
Monitoring Urban Growth and the Nepal Earthquake 2015 for Sustainability of Kathmandu Valley, Nepal


1
The State Key Laboratory of Remote Sensing Science, Institute of Remote Sensing and Digital Earth, Chinese Academy of Sciences, Beijing 100101, China
2
State Key Laboratory of Resource and Environmental Information System, Institute of Geographic Sciences and Natural Resources Research, Chinese Academy of Sciences, Beijing 100101, China
3
Cultural and Spatial Ecology, Department of Geosciences, Florida Atlantic University, Boca Raton, FL 33431, USA
*
Author to whom correspondence should be addressed.
Land 2017, 6(2), 42; https://doi.org/10.3390/land6020042
Submission received: 24 April 2017
/
Revised: 8 June 2017
/
Accepted: 14 June 2017
/
Published: 17 June 2017
(This article belongs to the Special Issue Urban Land Systems: An Ecosystems Perspective)
Abstract
:The exodus of people from rural areas to cities brings many detrimental environmental, social and cultural consequences. Monitoring spatiotemporal change by referencing the historical timeline or incidence has become an important way to analyze urbanization. This study has attempted to attain the cross-sectional analysis of Kathmandu valley that has been plagued by rampant urbanization over the last three decades. The research utilizes Landsat images of Kathmandu valley from 1976 to 2015 for the transition analysis of land use, land cover and urban sprawl for the last four decades. Results showed that the urban coverage of Kathmandu valley has tremendously increased from 20.19 km2 in 1976 to 39.47 km2 in 1989 to 78.96 km2 in 2002 to 139.57 km2 in 2015, at the cost of cultivated lands, with an average annual urban growth rate of 7.34%, 7.70% and 5.90% in each temporal interval, respectively. In addition, the urban expansion orientation analysis concludes the significant urban concentration in the eastern part, moderately medium in the southwest and relatively less in the western and northwest part of the valley. Urbanization was solely accountable for the exploitation of extant forests, fertile and arable lands and indigenous and cultural landscapes. Unattended fallow lands in suburban areas have compounded the problem by welcoming invasive alien species. Overlaying the highly affected geological formations within the major city centers displays that unless the trend of rapid, unplanned urbanization is discontinued, the future of Kathmandu is at the high risk. Since land use management is a fundamental part of development, we advocate for the appropriate land use planning and policies for sustainable and secure future development.
Keywords:
land use/land cover change; urban expansion; geology; earthquake; GIS/RS; Kathmandu valley1. Introduction
The terms land use and land cover are often used interchangeably, but are conceptually different. The former is anthropogenically manipulated and concerned with the purpose the land serves. It depends on the way humans manage the landscape. The latter is physically designed and related to vegetation (natural or artificially modified) and its structure, as well as the other land types covering terrestrial land. The relation between these two disciplines is such that land cover may have multiple land uses, and land use affects the land cover [1]. Global land use has been changed significantly in the past three decades due to population growth and its footprints. Population growth inevitably increases the urban footprint with significant consequences on biodiversity, climate and environmental resources [2,3]. The environmental implications of population and land use and land cover (LULC) changes have been extensively and empirically examined because the exponential population growth exerts outpaced pressure on the local environmental resources [4]. Rapid urbanization has also been a common phenomenon, especially in developing countries with an increasing desire for prosperity [5,6]. Urban growth, a complex phenomenon [7,8], and multiple driving forces are associated [9,10,11]. Urbanization is a feedback system that is economically motivated [12]. Urban areas have grown substantially in the last several decades worldwide, but urbanization varies considerably in different geographic regions and contexts [13].
Nepal is a country that has experienced population explosion and accelerated urbanization in the last six decades. The number of urban centers in Nepal rose between 1952 and 2015 [14]. Kathmandu, the bowl-shaped capital city of the country, has become densely populated and juxtaposes rapid urbanization, resulting in land use and socio-economic change [15,16]. High population growth, dramatic land use change and socioeconomic transformations have brought the inconsistency of rapid urbanization and environmental consequences in Kathmandu valley [16,17]. For the management of rapid urbanization, the development plan needs to be integrated in order to maintain the equilibrium amongst resources, users, managers and the environment [18,19]. We hypothesize that the ongoing urbanization in Kathmandu valley is discordant with its geology and geography, and the ongoing LULC change foments the jeopardy of the human-nature integrity. This study aims to analyze the impacts accompanied by the spatiotemporal patterns of urbanization and LULC changes in Kathmandu in the last 40 years (1976, 1989, 2002 and 2015) using GIS and remote sensing tools at the nexus of rapid land use change, population growth and urbanization and the 2015 earthquake impacts in the valley. More specific objectives of the study were to: (a) analyze the spatiotemporal dynamics of land use pattern from 1976 to 2015 of landscape change; (b) identify the urbanization pattern and dynamically map the urban expansion area; (c) explore urban expansion rate, urban expansion orientation and analysis of the significant urban concentration zone; (d) explain and map the 2015 earthquake impact area of the valley.
2. Materials and Methodology
2.1. Study Area
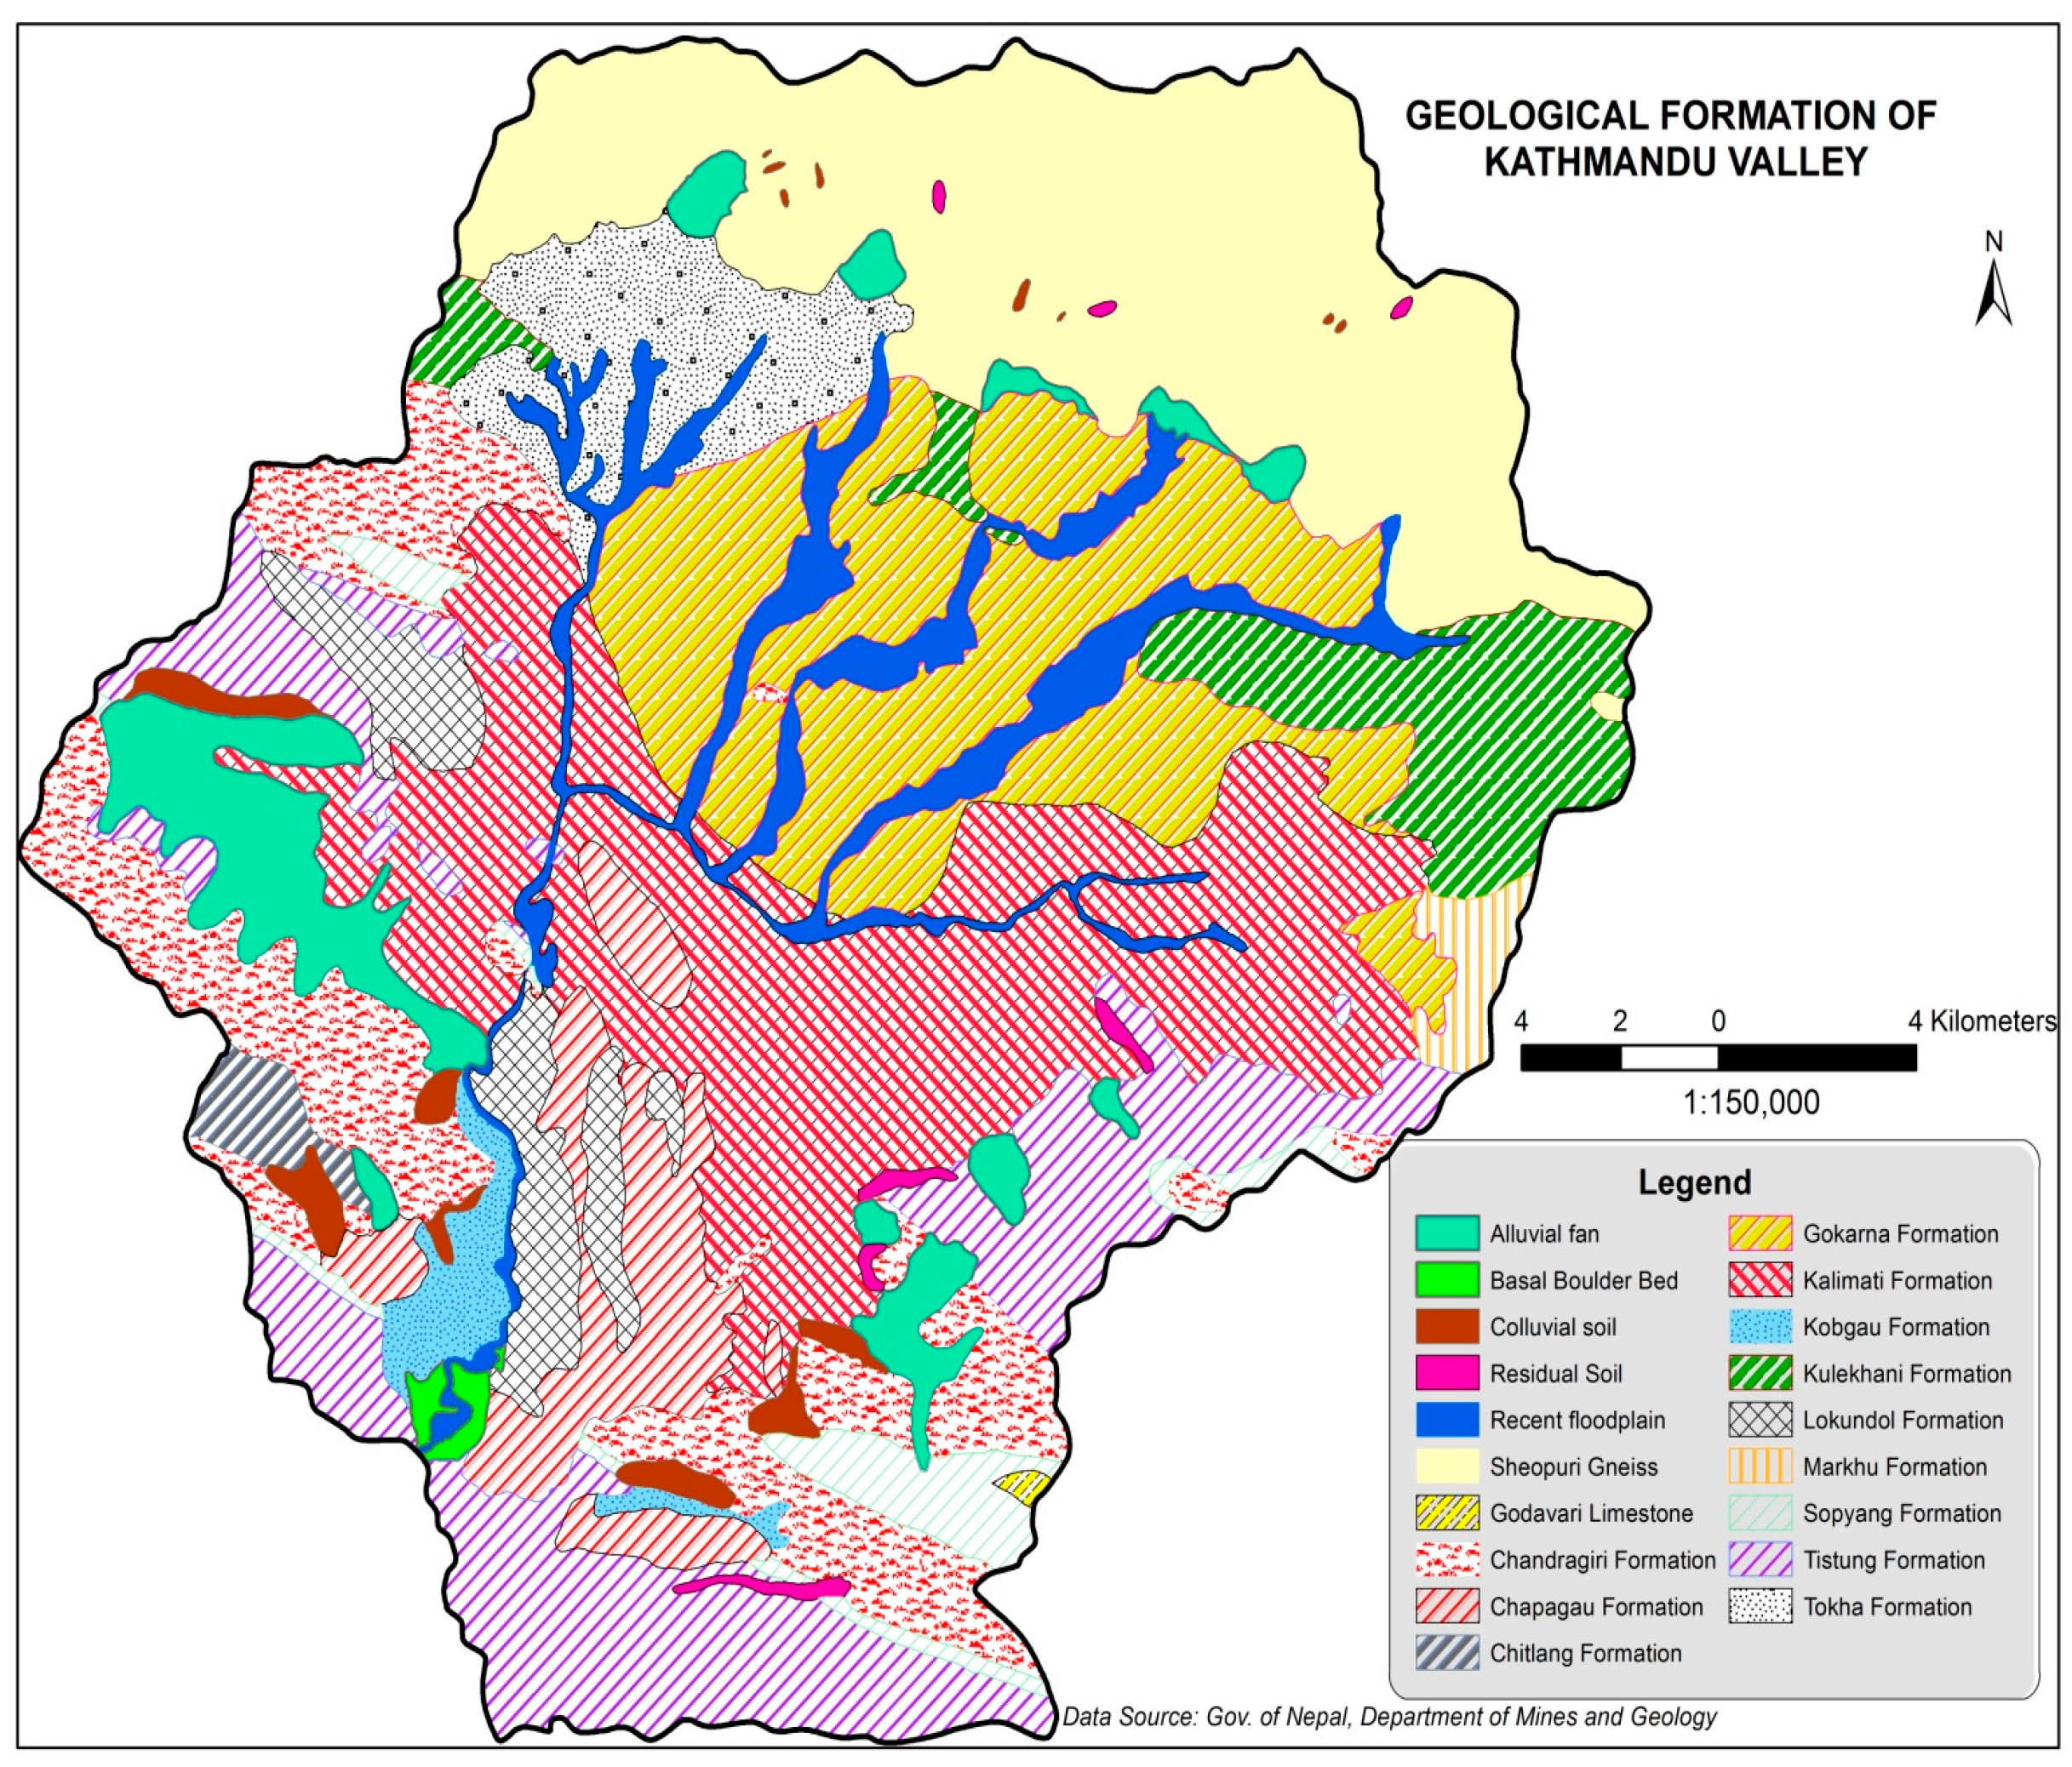
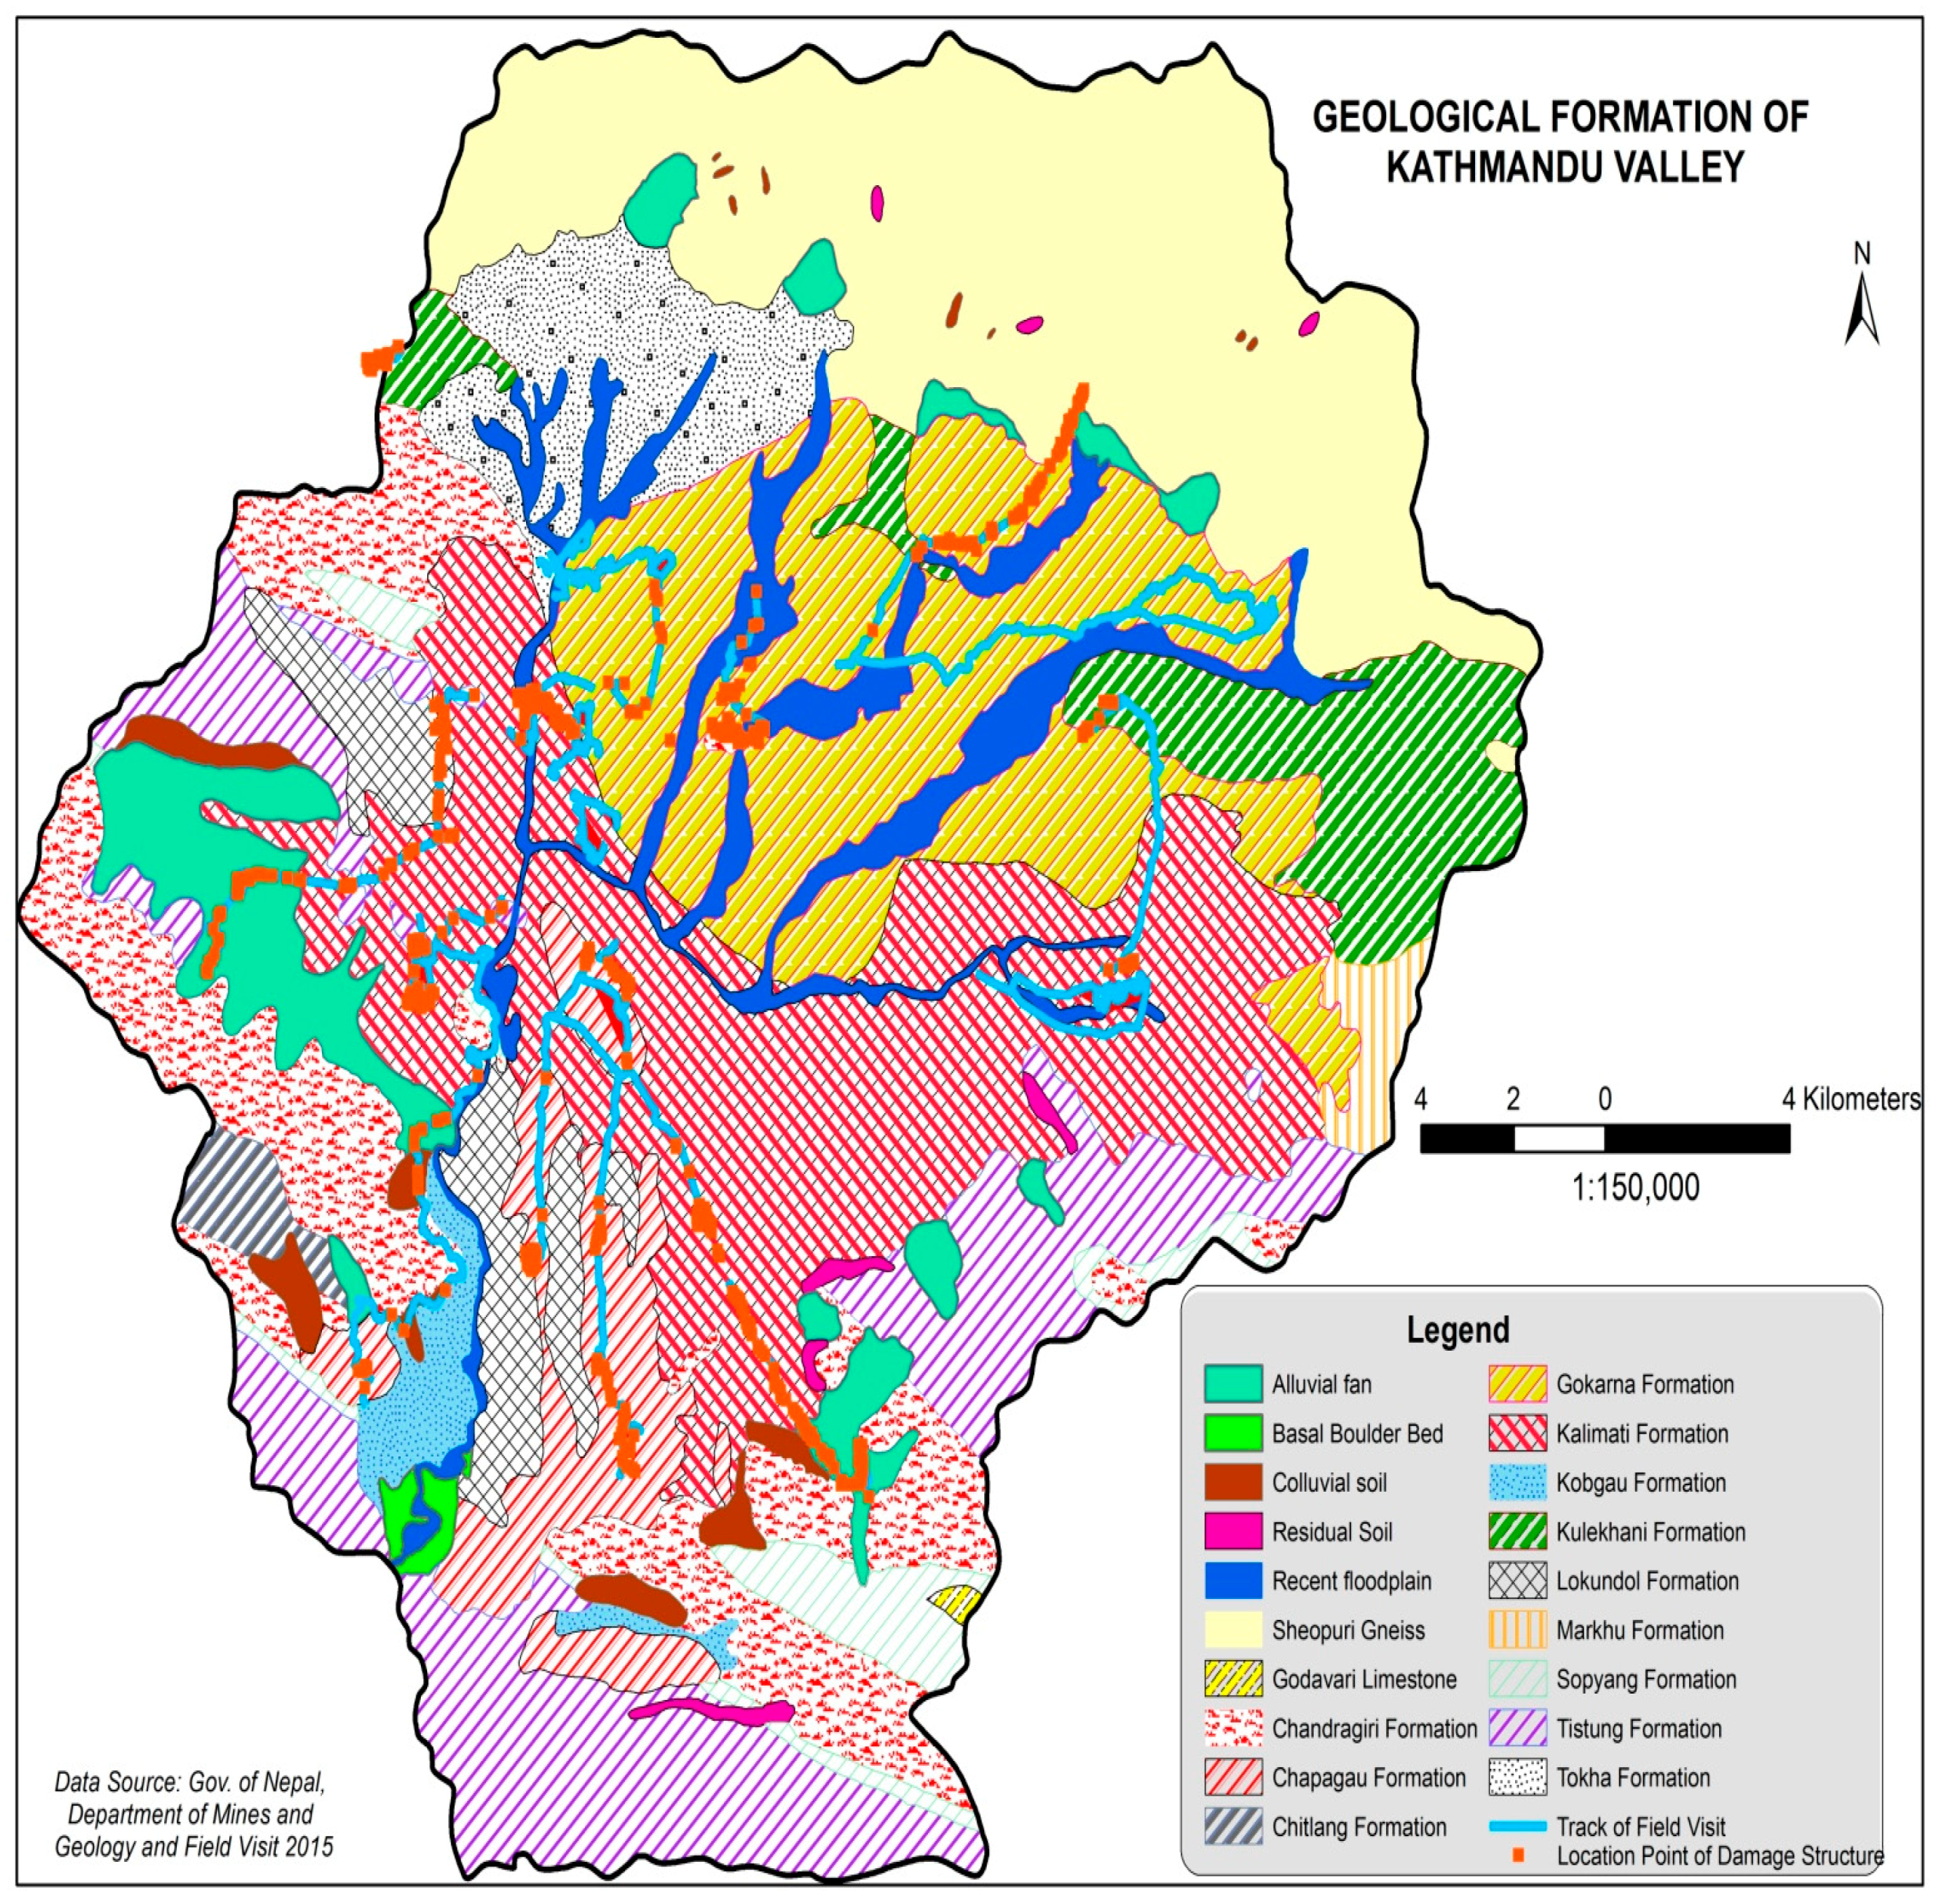
Kathmandu valley is an inter-montane lesser Himalaya bowl-shaped basin. Its geology mostly consists of fluvio-lacustrine sediments of Plio-Pleistocene age [20,21], which has characteristics of magnifying seismic waves and being prone to liquefaction [22]. The vulnerability of liquefaction is due to its high ground water level and potential strong earthquake motions in this area [23]. The valley is surrounded by Mahabharat mountain range associated with four hills namely Phulchowki (2762 m) in the southeast, Chandragiri/Champadevi in the southwest, Shivapuri (2762 m) in the northwest and Nagarkot in the northeast, formerly known as the forts of the valley [24]. The basement rocks of Phulchowki and the Bhimphedi groups of the Kathmandu complex are formed by Precambrian to Devonian rocks [25,26]. These groups together form the Kathmandu complex, which is interpreted tectonically as thrust mass (allochthonous) with the underlying Paraautochthonous Nuwakot Complex constituting the Mahabharat Synclinorium, the axis of which passes along the Phulchowki-Chandragiri range. The basement rocks are intersected by numerous faults systems; the geological formation of the valley has been divided into different groups [25] (Figure 1).
Administratively, the valley consists of three districts: Kathmandu, Lalitpur and Bhaktapur. Mainly five municipals areas, namely Kathmandu, Lalitpur Bhaktapur, Kirtipur and Madhyapur-Thimi, are exponentially developed and populated. Kathmandu valley, the selected study area, lies between 27°24′14″ and 27°49′10″ north latitude (the southern part of Thuladurlung village to the northern part of Gokarneshwor municipality) and 85°11′18″ and 85°33′56″ eastern longitude (the western part of Chandragiri municipality to the eastern part of Shankharapur municipality); however, nomenclature is being changed during the new local reconstruction process. The study area covers an area of 933.22 km2 within the vertical span 410 m to 2831 m above sea level. Figure 2a indicates the location map of the study area, and Figure 2b represents the main part of Kathmandu valley, which is divided into eight main areas.
The Kathmandu valley is facing potentially insurmountable challenges (both demographic and physiographic) due to overpopulation led by immigration. Since 1971, the population of the valley has exploded from 0.6 million people to over 2.5 million (Table 1), with an annual growth rate of 2.3%–5.8% [27].
Continuous haphazard urbanization has increased agricultural land loss and constrained the coping capacity in the course of disaster management [28]. The mushroomed concrete buildings constructed in the valley reduce the percolation of surface water, increase the demand for water and cause a fall in the water level each year, making the valley at the brink of land subsidence [25].
2.2. Data
This study has analyzed the spatiotemporal dynamics of urbanization of LULC and identified the crosscutting impacts of the Nepal Earthquake, 2015. Four pairs of Landsat images were used for the classification: (i) Landsat Image 2 (Multi-spectral Scanner (MSS), image with Path/Row152/41) 28 October 1976; (ii) Landsat Image 5 image (Thematic Mapper (TM) with Path/Row 141/41) 31 October 1989; (iii) Landsat Image 7 (Thematic Mapper Plus (ETM+) with Path/Row 141/41) 27 October 2002; and (iv) Landsat Image 8 (Operational Land Image (OLI) with Path/Row 141/41) of 24 January 2015. All data were projected in the Universal Transverse Mercator World Geodetic System 1984. A topographical map published by the Survey Department, Government of Nepal, 1995 (scale 1:25,000), was used as the reference for image analyses. The Google Earth image was used for ground-truthing. A “region of interest” (ROI) boundary representing metropolitan, municipal and village level study area was delineated for remote sensing analysis. The study area boundary datasets were obtained from the Survey Department, Government of Nepal, and the administrative boundary of Kathmandu valley was imported in TerrSet.
2.3. Data Processing and Classification
All obtainable images, pre-processing, raster group (stacking), subset and classification were accomplished using Idrisi (TerrSet) developed by Clark Lab. Both unsupervised and supervised approaches with the maximum likelihood parameter (MLP) system were applied to improve the accuracy of land use classification. Since no single classification system is used by most of the scientific community [29,30], an adapted classification system recommended by Anderson et al., 1976 [31], was used for remotely-sensed data. In the study, land use is classified into six different classes: urban (built-up), water, open field, forest, bush and cultivated land. The Land Change Modeler (LCM) system was applied to analyze the changes and transitions matrix in LULC. The computed transition matrix consists of the row and column of landscape categories at times T1 and T2.
2.4. Urban Expansion Direction
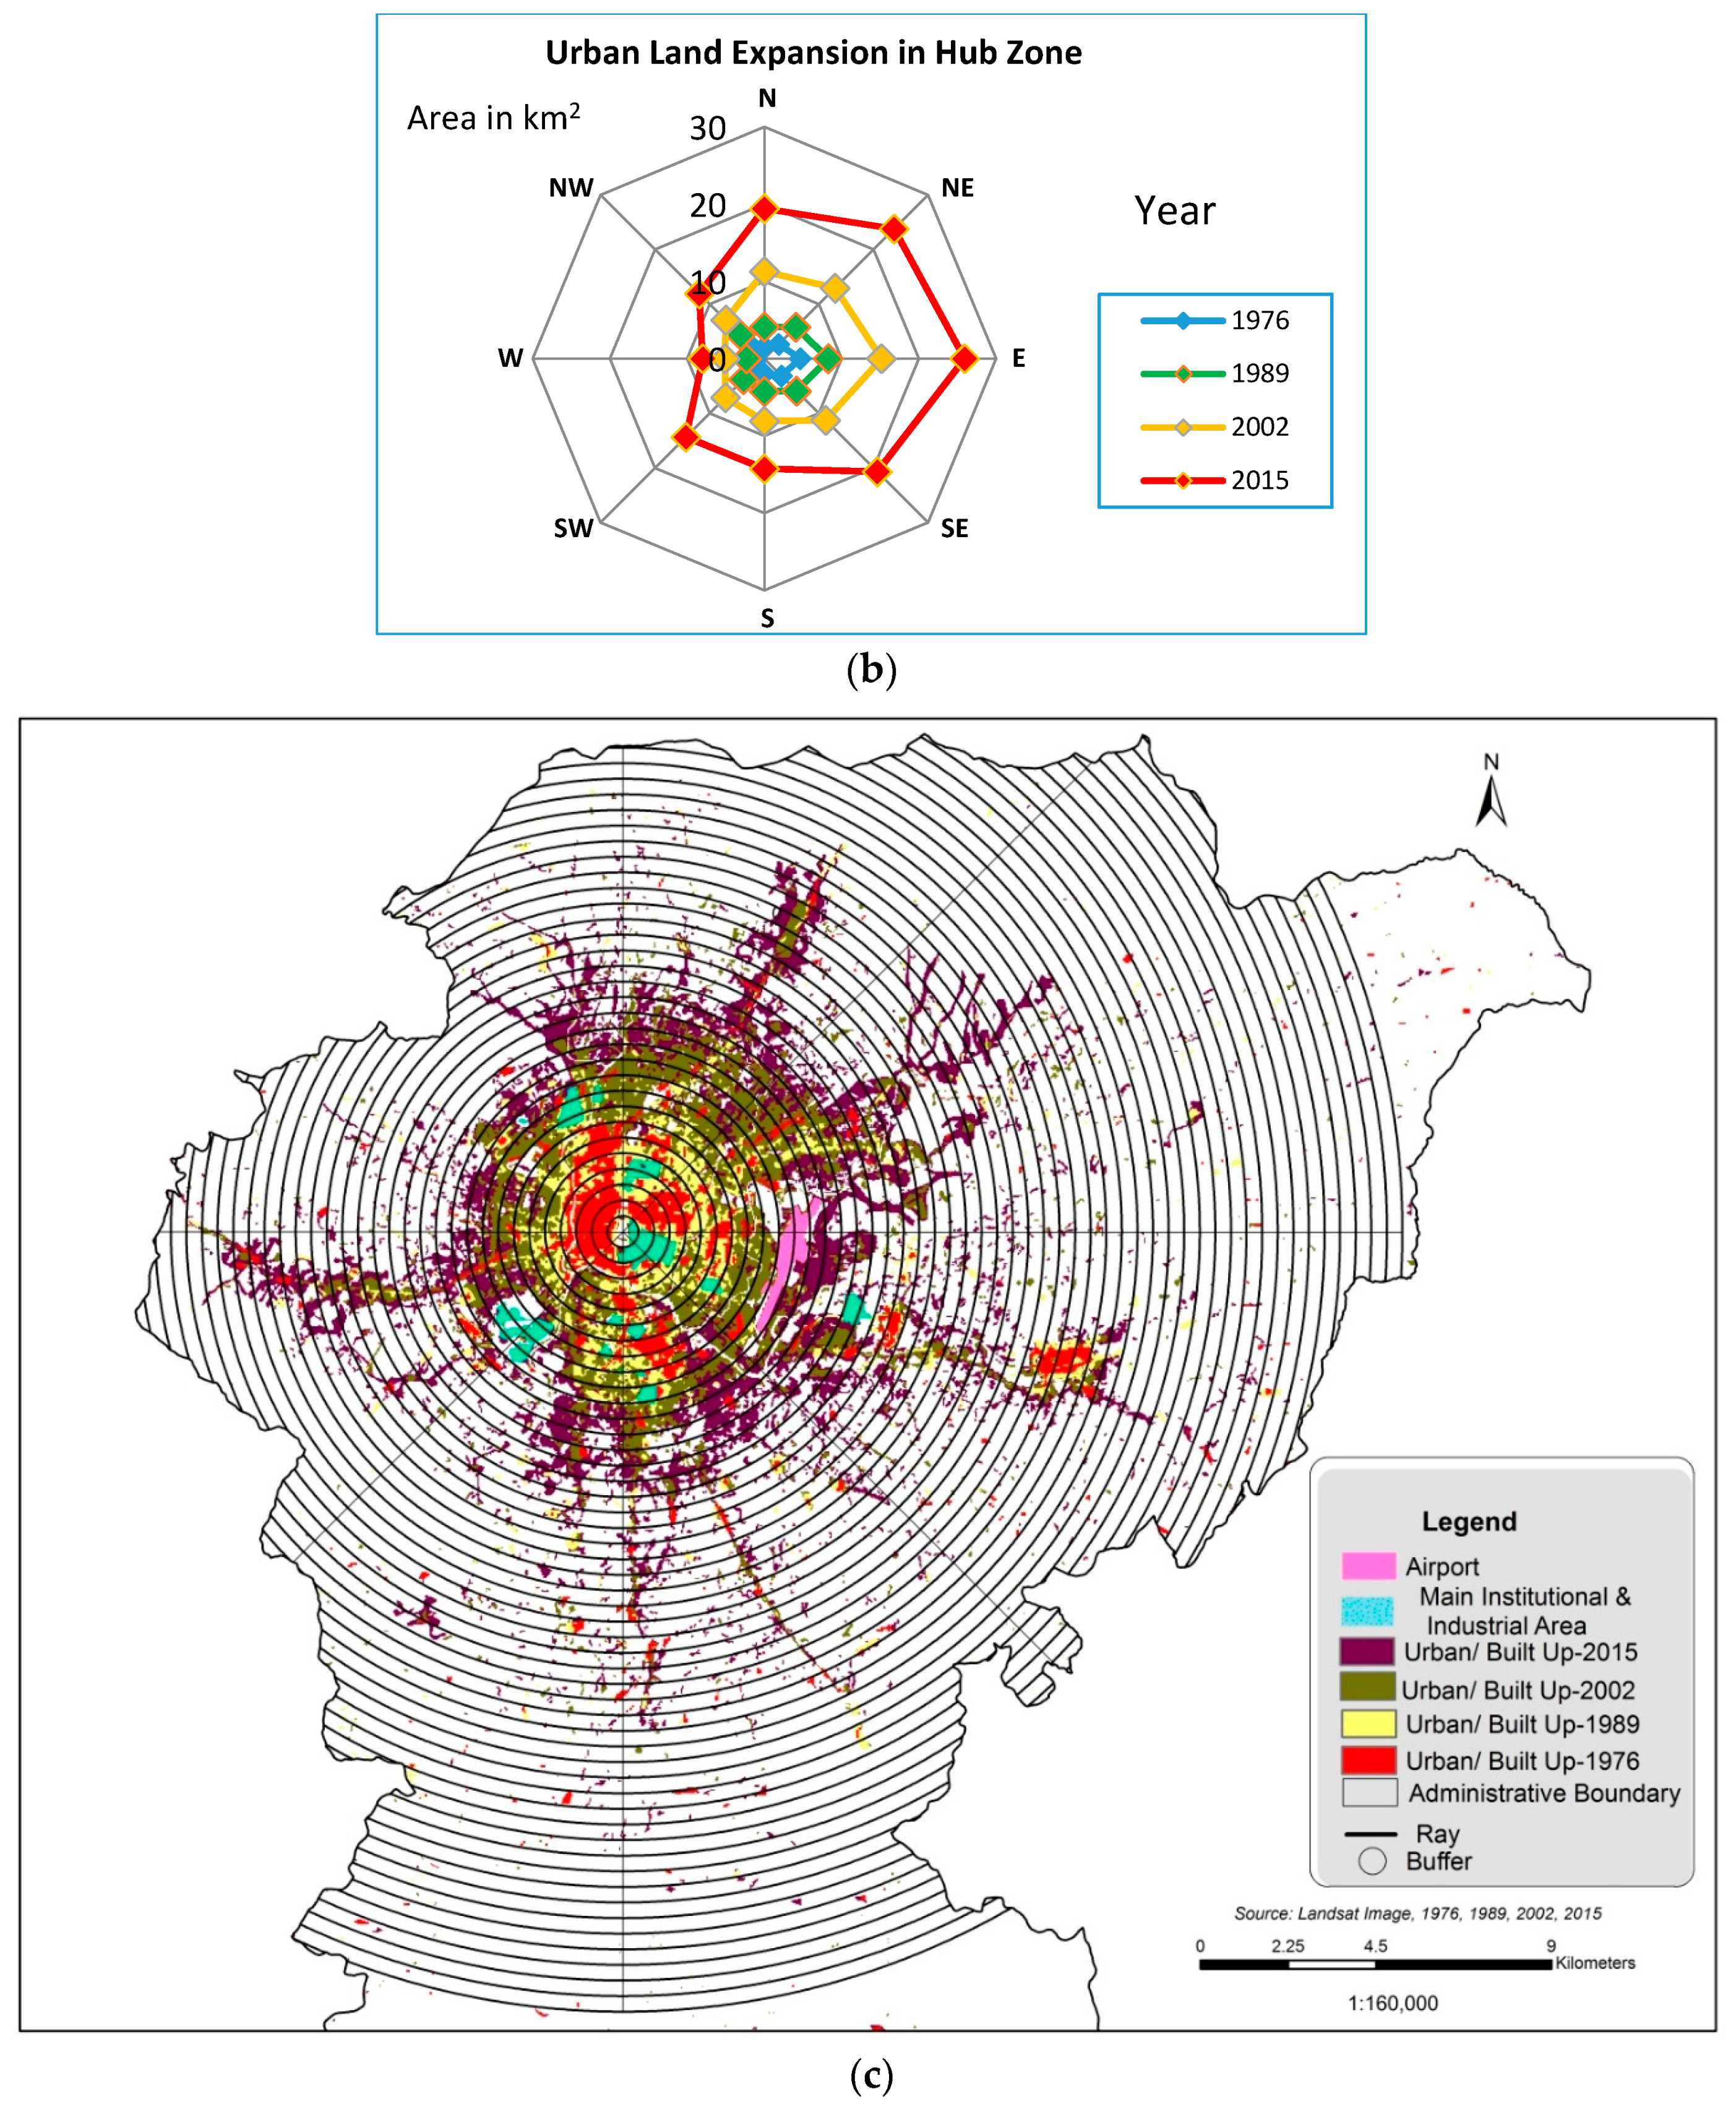
For the detailed exploration of urban expansion and its direction, the major administrative center of the country, Singhadurbar is assumed as the central point, and the outward urban orientation of the valley is conducted through the lines created by utilizing ArcGIS 10.1. The outcomes should answer the questions: where and in which direction did the changes occur from the city core? The rays [30] consisting of eight subdivisions north, northeast, east, southeast, south, southwest, west, northwest and north (N-NE, NE-E, E-SE, SE-S, S-SW, SW-W, W-NW and WN-N), each representing 45°, were drawn, and 50 buffer zones were calculated at the regular intervals of 400 m.
2.5. Measuring Urban Expansion Rate
The urban expansion growth rate [32] of the study area is measured by calculating the total transformation of urban area. The urban expansion rate indicates the average annual urban area growth in the following years.
where MUER refers to measuring the urban expansion rate, U is urban area in km2, t1 is succeeding time and t0 is preceding time.
2.6. Plotted of Earthquake Damage Area
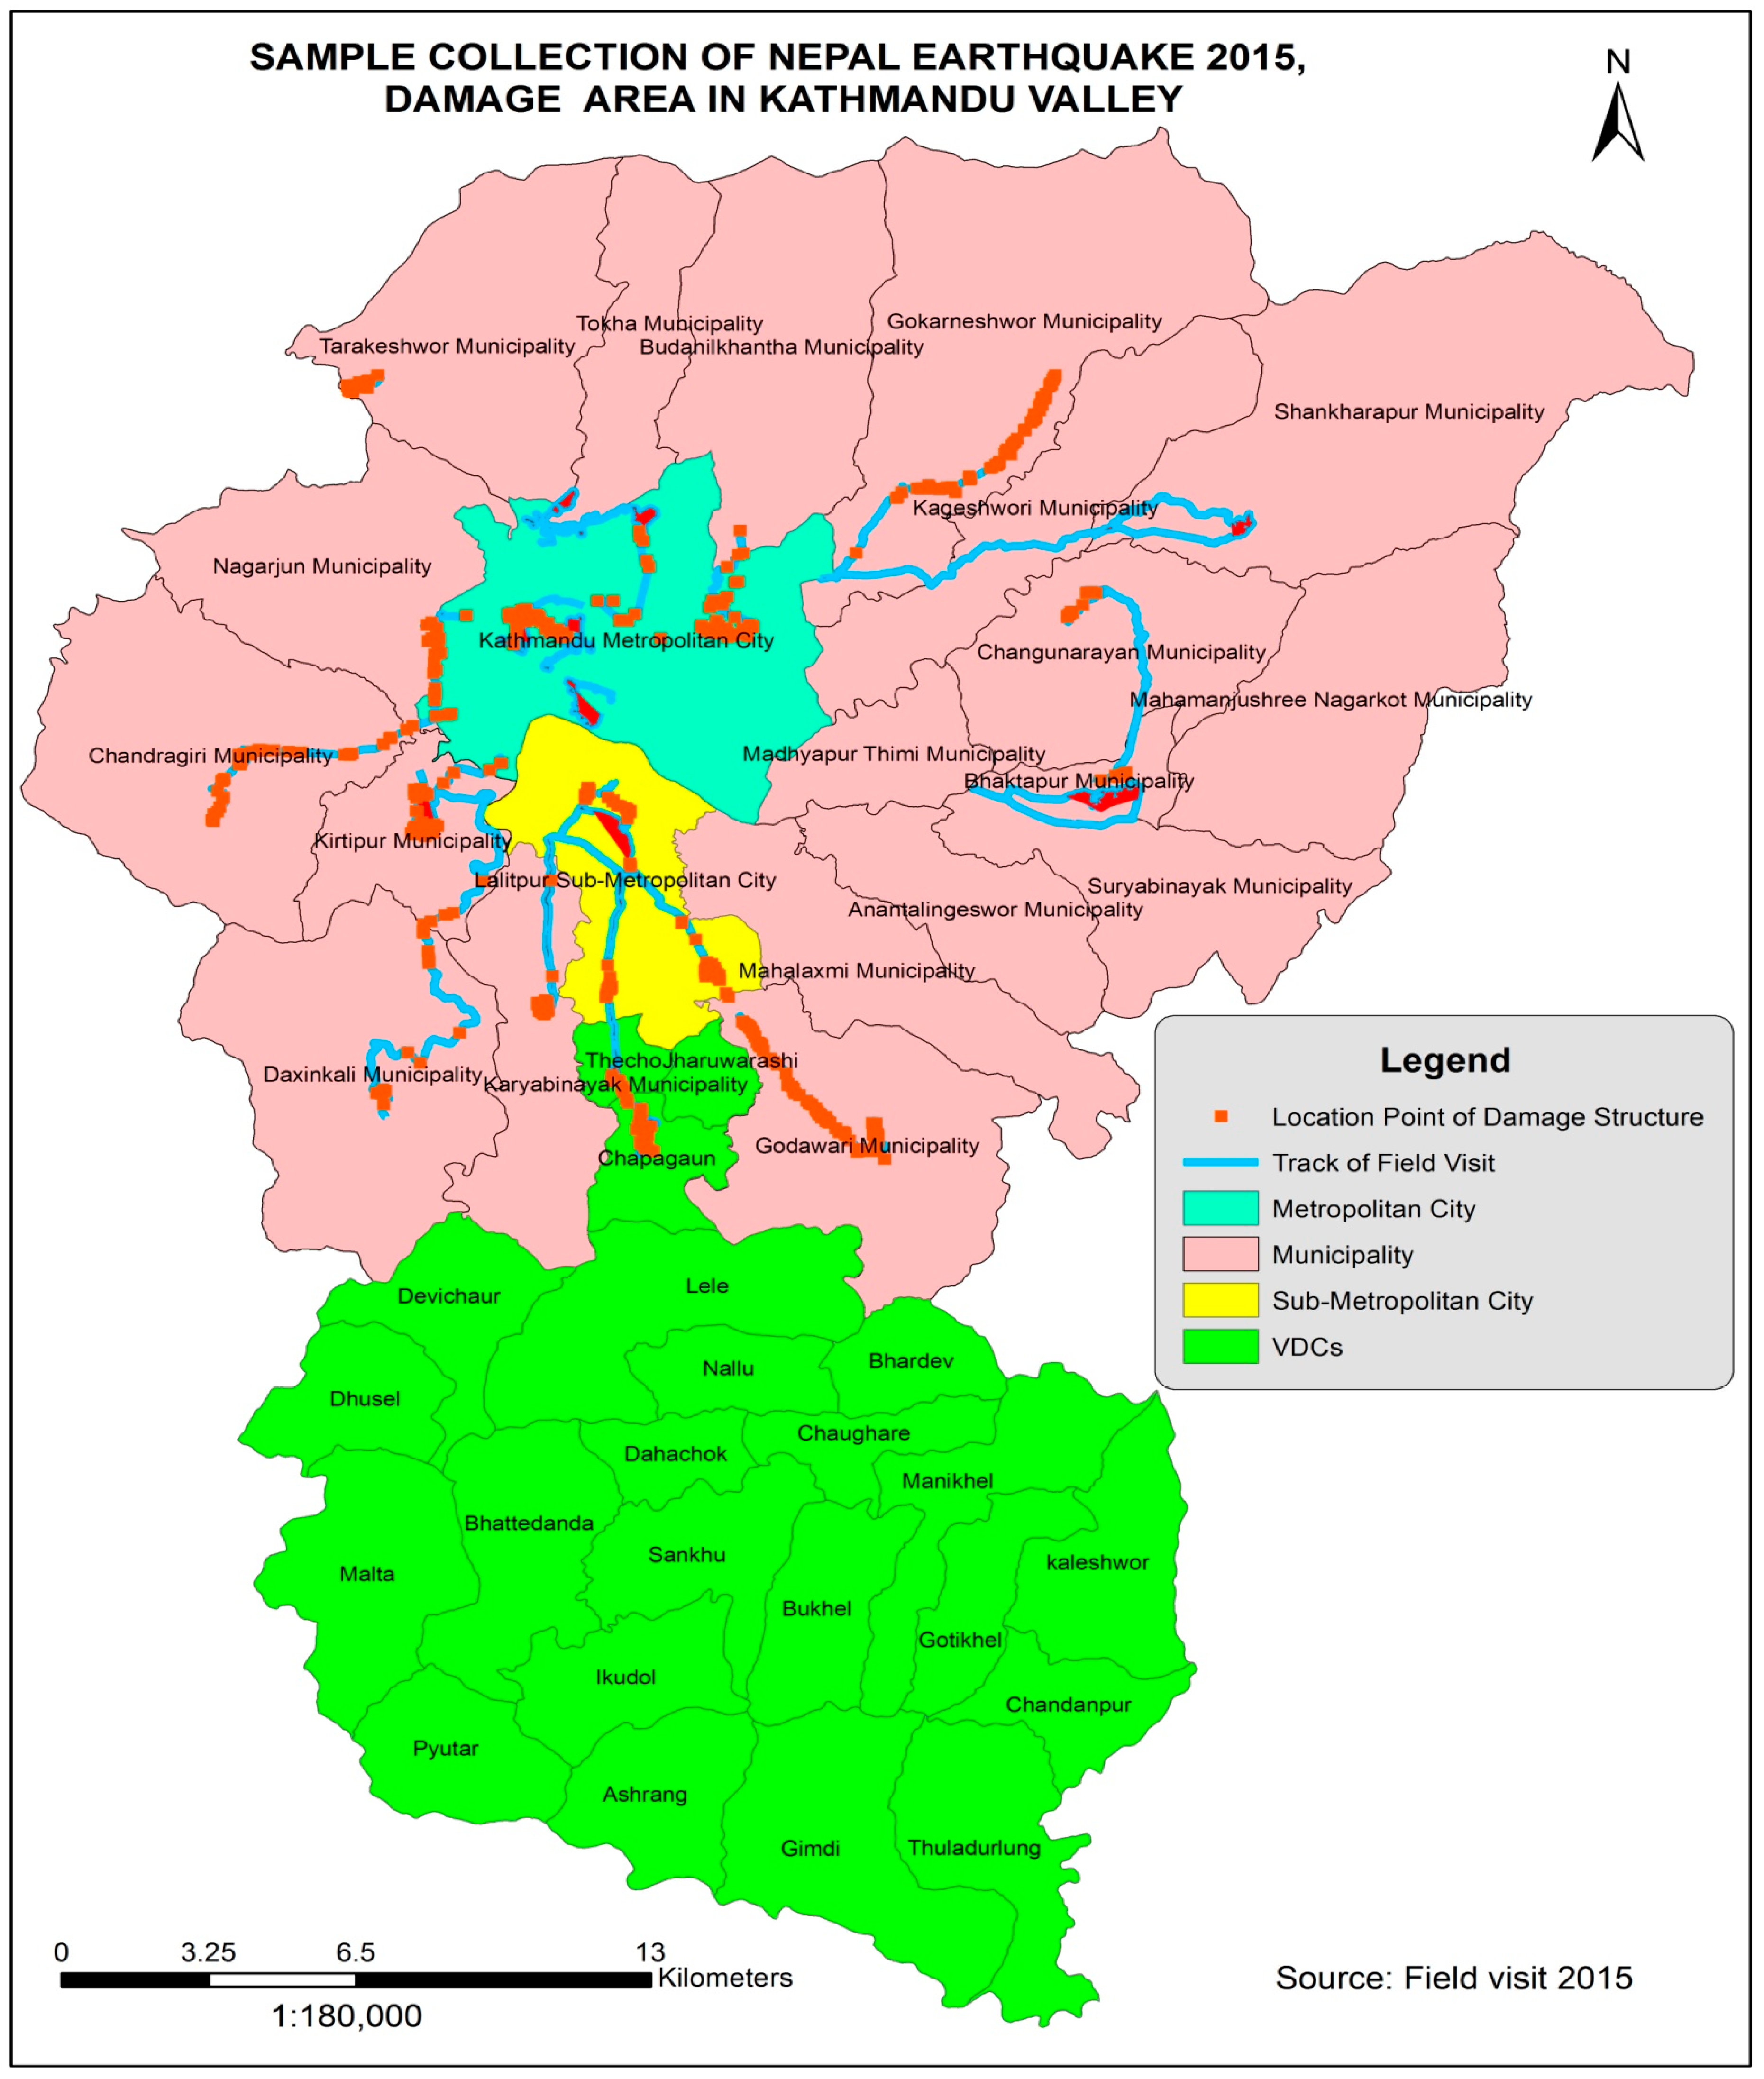
Highly damaged localities were captured through GPS during the field observation, and the collected information has been overlaid in the geological map of the valley and analyzed accordingly (Figure 3). The study excludes the statistical information of loss and damage during the Nepal Earthquake, 2015.
3. Results and Discussion
3.1. Urbanization in Kathmandu Valley
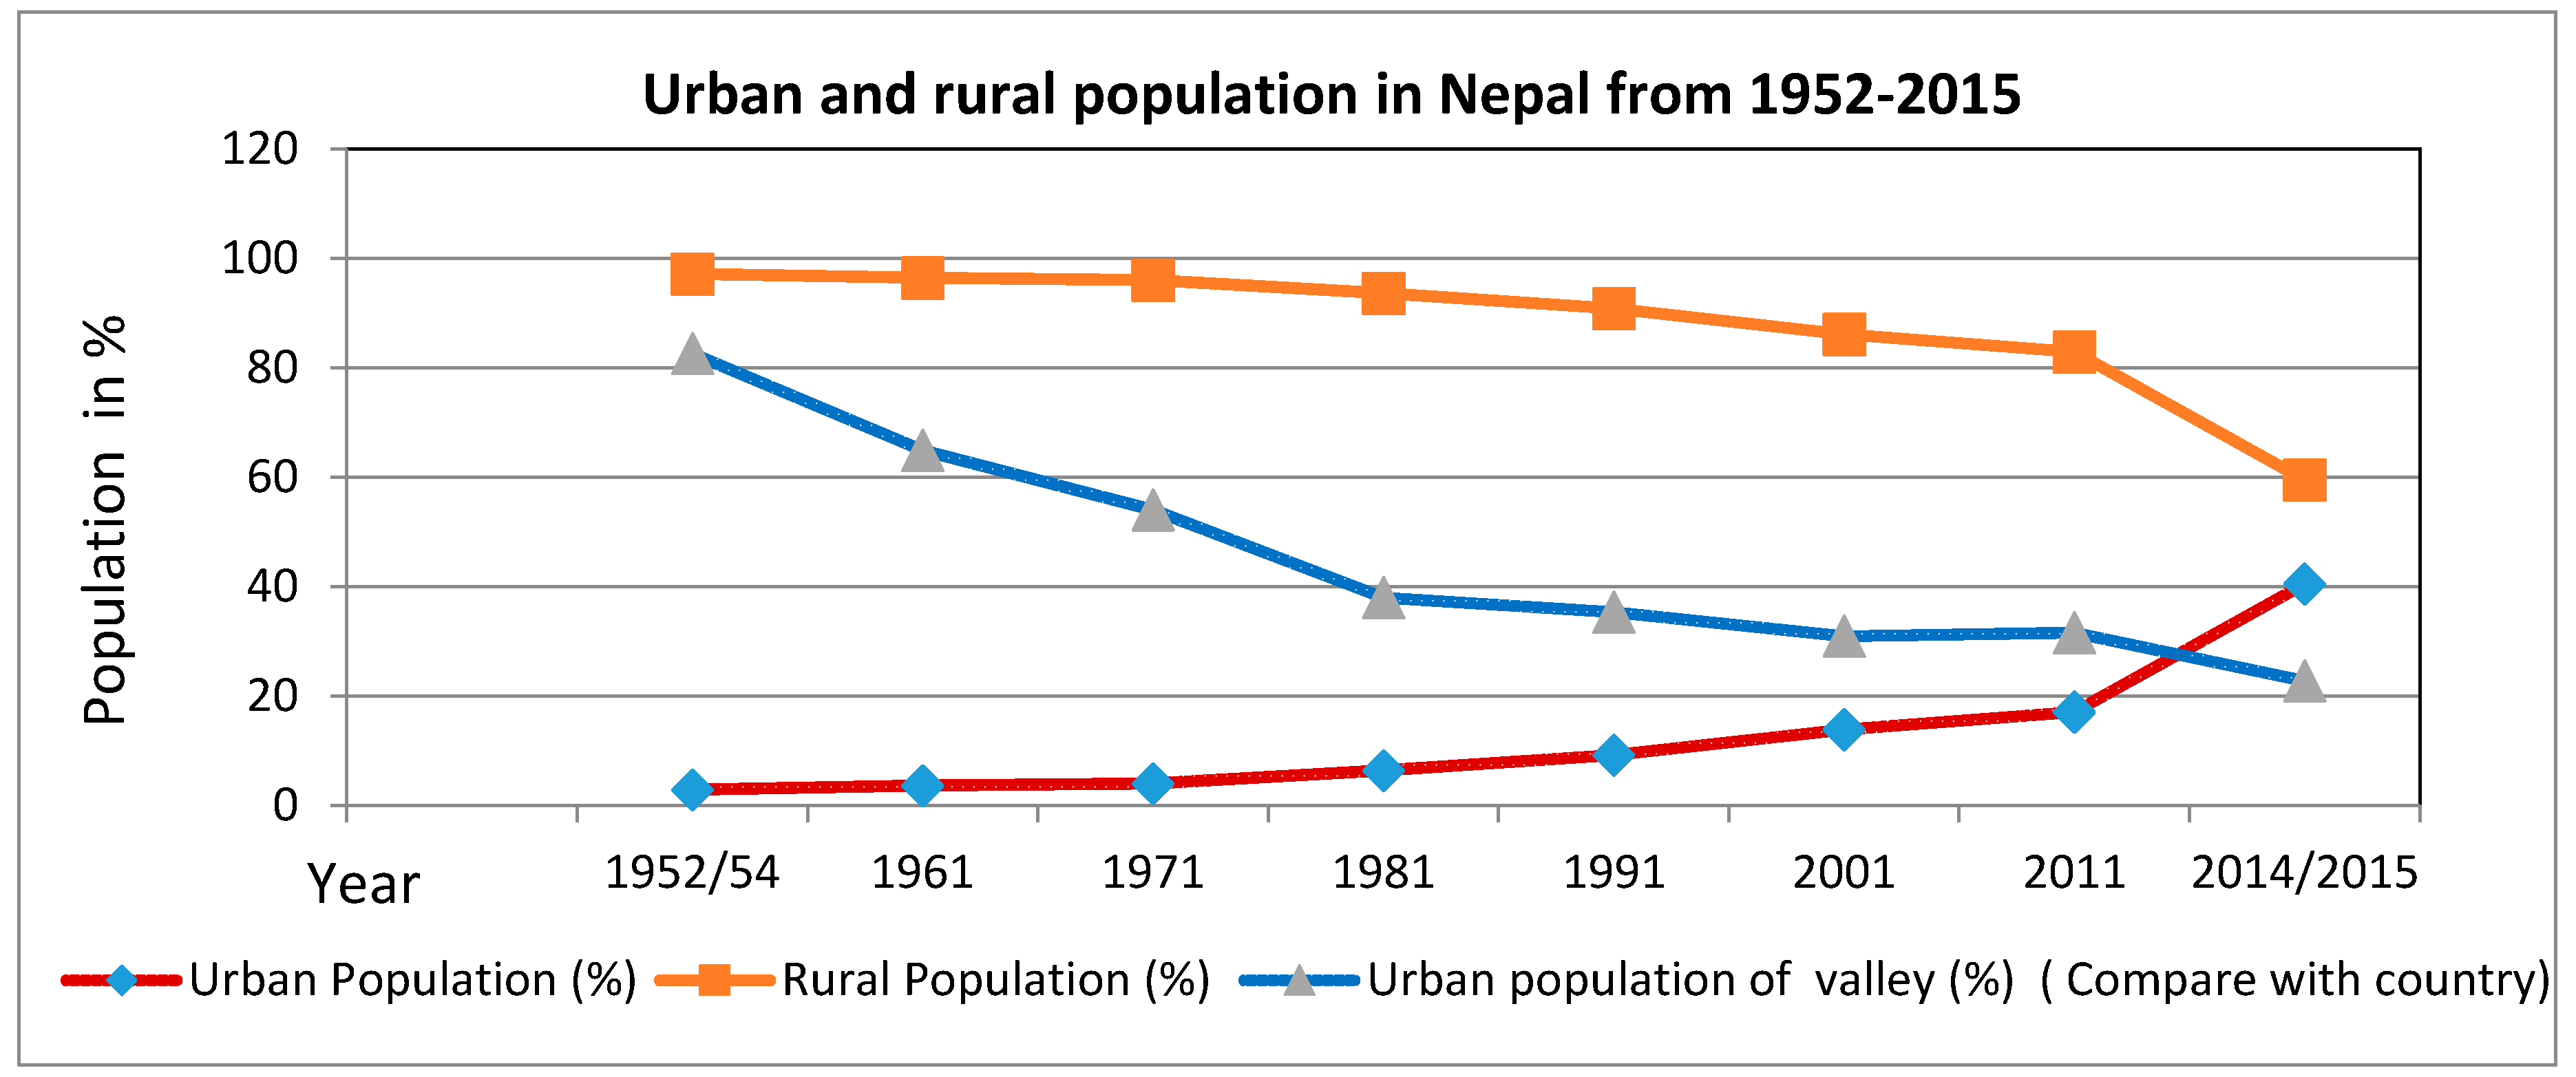
Random urbanization began to gain ground in the Kathmandu valley in the late 1950s [33], and accelerated population growth and migration complemented the process. In 1981, 93% of Nepal’s population lived in rural areas, and the data came down to 83% in 2011 [27,34]. Since 2001, the average population density in the Kathmandu has vastly increased compared to the country as a whole. The population density of Kathmandu grew from 1837/km2 in 2001 to 2699/km2 in 2011, whereas Nepal’s density of population only increased from 157/km2 to 180/km2 in the same time period. Consequently, the population density of Kathmandu was 1277/km2. While Nepal’s was 126/km2 in 1991, in 1981, it was 963/km2 in Kathmandu to 102/km2 in Nepal and 623/km2 against 79/km2 in 1971. This shows that the population density in the Kathmandu valley was rather aggressively growing [24]. Urban population increased from 2.9% to 40.49% in a period of 63 years (1952–2015). The rural population of Nepal decreased from 97.1% down to 59.51% in the same period. The valley represents 22.77% of the total urban population of the country (Figure 4). Table 2 and Figure 5 depict the statistical comparison between national-level rural-urban population and the urban population proportion of Kathmandu valley.
3.2. Land-Use Land-Cover Dynamics
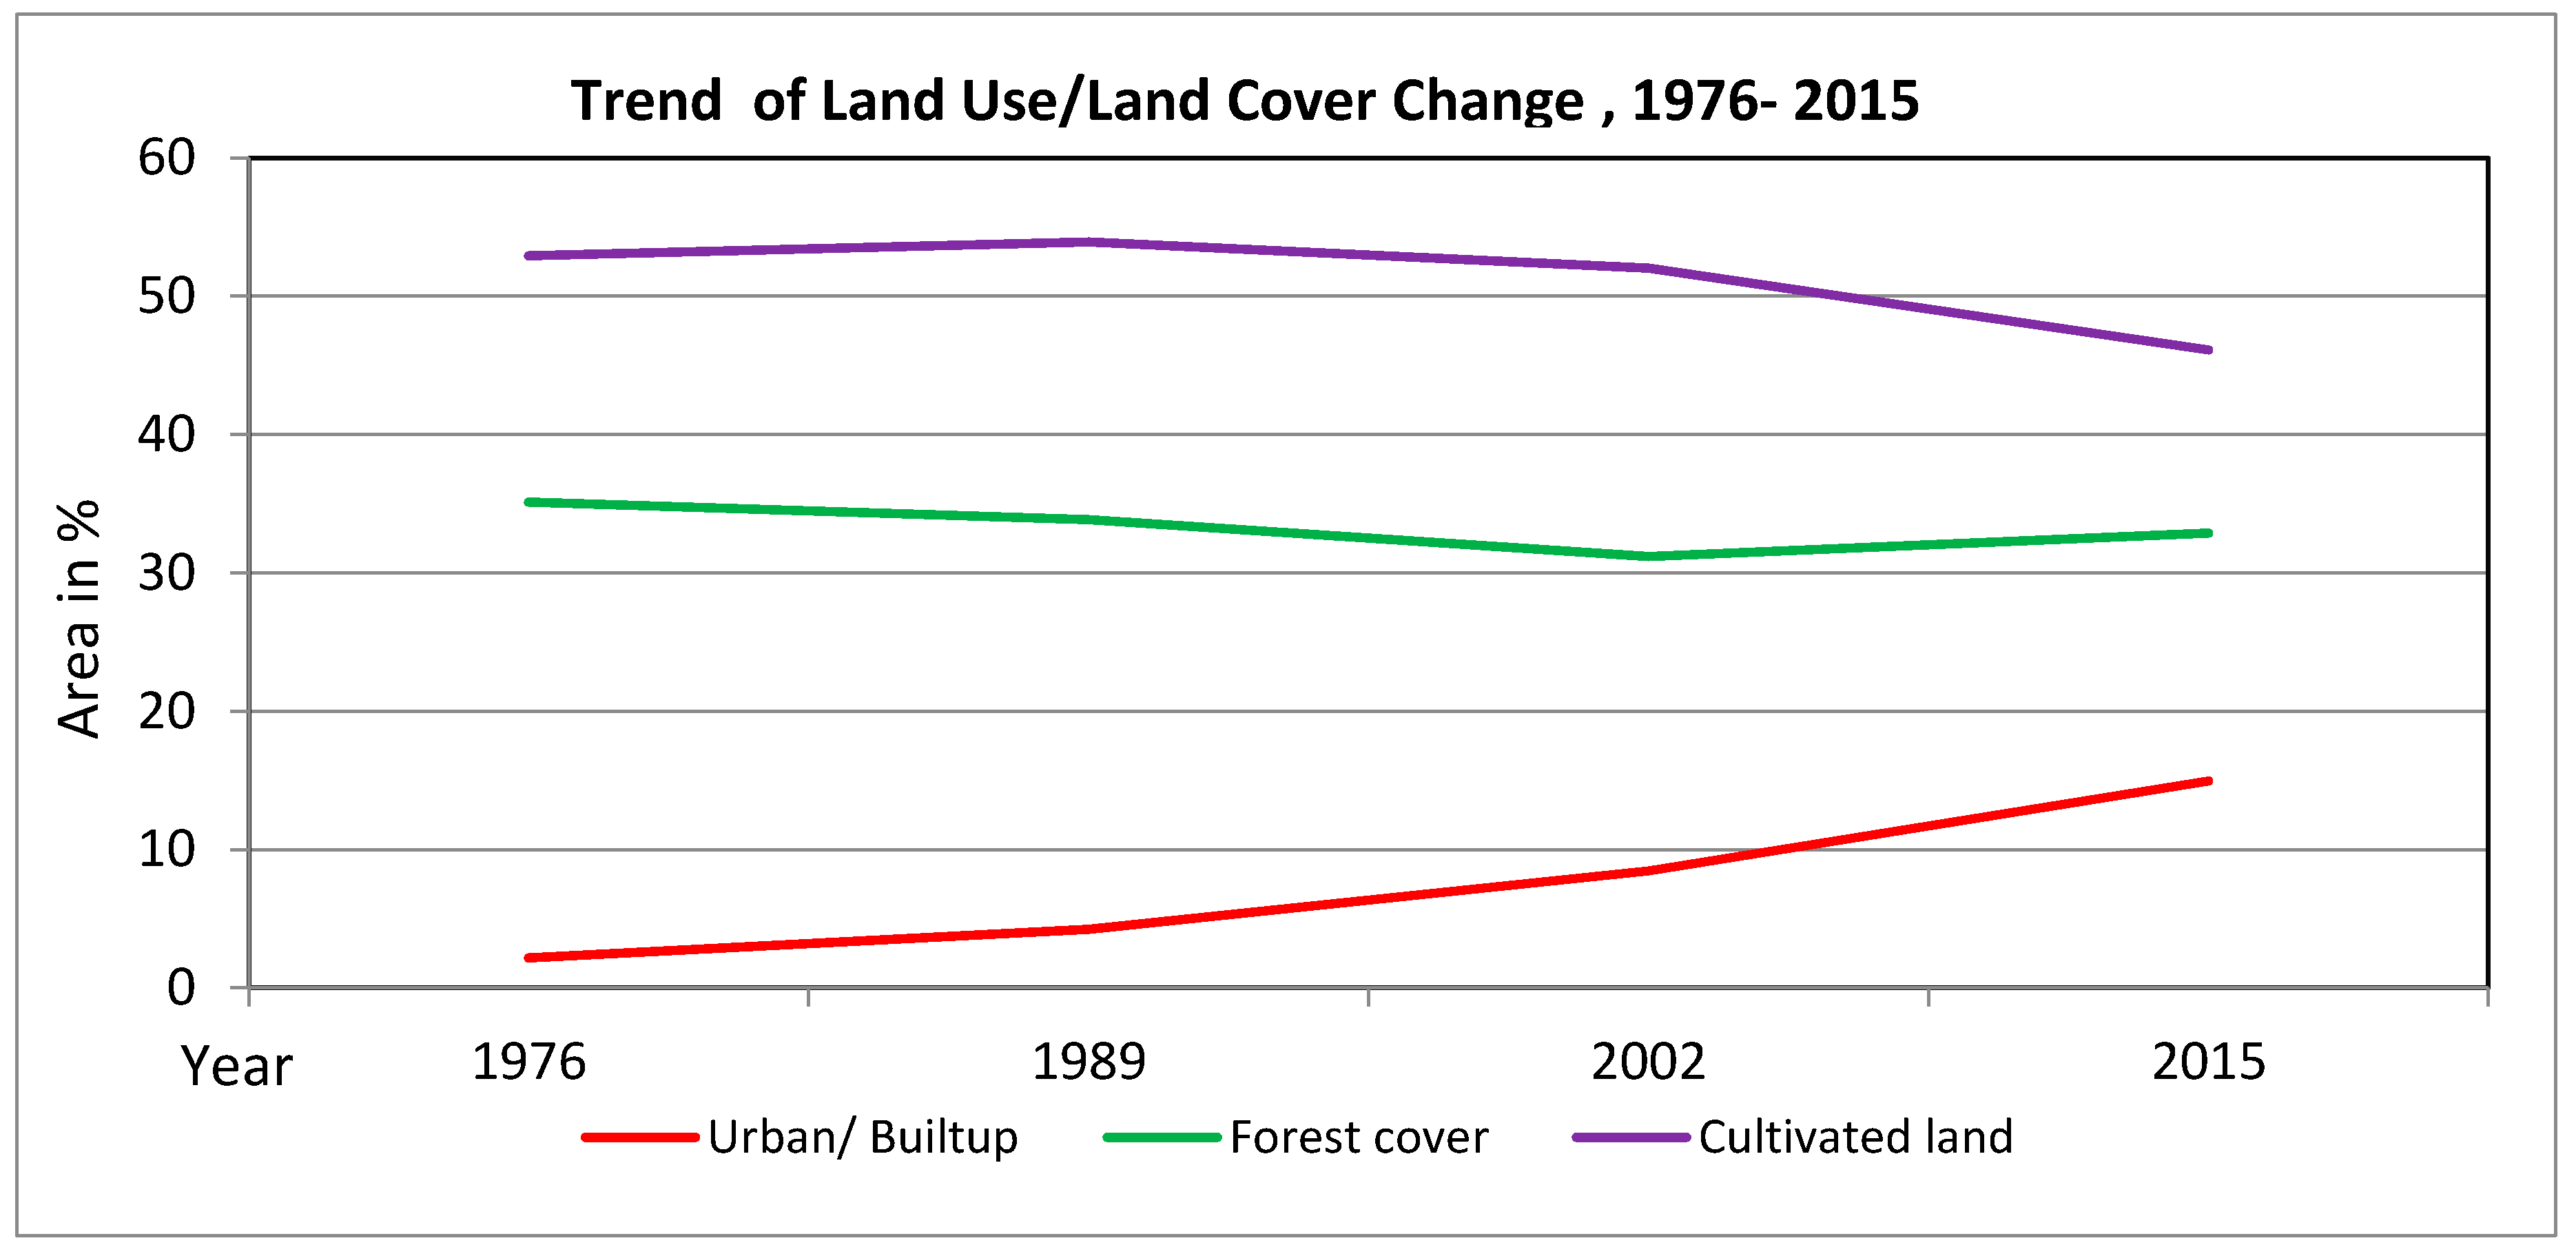
LULC change analysis of Kathmandu valley showed that 17.51 km2 of cultivated land were converted into other land use classes between 1989 and 2002, whereas 55.01 km2 of cultivated land were decreased between 2002 and 2015. Cultivated land was mostly transformed into urban/built up area and bush land, whereas forest areas were intensively degraded in rural areas. A total are of 11.84 km2 was deforested between 1976 and 1989. The deforestation rate augmented (24.97 km2) between 1989 and 2002 and is shown in Table 3 and Figure 6.
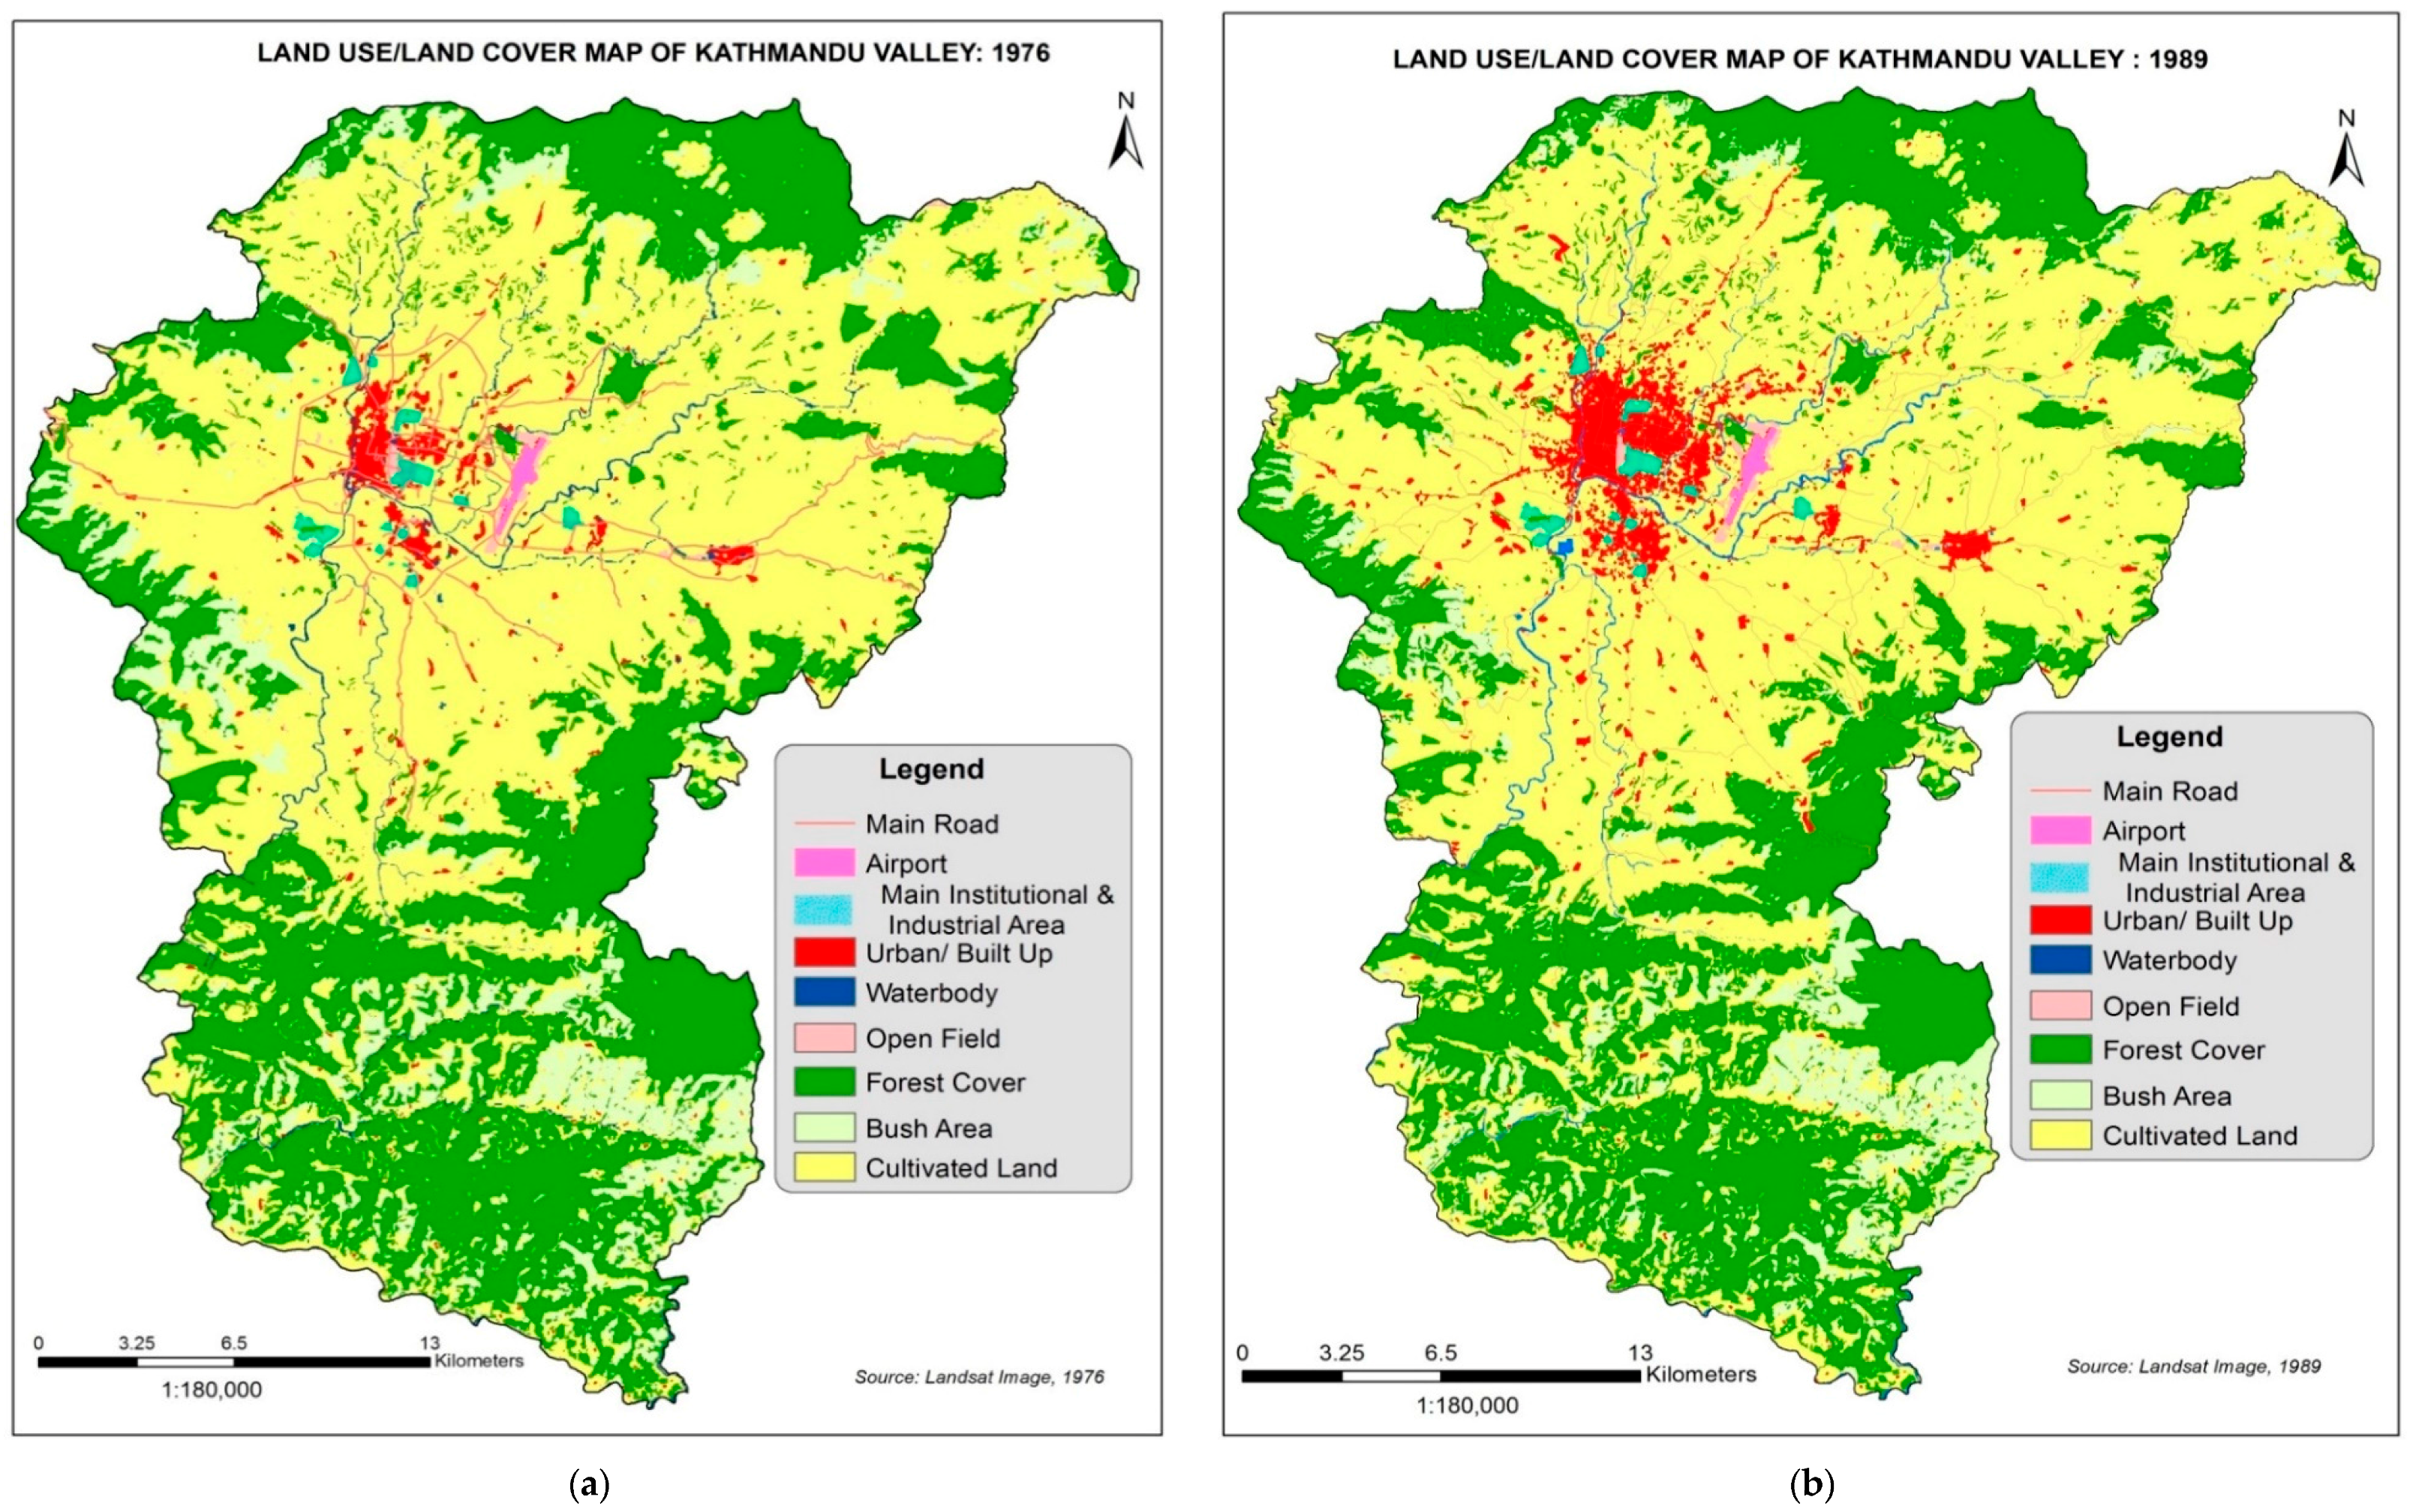
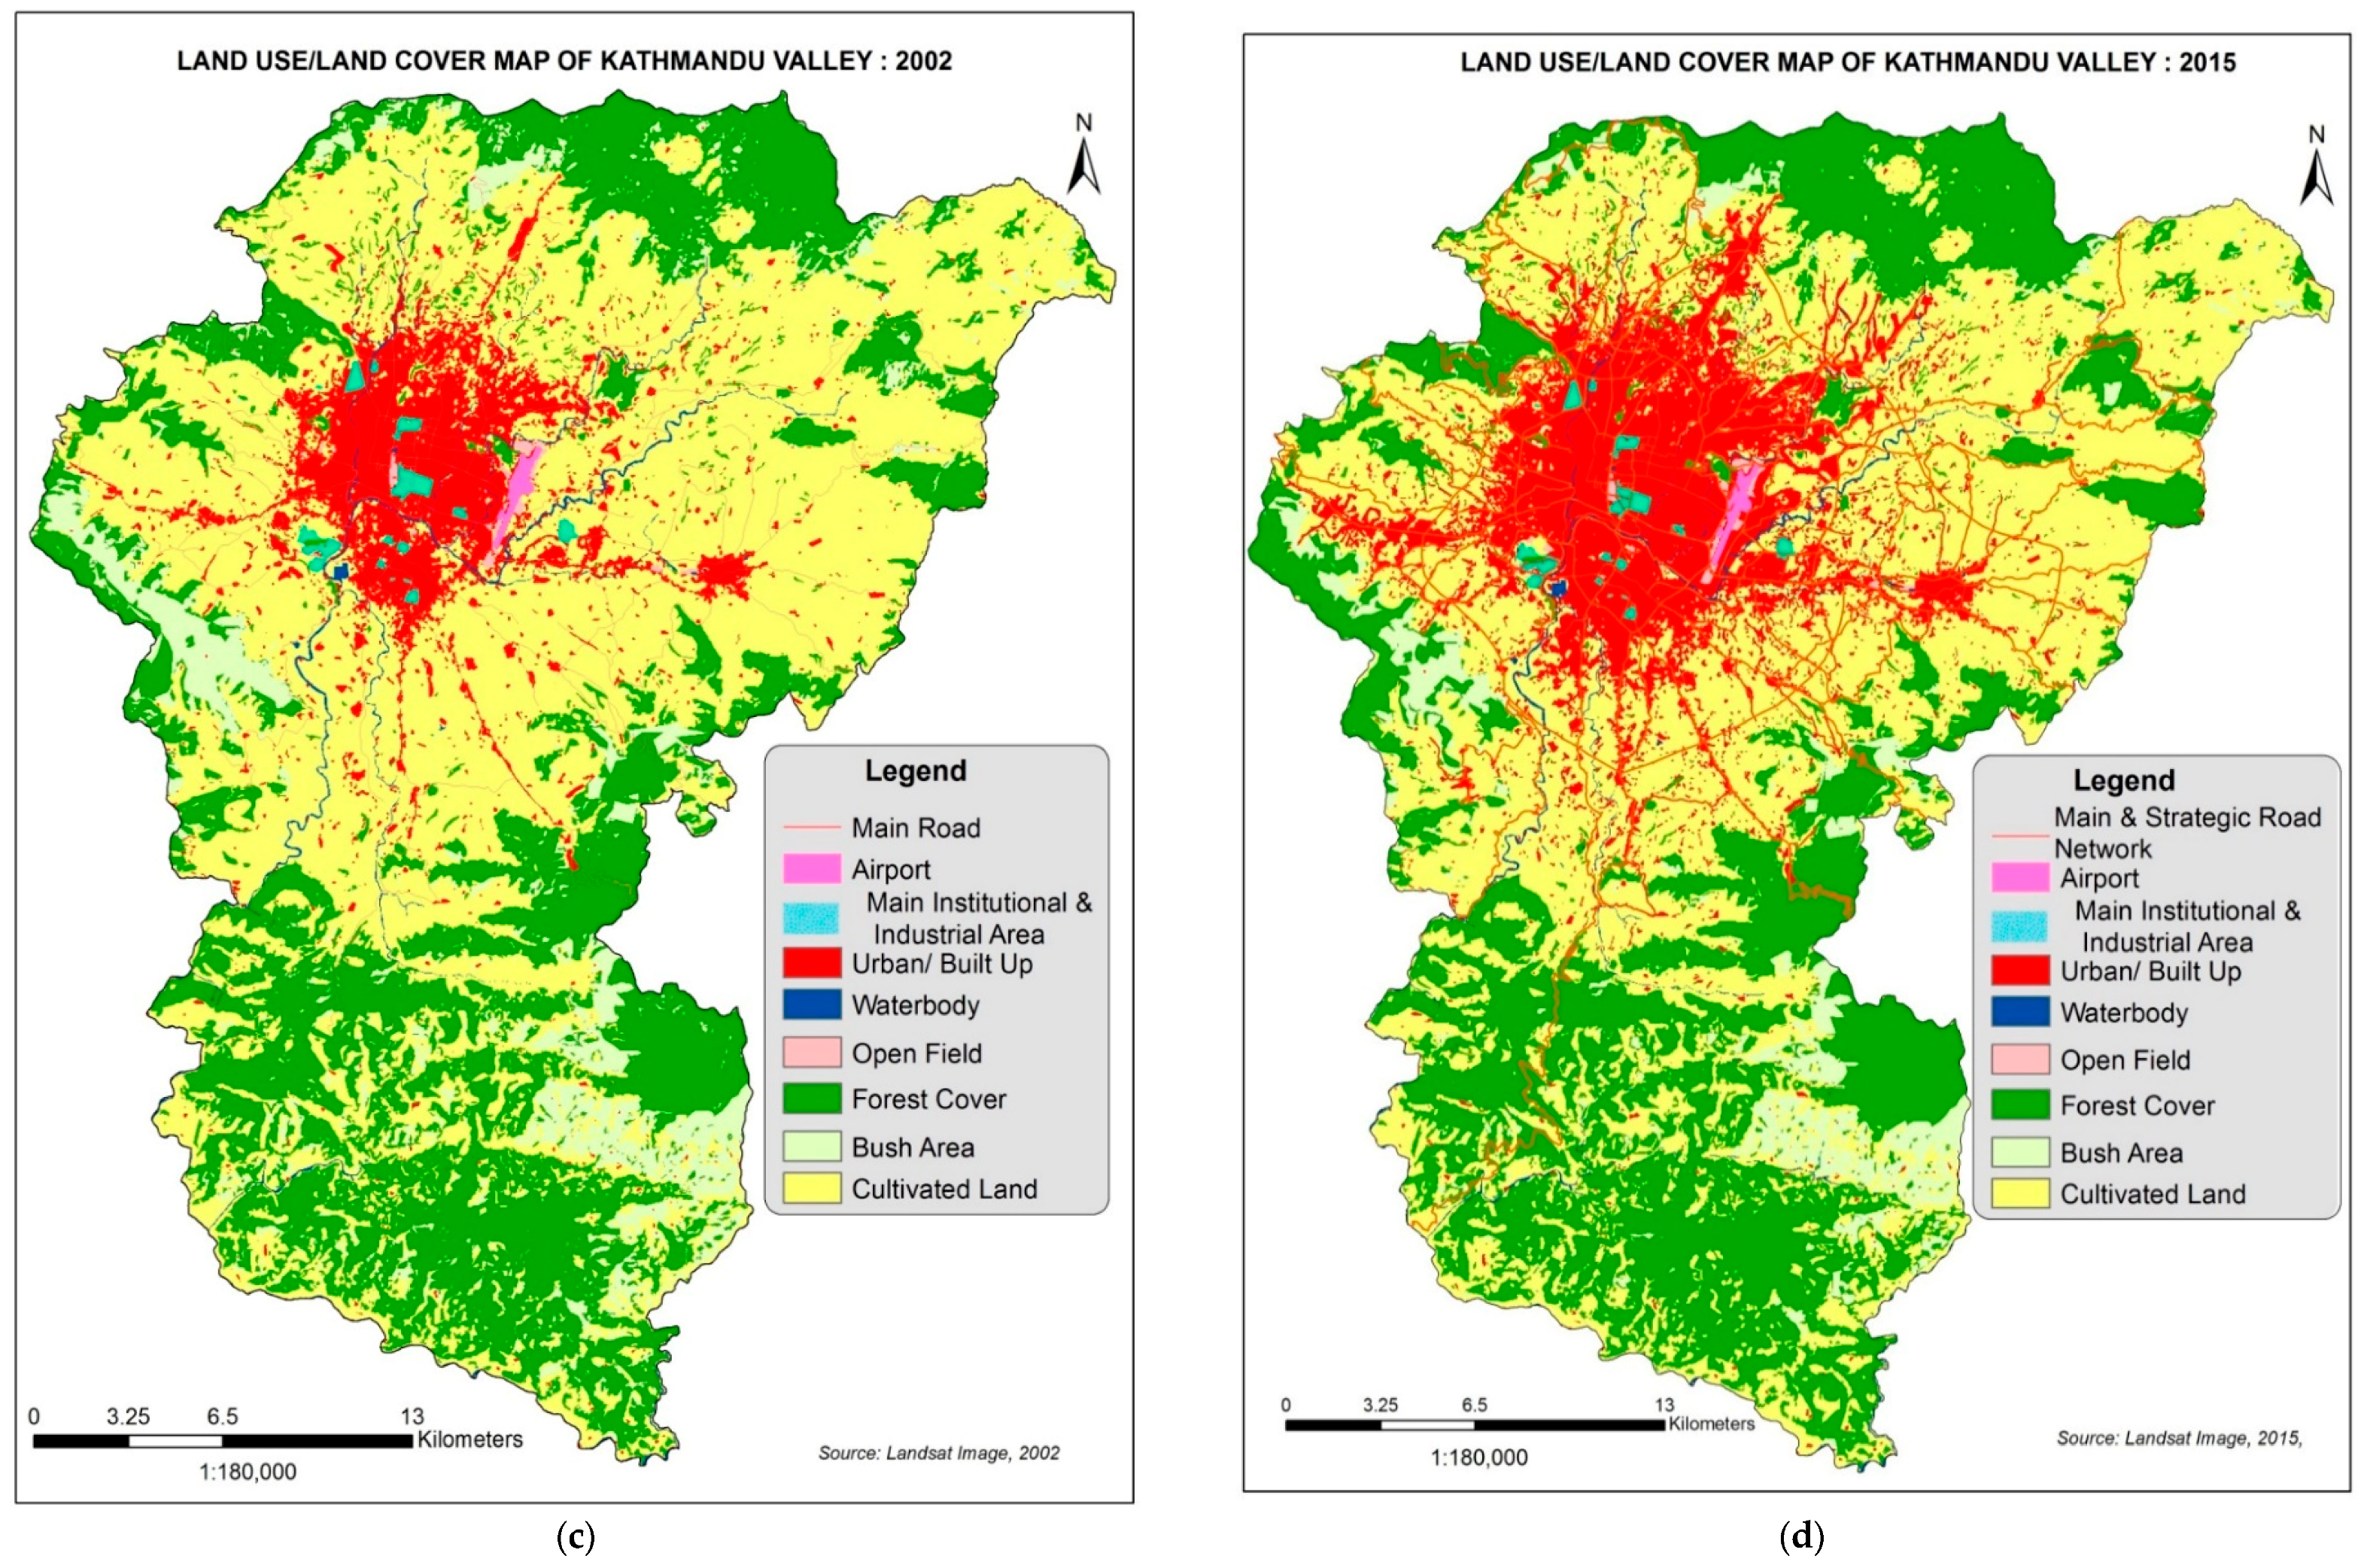
The land use pattern in urban areas had rapidly changed, and the urban development pattern is environmentally unmanageable in Kathmandu valley [35]. Rapid population growth and urbanization have caused much agricultural land transformation of anthropogenic structures and has intensified overexploitation of extant land covers. The escalated land use change is partially due to Nepal becoming a more service-based economy [36]; yet, 70% of Nepal’s gross national product still depends on agricultural sector. Despite agricultural productivity, many people have migrated from rural areas for the quest of better living [37]. According to the statistics, Kathmandu’s urban coverage totaled 20.19 km2 in 1976 (Figure 7a), but increased to 39.47 km2 in 1989 (Figure 7b), 78.96 km2 in 2002 (Figure 7c) and 139.57 km2 in 2015 (Figure 7d), which is considered as a rapid transition in the in the LULC analysis.
The effects of rapid urbanization were prevalent in cities and suburban areas of the valley. As the cities expanded, it directly impacted suburban areas, and those living in suburban faced many new challenges. A significant area (63.32 km2) of cultivated land of Kathmandu valley was converted into other classes between 1976 and 2015, and 119 km2 area appeared as urban in the same period, at the expense of agricultural lands, forest and bush areas. Much of the city’s rapid growth in population has been accommodated in informal settlements, resulting in the destruction of natural systems. In order to raise the stewardship between humans and nature, more strict urban plans and policies that favor the protection of arable land are essential.
The spatial transition over a period of 13 years between 1976 and 1989 showed the pronounced conversion of forest into cultivated land uses, probably for agricultural uses such as rearing livestock, foraging and grass collection. Over 90% of the valley’s population was agro-pastoral in the 1980s [33]. However, over time, urban sprawl became the second largest factor for converting forest into cultivated land, a precursor of urbanization (Table 4, Figure 8a).
Some extensive alterations in LULC were noticed between 1989 and 2002 (Table 5). The degeneration of forests continued with 20 km2 being transformed into bush land and 17.62 km2 into cultivated land. Urbanization was intense during this period with about 38 km2 of land being converted from forest and cultivated lands to urban areas (Table 5, Figure 8b).
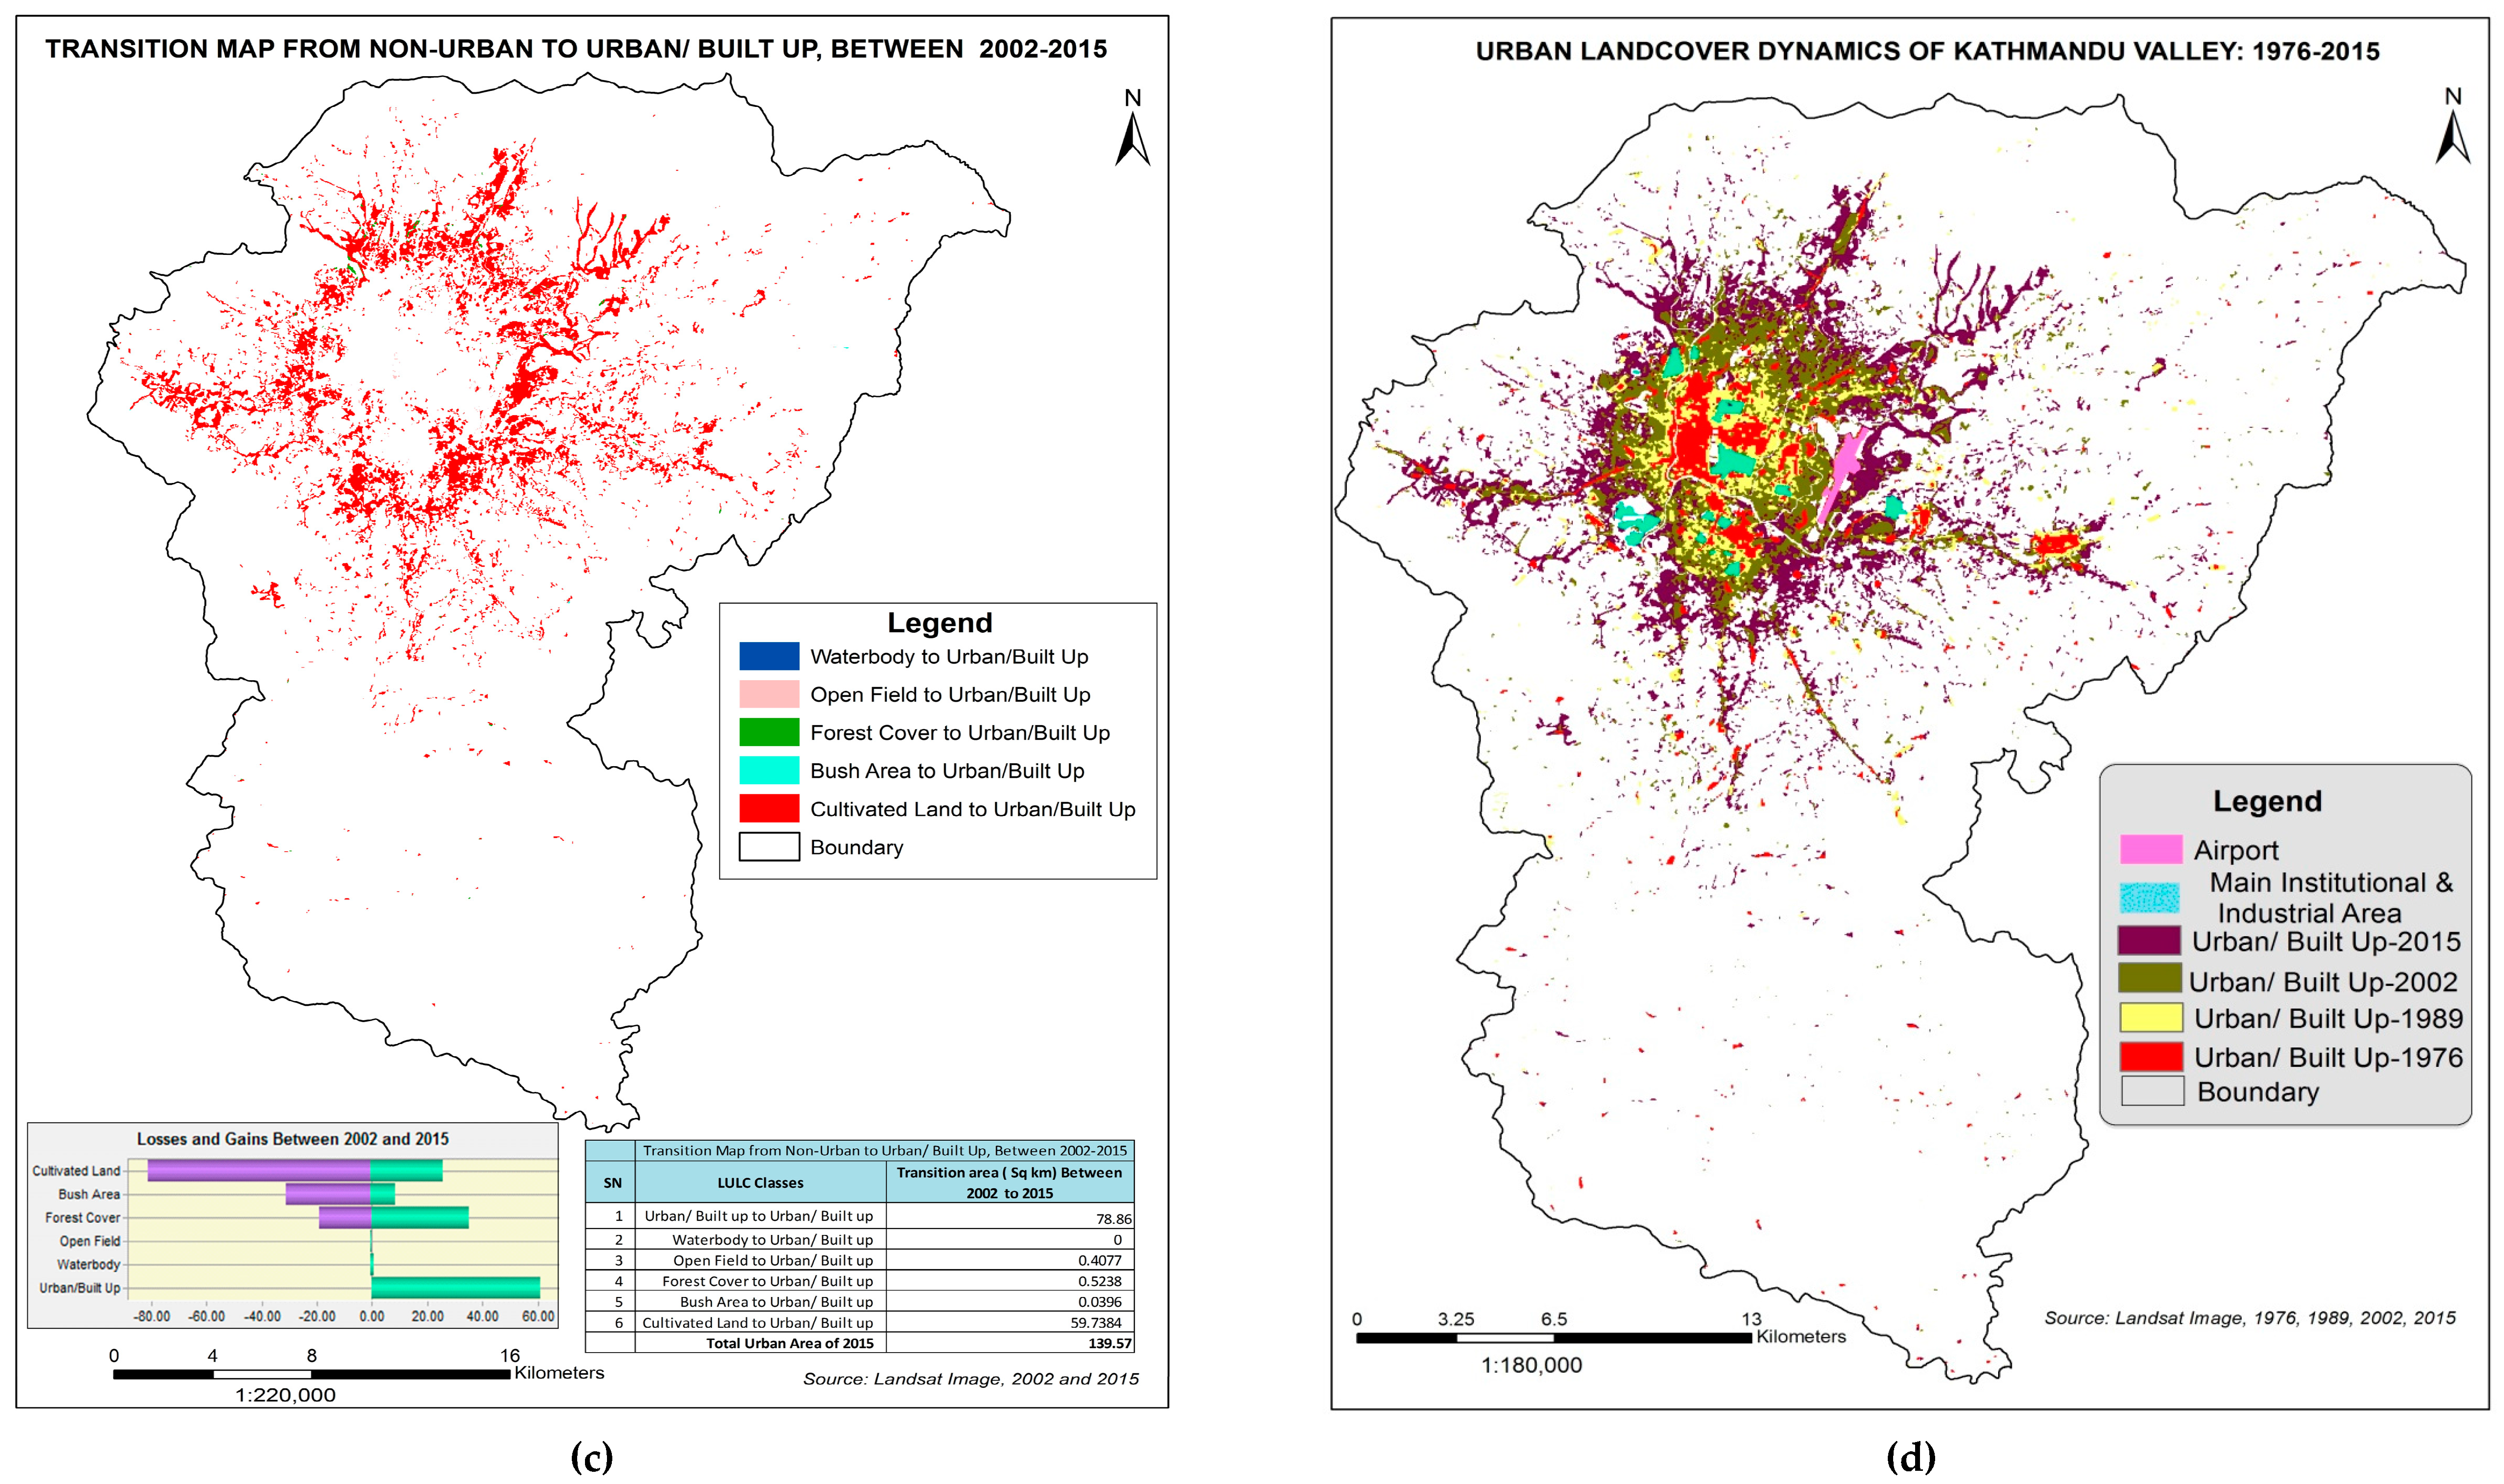
The conversion of a total of 59.74 km2 of cultivated land into built up structures and the transformation of 13.72 km2 of forest to cultivated land are the two remarkable changes in land use and land cover between 2002 and 2015. Forest land conversion was minimal because of increased forest and biodiversity conservation programs. Despite intensified urbanization, these recent conservation programs have helped emphasize the benefits of leaving greenery and forests intact. As a consequence, in the last decade, the change of forest into cultivation land (13.72 km2) was surmounted by cultivated land into forest (Table 6, Figure 8c). Figure 8d demonstrates the spatiotemporal pattern of urbanization in the valley from 1976 to 2015.
3.3. Spatial Orientation of Urban Land Expansion
The first decade between 1976 and 1989 accounted for limited urban enlargement throughout the entire study area, contrary to the large-scale urbanization between 1989–2002 and 2002–2015. Remarkable change of LULC (Figure 9a) and urban enlargement occurred in every direction from the city core (Figure 9b,c); yet, the extensions that took place in N-NE (Budhanilkantha area), NE-E (Jorpati, Sankhu, Gokarna area), E-SE (Bhaktapur area) and SE-S (Imadol, Godawari area of Lalitpur) are comparatively the highest. The Bhaktapur area is one of the important gateways to the valley and incorporates the large plain area where urban area expanded from 4.67 km2 in 1976 to 8.3 km2 in 1989. The dramatic increase from 15.2 km2 in 2002 to 25.95 km2 in 2015 is another large-scale expansion. Consequently, Jorpati, Sankhu area, experiences a similar trend where 2.6 km2 urban area was augmented to 5.75 km2 in 1989, which enlarged to 12.95 km2 in 2002 and 23.75 km2 in 2015 (Table 7). The areas adjacent to the major road networks that link the valley with the important hinterland villages (e.g., Lubhu, Lamatar, Chapagaun areas of Lalitpur) have gained a higher urban enlargement. S-SW (Bungmati, Khokana area) has moderately medium and SW-W (Kirtipur, Thankot area), W-NW (Sitapaila, Ramkot area) and NW-N (Goldhunga, Jitpur area) possess relatively less urban increase.
The first two areas share their western boundary with the hills, which has constrained the expansion, resulting in the comparatively lower expansion. Due to the on-going construction of the outer Ring road almost covering the whole valley, further expansion of the dense settlements in the remaining areas at the cost of cultivated land is predictable.
3.4. Urban Expansion Rate
The total urban area of Kathmandu valley was 20.19 km2 in 1976, which extended by almost two-fold in 1989 with 39.47 km2, with an average growth rate of 7.34% per year in the following 13 years. In 2002 and 2015, the urban are reached 78.96 km2 and 139.57 km2, respectively. The total annual increase rate was 7.70% between 1989 and 2002 and 5.90% between 2002 and 2015. That is 6.91-times higher than that in 1976.
3.5. Socioeconomic Impacts
Kathmandu valley is the central hub for the political, educational and economic activities, employment opportunities, air transport, cultural and historical heritage. The availability of urban basic services such as roads, electricity and telephone has influenced the population acceleration in the last few decades. Thus, the fertile land has been confined due to the abrupt urbanization, and people’s interest has shifted to commercial farming, mainly of horticulture and floriculture, from the substantial farming in the limited land within the valley [25].
Multiple driving forces are considered responsible for the urbanization process in Kathmandu; however, they were specific at spatial scales [9,37]. Economic opportunities in the city’s core areas, population growth in the fringe and the political situation in the rural areas were identified as the major drivers of urbanization. A previous study reported that [37] physical condition was trivial in contributing to the urbanization process; nevertheless, its role greatly varied from 18% in the city, to 27% in the fringes, to 55% in the rural areas. Economic opportunities contributed 47%, 31% and 22% in urbanization in cities, fringes and rural areas, respectively. The land market business is highly concentrated in the rural and fringe in comparison to the city core due to the limited land availability. The land use-based approach is often regarded in sustainable urbanization [25].
3.6. Nepal Earthquake 2015
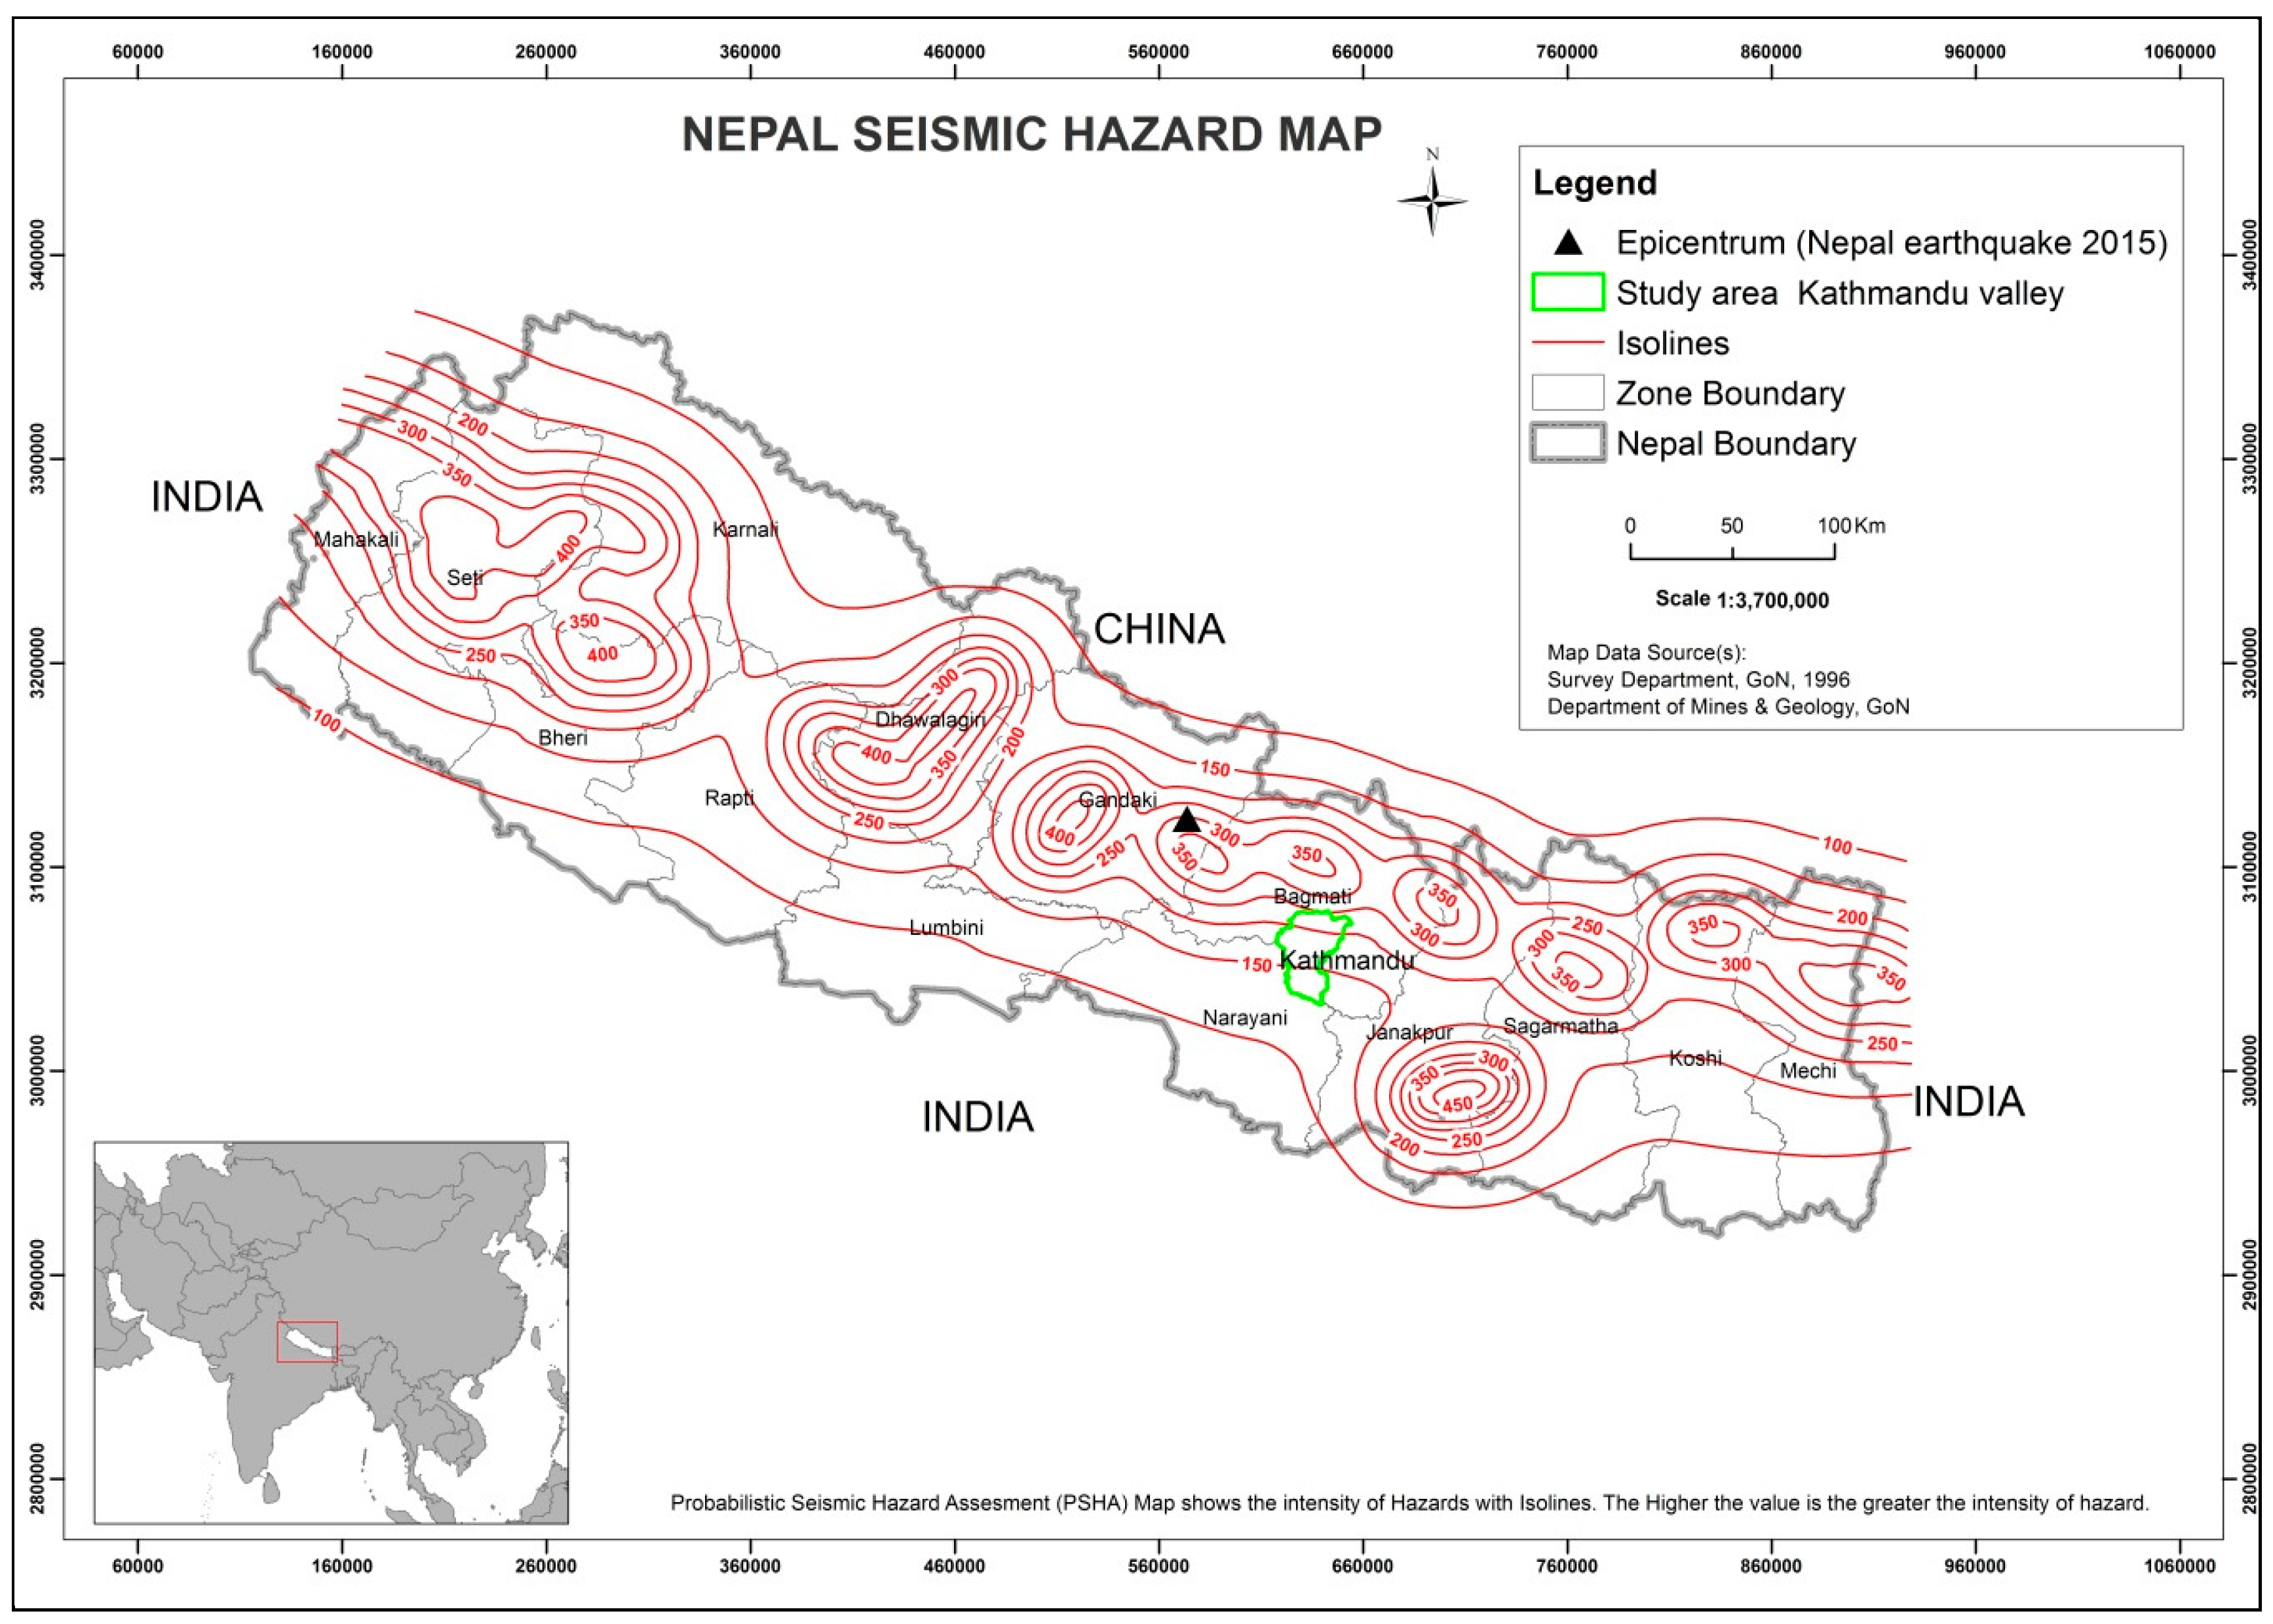
Nepal is listed as the 20th most disaster-prone country in the world, most vulnerable to the effects of climate change, 11th most at risk for earthquake damage and 30th most vulnerable to floods [38]. Kathmandu valley has the greatest earthquake risk among any of the 21 mega cities in the world because it lies in a very active seismic zone within a high hazard intensity (Figure 10). Seismic records of Nepal, which date back to 1255 A.D., show that destructive earthquakes happened in 1408, 1681, 1810, 1833, 1866, 1934, 1980, 1988 and 2011. The 1833 quake was the most destructive, and the 1934 earthquake impacted Kathmandu the most, resulting in more than 8500 deaths and destroying 38,000 buildings [38,39].
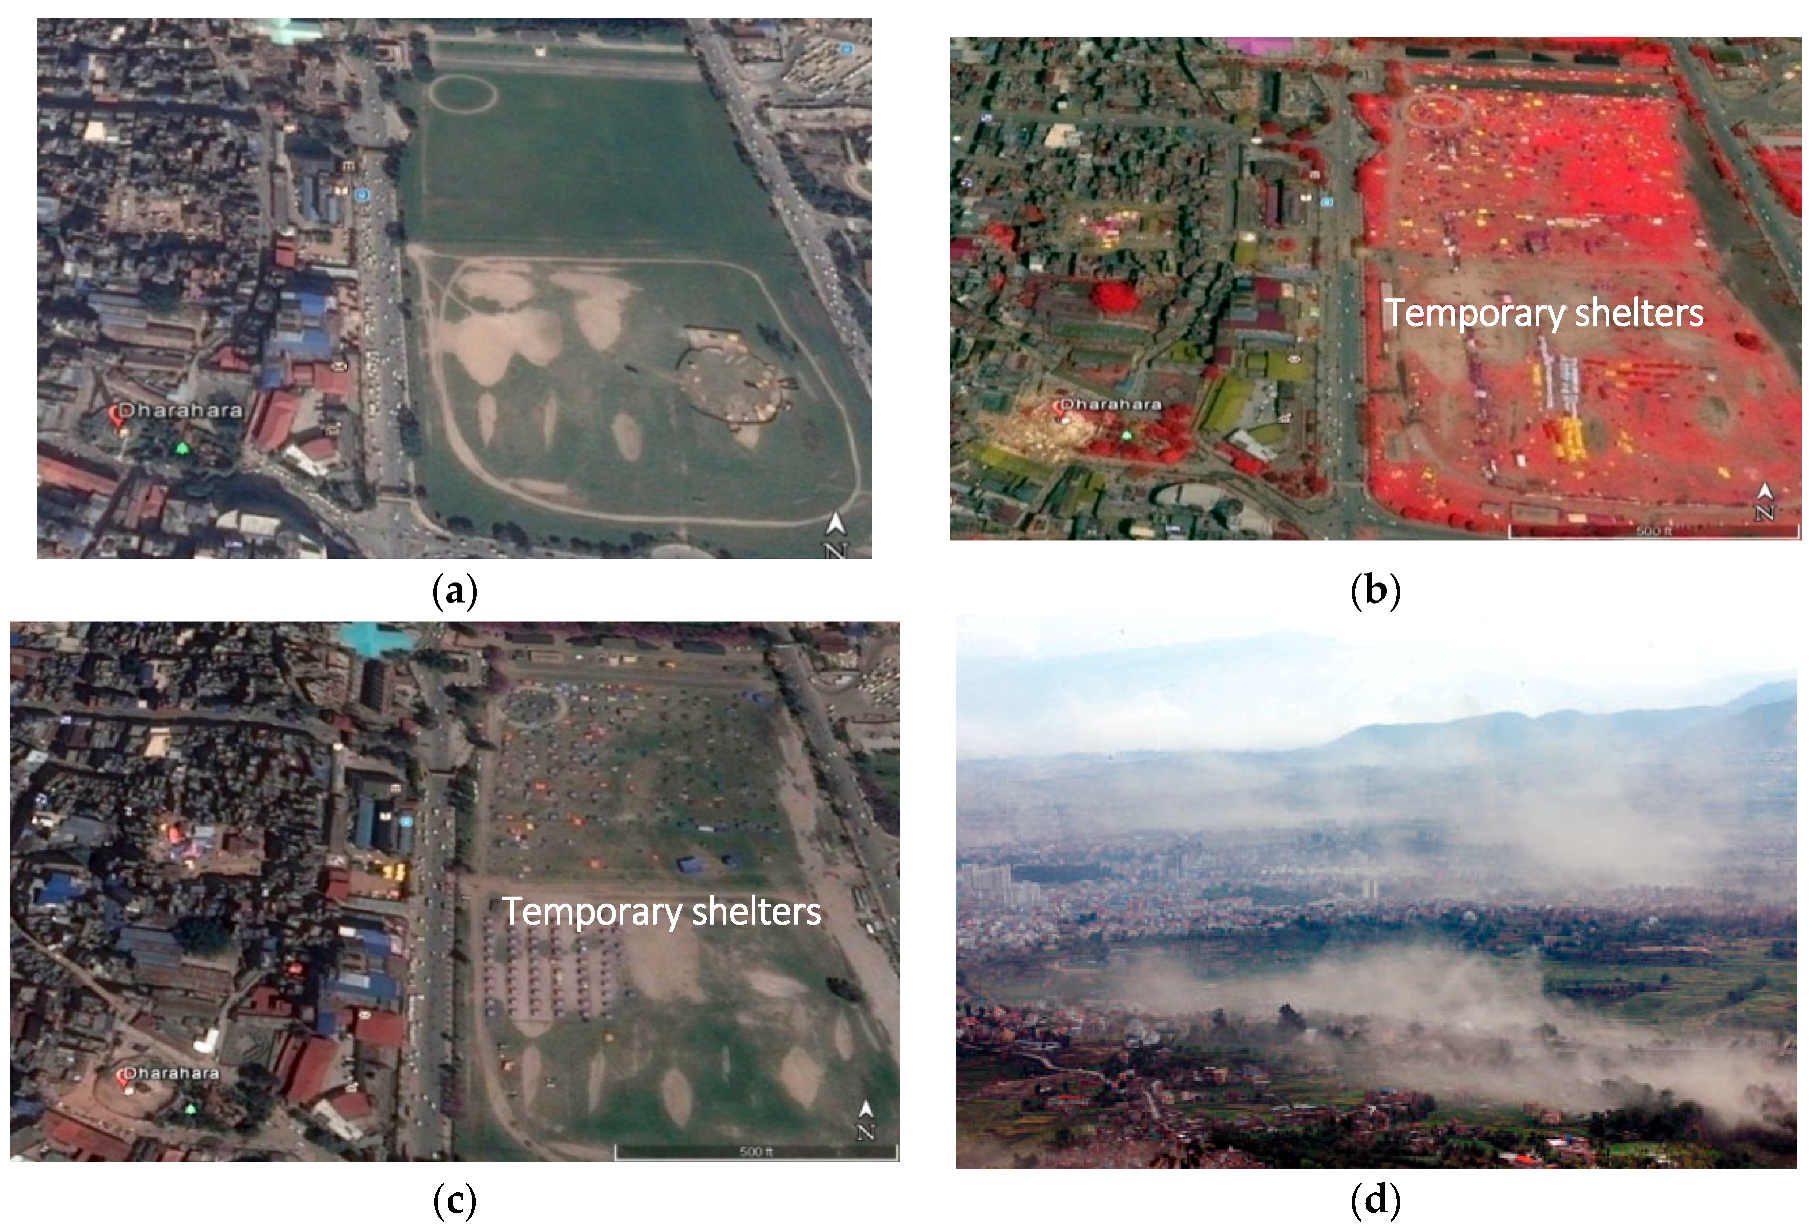
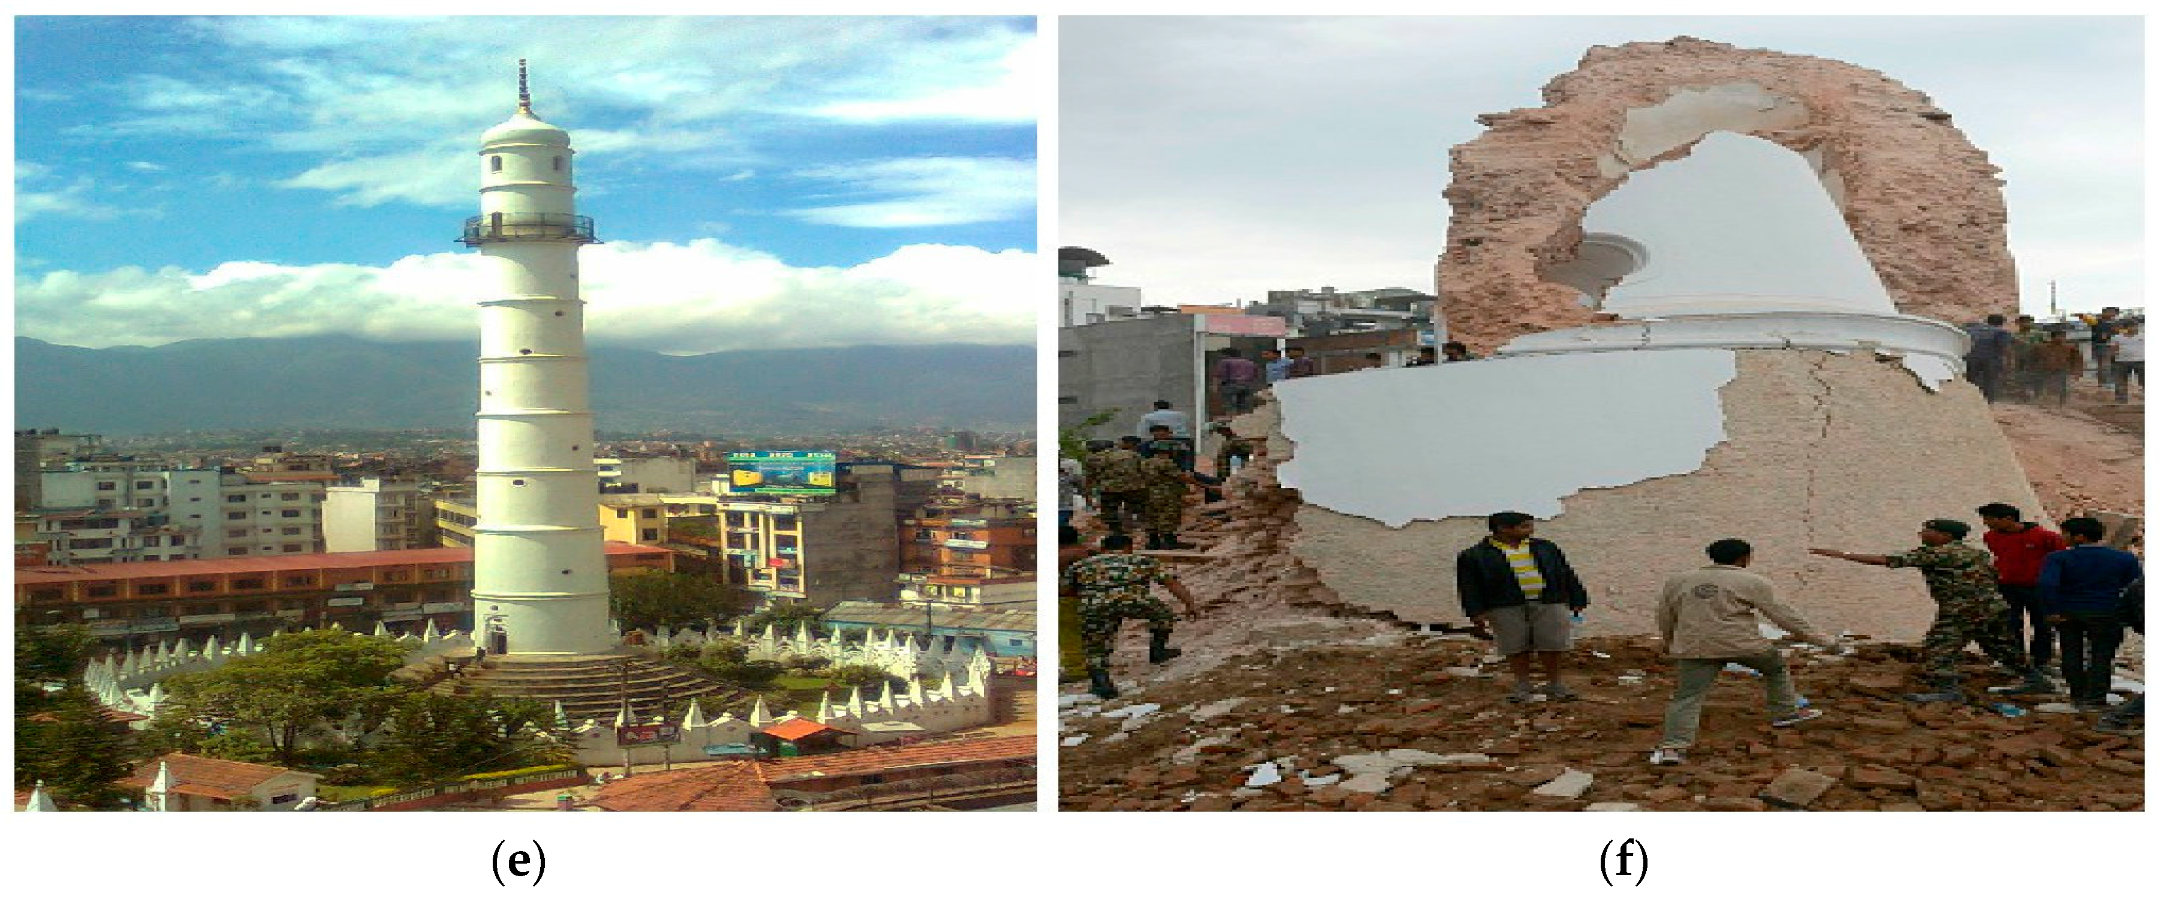
On Saturday, 25 April 2015, at 11:56 a.m. local time, a 7.6 magnitude (8.2 km depth) earthquake struck Barpak, Gorkha, about 76 km northwest of Kathmandu, followed by many subsequent aftershocks, the largest occurring at 12:50 local time on 12 May 2015 in Barpak, Gorkha, and Sunkhani, Dolakha, with a magnitude of 7.3. The 2015 earthquake was the most powerful jolt to hit Nepal since the quake of 1934 [40]. This earthquake killed 1746 people and severely injured 13,102 in Kathmandu valley alone. Altogether, 80,149 private properties and 321 government buildings were fully destroyed in Kathmandu alone; and 72,249 private houses and 545 government buildings partially crumbled [41]. The earthquake damaged (Figure 11a,d presents the view in Google Earth images before and after the earthquake of Kathmandu valley) many of the country’s large administrative centers, including Singh durbar, Sheetal Niwas, the Supreme Court, etc. Seven UNESCO heritage sites were also damaged. The nine-story historical landmark tower Dharahara, in Nepali language, which was constructed during 1832 by the then Prime Minister Bhimsen Thapa, massively collapsed during the jolt, where a large number of visitors lost their lives (Figure 11e). Much of the damage occurred because many of the buildings across the country are not built to seismic standards, and so, any major jolt can cause them to crumble. Tens of thousands of houses, buildings and structures are in such a precarious state that a major jolt can result in harsh damage. Various structures are supported by bamboo, wooden or iron bastions to prevent from further crumbling. Now, even over a year after the quake, many structures still have not been rebuilt. Some people are living in homes with cracked foundations or holes in the stone walls. Countless numbers of people are also still reported to be living in temporary shelters in Kathmandu.
Due to the easy access of urban facilities, such as physical infrastructure, economic probability and advanced life, people are intending to move to city areas, resulting in villages being unattended and full of ruderals [36]. The investment of land markets and real estate has played a vital role in mushrooming the settlements in urban areas. The urban sprawl and LULC change of Kathmandu occurred without proper planning or policy, creating an area greatly at risk from earthquake damage. Limited understanding of earthquake disaster risk and lack of emergency preparedness are the major hurdles of the effective disaster risk reduction and mitigation process. Due to the lack of proper land use planning, unmanaged urban sprawl and risky settlements, many cultivable lands and forests are converted into built-up areas. Incomplete land use planning puts people at higher risk in natural disasters and increases food insecurity, as much of the area’s cultivated land has been converted into shoddily-constructed homes. Due to the lack of seismic technologies, trained masons and engineers and the perceived cost of seismic-resilient construction, many buildings when constructed are seismically unsafe. To build seismically-resilient and LULC-friendly structures, effective disaster management and construction protocols must be implemented by the Nepalese government. These policies should consider mitigation and preparedness, emergency response and rehabilitation and reconstruction policies for post-disaster based on scientific criteria. Sustainable planning has the capacity to make this last disaster an opportunity to rebuild a better Nepal.
3.7. Earthquake, Land Use and Geological Formation
Spatial analysis of the geology in Kathmandu valley showed that the Gokarna formation, Kalimati formation and Chapagaun formation were all highly affected by the 2015 earthquake, while the Chandragiri formation and Kulekhani formation were both moderately affected (Figure 12 and Figure 13). Mostly the areas enclosed within the Kalimati, Gokarna and Chapagaun formation, mainly Gongabu, Jorpati, Gokarna, Bhaktapur, Bungmati, Chapagaun and Kirtipur periphery, are the remarkable areas that obtain high urban orientation, as well as are highly impacted by the Nepal earthquake, 2015. The geological landscape affected the damage risk of Kathmandu valley, but housing construction also often determined how much damage a building experienced. Traditional homes constructed with bricks and mud mortar often suffered large amounts of damage, as well as the modern houses, which are made up of bricks and concrete, fail to meet the earthquake resilience criteria. Although concrete is a more modern material, it is heavy and often became dislocated during the quake. Additionally, poor equipment, unskilled labor, poor quality building materials and a lack of timely maintenance were risk factors for the quake damage result in fragile homes. Through spatial analysis and geological surveys, we conclude that the establishment of non-resilient, unregulated constructions on top of highly vulnerable geologic formations created the large amounts of loss and damage in Kathmandu valley. Further research is needed to fully understand different land uses and geological formations’ vulnerability to earthquakes.
3.8. Planning and Policy
The government of Nepal (GoN) has introduced different land use acts and policies regarding the LULC management (e.g., Civil Code 1843, amended in 1963, Land Right Acquiring Act 1951, Survey and Measurement Act 1962, Land Act 1964, Land Administration Act and Land Revenue Act 1976, Land Acquisition Act 1977, Town Development Act 1989, National Agriculture Policy 2004, National Urban Policy 2007, Industrial Policy 2011, National Shelter Policy 2012, Agriculture Development Strategy (ADS) 2013, National Land Use Policy 2012 and 2015, Forest Policy 2015, Urban Planning and Building Construction Guidelines, 2015); these are some of the noteworthy plans and policies promulgated by the government [42]. Similarly, several scattered laws and regulations in one way or other deal with land and its use. In 2002, the government approved a long-term development plan for Kathmandu valley prepared by the Kathmandu valley Town Development Committee. The plan was particularly based on land use criteria [25]. The plan conceptualized a vision for developing Kathmandu through the year 2020. It aimed at de-concentrating economic investments and employment opportunities in the valley core to promote natural, historical, cultural, touristic environments and delineating the urban growth boundaries to control urban growth and limit capital investments. However, the plan was jeopardized by a lack of long-term strategies, political commitment and the sustainability of growth in the valley. In 2015, Nepal adopted the Settlement Development, Urban Planning and Building Construction Guidelines. These guidelines are scientifically based, and their implementation is urgently required. Fixed scientific measures are considered to be strictly adopted in terms of infrastructure development in these newly-developing urban, fringe and rural areas. Geological studies and soil tests should be emphasized prior to construction of infrastructures. Specific road standards need to be maintained for road construction or the urban planning process. These guidelines must be followed closely for the protection of Kathmandu valley’s high productivity agricultural land, green outskirts and open spaces and to smoothen the resilient urban development process.
4. Conclusions and Future Steps
The high rates of migration and population growth have directly contributed to rapid, often unmanaged urban growth in Kathmandu valley. Urbanization has occurred at the cost of fertile agricultural lands and cultural sites. Land use change in the valley has been aggravated through sporadic and persistent exploitations. Unattended fallow lands in suburban areas have worsened land degradation by welcoming invasive alien species and compromising the indigenous landscape and culture. The study area experienced rapid urbanization with the average annual urban growth rate of 7.34%, 7.70% and 5.90% between 1976, 1989, 2002 and 2015, respectively., The annual urban expansion growth rate indicates the level of urban area extension in the valley. Urban expansion direction indicates the value of socio-economic movement. Relatively the highest, moderate and the lowest urban concentration over the time period occurred in the east, southwest and west along with the northwest part of the valley, respectively.
This excessive trend of urban momentum in recent decades is being strengthened with the ongoing construction of the outer Ring-road and additional physical infrastructures, which are likely to convert the whole valley into a dense jungle of concrete in the coming decades. The government needs to introduce an effective urban plan to control the haphazard settlement practice in the city, fringe and rural areas. Geological studies, soil tests, building standards, road standards and wise land utilization practices should be conducted prior to the construction of private and public infrastructure
To this end, the monitoring of the urban expansion direction and variation through the application of multi-temporal images will be the crucial milestones, and geological information will remain as the stepping stones for the operative urban planning in the forthcoming days.
Since land use management is a fundamental part of development, our results advocate the essentiality of incorporating scientific urban planning and appropriate land use management practice for the sustainable urban development of Kathmandu valley, as well as other cities of Nepal.
Acknowledgments
The research was supported by the Chinese Academy of Sciences (CAS) President’s International Fellowship Initiative (PIFI), Grant No. 2016PE022, and the National Natural Science Foundation of China (Grant No. 41471281, 41501396 and 41501473).The authors thank all of the scientists who have participated in the establishment of the database. Chris Lebos and Sushila Rijal are acknowledged for language editing. We would like to thank the Editor and the anonymous reviewers for their constructive comments and suggestions.
Author Contributions
Bhagawat Rimal designed the research idea for the paper and took overall responsibility for the study, including data collection and image analysis, preparation of figures, and finalization of the manuscript. Lifu Zhang supervised the research and provided useful suggestions throughout the preparation of the manuscript. Dongjie Fu, and Yongguage Zhai carried out the comprehensive revision of the article and gave useful advice. Ripu Kunwar contributed in putting the research in the local context. All authors revised and contributed to finalizing the manuscript. In addition, all authors approved the final manuscript.
Conflicts of Interest
The authors declare no conflict of interest.
References
- Michetti, M.; Zampieri, M. Climate–human–land interactions: A review of major modeling approaches. Land 2014, 3, 793–833. [Google Scholar] [CrossRef]
- Araya, Y.H.; Cabral, P. Analysis and modeling of urban land cover change in Setúbal and Sesimbra, Portugal. Remote Sens. 2010, 2, 1549–1563. [Google Scholar] [CrossRef]
- Triantakonstantis, D.; Mountrakis, G. Urban growth prediction: A review of computational models and human perceptions. J. Geogr. Inf. Syst. 2012, 4, 555–587. [Google Scholar] [CrossRef]
- Hunter, L.M.; de Manuel, J.; Gonzalez, G.; Stevenson, M.; Karish, K.S.; Toth, R.; Edwards, T.C., Jr.; Lilieholm, R.J.; Cablk, M. Population and land use change in the California Mojave: Natural habitat implications of alternative futures. Popul. Res. Policy Rev. 2003, 22, 373–397. [Google Scholar] [CrossRef]
- Li, J.J.; Wang, X.R.; Wang, X.J.; Ma, W.C.; Zhang, H. Remote sensing evaluation of urban heat island and its spatial pattern of the Shanghai metropolitan area, China. Ecol. Complex. 2009, 6, 413–420. [Google Scholar] [CrossRef]
- Zhang, H.; Zhou, L.G.; Chen, M.N.; Ma, W.C. Land Use Dynamics of the Fast-Growing Shanghai Metropolis, China (1979–2008) and its Implications for Land Use and Urban Planning Policy. Sensors 2011, 11, 1794–1809. [Google Scholar] [CrossRef] [PubMed]
- Kanokporn, S.; Visut, I. Change of land use patterns in the areas close to the airport development area and some implicating factors. Sustainability 2011, 3, 1517–1530. [Google Scholar]
- Kityuttachai, K.; Tripathi, N.K.; Tipdecho, T.; Shrestha, R. CA-Markov analysis of constrained coastal urban growth modeling: Hua Hin Seaside City, Thailand. Sustainability 2013, 5, 1480–1500. [Google Scholar] [CrossRef]
- Cheng, J. Modelling Spatial and Temporal Urban Growth. Ph.D. Thesis, Faculty of Geographical Sciences Utrecht University, Utrecht, The Netherlands, 2003. [Google Scholar]
- Yin, J.; Yin, Z.; Zhong, H.; Xu, S.; Hu, X.; Wang, J.; Wu, J. Monitoring urban expansion and land use/land coverchanges of Shanghai metropolitan area during the transitional economy (1979–2009) in China. Environ. Monit. Assess. 2011, 177, 609–621. [Google Scholar] [CrossRef] [PubMed]
- Rimal, B.; Baral, H.; Stork, N.E.; Paudyal, K.; Rijal, S. Growing city and rapid land use transition: Assessing multiple hazards and risk in the Pokhara Valley Nepal. Land 2015, 4, 957–978. [Google Scholar] [CrossRef]
- Sexto, J.O.; Song, X.P.; Huang, C.; Channa, S.; Baker, M.E.; Townshend, J.R. Urban growth of the Washington, D.C.–Baltimore, MD metropolitan region from 1984 to 2010 by annual, Landsat-based estimates of impervious cover. Remote Sens. Environ. 2013, 129, 42–53. [Google Scholar] [CrossRef]
- Castrence, M.; Nong, D.H.; Tran, C.C.; Young, L.; Fox, J. Mapping urban transitions using multi-temporal Landsat and DMSP-OLS night-time lights imagery of the Red River Delta in Vietnam. Land 2014, 3, 148–166. [Google Scholar] [CrossRef]
- Ministry of Federal Affairs and Local Development | Nepal Government. Available online: http://www.mofald.gov.np/en (accessed on 24 April 2017).
- Sharma, P. Urbanization and development. In Population Monograph of Nepal; Central Bureau of Statistics: Kathmandu, Nepal, 2003; pp. 375–412. [Google Scholar]
- Thapa, R.B.; Murayama, Y. Examining Spatiotemporal Urbanization Patterns in Kathmandu Valley, Nepal: Remote Sensing and Spatial Metrics Approaches. Remote Sens. 2009, 1, 534–556. [Google Scholar] [CrossRef]
- Thapa, R.B.; Murayama, Y.; Ale, S. Kathmandu. Cities 2008, 25, 45–57. [Google Scholar] [CrossRef]
- TV, R.; Aithal, B.H.; Sanna, D.D. Insights to urban dynamics through landscape spatial pattern analysis. Int. J. Appl. Earth Obs. 2012, 18, 329–343. [Google Scholar] [CrossRef]
- Tsutsumida, N.; Saizen, I.; Matsuoka, M.; Ishii, R. Land cover change detection in Ulaanbaatar using the breaks for additive seasonal and trend method. Land 2013, 2, 534–549. [Google Scholar] [CrossRef]
- Yoshida, M.; Gautam, P. Magnetostratigraphy of Plio-Pleistocene Lacustrine Deposits in the Kathmandu Valley Central Nepal. Proc. Indian Natl. Sci. Acad. 1988, 54, 410–417. [Google Scholar]
- Sakai, T.; Gajurel, A.P.; Tabata, H.; Upreti, B.N. Small-amplitude lake-level fluctuations recorded in aggrading deltaic deposits of the Upper Pleistocene Thimi and Gokarna Formations, Kathmandu Valley, Nepal. J. Geol. Soc. 2001, 25, 43–51. [Google Scholar]
- Botts, H.; Du, W.; Foust, B.; Ihinger, P.; Jeffery, T. Modeling Earthquake Risk-White Paper. Available online: http://www.corelogic.com/about-us/researchtrends/modeling-earthquake-risk-white-paper.aspx#.WUH9HNwlGpo (accessed on 24 April 2017).
- Piya, B. Generation of Geological Database for the Liquefaction Hazard Analysis in Kathmandu Valley. Master’s Thesis, International Institute for Geoinformation Science and the Earth Observation (ITC), Enschede, The Netherlands, 2004. [Google Scholar]
- Sakai, H. Stratigraphic division and sedimentary facies of the Kathmandu Basin sediments. J. Nepal Geol. Soc. 2001, 25, 19–32. [Google Scholar]
- International Centre for Integrated Mountain Development (ICIMOD). Kathmandu Valley Environment Outlook (KVEO); International Centre for Integrated Mountain Development (ICIMOD): Kathmanud, Nepal, 2007. [Google Scholar]
- Stocklin, J.; Bhattarai, K.D. Geological Map of Kathmandu Area and Central Mahabharat Range (1:250,000); Department of Mines and Geology: Kathmandu, Nepal, 1986. [Google Scholar]
- Central Bureau of Statistics (CBS). Environment Statistics of Nepal and Nepal Population Report; National Planning Commission Secretariat, Government of Nepal: Kathmandu, Nepal, 2011.
- Bhattarai, K.; Conway, D. Urban Vulnerabilities in the Kathmandu Valley, Nepal: Visualizations of Human/Hazard Interactions. J. Geogr. Inf. Syst. 2010, 2, 63–84. [Google Scholar] [CrossRef]
- Zhang, Z.X.; Wang, X.; Zhao, X.L.; Liu, B.; Yi, L.; Zuo, L.J.; Wen, Q.K.; Liu, F.; Xu, J.Y.; Hu, S.G. A 2010 update of National Land Use/Cover Database of China at 1:100000 scale using medium spatial resolution satellite images. Remote Sens. Environ. 2014, 149, 142–154. [Google Scholar] [CrossRef]
- Zhang, Z.; Li, N.; Wang, X.; Liu, F.; Yang, L. A Comparative Study of Urban Expansion in Beijing, Tianjin and Tangshan from the 1970s to 2013. Remote Sens. 2016, 8, 1–22. [Google Scholar] [CrossRef]
- Anderson, J.R.; Hardy, E.E.; Roach, J.T.; Witmer, R.E. A Land Use and Land Cover Classification System for Use with Remote Sensor Data; United States Government Printing Office: Washington, DC, USA, 1976.
- Xiao, P.; Wang, X.; Feng, X.; Zhang, X.; Yang, Y. Decting China’s urban expantion over the past three decades using nighttime light data. IEEE J. Sel. Top. Appl. Earth Obs. Remote Sens. 2014, 7, 4095–4106. [Google Scholar] [CrossRef]
- Toffin, G. Urban fringes: Squatter and slum settlement in the Kathmandu valley, Nepal. CNAS J. 2010, 372, 151–168. [Google Scholar]
- Goldstein, M.; Ross, J.; Schuler, S. From a mountain/rural to a plains/urban society: Implications of the 1981 Nepalese consensus. Mt. Res. Dev. 1983, 3, 61–64. [Google Scholar] [CrossRef] [PubMed]
- Muzzini, E.; Aparicio, G. Urban Growth and Spatial Transition in Nepal, An Initial Assessment; The World Bank: Washington, DC, USA, 2013. [Google Scholar]
- Kunwar, R.M.; Baral, K.; Poudel, P.; Acharya, R.P.; Thapa-Magar, K.; Cameron, M.; Bussmann, R.W. Land-use and socioeconomic change, medicinal plant selection and biodiversity resilience in Far Western Nepal. PLoS ONE 2016, 11, e0169447. [Google Scholar] [CrossRef] [PubMed]
- Thapa, R.B. Spatial Process of Urbanization in Kathmandu Valley, Nepal. Ph.D. Thesis, The Graduate School of Life and Environmental Sciences, The University of Tsukuba, Tsukuba, Japan, 2009. [Google Scholar]
- Ministry of Home Affairs (MoHA). Nepal Disaster Report; Ministry of Home Affairs, Government of Nepal: Kathmandu, Nepal, 2011.
- National Society for Earthquake Technology—Nepal (NSET). The Kathmandu Valley Earthquake Risk Management Action Plan; National Society for Earthquake Technology Nepal and GeoHazards International (GHI): Kathmandu, Nepal, 1999. [Google Scholar]
- National Planning Commission. Nepal Earthquake 2015, Post Disaster Needs Assessment; Key Findings; Government of Nepal: Kathmandu, Nepal, 2015.
- Government of Nepal. Nepal Disaster Risk Reduction Portal. Available online: https://drrportal.gov.np (accessed on 23 October 2015).
- UN-Habitat. National Land Use Plan; Catalytic Support on Land Issues, Participatory Land Use Planning and Implementation; UN-Habitat: Pulchowk, Nepal, 2015. [Google Scholar]
Figure 1.
Geological formation map of Kathmandu valley.

Figure 2.
(a) Location map of the study area; (b) urban expansion of Kathmandu valley in eight main area.
Figure 2.
(a) Location map of the study area; (b) urban expansion of Kathmandu valley in eight main area.
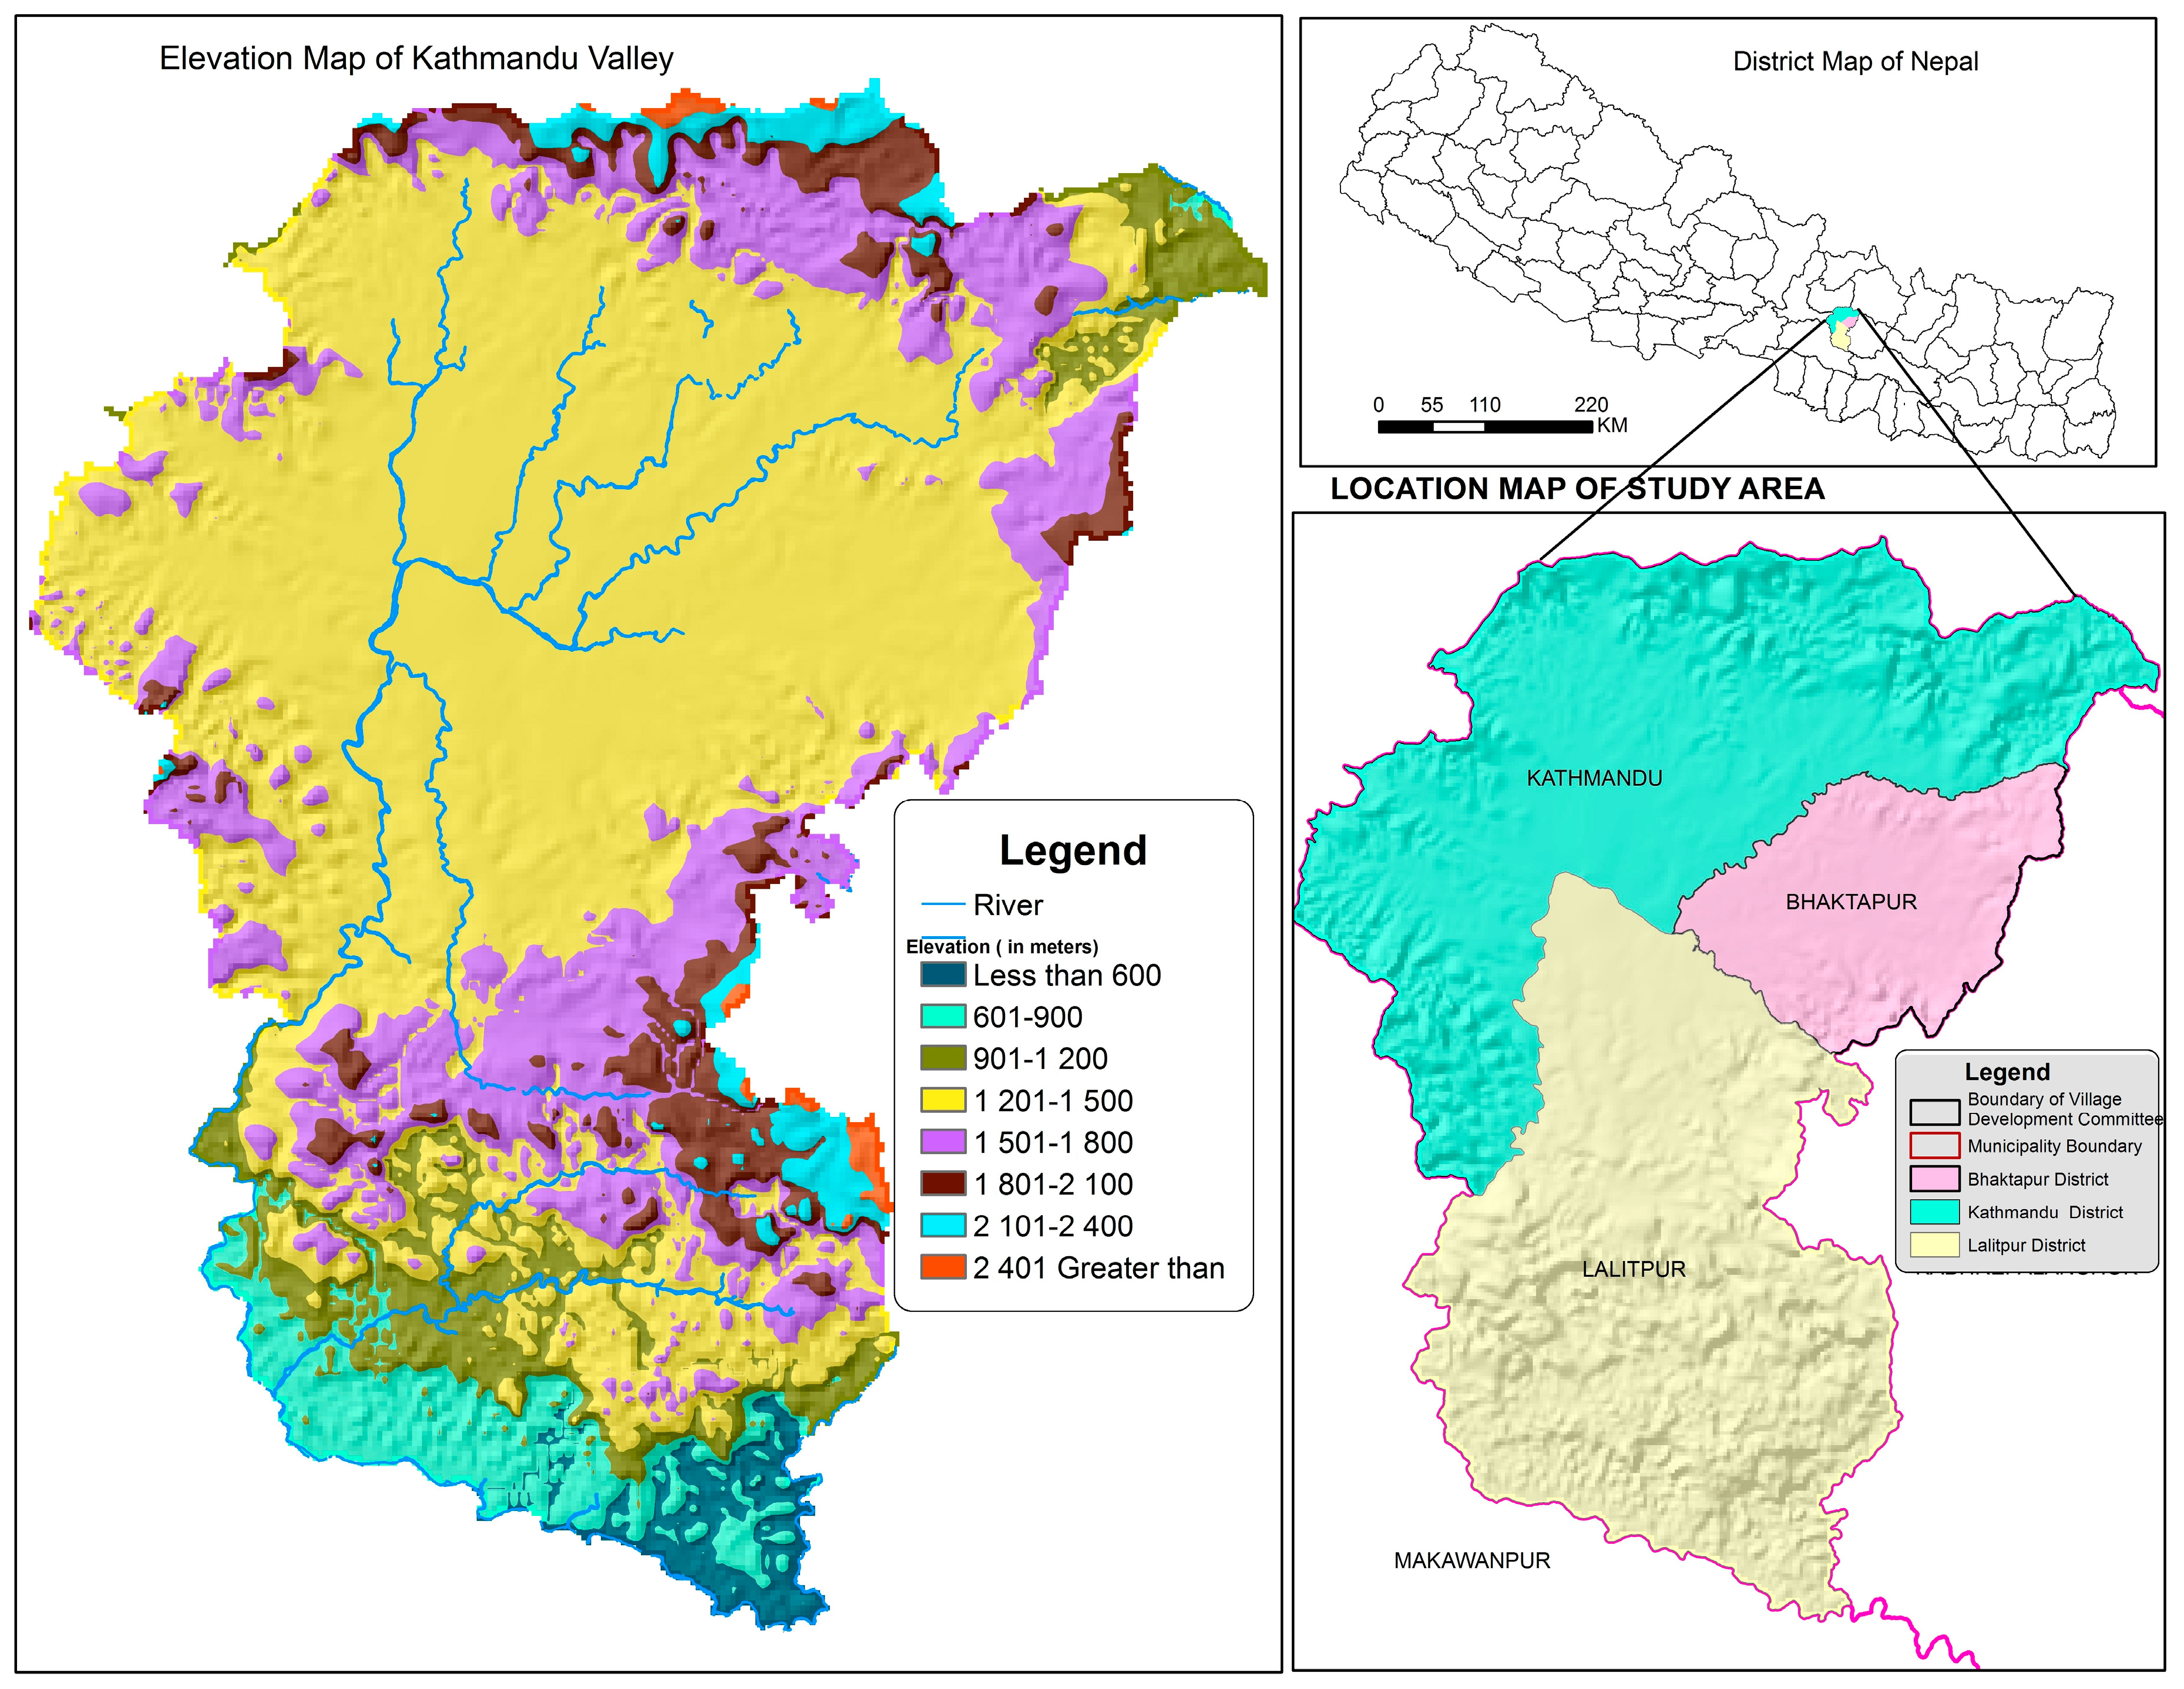
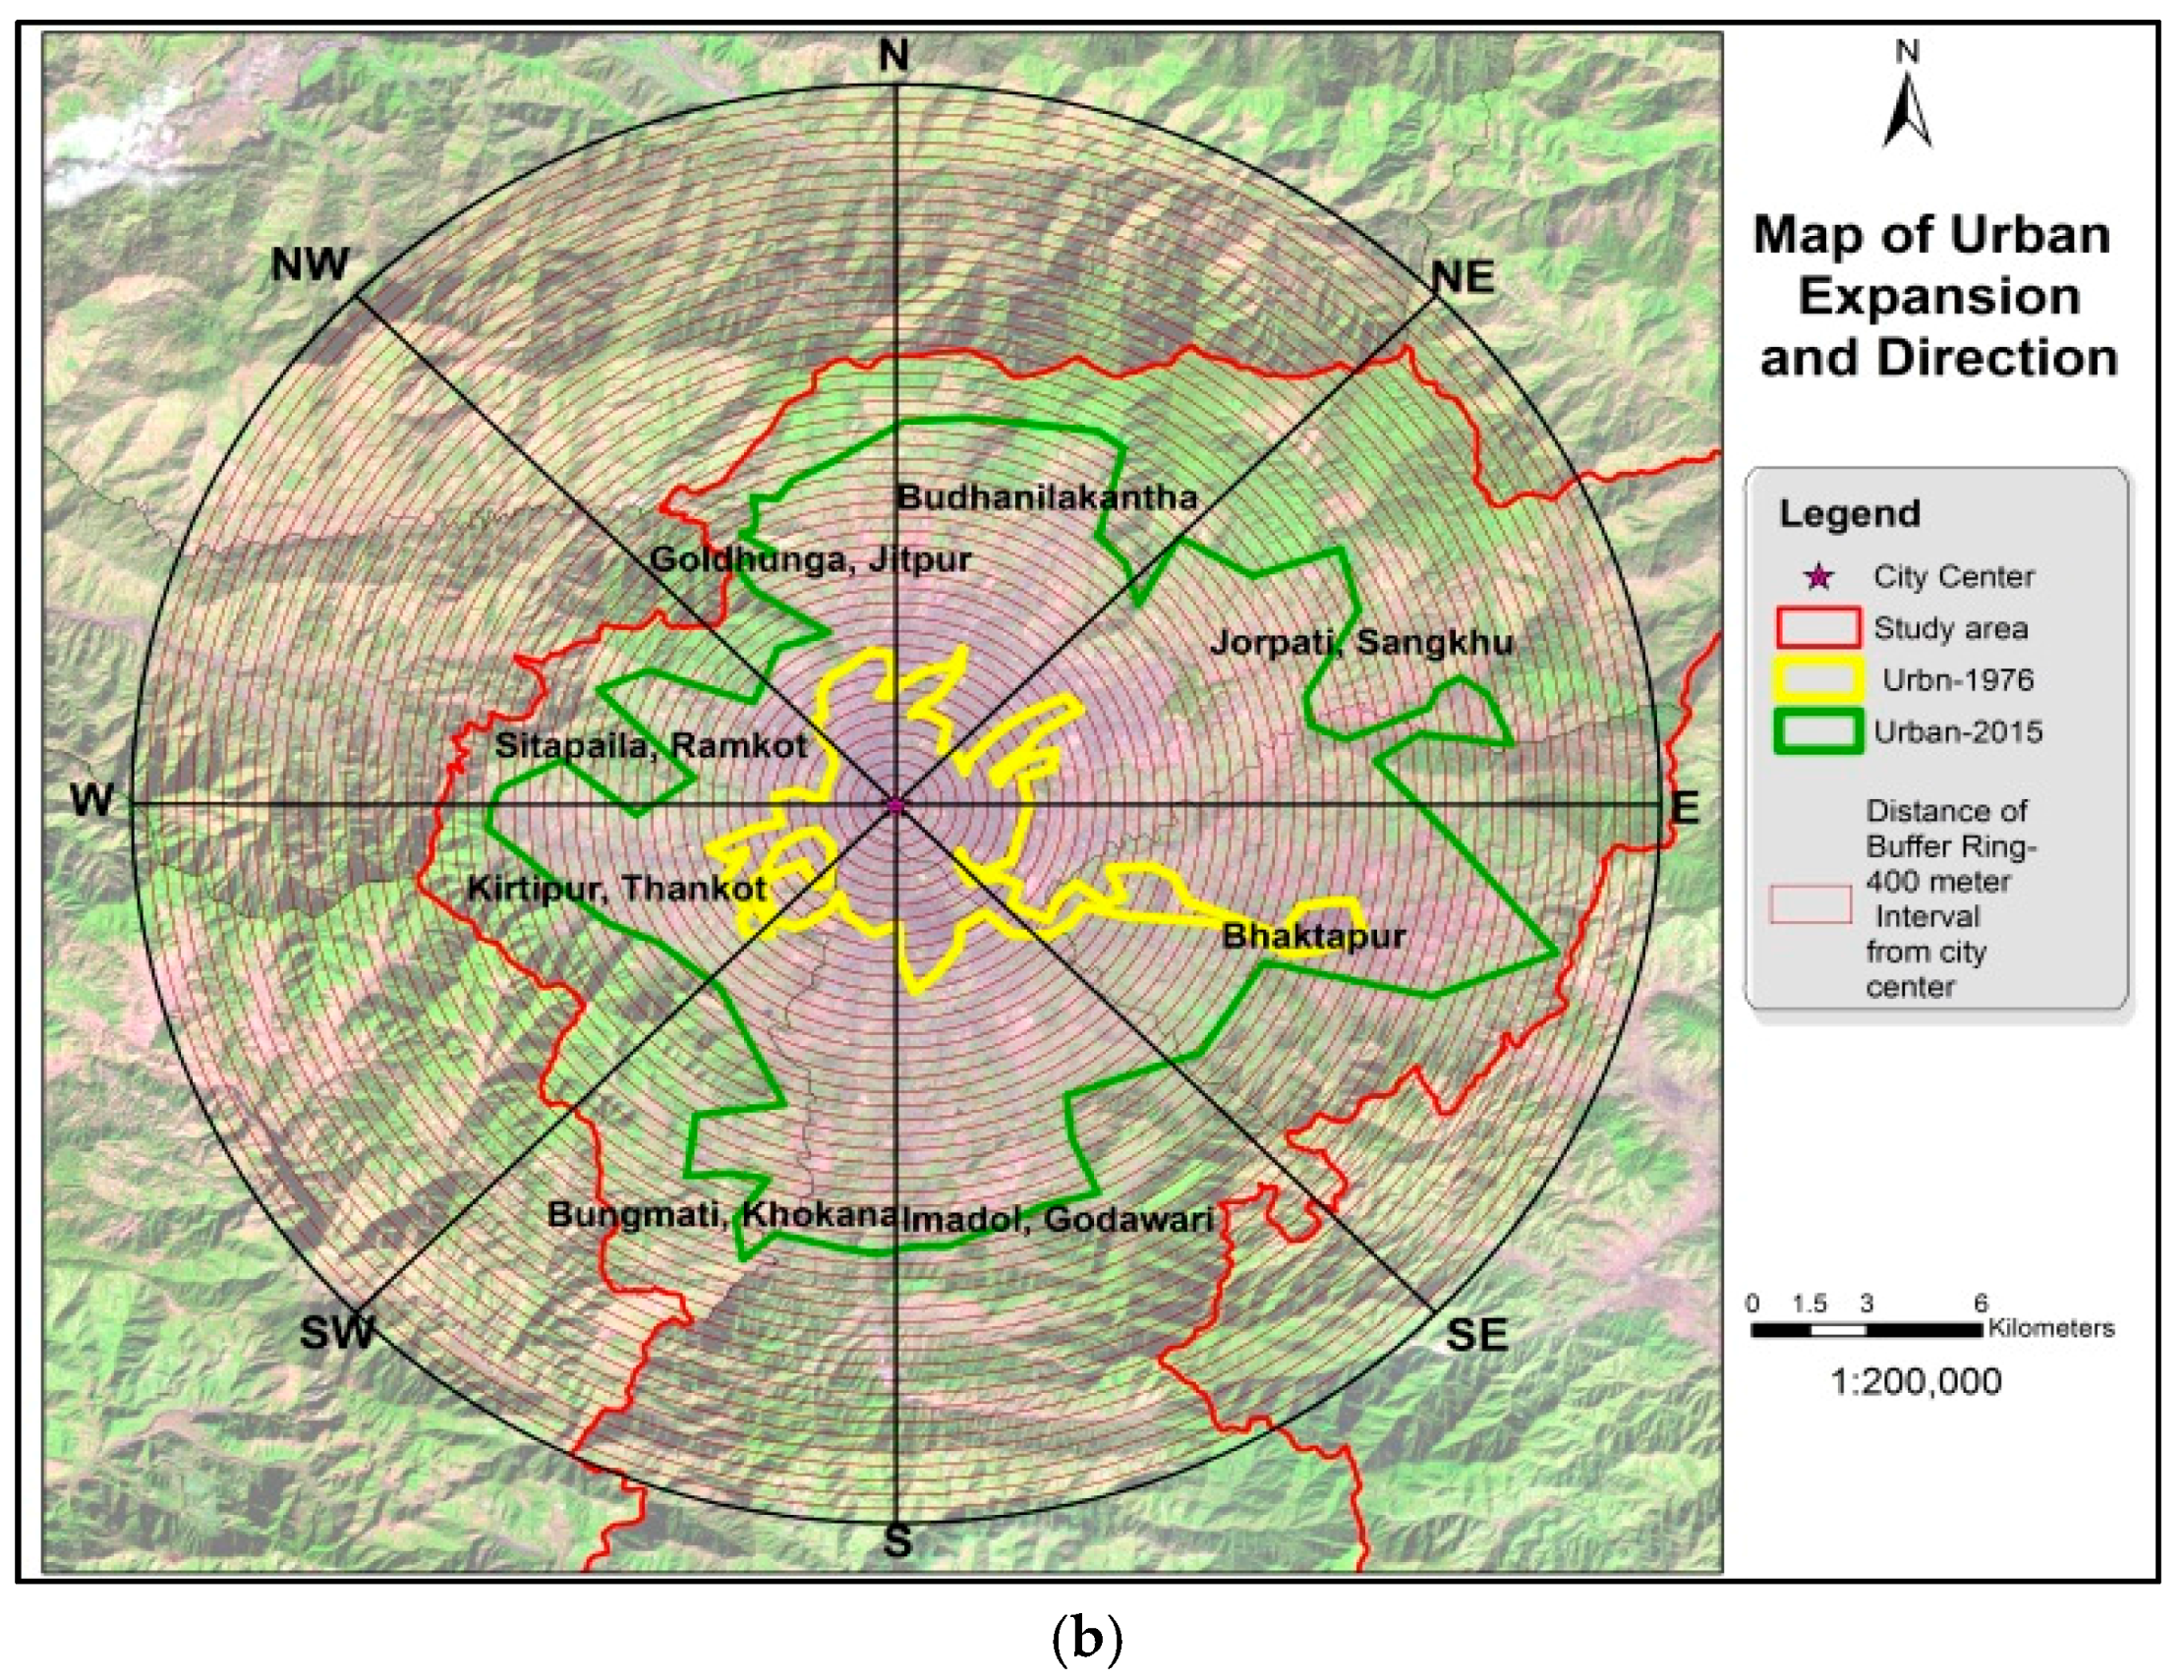
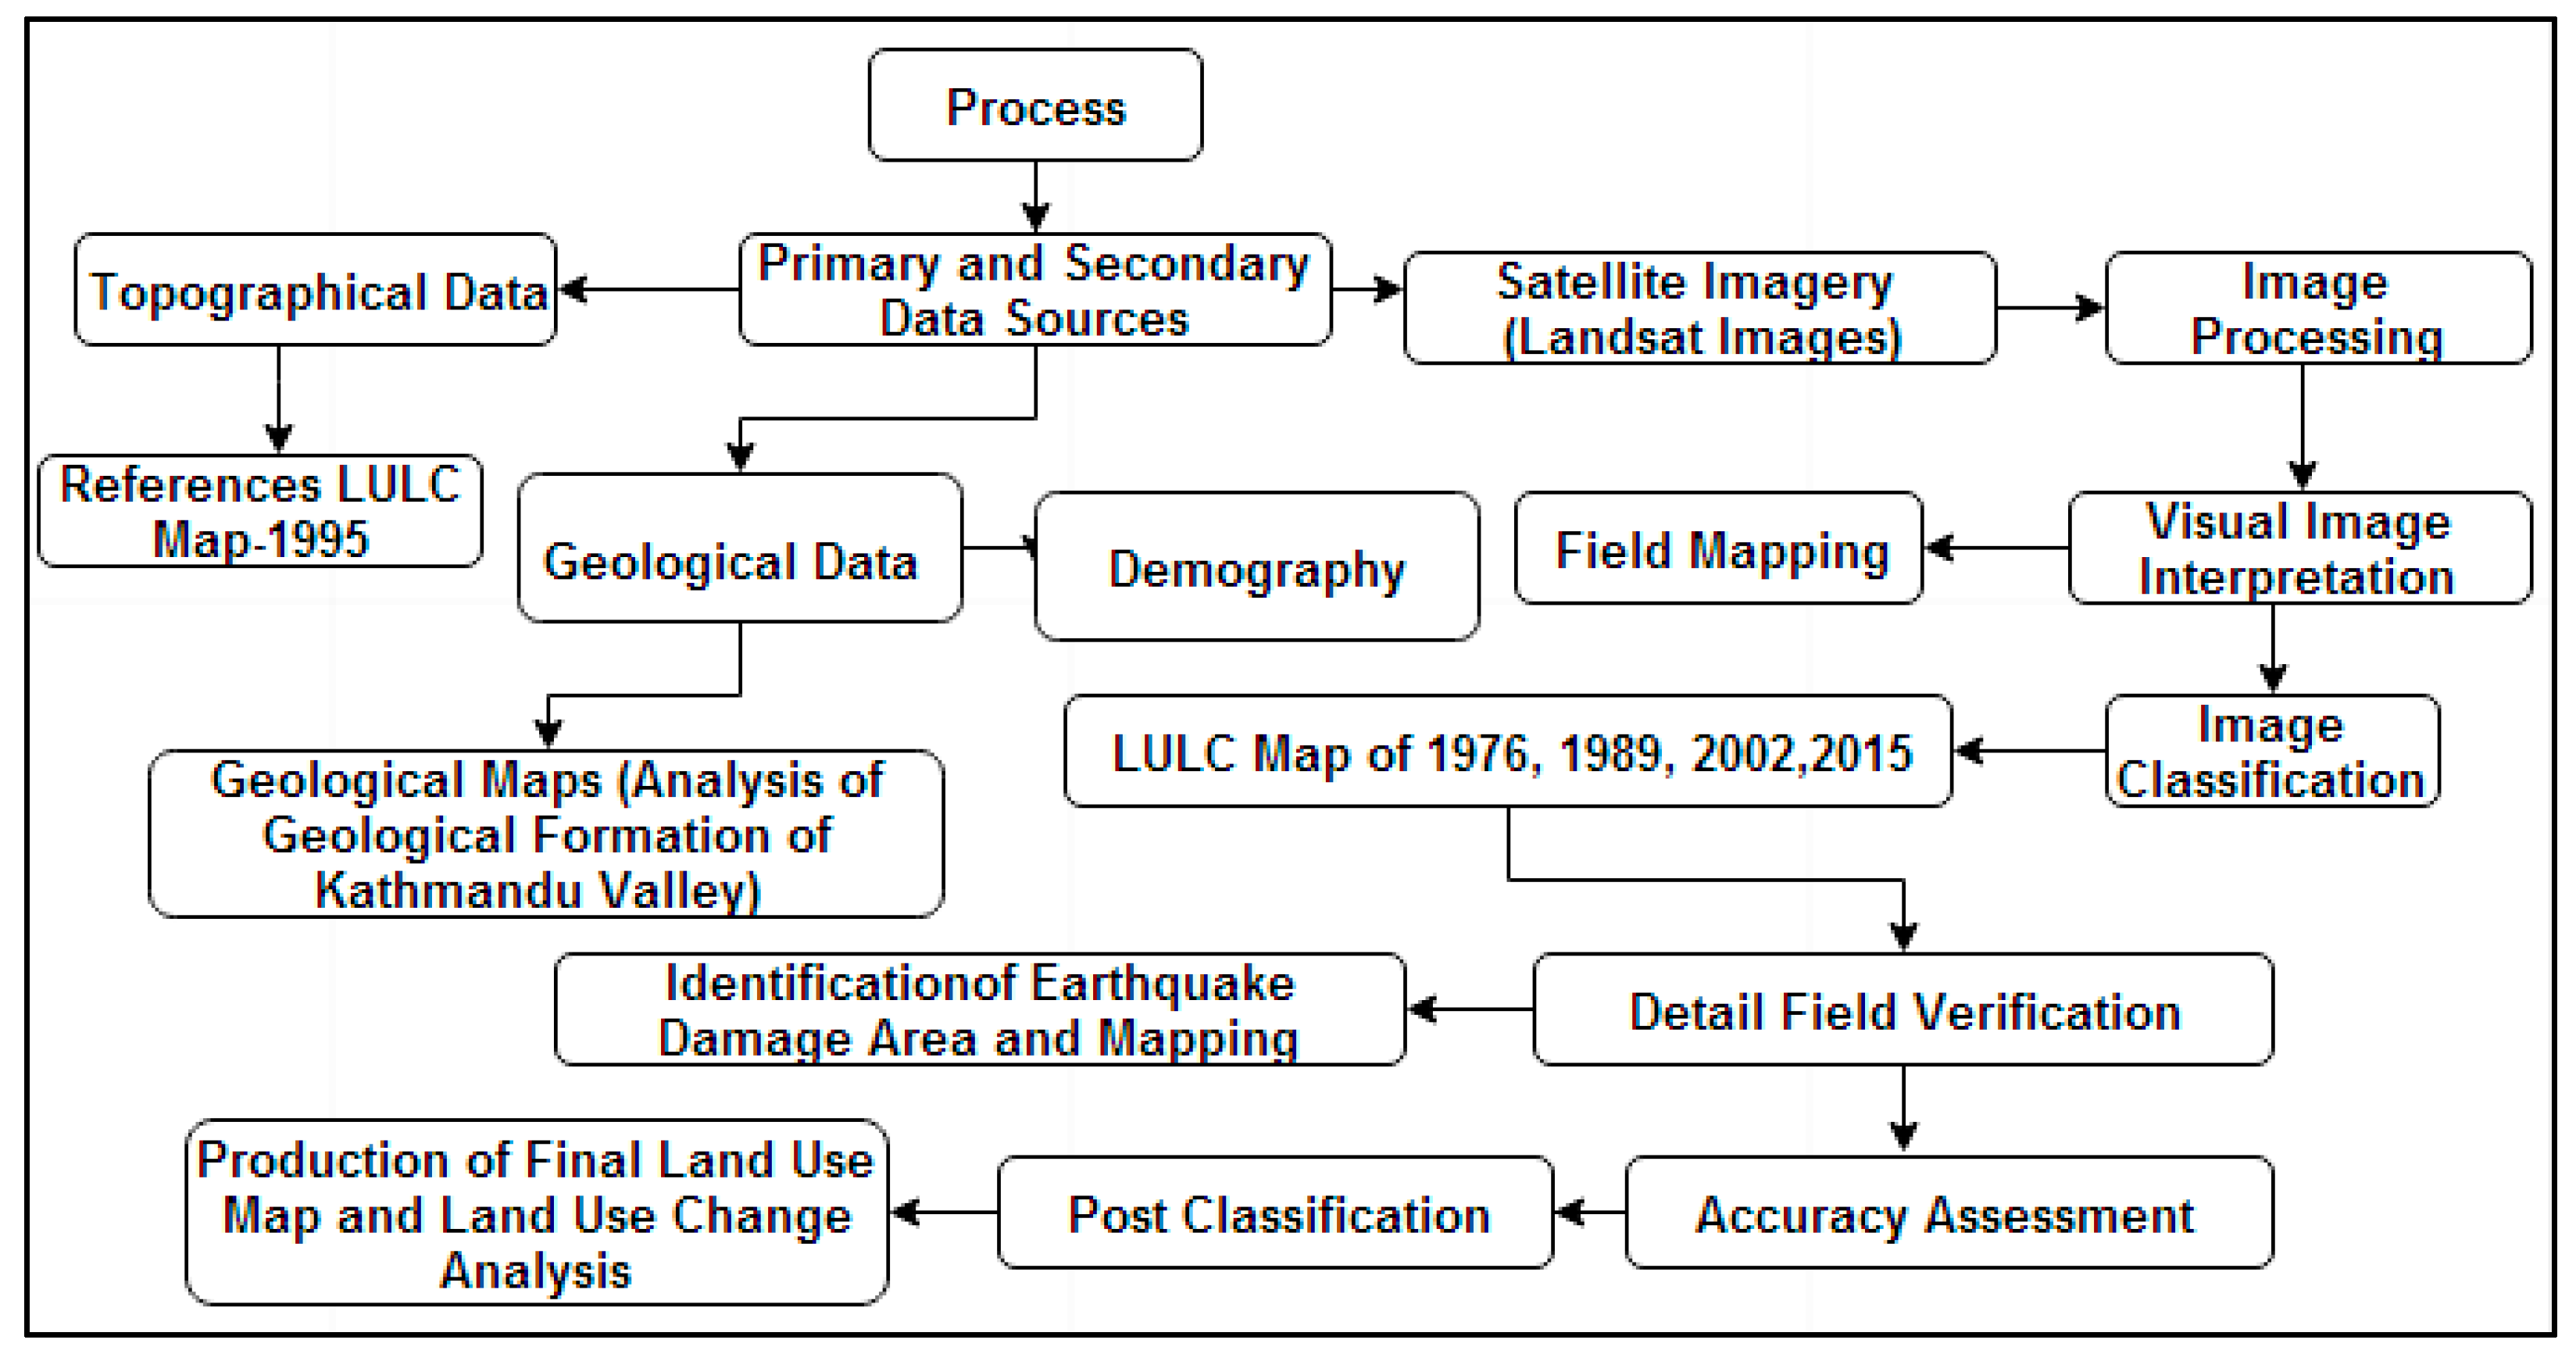
Figure 3.
Methodological approach.

Figure 4.
Urban and rural population of Nepal.

Figure 5.
Population distribution in different parts of the Kathmandu valley. Note: The administrative boundary of Village Development Committees, Municipalities and their nomenclature are being changed due to the reconstruction and reclassification of the local-level administrative units, although this study is based on local development construction before March 2017.
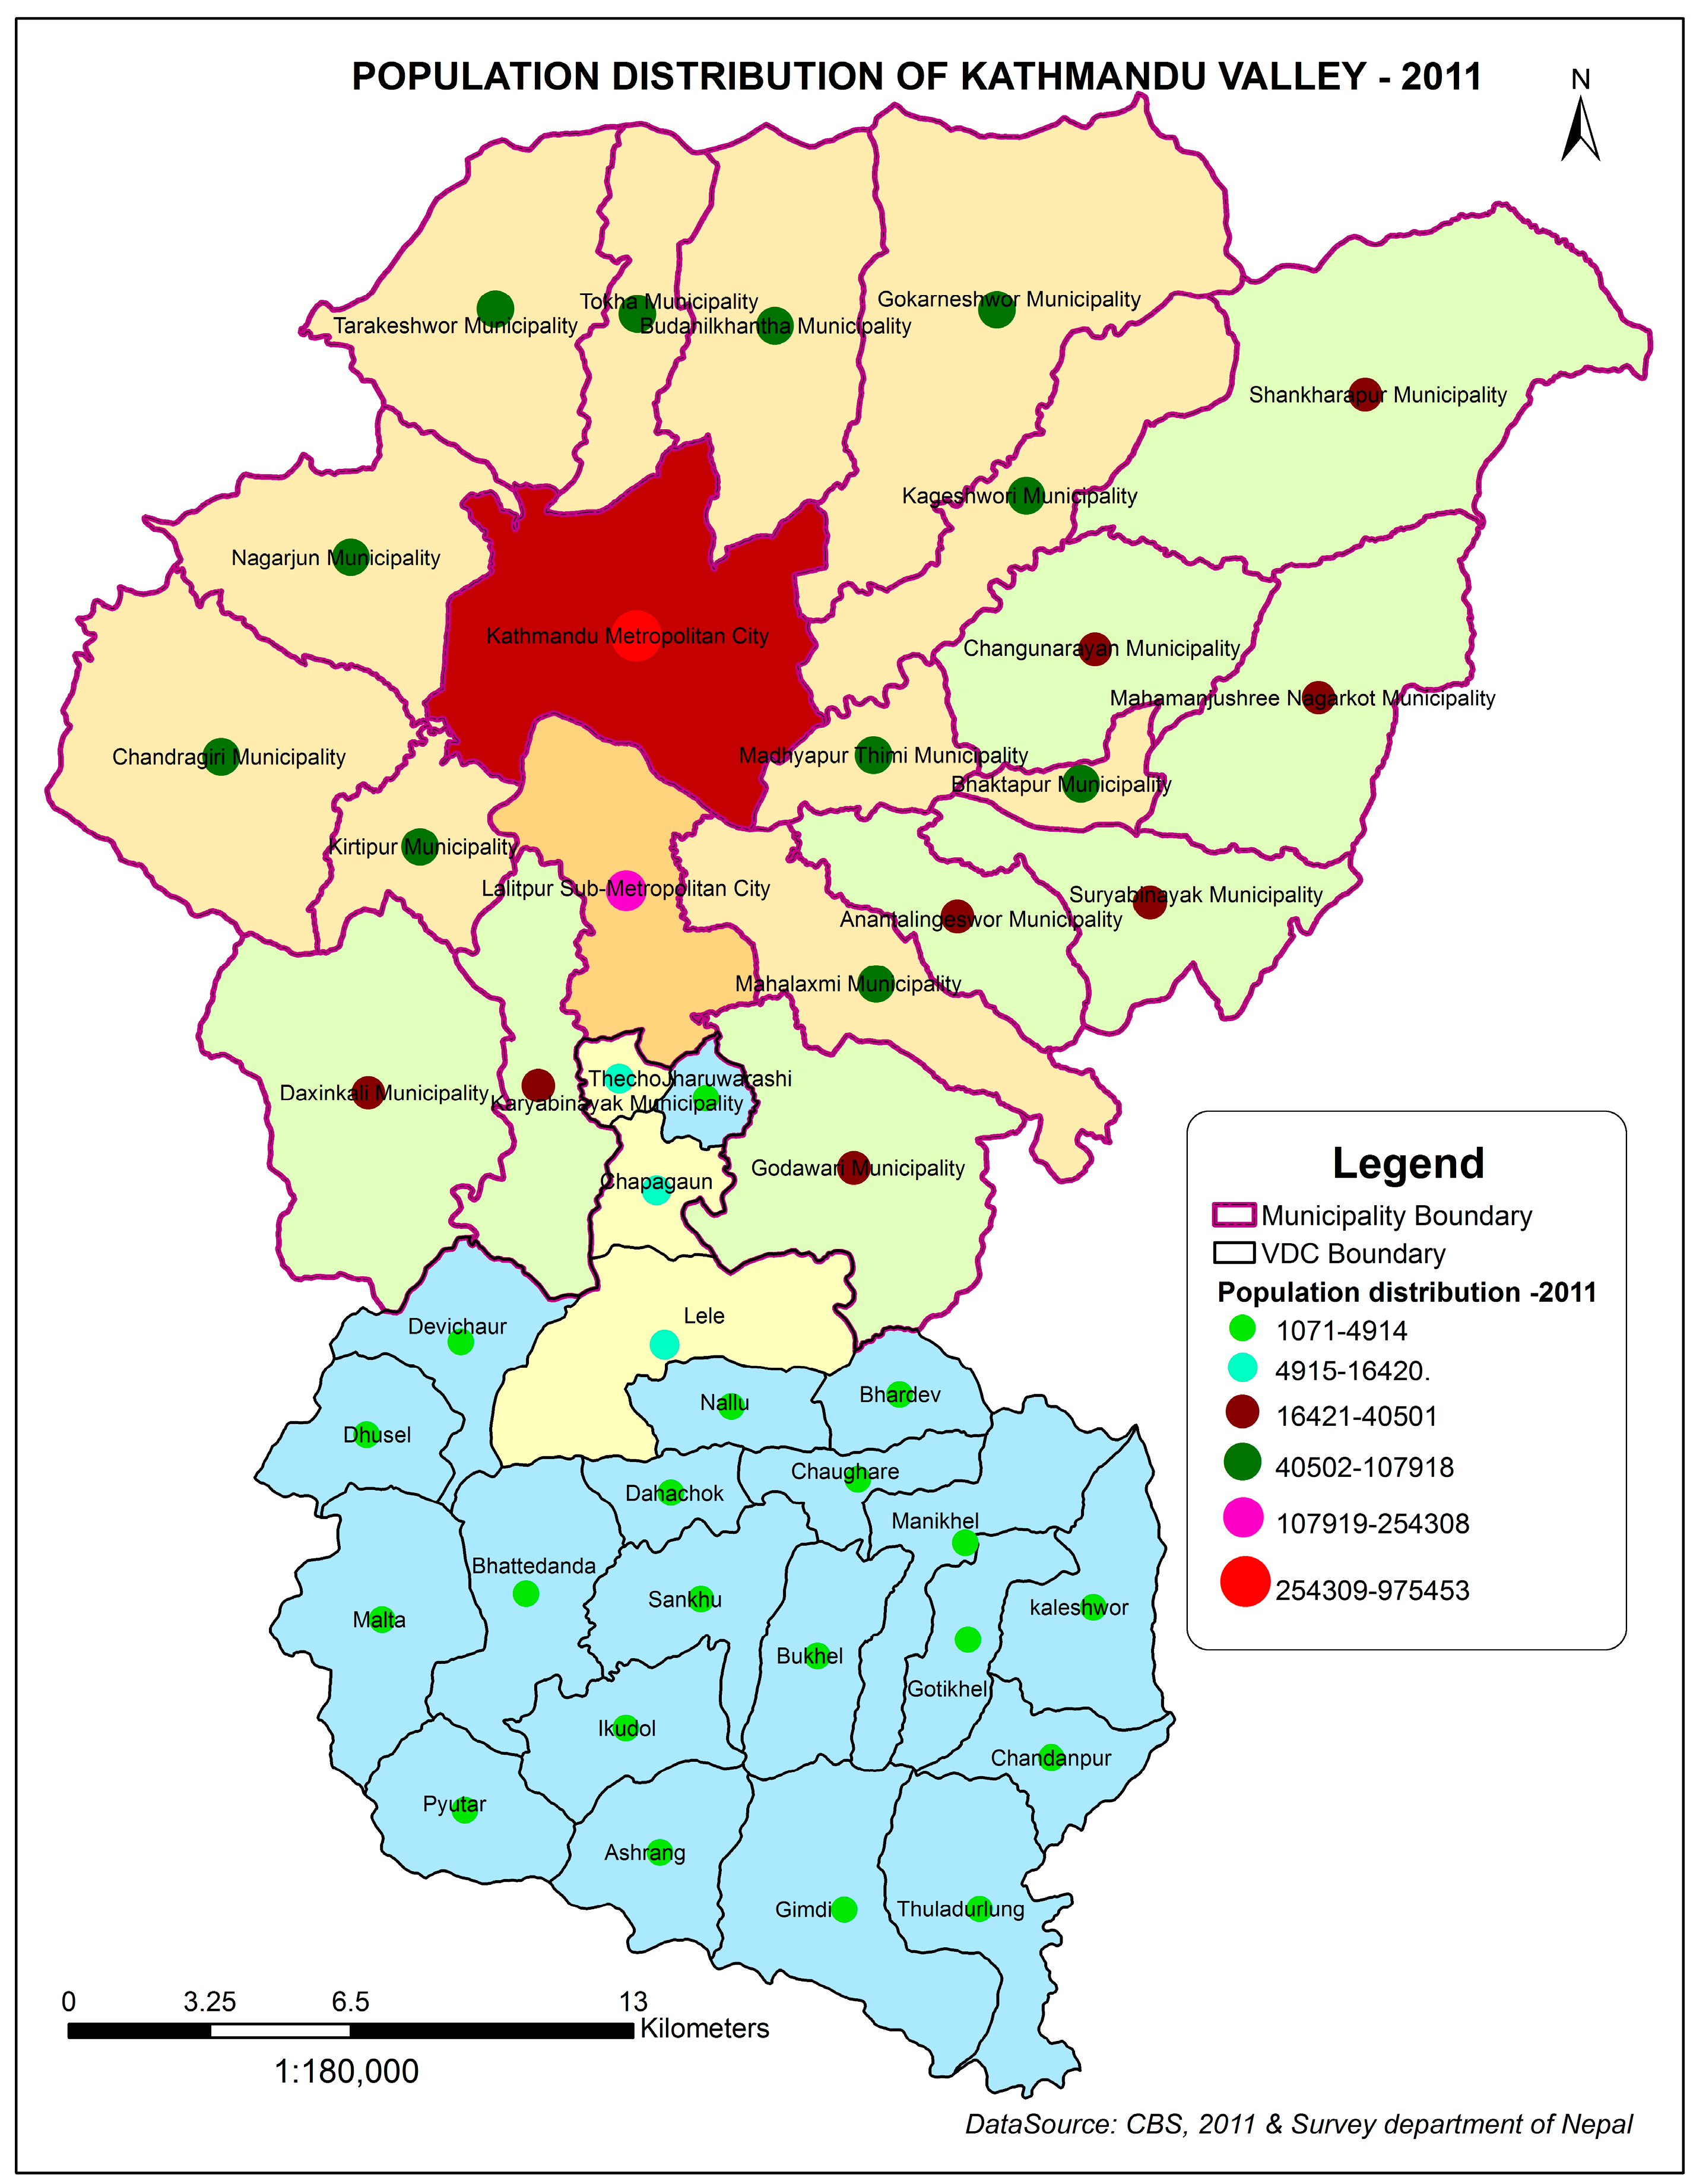
Figure 6.
Trend of land use change in Kathmandu valley.

Figure 7.
LULC map of Kathmandu valley: (a) 1976; (b) 1989; (c) 2002; and (d) 2015.


Figure 8.
(a) Transition map from all land use/land cover classes to urban area 1976–1989; (b) transition map from all land use/land cover classes to urban area 1989–2002; (c) transition map from all land use/land cover classes to urban area 2002–2015; (d) urban land cover dynamics of the valley from 1976–2015.
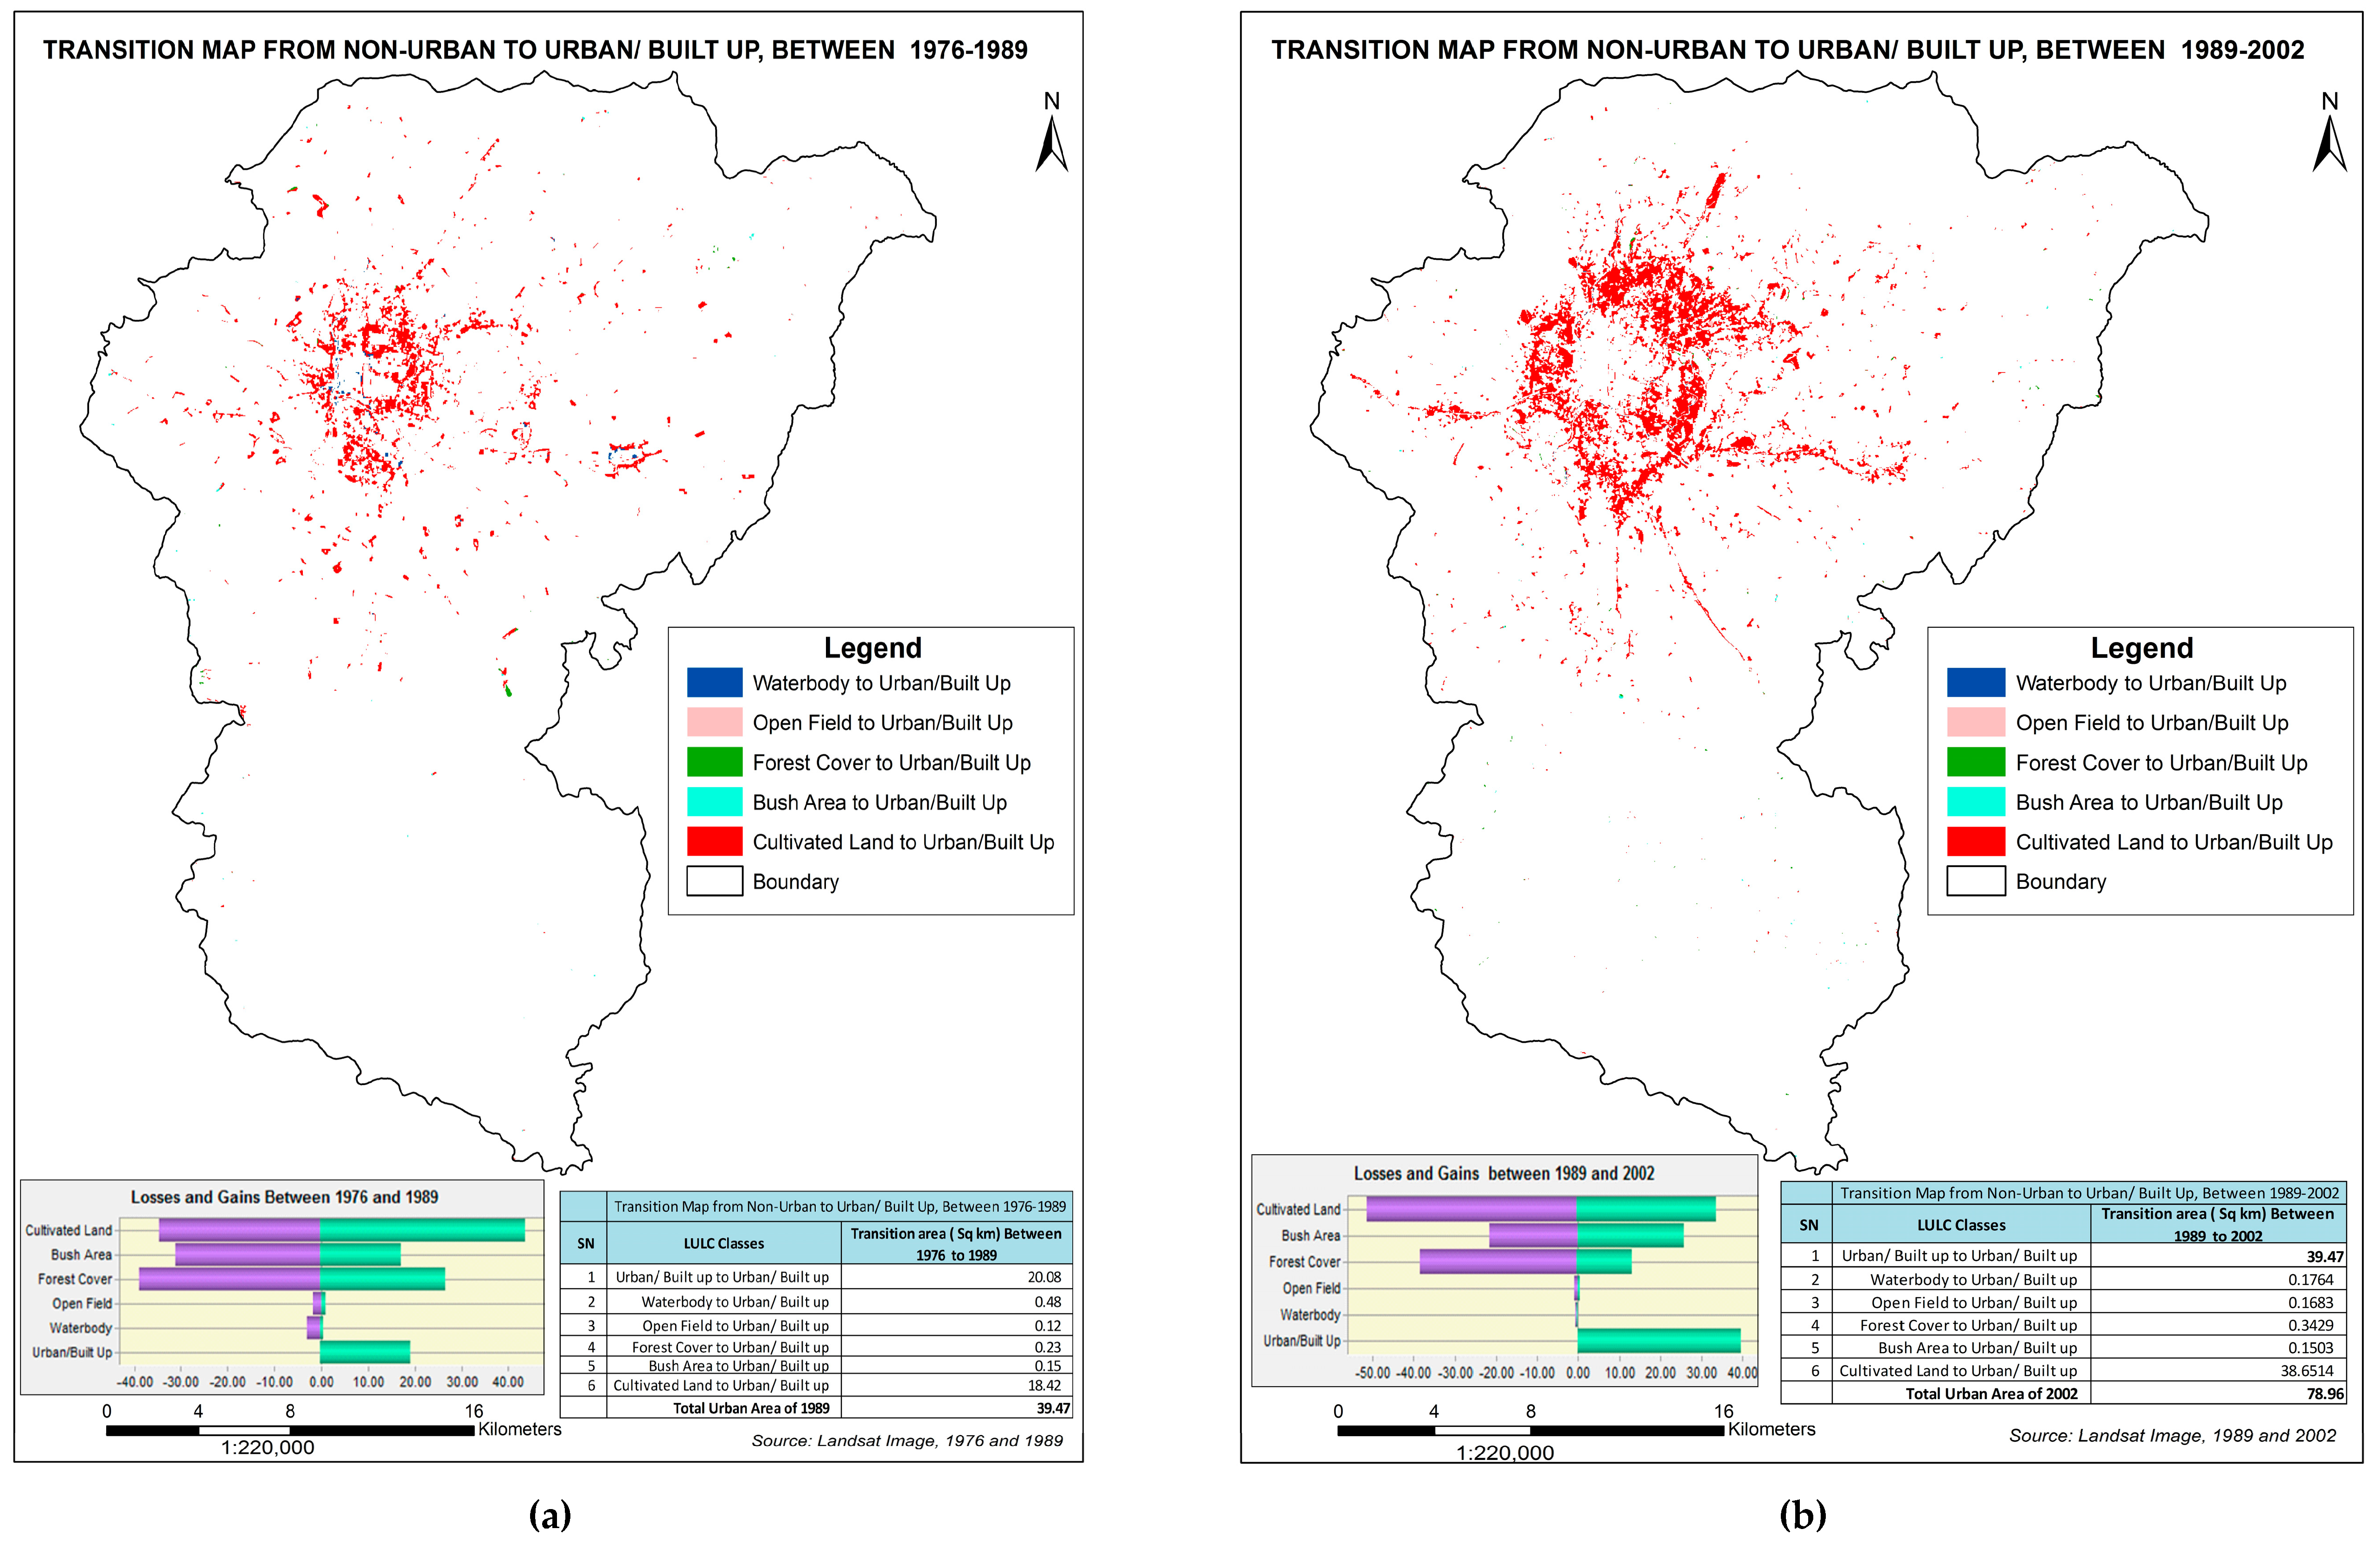

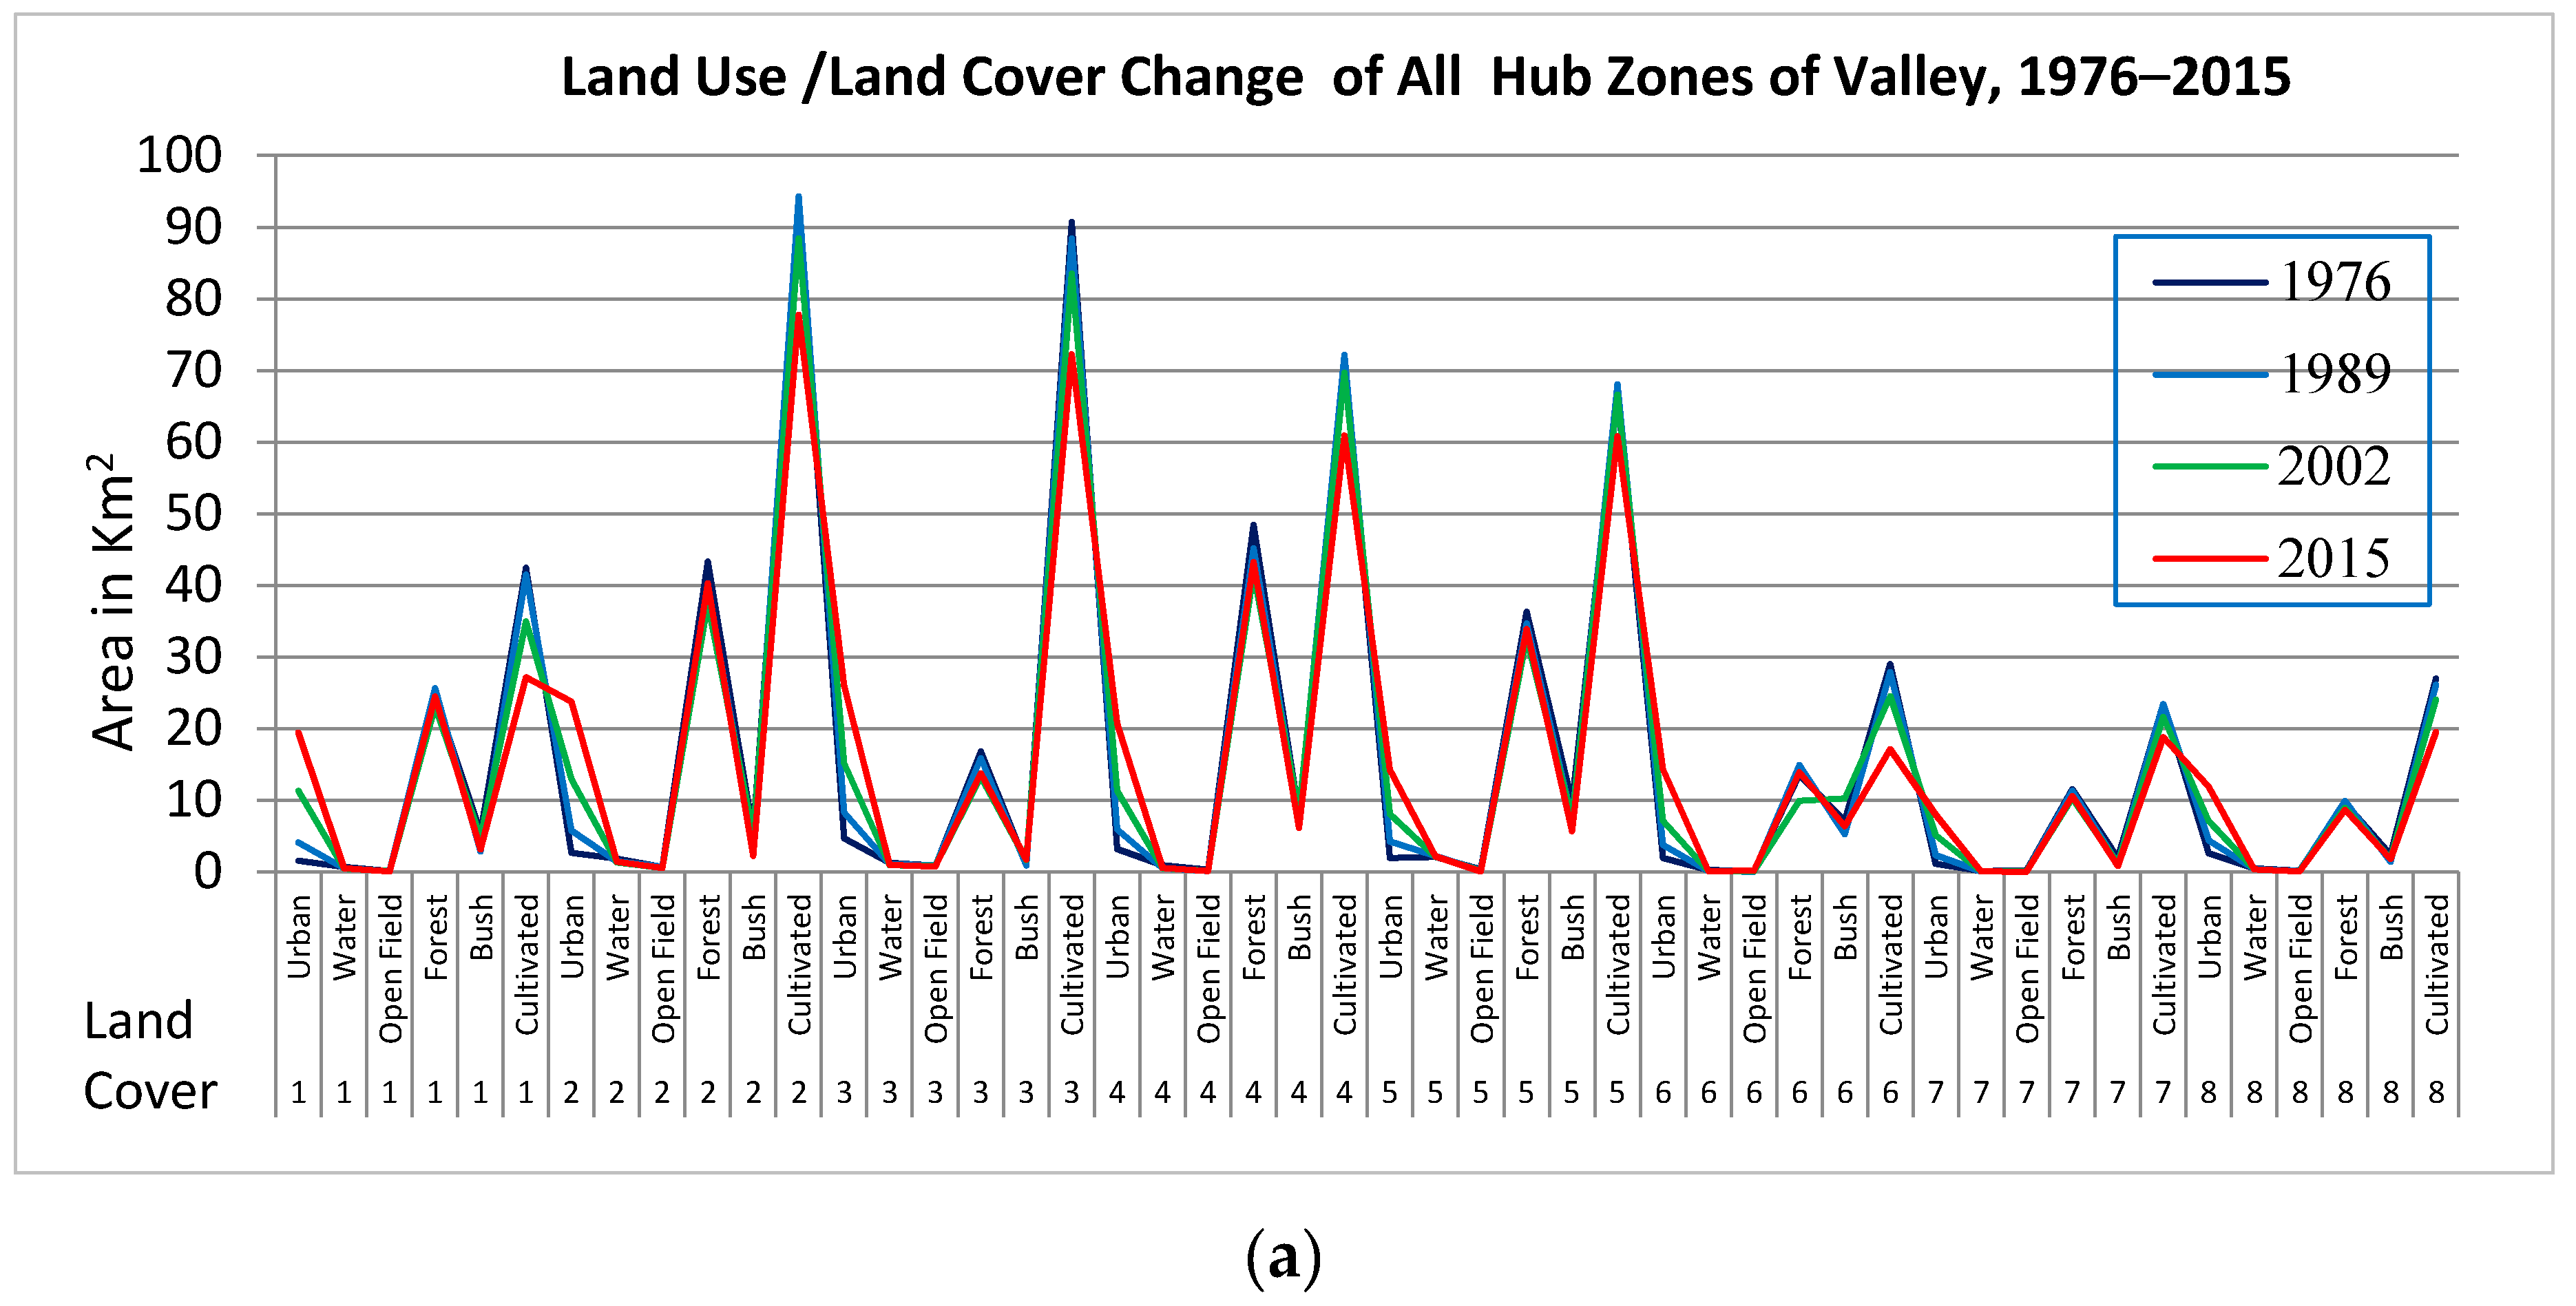
Figure 9.
(a) Land cover change matric in all eight main zones in the valley, 1976–2015 (km2); (b) spider diagram of the urban expansion in eight directions in the valley, 1976–2015 (km2); (c) spatial orientation of urban land expansion in the valley, 1976–2015 (km2).
Figure 9.
(a) Land cover change matric in all eight main zones in the valley, 1976–2015 (km2); (b) spider diagram of the urban expansion in eight directions in the valley, 1976–2015 (km2); (c) spatial orientation of urban land expansion in the valley, 1976–2015 (km2).


Figure 10.
Seismic hazard map of Nepal.

Figure 11.
Google Image of Kathmandu, City (focus on Dharahara and Tudhikhel. (a) Before the earthquake, 1 December 2014; (b) after the earthquake, 26 April 2015; (c) Google Image, after the earthquake, 12 May 2015; (d) dusty sky of Kathmandu a few minutes after the quake, 2015, photo, Bikram Rai; Bhimsen Tower, Dharahara, (e) before and (f) after the earthquake: Google search: 6 June 2016.


Figure 12.
Overlay map of the earthquake damage structure and geological map of Kathmandu valley.

Figure 13.
Overlay map of earthquake damage structure and administrative boundary map of Kathmandu valley (including all three district boundaries).
Figure 13.
Overlay map of earthquake damage structure and administrative boundary map of Kathmandu valley (including all three district boundaries).


Table 1.
Population distribution of Kathmandu valley.
| Districts | 1971 | 1981 | 1991 | 2001 | 2011 |
|---|---|---|---|---|---|
| Kathmandu District | 353,756 | 422,237 | 675,341 | 1,081,845 | 1,744,240 |
| Lalitpur District | 154,998 | 184,341 | 257,086 | 337,785 | 468,132 |
| Bhaktapur District | 110,157 | 159,767 | 172,952 | 225,461 | 304,651 |
| Kathmandu valley * | 620,882 | 768,326 | 1,107,370 | 1,647,092 | 2,519,034 |
Source: Central Bureau of Statistics (CBS 2011), * includes Kathmandu, Lalitpur and Bhaktapur districts.
Table 2.
Urban and rural population.
| Year | Urban Centers | Urban Population (%) | Rural Population (%) | Urban Population of Valley (%) (of the Total Urban Population of the Country) |
|---|---|---|---|---|
| 1952/1954 | 10 | 2.9 | 97.1 | 82.6 |
| 1961 | 16 | 3.6 | 96.4 | 64.9 |
| 1971 | 16 | 4 | 96 | 54 |
| 1981 | 23 | 6.4 | 93.6 | 38 |
| 1991 | 33 | 9.2 | 90.8 | 35.3 |
| 2001 | 58 | 13.9 | 86.1 | 30.9 |
| 2011 | 58 | 17.1 | 82.9 | 31.58 |
| 2014/2015 | 217 | 40.49 | 59.51 | 22.77 |
Source: Central Bureau of Statistics (CBS 2003), International Centre for Integrated Mountain Development (ICIMOD, 2007), (CBS, 2011), and (Ministry of Federal Affairs and Local Development|Nepal (MoFALD,2015). Note: The administrative boundary of the Village Development Committees and Municipality and the nomenclature are being changed due to the reconstruction and reclassification of the local-level administrative units. However, this study is based on local development construction before March 2017.
Table 3.
Land use/land cover statistics, 1976–2015.
| Land Cover | 1976 (Area) | 1989 (Area) | Change between 1976 and 1989 | 2002 (Area) | Change between 1989 and 2002 | 2015 (Area) | Change between 2002 and 2015 | Change between 1976 and 2015 | ||||
|---|---|---|---|---|---|---|---|---|---|---|---|---|
| km2 | % | km2 | % | km2 | % | km2 | % | |||||
| Urban/built up | 20.19 | 2.16 | 39.47 | 4.23 | 19.28 | 78.96 | 8.46 | 39.48 | 139.57 | 14.96 | 60.61 | 119.38 |
| Water body | 9.50 | 1.02 | 7.20 | 0.77 | −2.30 | 6.59 | 0.71 | −0.61 | 7.51 | 0.81 | 0.93 | −1.98 |
| Open field | 3.23 | 0.35 | 2.49 | 0.27 | −0.74 | 1.99 | 0.21 | −0.50 | 1.75 | 0.19 | −0.24 | −1.48 |
| Forest cover | 327.60 | 35.10 | 315.76 | 33.84 | −11.84 | 290.80 | 31.16 | −24.97 | 306.73 | 32.87 | 15.93 | −20.88 |
| Bush area | 78.94 | 8.46 | 65.33 | 7.00 | −13.61 | 69.43 | 7.44 | 4.10 | 47.22 | 5.06 | −22.22 | −31.72 |
| Cultivated land | 493.77 | 52.91 | 502.97 | 53.90 | 9.20 | 485.45 | 52.02 | −17.51 | 430.44 | 46.12 | −55.01 | −63.32 |
| Total | 933.22 | 100 | 933.22 | 100 | 933.22 | 100 | 933.22 | 100 | ||||
Table 4.
Spatiotemporal transition of LULC, 1976–1989.
| Year | 1989 | km2 | ||||||
| 1976 | LULC Classes | Urban | Water | Open field | Forest | Bush | Cultivated | Total |
| Urban | 20.08 | 0 | 0.00 | 0.01 | 0.01 | 0.09 | 20.19 | |
| Water | 0.48 | 6.44 | 0.00 | 0.42 | 0.05 | 2.11 | 9.50 | |
| Open field | 0.12 | 0.00 | 1.59 | 0.03 | 0.10 | 1.39 | 3.23 | |
| Forest | 0.23 | 0.02 | 0.06 | 288.81 | 12.79 | 25.68 | 327.60 | |
| Bush | 0.15 | 0.00 | 0.14 | 16.19 | 47.92 | 14.53 | 78.94 | |
| Cultivated | 18.42 | 0.73 | 0.70 | 10.31 | 4.46 | 459.15 | 493.77 | |
| Total | 39.47 | 7.20 | 2.49 | 315.76 | 65.33 | 502.97 | 933.22 | |
Table 5.
Spatiotemporal transition of LULC, 1989–2002.
| Year | 2002 | km2 | ||||||
| 1989 | LULC Classes | Urban | Water | Open field | Forest | Bush | Cultivated | Total |
| Urban | 39.47 | 0.00 | 0.00 | 0.01 | 0.00 | 0.00 | 39.47 | |
| Water | 0.18 | 6.54 | 0.03 | 0.02 | 0.00 | 0.43 | 7.20 | |
| Open field | 0.17 | 0.00 | 1.59 | 0.02 | 0.05 | 0.66 | 2.49 | |
| Forest | 0.34 | 0.01 | 0.01 | 277.27 | 20.52 | 17.62 | 315.76 | |
| Bush | 0.15 | 0.00 | 0.00 | 6.35 | 43.72 | 15.10 | 65.33 | |
| Cultivated | 38.65 | 0.03 | 0.37 | 7.14 | 5.14 | 451.64 | 502.97 | |
| Total | 78.96 | 6.59 | 1.99 | 290.80 | 69.43 | 485.45 | 933.22 | |
Table 6.
Spatiotemporal transition of LULC, 2002–2015.
| Year | 2015 | km2 | ||||||
| 2002 | LULC Classes | Urban | Water | Open field | Forest | Bush | Cultivated | Urban |
| Urban | 78.86 | 0.01 | 0.00 | 0.04 | 0.00 | 0.05 | 78.96 | |
| Water | 0.00 | 6.56 | 0.00 | 0.03 | 0.00 | 0.00 | 6.59 | |
| Open field | 0.41 | 0.02 | 1.38 | 0.01 | 0.00 | 0.18 | 1.99 | |
| Forest | 0.52 | 0.13 | 0.05 | 271.64 | 4.74 | 13.72 | 290.80 | |
| Bush | 0.04 | 0.01 | 0.00 | 19.14 | 38.27 | 11.96 | 69.43 | |
| Cultivated | 59.74 | 0.79 | 0.32 | 15.86 | 4.20 | 404.54 | 485.45 | |
| Total | 139.57 | 7.51 | 1.75 | 306.73 | 47.22 | 430.44 | 933.22 | |
Table 7.
Quantity of urban land expansion along 8 directions in the valley, 1976–2015 (km2).
| Direction | 1976 | 1989 | 2002 | 2015 |
|---|---|---|---|---|
| N to NE | 1.57 | 4.12 | 11.29 | 19.45 |
| NE to E | 2.63 | 5.76 | 12.96 | 23.75 |
| E to SE | 4.66 | 8.27 | 15.16 | 25.96 |
| SE to South | 3.16 | 5.93 | 11.28 | 20.69 |
| S to SW | 1.94 | 4.26 | 8.1 | 14.24 |
| SW to W | 1.93 | 3.78 | 7.11 | 14.35 |
| W to NW | 1.11 | 2.33 | 5.1 | 7.98 |
| NW to N | 2.58 | 4.36 | 7.07 | 11.9 |
© 2017 by the authors. Licensee MDPI, Basel, Switzerland. This article is an open access article distributed under the terms and conditions of the Creative Commons Attribution (CC BY) license (http://creativecommons.org/licenses/by/4.0/).
Share and Cite
MDPI and ACS Style
Rimal, B.; Zhang, L.; Fu, D.; Kunwar, R.; Zhai, Y. Monitoring Urban Growth and the Nepal Earthquake 2015 for Sustainability of Kathmandu Valley, Nepal. Land 2017, 6, 42. https://doi.org/10.3390/land6020042
AMA Style
Rimal B, Zhang L, Fu D, Kunwar R, Zhai Y. Monitoring Urban Growth and the Nepal Earthquake 2015 for Sustainability of Kathmandu Valley, Nepal. Land. 2017; 6(2):42. https://doi.org/10.3390/land6020042
Chicago/Turabian StyleRimal, Bhagawat, Lifu Zhang, Dongjie Fu, Ripu Kunwar, and Yongguang Zhai. 2017. "Monitoring Urban Growth and the Nepal Earthquake 2015 for Sustainability of Kathmandu Valley, Nepal" Land 6, no. 2: 42. https://doi.org/10.3390/land6020042
Note that from the first issue of 2016, this journal uses article numbers instead of page numbers. See further details here.