1. Introduction
Disasters are split into two groups; natural hazards and human-induced disasters [
1]. Natural hazards and human-induced disasters are frequent occurrences and include floods, cyclones, droughts, tidal surges, tornadoes, earthquakes, river erosion, fire, infrastructure collapse, high arsenic contents of ground water, water-logging, water and soil salinity, epidemics and various forms of pollution [
2]. Over recent decades, the frequency of natural hazards has grown worldwide, with the number of disasters quadrupling in the last 30 years, resulting in escalating human cost and economic losses [
3,
4]. Developing countries bear the highest burden in terms of the number of human lives lost and the proportion of gross domestic product lost as a result of disasters [
4]. The largely unplanned expansion of cities to accommodate rapid population growth, combined with inappropriate land use planning and the failure of urban authorities to regulate building standards contribute to the vulnerability of urban populations [
5].
Urbanization is a complex spatial process that converts land from rural uses to urban uses and results in impacts on the structure, function and dynamics of ecosystems, as well as the livelihoods of humans [
6]. The rapid conversion of agricultural land has become a serious issue for sustainable urban development in developing countries [
7]. Urbanization often increases the socioeconomic activities and revolutionizes the land use practice according to time [
8,
9]. Land use/land cover change is directly proportional to increases in natural and socio-economic activities. The land use/land cover pattern of a region is the outcome of natural and socio-economic factors and their utilization by man in time and space [
9]. Land use is the human use of land involving the management and modification of the natural environment or wilderness into a built environment, such as fields, pastures and settlements [
10]. It is a continuous and inevitable process due to economic development, exploitation of natural resources and rapid population growth. Multiple hazard risk assessment refers to the process of identifying the occurrence, probability and estimation of the potential damage of various types of disasters within a specified spatio-temporal framework.
Nepal is ranked as the 20th most disaster-prone country in the world and ranked 11th for earthquake vulnerability, fourth for climate change vulnerability and 30th for flood vulnerability [
11]. The recent devastating earthquake at 11.56 a.m. on 25 April 2015, with a magnitude of 7.8 on the Richter scale, was followed by subsequent aftershocks of 7.3 on 12 May 2015. The epicenter was the Barpak Village Development Committees (VDCs) of the Gorkha district and Sunkhani VDC of the Dolakha district and was the most powerful earthquake in Nepal for 80 years. The earthquake caused more destruction to the east of the epicenter in Barpak VDC, Gorkha. Pokhara, being located to its west, witnessed less loss and damage from the earthquake. Arwa, Mijure and Purunchaur were the more affected VDCs of Kaski district. The earthquake created an unprecedented situation, affecting the country’s most populous areas and the economic and administrative centers, along with numerous villages in the districts.
The Pokhara valley is an intermountain fluvial basin occupying the midsection of the Seti River in the Lesser Himalayas of Nepal. It is filled by a large volume of layered clastic deposits of gravel, silt and clay of Quaternary age, deposited from the Annapurna mountain range probably by a series of catastrophic debris flows [
12,
13].
The Seti watershed, and the Pokhara sub-metropolitan city section, in particular, has been exposed to frequent multiple hazard risks in the last few decades, ranging from avalanches and glacial lake outburst floods (GLOF) in the Himalayas to landslides and edge-falls, floods, sinkholes, land subsidence, fire and earthquakes. The watershed is characterized by deposits from past catastrophic floods. The fragile geology, dense settlement with weak structures in the municipal areas, unstable steep slopes and deep gorges and heavy rainfall are responsible for the debris flows. These are drivers of such hazards that may result in the remarkable loss of lives and property, threatening development activities, the environment and human civilization as a whole. Additionally, excessive and unbalanced land use and land cover change have contributed to increased susceptibility to the environmental risks of earthquakes, landslides, floods, fire and other environmental and industrial hazards, which are likely to become more inevitable, intense and frequent in the near future.
This study is based on 21 VDCs and two municipalities of Seti watershed within Pokhara valley of Kaski district. This paper aims to qualitatively characterize the historical patterns of land use and land cover, to examine the relationship between urbanization; land use and land cover dynamics and hazard analysis between the time period of 1990–2013 using GIS and remote sensing techniques.
2. Methodology
2.1. Study Area
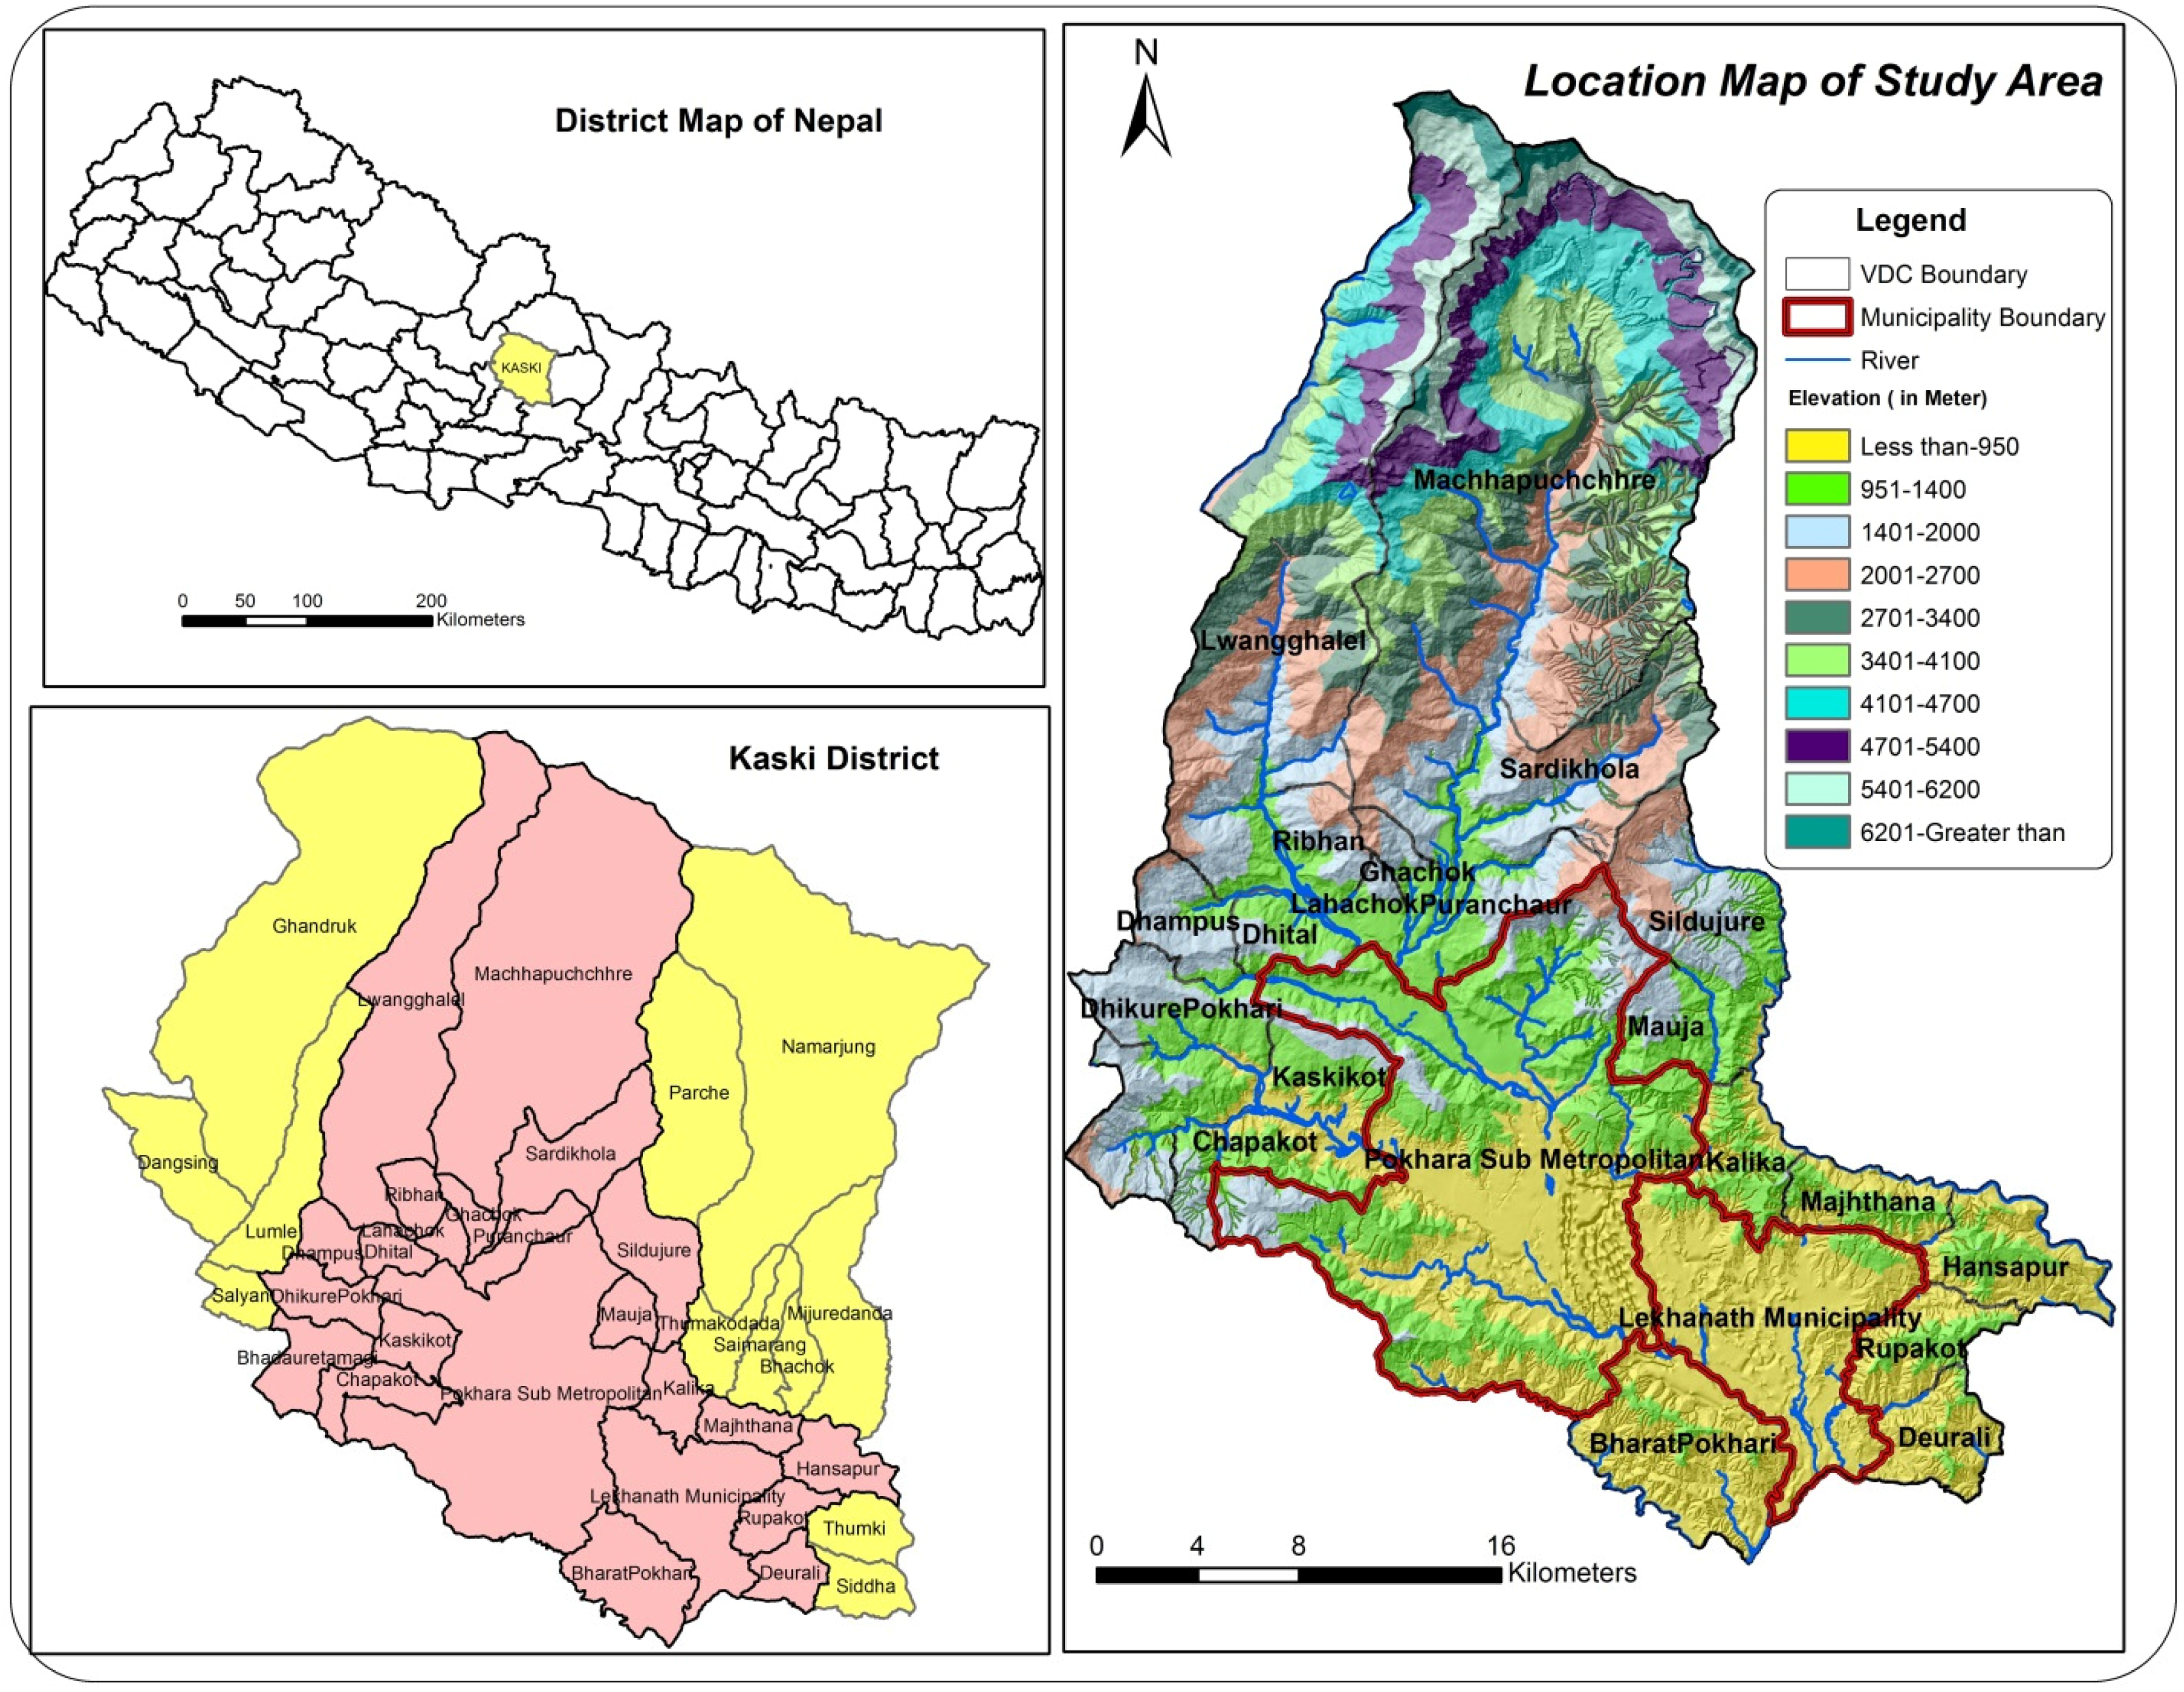
This study area comprises the entire 976.37 km
2 Seti watershed region within the Kaski district. The Pokhara Valley lies in the Mahabharat Range, Midlands and the Great Himalayan Range of Nepal between longitudes 83°48'E and 84°13'11"E and latitudes 28°4'39"N and 28°36'18"N. The total area covered by the administrative division is 1152.19 km
2. High mountains are in the northern part, whereas the middle range mountains occupy the southern portion of the Seti watershed. The maximum altitude is 8091 from mean sea level, mount Annapurna, the tenth highest mountain in the world (
Figure 1). The streams of the Seti watershed exhibit dendritic, parallel and sub-parallel drainage with three to five orders of tributaries. Most of the streams and gullies are very active, reflecting the tectonic activity of the rising Himalayas. The rainy season is June to September. The mean annual rainfall at Lumle station is 5700 mm and at Pokhara station is 3967 mm [
14]. The intense rainfall causes severe landslides and floods in the region. The high topographic variation from south to north in the watershed basin and from valley bottom to hill and mountain tops in the sub-basins creates a unique mixture of climatic conditions within the Seti watershed; the climatic conditions of the central part of the basin range between sub-tropical to cool temperate, whereas climatic variations in the northern part range from temperate to alpine.
The rocks of the Seti watershed are predominately metamorphic with some sedimentary and igneous. A regional-scale anticlinorium passes through Pokhara and extends from northwest to southwest. The rocks of the area are dominated by northeast to southwest trending mineral and stretching lineation and northwest to southeast trending minor fold axes [
15].
The study area has been divided into three regions that represent urban areas defined by urban administrative boundaries, the peri-urban area outside of the urban area and rural areas elsewhere in the watershed.
Pokhara city is the headquarters of the western development region, with many governmental offices situated in the area. It is the focal point for the different districts of the Gandaki zone for education, health, business, electricity, transportation, communication and tourism. The city is well-situated with colleges, universities and schools, as well as hospitals.
Figure 1.
Location map of the study area.
Figure 1.
Location map of the study area.
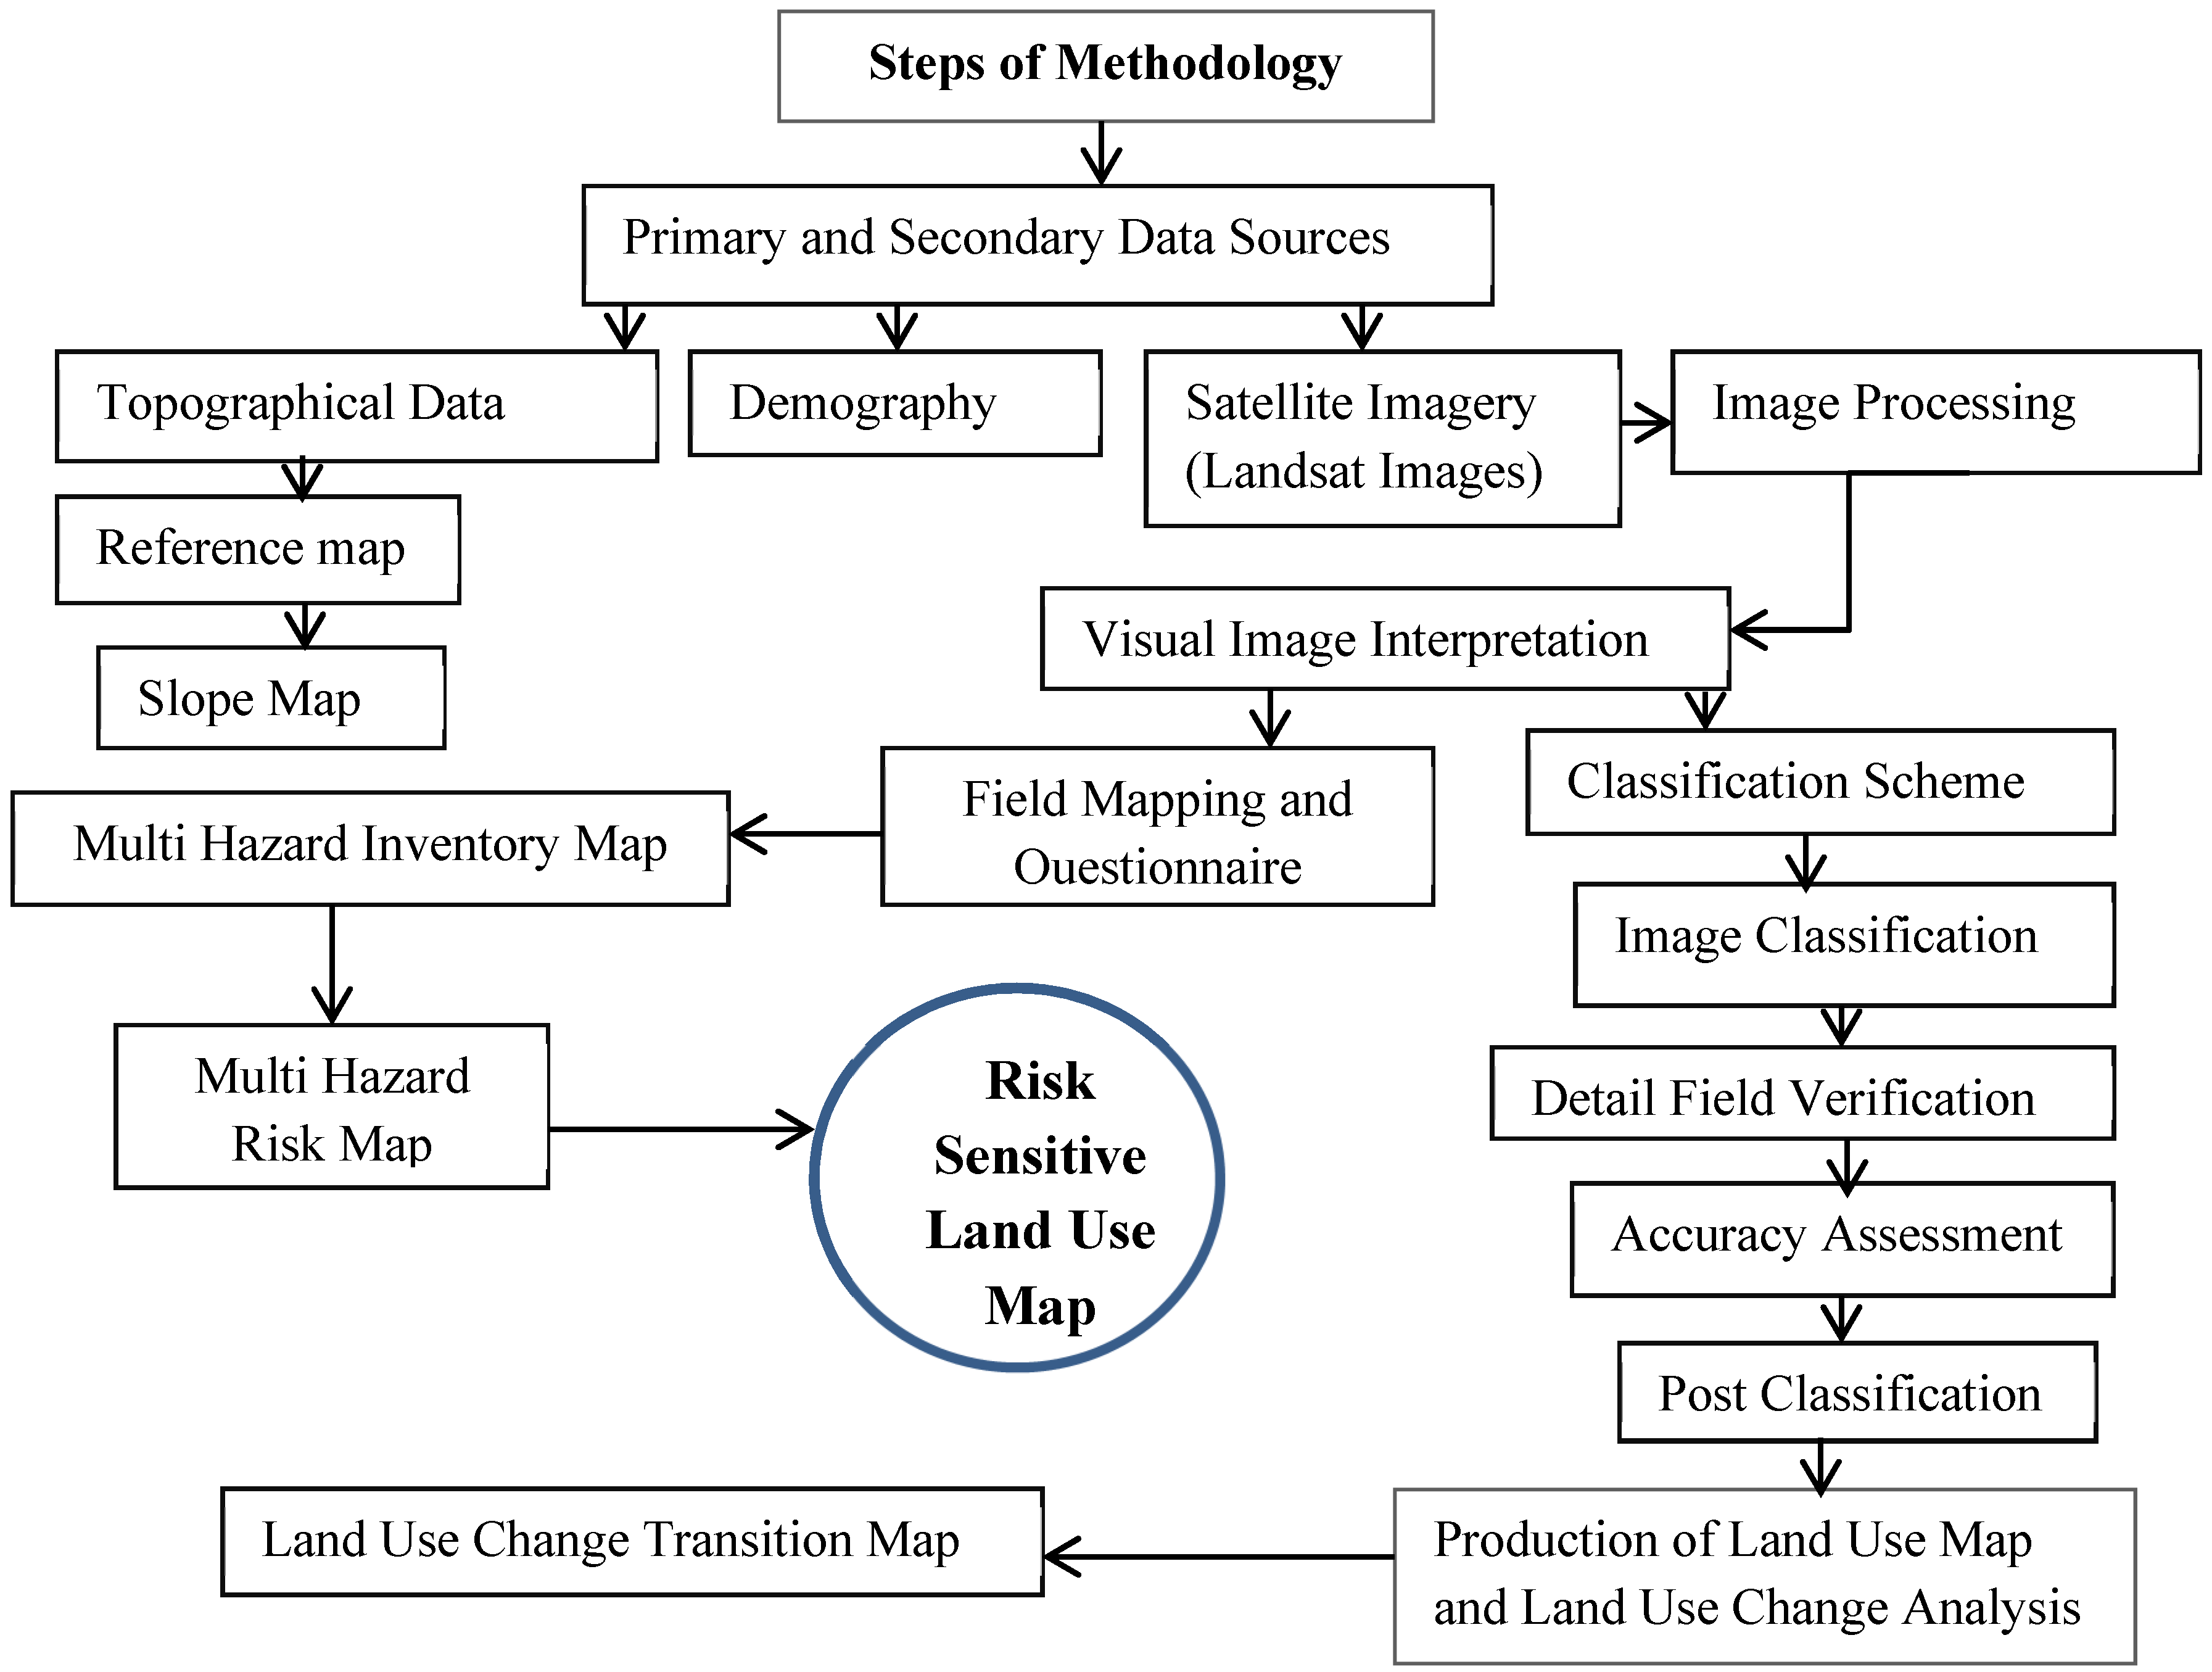
2.2. Methods
The study is based on both primary and secondary information (
Figure 2). Secondary data were collected from the Central Bureau of Statistics (CBS), land policy documents, topographic maps, land use plans, flood risk maps, images and other relevant maps available in published and unpublished research papers, articles, books, government documents and official records obtainable in the district office, sub-metropolitan office and municipality, as well as VDC profiles and other resources. A topographical map published by Survey Department, Government of Nepal, 1998, for Pokhara with a scale of 1:25,000 was used for the reference map for the analysis of images. The map was based on an aerial photograph at a scale of 1:50,000 taken in 1996.
Figure 2.
Flow chart showing the methodological approach.
Figure 2.
Flow chart showing the methodological approach.
Intensive fieldwork was performed to acquire ground-truth first-hand information and to verify secondary data. No field visits were conducted in grassland, snow-covered areas and glacier areas in the northern part of the study area. Landscape observations, an expert consultation and informant survey (CIS), such as from businesspersons, school teachers, university lecturers and people involved in traditional occupations, were made to obtain the information on the occurrence of historical land use change events and data on damage resulting from fire, landslide, flood and earthquake hazards. A total of 50 key informants and experts were consulted. The snowball technique was used to identify them.
The highly vulnerable zones in terms of fire, flood, landslide, earthquake and sinkholes were explored through primary and secondary data acquisition and analysis with the help of multiple hazard inventory mapping. Sinkhole hazards were identified through primary data collection. Locations of individual sinkholes were captured using the Global Positioning System (GPS). For fire hazard assessment, the locations of petrol stations in the dense settlements that pose a considerable threat were also located using GPS. Landslide and flood hazard-prone areas were identified through past research, field visits using GPS, along with consultations with local people and relevant experts. The earthquake hazard was assessed through secondary information. The collected information has been plotted to prepare a multiple hazard risk map. After finalization of the risk area, the risk sensitivity land use map has been prepared to show areas of high risk and areas more suitable for future urban expansion.
Two cloud-free Landsat images were used to classify the study area: Landsat Image 5 (with Path/Row 142/40) of November 1990 and Landsat 8 (with Path/Row 142/40) of October 2013. All data were projected to the Universal Transverse Mercator (UTM) projection system, which is the World Geodetic System 1984. The IDRISI Selva version image processing software was used for the image analysis. According to the land use classification scheme, an unsupervised and a supervised approach with the maximum likelihood parameter (MLP) system were applied to improve the accuracy of the land use classification for the 1990 and 2013 images. The classification system used is a slightly modified classification system for remotely-sensed data as recommended by Anderson
et al. 1976 [
16]. The Land Change Modeler (LCM) system was applied to analyze the changes, transition and exchanges of land use and land cover (LULC). The transition probability may be accurate on a per category basis.
3. Results and Discussion
3.1. Population Growth and Urbanization
Though the urban history of Nepal is relatively short, the rate of urban development is quite high. In the early period, Pokhara was essentially a market center situated in the broad valley of Seti and its tributaries. Because of its strategic location between the mountains and
Tarai (plain), it became an important east-west staging point on the Trans-Himalayan trade route [
8,
17,
18]. The history of Pokhara city begins with the periodical religious gatherings during the medieval period and permanent
bazaar (market places) after the unification of Nepal in 1768. Enchanting natural beauty, tourism activities and its unique social and cultural heritage are responsible for the present development of the town population of the Pokhara sub-metropolis. Discussants also note that access to such facilities is the main cause of migration to and the population growth of Pokhara.
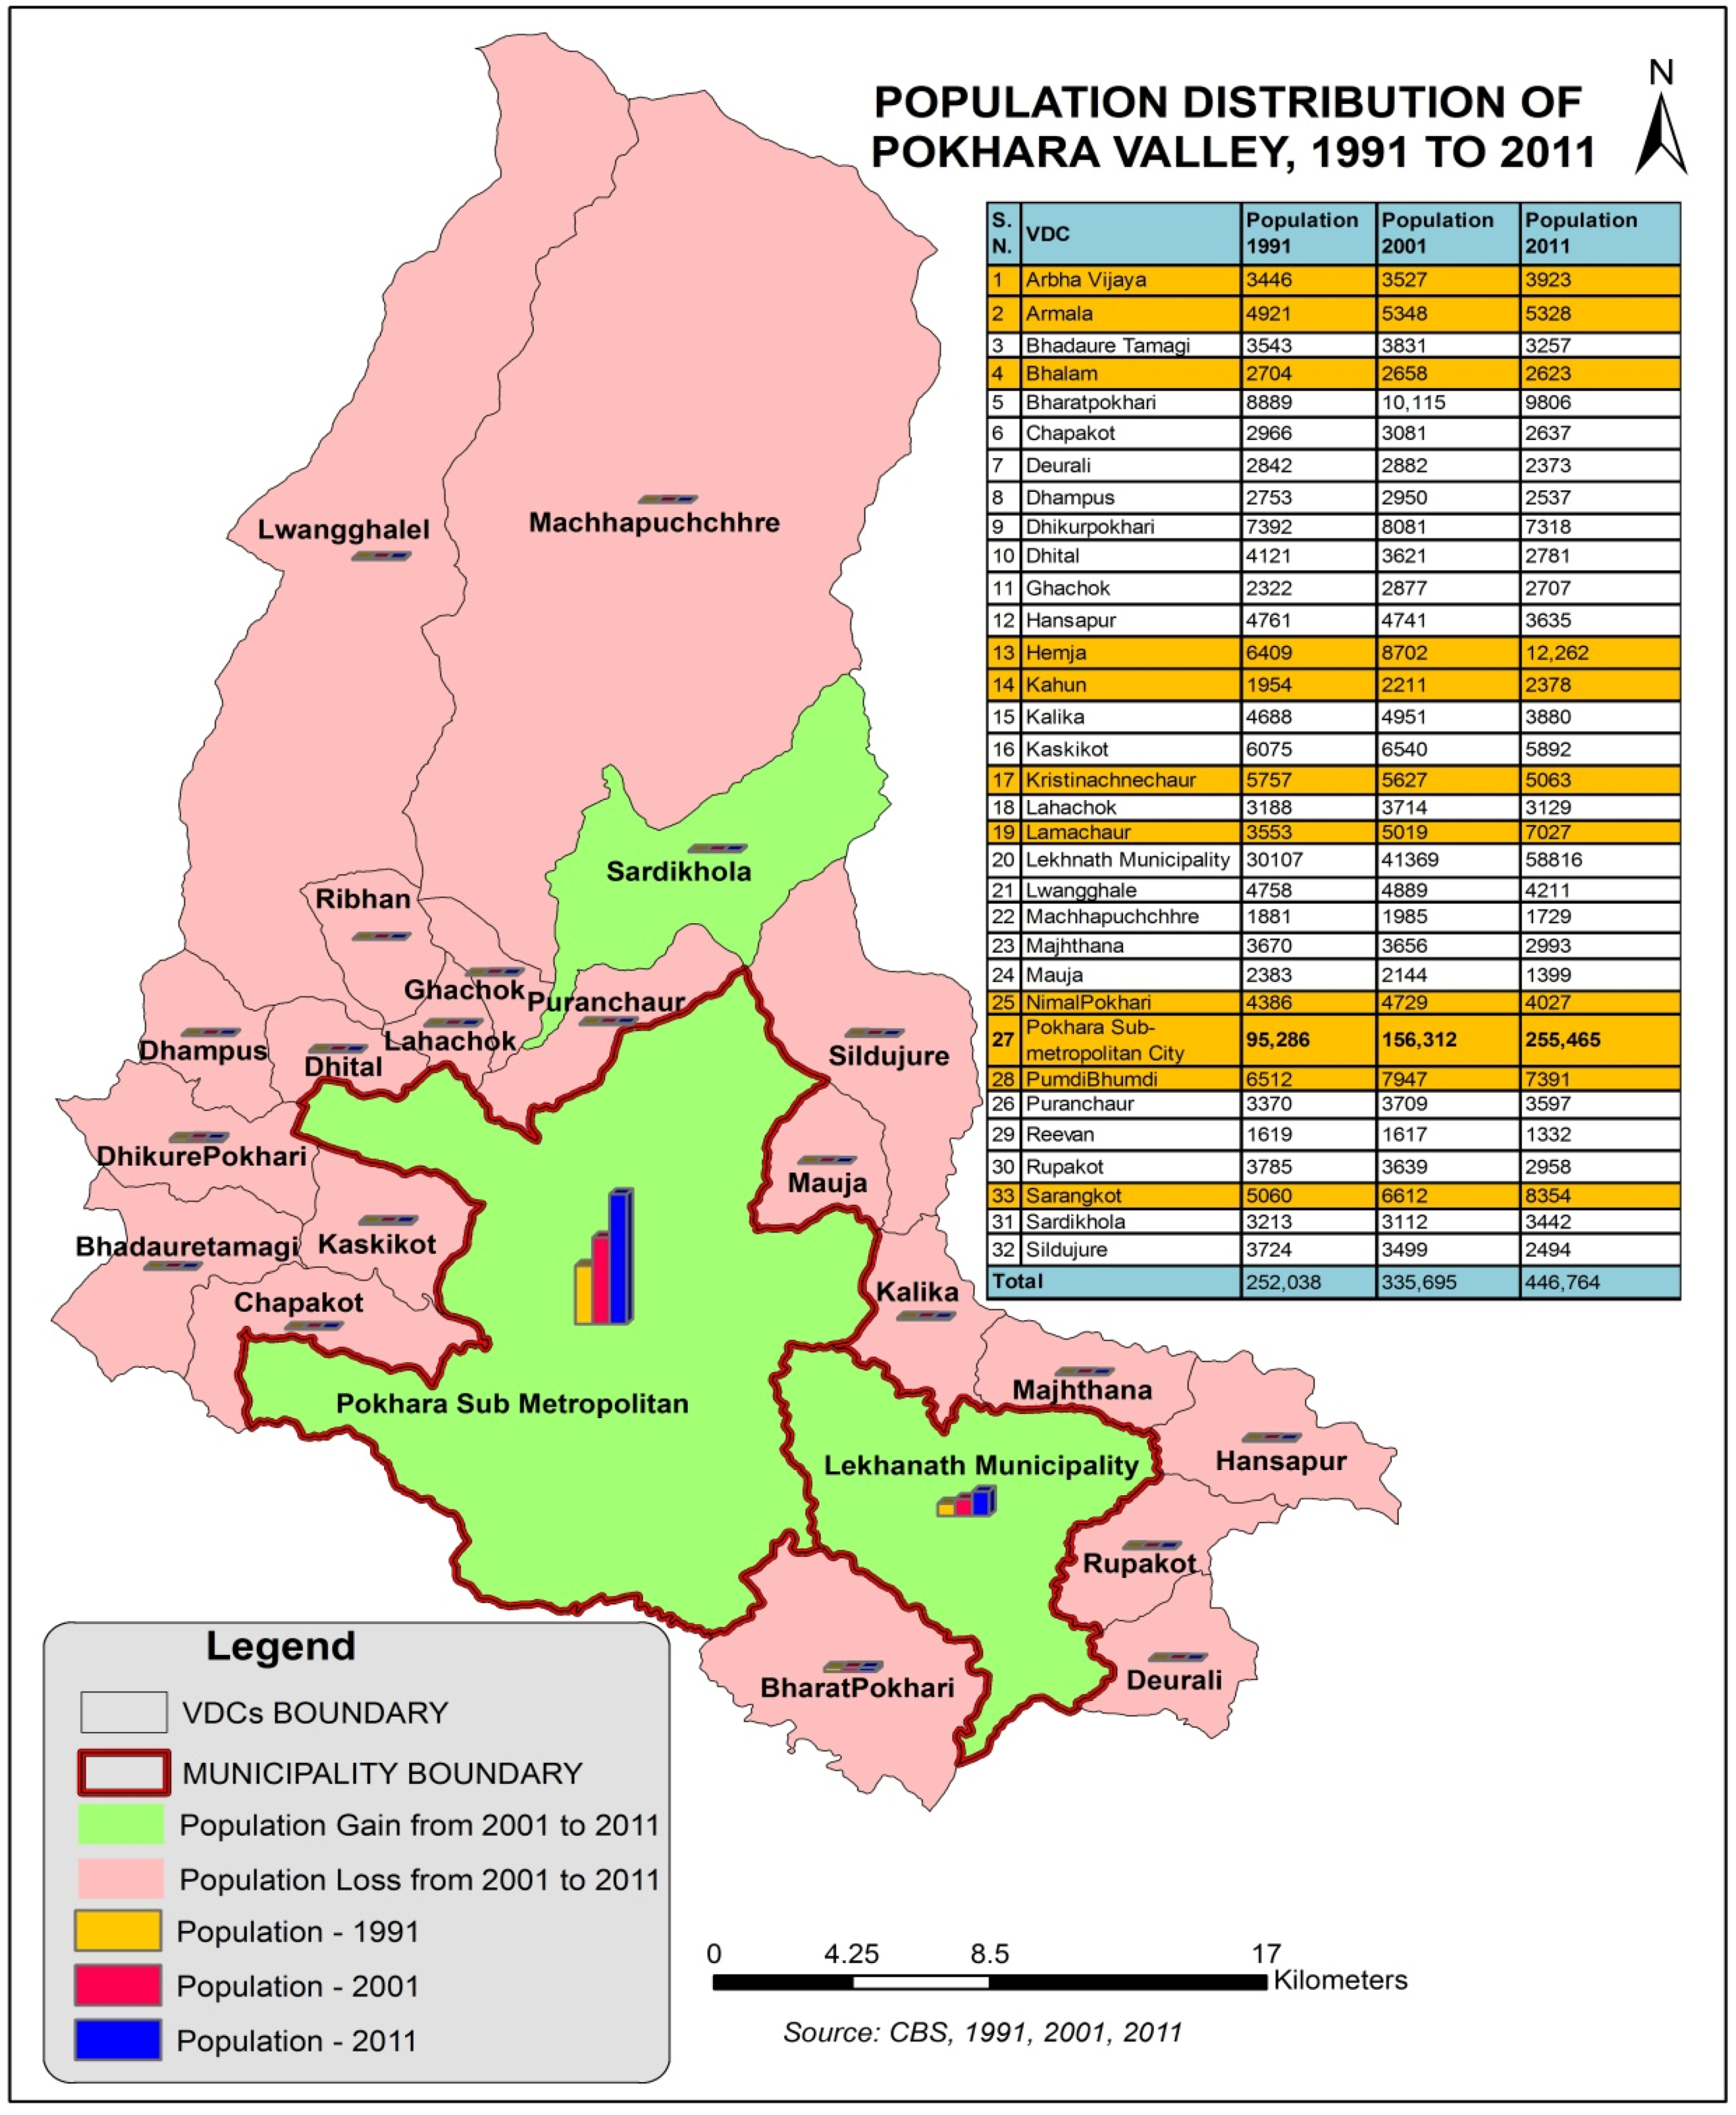
The Pokhara valley is going through an unprecedented rate of population growth. The Central Bureau of Statistics [
14] recorded 446,764 as the total population of the valley among which, 255,465 (prior to annexation with 10 VDCs) people settle in the Pokhara sub-metropolitan city and 58,816 in Lekhnath Municipality alone. In the Pokhara sub-metropolitan city, the urban area had covered 6.33% in 1977, but has increased to 51.42% in 2010, whereas cultivated land has decreased from 60.73% down to 20.27% during the same period [
19].
There has been a gradual increase in population in the Seti watershed area from 252,038 in 1991 to 335,695 in 2001 and 446,764 in 2011. The Pokhara sub-metropolitan city and Lekhnath municipality contain the highest and the second highest population counts, respectively. The total populations of the newly-annexed Pokhara sub-metropolitan area for the years 1991, 2001 and 2011 were 139,988, 208,692 and 313,841, respectively, and for Lekhnath in 1991, 2001 and 2011 were 30,107, 41,369 and 58,816. Population pressure is very high in the city area. The population census in 2011 showed that 70.25% of the population settled in the Pokhara sub-metropolitan city alone (including the newly-adjoined 10 VDCs) (
Figure 3).
Figure 3.
Population distribution map. Note: The total area of the sub-metropolitan city was 55.31 km2, which expanded to 226 km2 by 2014 after the annexation of the other 10 adjoining VDCs, namely Arbha Vijaya, Armala, Bhalam, Hemja, Kahun, Kristinachnechaur, Lamachaur, Nimal Pokhari, PumdiBhumdi and Sarangkot. The population sum of the annexed 10 VDCs and Pokhara sub-metropolitan city is mentioned as the total population of Pokhara sub-metropolitan city in this study.
According to Rimal [
8,
9], multiple forces have contributed to driving people from rural villages and districts into the city area of Pokhara. The major causes of population migration in the city are greater economic opportunities (28%), accessibility to public service (22%), the influence of population growth and migration (13%), globalization (10%), physical conditions (7%), as well as tourism activities, government plans and policies, the land market and the political situation (all 5%). Rapid population growth has significantly influenced the utilization of land and other natural resources in this region, resulting in land use/cover changes.
3.2. Land Use/Land Cover Change (1990–2013)
Land use/land cover (LULC) change is quantified for the last 23 years in the vicinity of the fast urban growing city of Pokhara. This research is pivotal, since it shows the relationship between the urbanization process and the transition of various land use classes at different spatial and temporal scales.
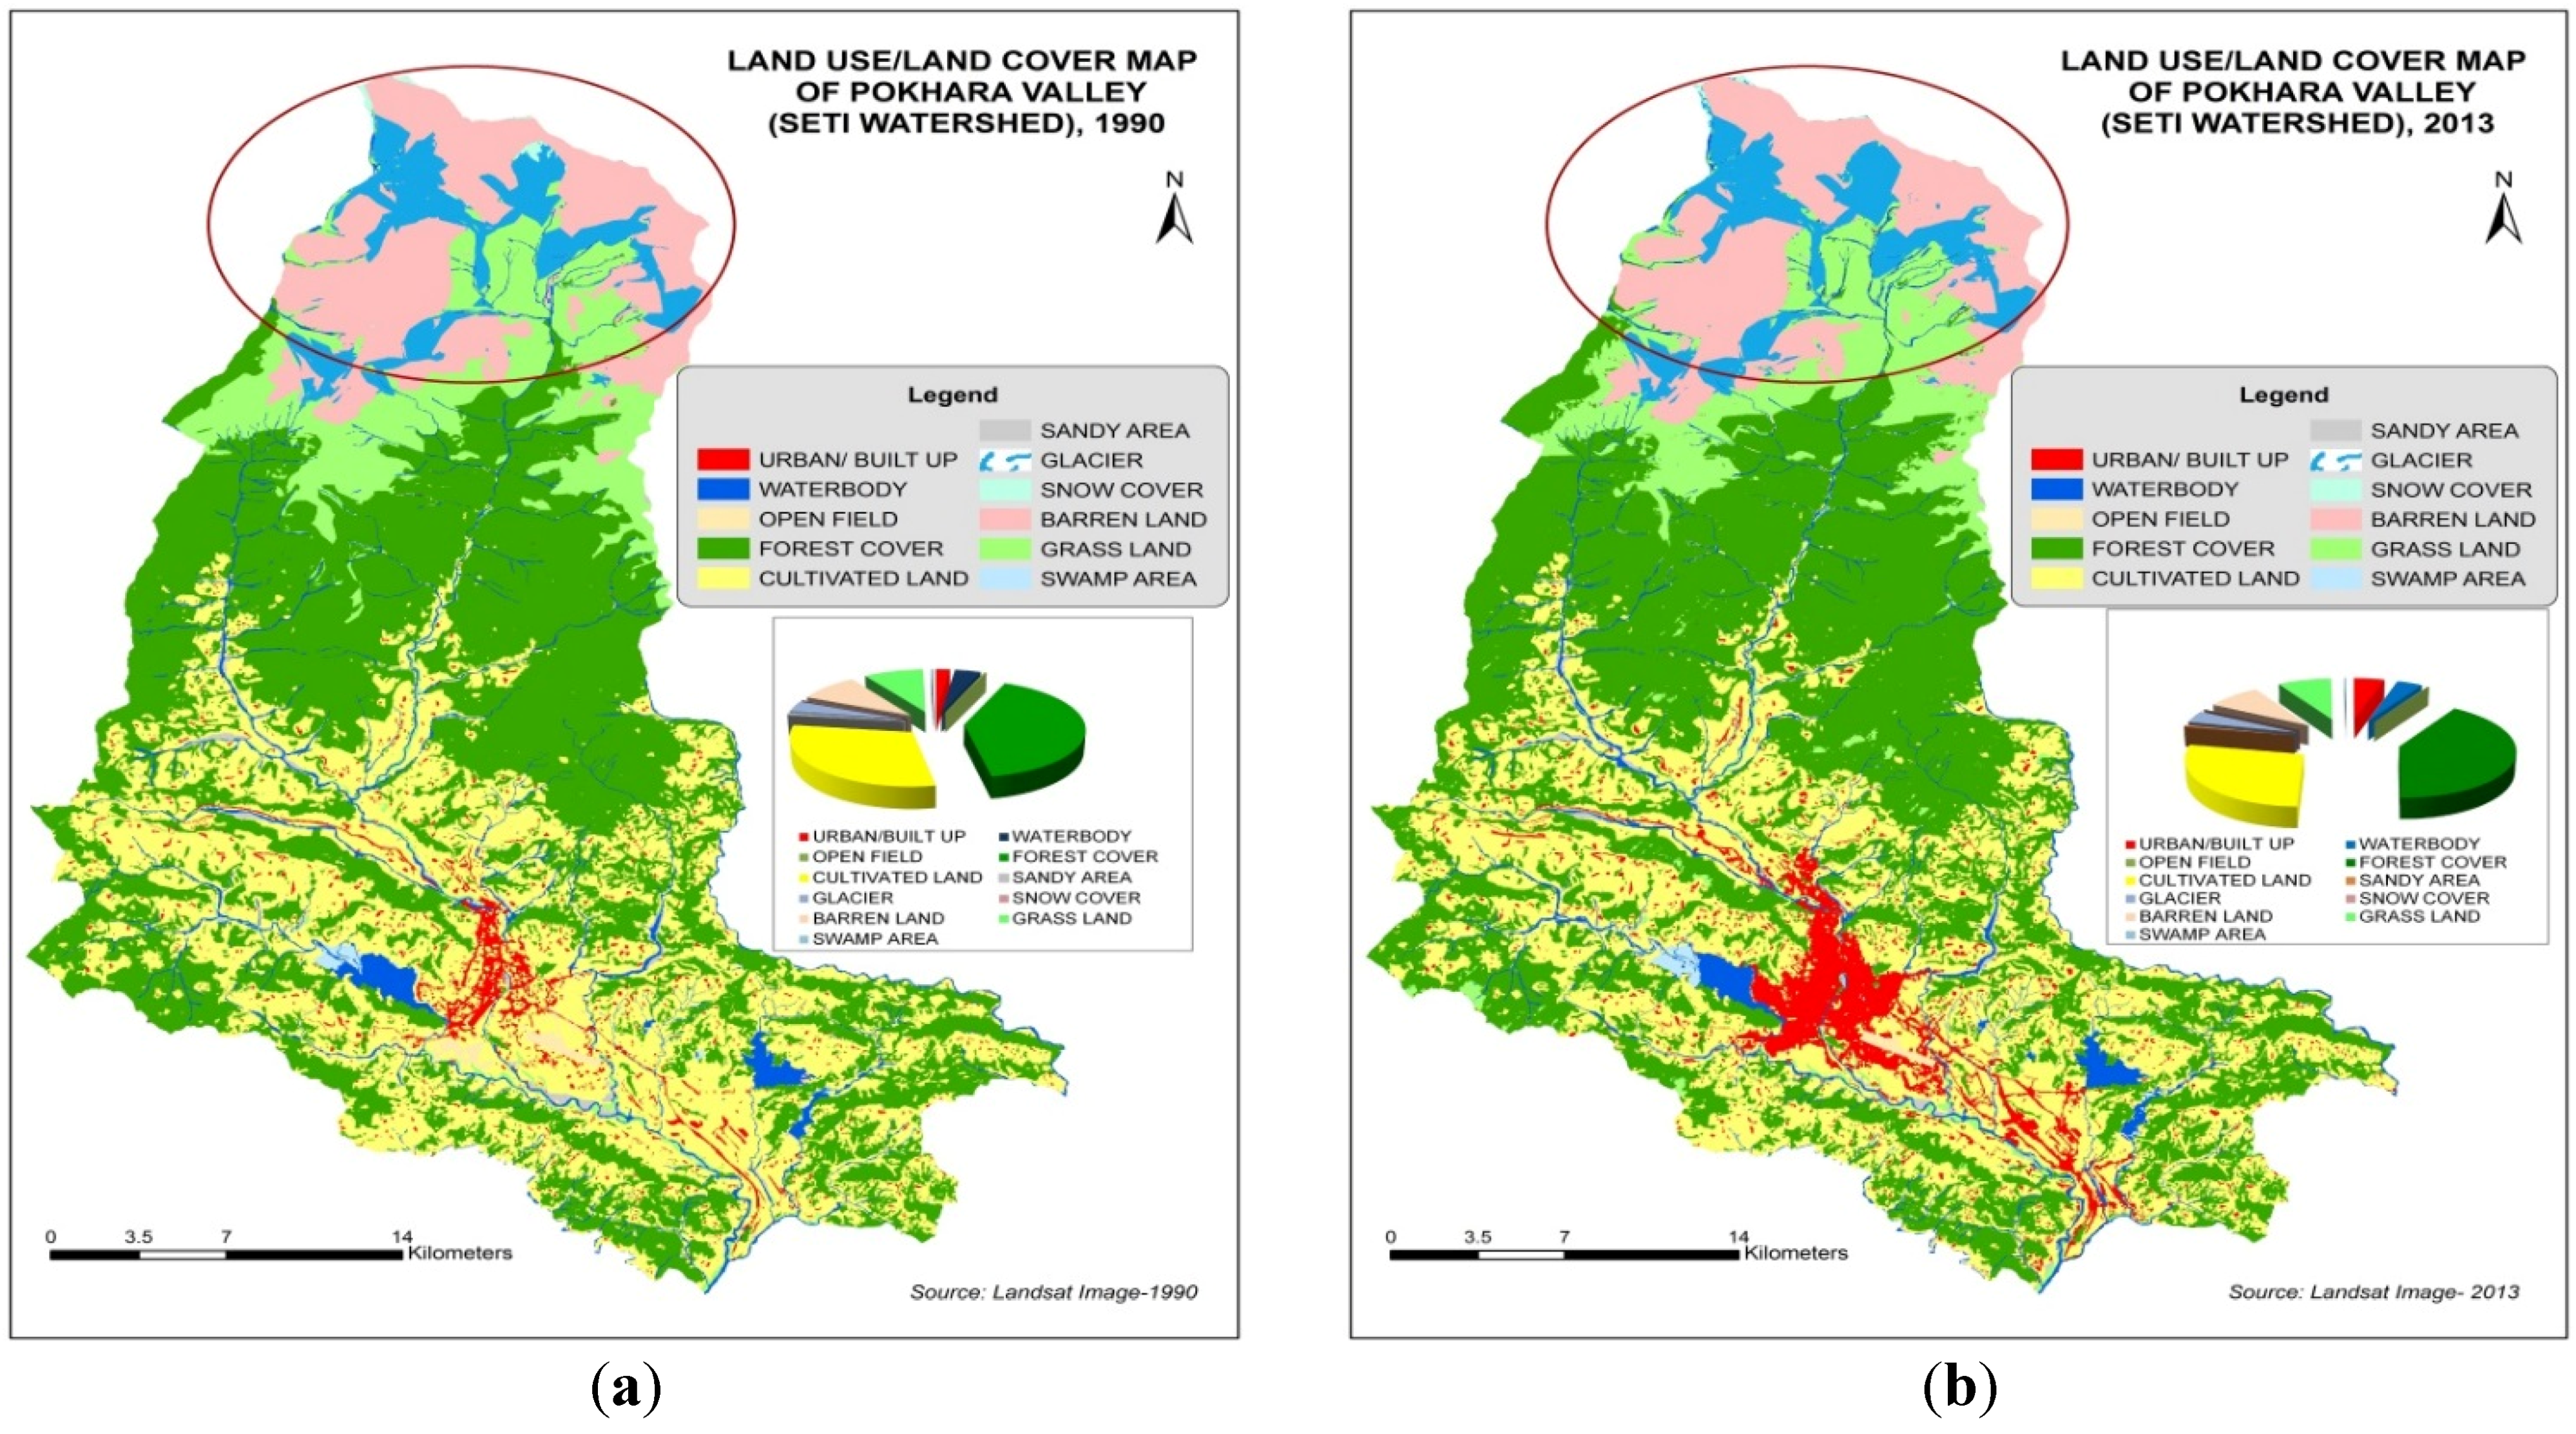
There have been extensive changes in different land use classes between 1990 and 2013 (
Table 1) due to diverse proximate and other underlying causes. The high rate of migration and population growth has directly contributed to rapid urban growth. Urban coverage of the Seti watershed has increased by 60% from 24.03 km² in 1990 (
Figure 4a) to 54.20 km² in 2013 (
Figure 4b) which is a remarkable rate of increase (
Table 1). According to the analysis, 29.19 km² of cultivated land have been converted into built-up area (
Figure 5). Easy road access to local villages has also fostered urban growth. Not surprisingly, the area of cultivable land is declining. One result of the rapid movement of people to city areas is that forest coverage for private forest and community forestry has increased remarkably in the rural area. The random flows of the rivers convert the cultivated land into sand and
vice versa. Cultivated land occupied 349.63 km² (30.27%) in 1990, decreasing to 320.81 km² (27.77%) in 2013.
Table 1.
Land use/land cover change, 1990–2013.
Table 1.
Land use/land cover change, 1990–2013.
| Land Cover Type | Land Cover 1990 | Land Cover 2013 | Magnitude (2013–1990) Change |
|---|
| Area in km² | Area in % | Area in km² | Area in % | Change Area in km² | Change Areain % |
|---|
| Urban/Built-up | 24.03 | 2.08 | 54.20 | 4.69 | 30.17 | 2.61 |
| Water Body | 44.44 | 3.85 | 45.79 | 3.96 | 1.35 | 0.12 |
| Open Field | 3.97 | 0.34 | 2.63 | 0.23 | −1.34 | −0.12 |
| Forest Cover | 470.80 | 40.75 | 479.41 | 41.50 | 8.61 | 0.75 |
| Cultivated Land | 349.63 | 30.27 | 320.81 | 27.77 | −28.82 | −2.50 |
| Sandy Area | 6.23 | 0.54 | 7.36 | 0.64 | 1.13 | 0.10 |
| Glacier | 42.36 | 3.67 | 46.12 | 3.99 | 3.77 | 0.33 |
| Snow Cover | 1.34 | 0.12 | 0.50 | 0.04 | −0.84 | −0.07 |
| Barren Land | 105.46 | 9.13 | 99.28 | 8.59 | −6.18 | −0.54 |
| Grass Land | 102.33 | 8.86 | 95.49 | 8.27 | −6.84 | −0.59 |
| Swamp Area | 4.62 | 0.40 | 3.61 | 0.31 | −1.00 | −0.09 |
| Total | 1155.19 | 100.00 | 1155.19 | 100.00 | | |
A total of 8.19 km² and 6.63 km² of forest has been converted into grassland and cultivated land, respectively. Despite this transformation, forest coverage overall has increased slightly.
Table 1 shows that in 1990, forest covered 470.80 km² (40.75%), increasing to 479.41 km² (41.50%) in 2013. Grassland and barren land both decreased in the area. Similarly, snow-covered area decreased, but the area covered by glaciers increased by 3.99% over the time period. This signifies less snow in the Himalayas and rapid melting and formation of larger glaciers in the region. Furthermore, transformation of the open field into cultivated land is due to encroachment for food security and the rise in the number of urban slum dwellers. The open field land class, although small in area, encompasses an area in the western part of the Pokahra sub-metropolitan city that is the proposed site for the Pokhara International Airport. The open field and swamp areas in the region have also decreased, while water body and sandy areas have slightly increased. The total 44.44 km² of water body and 6.23 km² of sandy area increased to 45.79 km² and 7.63 km², respectively, in 2013. The total 3.97 km² of open area and 4.62 km² of swamp area has transformed to 2.63 km² and 3.61 km² in 2013, respectively (
Table 1).
Figure 4.
(a) LULC map of Pokhara valley, 1990; (b) LULC map of Pokhara valley, 2013.
Figure 4.
(a) LULC map of Pokhara valley, 1990; (b) LULC map of Pokhara valley, 2013.
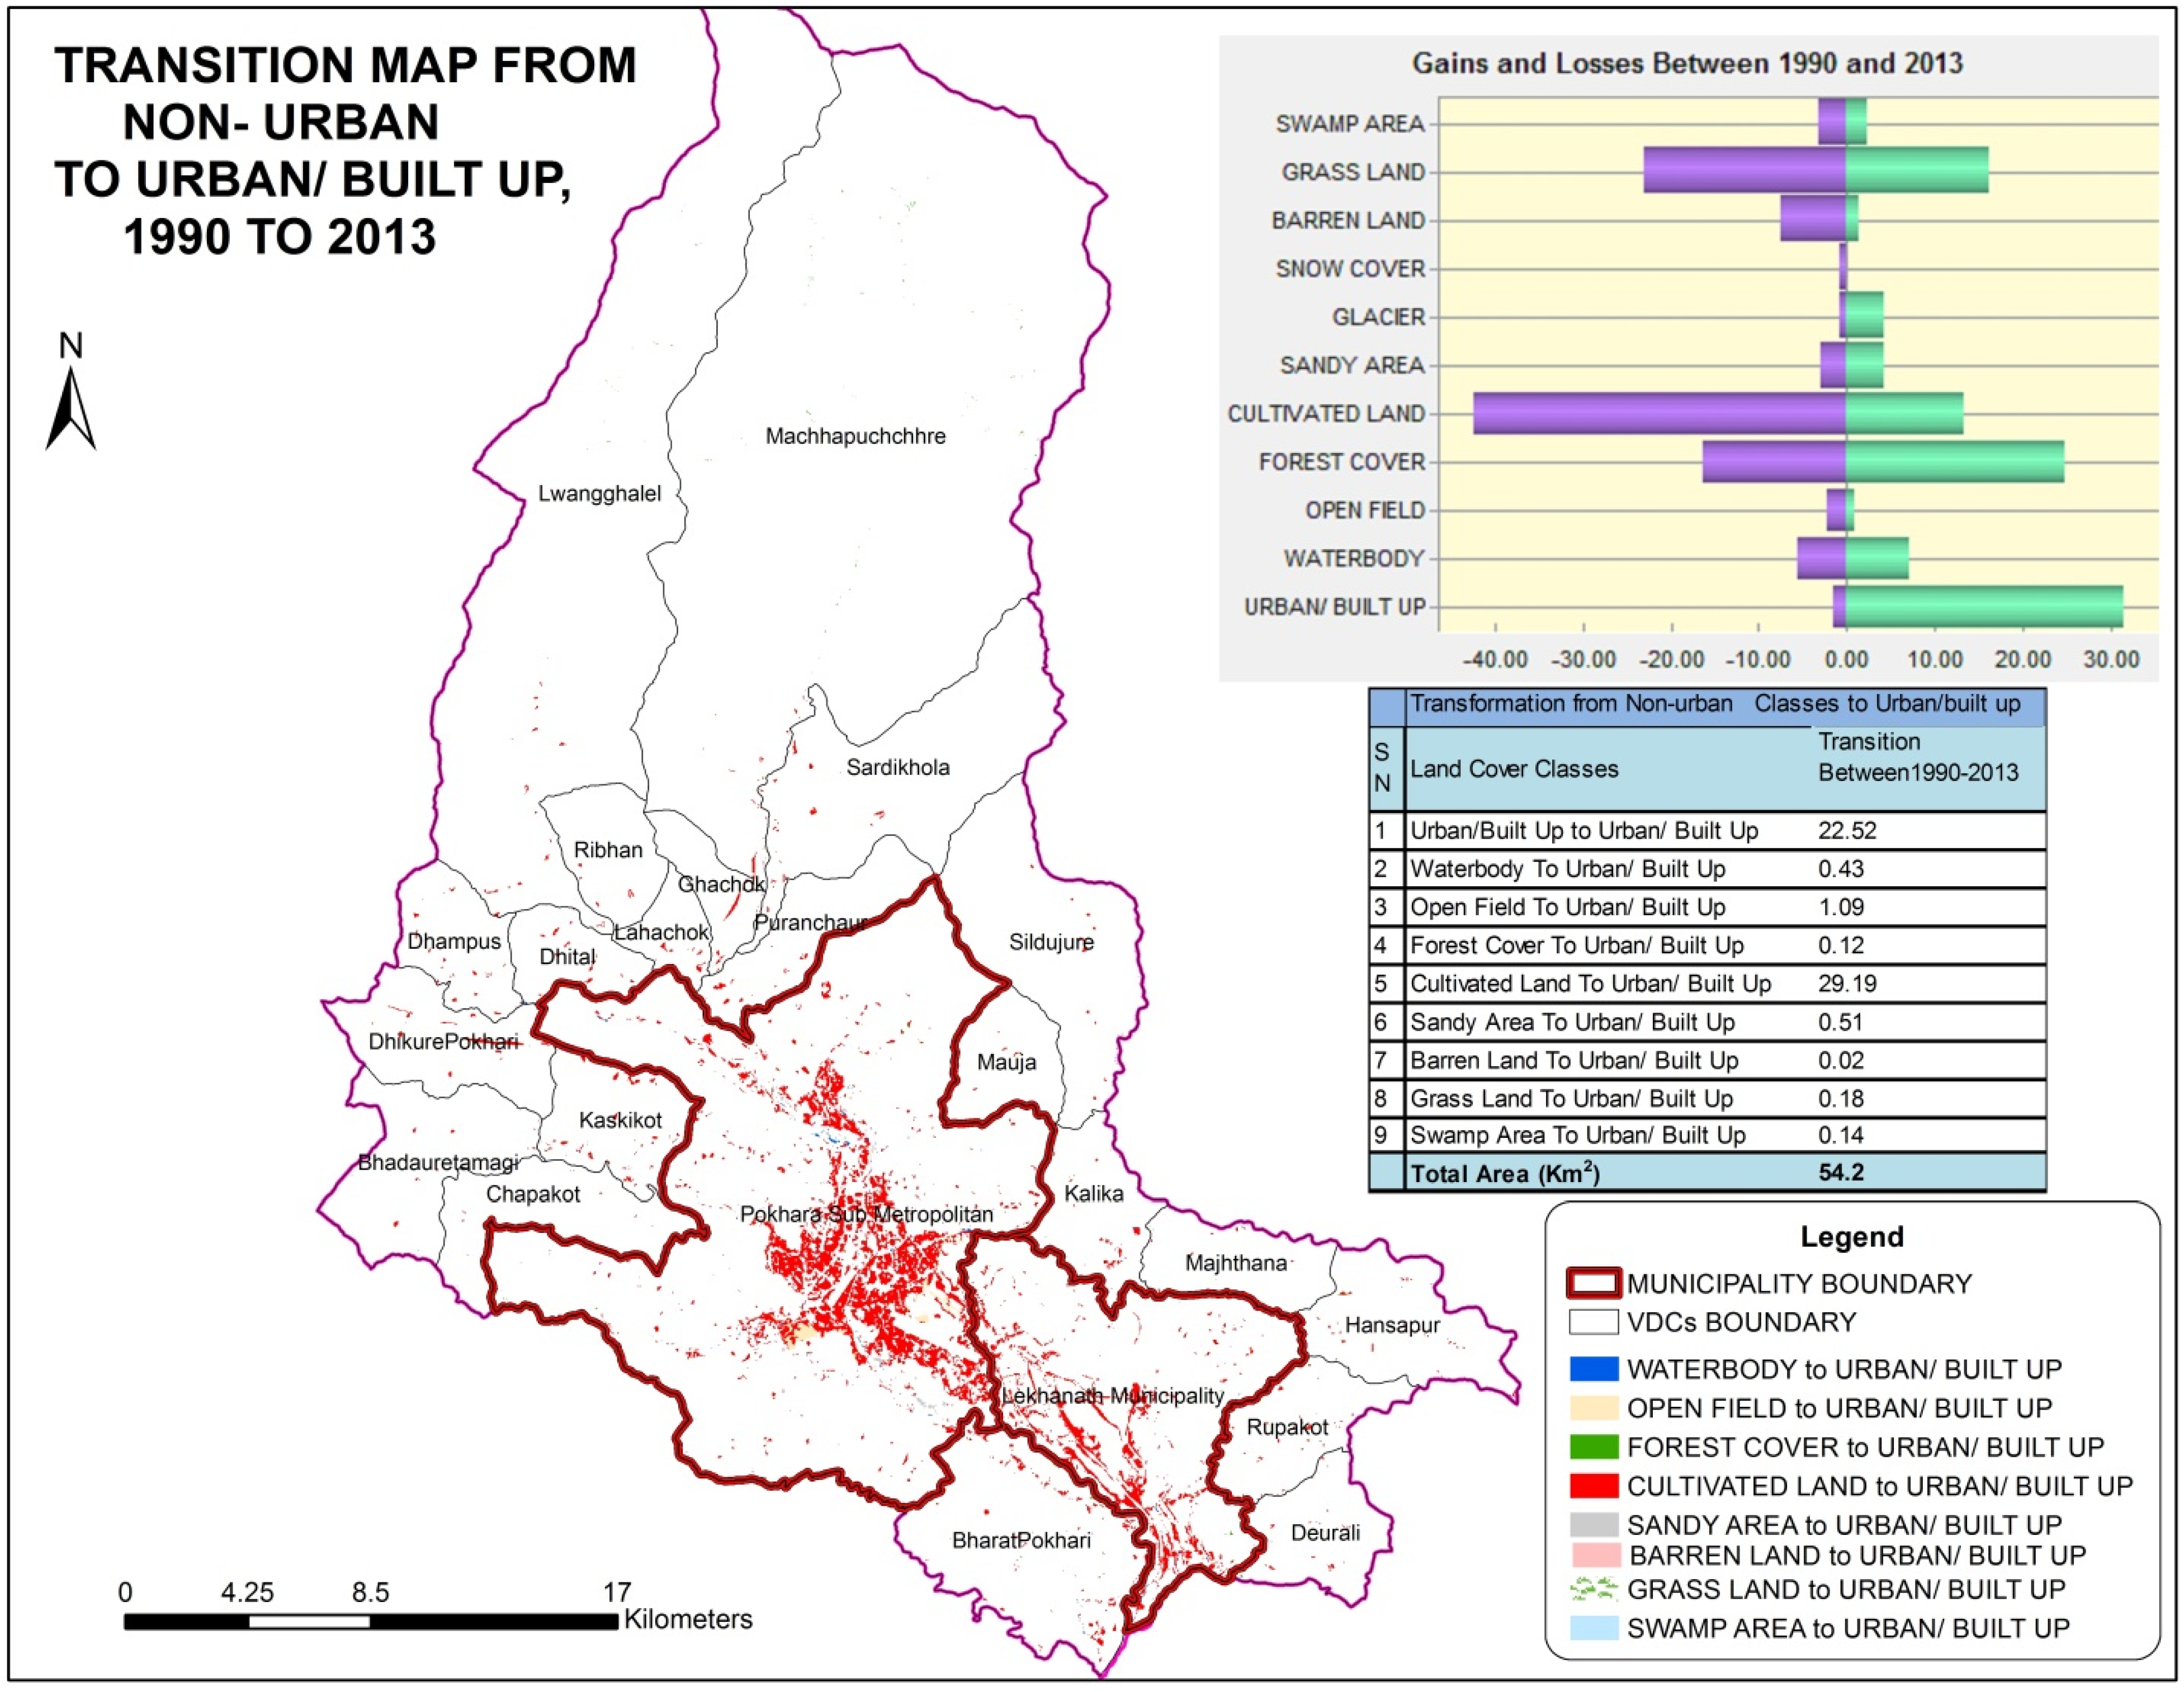
Figure 5 below shows the transition of different non-urban land use classes to urban/built-up. A large area (29.19 km²) of cultivated land has been converted into urban/built-up. Similarly, the area transformed to urban/built-up from water body, open field, forest cover, sand, grassland and swamp is 0.43km², 1.09 km², 0.12 km², 0.51 km², 0.18 km² and 0.14 km², respectively.
Almost the entire urban expansion has taken place in the Pokhara sub-metropolitan area and Lekhnath municipality and their buffer areas. The area has seen drastic land use/land cover changes in the last two decades. Land cover changes are demonstrated in terms of decreasing cultivated areas and forest with respect to increasing urban/built-up. It is predictable that the cultivated land has been squeezed and the urban/built-up area has been intensified. Among the remaining agricultural areas, many are at high risk of edge fall, sinkholes, landslides and floods. Scattered settlements remain amid the agricultural areas. The loss of agricultural areas and the risk of frequent serious disasters pose a severe challenge to food security. Much of the city’s rapid growth in population has been accommodated in informal settlements with a high risk of environmental impairments and hazards. The rapid increase in urban development is itself a risk factor. Besides, urban expansion in the high risk and vulnerable areas is yet another factor jeopardizing the safety of human life.
Figure 5.
Transition map from all land use/land covers to urban area, 1990–2013.
Figure 5.
Transition map from all land use/land covers to urban area, 1990–2013.
3.3. Multiple hazard Risk
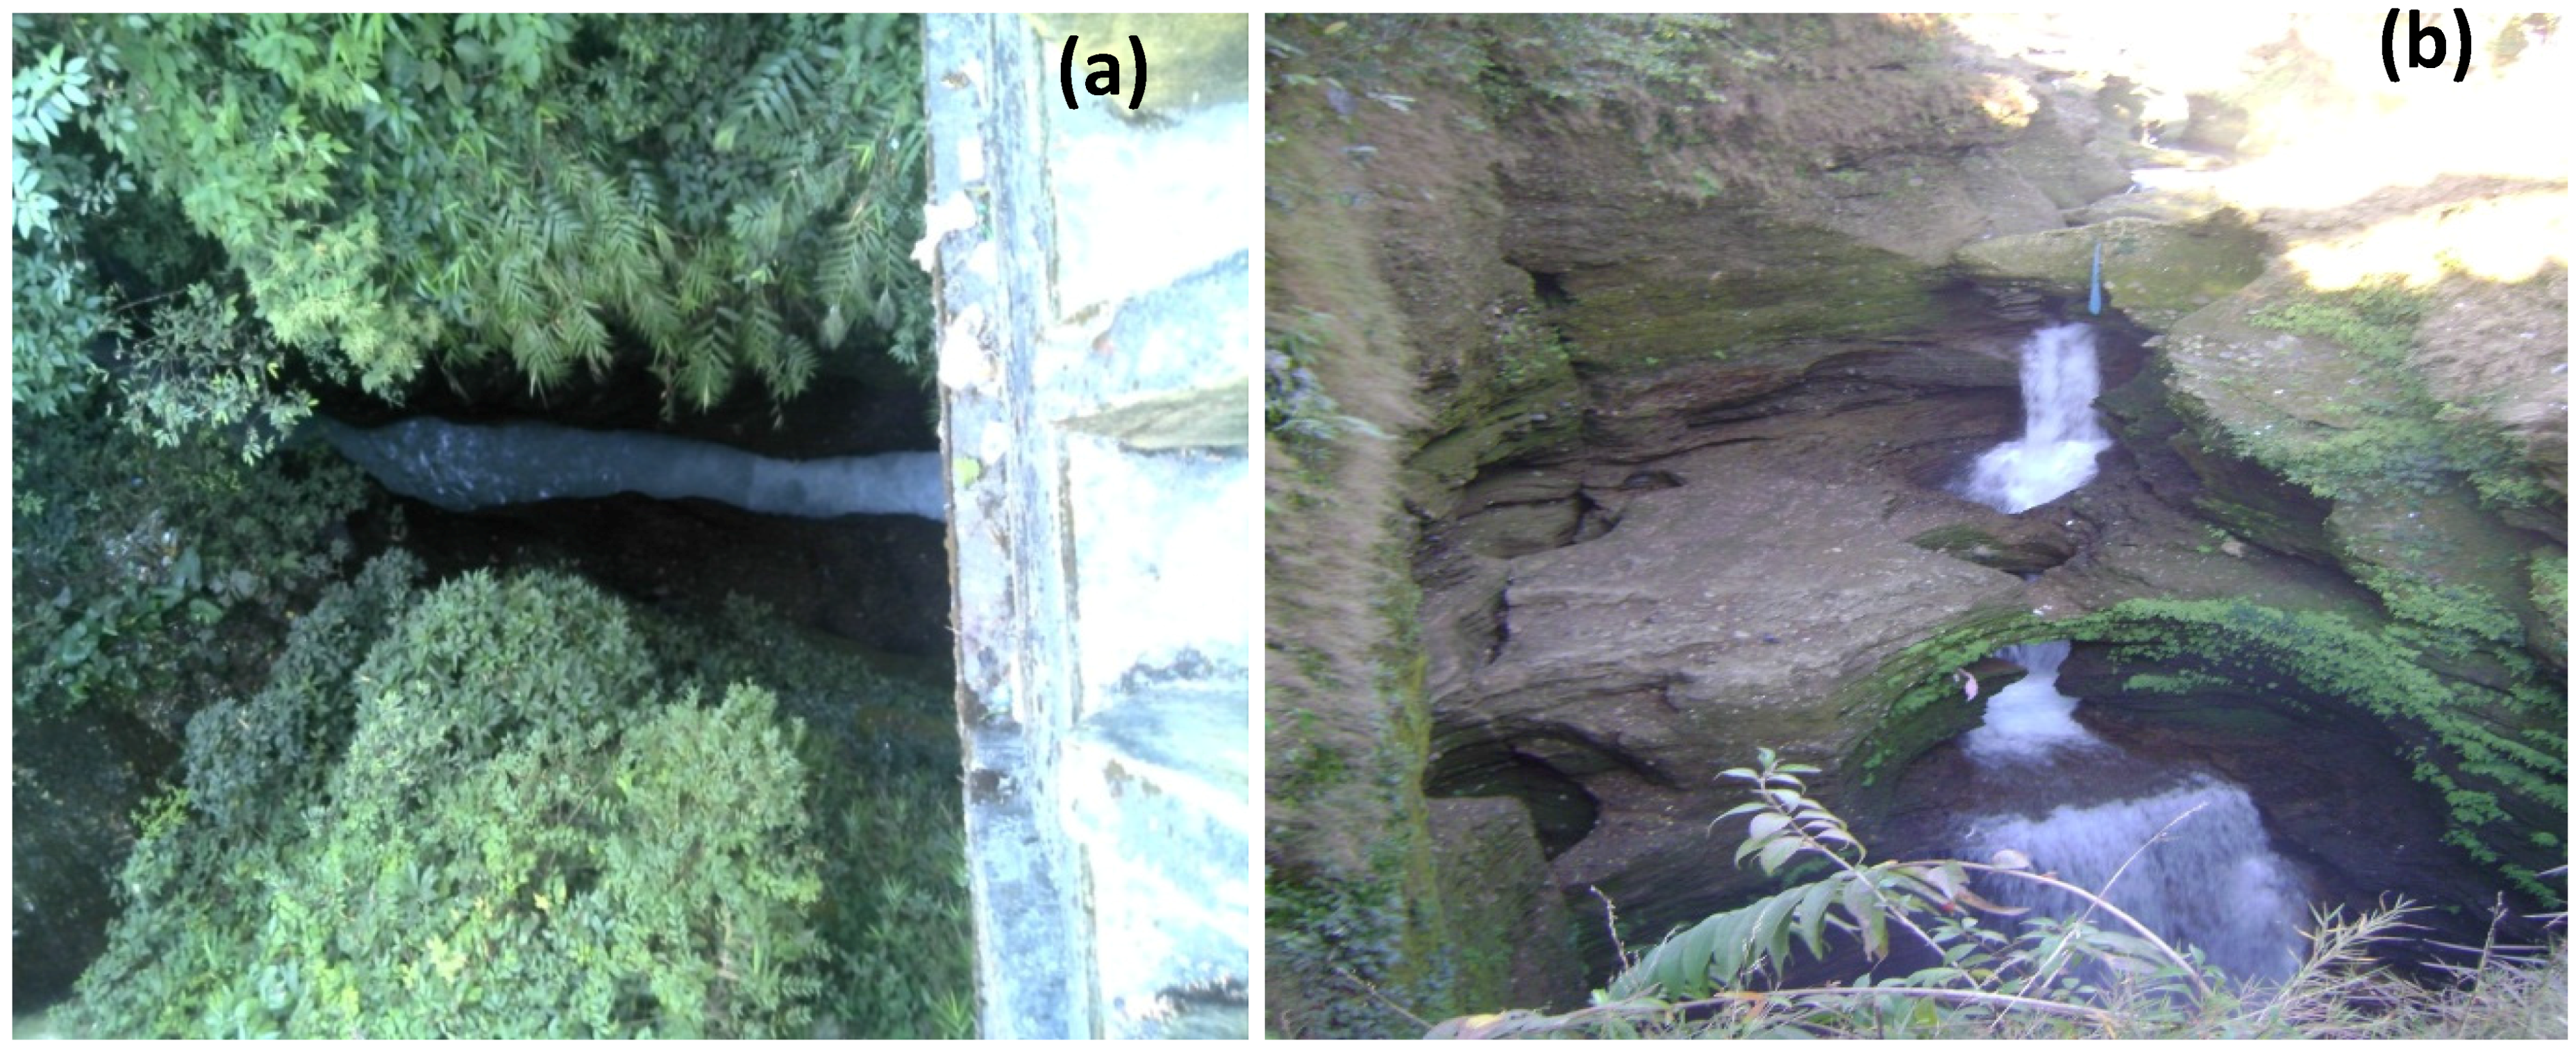
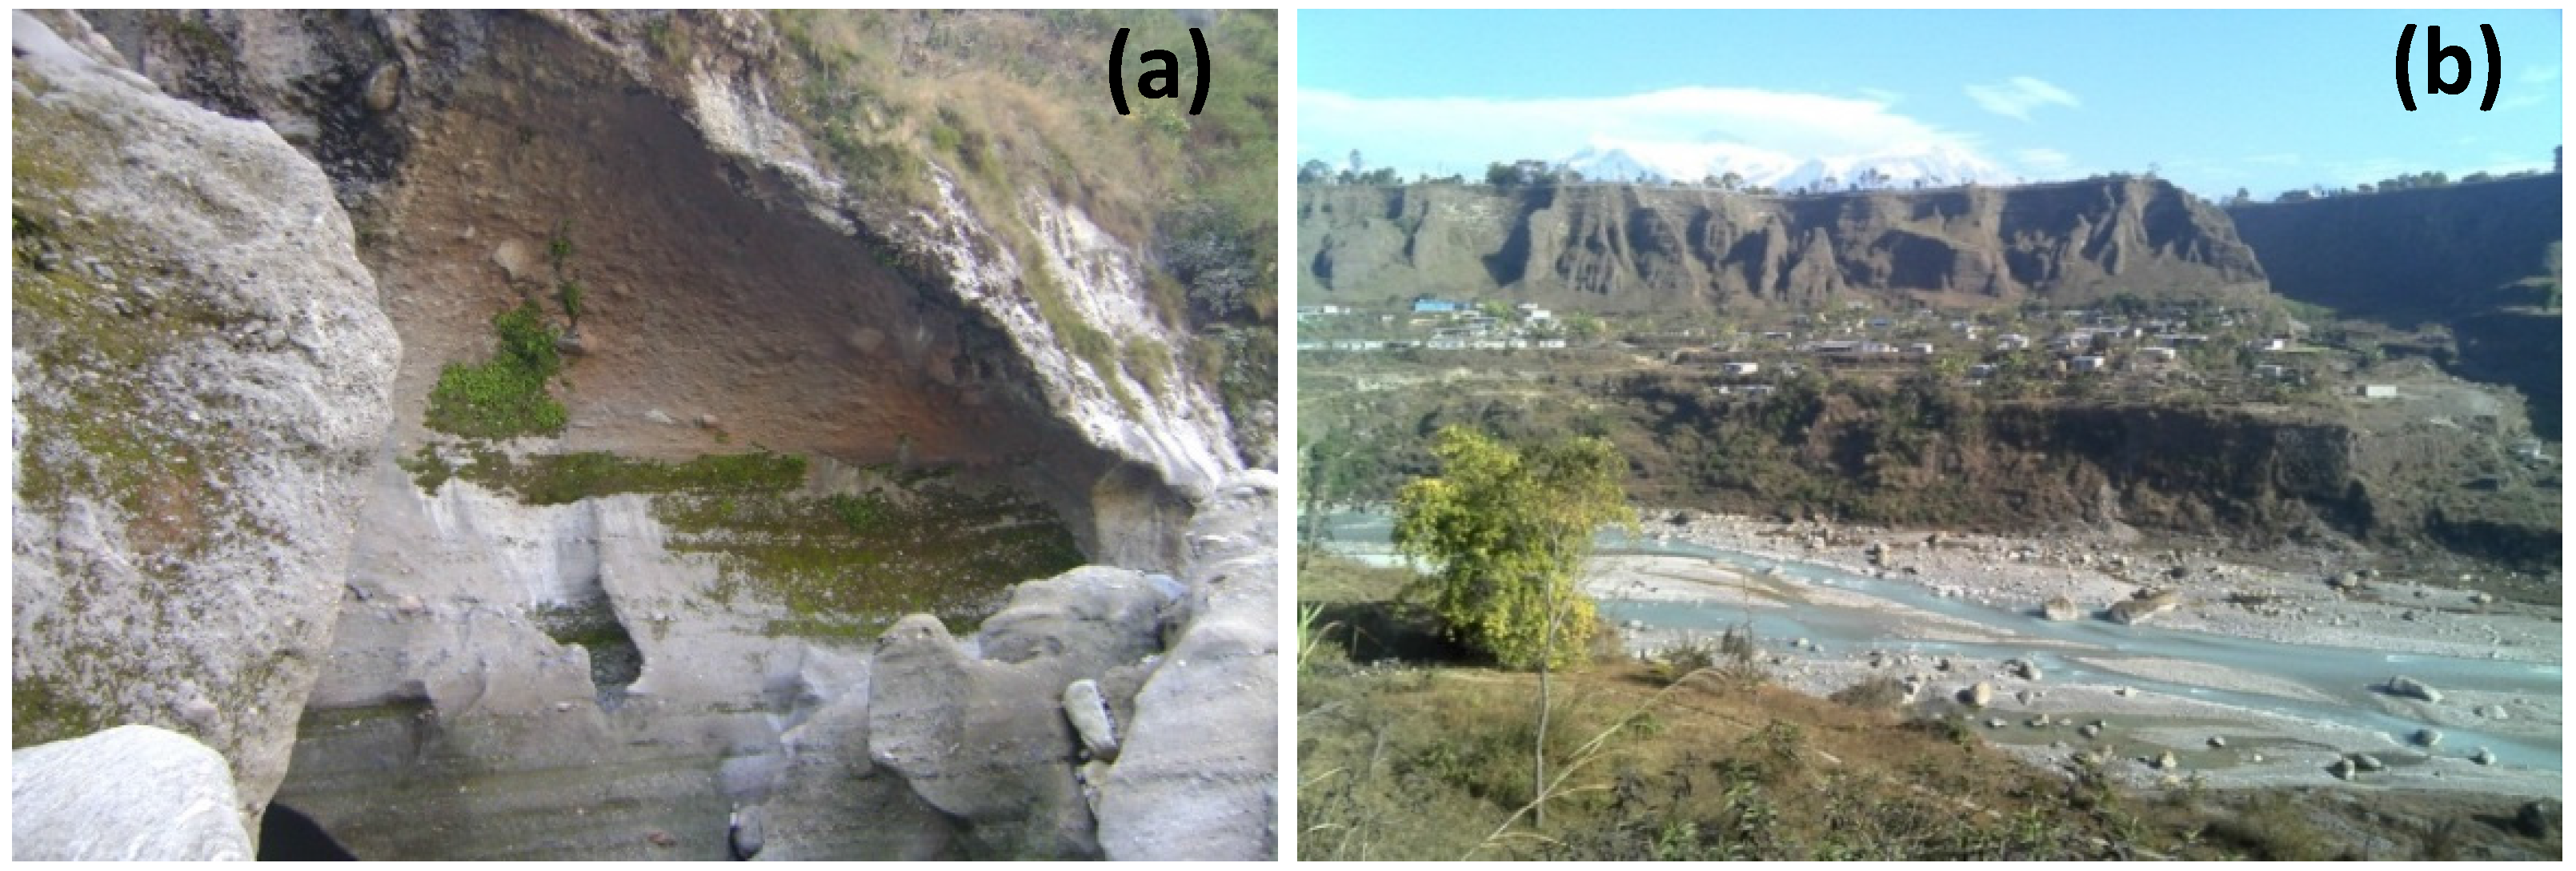
Pokhara is a disaster-prone area due to its steep terrain, a rugged and fragile geomorphic condition, surrounding high peaks and slopes, volatile tectonic process, variable climatic condition and the frequency of earthquakes, floods and landslides. The likelihood of disaster in Pokhara is therefore high. The Pokharel 2013 report has mentioned Archalboat, Dhad, Chhorepatan, Simla Tunda and the Phusre Khola edge as potential subsidence risk areas, the western edge of Bijayapur Khola and the Firke Khola as edge fall risk areas, Phusre Khola, Dowilla, Simal Tunda, both sides of the Seti River bank and the Chhorepatan area as high flood hazard risk areas, Chhorepatan as a sinkhole risk area and Batule chaur as a land collapse risk area [
20]. Mentioned (
Figure 6) represented the Seti George and Devis’s Fall of Pokhara valley.
Figure 6.
(a) Seti Gorge 2014 and (b) Devis’s Fall 2014.
Figure 6.
(a) Seti Gorge 2014 and (b) Devis’s Fall 2014.
3.3.1. Sinkholes
In the Pokhara sub-metropolis and adjoined areas, a number of sinkholes and sites of land subsidence have been reported (
Table 2). Geologically, all of these recorded sinkholes lie in the Ghachok formation. This formation is the debris flow deposits that comprise boulder- to silt-sized sediments with limestone fragments and capped by a 1–3 meter-thick silty layer. The area from Baidam and Rastra Bank to Baglung Buspark, Chhorepatan and its adjoining areas, Pokhara stadium and adjoining areas and the left bank of the Seti River near the Golf palace are also susceptible to land collapse and subsidence when a large earthquake occurs [
21,
22]. The southern peripheries of the Powerhouse, Gupteshwar cave, Mahendra cave and Chamero cave areas, which are regularly visited by tourists, have a high likelihood of sinkhole development within the Phewa formation ([
23]; p.13). The areas of Chipledhunga, Mahendra Pul, Male Patan, Manaswar, Bhagerthan Lama Chaur and Tersa pati are additional sinkhole collapse-prone areas of Pokhara valley [
21].
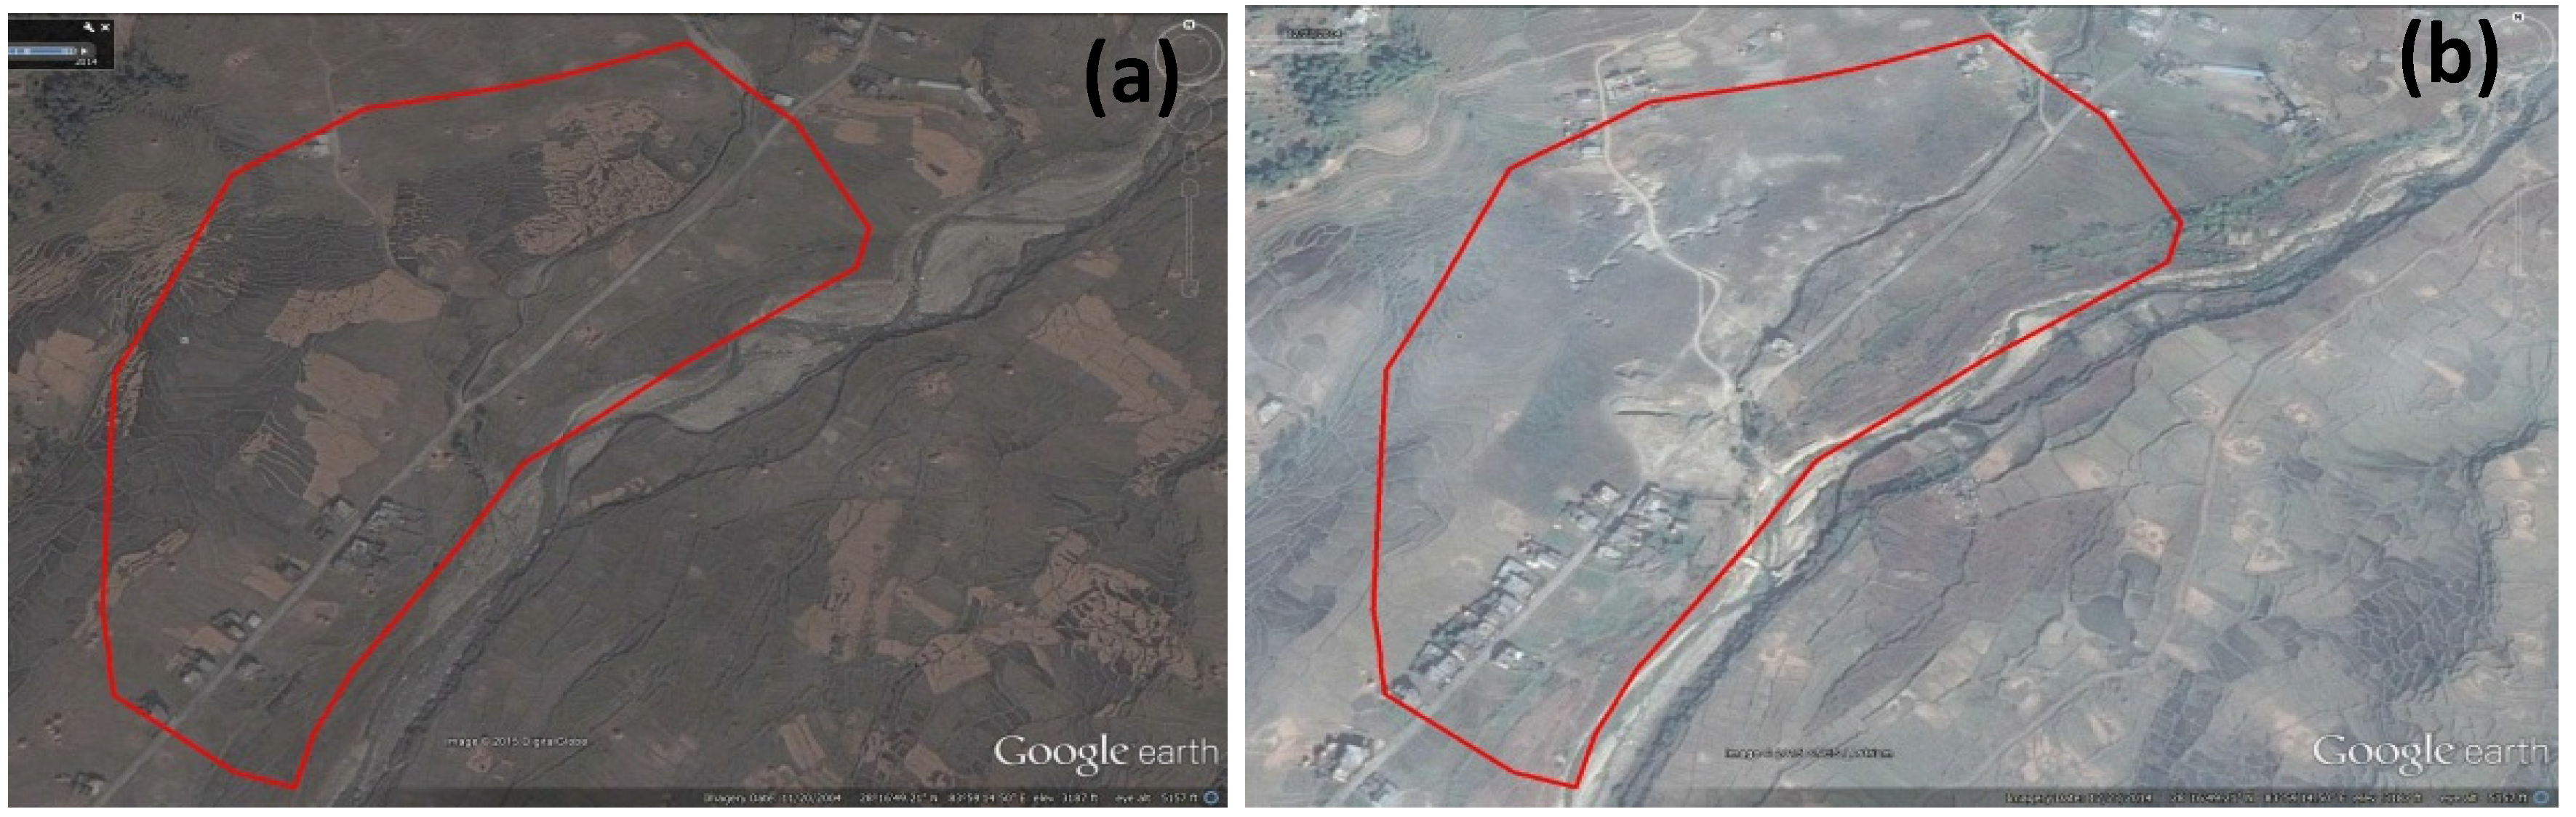
The agricultural land with some settlement in the Jaimure basin of Armala nearby the meeting point of the local Kali Khola and Jumleti Khola is a highly affected region with more than 100 large to small sinkholes that have formed in recent years (
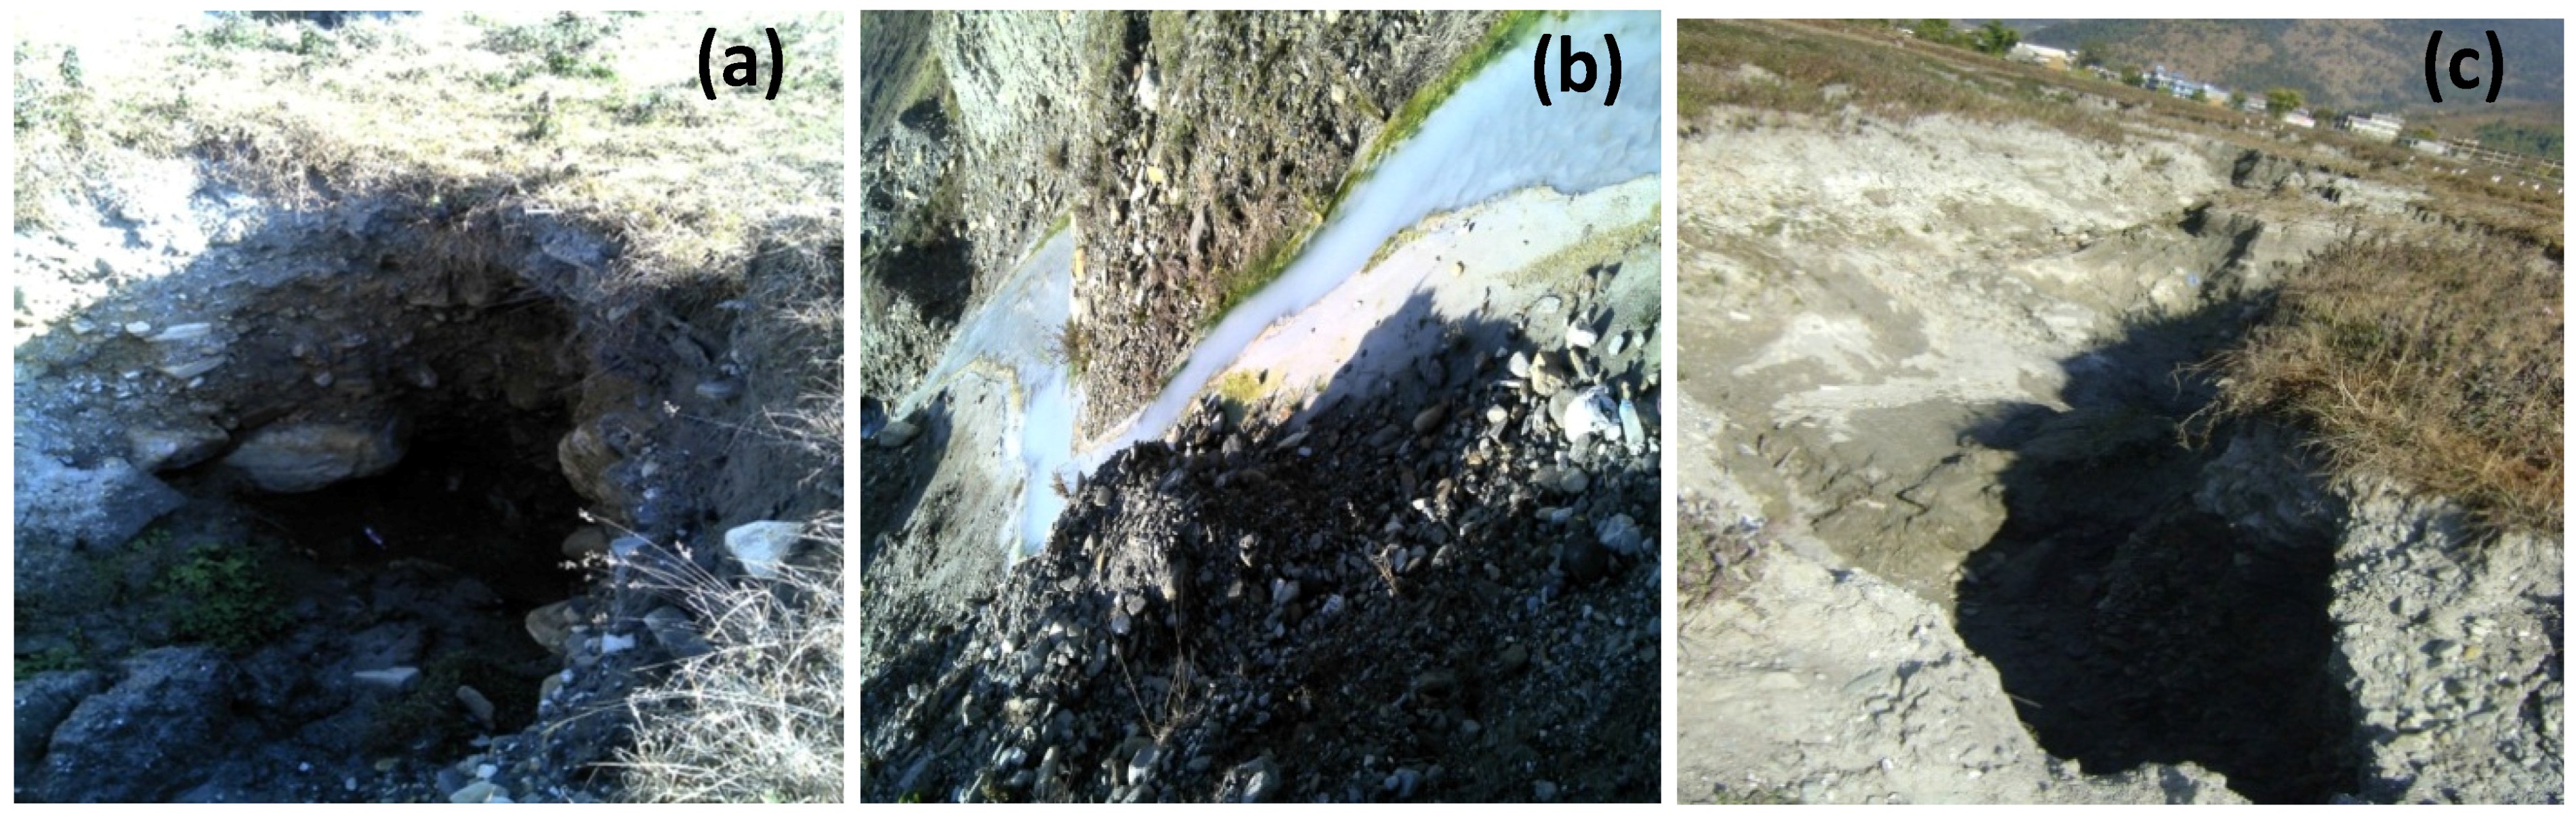
Figure 7). People have been moved from the area due to the threat. Its water flow is recharged through various sources. The flow of water is obstructed on the surface due to the poorly-managed land use practice, and water passes through the gravel layer to the dissolvable lime, resulting in the formation of underground ponds (
Figure 8). This then creates sinkholes, soil subsidence and the flow of lime-mixed water. Consequently, the core city area, named New Road nearby the Pokhara sub-metropolitan City Office and the Phirke Khola Bridge near Ganesh Tol in Parsyang have encountered land collapse.
Mahendra cave, Bat cave and Gupteshwor cave consist of huge boulders and rocks. Thus, the areas of the caves and the settlements and land around are also considered as hazard-susceptible zones. The Seti River, originating from glaciers in the Annapurna range and flows through deep gullies, has been widened broadly in some places. In some places, including the Pokhara metropolis area, it has created deep gorges, where one can only hear the sound of the river flow. People in the metropolis have settled at the edge of the river in the gorge. The unmanaged dense settlements themselves are at risk of disasters, whereas expanding settlements at the edge of the gorge are at risk from a geological perspective, as well.
Table 2.
Sinkhole and land subsidence hazard areas.
Table 2.
Sinkhole and land subsidence hazard areas.
| SN | VDC/Municipality | Location | Potential Hazard |
|---|
| 1 | Armala | Settlement and cultivated area near Kali khola and Jumleti khola meeting place | Sinkhole/land subsidence |
| 2 | Pokhara S.M | Mahendrapul area, Ranipawa area and settlement around | Gorge |
| Phirke Khola Bridge near Ganesh Tol in Parsyang | Sinkhole/land subsidence |
| Mahendra cave, Bat cave and Gupteshwor area | Sinkhole/land subsidence |
| New road nearby the Pokhara Sub-Municipality Office | Sinkhole/land subsidence |
Figure 7.
(a) Google image of 2004, Armala and (b) Google Image of 2014, Armala.
Figure 7.
(a) Google image of 2004, Armala and (b) Google Image of 2014, Armala.
Figure 8.
(a) Sinkhole in the Armala area; (b) Identified watercourse after the sinkhole; (c) Sinkhole in the Armala area, 2014.
Figure 8.
(a) Sinkhole in the Armala area; (b) Identified watercourse after the sinkhole; (c) Sinkhole in the Armala area, 2014.
3.3.2. Floods
The scientific community is well aware that the intensity of flood events, and their potential effects on people, valuables and goods, are directly affected by land use changes in general and increases in the areas of sealed surfaces in particular [
24]. Landslides, floods and mass movement disasters are common phenomena in the Seti watershed, associated with extreme weather events and high precipitation, especially during the summer monsoon period, resulting in excessive river discharge.
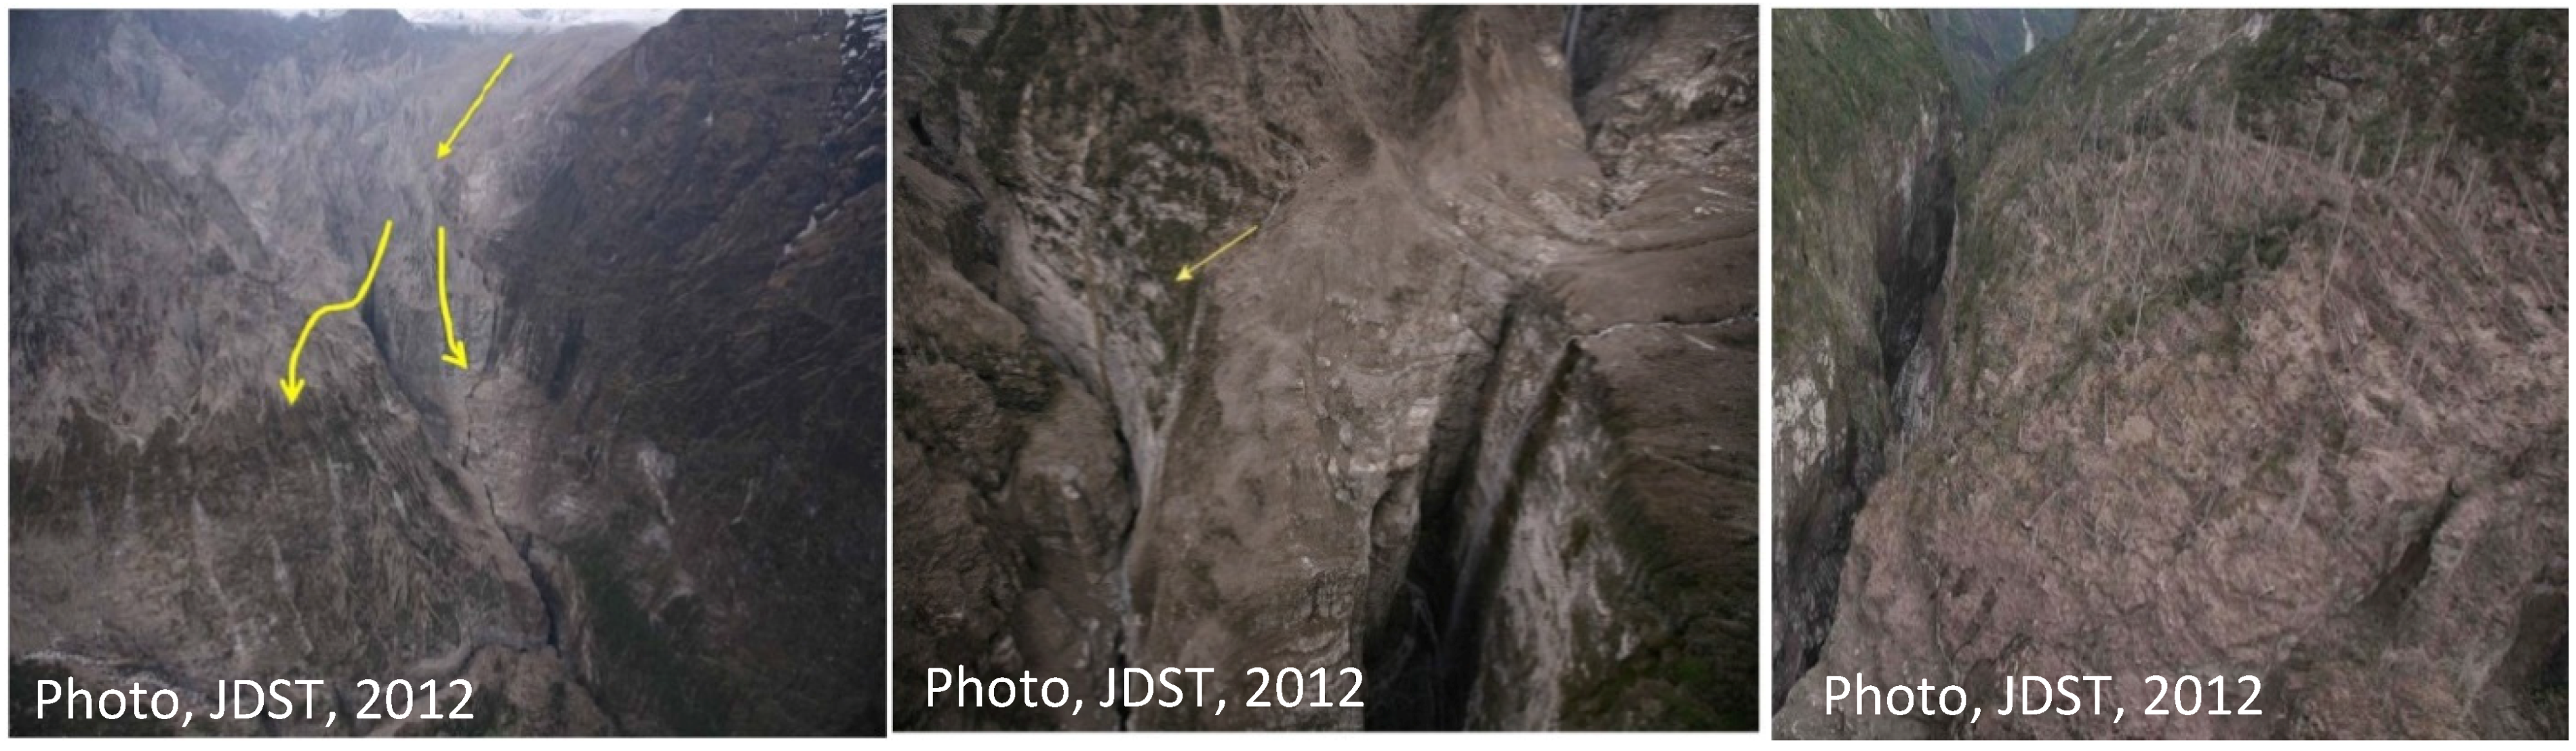
The upper areas of the watershed have experienced several recent avalanches and debris flows, resulting in lake formation, which have then broken through (
Figure 9). When the river carries a large amount of debris, including clay and lime, this challenges the settlements’ banks in the lower parts of the catchment area and the workers in the riverbank. A considerable number of lives and the property of urban dwellers residing in the river banks within the Pokhara sub-metropolitan area are likely to be harshly affected by seasonal and flash floods.
Of note was the massive flash flood on 5 May 2012 of the Seti River, which caused serious damage. The flood swept away several settlements and people working along the Seti River, rupturing river banks downstream, destroying tourist spots along the river and damaging the water supply of Pokhara municipality. Altogether 40 people died, an additional 32 were missing, and 31 families were directly affected by the unprecedented flood [
25]. A total of 20 houses, one public building and two temples were destroyed, whereas 500 meters of road, two suspension bridges and two water supply systems were smashed. The disaster resulted in an economic loss of NRs 85,000,000 [
26].
Figure 9.
Northern part of Pokhara valley, Seti Gorge (Photos were taken by the Japanese Disaster Survey Team, 2012).
Figure 9.
Northern part of Pokhara valley, Seti Gorge (Photos were taken by the Japanese Disaster Survey Team, 2012).
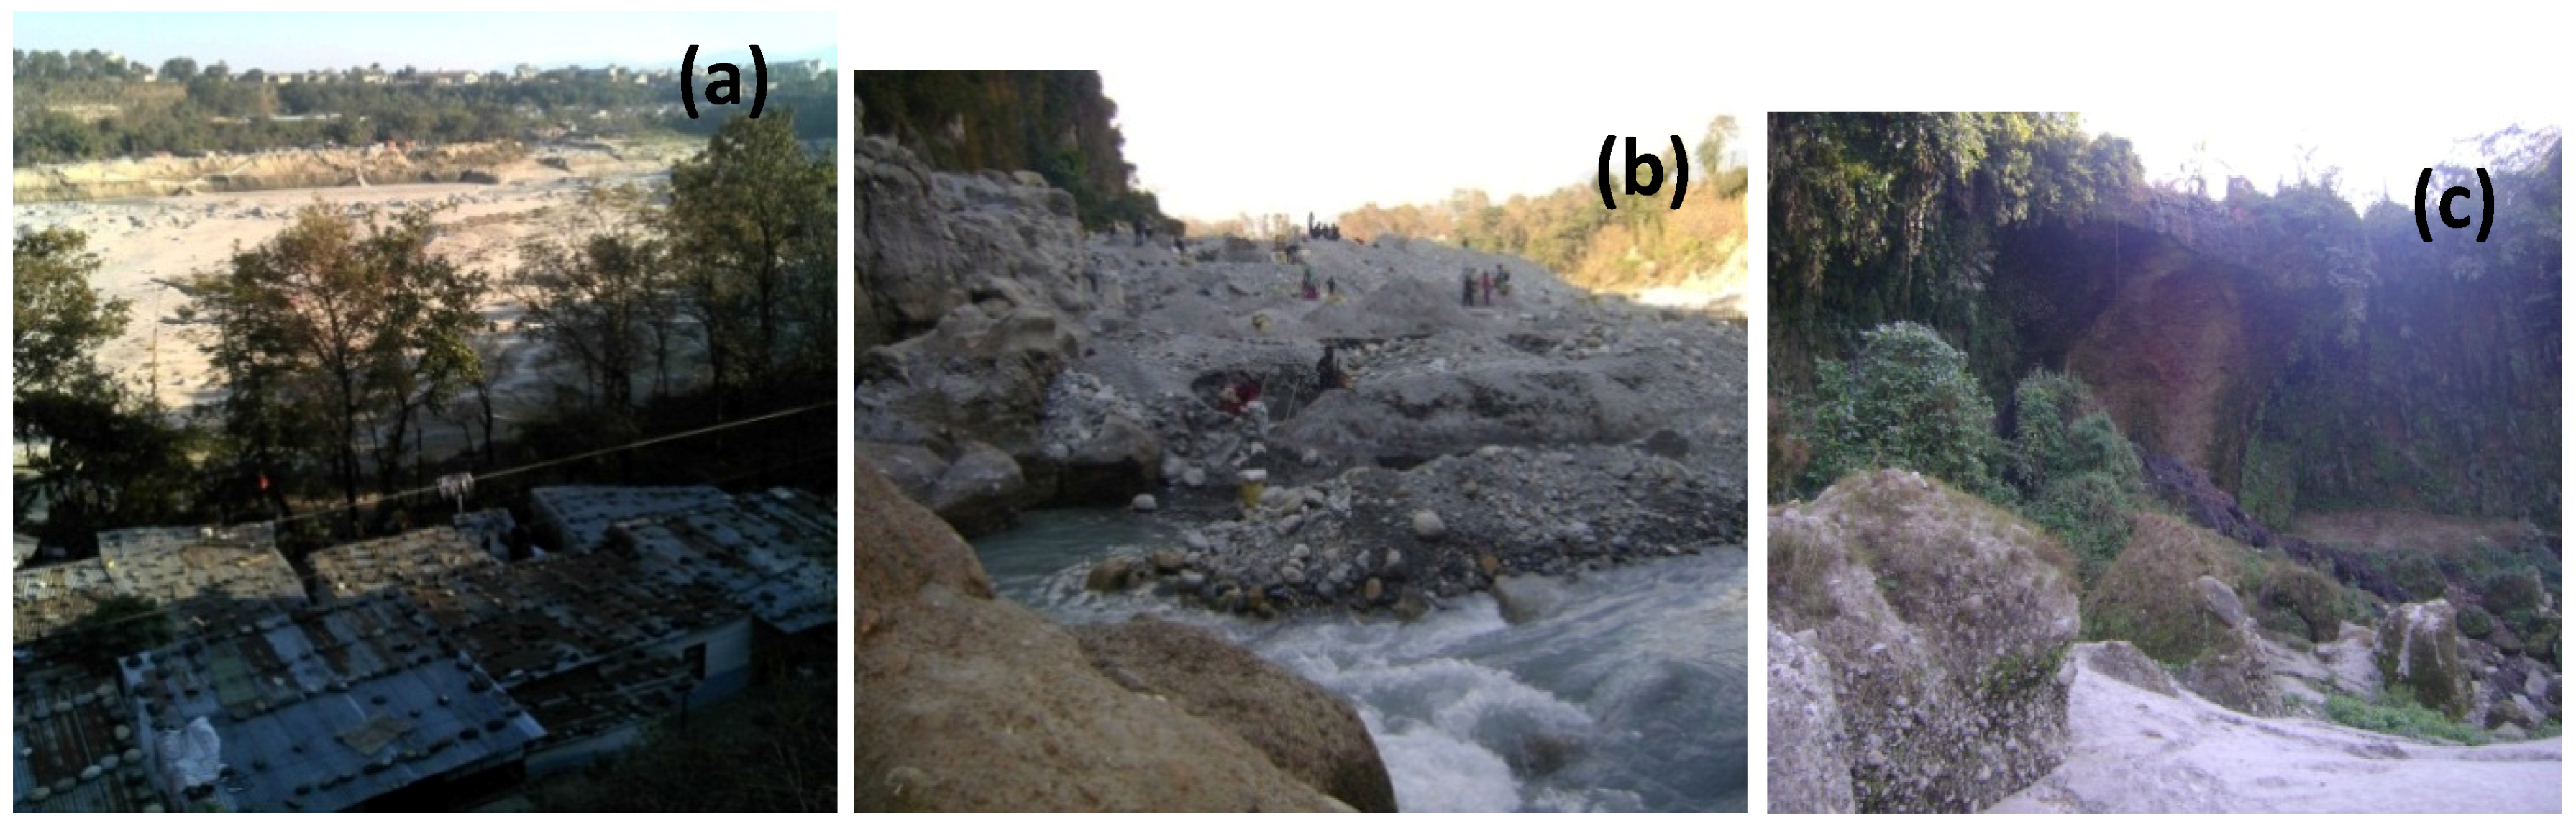
Of the various tributaries of the watershed, it is mainly the Seti River itself that creates the worst effects throughout the year (
Figure 10). The flood in the Bhunge Khola has damaged a wide cultivated field and a few houses situated near the confluence with the Phusre Khola (
Table 3).
Figure 10.
(a) Ramghat, 2014; (b) Nadipur, 2014; (c) Nadipur, 2014.
Figure 10.
(a) Ramghat, 2014; (b) Nadipur, 2014; (c) Nadipur, 2014.
Table 3.
Flood hazard prone areas.
Table 3.
Flood hazard prone areas.
| SN | VDC/Municipality | Location | Potential Hazard |
|---|
| 1 | Arbijaipur | Grass and cultivated land in the bank of Bijaipur khola | Flood |
| Kaseri settlement is mostly near the Bijayapur Khola | Flood |
| 2 | Machhapuchhre | Grassland at the bank of the Seti River and Mangale Khola | Flood |
| Cultivated land with settlement on the bank of the Seti River to the west of Sandal | Flood |
| Cultivated land and settlement area near the meeting point of Bhalaudi Khola and the Seti River | Flood |
| 3 | Ribhan | Cultivated land near Charym settlement | Flood |
| Settlement near Nayapul Dil | Flood |
| 4 | Puranchaur | Grassland and cultivated land of the Seti River | Flood |
| 5 | Pumdibhumdi | Grass and cultivated land of Chhapswara | Flood |
| Cultivated area of Pipaldali on the bank of Phusrekhola | Flood |
| 6 | Nirmalpokhari | Grasslands on the bank of Phusrekhola | Flood |
| Grassland near the Duwar area | Flood |
| 7 | Lahachok | Grassland at the meeting point of Mardi Khola and the Seti River | Flood |
| Grassland, cultivated land and some settlements near the bridge and the bank of Mardi Khola | Flood |
| 8 | Kristi Nachne Chaur | Cultivated land of Dulekhu settlement | Flood |
| Grass and cultivated land to its north | Flood |
| Grass and cultivated land on the bank of Phusrekhola | Flood |
| Cultivated land on the bank of Mausuli khola, Aambote Khola and Bhunge Khola | Flood |
| 9 | Kaskikot | Large settlement and cultivated land on the Kahare Khola bank | Flood |
| Wide cultivated land near the meeting point of Laurek khola | Flood |
| Large cultivated land near Guhetro and Betani khola near Pame | Flood |
| Cultivated land and settlement near Laurek and Harpan Khola | Flood |
| 10 | Kalika | Cultivated land at the southern part of the meeting point of Jantre Khola and Madi Khola | Flood |
| 11 | Dhital | Grass and cultivated land on the bank of Idikhola | Flood |
| 12 | Dhikurpokhari | Cultivated land to the northwest of Bhindabari on the bank of Khahare khola | Flood |
| Cultivated land near Dhadkhola near the Lewade and Niware settlements | Flood |
| 13 | Bharatpokhari | Cultivated land and grass on the bank of Saraudi khola | Flood |
| Grass and settlement of the Chirgadi area | Flood |
| Grass, settlement and cultivated land on the bank of Saraudi Khola | Flood |
| 14 | Sardikhola | Grass near the Yomu settlement | Flood |
| Grass and settlement near Gairakhor of the Sardikhola bank | Flood |
| Cultivated land at the meeting point of Bhurujung khola and the Seti River on the border of Sardikhola VDC and Puranchaur VDC | Flood |
| 15 | Pokhara sub-metropolitan | Grass, settlement and cultivated land of the Seti bank | Flood |
| River bank of Seti at Sitaghat | Flood |
| Settlement of Laltinbazar, Upallodip and Tallo dip | Flood |
| Damside area grass | Flood |
| Grassland on river bank near Manipal Medical College | Flood |
| Seti River bank at Ramghat | Flood |
| Settlement at the edges of the Seti River at Ramghat | Flood |
| Grassland on the bank of the Seti River below Phoolbari and Baraghare | Flood |
| Pragati Tol, Lamtara, Dobilla settlements | Flood |
| Cultivated land and the grass land at the west of the Seti River bank in Dobilla | Flood |
| 16 | Hyangja | Cultivated land and settlement on the bank of Yangdi khola, | Flood |
| Cultivated of Yamdi near the Seti dam | Flood |
| Grassland, cultivated land and settlement above the Lamachaur settlement on the Seti River bank | Flood |
| 17 | Lekhnath municipality | Settlement and grass of the Khudikhola bank and Satmuhane | Flood |
| Bijaipur khola bank towards the northeast part from Bijaipur and Seti meeting point | Flood |
| Grassland and some settlements in the Musetunda area, Tintara | Flood |
| Grassland in the northern and the southern part of Lamiahal area on the Seti River bank | Flood |
| Settlement and grass where Khudi and Gaduwa meet | Flood |
3.3.3. Landslides/Edge Falls
Well-defined erosion fronts are seen in Kabre and below Kuiredanda, both banks of Phusre Khola, between Chhorepatan and Mahatgaunda, Kali Khola, Bhalam Khola, Bijaipur Khola, Mardi Khola, Bhurjung Khola and to the south of Armala and Dihi (
Table 4). The largest landslide of the area was observed between Antighari and Bijaipur in a tributary to the Bijaipur Khola. The next largest landslide area in Jumleti had a width of 75 meters, a length of 100 meters and about a 10–15-meter depth. The landslide on the southwestern slope of Thuloswara caused severe damage to the drinking water pipelines and the cultivated land and was about 200 meters long and 50 meters wide. The landslide on the road between Chhorepatan and the Phusre Khola Bridge occurred about 40 years ago and was 800 meters long and 250 meters wide. The landslide at Bamdi (Chapakot) was about 300 meters long, and the one southwest of Harpan on the south facing slope was 120 meters wide. Meanwhile, the prominent 150 meter-high bare rock cliff is located northwest of Jumleti. Other noticeable bare rock cliffs are located at Mukundpur, Kulpidanda, Tamage, along the Handi Khola, Kristi and Matikhan and northeast of Bijaipur [
15]. Recent incidents of floods and landslides occurred on 29 July 2015. Thirty seven people were killed, and 19 were injured in Lumle, Bhadaure and Dhikurpokhari of Kaski district. Mentioned (
Figure 11) represented the risk area of edge falls.
Table 4.
Landslide and edge fall hazard-prone areas.
Table 4.
Landslide and edge fall hazard-prone areas.
| SN | VDC/Municipality | Location | Potential Hazard |
|---|
| 1 | Lwanghadel | Bhedabari village (Topo map): surrounded by the rivers Idi, Mardi and Pati Khola from its three sides and remains at risk | Landslide |
| Grassland and cultivated areas at the bank of the above 3 rivers | Landslide |
| 2 | Sardikhola | Settlement near Gairakhor on the Sardikhola bank | Edge fall |
| 3 | Pokhara Sub Metropolitan | Large settlement near Sitaghat | Edge fall |
| Settlement of the upper Seti River bank at Nadipur | Landslide/edge fall |
| Seti River bank at Nadipur | Edge fall/flood |
| Sitaghat settlement on the bank of the Seti River | Flood/edge fall |
| Phoolbari and Baraghare area with large grass cover and settlement | Edge fall |
| South of Sitapaila, both sides of the main road, Pragati Tol, Lamtara, Dobilla settlements | Flood/edge fall/land slide |
| Sahara ground, adjoined settlements, cultivated land and grass land to the west of the Seti River bank | Flood/edge fall/land slide |
| Cultivated land to the east of Dobillaghat across the Seti River, Shivalaya area, grassland in Sheepfarm and Bachhi buduwa area | Edge fall |
| Gaukharka grass land on the bank of Bijaypur khola, agricultural land of Kalimati | Edge fall |
| 4 | Lekhnath Municipality | Grassland on the northern and the southern part of Lamiahal area on the Seti River bank | Flood/edge fall |
| Settlement and grass where Khudi and Gaduwa meet | Flood/edge fall |
| 5 | Lahachok | Bank of Mardi River towards the northwest of the Seti and Mardi meeting point | Edge fall |
| 6 | Bharatpokhari | Pudi khola bank towards the northwest part of the Pudi and Seti meeting point | Edge fall |
| 7 | Ghachok | Seti River bank towards the northeast from the meeting of Pallo Khahare and Seti | Edge fall |
| 8 | Dhampus | Wall of Dhad khola | Landslide |
Figure 11.
(a) Nadipur, 2014; (b) Dobilla (both sides), 2014.
Figure 11.
(a) Nadipur, 2014; (b) Dobilla (both sides), 2014.
3.3.4. Fire Hazards
Another high risk in the study area is fire. The municipal area comprises dense settlements with weak infrastructure, unplanned electrical cables and joined buildings. Petrol pumps are either very close or attached to settlements. The city has a very limited fire brigade, and people lack safety measures. Hence, the fire risks are high due to electrical faults, fuel pump explosions or fires during and following earthquakes, which may result in extensive loss of property and lives (
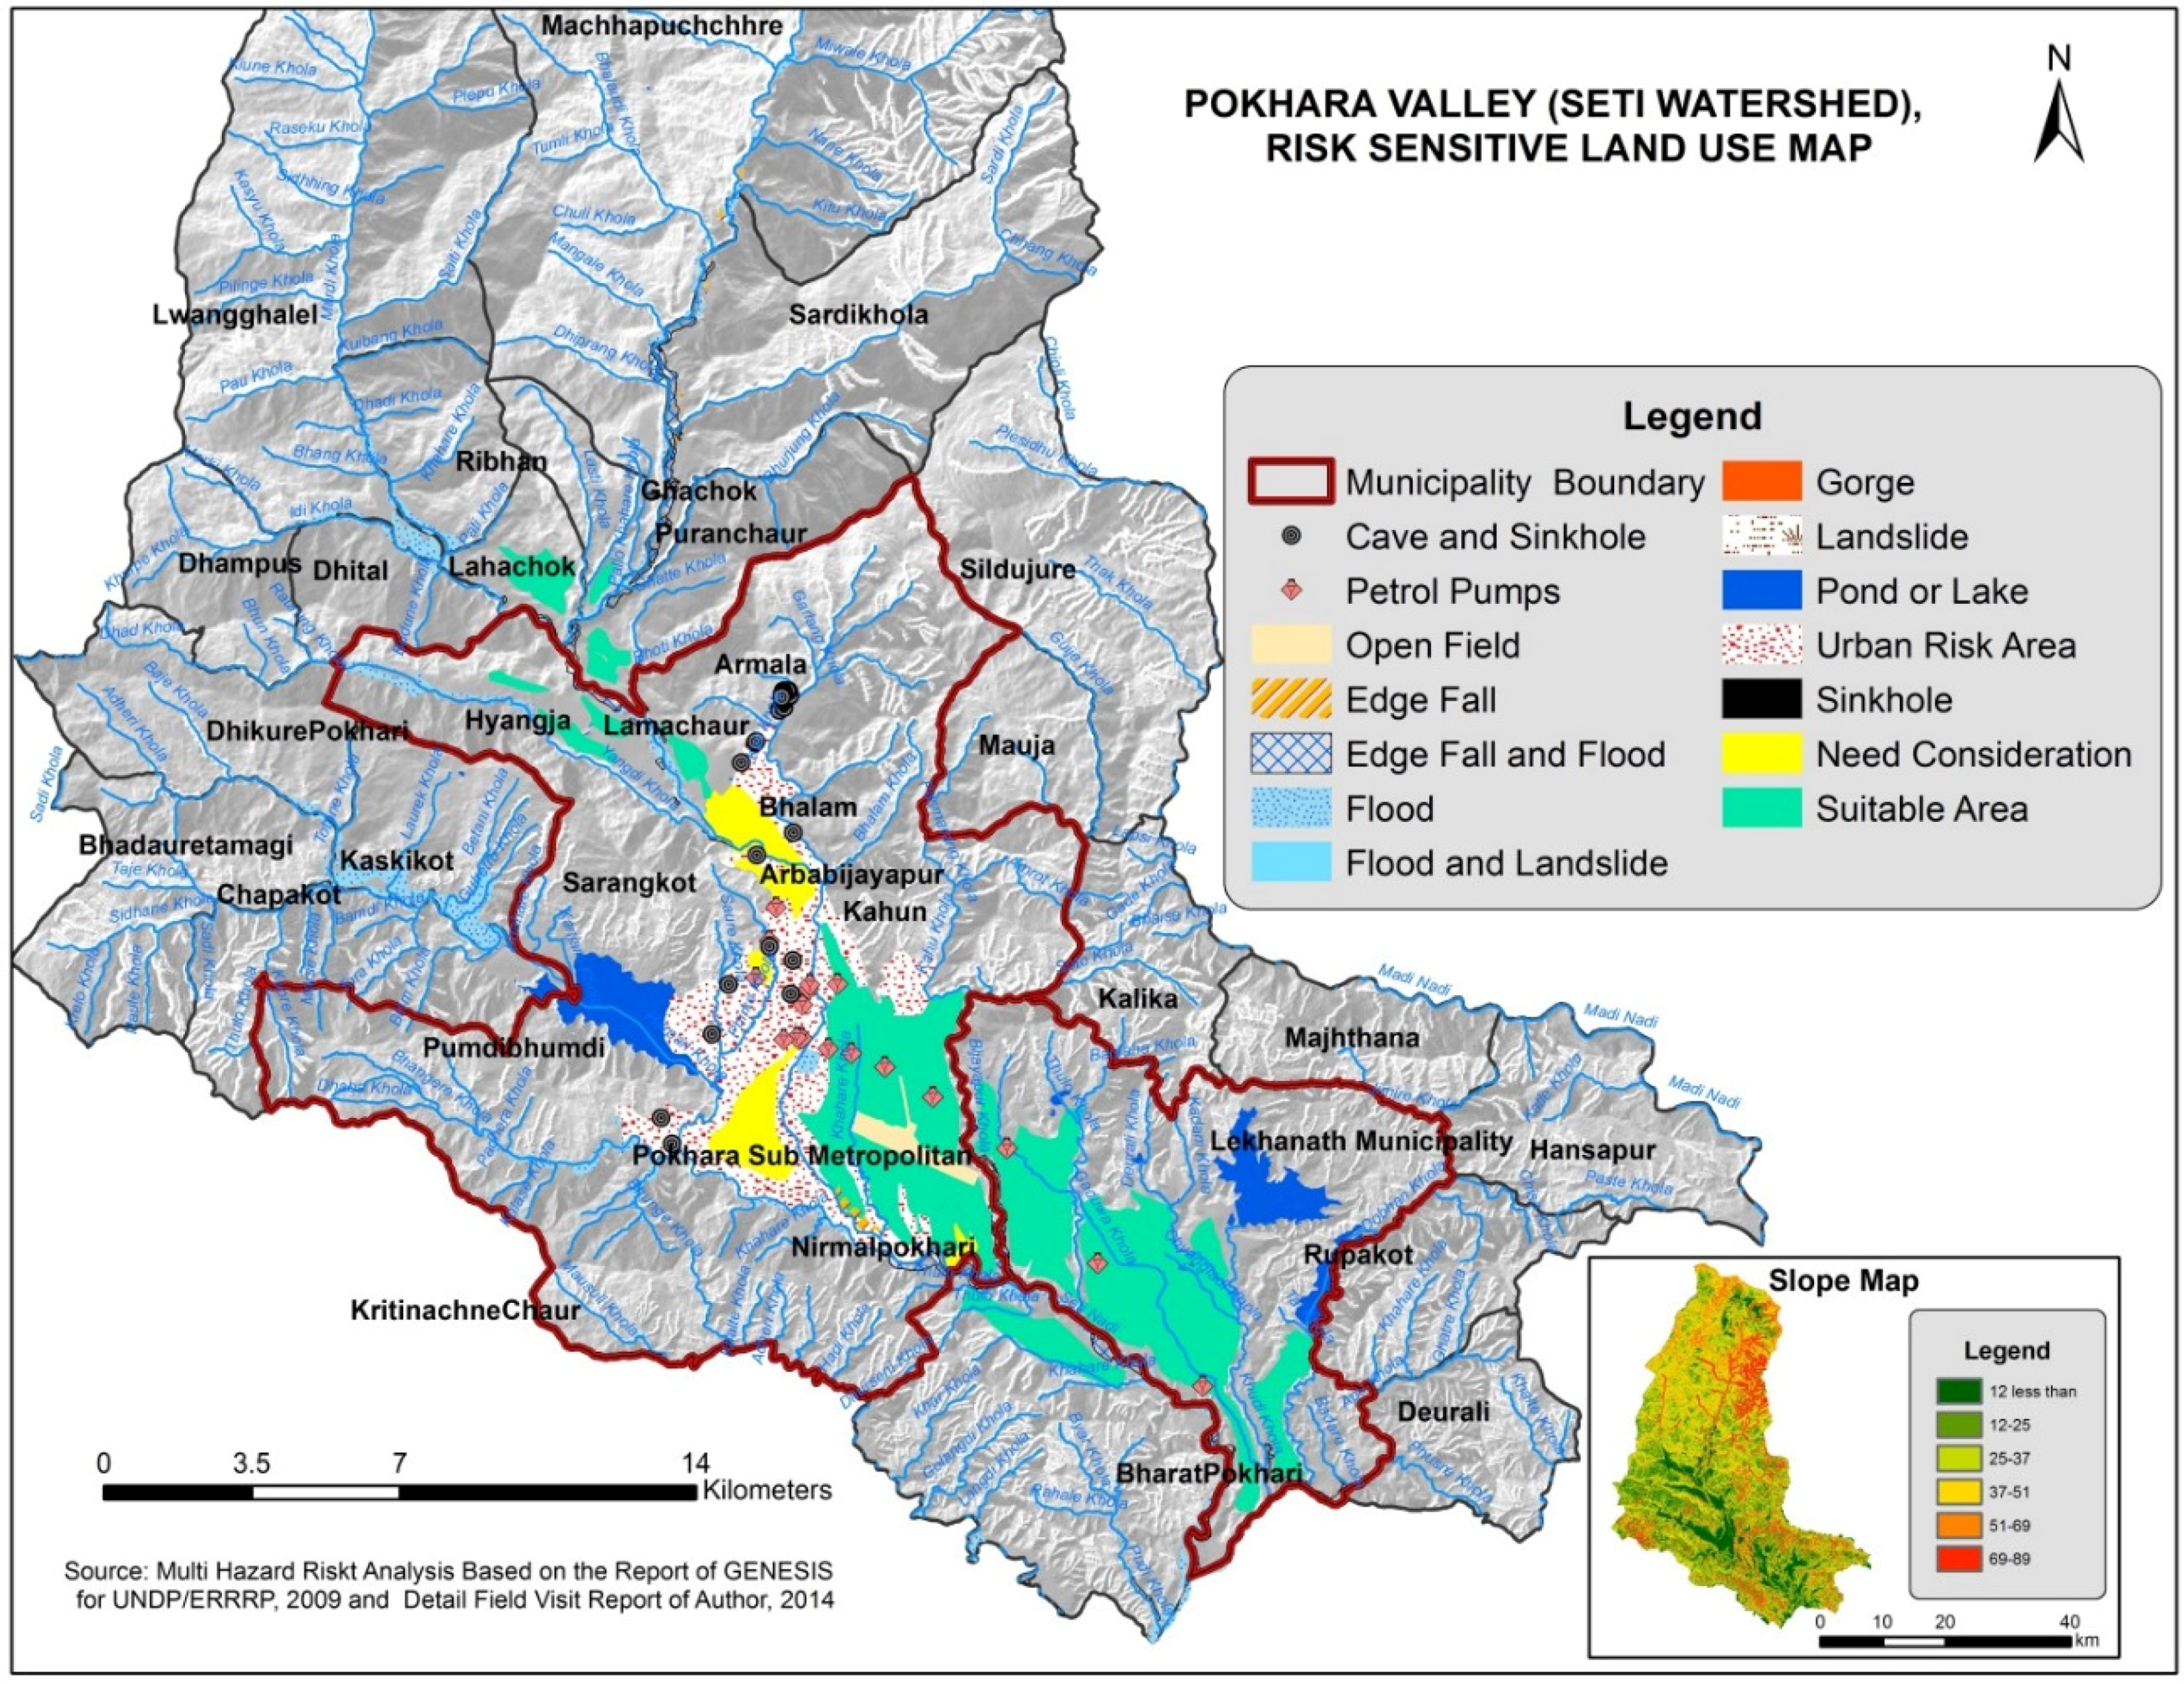
Figure 12).
Figure 12.
Risk sensitivity map.
Figure 12.
Risk sensitivity map.
3.3.5. Earthquakes
The severity of disasters triggered by seismic events is the outcome of the interaction between the geophysical phenomenon and the characteristics of the built environment [
27,
28]. Pokhara sub-metropolitan city can be considered to be moderately vulnerable to earthquakes with a probability of intensity of VIII MMI earthquake in the region. In the sub-metropolitan city area, liquefaction-susceptible zones are found on the banks and tributaries of the Seti River, and some patches of liquefaction susceptible zones are found in the KI Singh Bridge, Laltin Bazar and Kamal Pokhari areas [
21].
According to the preliminary damage report provided by the Pokhara sub-metropolitan office, at least two deaths and as many as 24 injuries resulted from the tremor of 25 April 2015. Altogether, 517 buildings in 17 wards and more than 300 houses and other infrastructure partially collapsed due to the earthquake and the subsequent aftershocks mainly on 12 May. Arwa, Mijure and Purunchaur are the comparatively more affected VDCs. The educational institutions, tourism industry and the normal daily lives of people were severely affected by the earthquake. This earthquake caused more destruction to the eastern part from the epicenter, Barpak VDC, Gorkha, than Pokhara, located to its west.
The dense settlements of Pokhara sub-metropolitan city and Lekhnath municipality are mostly low buildings, and few are built to withstand earthquakes. The location of petrol pumps close to buildings and unsafe electrical cables increase fire risk if earthquakes occur. All of these factors result in a high threat to life and property.
Our land use/land cover analysis has revealed the increase in settlement and built-up areas in disaster-prone areas. It is essential that strategic planning to combat risks is undertaken.
Increase in the size of human population in the region is one of the main reasons for the change in land use and land cover in the study area. Due to rapid population growth, the city areas are increasing in size, and cultivated land and open fields are being converted to urban areas. This results in increased environmental degradation.
The land sales market and business development have played vital roles in increasing the density of settlements. Land value has been rising rapidly in comparison to past decades. There have been no specific measures put in place to fix the value and price of land. There are no standards for infrastructure development, and this is likely to result in considerable destruction and loss of lives and property from potential disasters, such as earthquake, landslide, flood, epidemic diseases and fire. High rise apartments are being constructed without proper building codes and soil tests. The Land Use Policy, 2012, includes scientifically-based standards, and their implementation is urgently needed.
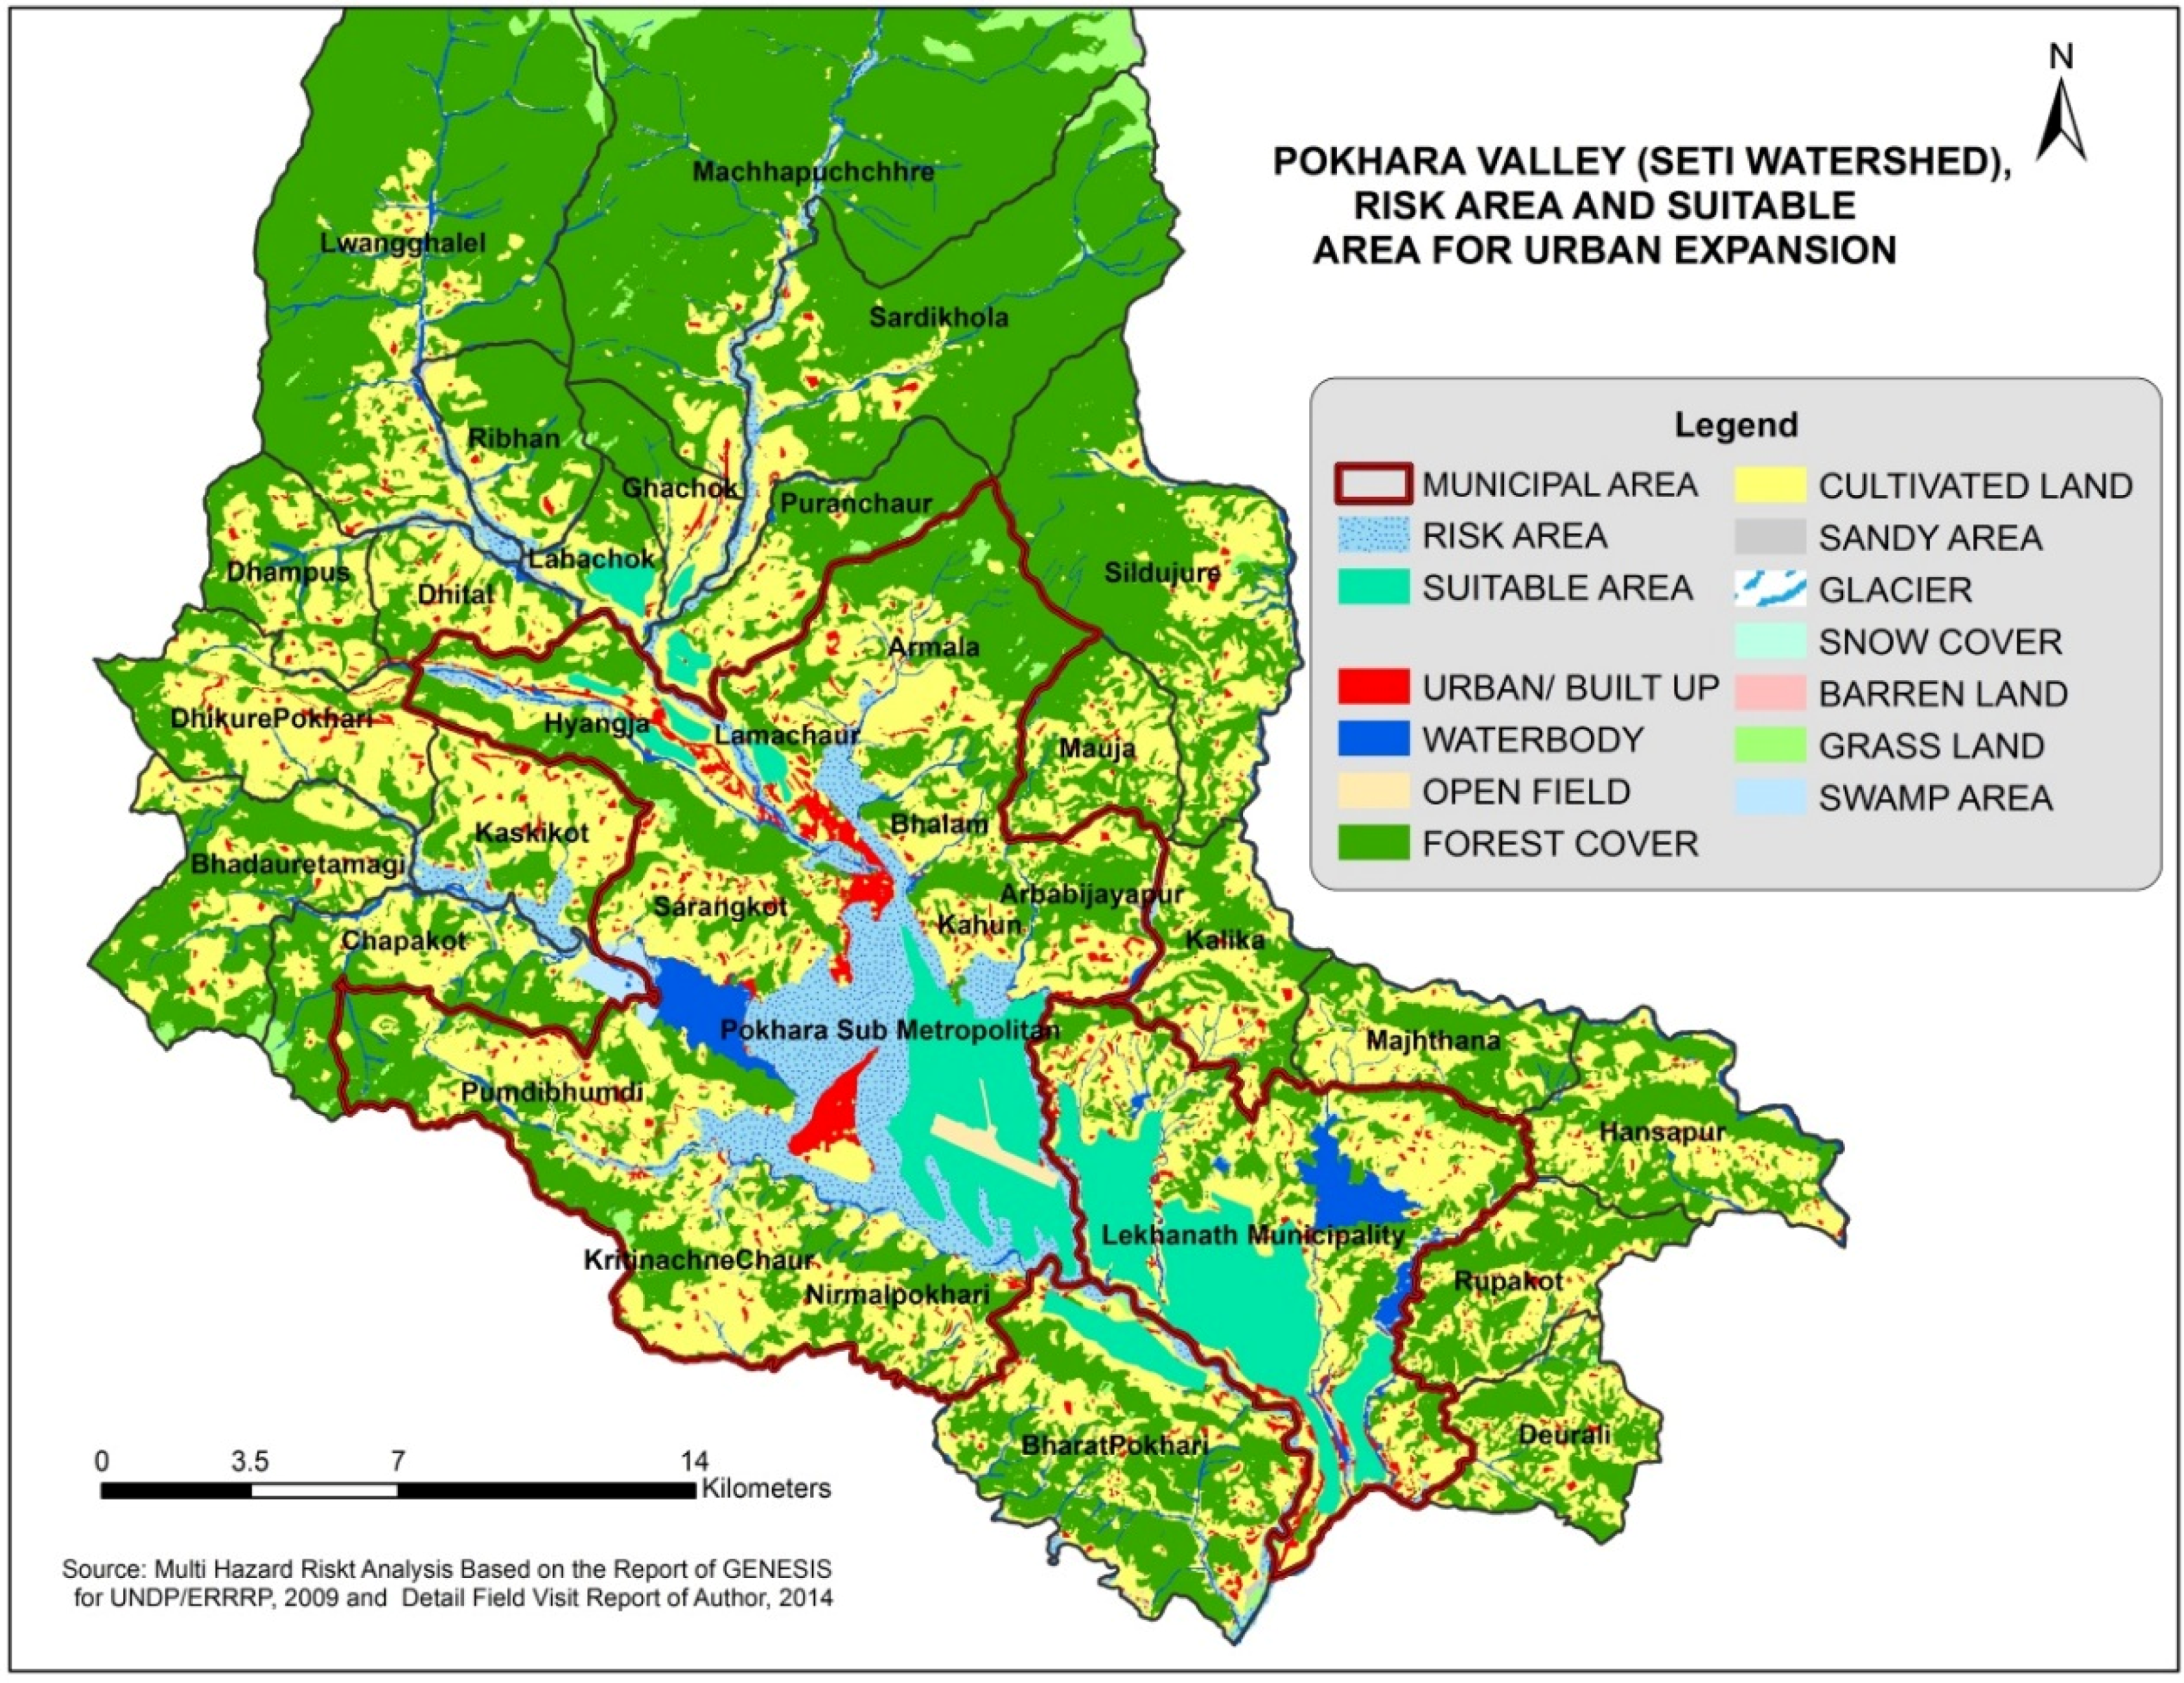
Development and settlement activities should be restricted in those areas that are identified as sensitive to multiple hazards (
Figure 13). To mitigate their vulnerability and the possible damage to life and property, existing settlements at risk should be relocated to safer areas, such as Hemja, Lamachaur, Ghachok, Ghardi khola, Bharatpokhari, Puranuchaur and Lahachok (
Figure 13).
Figure 13.
Map for risk areas and suitable places for urban expansion.
Figure 13.
Map for risk areas and suitable places for urban expansion.
4. Conclusion
Our study has assessed trends in urban growth, land use/land cover change and multiple hazard risk in the Seti watershed within Pokhara valley using an integrated approach, including GIS and remote sensing. Land use/land cover maps for the years 1990 and 2013 were derived using an object-oriented approach, which provided information on the spatio-temporal distribution of the region. According to the land use/land cover analysis, the total 24.03 km² of urban area in 1990 increased to 54.20 km² in 2013. In contrast, 349.63 km² of cultivable land decreased to 320.81 km² in 2013, whilst forest cover experienced a small increase from 470.80 km²–479.41 km² over the same time period. Consequently, the study area has faced rapid demographic changes in two decades.
Large cultivated areas and some settlements at Armala, some city core areas, such as Mahendrapul and Ranipawa, and the periphery of Mahendra cave, Bat cave and Gupteshwar area, along with the new road area, have already witnessed sinkholes, gorges and land subsidence, respectively. The settlements and the landscapes around these areas are at high risk for future disasters. The settlements, cultivable lands and grasslands near the river banks of the Seti River and its tributaries have a high threat of flooding, and the settlements there need to be relocated to safer areas.
Lessons learned from the Pokhara valley study suggest that rapid urban spread and growth has resulted in an increase in impermeable land use, and these areas of high population growth are at severe risk of multiple hazards, such as floods, landslides, edge falls, fire, earthquakes, sinkholes and land subsidence. Disaster risk management would indicate that these settlements at high risk require scientifically-planned relocation.
Finally, disasters hinder development, and development creates new risks by fostering land use change and environmental degradation. In order to reduce the landslide and edge fall problem, sustainable development practices should be adopted. The Initial Environmental Evaluation (IEE), Environmental Impact Assessment (EIA) and Strategic Environmental Assessment (SEA) should be the compulsory prerequisites for any new development projects. Since the regulations adopted in the Land Use Policy, 2012, are scientifically based, their implementation is urgently needed. Nevertheless, some building codes have been implemented in Pokhara city, but these exclude those areas that have been newly annexed to the sub-metropolis. Fixed scientific measures should be strictly adopted in terms of infrastructure development in these newly-developing urban, fringe and rural areas. Geological studies and soil tests should be conducted prior to construction of infrastructure and road standards maintained for road construction. Trained manpower with certified licenses should be used in the construction of infrastructure.
Sustainable hazard mitigation and land use plans should be the distinct priority of the local and the central government for long-term social and economic reasons. Disaster risk management has not explicitly been assimilated in the national, regional and local policies, programs and projects. Therefore, revisiting the policies, programs and projects is necessary.
To minimize development in disaster-prone areas and environmental damage due to urban sprawl, integrated, proactive and strong legislative actions should be implemented.
Restricting development, structures and settlements in hazard-prone areas, relocation of the people to safer areas, developing coping capacity at the community level with awareness about frequent and probable natural hazards and wise land utilization practice should be a priority. The government needs to introduce effective resettlement plans with appropriate livelihood schemes in the course of the relocation of the people from high risk-prone areas.
Since flood risk is the function of hazards, exposure and vulnerability, it is essential to reduce exposure and vulnerability to floods. Predictive watershed management planning identifies the sensitive areas, controls landslides, designates acceptable land uses and specifies overall management targets.
Integration of flood risk management (structural and non-structural measures) in regular urban planning and identification and mapping of flood plains and prone areas, urban, fringe and rural areas at risk is essential.
Institutionally, more attention and investment should be paid to hazard prevention; information sharing, raising awareness, reinforcing preparedness and early warning system development are required.
Retrofitting of existing structures is crucial to make them disaster resilient.
Road standards should be maintained during road construction. Restrictions to steep slope structures/road constructions is essential to prevent landslide and edge fall.
A new compact settlement strategy should be adopted to manage settlement spread.
Soil testing and geological studies are essential before the construction of private and public infrastructure.
Preparing a large-scale topographic map for detailed analysis of the structure and the preparation of comprehensive land use maps, land capability maps, land suitability maps and land zoning maps are needed.
Since disaster management is a fundamental part of development, our results show that it is essential that policy makers, public officials and concerned authorities include multiple hazard risk mitigation in land use plans and policies. Research establishes the links between urban expansions, escalating demography and multiple hazard risk assessment, which assist in modelling the latent impact of future catastrophes and emergency management. It also provides a solid base for the effective management of disasters when they occur and their mitigation.
Acknowledgments
We acknowledge to contributions of the participants in this study (business persons, school teachers, university lecturers and local people) for their invaluable information for the research.
Author Contributions
Bhagawat Rimal had the original idea for the paper, and was took overall responsibility for the study, including data collection and analysis, preparation of figures and finalization of the manuscript. Himlal Baral contributed materials and expertise concerning the study site and the research theme. Nigel Stork carried out the comprehensive revision of the article. Kiran Paudyal contributed to put the research in the local context. Sushila Rijal facilitated the field work activities and drafted the field report. All authors have reviewed and contributed to finalize the manuscript. In addition, all authors approved the final manuscript.
Conflicts of Interest
The authors declare no conflict of interest.
References
- Batuk, F.; Şengezer, B.; Emem, O. Relations between disaster management, urban planning and NSDI. Int. Arch. Photogramm. Remote Sens. Spat. Inf. Sci. 2008, 37, 441–444. [Google Scholar]
- GPRB (Government of the People’s Republic of Bangladesh). National Plan for Disaster Management 2010–2015; Disaster Management Bureau Disaster Management & Relief Division, Government of the People’s Republic of Bangladesh: Bangladesh, 2010.
- UNISDR (United Nations International Strategy for Disaster Reduction). Disaster Statistic 1995–2005; UNISDR: Geneva, Switzerland, 2006. [Google Scholar]
- Wamsler, C. Managing Urban Disaster Risk, Analysis and Adaptation Frameworks for Integrated Settlement Development Programming for the Urban Poor. Ph.D. Thesis, The Housing Development & Management (HDM), Architecture and Built Environment Lund University, Lund, Sweden, 2007. [Google Scholar]
- UNDP (United Nations Development Programme). Urban Risk Management; UNDP: New York, NY, USA, 2010. [Google Scholar]
- Thapa, R.B. Spatial Process of Urbanization in Kathmandu Valley, Nepal. Ph.D. Thesis, The Graduate School of Life and Environmental Sciences, The University of Tsukuba, Tsukuba, Japan, 2009. [Google Scholar]
- Li, X.; Anthony, G. Modeling sustainable urban development by the integration of constrained cellular automata and GIS. Int. J. Geogr. Inf. Sci. 2000, 14, 131–152. [Google Scholar] [CrossRef]
- Rimal, B. Urban Development and Land Use Change of Main Nepalese Cities. Ph.D. Thesis, The Faculty of Earth Science and Environmental Management, University of Wroclaw, Wroclaw, Poland, 2011. [Google Scholar]
- Rimal, B. Urban Landscape Dynamics of Nepal; Everest Geoscience Information Service Center: Kathmandu, Nepal, 2012. [Google Scholar]
- FAO/UNEP (Food and Agriculture Organization/United Nations Environment Programme). Negotiating a Sustainable Future for Land, Structural and Institutional Guidelines for Land Resources Management in the 21st Century; FAO: Rome, Italy, 1997. [Google Scholar]
- MoHA (Ministry of Home Affairs). Nepal Disaster Report; Ministry of Home Affairs, Government of Nepal: Nepal, 2011.
- Yamanaka, H.; Yoshida, M.; Arita, K. Terrace landform and Quaternary deposit around Pokhara Valley, central Nepal. J. Nepal Geol. Soc. 1982, 2, 95–112. [Google Scholar]
- Gautam, P.; Panta, S.R.; Ando, H. Mapping of subsurface karst structure with gamma ray and electrical resistivity profiles: A case study from Pokhara valley, central Nepal. J. Appl. Geophys. 2000, 45, 97–110. [Google Scholar] [CrossRef]
- CBS (Central Bureau of Statistics). Environment Statistics of Nepal and Nepal Population Report; National Planning Commission Secretariat; 2011. [Google Scholar]
- Nepal Environmental and Scientific Services (NESS). Environmental Survey for Upgrading Feasibility Study on Upper Seti (Damauli) Storage Hydroelectric Project for Nepal Electricity Authority (NEA); NESS: Kathmandu, Nepal, 2001. [Google Scholar]
- Anderson, J.R.; Hardy, E.E.; Roach, J.T.; Witmer, R.E. A Land Use and Land Cover Classification System for Use with Remote Sensor Data; United States Government Printing Office: Washington, DC, USA, 1976. [Google Scholar]
- Gurung, H.B. Pokhara Valley, Nepal Himalaya: A Field Study in Regional Geography; University of Edinburgh: Edinburgh, UK, 1965. [Google Scholar]
- Poudel, K.R. Urban growth and land use change in the Himalaya Region: A case study of Pokhara sub metropolitan city, Nepal. GIS Ostrava 2008, 27, 1–11. [Google Scholar]
- Rimal, B. Urbanization and the decline of agricultural land in Pokhara sub metropolitan city, Nepal. J. Agric. Sci. 2013, 5, 54–65. [Google Scholar] [CrossRef]
- Pokharel, R.P. Vulnerable land in Pokhara city and its use potentiality. Himal. Geogr. 2013, 8, 51–58. [Google Scholar]
- Genesis Consultancy Pvt. Ltd. Report on Impact of Settlement Pattern, LandUse Practice and Options in High Risk Areas, Pokhara Sub-Metropolitan City; Report for UNDP/ERRRP; 2009. [Google Scholar]
- Genesis Consultancy Pvt. Ltd. Report on Impact of Settlement Pattern, Land Use Practice and Options in High Risk Areas, Pokhara Sub-Metropolitan City; Revised Report for UNDP/ERRRP; 2010. [Google Scholar]
- Koirala, A.; Rimal, L.N.; Sikrikar, S.M.; Pradhananga, U.B. Engineering and environmental geological map of Pokhara valley (1:50000). Department of Mines and Geology in cooperation with BGR: Kathmandu, Nepal; Hannover, Germany, 1996. [Google Scholar]
- Ebert, A.; Welz, J.; Heinrichs, D.; Krellenberg, K.; HansJürgens, B. Socio-environmental change and flood risks: The case of Santiago de Chile. Erdkunde 2010, 64, 303–313. [Google Scholar] [CrossRef]
- MoHA (Ministry of Home Affairs). Nepal Disaster Report; Ministry of Home Affairs and DPNet-Nepal: Kathmandu, Nepal, 2013.
- JDST (The Japanese Disaster Survey Team). Survey Report on Seti River Flood, Nepal 2012; Available online: http://www.sff.or.jp/nepal/osirase/ (accessed on 2 Feburary 2015).
- Hewitt, K. Regions of Risk: A Geographical Introduction to Disasters; Addison Wesley Longmann: Essex, UK, 1997. [Google Scholar]
- Martins, V.N.; Cabral, P.; Silva, D.S. Urban modelling for seismic prone areas: The case study of Vila Franca do Campo (Azores Archipelago, Portugal). Nat. Hazards Earth Syst. Sci. 2012, 12, 2731–2741. [Google Scholar] [CrossRef]
© 2015 by the authors; licensee MDPI, Basel, Switzerland. This article is an open access article distributed under the terms and conditions of the Creative Commons Attribution license (http://creativecommons.org/licenses/by/4.0/).


