Article

Built-up Area Change Analysis in Hanoi Using Support Vector Machine Classification of Landsat Multi-Temporal Image Stacks and Population Data

1
East-West Center, 1601 East-West Road, Honolulu, HI 96848, USA
2
Department of Natural Resources and Environmental Management, University of Hawaii, 1901 East-West Road, Honolulu, HI 96822, USA
*
Author to whom correspondence should be addressed.
Land 2015, 4(4), 1213-1231; https://doi.org/10.3390/land4041213
Submission received: 28 July 2015 / Revised: 6 December 2015 / Accepted: 10 December 2015 / Published: 17 December 2015

Abstract

:
In 1986, the Government of Vietnam implemented free market reforms known as Doi Moi (renovation) that provided private ownership of farms and companies, and encouraged deregulation and foreign investment. Since then, the economy of Vietnam has achieved rapid growth in agricultural and industrial production, construction and housing, and exports and foreign investments, each of which have resulted in momentous landscape transformations. One of the most evident changes is urbanization and an accompanying loss of agricultural lands and open spaces. These rapid changes pose enormous challenges for local populations as well as planning authorities. Accurate and timely data on changes in built-up urban environments are essential for supporting sound urban development. In this study, we applied the Support Vector Machine classification (SVM) to multi-temporal stacks of Landsat Thematic Mapper (TM) and Enhanced Thematic Mapper Plus (ETM+) images from 1993 to 2010 to quantify changes in built-up areas. The SVM classification algorithm produced a highly accurate map of land cover change with an overall accuracy of 95%. The study showed that most urban expansion occurred in the periods 2001–2006 and 2006–2010. The analysis was strengthened by the incorporation of population and other socio-economic data. This study provides state authorities a means to examine correlations between urban growth, spatial expansion, and other socio-economic factors in order to not only assess patterns of urban growth but also become aware of potential environmental, social, and economic problems.

1. Introduction

Massive urbanization began to accelerate in Asia in the 1980s and is expected to continue over the next several decades. Because Asia is highly populous and has experienced sustained economic growth since the 1980s, its urbanization has given birth to some of the largest and densest cities in the world [1]. Vietnam, one of Southeast Asia’s economic dragons [2], is experiencing one of the greatest urban transitions in the world. At the national level, the urban population increased from 23.7% in 1999 to 29.6% in 2009 (with 25.4 million urban residents out of the country’s 85.8 million people) [3]. The urban population continues to grow at an unprecedented rate and is projected to increase by 45% by 2020, which translates to more than 30 million urban residents [4].
This remarkable achievement has been largely attributed to the ‘Doi Moi’ or ‘renovation’ reforms program initiated in 1986, which introduced liberal market mechanisms encouraging private-sector initiatives while retaining the state’s role as the nation’s strategic planner and enforcer [5]. The introduction of the ‘Doi Moi’ policy in 1986 was a turning point in the economic transformation of Hanoi. The GDP of Hanoi increased 11 times in the period between 1985 and 2000 and 3 times between 2000 and 2008 [6]. The city’s poverty rate decreased sharply from 63% in 1993 to 3% in 2010, and a 2% poverty rate target has been set for 2015 [7]. The GDP of the Hanoi industrial sector grew approximately 15% per year between 1996 and 2000, while the GDP of the agriculture sector decreased from 5% in 1996 to 4% in 2000 [8]. A stable economic growth of 7 to 8% per year between 2000 and 2010 and rapidly growing foreign investments have led to growing demands for land for housing, offices, manufacturing industries, and a booming real estate sector [9].
Besides ‘Doi Moi’ other national policies have also influenced the urban expansion. During the 1990s, large-scale conversion of agricultural land to urban land was tightly restricted and controlled by the state, requiring approval from the Ministry of Natural Resources and Environment. At the beginning of the 2000s, the state relaxed its power on the management of these lands and, in 2006, decentralized the land management to provincial and municipal governments [6]. In the late 1990s, the central government ratified a general urban development plan for 2020 with the goal of fostering economic development (Decision 10/1998/QD-TTg). These policies have promoted the conversion of agricultural to urban land uses and stimulated a real estate market boom across Hanoi.
Rapid urbanization almost always involves wrenching social adjustment as agricultural communities are forced to adjust rapidly to industrial ways of life, and the large-scale in-migration of young people, usually from poor regions, creates enormous demand and expectations for community and social services. Environmental stresses in rapidly urbanizing areas are also significant due to the patchy nature of newer settlements, pollution from a variety of industrial and residential sources as well as motorization, and inadequate public-sector financial resources to cope with the rapid development [10].
Although much is known about Hanoi’s socio-economic achievements since Doi Moi, the effects of these changes on land cover (transition from agriculture to built-up land) have not been well documented or updated. While numerous studies (Pham and Yamaguchi [11,12]; Pham et al. [13]; Duong et al. [14]; Schneider and Woodcock [15]; Duan and Shibayama [16]; Castrence et al. [17]) have focused on developing methods for mapping the spatial expansion of built-up areas around Hanoi, they have not examined the relationships between changes in land cover and socio-economic variables. Recently, Saksena et al. [18] has used data from Vietnam’s national population and agricultural censuses to classify local government administrative units (communes) according to their degree of urbanicity. Census data provides insights into the socio-economic characteristics of places undergoing the rural-to-urban transition or the interaction of rural and urban activities, while remotely sensed data provides insights into the biophysical manifestations (i.e., land use and land cover changes) associated with such transitions and interactions. Both census data and remotely sensed data can be used independently to map the urban transition but can perhaps provide the greatest insights on change when used together. This study seeks to provide a comprehensive understanding of urban expansion around Hanoi using multi-temporal image stacks developed from freely-available Landsat Thematic Mapper (TM) and Enhanced Thematic Mapper Plus (ETM+) data from 1993 to 2010, and population data from the 1999 and 2009 Vietnam Population and Housing Censuses.
The paper’s objectives are twofold. First, we seek to determine how patterns of urban expansion have shifted over the last two decades, and where and when the new land development occurred. Second, we seek to determine how changes in urban development compare to changes in population distribution across the region at the commune level. To address these questions, we investigate the pattern and form of urban growth and expansion in the greater Hanoi metropolitan region by using Landsat data to map built-up areas that existed before 1993 and that occurred during three time periods (1993–2001, 2001–2006, 2006–2012), and by subsequently connecting these changes to population estimates at the commune level. We draw on work by Saksena et al. [18] that classified communes according to their urbanicity. The paper concludes with a discussion of possible drivers and implications of the urban spatial patterns in the region.

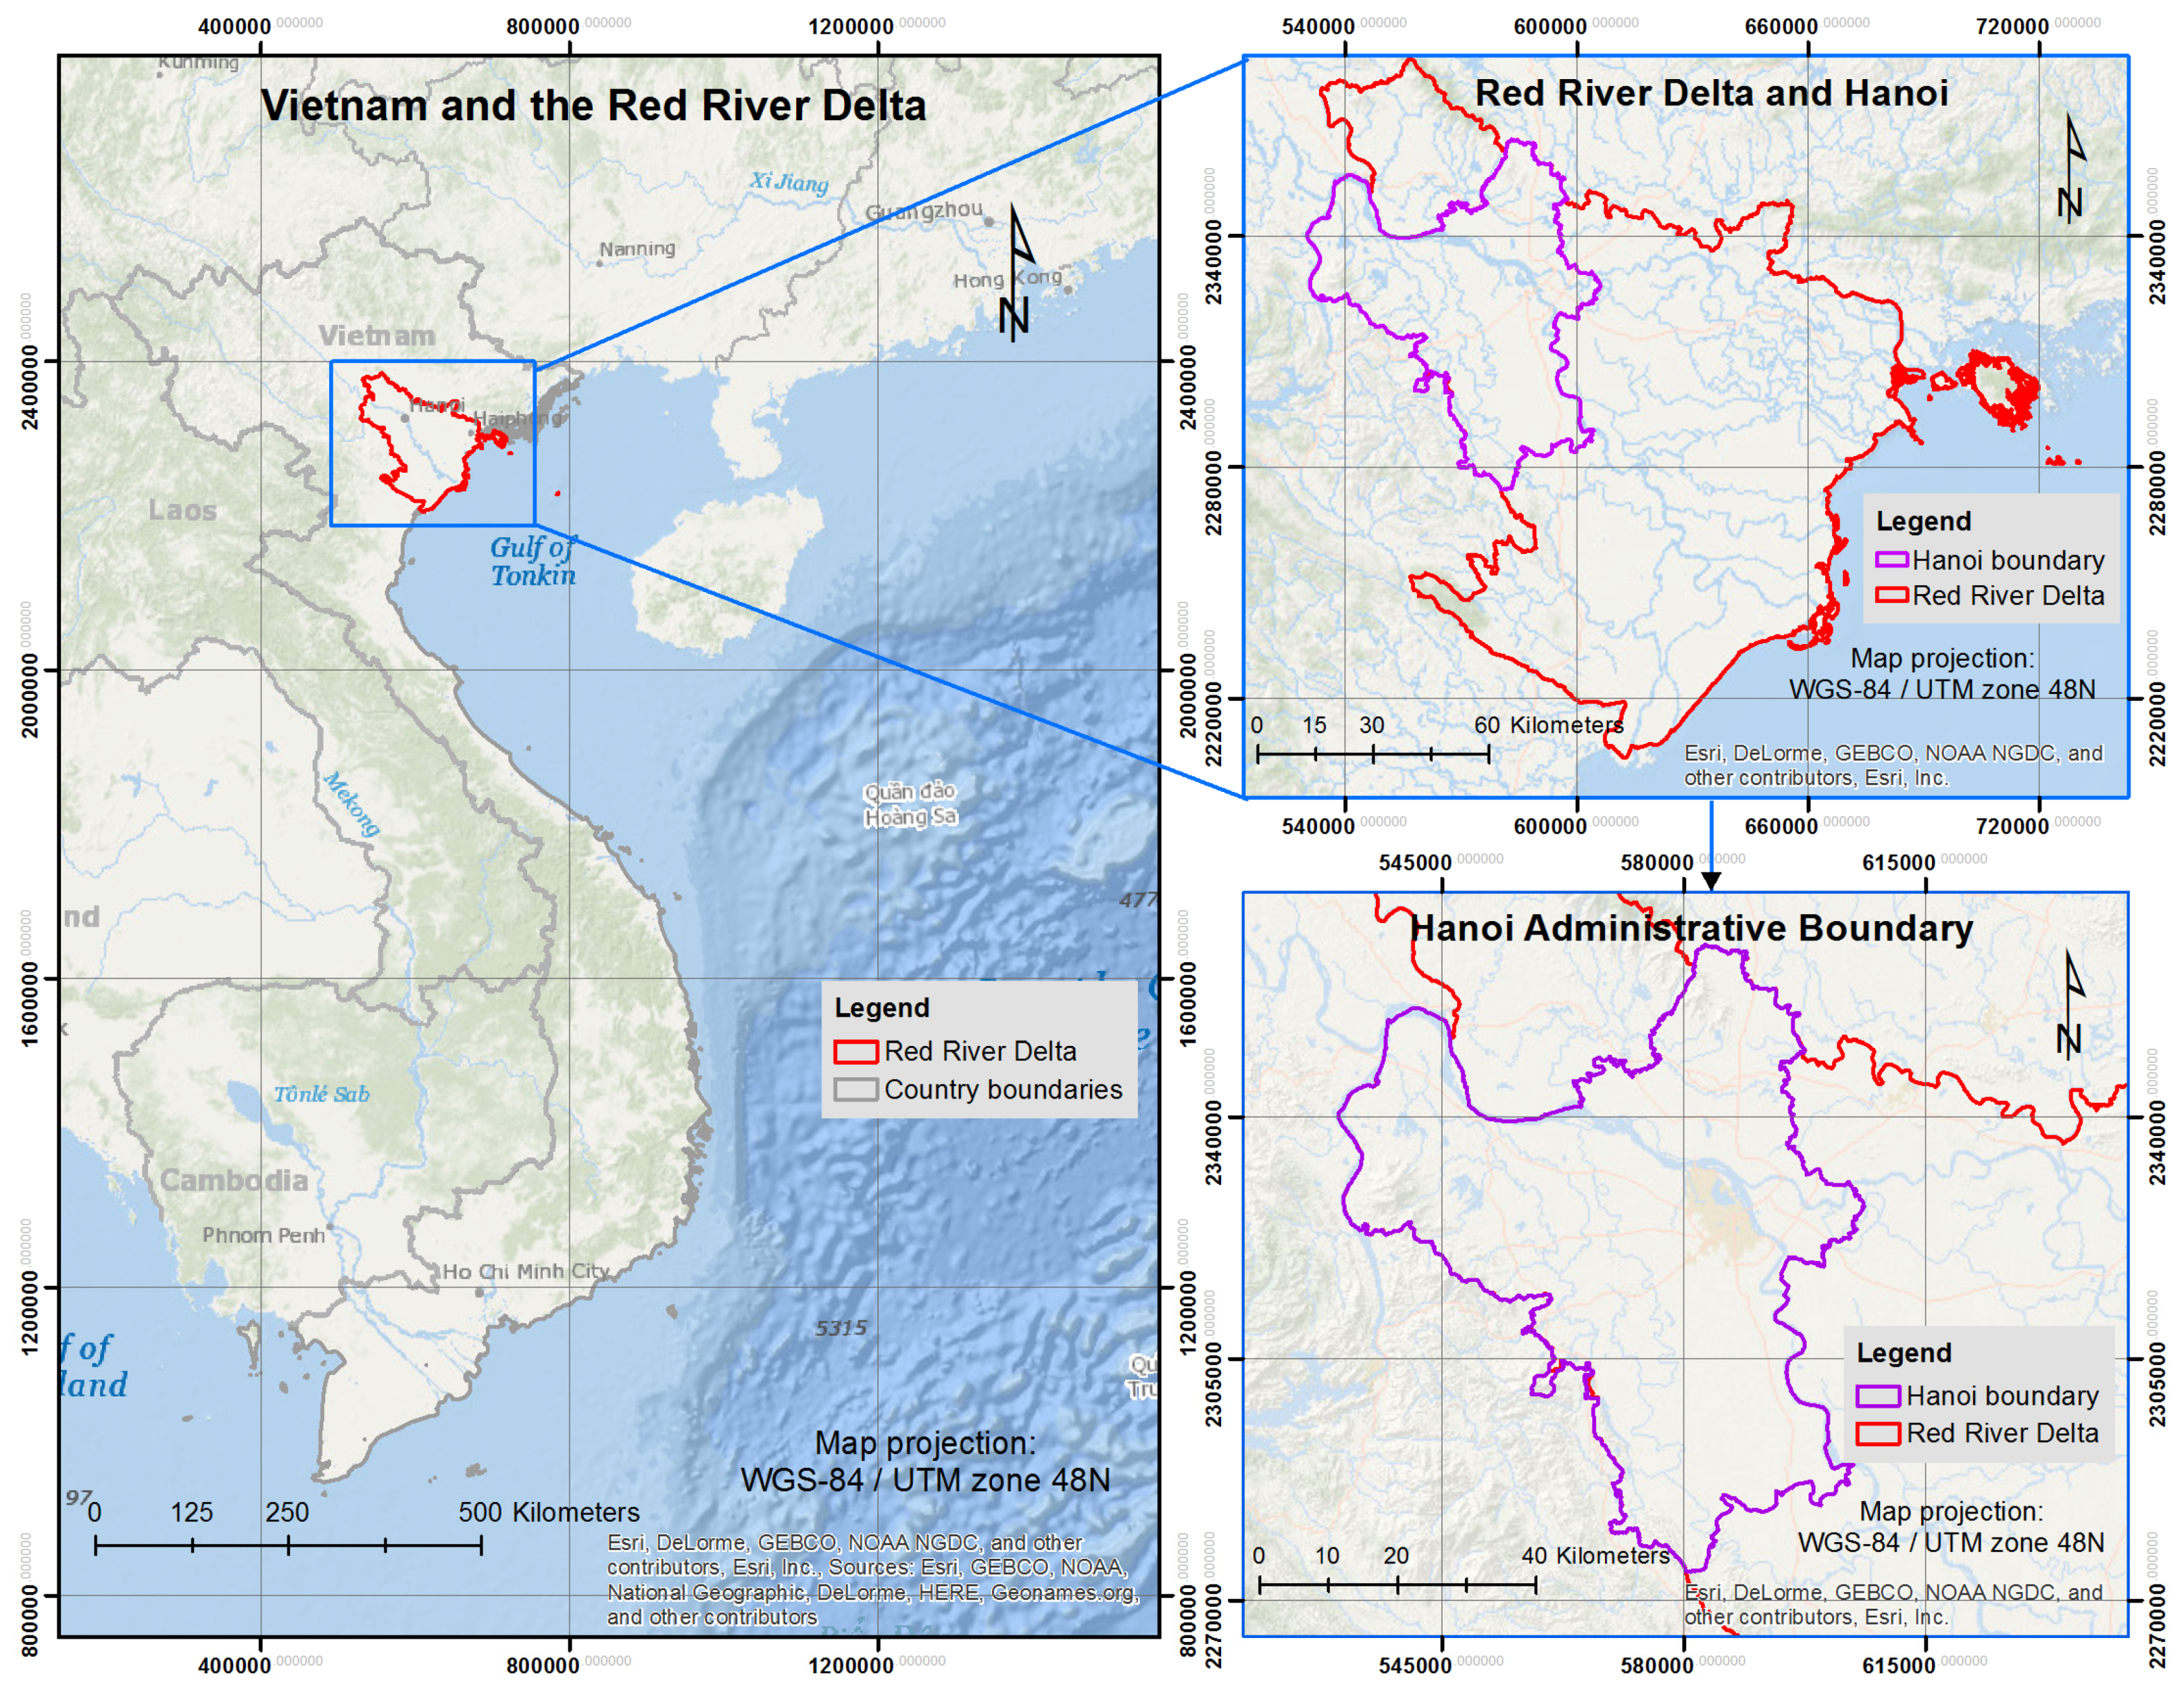
2. Historical Overview of the Study Area

Hanoi, the capital city, is located in the heart of the Red River Delta at 21.03N and 105.85E (Figure 1). It is one of the oldest cities in the country and has been inhabited for millennia. King Minh Mang named the city Hanoi in 1831; in 1888, French colonialist established Hanoi City; in 1945, Hanoi became the Capital of the Democratic Republic of Vietnam; and, in 1954, Hanoi was liberated from the French Colonial Regime [19]. By then, the city had an administrative area of 152 km2 [20]. By 1960, it had expanded to 586.13 km2, and to 2123 km2 by 1978, but shrank to only 913.8 km2 by 1998 [19]. In 2008, the administrative boundaries of Hanoi were adjusted to include the neighboring province of Ha Tay as well as a number of districts and communes that formerly belonged to the provinces of Vinh Phuc and Hoa Binh. Today, the capital has an area of 3,300 km2, 3.6 times its previous size [6]. In doing so, Hanoi absorbed wide areas of agricultural land that now constitute two-thirds of its area. Recent expansion also resulted in a doubling of the city population from 3.4 to 6.4 million inhabitants. Hanoi’s population is smaller than HCMC’s, 6.8 million people, but far larger than the next largest cities, Hai Phong (1.8 million) and Da Nang (822,000). Hanoi’s population density has reached an average of 1926 persons per km2 [21].
Figure 1. Map of the study area.
Land 04 01213 g001
In 2008, Hanoi’s economy was based on services (52.17%), industry-construction (41.28%), and agriculture-forestry-fishery (6.55%). Foreign Direct Investment (FDI) plays a vital role in Hanoi’s economic growth. In the first half of 2014, Hanoi attracted US$583 million in FDI, of which more than 40% was invested in manufacturing and processing industries [22]. The inflow of FDI has promoted rapid urbanization and industrialization concentrated primarily around the city. Large tracts of agricultural land have been reserved for industrial and urban development projects. According to Hanoi’s 2000–2010 land-use plan, about 11,000 hectares of land, mostly annual crop land, were taken for 1736 projects causing the loss of jobs for 150,000 farmers [23]. Among nine economic regions in Vietnam, the Red River Delta is the only region that showed a net loss of agricultural employment between 1999 and 2009 [5]. The rapid urbanization and loss of agricultural land in the Red River Delta challenge the government’s ability to manage the rural-urban transition effectively.
In response to this challenge, government authorities developed an urban development model referred to as ‘Khu Do Thi Moi’ (KDTM) or ‘New Urban Areas’ (NUA). By 2010, the Hanoi Department of Construction reported that there were 152 NUAs covering an area of 44,406 ha, with projected inhabitants of 2 million people. The NUA model was intended to meet the demands of the city’s growing population for housing and increase the effective use of urban land with modern infrastructure, housing, and amenities. In reality, the economy’s rapid growth has driven land prices sky high, and investors often violate NUA’s technical and management regulations to maximize profits, focusing on building houses for sale without considering other public facilities such as schools, clinics, and markets. Many NUAs are poorly connected to the city center, and disputes often arise after apartments are handed over to customers because of poor construction, failure to meet contractual commitments, construction delays, or poor maintenance and repair services. As a result, many NUAs have low occupancy rates and have become ‘sleeping’ towns without inhabitants [9]. In addition, conflicting national policies have hindered the program’s implementation. While state policy requires that 30 to 50% of new housing units built in NUAs be accessible to low-income population, this goal has not been reached for various reasons including legal barriers. Many rural migrants and landless farmers from neighboring provinces are disqualified from living in these housing projects. Hence, large areas of Hanoi have turned into marginal settlement zones with slum-like buildings, which have become the destination of impoverished city residents as well as rural migrants [24]. The NUA model has failed to achieve the intention of policy makers to redistribute population from the crowded city center. Planners desperately need new tools for monitoring urban expansion in near-real time.

3. Methods

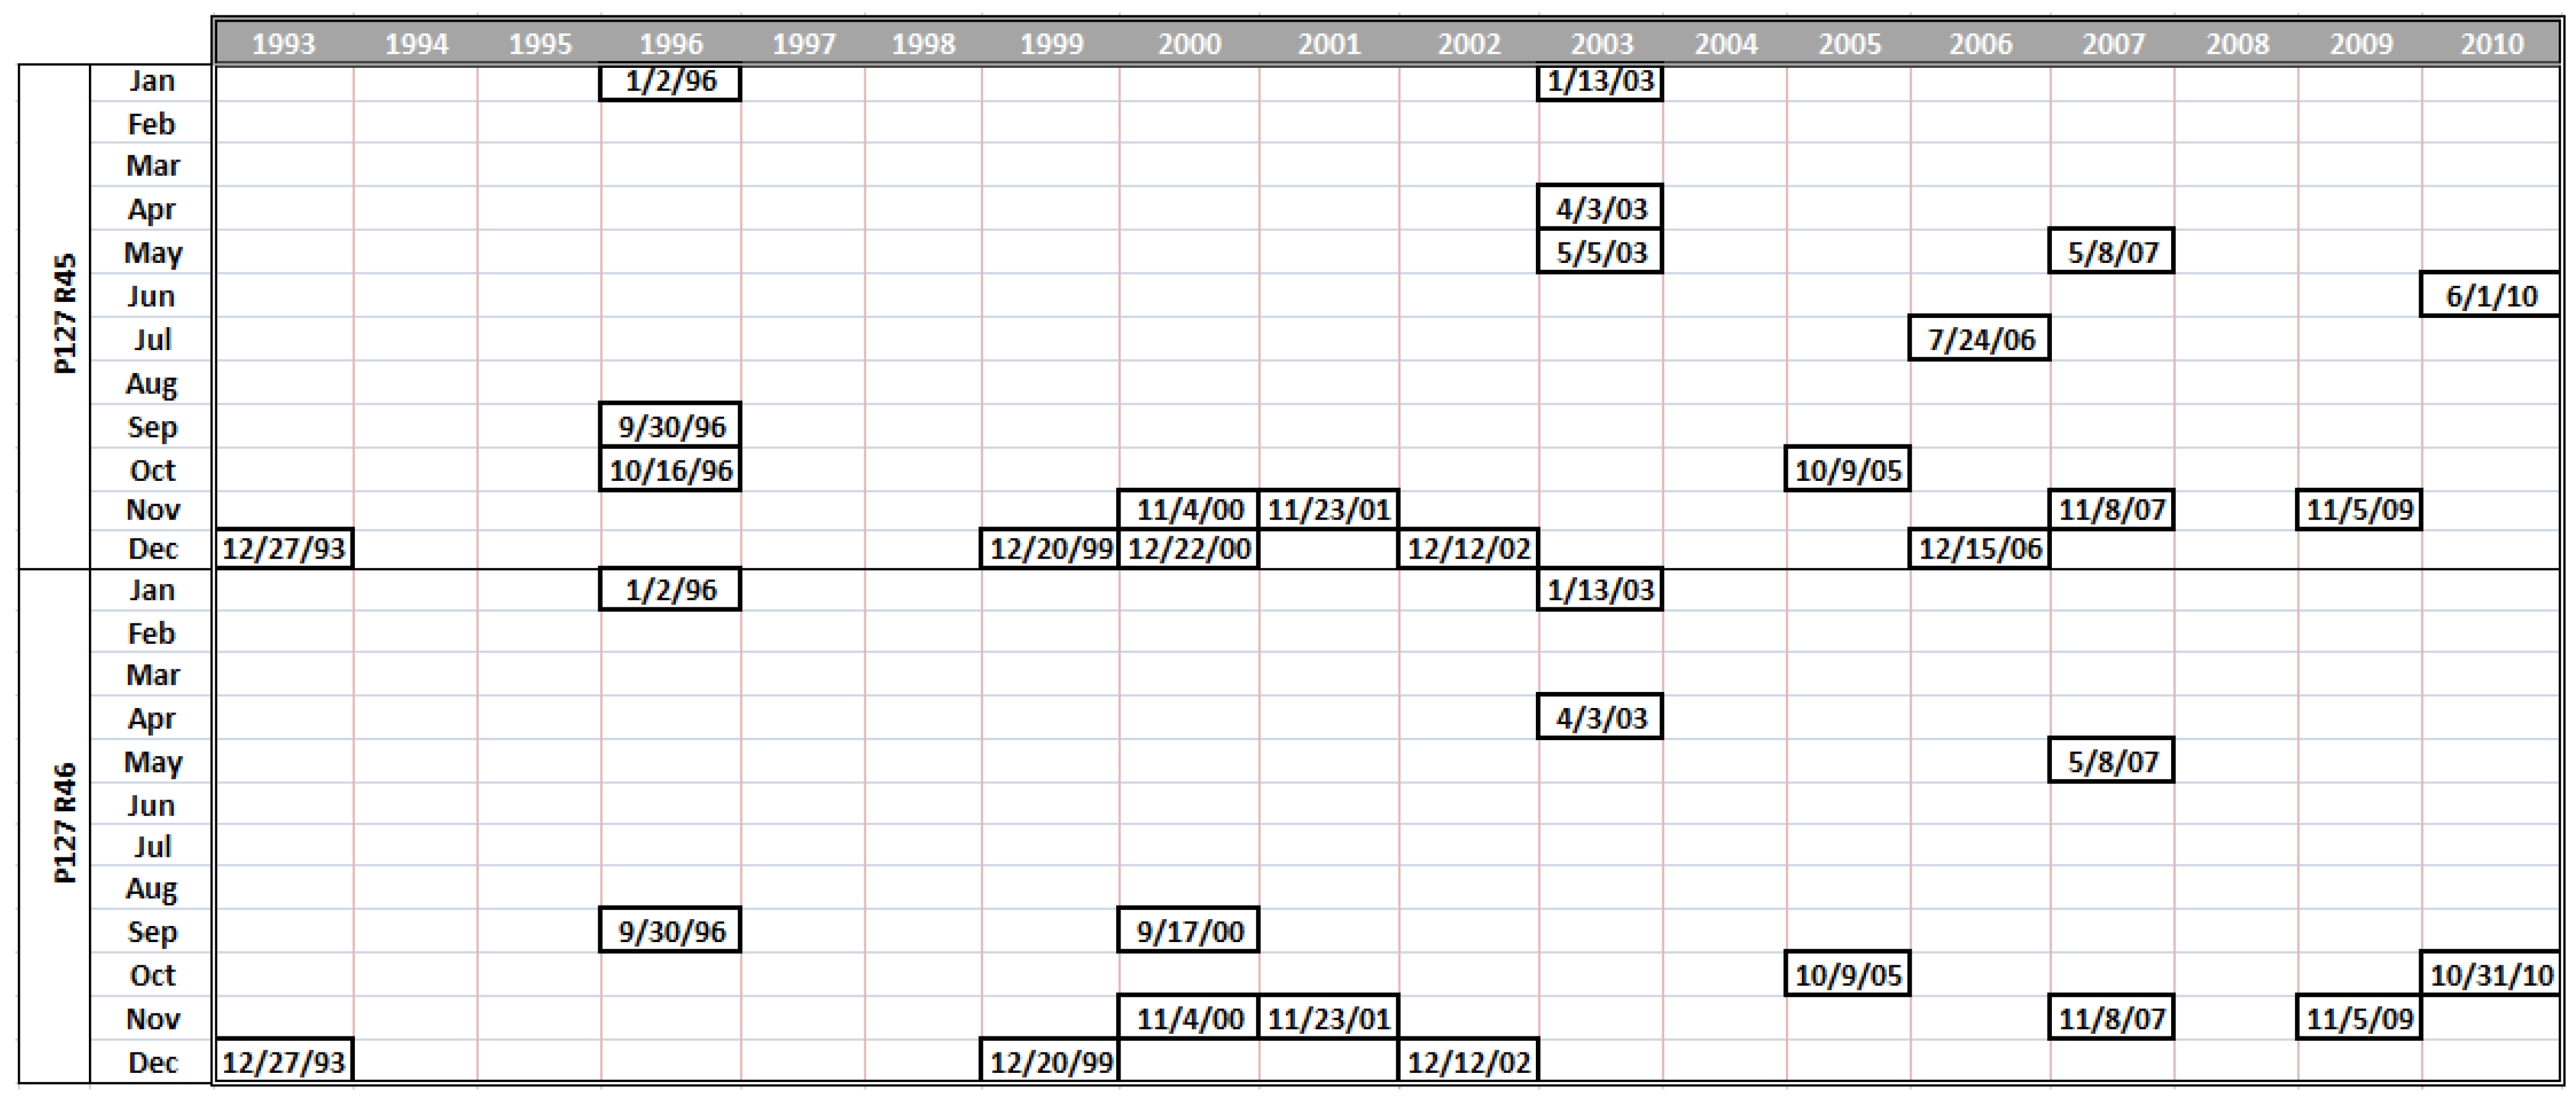
3.1. Remote Sensing of Built-up Areas

Urban areas are highly heterogeneous and challenge the ability of remote sensing specialists to produce accurate land-cover maps, especially using conventional image processing algorithms and techniques based on parametric statistics [25,26]. Urbanization in Asia also often occurs on prime agricultural land that tests the specialists’ ability to distinguish between fallow farmland and built-up areas, since both show high reflectance in the visible-infrared wavelength regions. This problem is even more acute in areas such as the Red River and Mekong River deltas, where farmland supports multiple crops per year with high inter- and intra-year variability [27]. Mapping large urban areas requires making trade-offs between highly accurate but data-intensive high-resolution imagery and less accurate but also less data-intensive moderate-resolution sensors such as 30 meter Landsat data [28]. In addition to spatial resolution, temporal coverage is critical. The long historical archive and continuing acquisitions of Landsat data [29] is a valuable asset that the more recent high-resolution sensors cannot provide. Consequently, we considered Landsat data to be more suitable for our study.
Recent studies have shown that the use of several Landsat images can provide additional information on land cover types [17,30,31,32,33,34]. The high image density of the stack allows for the detection of a change through its multi-temporal signature in spectral space [17,34]. Integrating multi-temporal information helps distinguish urban from non-urban surfaces, as urban spectral responses are largely persistent over time compared to non-urban surface phenology [28]. Capitalizing on this strategy, we utilized stacks of Landsat TM and ETM+ images from 1993 to 2010. The satellite images were acquired from the Global Land Cover Facility (GLCF) archived at the University of Maryland (GLCF-UMD) and from the United States Geological Survey (USGS)-Earth Resources Observation and Science (EROS) Center. Hanoi is covered by 2 Landsat tiles: P127-R045 and P127-R046. We chose all images available for these two footprints from 1993 to 2010 but excluded images affected by cloud cover and scan line corrector (SLC) failures (which affects Landsat 7 imagery acquired after May 2003). This reduced the number of usable images and resulted in gaps in our image stacks for the years 1994, 1995, 1997, 1998, 2004 and 2008. All images were projected into the Universal Transverse Mercator (UTM) coordinate system, Zone 48 based on the World Geodetic System 1984 datum (WGS84). Landsat images and dates of acquisition are listed in Figure 2.
To prepare the image stacks, we selected all visible and infrared bands (1–5 and 7) of each Landsat and compiled them into a single image stack for each tile. Afterward, we subset each tile via the study area’s boundary.
Figure 2. Landsat scenes selected for multi-temporal image stacks.
Land 04 01213 g002
The Support Vector Machine (SVM) supervised classification was applied to the stacks of Landsat TM and ETM+ images for mapping land cover in the study area. Note that radiometric corrections were not performed since this step is only necessary when images are analyzed individually [35], but not simultaneously, as we did here. SVM is a supervised non-parametric statistical learning technique; therefore, no assumptions are made on the probability distribution of the data to be classified [36]. This characteristic makes SVM superior to traditional Bayesian methods for discriminating complex, hierarchical patterns in satellite data [37]. Esch et al. [38] found SVM to be effective in automatic extraction of urban areas where there is a wide range of surface materials and the heterogeneity of the classes.
Our method for image analysis and classification was intellectually stimulated by a strategy outlined in Schneider [34] and Castrence et al. [17], which showed the effectiveness of SVM classification of multi-temporal image stacks for mapping land cover change in urban and peri-urban environment. Our classification scheme includes seven classes: agriculture, built-up, forest, water, and three change classes (agriculture to built-up) between the time periods of 1993–2001, 2001–2006 and 2006–2010. We chose to map changes in these three time periods to match the dates of the national population and housing census (1999–2009) and the agricultural-forestry-fishery census (2001–2006–2011) for the convenience of comparison and combination of these datasets. Based on the field observation and our experiences of the study area, we assumed that all changes to built-up land come from agricultural land and that other sources of changes are negligible.
Following both random and stratified sampling strategies, we randomly generated ground truth points (GTPs) and purposely added more GTPs for classes where coverage area was small. We labeled each one with an appropriate land cover class. We based our groundtruthing on local knowledge, field surveys, and a visual interpretation of both current and historical satellite imageries from Google Earth, Bing Maps and Landsat to determine the land cover type and trajectory of each sampled location. We had a total of 927 pixels for GTPs representing the seven classes identified in our classification scheme. Since the study area’s landscape is largely dominated by agricultural land, we had more points in the agricultural class (362 pixels) and fewer points in the forest class (48 pixels).
We implemented the SVM classifier in ENVI 4.4 (Exelis Visual Information Solutions, Inc., Boulder, CO, U.S.A.). The SVM classifier has four kernels, namely, linear, polynomial, Radial Basis Function (RBF) and sigmoid. Although some studies have observed that kernel selection can be crucial in the production of satisfactory classification accuracy by SVMs [39], very little guidance exists concerning the criteria to be used in selecting kernel-specific parameters [40,41]. We chose the RBF kernel, as it generally requires defining a fewer parameters and is also known to produce good results [42,43]. To obtain relatively realistic accuracy estimates, we applied tenfold cross validation [44] using the groundtruthing data for both training and accuracy assessment. We randomly divided our groundtruthing data into training and validation samples with a proportion of 80% and 20%, respectively. We repeated this process ten times to generate ten independent sets for training and validation. We then ran the classifier and accuracy assessment ten times, once for each training and validation set. We performed accuracy assessment based on a confusion matrix to compute overall accuracy (OA), producer accuracy (PA), user accuracy (UA), and the kappa coefficient (Kc) statistic [45]. We took the average of all validation iterations and reported the estimated accuracy in Table 1.
Our supervised classification was an iterative process that involved visually identifying misclassified areas, increasing the number of GTPs, and subsequently re-running the classifier and accuracy assessment. This step was necessary because of the heterogeneity and subtlety of the land cover changes in the study area. The initial random and stratified GTPs did not fully represent the characteristics of all the land cover and land cover change classes, which led to misclassifications. By collecting more GTPs for misclassified areas, such previously ignored characteristics were added to the appropriate classes, which ultimately improved the classification. Once the classification was satisfactory, we mosaicked two sub-scenes and performed the following post-classification steps to obtain the final map. Seasonal changes in water levels in the Red River resulted in parts of the alluvial plain being misclassified as built-up change classes. Practically, this misclassification can be handled by collecting GPTs in the alluvial plain area and by classifying it as water or a separate class. Since the portion of the Red River running through Hanoi is small, we manually digitized a layer of the Red River as a masking layer, and the raster math was then used to merge the original land cover map with the masked layer. We followed the SVM classification with a 4 × 4 majority filter kernel to remove the ‘salt and pepper’ effect common in Landsat classifications [46].

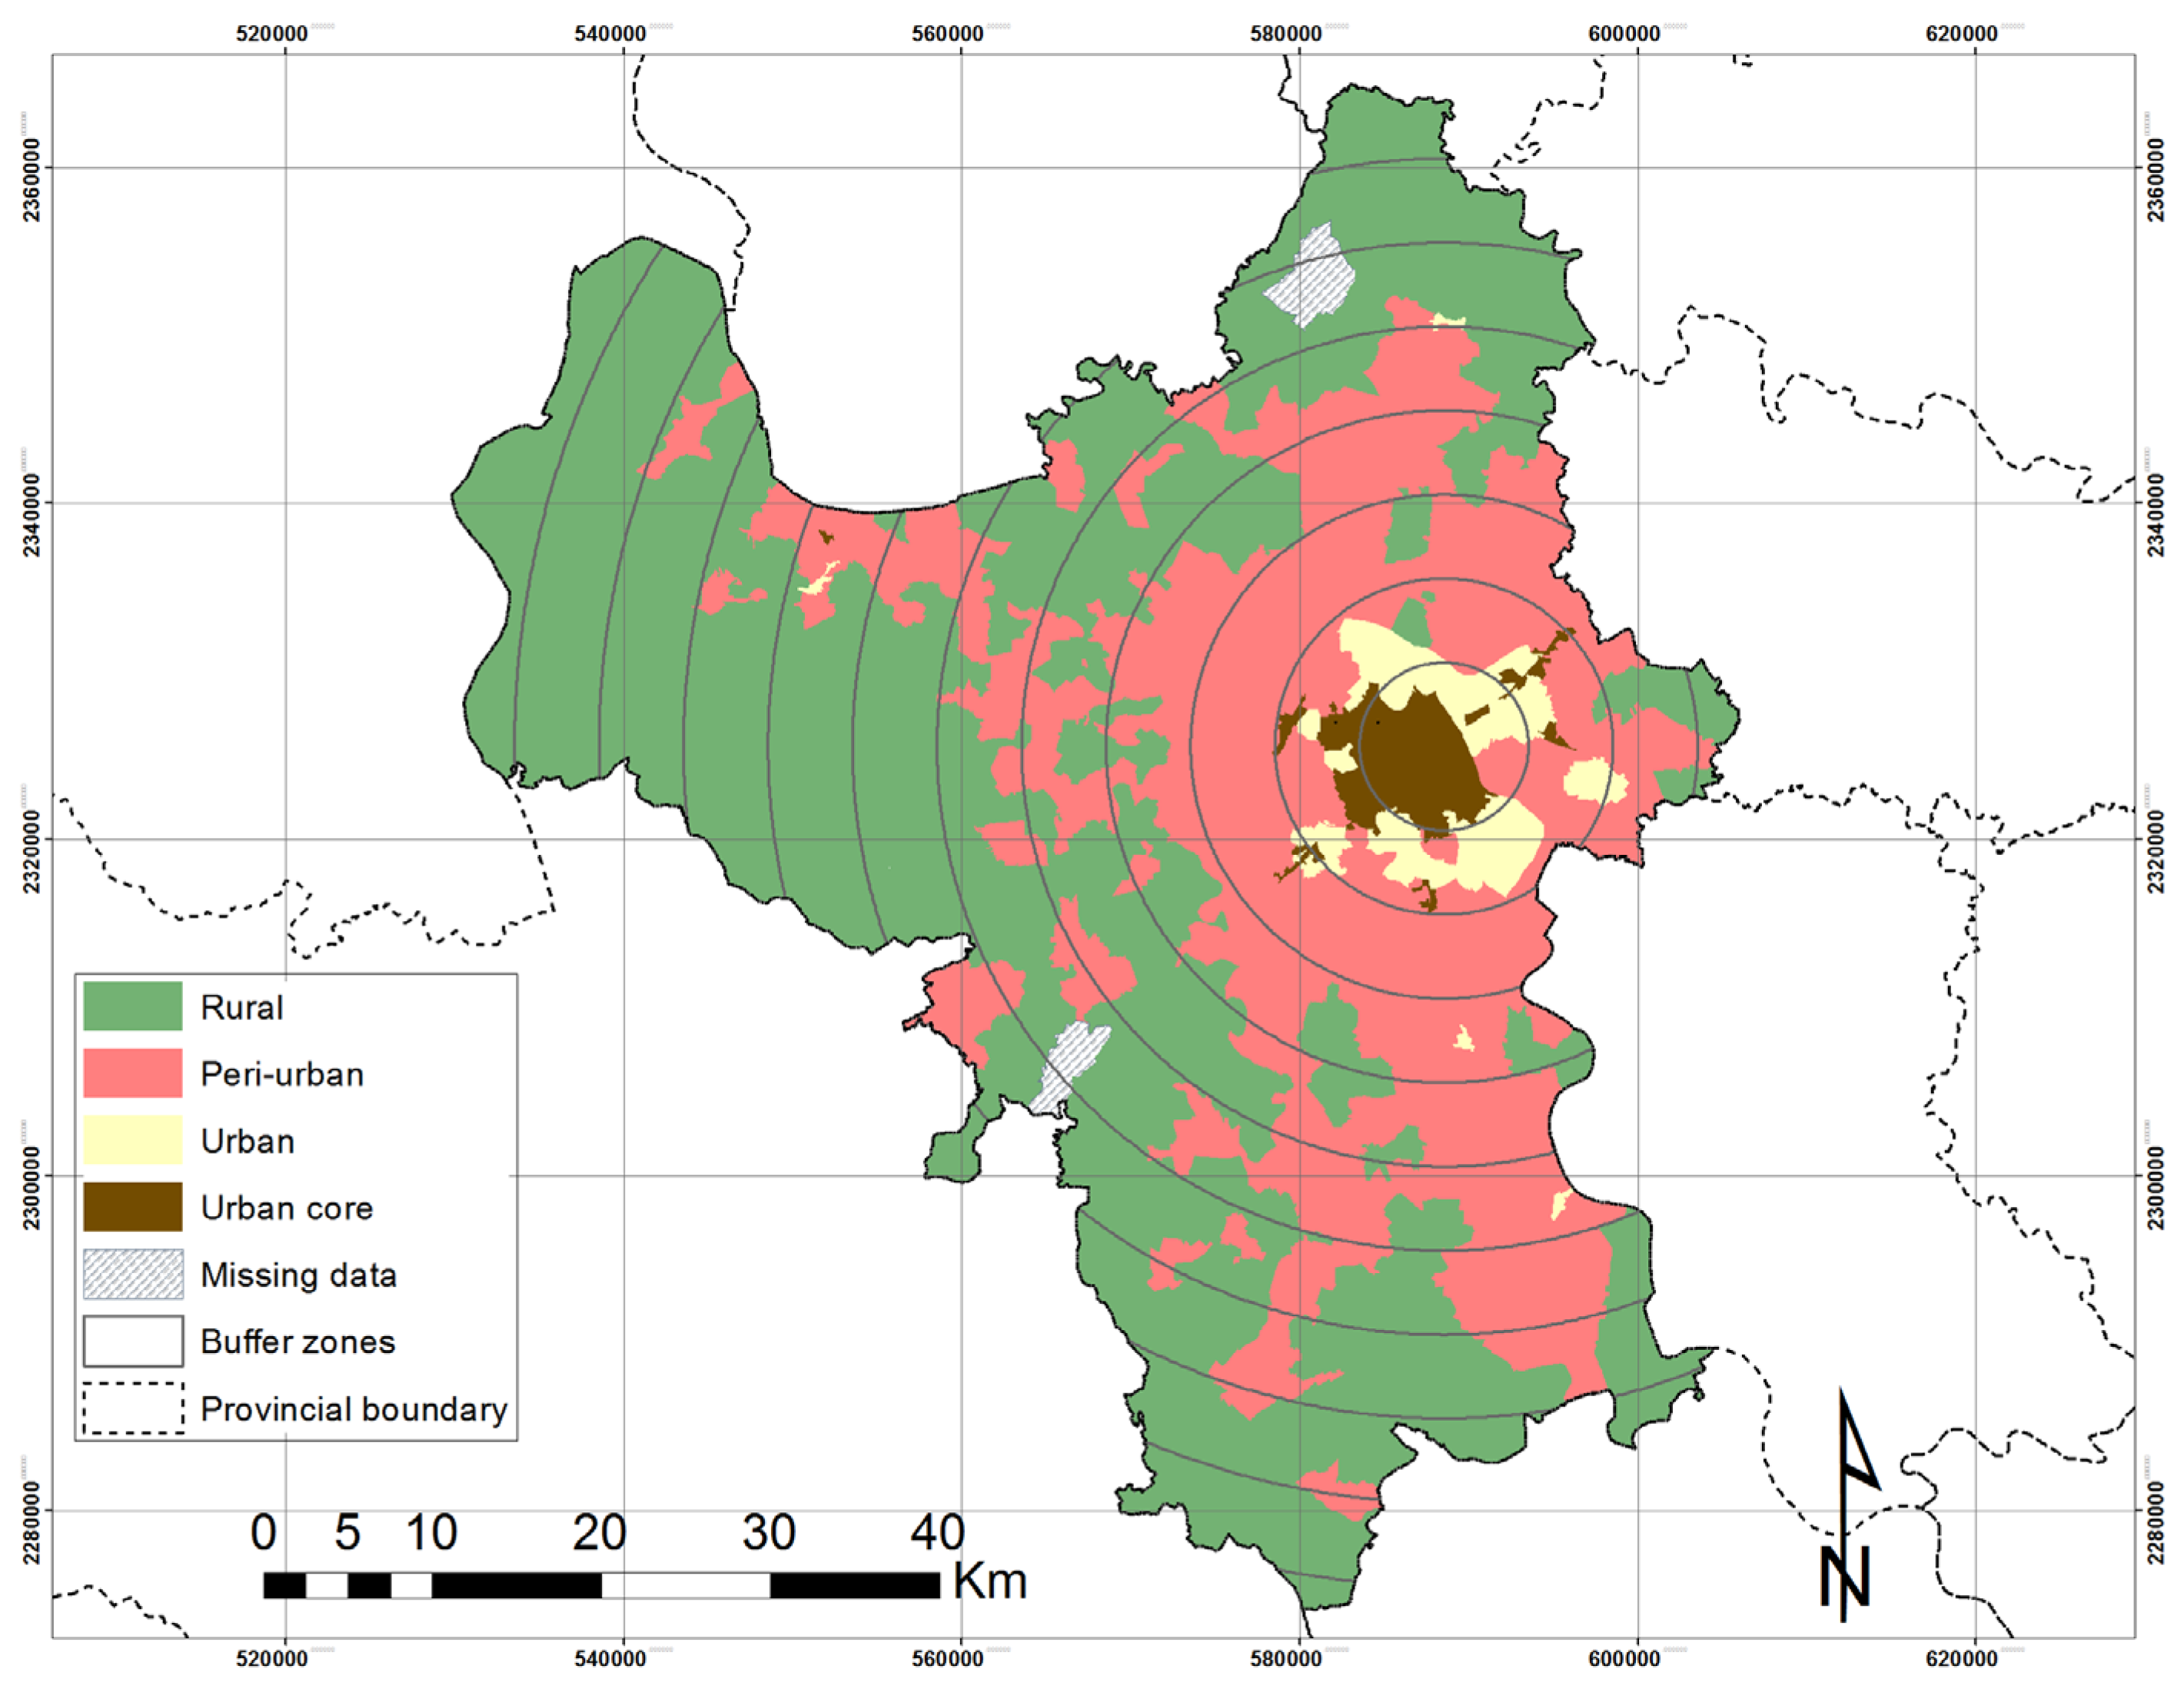
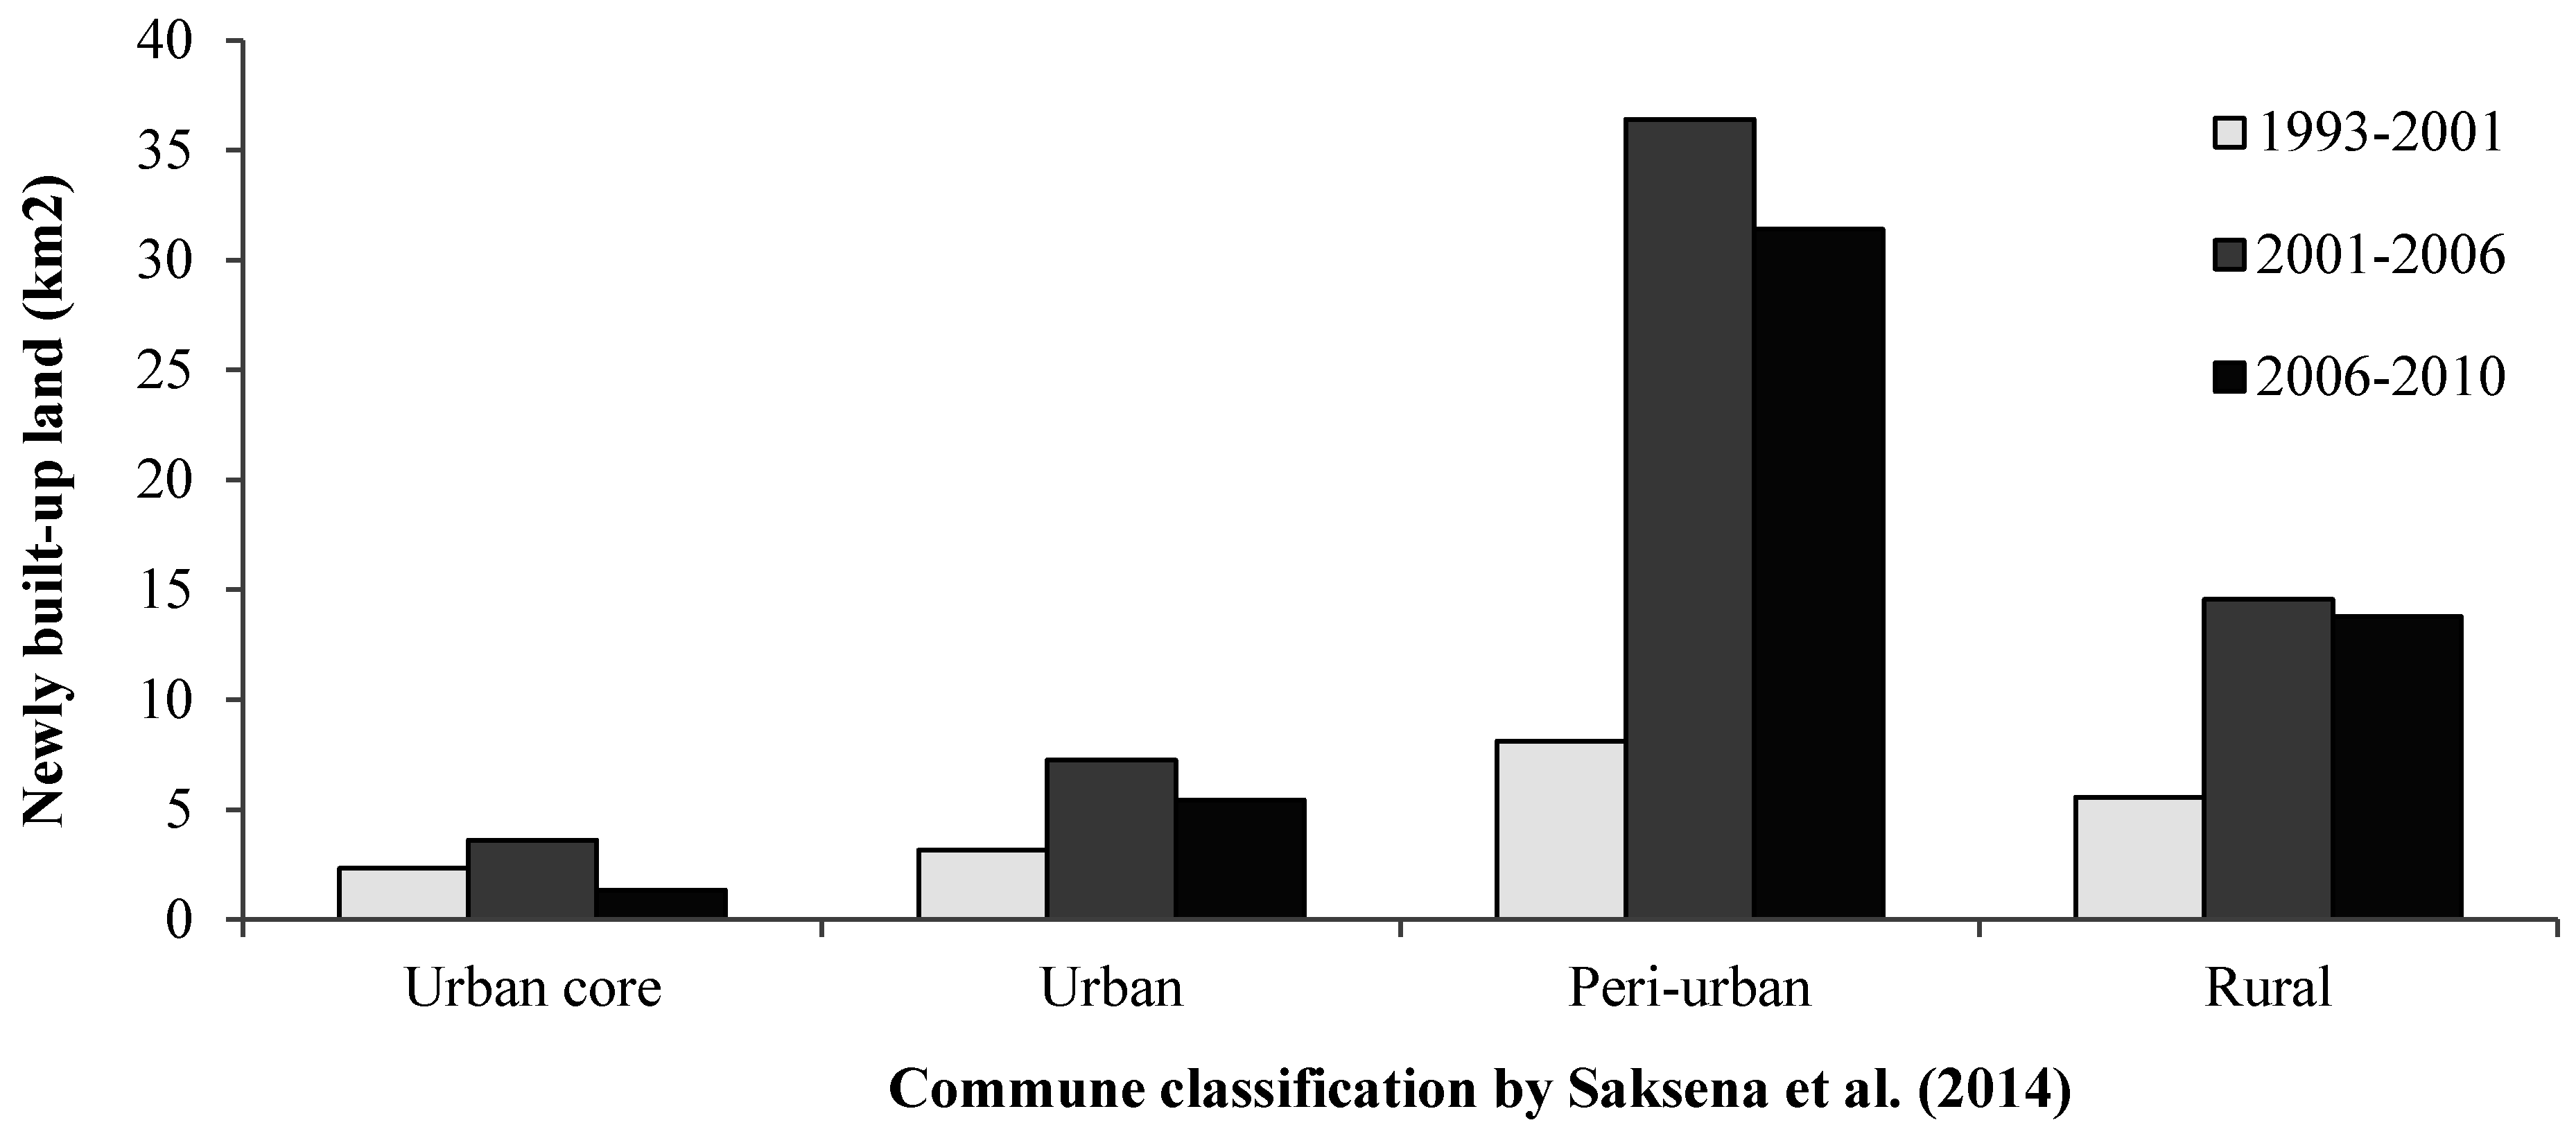
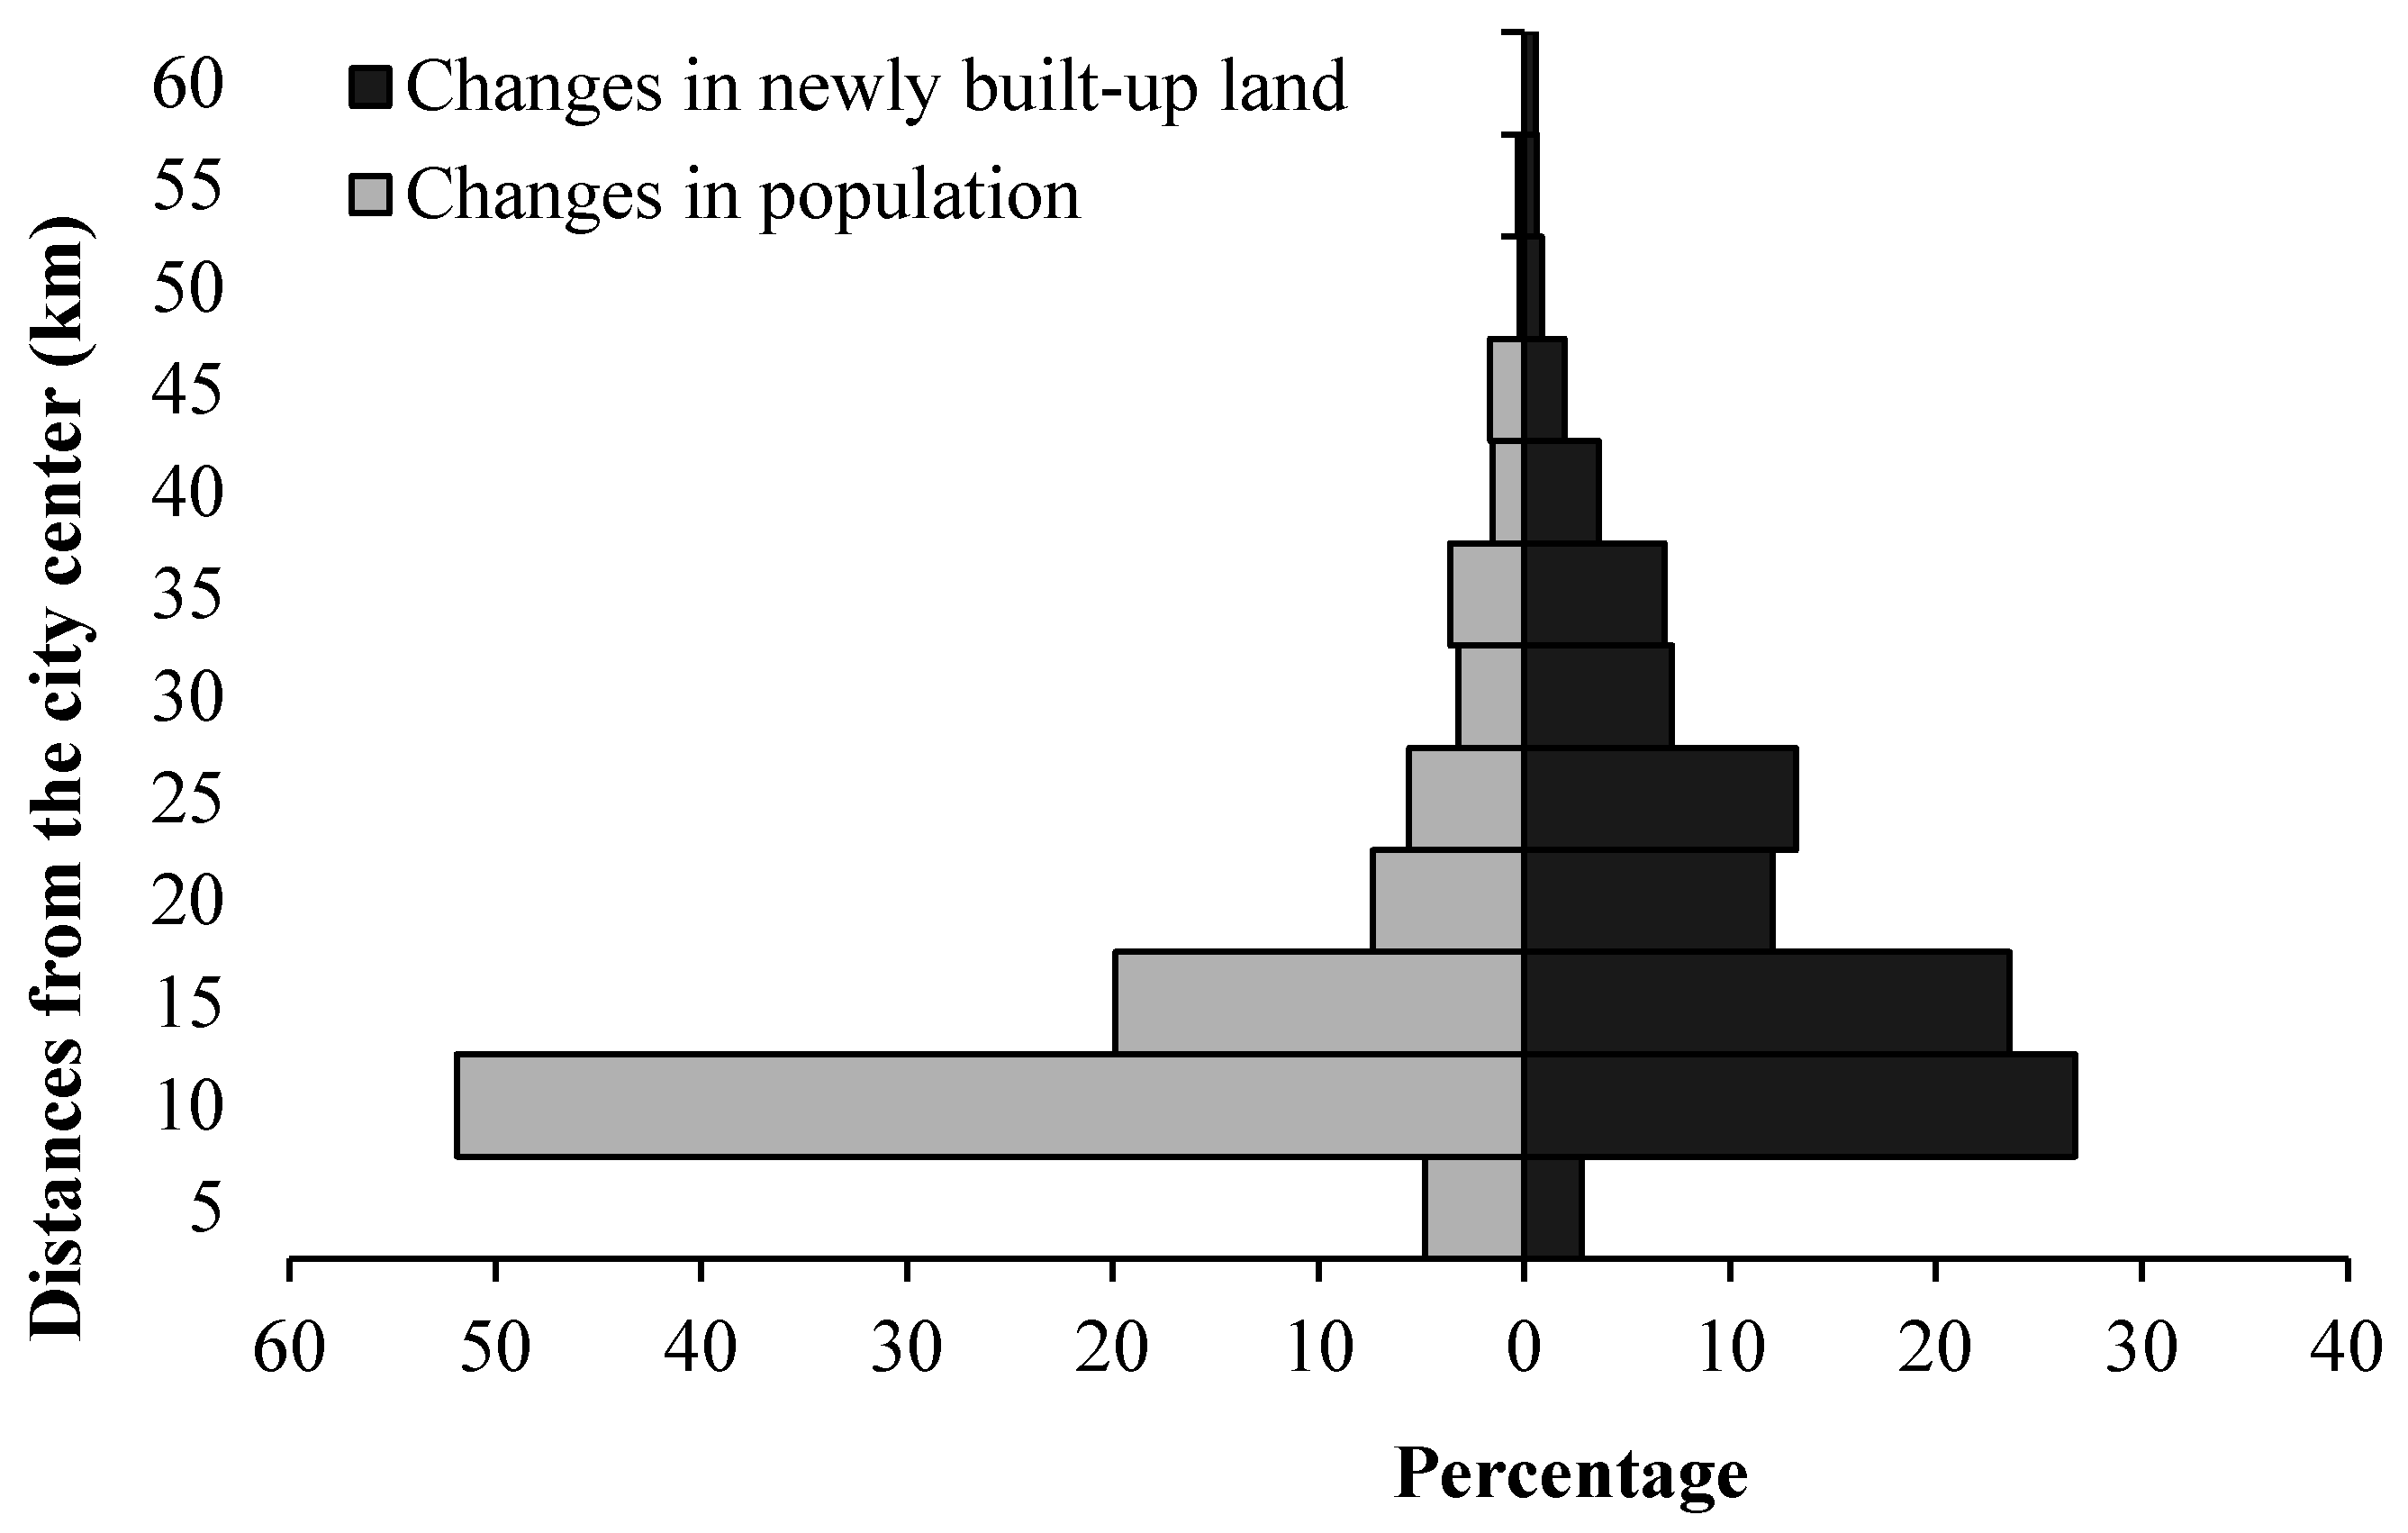
3.2. Rural-Urban Gradient Analysis

We adopted GIS-based buffer analysis in our research using circular buffer zones surrounding the city center (Figure 3). Each buffer zone was employed as a basic spatial unit to characterize the distance-dependence of urban growth. Rural-urban gradients have predominantly been quantified using concentric zones from the urban core outwards [47,48,49], and objective quantification using GIS methods [50,51,52,53,54]. In this study, we defined a center point located in the Hoan Kiem district because this is one of the first four urban districts of Hanoi. We then created multiple buffer zones at five-kilometer intervals from the center point until we covered the entire Hanoi boundary. We used five-kilometer interval buffer zones because, in 1993 (the beginning of our study period), all contiguous urban districts were encompassed within a radius of five kilometers.
To reinforce our understanding of land cover changes in and around the urban core, as well as associations between built-up expansion, population growth and peri-urbanization, we used an urban transition map developed for Hanoi by Saksena et al. [18] as an independent gradient system that does not rely on government classification, human density, or distance to town (Figure 3). Instead, it is based on fundamental driving forces drawn from socioeconomic theories. Within Hanoi city boundaries, Saksena et al. [18] classified 106 administrative units as urban core communes, 32 as urban communes, 230 as peri-urban communes, and 204 as rural communes. Two communes with missing data were excluded from the analysis. Finally, to gain an insight into how urban expansion corresponds with population growth, we combined data from the 1999 and 2009 population census with our urban classification map.
Figure 3. Gradient analysis using five-kilometer interval buffer zones and a commune classification developed by Saksena et al. (2014).
Land 04 01213 g003

4. Results and Discussion

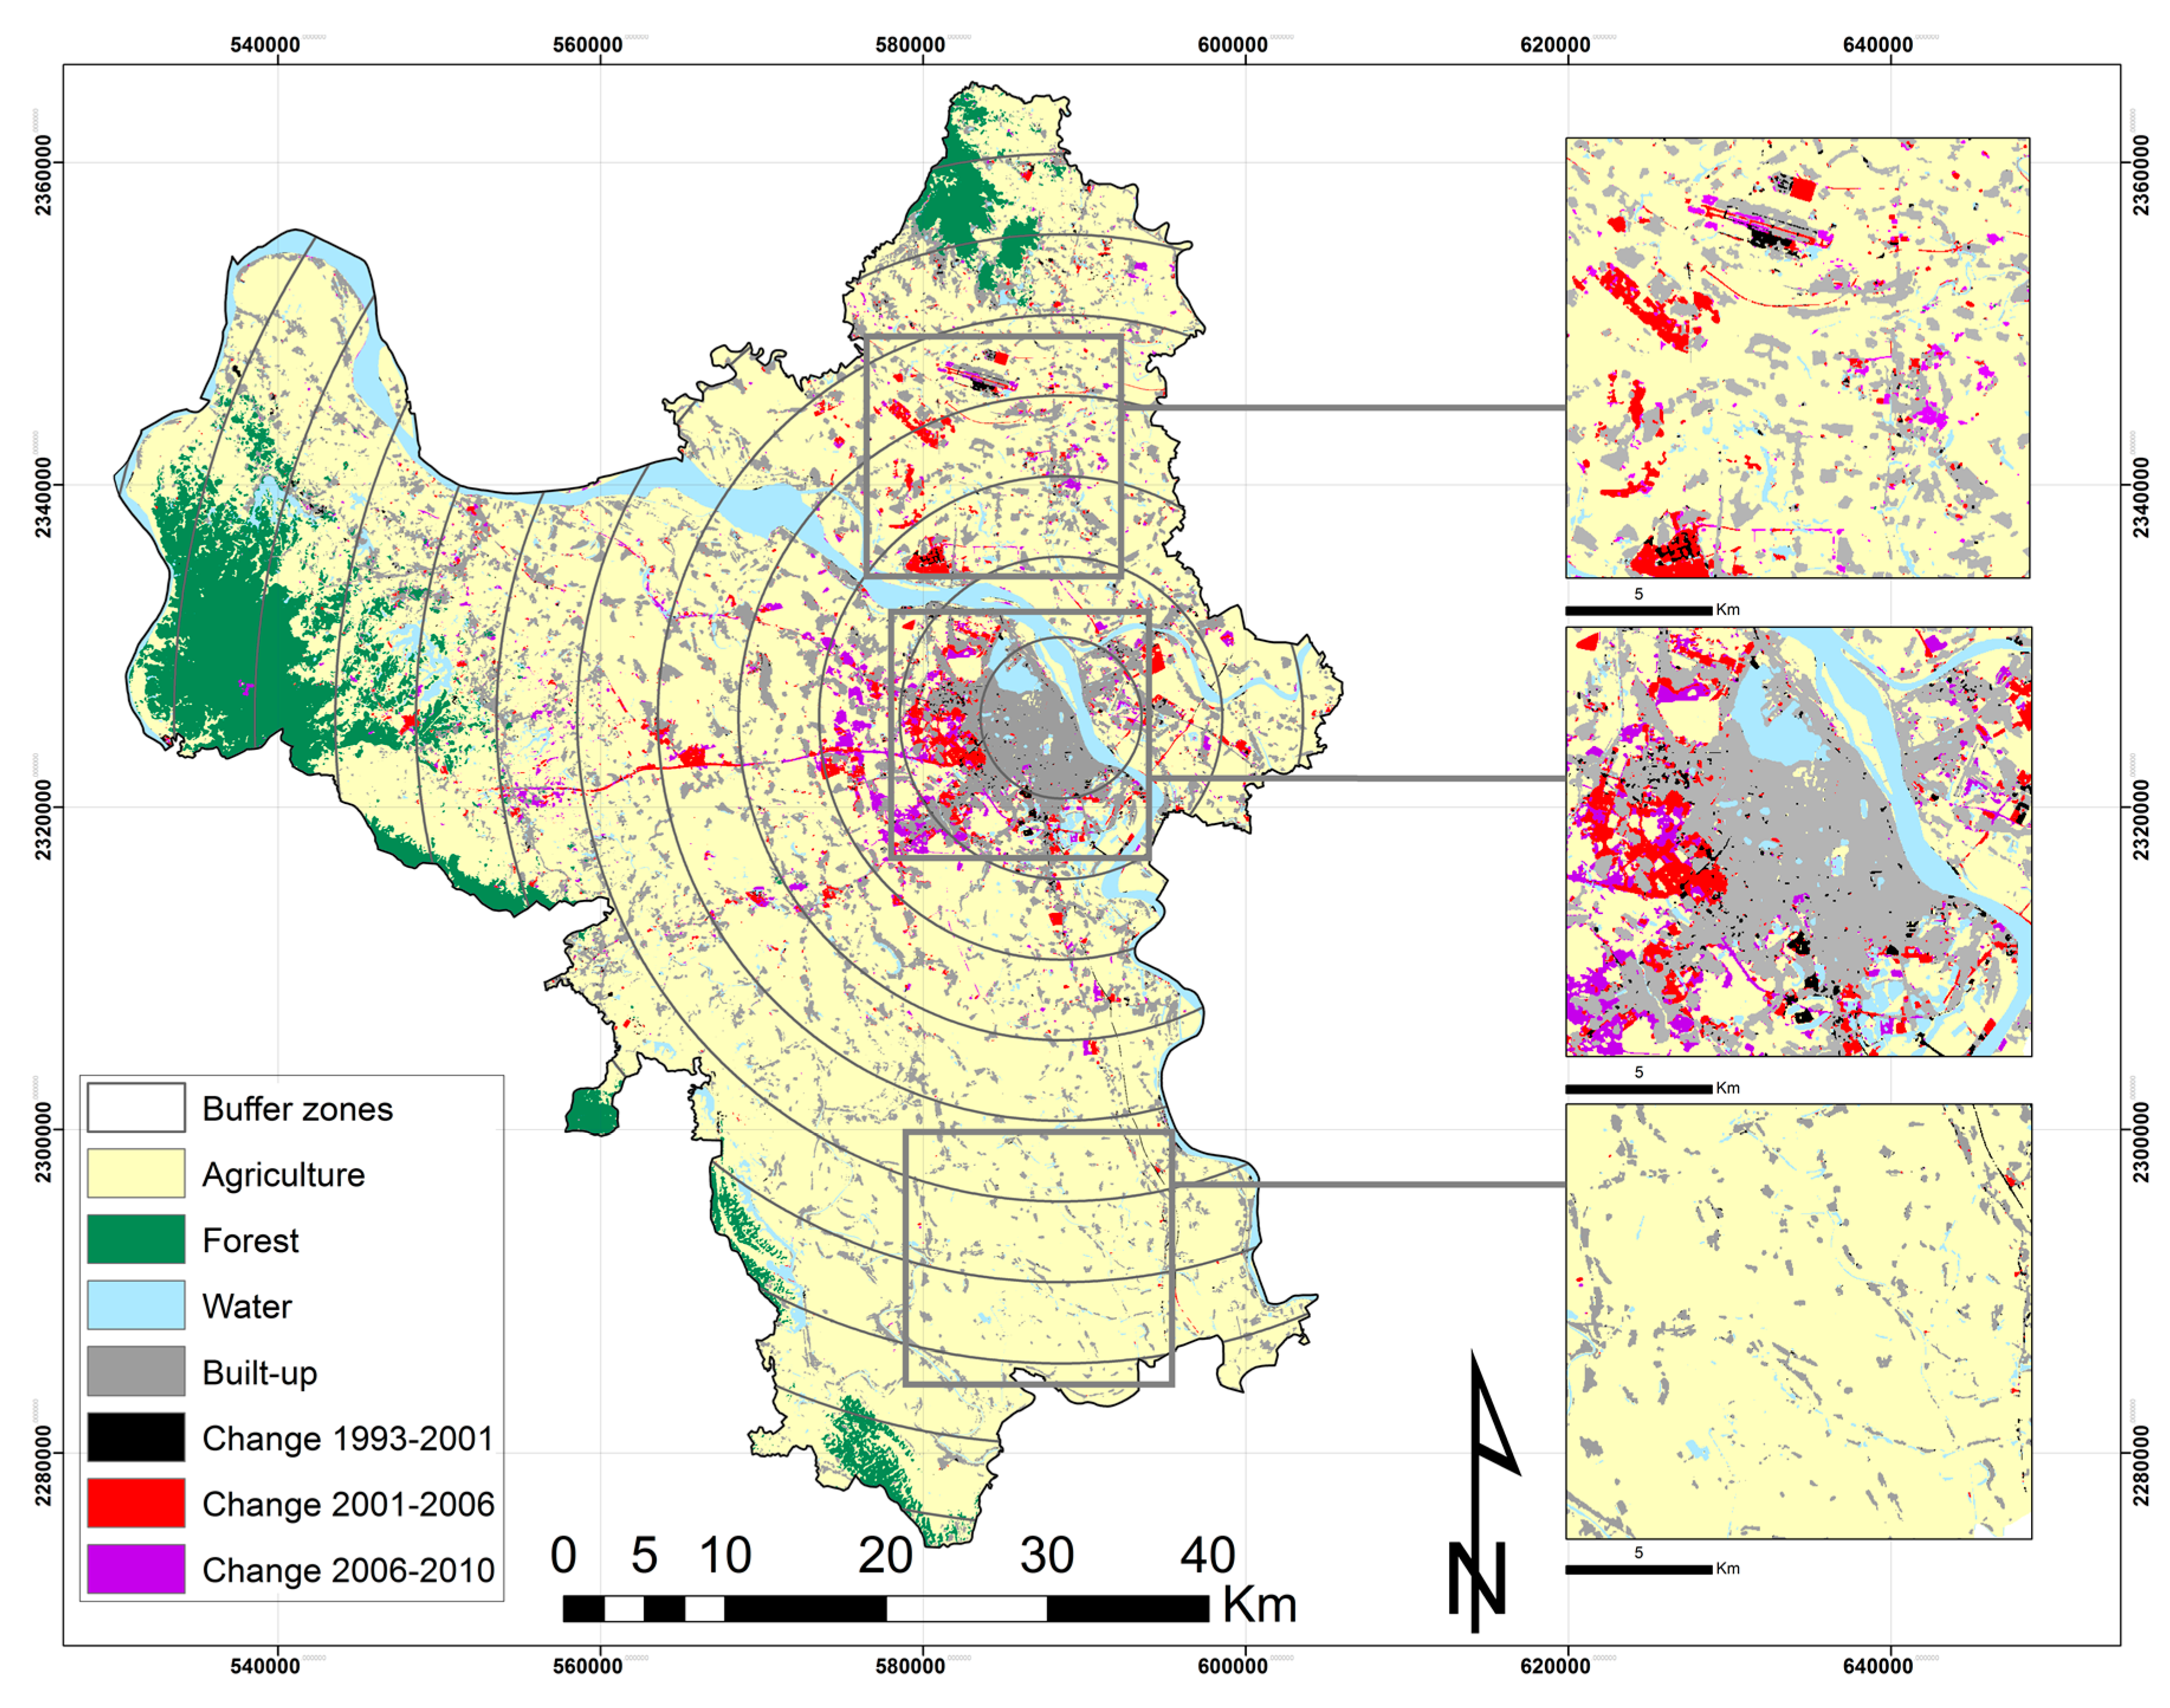
4.1. Land Cover Classification

Our land cover map includes seven classes: agriculture, forest, water, built-up and three classes of change from agricultural land to built-up land (1993–2001, 2001–2006, and 2006–2010) (Figure 4). The SVM method showed a good performance in mapping the agriculture to built-up transition in the three time periods (Figure 5). The SVM classification of Hanoi resulted in high overall accuracies ranging from 93.85% (kappa coefficient = 0.92) to 95.37% (kappa coefficient = 0.94) among the various land-cover classes. In comparison with previous work [17], a smaller study area and a richer archive of Landsat and high-resolution Google Earth images resulted in improved accuracies. The three change classes (1993–2001, 2001–2006, and 2006–2010) had slightly lower accuracies than the stable classes (agriculture, built-up, forest, and water) (Table 1).
Figure 4. Land cover map of Hanoi using the Support Vector Machine Classification.
Land 04 01213 g004
Figure 5. Performance of SVM on a multi-temporal image stack in mapping agriculture to built-up transition.
Land 04 01213 g005
Table 1. Overall accuracy, kappa coefficient and the average producer’s and user’s accuracies of the tenfold cross validation for all land cover classes.
Land Cover ClassesProducer’s AccuracyUser’s Accuracy
Agriculture95.60%95.11%
Built–up95.34%95.12%
Change 1993–200194.10%93.86%
Change 2001–200693.01%93.15%
Change 2006–201092.86%92.85%
Forest94.61%95.61%
Water94.90%95.38%
Overall Accuracy94.5%
Kappa Coefficient0.93
Image classification accuracies often depend on the land cover classification scheme, the quality of groundtruthing data, the spatial resolution of the satellite images, and the study’s objectives. The urban landscape of Hanoi is heterogeneous, so we utilized a simple land cover classification scheme that met our objectives and was suitable for the 30-meter spatial resolution Landsat images. Classification accuracies may also depend on the temporal availability of satellite images, as we found the highest accuracies for the period for which we had the most images and the lowest accuracy for the period for which we had the fewest images. We included as many Landsat images as possible but omitted several cloudy and SLC-off images. Recent advanced remote sensing techniques may help to fill the un-scanned gaps of SLC-off images [55,56,57] but would require time and effort inputs that are beyond the capability of this study.

4.2. Gradient Analysis of Newly Built-Up Areas in Hanoi

To quantify the location and change of built-up land over time and along the rural-urban gradient, we used the pre-defined buffer zones. The results show that, over the course of the study, the growth of built-up areas occurred mainly between 10 and 25 km from the city center (Figure 6). Within the 10 to 25 km buffer zones, the greatest amount of change occurred between 2001 and 2006. The core zone (within five km) and zones further than 35 km showed the least amount of change over the three periods, and differences between these periods were also negligible. We then explored whether the changes we observed in built-up areas in different buffer zones conform to the changes documented by Saksena et al. [18]. Results (Figure 7) show that urban core and urban communes experienced modest change over the three time periods, while peri-urban communes showed drastic change. The greatest amount of change occurred between 2001 and 2006 in all commune categories; change in peri-urban communes was 30 times higher than that in urban core communes during the 2006 to 2010 period. The two methods for identifying and mapping change in built-up areas distinguished urban growth according to the rural-urban characteristics of communes as well as along the rural-urban distance gradient. These two figures (Figure 6 and Figure 7) suggested that urbanization in Hanoi is driven by both the socio-economic and natural characteristics of each commune and its distance from the urban center.
Figure 6. Changes in newly built-up land in different buffer zones during the three time periods.
Land 04 01213 g006
Figure 7. Changes in newly built-up land in different commune categories during the three time periods.
Land 04 01213 g007
We also explored correlations between changes in newly built-up land and changes in population. Figure 8 compares demographic changes between 1999 and 2009 with changes in newly built-up land between 1993 and 2010. We found that, within the 5 and 10 km buffer zones, population growth exceeds the growth of built-up land, an indication of the high population densities found in areas near the urban center. The greatest changes in population and newly built-up land occurred in the 10 and 15 km buffer zone (Figure 8). Figure 9 shows that changes in newly built-up land occurred in roughly proportional amounts with changes in population. According to the 1999 and 2009 national population censuses, the population of Hanoi grew by more than a million people during this decade; over 50% of this growth occurred in communes classified as peri-urban.
Figure 8. Percentage of change in population and newly built-up land in each buffer zone. Percentages were computed based on the total amount of built-up land during the study period (1993–2010) and total population increase between two census dates (1999–2009).
Land 04 01213 g008
Figure 9. Percentage of change in population and newly built-up land according to commune classification. Percentages were computed based on the total amount of built-up land during the study period (1993–2010) and total population increase between two census dates (1999–2009).
Land 04 01213 g009

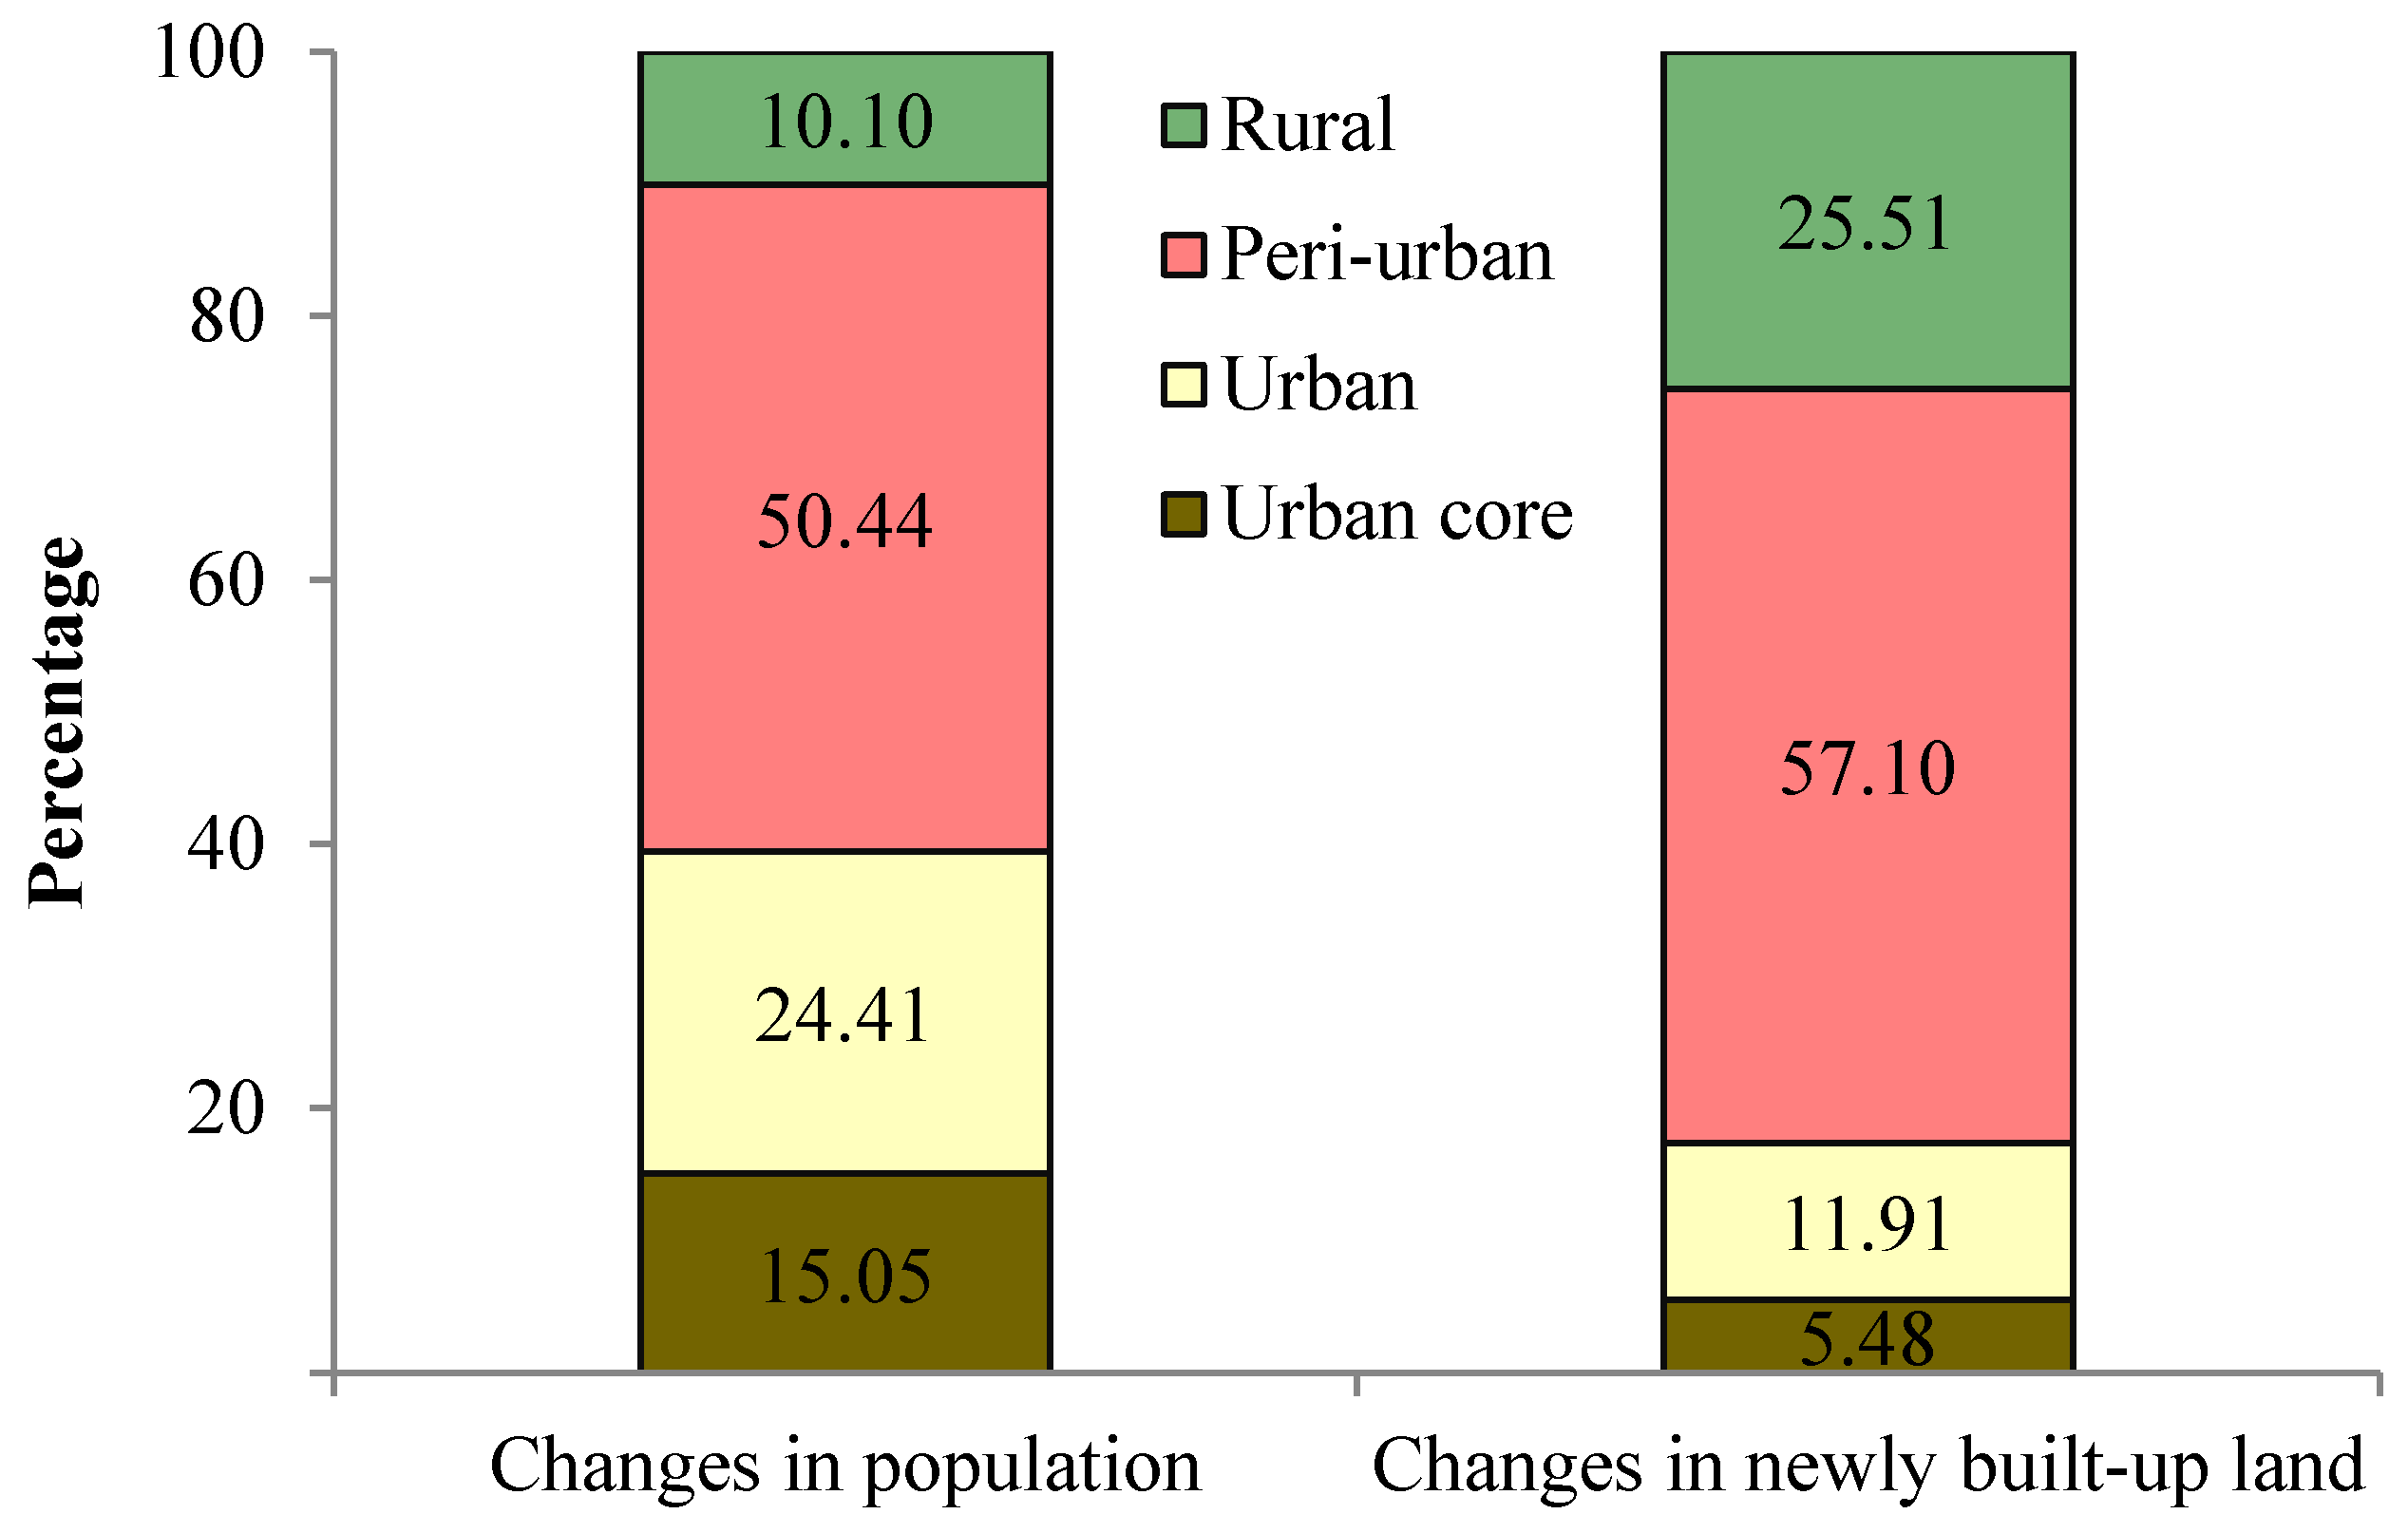
4.3. Policy Implication

The study showed that the number of people living in urban core and urban communes grew faster than changes in built-up land, whereas, in peri-urban and rural communes, changes in newly built-up land outpaced population growth. The continued encroachment of newly built-up land into peri-urban and rural communes creates chaos for migrants moving into the commune and farmers struggling to survive. In many developing countries, urban agriculture contributes significantly to livelihoods of urban populations. Located in the heart of the Red River delta, Hanoi is a largely agricultural dominated landscape. About 80% of fresh vegetables and 40% of eggs are produced by urban and peri-urban agriculture surrounding Hanoi [58]. This level of production can be attributed to the large proportion of the population involved. The rapid conversion of agricultural land to urban uses has raised a concern about food provision for urban populations and livelihoods of peri-urban famers [59]. Because agricultural land is finite and there are also competing interests in what to use the land for (e.g., industrial and infrastructural projects), integrated land use planning is needed to balance different development goals. Agricultural land should be broadly classified on the basis of ecological conservation and economic efficiency [60].
Migration to Hanoi is another related planning focus. Questions have been raised as to whether policies to reduce and control rural-to-urban migration are either desirable or practical [61]. The population increase in Hanoi over the last two decades is largely due to migration [6]. Migrants to the city bring both advantages and challenges for policymakers and the public. Even though there are concerns that rural migrants may bring poverty and other social issues to the city, the fact is that most of the workers in Hanoi’s industrial parks are migrants from rural areas [62]. Remittances also play a very important role in development and poverty reduction for migrants’ origins [63]. From the perspective of city authorities, migrants should be perceived as a great potential labor source for the growing industry rather than problems to the city. However, policies to accommodate migrants are a challenge. Migrants in Hanoi generally have low incomes, poor benefits, unstable employment, and lack traditional family support systems that often make them particularly vulnerable, especially in the case of women [64]. Migrants are also struggling for state support for their legal migration status. In theory, migrants can obtain official permission to change their registration. But, in reality, large numbers of them are unable to fulfill the conditions required, which inhibits their rights to access housing and other public services. It is therefore advisable that restricting migration might not be the solution. Rather, it would be more practical to focus on meeting the basic infrastructural needs for the migrants and create the political will necessary to accommodate them. Balancing urban development, rural-urban migration, and agricultural production should be a priority in any urban development plans.

5. Conclusions

In this study, we have analyzed the built-up expansion on the agricultural land in Hanoi from 1993 to 2010. The analysis of changes in newly built-up areas and population provides greater insights into urban growth dynamics than either variable could provide alone. The supervised non-parametric statistical learning techniques of SVM produced a highly accurate map of land cover change with an overall accuracy of 95%. We found that built-up areas in Hanoi have expanded rapidly over the last two decades. Most of the change occurred between 2001 and 2006 and between 2006 and 2010, corresponding to major changes in economic policies in the early 2000s such as the development of the NUAs model and the decentralization of land management to provincial and municipal governments. Urban expansion was greatest between the 10 and 25 km buffer zones, areas classified as peri-urban by Saksena et al. [18] Demographic change correlates well with changes in built-up areas. Despite the government’s attempt to reduce population density in the city center through the NUA model, we found an increase of population density within 10 km radial around the city center. The study demonstrates that correlations between urban growth patterns and various socio-economic factors are worth exploring. Knowing how, when, and where urbanization occurs allows planners and policymakers to make timely assessment about the impacts of new policies and to adjust accordingly so as to promote sustainable growth, maintain cropland, and minimize other environmental, social and economic problems.
Although the study objectives have been met, the study has its limitations, and there is a need for extended research. While Landsat data generally provide good temporal coverage, its medium spatial resolution did not allow us to map the internal changes of agricultural land uses such as from paddy rice to vegetable or to flower plots. Such changes in land use could serve as indicators of urban and peri-urbanization processes. In addition, we were unable to separate different built-up features such as industrial land versus residential land or to map urban reforms (such as tearing down old office buildings and apartments and constructing new ones). These pieces of information are meaningful for urban pattern analyses and could better support our understanding of population density versus built-up density change dynamics. Finally, due to the availability of satellite data, this study was only able to observe urban growth for a 17-year period. This limited our ability to link spatial growth with policy objectives and their implementation. The current construction master plan for Hanoi has a planning horizon of 30 years and a projection for 50 years with multiple short to mid-term plans of 5 to 10 years. Therefore, long-term monitoring data and practices are essential for understanding change over time in urban landscapes and for overseeing policy objectives. Extended research with a longer monitoring and observation period is needed to be able to predict urban growth and its potential consequences more accurately.

Acknowledgments

This study is funded by the National Science Foundation, Grant number #0909410. We would like to thank Jim Spencer, Qi Chen, Christopher Lepczyk and Kaspar Hurni for their helpful feedback to guide the direction of our research. We especially appreciate Miguel Castrence for technical assistance.

Author Contributions

Duong Nong designed the study, analyzed the data and drafted the manuscript. Jefferson Fox, Tomoaki Miura and Sumeet Saksena supervised the study, provided feedback and edited the manuscript.

Conflicts of Interest

The authors declare no conflict of interest.

References

  1. ADB. Sustainable Urbanization in Asia and Latin America; Publication Stock No. BKK146703–2; Asian Development Bank: Mandaluyong City, Philippines, 2014. [Google Scholar]
  2. Welle-Strand, A.; Vlaicu, M.; Tjeldvoll, A. Vietnam—A new economic dragon in southeast Asia? J. Developing Societies 2013, 29, 155–187. [Google Scholar] [CrossRef]
  3. The 2009 Vietnam Population and Housing census: Major Findings; Central Population and Housing Census, Steering Committee: Hanoi, Vietnam, 2010.
  4. Campbell, T. A Tale of Two Cities in Vietnam; World Bank: Washington, DC, USA, 1999. [Google Scholar]
  5. Vietnam Urbanization Review: Technical Assistance Report; World Bank: Wasington, DC, USA, 2011; p. 238.
  6. Labbé, D. Facing the Urban Transition in Hanoi: Recent Urban Planning Issues and Initiatives; Institut national de la recherche scientifique, Centre Urbanisation, culture et société: Quebec, QC, Canada, 2010. [Google Scholar]
  7. Biau, D. Vietnam Urban Planning and Development Association. Avaliable online: http://ashui.com/mag/vupda (accessed on 15 April 2015).
  8. Duong, N.; Thoa, L.; Hoan, N.; Taun, T.; Thu, H.; Seto, K. A study on urban growth of Hanoi using multi-temporal and multi-sensor remote sensing data. Asian J. Geoinf. 2003, 3, 69–72. [Google Scholar]
  9. Luan, T.D. Living in “new urban areas”: Towards sustainable urban communities in Hanoi, Vietnam. In Environmental Impact II; WIT Press: Southampton, UK, 2014; Volume 181, pp. 333–344. [Google Scholar]
  10. Douglas, R. On the Edge: Shaping the Future of Peri-Urban East Asia; Institute of International Studies, Stanford University: Stanford, CA, USA, 2002. [Google Scholar]
  11. Pham, M.H.; Yamaguchi, Y. Monitoring land cover change of the Hanoi city center under impacts of urbanization by using remote sensing. In Proceedings of International Symposium on Geoinformatics for Spatial Infrastructure Development in Earth and Allied Sciences, Ho Chi Minh, Vietnam, 9–11 November 2006.
  12. Pham, H.M.; Yamaguchi, Y. Urban growth and change analysis using remote sensing and spatial metrics from 1975 to 2003 for Hanoi, Vietnam. Int. J. Remote Sens. 2011, 32, 1901–1915. [Google Scholar] [CrossRef]
  13. Pham, H.M.; Yamaguchi, Y.; Bui, T.Q. A case study on the relation between city planning and urban growth using remote sensing and spatial metrics. Landsc. Urban Plann. 2011, 100, 223–230. [Google Scholar] [CrossRef]
  14. Duong, N.D.; Le Kim Thoa, N.T.H.; Tuan, T.A.; Le Thu, H. Study on urban growth of Hanoi using multitemporal and multisensor remote sensing data. In Proceedings of International Symposium on Geoinformatics for Spatial Infrastructure Development in Earth and Allied Sciences, Hanoi, Vietnam, 25–28 September 2002.
  15. Schneider, A.; Woodcock, C.E. Compact, dispersed, fragmented, extensive? A comparison of urban growth in twenty-five global cities using remotely sensed data, pattern metrics and census information. Urban Stud. 2008, 45, 659–692. [Google Scholar] [CrossRef]
  16. Duan, H.D.; Shibayama, M. Studies on Hanoi urban transition in the late 20th century based on GIS/RS. Southeast Asian Stud. 2009, 46, 532–546. [Google Scholar]
  17. Castrence, M.; Nong, D.; Tran, C.; Young, L.; Fox, J. Mapping urban transitions using multi-temporal Landsat and DMSP-OLS night-time lights imagery of the Red River Delta in Vietnam. Land 2014, 3, 148–166. [Google Scholar] [CrossRef]
  18. Saksena, S.; Fox, J.; Spencer, J.; Castrence, M.; DiGregorio, M.; Epprecht, M.; Sultana, N.; Finucane, M.; Nguyen, L.; Vien, T. Classifying and mapping the urban transition in Vietnam. Appl. Geogr. 2014, 50, 80–89. [Google Scholar] [CrossRef]
  19. Vien, T.D.; Quang, N.V.; Van Dung, N. Rural-Urban Land Use Changes in Peri-Urban Hanoi; Hanoi, The Hague: Hanoi Agricultural University and Wageningen University and Research Centre: Hanoi, Vietnam, 2005. [Google Scholar]
  20. Logan, W.S. Hanoi: Biography of A City; UNSW Press: Sydney, Australia, 2000. [Google Scholar]
  21. HSO. Hanoi Statistical Yearbook 2008; Hanoi Statistical Office: Hanoi, Vietnam, 2009. [Google Scholar]
  22. Vietnam News Agency. Available online: http://vietnamnews.vn/economy/260399/ha-noi-seeks-to-attract-more-foreign-high-tech-investment.html (accessed on 20 January 2015).
  23. Van Suu, N. Agricultural land conversion and its effects on farmers in contemporary Vietnam. Focaal 2009, 2009, 106–113. [Google Scholar] [CrossRef]
  24. Boothroyd, P.; Phạm, X.N. Socioeconomic Renovation in Vietnam: The Origin, Evolution, and Impact of Doi Moi; IDRC: Ottawa, ON, Canada, 2000. [Google Scholar]
  25. Myint, S.W.; Lam, N. Examining lacunarity approaches in comparison with fractal and spatial autocorrelation techniques for urban mapping. Photogramm. Eng. Remote Sens. 2005, 71, 927–937. [Google Scholar] [CrossRef]
  26. Yang, X. Urban Remote Sensing: Monitoring, Synthesis and Modeling in the Urban Environment; John Wiley & Sons: Chichester, UK, 2011. [Google Scholar]
  27. Kontgis, C.; Schneider, A.; Fox, J.; Saksena, S.; Spencer, J.H.; Castrence, M. Monitoring peri-urbanization in the greater Ho Chi Minh city metropolitan area. Appl. Geogr. 2014, 53, 377–388. [Google Scholar] [CrossRef]
  28. Griffiths, P.; Hostert, P.; Gruebner, O.; van der Linden, S. Mapping megacity growth with multi-sensor data. Remote Sens. Environ. 2010, 114, 426–439. [Google Scholar] [CrossRef]
  29. Wulder, M.A.; White, J.C.; Goward, S.N.; Masek, J.G.; Irons, J.R.; Herold, M.; Cohen, W.B.; Loveland, T.R.; Woodcock, C.E. Landsat continuity: Issues and opportunities for land cover monitoring. Remote Sens. Environ. 2008, 112, 955–969. [Google Scholar] [CrossRef]
  30. Hilker, T.; Wulder, M.A.; Coops, N.C.; Seitz, N.; White, J.C.; Gao, F.; Masek, J.G.; Stenhouse, G. Generation of dense time series synthetic landsat data through data blending with modis using a spatial and temporal adaptive reflectance fusion model. Remote Sens. Environ. 2009, 113, 1988–1999. [Google Scholar] [CrossRef]
  31. Huang, C.; Goward, S.N.; Masek, J.G.; Thomas, N.; Zhu, Z.; Vogelmann, J.E. An automated approach for reconstructing recent forest disturbance history using dense landsat time series stacks. Remote Sens. Environ. 2010, 114, 183–198. [Google Scholar] [CrossRef]
  32. Kennedy, R.E.; Cohen, W.B.; Schroeder, T.A. Trajectory-based change detection for automated characterization of forest disturbance dynamics. Remote Sens. Environ. 2007, 110, 370–386. [Google Scholar] [CrossRef]
  33. Verbesselt, J.; Hyndman, R.; Newnham, G.; Culvenor, D. Detecting trend and seasonal changes in satellite image time series. Remote Sens. Environ. 2010, 114, 106–115. [Google Scholar] [CrossRef]
  34. Schneider, A. Monitoring land cover change in urban and peri-urban areas using dense time stacks of landsat satellite data and a data mining approach. Remote Sens. Environ. 2012, 124, 689–704. [Google Scholar] [CrossRef]
  35. Song, C.; Woodcock, C.E.; Seto, K.C.; Lenney, M.P.; Macomber, S.A. Classification and change detection using Landsat TM data: When and how to correct atmospheric effects? Remote Sens. Environ. 2001, 75, 230–244. [Google Scholar] [CrossRef]
  36. Mountrakis, G.; Im, J.; Ogole, C. Support vector machines in remote sensing: A review. ISPRS J. Photogramm. Remote Sens. 2011, 66, 247–259. [Google Scholar] [CrossRef]
  37. Huang, C.; Goward, S.N.; Schleeweis, K.; Thomas, N.; Masek, J.G.; Zhu, Z. Dynamics of national forests assessed using the landsat record: Case studies in eastern united states. Remote Sens. Environ. 2009, 113, 1430–1442. [Google Scholar] [CrossRef]
  38. Esch, T.; Himmler, V.; Schorcht, G.; Thiel, M.; Wehrmann, T.; Bachofer, F.; Conrad, C.; Schmidt, M.; Dech, S. Large-area assessment of impervious surface based on integrated analysis of single-date landsat-7 images and geospatial vector data. Remote Sens. Environ. 2009, 113, 1678–1690. [Google Scholar] [CrossRef]
  39. Kavzoglu, T.; Colkesen, I. A kernel functions analysis for support vector machines for land cover classification. Int. J. Appl. Earth Obs. Geoinf. 2009, 11, 352–359. [Google Scholar] [CrossRef]
  40. Carrão, H.; Gonçalves, P.; Caetano, M. Contribution of multispectral and multitemporal information from modis images to land cover classification. Remote Sens. Environ. 2008, 112, 986–997. [Google Scholar] [CrossRef]
  41. Li, D.-C.; Liu, C.-W. A class possibility based kernel to increase classification accuracy for small data sets using support vector machines. Expert Syst. Appl. 2010, 37, 3104–3110. [Google Scholar] [CrossRef]
  42. Huang, C.; Song, K.; Kim, S.; Townshend, J.R.; Davis, P.; Masek, J.G.; Goward, S.N. Use of a dark object concept and support vector machines to automate forest cover change analysis. Remote Sens. Environ. 2008, 112, 970–985. [Google Scholar] [CrossRef]
  43. Petropoulos, G.P.; Kontoes, C.; Keramitsoglou, I. Burnt area delineation from a uni-temporal perspective based on landsat tm imagery classification using support vector machines. Int. J. Appl. Earth Obs. Geoinf. 2011, 13, 70–80. [Google Scholar] [CrossRef]
  44. Steele, B.M. Maximum posterior probability estimators of map accuracy. Remote Sens. Environ. 2005, 99, 254–270. [Google Scholar] [CrossRef]
  45. Congalton, R.G.; Green, K. Assessing the Accuracy of Remotely Sensed Data: Principles and Practices; CRC Press: Boca Raton, FL, USA, 2008. [Google Scholar]
  46. Fung, T.; So, L.; Chen, Y.; Shi, P.; Wang, J. Analysis of green space in chongqing and nanjing, cities of china with ASTER images using object-oriented image classification and landscape metric analysis. Int. J. Remote Sens. 2008, 29, 7159–7180. [Google Scholar] [CrossRef]
  47. Kroll, F.; Müller, F.; Haase, D.; Fohrer, N. Rural–urban gradient analysis of ecosystem services supply and demand dynamics. Land Use Policy 2012, 29, 521–535. [Google Scholar] [CrossRef]
  48. Pillsbury, F.C.; Miller, J.R. Habitat and landscape characteristics underlying anuran community structure along an urban-rural gradient. Ecol. Appl. 2008, 18, 1107–1118. [Google Scholar] [CrossRef] [PubMed]
  49. Sadler, J.; Small, E.; Fiszpan, H.; Telfer, M.; Niemelä, J. Investigating environmental variation and landscape characteristics of an urban–rural gradient using woodland carabid assemblages. J. Biogeogr. 2006, 33, 1126–1138. [Google Scholar] [CrossRef]
  50. Hahs, A.K.; McDonnell, M.J. Selecting independent measures to quantify melbourne’s urban–rural gradient. Landsc. Urban Plann. 2006, 78, 435–448. [Google Scholar] [CrossRef]
  51. Hunt, S.D.; Guzy, J.C.; Price, S.J.; Halstead, B.J.; Eskew, E.A.; Dorcas, M.E. Responses of riparian reptile communities to damming and urbanization. Biol. Conserv. 2013, 157, 277–284. [Google Scholar] [CrossRef]
  52. Lockaby, B.; Zhang, D.; McDaniel, J.; Tian, H.; Pan, S. Interdisciplinary research at the urban–rural interface: The west GA project. Urban Ecosyst. 2005, 8, 7–21. [Google Scholar] [CrossRef]
  53. Luck, M.; Wu, J. A gradient analysis of urban landscape pattern: A case study from the Phoenix metropolitan region, Arizona, USA. Landsc. Ecol. 2002, 17, 327–339. [Google Scholar] [CrossRef]
  54. Williams, N.S.; McDonnell, M.J.; Seager, E.J. Factors influencing the loss of an endangered ecosystem in an urbanising landscape: A case study of native grasslands from Melbourne, Australia. Landsc. Urban Plann. 2005, 71, 35–49. [Google Scholar] [CrossRef]
  55. Chen, F.; Ye, H.; Zhao, X. Making Use of the Landsat 7 SLC-OFF ETM+ Image Through Different Recovering Approaches; INTECH Open Access Publisher: Rijeka, Croatia, 2012. [Google Scholar]
  56. Maxwell, S. Filling Landsat ETM+ SLC-OFF gaps using a segmentation model approach. Photogramm. Eng. Remote Sens. 2004, 70, 1109–1112. [Google Scholar]
  57. Zhang, C.; Li, W.; Travis, D. Gaps-fill of SLC-OFF Landsat ETM+ satellite image using a geostatistical approach. Int. J. Remote Sens. 2007, 28, 5103–5122. [Google Scholar] [CrossRef]
  58. Corbould, C. Feeding the Cities: Is Urban Agriculture the Future of Food Security? Stragegic Analysis Paper. Future Directions International. Available online: http://futuredirections.org.au (accessed on 27 April 2015).
  59. Pham, V.C.; Pham, T.-T.-H.; Tong, T.H.A.; Nguyen, T.T.H.; Pham, N.H. The conversion of agricultural land in the peri-urban areas of Hanoi (Vietnam): Patterns in space and time. J. Land Use Sci. 2015, 10, 224–242. [Google Scholar] [CrossRef]
  60. An, L.Q. Agriculture and development: Toward a sustainable agriculture in Vietnam. In Vietnam and IRRI: A Partnership in Rice Research: Proceedings of a Conference held in Hanoi, Vietnam, 4–7 May 1994; Int. Rice Res. Inst.: Los Banos, Philippines, 1995; pp. 45–46. [Google Scholar]
  61. Tacoli, C. International Institute for Environment and Development. Avaliable online: http://www.iied.org/stopping-rural-people-going-cities-only-makes-poverty-less-visible-stripping-migrants-rights-makes (accessed on 5 May 2015).
  62. Linh, T.G.; Thao, N.T.P. Social Protection for Rural-Urban Migrants in Vietnam: Current Situation, Challenges and Opportunities; CSP Research Report 08; Centre for Social Protection: Brighton, UK, 2011. [Google Scholar]
  63. Straubhaar, T.; Vâdean, F.P. International migrant remittances and their role in development. In Migration, Remittances and Development; OECD: Paris, France, 2005; pp. 13–37. [Google Scholar]
  64. Thao, V.T. Making a living in rural Vietnam from (IM) mobile livelihoods: A case of women’s migration. Popul. Space Place 2013, 19, 87–102. [Google Scholar] [CrossRef]

