The Spatial Pattern of the Absorption of Cohesion Policy Funds in Polish Rural Areas


Institute of Rural and Agricultural Development, Polish Academy of Sciences, 72 Nowy Świat St., 00-330 Warsaw, Poland
*
Author to whom correspondence should be addressed.
Land 2021, 10(1), 26; https://doi.org/10.3390/land10010026
Submission received: 30 October 2020
/
Revised: 15 December 2020
/
Accepted: 25 December 2020
/
Published: 30 December 2020
(This article belongs to the Special Issue Urban and Regional Planning in Post-socialist Countries)
Abstract
:This paper determines the extent to which rural areas in Poland have been beneficiaries of the EU’s Cohesion Policy (CP). The amount of funds allocated to rural areas at the local (gmina/commune) level as part of the total CP obtained by Poland from 2007 to 2018 was estimated. The spatial distribution of that allocation was then determined. Whether the level of absorption is linked to the separately computed rural development level in communes was examined. This then made it possible not just to determine the spatial pattern of the absorption of CP funds but also to identify the main social and economic correlates of their high levels of absorption. It was found that nearly 40% of CP funds for Poland were allocated to rural areas, inhabited by 40% of the country’s population. However, this seemingly balanced allocation was somewhat undermined by its spatial distribution: the highest absorption was reported in over a third of communes with a high level of development while it was also found in less than a fifth of communes with a low level of development. Communes with higher levels of absorption have a more favourable local budget situation and a high degree of deagrarianisation of their local economies. The absorption level is more highly correlated with the variables characterising the extent to which an agricultural area has turned into a multifunctional area than with a commune’s absorptive capacity.
1. Introduction
Rural communes in Poland are highly spatially diversified, which is a consequence of natural conditions as well as historical events in different regions. There are many discussions in the literature on the relationship between economic conditions and the advantages that some areas owe to their geographical location [1,2,3]. These are identified with benefits of communes’ location in relation to urban centres, and also to some extent with the diversity of the rural settlement network [4,5]. A great diversity of rural areas is not characteristic for Poland. There are also differences, for example, between northern and southern Italy [6], and between former West Germany and East Germany [7], and in almost every country between suburban and peripheral locations [5,8,9,10]. Promoting less developed areas is the primary objective of the Cohesion Policy [11]. However, levelling out differences in the development of areas (regions) is determined by the potential of limited human resources, social capital, financial capacity, or the local economies [12,13].
Every regional development theory accepts the existence of territorial differences as an objective fact. At the same time, it is assumed a priori that such differences are undesirable [14,15,16]. Both the European Union and national strategic documents indicate that our objective should be territorial cohesion, understood as equalising the level of development [17,18]. It has been suggested that less developed areas should receive more funding as a means of accelerating their development [19,20]. However, territorial egalitarianism is not a simple issue, because it is connected with a dilemma: levelling/convergence versus productivity/effectiveness.
Traditionally, the programme dedicated to rural areas was the Common Agricultural Policy, which focused mainly on supporting the agricultural sector and less on rural development [21]. However, in view of progressive deagrarianisation, as reflected in rural residents’ sources of income as well as the decreasing role of farming in the local economy, the need to increase funding for the multifaceted development of rural areas has been voiced for years [22,23]. A response to this need has been provided, to some extent, by the Cohesion Policy, which aims to reduce the differences in the development level of different regions and to strengthen economic and social cohesion [24] and, since the publication of the Green Paper on Territorial Cohesion [25], territorial cohesion as well.
Since the accession to the EU in 2004, Poland has been the biggest beneficiary of Cohesion Policy funds (with EUR 67 billion invested in the 2007–2013 programming period and over EUR 90 billion planned for the years 2014–2020) [26]. Despite this, regional differences remain relatively stable [5]. Studies have shown that in the same period, intraregional differences increased as a result of the dynamic development of metropolitan areas constituting poles of development [27,28,29,30] and the stagnation (and consequently delays) of peripheral area development [31]. Hence, the progressive regional convergence of development on a European scale has been accomplished at the cost of intraregional differences at the local level [29,30,32].
Considering the above, it would be important to ascertain the extent to which rural areas take part in the absorption of EU funding that has been earmarked for Cohesion Policy objectives. This issue has not yet been researched in Poland. Neither have rural areas themselves been a popular subject of research in international literature, especially not in the context of the Cohesion Policy. The literature review shows that researchers tend to focus on the regional perspective [33,34,35], while analyses focused on the local scale are rare [36,37,38]. In addition, the separation of the money that has been channelled into rural areas from the entire flow of cohesion funds is very labour-intensive.
The main goal of the study was to determine the spatial pattern of allocation of CP funds and to determine what social and economic variables of rural development are the main correlates of absorption. This will be achieved by comparing the amount of Cohesion Policy outlays at local level (LAUs) with the level of local socio-economic development.
It is important to identify the communes with a high level of absorption, considered to be the most effective units in obtaining project funding, and to check how this success is related to the specific conditions of local social and economic development (such as the geographical attractiveness of the commune, its demographic structure, financial resources, or the structure of the local economy).
Theoretical Framework (Literature Overview)
Two similar trends are observed in empirical analyses of the relationship between the Cohesion Policy and regional differences [37,38,39,40]. In the first approach, fund absorption is an independent variable, that is used to explain a particular phenomenon under investigation. This approach can be found in research on the impact of European funding on growth and economic development [34,41,42,43,44,45,46,47] and also on convergence processes [33,36,48]. For example, in this type of research, the change in Gross Domestic Product (GDP) per capita under the intervention of the CP is analysed.
In other research, found in the literature, EU fund absorption is a dependent variable. This means that absorption is seen as a phenomenon which needs to be explained. This trend is observed in analyses seeking true determinants of the distribution of European fund absorption. According to Bodenstein and Kemmerling [49], these are different from the official criteria of fund allocation. In this case, we are talking about research on political economy, referring to a national theory of fiscal federalism. In the text cited and in the studies by Zubek and Henning [37], this theory is transposed to the problem of structural funding. Bodenstein and Kemmerling [49, p.1] describe it as the “two-tiered bargaining process in the EU”. The analyses by Zubek and Henning [37] are especially important from the viewpoint of the present paper because, as these authors point out, they are one of the few studies below the national and regional levels, i.e., they were conducted at the local level. In this case, they set out to clarify the role of local governments in determining the level of allocation of structural funds. From the point of view of fiscal federalism theory, the position of the local government depends on its ability to influence those in higher levels of government. Major factors in the distribution of transfers from European funds include the local electorate and individual lobbying skills. On the other hand, the authors consider the impact of a local-government unit’s administrative and financial capacity on the amount of funding absorbed. Finally, they argue that per capita income (as an estimate of local tax revenue, and thus the local government’s financial capacity) and administrative capacity (understood as the efficiency of producing public goods) are significant determinants of the distribution of fund absorption [37].
In the context of the debate on convergence and divergence processes, the way different factors influence the spatial allocation of EU funding below the NUTS 2 level has been investigated by Novosák et al. [38,40]. These authors concentrated on explaining the influence of factors determining the spatial distribution of allocations, paraphrasing the research question of Blažek and Macešková [50]: which regions are structural funds directed at, “rich” ones or “poor” ones? Their study takes into account factors related to the development level of Czech microregions as well as factors determining their absorptive capacity. The analysis shows that microregions at a lower level of socio-economic development absorb less structural funding. This runs counter to the criteria and idea of granting funding under Objective 1 of the Cohesion Policy, although it is not because of greater backwardness, but because of the lesser absorptive capacity resulting from it. In this context, Novosák et al. [38,40] noted a positive impact of entrepreneurship, innovation, a high standard of human capital and conurbation effects (high population density, high concentration of infrastructures) on absorptive capacity, and therefore on the level of allocation in individual microregions. The spatial distribution of European funding thus invokes the “centre-periphery” model of spatial diversity in which more funding is allocated in central microregions. Proof of the existence of a trend involving directing larger amounts of European funding to more competitive areas (central, urbanised, non-agricultural), with a higher level of human potential, is also provided by another study [28].
To conclude, research on the determinants of the allocation of cohesion policy funds (the absorption level) most often lists factors of a political nature, i.e., local electorate and individual skills of lobbying, as well as socio-economic: financial capacity, administrative efficiency, entrepreneurship, innovation, human capital, and the agglomeration effects.
2. Materials and Methods
In the present study, two concepts are key for achieving the research goal: the level of Cohesion Policy funding absorption, and the level of rural socio-economic development. Their definition in theoretical language and then their empirical use, including finding relevant sources of data, form the foundation of the study. The analysis covers the years 2007–2018 and considers all of Poland’s rural and rural-urban communes, a total of 2173 LAU-level local government units. The adoption of the lowest level of spatial unit aggregation yields the most detailed picture of spatial differences.
2.1. Measurement of Cohesion Policy Funds Absorption
Data on Cohesion Policy funding allocations were obtained from the following databases: KSI-SIMIK 07-131 (for the 2007–2013 financial framework) and SL20142 (for the 2014–2020 framework).3 From the beginning of 2007 until mid-2018, information about approx. 150,000 agreements, worth a total of PLN 500 billion,4 was gathered from the two databases. In both the financial frameworks, only projects carried out in rural and rural-urban communes were selected, to the exclusion of urban communes. In the data listed for completed projects, the outlays incurred as part of an intervention were assigned specifically to the location of the commune carrying out the project. For projects involving social infrastructure and public transport carried out in province and powiat/county capitals and other urban communes, their impact on the surrounding rural communes was taken into account. A methodology based on the following assumptions was adopted. First, 50% of the funds were left in the provincial capitals, while the remainder was allocated proportionally to the number of communes in their functional urban areas (FUAs). Secondly, in the case of towns or cities that were the capital of a county, it was assumed that 50% of the funds would be left within their administrative boundaries. The remainder was distributed proportionally according to the number of communes bordering the urban commune that is the county capital. The last case concerns urban-rural communes (consisting of a central, urban part and a rural one - surroundings). In this case, 50% was left in the central part, while the remaining funds were allocated to the rural part.
Similar to the research by Rakowska [51] and by Novosák et al. [38], here, the absorption level is expressed in the amount of money spent per capita under the Cohesion Policy in each territorial unit. In other words, it is the relative allocation amount. In their analyses, Zubek and Henning [37] used the amount of structural-fund spending per unit of area, adding that using allocation-per-capita did not change the estimates.
2.2. Measurement of the Level of Socio-economic Development
The authors define socio-economic development based on Rosner and Stanny’s [29, p. 13] definition: “the process of transforming rural areas into an inhabitant-friendly environment, i.e., one which allows them to fulfil their needs and aspirations, particularly with regard to labour conditions and obtaining satisfactory income; access to public services and broadly defined cultural goods; a sense of participation in the life of the local community; a sense of agency in the ongoing transformation; etc.”. The level of socio-economic development is the degree of transformation of the social and economic environment in this direction.
Measuring this is a complex task [52], and the choice of empirical variables cannot be universal but should reflect the situation in rural Poland. That is why socio-economic development in this study was measured with the help of variables that were required to fulfil the following conditions:
- -
- they had to characterise socio-economic development, as defined above, as comprehensively as possible, but at the same time the range of measures had to be limited only to the most important ones,
- -
- statistical data had to be available at commune level, gathered using the same methodology in all the units in the study,
- -
- they had to be characterised by not very strong correlations between them, but by substantial spatial diversity (expressed as a high coefficient of variation).
The quantification of the socio-economic development level took account of elements of social and economic characteristics as well as absorption capacity for every commune in Poland. The ten variables ultimately adopted for further analysis were:
Z1—The percentage of people of post-working age (60/65+ in Poland). This describes the demographic structure or, more precisely, indicates how advanced the demographic ageing process is in a given local community. The measure is a lower-the-better characteristic. The source of data is BDL GUS.5
Z2—The migration balance per 1000 residents. This is a demographic variable, but its explanatory capacity is greater, as it describes the localisation attractiveness of a given unit, especially of its labour market [53]. The measure is a higher-the-better characteristic, calculated as a three-year average. The source of data is BDL GUS.
Z3—The percentage of localities within a commune with access to public transport (excluding school transport). This is a measure of a commune’s spatial accessibility. Transport connecting villages to one another, and especially to the headquarters of local authorities, is very important to residents. The central village or county capital usually attracts not just administrative bodies but also public services, as well as serving as the local labour market [54,55]. The measure is a higher-the-better characteristic. Source of data: the third commune questionnaire from the Rural Development Monitoring (MROW) programme.
Z4—The proportion of non-agricultural business entities in the total number of businesses in the commune6. This is a measure of the degree of the local economy’s deagrarianisation, understood as the growing role of non-agricultural functions in providing residents with a source of income. The need for deagrarianisation lies at the foundation of the concept of multifunctional development, or sustainable development [56]. It is thus an extremely important element of development, and is also tied to social development through the growth of public services and increased employment in them. It is assumed as a higher-the-better characteristic of development. Source of data: unpublished data from the Ministry of Finance and the Agency for Restructuring and Modernisation of Agriculture (ARiMR).
Z5—The number of pensioners receiving Agricultural Social Insurance Fund (KRUS) old-age pensions per 100 people of post-working age. This measure characterises the agricultural function in the local economy. It is assumed as a lower-the-better characteristic, not because it applies to people of post-working age (other data are unavailable), but because it draws attention to an issue important in Poland and connected with excessive employment in agriculture in the family-farm sector (including hidden unemployment). Source: unpublished Agricultural Social Insurance Fund (KRUS) and BDL GUS data.
Z6—The number of PIT and CIT taxpayers per 1000 residents. This measure illustrates the role of non-agricultural sources of income in the local economy, including the importance of local entrepreneurship, thus showing how advanced the departure from the agricultural function is. It is a higher-the-better characteristic of development. Source: unpublished Ministry of Finance and BDL GUS data.
Z7—The proportion of the commune’s own revenue in overall revenue. This measure, calculated as a three-year average, characterises the situation of commune budgets, revealing potential possibilities to improve the conditions for it to fulfil its tasks (including the development of infrastructure and access to public services). This is a higher-the-better characteristic of development. The source of data is BDL GUS.
Z8—The number of applications for funding to support projects co-financed with Cohesion Policy funds for the years 2007–2013 per 10,000 residents. This is one of three measures that indicates a commune’s absorption capacity. It shows how active local governments are in obtaining funding, measured not in outlays but in the number of applications that qualify for funds after meeting formal requirements. It is a higher-the-better characteristic. Source: the SIMIK database made accessible by the Ministry of Development Funds and Regional Policy.
Z9—The number of applications for funding to support projects in the Leader approach for the years 2007–2013, submitted through a Local Acton Group, per 10,000 residents. This is the second measure of absorptive capacity, this time showing the capacity not only of the local government, but also of residents who are or are not members of various organisations, to obtain EU funding. The implementation of the Leader approach was mainly based on using residents’ knowledge and experience to foster local development, thus including them in the decision-making process [57]. Projects submitted by LAGs usually involved smaller sums but played a major role in motivating communities and identifying leaders of social life, and also in the cooperation of NGOs with local authorities. This is a higher-the-better characteristic of development. Source: unpublished data from 16 marshals’ offices.
Z10—The percentage of councillors who are a university or high-school graduates. This is the third measure of absorptive capacity, this time related to the potential competence of local commune authorities (specifically in serving as local-government members), which translates into the capacity to apply for external funding for local development. The range of this measure also includes “human capital”. The election of councillors with specific competences also indicates the importance of education to the residents. Source of data: BDL GUS.
The process of arriving at a synthetic measure involved several successive statistical stages: gathering the empirical variables in the aggregation of communes and assigning them the rank of higher-the-better (positive variable) or lower-the-better (negative variable); normalisation using the zero-unitarisation formula [58]; weighting and defining the synthetic variable based on the zero-unitarisation sums procedure. The synthetic variable obtained from the following formula assumes values within the range (0,1): where is the normalised value of the j-th feature in the i-th object (after the negative variable is changed to a positive variable), n is the number of objects, and mi is the weight factor of an i feature [59]. Equal weights were given to each empirical variable. This decision was motivated by the need to limit any arbitrary decisions by the researchers in this regard. The research approach adopted here is called the method of sums in the literature [60].
From a research methodology point of view, the scale is an ordering one; it maps the relations of “equal to” and “greater than” between the objects of the analysis, but it does not enable us to determine “how much greater” the measurement result for one commune is compared to another. To facilitate the interpretation of the values organised on a scale from 1 to 2173 (the number of commune units included in the study), the socio-economic development scale was divided into three equinumerous classes: high, medium and low level of development.
The study of how strongly the different variables influence development processes was based on correlation analysis. The choice of the analytical form of the function was an important stage to ensure these correlations were properly described. It was assumed that the coefficient for investigating the relationship between the diagnostic (empirical) variables would be based on the Pearson correlation coefficient (r). All the variables are described on ratio scales, i.e., scales that are logically more powerful but substantively weaker than the scale describing the synthetic measure (based on an ordinal scale). This is why the non-parametric statistic Spearman’s rho (R) was used for the aggregate variables, as it is a measure of the monotone dependence of random variables. It should be interpreted as the percentage of variances of the ranks of one variable explained by another [61].
3. Results
3.1. Level of Cohesion Policy Funds Absorption
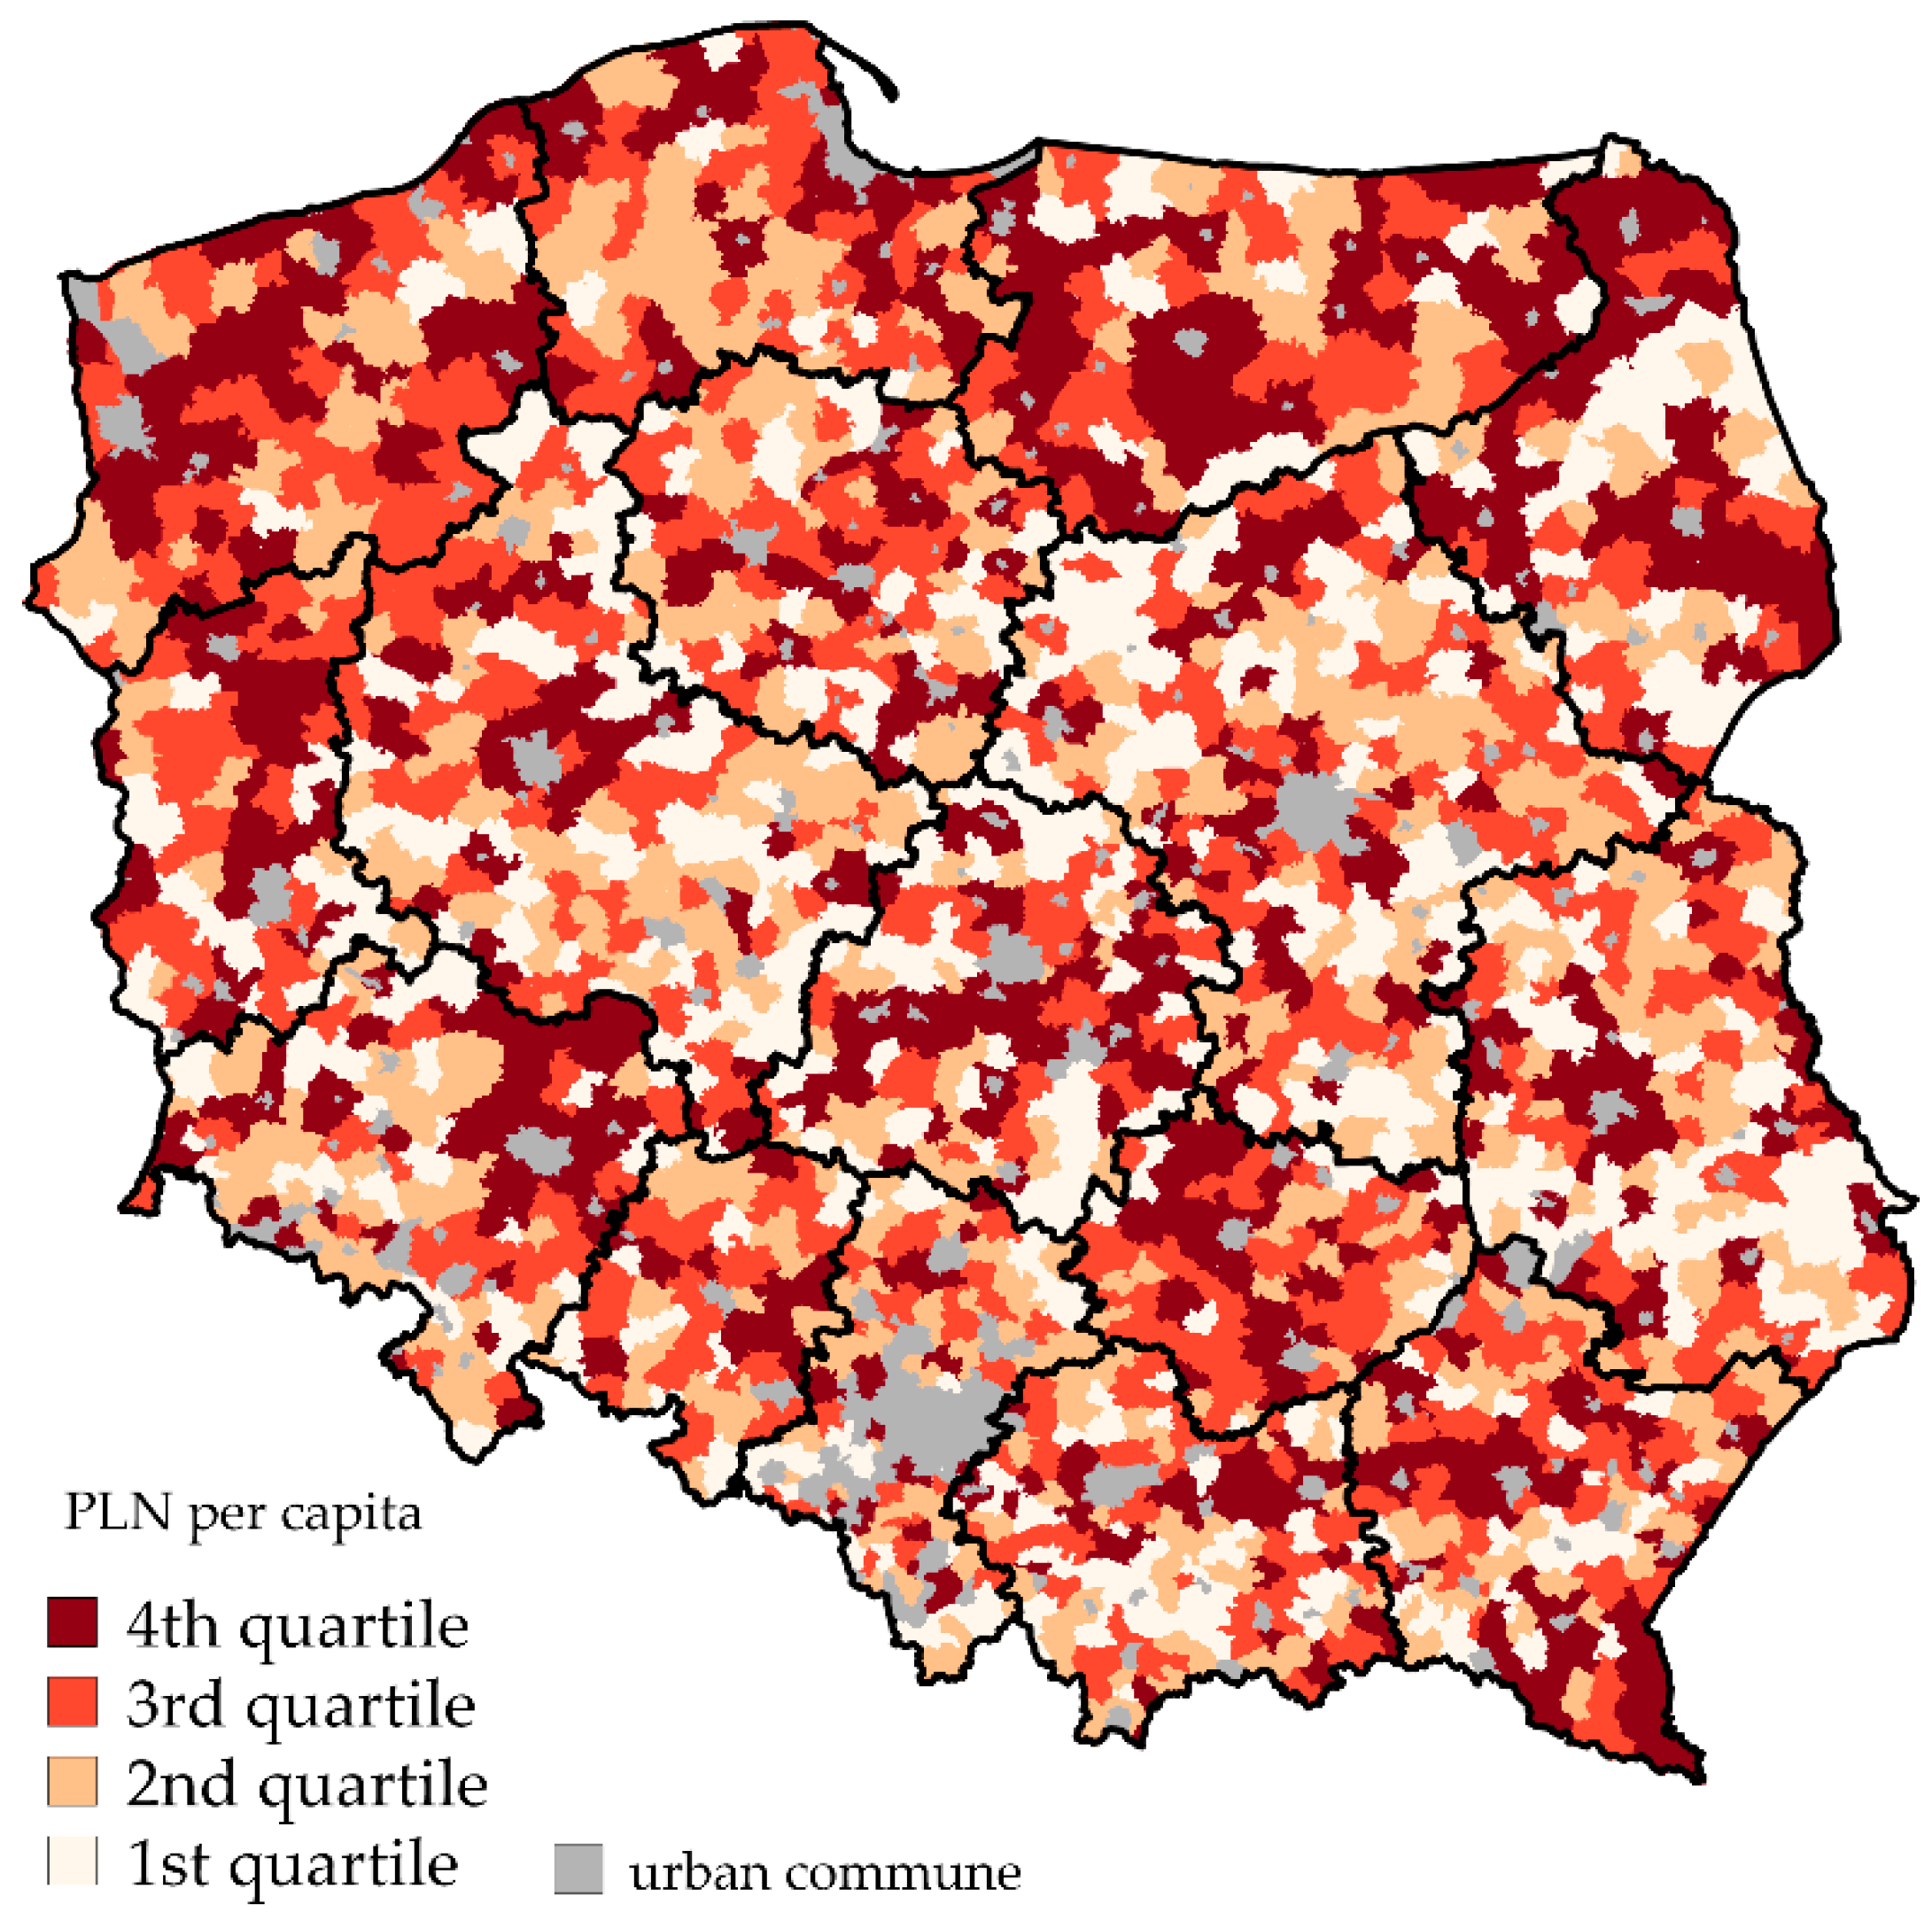
In the period covered by the study, projects worth a total of PLN 178.7 billion were carried out in rural Poland, and taking into account the estimated impact of some urban projects of a supralocal nature it was PLN 186.5 billion. The results of the distribution of per capita spending under the Cohesion Policy is shown in the choropleth map divided into four quartiles (Figure 1). The spatial distribution is significantly mosaic-like, which is confirmed by the very high variation coefficient, as high as 164%. Due to the purpose of the study, it is especially important to identify communes with a high level of absorption, treated as the units most effective at obtaining funding to support projects. To this end, the authors have assumed that the fourth quartile of the distribution identifies communes with a high level of absorption of Cohesion Policy funding.
The statistics of the arithmetical mean and median indicate (Table 1) that the cut-off thresholds for each of the first three quartiles are close to a multiple of the value of the first quartile (about PLN 1600 per capita). The average absorption in communes from the first quartile is as much as 15 times lower than in communes from the fourth quartile. Even the difference between the third and fourth quartiles is quite substantial, at about PLN 17,000. The group of communes where per capita outlays are the highest stands out very markedly from the rest. Taking into account the high dispersion of the absorption level measure, for further analysis, the communes were therefore divided into two groups according to the value of funding allocated: below and above the third quartile of the variable’s distribution.
3.2. Level of Socio-Economic Development of Rural Areas
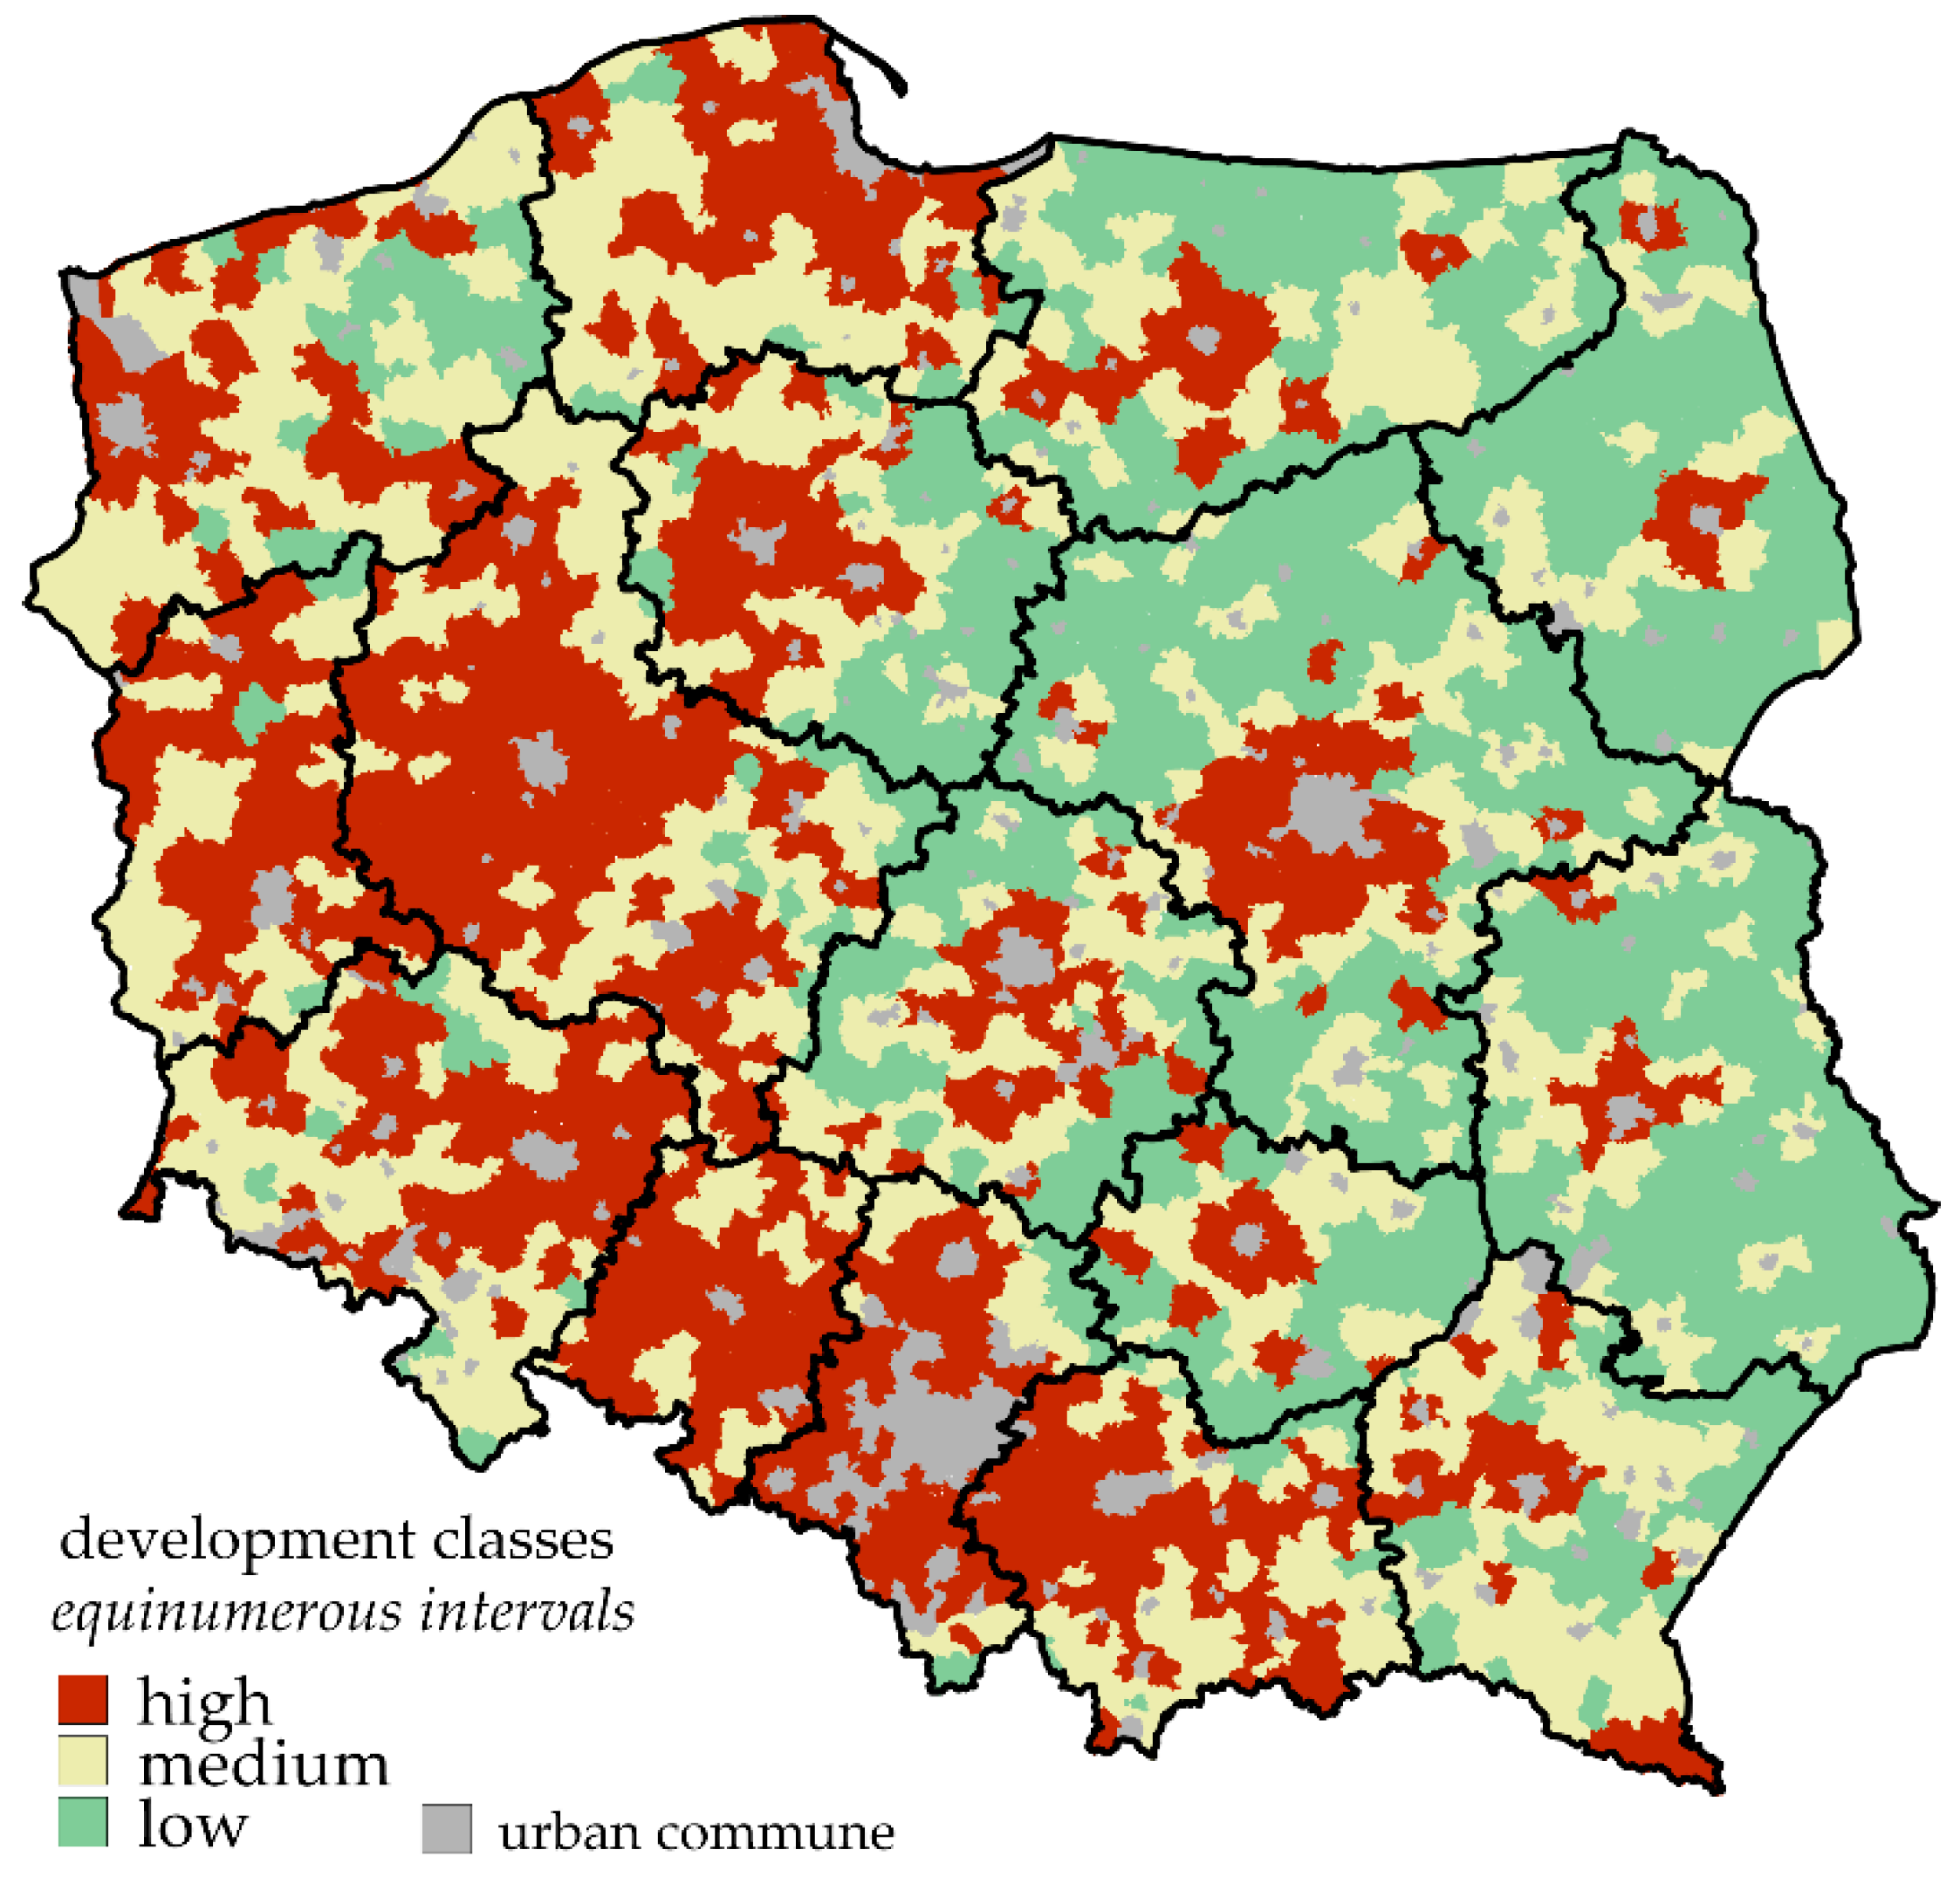
Based on the variables described in the methodological section, the characterisation of rural development in Poland was used to measure the development level with the help of a multi-criteria measure. As mentioned above, it was decided to calculate the synthetic measure directly from the normalised empirical variables (assuming their equivalence). The resultant measure is hierarchic and its spatial distribution is relatively ordered, which is confirmed by the variation coefficient of 25%. The spatial diversity of the socio-economic development achieved by communes is shown in the choropleth map (Figure 2).
The analysis results show a polarisation of socio-economic development according to two criteria ordering the spatial distribution, which are as follows: east versus west for regions (boundaries running through the middle of the country or between two large regions—such as between Mazovia and Wielkopolska), and centres versus peripheries within regions. The results thus suggest that two factors affecting the spatial arrangement of rural areas continue to be of key importance. The first factor is historical, connected with Poland’s past borders (especially in the 19th and early 20th century) [62,63]. In the eastern and central part of the country, with a low level of development, agriculture still dominates the local economy. The western regions (under Prussian rule during the partitions) have come to develop multifunctional local economies. The other factor is linked to location in relation to regional centres, i.e., centres around towns and cities (especially large and medium-sized ones) versus areas with a peripheral location in relation to the urban network. Between these areas is an intermediate zone forming a continuum between the central and peripheral zones [64].
3.3. The Correlation between the Level of CP Funds Absorption and the Level of Socio-Economic Development
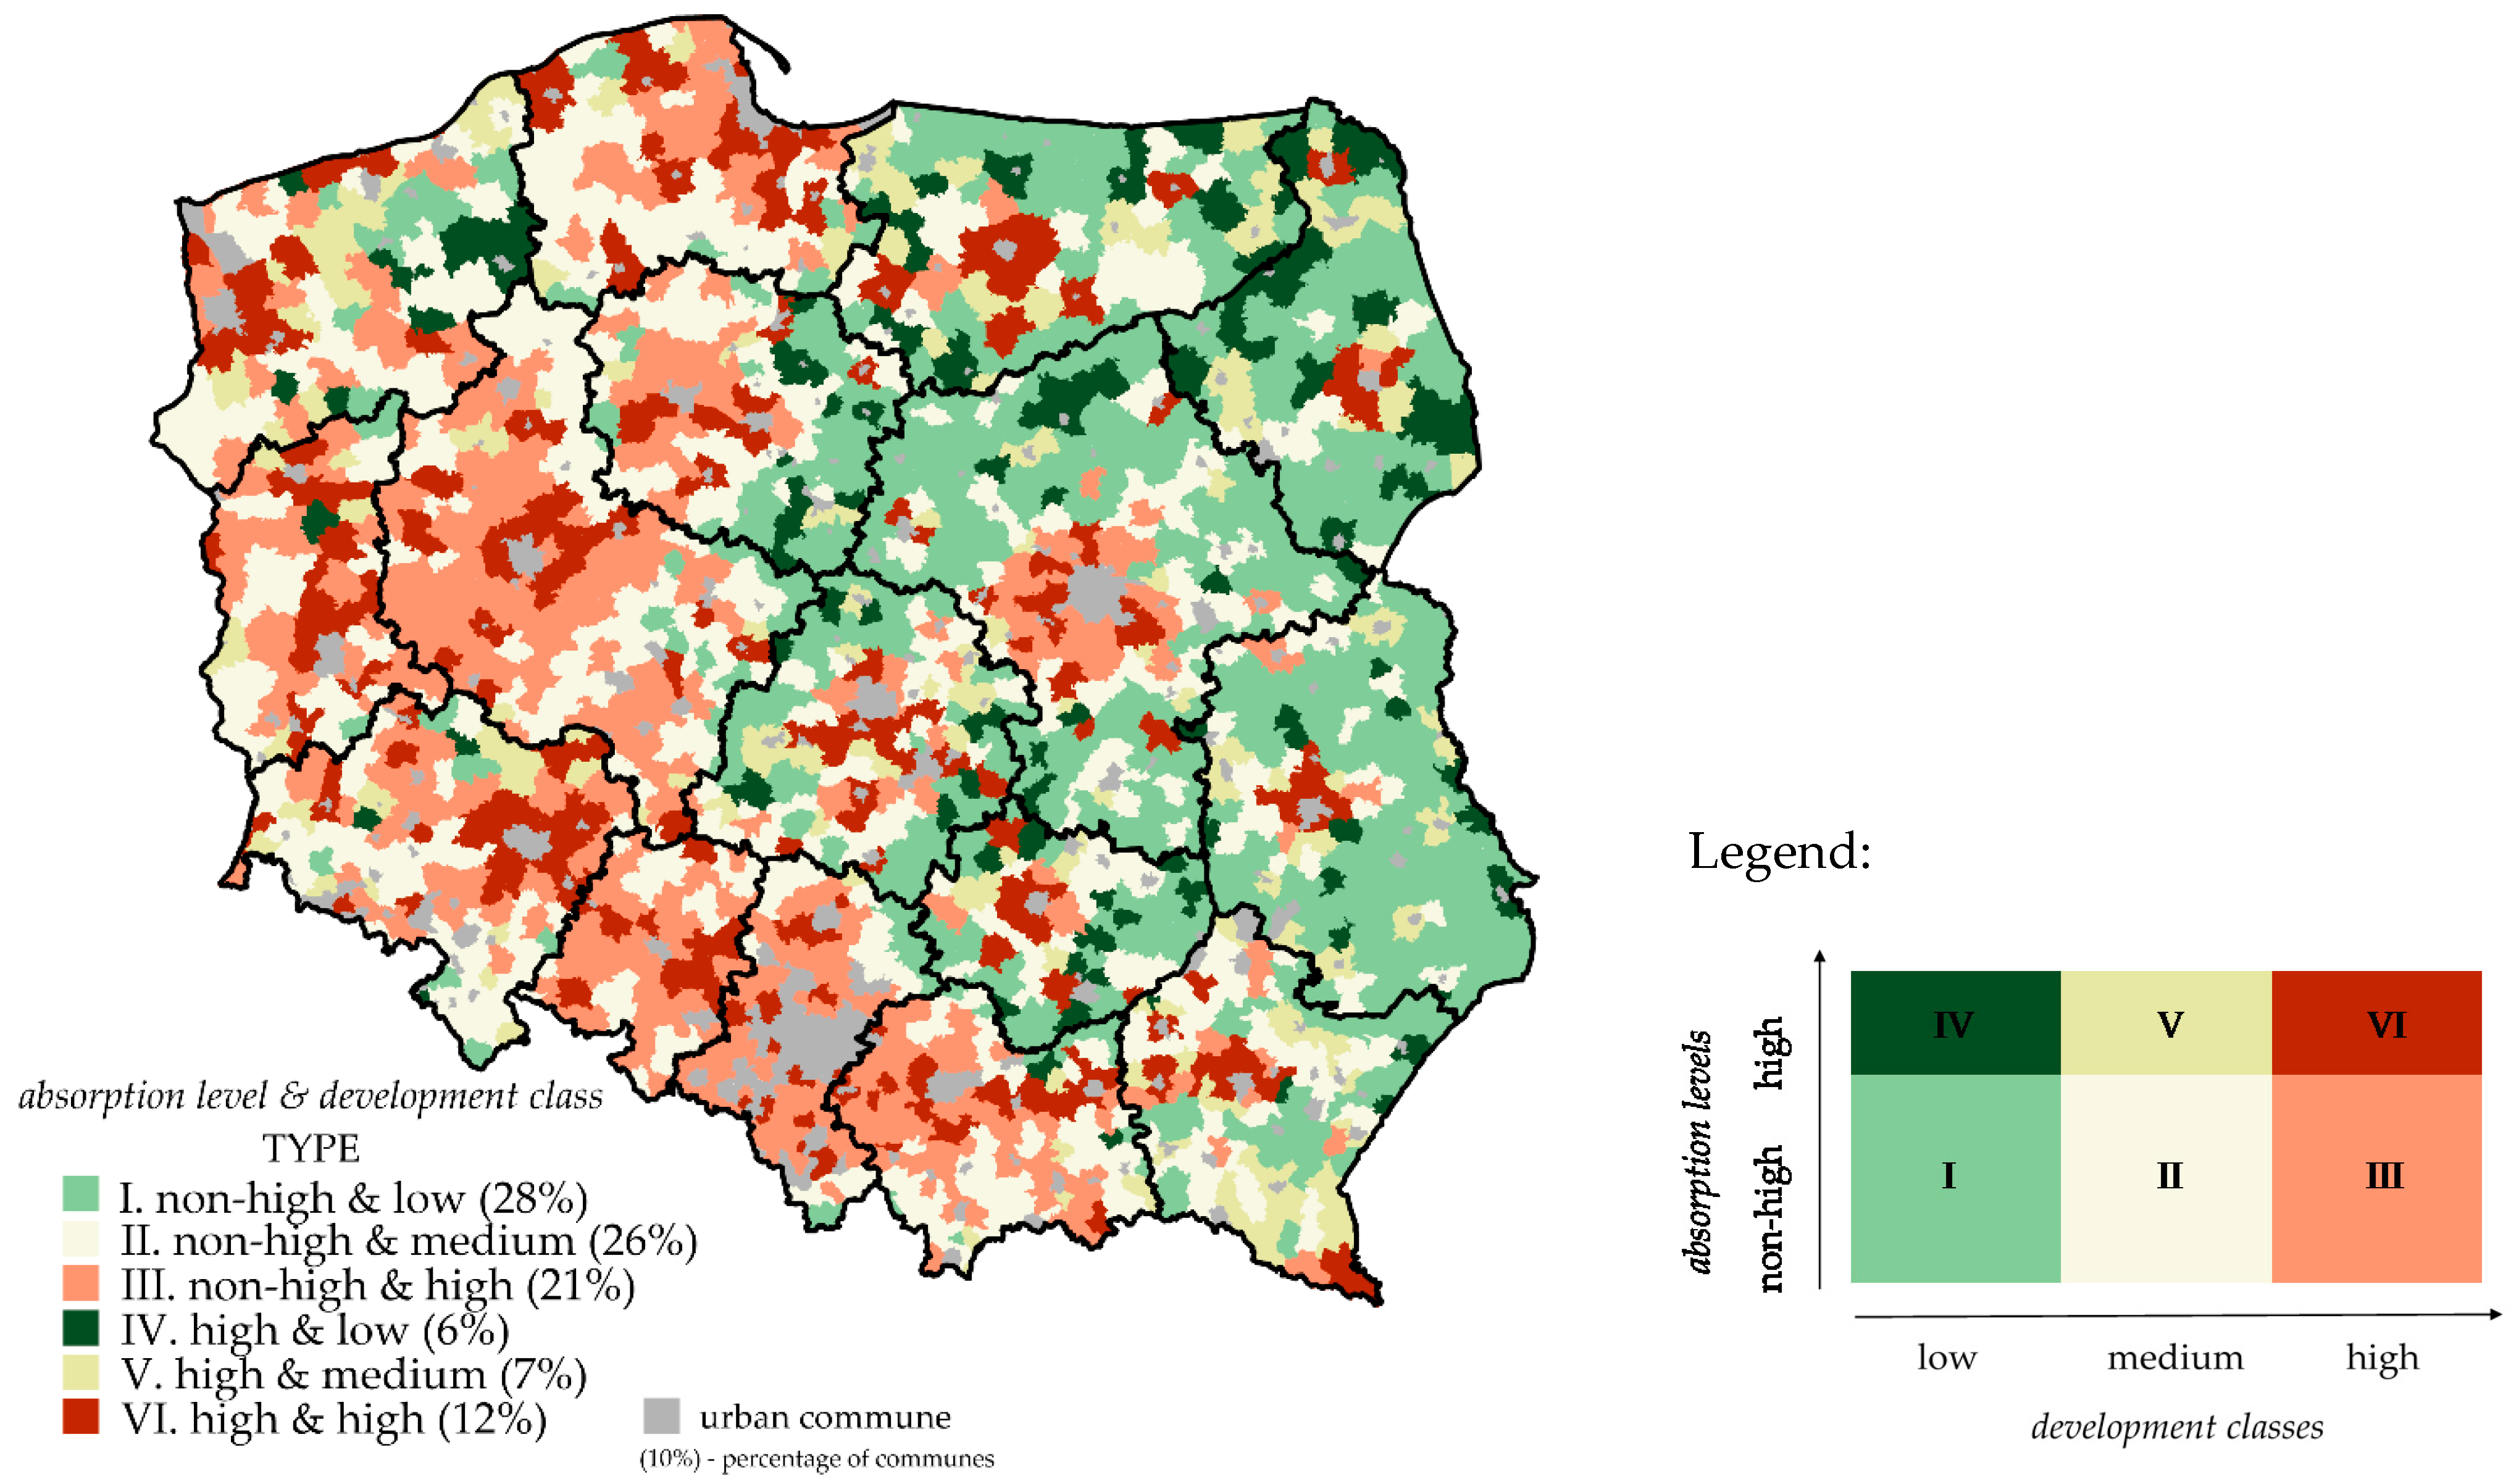
Once the two hierarchical scales described above were obtained, they were collated with the help of an array ordering the communes (see key in Figure 3). Each commune was assigned to one of six types of similar units with a specified level of development (x-axis in the Figure 3 key) and allocation of Cohesion Policy funding (y-axis in the Figure 3 key). The first step in the research procedure involved using the classification of communes by development level, forming three equinumerous classes: communes with a low development level, communes with a medium development level, and communes with a high development level. Next, two of these three classes were distinguished using the “absorption level” variable: the high (comprising the fourth quartile) and the non-high level. In addition, the relationship between the development level and the absorption level was verified using Spearman’s rank correlation coefficient (Spearman’s rho) with respect to the ordering scale of the development level measure.
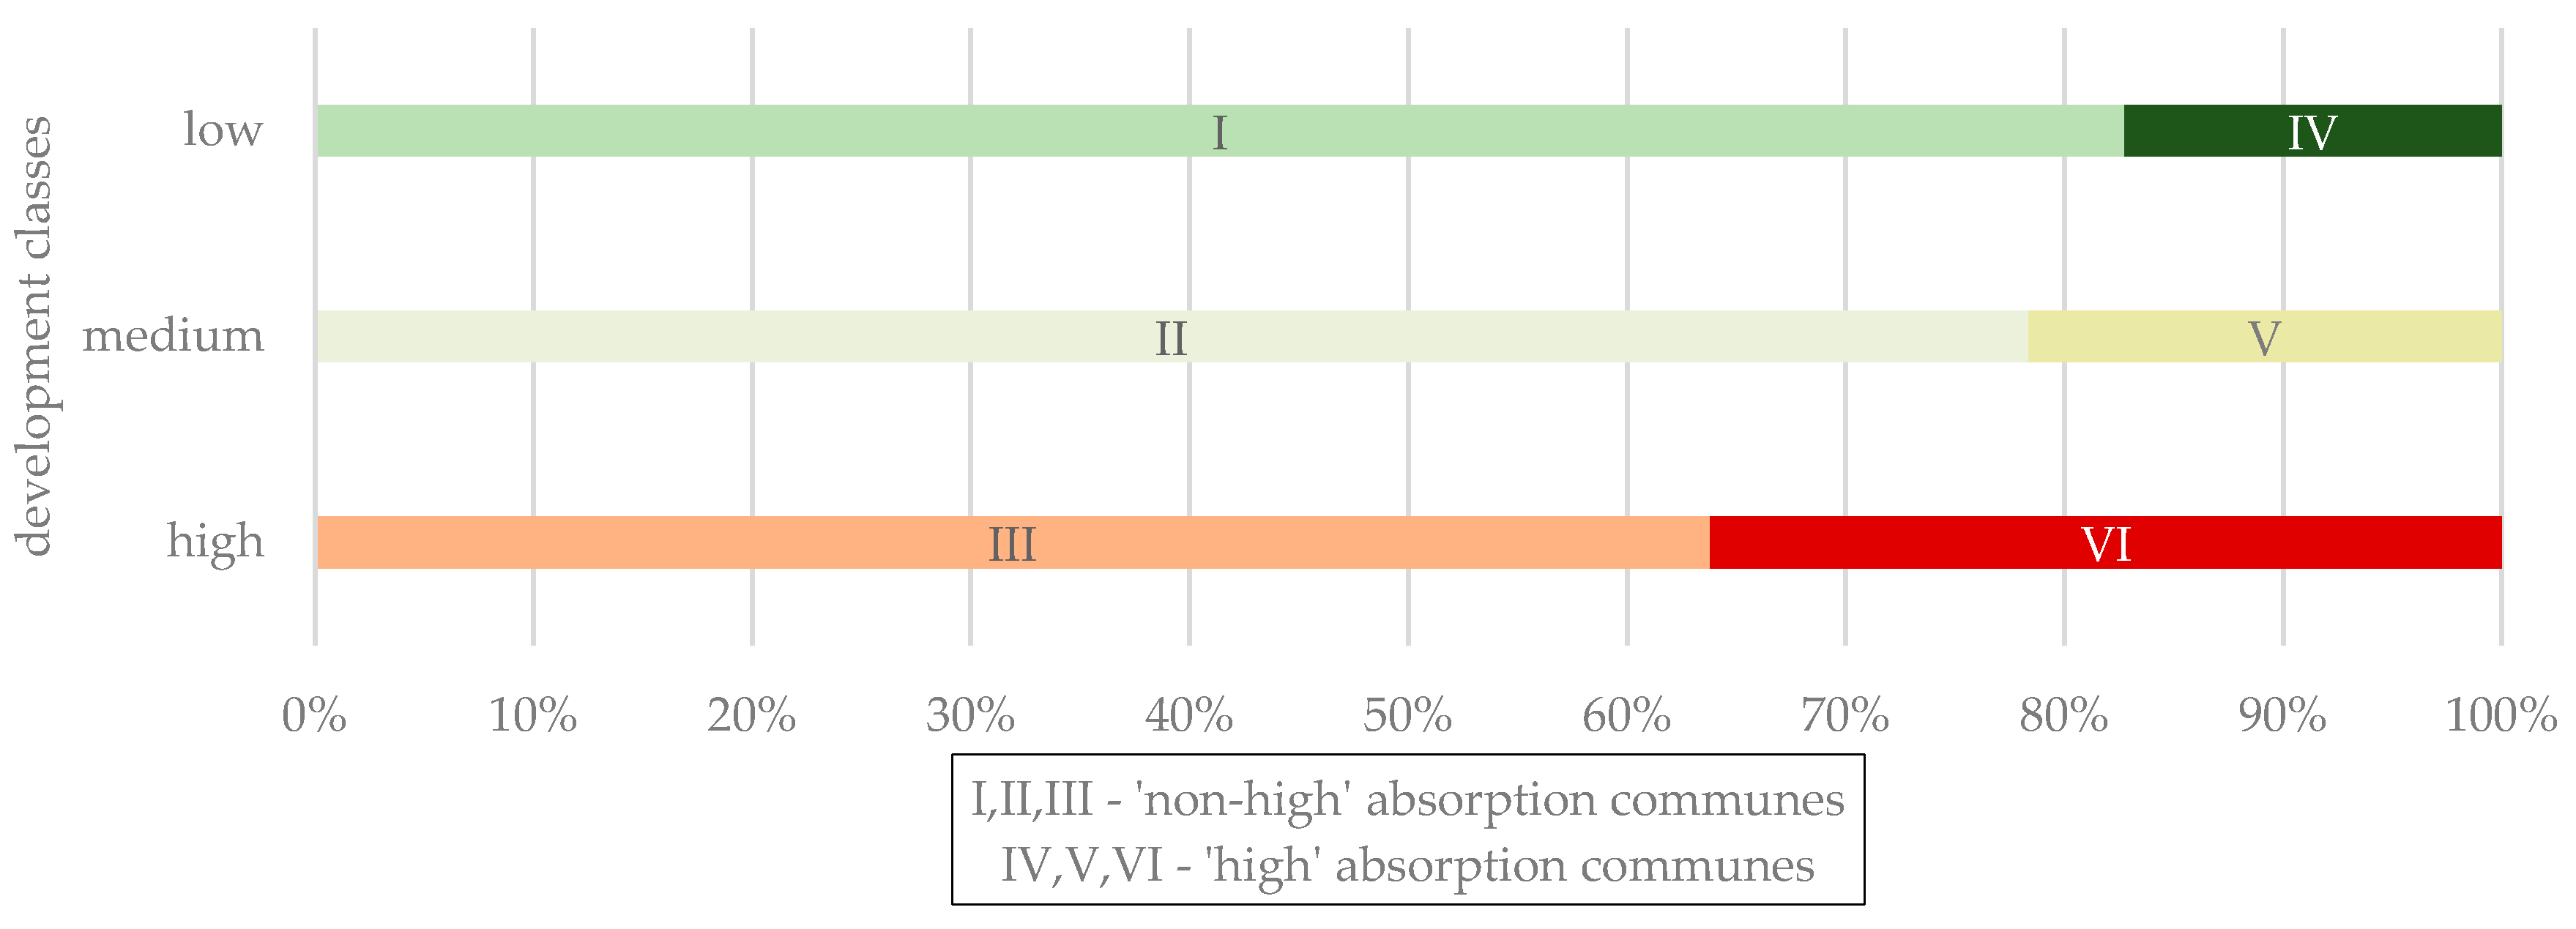
The result of the research procedure in which every commune was placed in one of the array’s six groups is presented spatially (Figure 3) and expressed as the percentage of high/non-high absorption communes in the three socio-economic development classes (Figure 4). Furthermore, in order to characterise the different groups, the statistics of selected variables are also presented (Table 2). This step provided an answer to the question of whether a high level of EU funding absorption is connected with specific local conditions of socio-economic development (such as human resources possibilities, social capital, financial capacity, or the structure of the local economy).
The spatial layout reveals a relationship between the spatial distribution of funding and the level of socio-economic development. There is a noticeable concentration of communes with a high absorption of funding for implementing Cohesion Policy objectives mainly around regional capitals. These units account for 36.2% of the communes with the highest level of development (type VI—high & high). The average per-capita absorption in this group of communes is PLN 24,620, which, at more than PLN 15,000, is above average for all the units under consideration. These communes are characterised by the very good condition of local budgets, a high population density and an advantageous demographic structure: the local community is relatively young, mainly due to large-scale incoming migration (Table 2). These are communes with strong functional ties to a town or city with a major role in the regional settlement structure. Hence their residents are highly enterprising and represent a high level of human capital (which also exists in the structures of local governing agencies). With reference to the level of local autonomy, it is worth noting that, compared to the other types, the share of these communes’ own revenue is highest in type VI.
At the opposite pole are most of the communes with the lowest level of socio-economic development, among which as much as 83% show a non-high level of absorption (type I—non-high & low). Communes from this development class are mainly in eastern and central Poland (Figure 3). They are relatively monofunctional economically, with the smallest share of non-agricultural businesses in the overall number of businesses, and are dominated by traditional, family farms. In this group of communes, half of the people of post-working age are retired farmers (Table 2). Severe depopulation processes are underway there, and the age structure is the oldest in the country. Consequently, apart from economic problems, these communes struggle with numerous social problems, e.g., limited access to public services, residents’ relatively low level of education, etc. (the smallest proportion of councillors with university education). The average per capita allocation of Cohesion Policy funding in this group is just PLN 3259, i.e., PLN 5500 less than the average for the population under consideration.
Communes at the lowest level of development with simultaneously high levels of absorption (type IV—high & low) are especially interesting as an object of research. These communes report the country’s highest activity level of local communities (via the local government or the non-profit sector) in winning projects not only from funds assigned to Cohesion Policy objectives but also from the Common Agricultural Policy. Such application success is achieved in communes whose characteristics indicate the lowest population density in the country and the highest migration loss (see Table 2). This also translates into infrastructural development difficulties, higher unit costs of investment projects and services that have to be carried out in every Polish commune regardless of location (in this case, as much as a third of village units have no public transport). Based on statistical data and completed quantitative research, it is only possible to surmise the reasons for such a “breaking” of the non-high absorption trend in this low-development group of communes. A reconnaissance (chiefly in the social media and on commune websites) suggests the presence of a “good-leader effect”, in which a leader aware of a deficit of local resources (e.g., financial, infrastructural) saw a chance to reduce it through obtaining EU funding. Verifying this tentative hypothesis would require more in-depth research in each of the Type IV communes (there are 125 and they account for 17% of all the low development level communes). The task is made even more difficult by the fact that they are not concentrated geographically, and their spatial distribution is mosaic-like (the surroundings of smaller sub-regional and local towns, the junction of provincial borders) (Figure 3).
Similar conclusions can be drawn from analysing the location of the 22% that are medium-development communes, which displayed a high absorption rate (type V—high & medium). However, their socio-economic situation is relatively better (Table 2).
Let us look at a few of the most important features that distinguish high-absorption communes at each level of development (types IV, V, VI), in relation to the other communes (types I, II, III). First of all, there is the structure of the local economy. Communes with higher absorption rates show a higher level of deagrarianisation of the local economy, which is expressed both in a higher share of non-agricultural businesses and of income-tax payers and in a lower share of retired farmers among residents of post-working age (which reflects the agricultural sector’s role in the local economy). Communes with higher absorption are also characterised by higher median revenue and higher indicators related to social potential. They also have higher absorption potential based on the number of applications for the EU 2007–2013 project funding per 10,000 residents.
The above description of the types using an analysis of local resources—such as demographic potential, location attractiveness and the spatial accessibility of the commune, its financial situation or the structure of the local economy—proves that a high level of absorption of EU funding is connected with specific circumstances. Of the range of ten variables adopted for the analysis, the one with the strongest correlation with the level of absorption is the commune’s own revenue in the overall budget. This confirms that wealthier local governments are relatively more often beneficiaries of Cohesion Policy funds. The statistical inference here shows a positive correlation between the absorption level and the development level (graph in Figure 4). It should be said, however, that this linear relationship is not strong, with a Spearman’s Rho correlation of about 0.34**.7 The authors underline that the reality is more complex, being determined by hard-to-measure, non-linear relationships as well.
4. Discussion and Recommendations
Studies on the absorption of funding from the Cohesion Policy most often indicate that urbanised areas are the policy’s priority. According to the research by Churski et al. [65] (p. 69), urbanised areas are “the areas privileged in obtaining the most generously co-financed European projects”. As pointed out by Rodríguez-Pose and Garcilazo [66], the large concentration of funding in highly urbanised areas with a high population density, especially regional centres, is linked to the high effectiveness of spending and a substantial return on investments in these areas.
The present case study of Poland shows that almost 40% of CP funding in 2007–2018 (approx. PLN 185 billion) was allocated to rural areas. The scale of these outlays shows that there are large investment needs not just in towns and cities and their functional areas. It should be underlined, however, that rural areas make up 93% of Poland’s area and are inhabited by 40% of the country’s population. The absorption of funding per sq. km amounted to PLN 638,000 in rural and rural-urban communes, and PLN 14.5 million in towns and cities—figures of PLN 12,300 per rural resident and of PLN 14,000 per urban resident. These are mean values, yet it should be remembered that the majority of support for rural areas is concentrated in the immediate surrounding of regional centres with leading administrative functions. All this shows that rural areas as a public intervention category are, in a way, “torn” between the Common Agricultural Policy and the Cohesion Policy. In the former, support is directed mainly to agricultural activity. Approximately 75% of the CAP budget in Poland supports farmers’ incomes and 25% is allocated to rural development. The budget is therefore targeted only at part of the rural economy (22% of rural residents work mainly or additionally in agriculture [67]). On the other hand, the aim of the latter policy is convergence at the NUTS 2 level, which is achieved particularly through the rapid development of urban centres [68].
While acknowledging that territorial cohesion is the goal, instruments for controlling rural development should be chosen in such a way as to take account of local uniqueness. Poorly developed rural areas cannot compete with larger towns and cities for funding. Moreover, differences in local conditions (endogenic resources) define the needs and influence the development chances of rural communes. We therefore recommend:
- To provide stronger support for the least-developed rural areas by amending the allocation rules (1st recommendation).
- To introduce an obligatory minimum threshold of allocation to rural areas in regional operational programmes, or a varying level of minimal internal contributions, depending on the kind of intervention and the type of commune (2nd recommendation).
- To create an appropriate, simple, and intuitive methodology, one that takes into account features such as the affluence of local governments, the demographic conditions, and the accessibility of regional centres (services and labour markets) (3rd recommendation).
It is worth relying on knowledge of the territorial differences in Poland. These point to two spatial regularities: a continuum from the centre to the peripheries, and an east-west arrangement [5,29,30]. The polarisation-diffusion model, which was promoted in Poland until recently, assumed that most of the funding available would go to regional centres first, and then the effects of such investments would have a positive impact on other areas in the regions [69]. However, it turned out that the spatial reach of the effects of diffusion was insufficient [27,70]. The new Polish regional development policy assumes that areas that have lost their socio-economic functions (including small and medium-sized towns and some rural areas) have to receive necessary stimulation [71]. It is anticipated that this will be a way of distributing economic stimuli more evenly across the territory (e.g., cooperation between local governments, activation of socially and economically marginalised areas, development of transport and communications, implementation of social and technological innovations), to also include areas further from provincial capitals. Assuming that changing the development model is a long process, the effects might therefore not be visible in statistical models for some years.
5. Conclusions
The Cohesion Policy is responsible for the integrated territorial development of regions in the European Union8. Taking Poland as its case study, the paper has explored the extent to which rural areas benefit from the CP. Taking into consideration the criterion of a commune’s socio-economic development, the units with the highest level of CP funding absorption were identified, and then the relationship between this level and the occurrence of specific local development conditions was investigated.
The calculations show that almost 40% of CP funding was allocated to rural areas, which are inhabited by 40% of Poland’s population. However, this is only ostensibly a balanced allocation. The distribution of the per-capita allocation of CP funding is very spatially varied. Some regularities can only be determined after comparing this allocation level to the communes’ socio-economic development (which is essentially organised along the axis of the centre-peripheries continuum, though the impact of historical circumstances is still noticeable along the east-west axis). In general, there is a positive correlation between the absorption level and the rural development level. However, this is not a strong correlation, although it is statistically significant. Unlike the level of CP funding absorption, the level of communes’ socio-economic development displays a relatively low diversity of distribution.
An analysis of the spatial distribution of the Cohesion Policy outlays confirms that a higher level of absorption is more often seen in communes with greater development potential. The highest absorption was found in more than a third of communes with a high level of development and in less than one-fifth of communes with a low level of development. In this study, we found confirmation of the hypothesis, which was also verified in other research [37,38,40,73,74], that Cohesion Policy funding is still more often directed to “wealthier” local governments. Among the variables measuring the rural development level and included in the analysis, the financial wealth of communes correlates most closely with Cohesion Policy outlays. A good condition of the local budget may mean greater capacity for generating a unit’s own contribution or indicate high competence of the leader and local-government councils pursuing an appropriate local development policy. Other factors are also important, such as residents’ greater resourcefulness (enterprise) and advanced deagrarianisation of the local economy. With a commune’s growing development level, the role of the non-agricultural sector in the local economy increases, while the share of the agricultural sector diminishes. This relationship is another important correlate of a high absorption of CP funding.
To sum up, the absorption level under analysis displays a greater correlation with the variables characterising the extent to which an agricultural area has transformed into a multifunctional area than with a commune’s absorptive capacity. The weight of the latter characteristic is greater in communes that achieve a relatively lower level of development.
Author Contributions
Conceptualization, Ł.K., A.M., and M.S.; methodology, Ł.K., A.M., and M.S.; formal analysis, Ł.K., A.M., and M.S.; investigation, Ł.K., A.M., and M.S.; resources, Ł.K., A.M., and M.S.; writing—original draft preparation, Ł.K., A.M., M.S.; writing—review and editing, Ł.K., A.M., and M.S.; visualization, Ł.K. and A.M.; supervision, M.S. All authors have read and agreed to the published version of the manuscript.
Funding
This research received no external funding.
Acknowledgments
The study uses data from the Rural Development Monitoring (MROW) project carried out jointly by the European Fund for the Development of Polish Villages (EFRWP) and the Institute of Rural and Agricultural Development, Polish Academy of Sciences (IRWiR PAN). The data were obtained from: the Local Data Bank under the Statistics Poland (GUS), the Agricultural Social Insurance Fund (KRUS), the Agency for Restructuring and Modernisation of Agriculture (ARiMR), the Ministry of Finance (MF), the Ministry of Development Funds and Regional Policy, 16 Marshal Offices, the gminas Survey.
Conflicts of Interest
The authors declare no conflict of interest.
References
- Kachniarz, M. Bogactwo Gmin—Efekt Gospodarności Czy Renty Geograficznej? (Communities Wealth—the Effect of Thrift or Geographical Advantage?); Wydawnictwo UE we Wrocławiu: Wrocław, Poland, 2011. [Google Scholar]
- Kopczewska, K. Renta Geograficzna a Rozwój Społeczno-Gospodarczy (Geographic Advantage and Socio-Economic Development); CeDeWu: Warsaw, Poland, 2008. [Google Scholar]
- Wiggins, S.; Proctor, S. How Special Are Rural Areas? The Economic Implications of Location for Rural Development. Dev. Policy Rev. 2001, 19, 427–436. [Google Scholar] [CrossRef]
- Heffner, K. Regiony Międzymetropolitalne a Efekty Polityki Spójności w Polsce (Inter-Metropolitan Regions and the Effects of Cohesion Policy in Poland); PNUEWr: Wrocław, Poland, 2010; pp. 163–184. [Google Scholar]
- Stanny, M. Typology of Peripheral Rural Areas—Anatomic Approach. In Transformation Processes of Rural Areas; Kamińska, W., Heffner, K., Eds.; Studia Regionalia KPZK PAN, 36: Warsaw, Poland, 2013; pp. 37–50. [Google Scholar]
- A’Hearn, B.; Venables, A.J. Internal Geography and External Trade: Regional Disparities in Italy, 1861–2011. SSRN Electron. J. 2010, 12, 1–57. [Google Scholar] [CrossRef] [Green Version]
- Küpper, P.; Peters, J.C. Entwicklung Regionaler Disparitäten Hinsichtlich Wirtschaftskraft, Sozialer Lage Sowie Daseinsvorsorge und Infrastruktur in Deutschland und Seinen Ländlichen Räumen (Growth of Regional Disparities in Terms of Economic Strength, Social Situation, Public Services and Infrastructure in Rural Germany); Thünen: Braunschweig, Germany, 2019. [Google Scholar] [CrossRef]
- Copus, A.; Psaltopoulos, D.; Skuras, D.; Terluin, I.; Weingarten, P. Approaches to Rural Typology in the European Union; Ratinger, T., Giray, F.H., Eds.; European Communities: Luxembourg, 2008. [Google Scholar]
- Carmo, R.M. Polycentrism as a Multi-Scalar Relationship Between Urban and Rural Areas: The Case of Portugal. Eur. Plan. Stud. 2012, 21, 149–166. [Google Scholar] [CrossRef]
- Eurostat. Updated Urban-Rural Typology: Integration of NUTS 2010 and the Latest Population Grid. 2015. Available online: https://ec.europa.eu/eurostat/statistics-explained/index.php?title=Archive:Urban-rural_typology_update&oldid=262364 (accessed on 15 April 2020).
- Consolidated version of the Treaty on the Functioning of the European Union. Off. J. Online 2012, 326, 47–390. Available online: http://data.europa.eu/eli/treaty/tfeu_2012/oj> (accessed on 1 September 2020).
- Hahne, U. Regionalentwicklung Durch Aktivierung Intraregionaler Potentiale. Zu den Chancen "Endogener" Entwicklungsstrategien (Regional Development by Activating Intra-Regional Potentials. On the Opportunities Offered by "Endogenous" Development Strategies); Schriften des Instituts für Regionalforschung der Universität Kiel, 8: München, Germany, 1985. [Google Scholar]
- Jonard, F.; Lambotte, M.; Ramos, F.; Terres, J.M.; Bamps, C. Delimitations of rural areas in Europe using criteria of population density, remoteness and land cover. JRC Sci. Tech. Rep. 2009, 23757. [Google Scholar]
- Stackelberg von, K.; Hahne, U. Teorie rozwoju regionalnego (Regional development theories). In Rozwój Ekonomiczny Regionów. Rynek Pracy. Procesy Migracyjne Polska, Czechy, Niemcy (Regional Economic Development. The Labour Market. Migration Processes Poland, Czech Republic, Germany); Golinowska, S., Ed.; Raport IPiSS, Zeszyt 16: Warsaw, Poland, 1998. [Google Scholar]
- Grosse, T.G. Wybrane Koncepcje Teoretyczne i Doświadczenia Praktyczne Dotyczące Rozwoju Regionów Peryferyjnych (Theory and Practice of Development of Peripheral Regions). SRiL 2007, 27, 27–49. [Google Scholar]
- Gorzelak, G.; Smętkowski, M. Rozwój Regionalny, Polityka Regionalna (Regional Developement, Regional Policy); FOR: Warsaw, Poland, 2018. [Google Scholar]
- Dyba, W.; Loewen, B.; Looga, J.; Zdražil, P. Regional Development in Central-Eastern European Countries at the Beginning of the 21st Century: Path Dependence and Effects of EU Cohesion Policy. Quaest. Geogr. 2018, 37, 77–92. [Google Scholar] [CrossRef] [Green Version]
- MFiPR. Krajowa Strategia Rozwoju Regionalnego 2030: Rozwój Społecznie Wrażliwy i Terytorialnie Zrównoważony (National Regional Development Strategy 2030: Socially Sensitive and Territorially Sustainable Development). 2019. Available online: https://www.gov.pl/web/fundusze-regiony/krajowa-strategia-rozwoju-regionalnego (accessed on 17 April 2020).
- Gorzelak, G. Wykorzystanie środków Unii Europejskiej dla rozwoju kraju: Wstępne analizy (The use of the European Union financial resources for the development of the country: Preliminary analyses). SRiL 2014, 57, 5–25. [Google Scholar] [CrossRef]
- MFiPR. Wpływ Polityki Spójności na Rozwój Obszarów Wiejskich (The Impact of Cohesion Policy on Rural Development). 2019. Available online: https://www.ewaluacja.gov.pl/strony/badania-i-analizy/wyniki-badan-ewaluacyjnych/badania-ewaluacyjne/wplyw-polityki-spojnosci-na-rozwoj-obszarow-wiejskich/ (accessed on 15 April 2020).
- Wilkin, J. The Political Economics of the Common Agricultural Policy Reform. Gospod. Nar. 2009, 229, 1–25. [Google Scholar] [CrossRef]
- Kłodziński, M. Aktywizacja gospodarcza obszarów wiejskich (Economic activation of rural areas). Probl. Integr. Rol. 1999, 3, 29–35. [Google Scholar]
- OECD. Rural Policy Reviews: Poland. 2018. Available online: https://www.oecd.org/cfe/oecd-rural-policy-reviews-poland-2018-9789264289925-en.htm (accessed on 20 April 2020).
- EC. Cohesion Policy 2007–13. Commentaries and Official Texts. 2007. Available online: https://ec.europa.eu/regional_policy/sources/docoffic/official/regulation/pdf/2007/publications/guide2007_en.pdf (accessed on 14 April 2020).
- EC. Green Paper on Territorial Cohesion. Turning Territorial Diversity into Strength. 2008. Available online: https://eur-lex.europa.eu/LexUriServ/LexUriServ.do?uri=COM:2008:0616:FIN:EN:PDF (accessed on 14 April 2020).
- EC. Country Data for: Poland. Available online: https://cohesiondata.ec.europa.eu/countries/PL (accessed on 1 September 2020).
- Smętkowski, M.; Wójcik, P. Regional Convergence in Central and Eastern European Countries: A Multidimensional Approach. Eur. Plan. Stud. 2012, 20, 923–939. [Google Scholar] [CrossRef]
- Kisiała, W.; Bajerski, A.; Stępiński, B. Realizacja regionalnych programów operacyjnych: Analiza profili absorpcji funduszy unijnych w układzie centrum-peryferie (Implementation of Regional Operational Programmes: Analysis of the Profiles of Absorption of the European Union’s Funds within the Framework of the Centre-Periphery Concept). SOEP 2015, 3, 113–130. [Google Scholar]
- Rosner, A.; Stanny, M. Socio-Economic Development of Rural Areas in Poland; EFRWP, IRWiR PAN: Warsaw, Poland, 2017. [Google Scholar]
- Stanny, M.; Rosner, A.; Komorowski, Ł. Monitoring Rozwoju Obszarów Wiejskich. Etap III. Struktury Społeczno-Gospodarcze, ich Przestrzenne Zróżnicowanie i Dynamika (Rural Development Monitoring. Stage III. Socioeconomic Structures, Their Spatial Diversity and Dynamics); EFRWP, IRWiR PAN: Warsaw, Poland, 2018. [Google Scholar] [CrossRef]
- Bachtler, J.; Gorzelak, G. Reforming eu cohesion policy. Policy Stud. 2007, 28, 309–326. [Google Scholar] [CrossRef]
- Herbst, M.; Wójcik, P. Growth and divergence of the polish subregions over 1995–2006: A search for determinants and spatial patterns. MPRA Pap. 2011, 34731, 1–20. [Google Scholar]
- Sala-I-Martin, X.X. Regional cohesion: Evidence and theories of regional growth and convergence. Eur. Econ. Rev. 1996, 40, 1325–1352. [Google Scholar] [CrossRef] [Green Version]
- Bradley, J. Evaluating the impact of European Union Cohesion policy in less-developed countries and regions. Reg. Stud. 2006, 40, 189–200. [Google Scholar] [CrossRef]
- Mohl, P.; Hagen, T. Which is the right dose for economic growth? Working Paper, Leibniz Centre for European Economic Research (ZEW) Discussion Papers. 2008. [Google Scholar]
- Caldas, P.; Dollery, B.; Marques, R. European Cohesion Policy impact on development and convergence: A local empirical analysis in Portugal between 2000 and 2014. Eur. Plan. Stud. 2018, 26, 1081–1098. [Google Scholar] [CrossRef]
- Zubek, N.; Henning, C.H. Local Government, Spatial Spillovers and the Absorption of EU Structural Funds. J. Agric. Econ. 2016, 67, 368–397. [Google Scholar] [CrossRef]
- Novosák, J.; Novosáková, J.; Hájek, O.; Horvath, P. Regional disparities, absorption capacity and Structural Fund payments: A case study of the Czech Republic. Quaest. Geogr. 2017, 36, 81–92. [Google Scholar] [CrossRef] [Green Version]
- Novosák, J.; Hájek, O.; Smekalová, L.; Nekolová, J.; Skarka, M. Territorial Cohesion and the Geography of EU Cohesion Policy Funding in the Czech Republic. Transform. Bus Econ. 2015, 14, 419–432. [Google Scholar]
- Novosák, J.; Hájek, O.; Horváth, P.; Nekolová, J. Structural Funding and Intrastate Regional Disparities in Post-Communist Countries. Transylv. Rev. Adm. Sci. 2017, 2017, 53–69. [Google Scholar] [CrossRef] [Green Version]
- Cappelen, A.; Castellacci, F.; Fagerberg, J.; Verspagen, B. The Impact of EU Regional Support on Growth and Convergence in the European Union. J. Common Mark. Stud. 2003, 41, 621–644. [Google Scholar] [CrossRef]
- Ederveen, S.; Gorter, J.; Mooij de, R.; Nahuis, R. Funds and Games: The Economics of European Cohesion Policy; ENEPRI: Brussels, Belgium, 2003. [Google Scholar]
- Beugelsdijk, M.; Eijffinger, S.C. The Effectiveness of Structural Policy in the European Union: An Empirical Analysis for the EU-15 in 1995–2001. J. Common Mark. Stud. 2005, 43, 37–51. [Google Scholar] [CrossRef] [Green Version]
- Dall’Erba, S.; Le Gallo, J. Regional convergence and the impact of European structural funds over 1989–1999: A spatial econometric analysis. Pap. Reg. Sci. 2008, 87, 219–244. [Google Scholar] [CrossRef] [Green Version]
- Becker, S.O.; Egger, P.H.; Von Ehrlich, M. Going NUTS: The effect of EU Structural Funds on regional performance. J. Public Econ. 2010, 94, 578–590. [Google Scholar] [CrossRef] [Green Version]
- Becker, S.O.; Egger, P.H.; Von Ehrlich, M. Too much of a good thing? On the growth effects of the EU’s regional policy. Eur. Econ. Rev. 2012, 56, 648–668. [Google Scholar] [CrossRef] [Green Version]
- Pinho, C.; Varum, C.; Antunes, M. Structural Funds and European Regional Growth: Comparison of Effects among Different Programming Periods. Eur. Plan. Stud. 2014, 23, 1302–1326. [Google Scholar] [CrossRef] [Green Version]
- Lyberaki, A. Greece—EU comparative economic performance at the national and regional levels: Why divergence? Eur. Plan. Stud. 1996, 4, 313–329. [Google Scholar] [CrossRef]
- Bodenstein, T.; Kemmerling, A. Ripples in a Rising Tide: Why Some EU Regions Receive More Structural Funds than Others. Eur. Integr. Online Pap. 2011, 16, 1–24. [Google Scholar] [CrossRef]
- Blažek, J.; Macešková, M. Regional Analysis of Public Capital Expenditure: To Which Regions Is Public Capital Expenditure Channelled—To ‘Rich’ or to ‘Poor’ Ones? Reg. Stud. 2009, 44, 679–696. [Google Scholar] [CrossRef] [Green Version]
- Rakowska, J. Samorządy Gmin Jako Beneficjenci Polityki Spójności UE w Latach 2007–2013 (2015) (Municipal Governments as Beneficiaries of EU Cohesion Policy in 2007–2013 (2015)); Wydawnictwo SGGW: Warsaw, Poland, 2016. [Google Scholar]
- Stiglitz, J.E.; Sen, A.; Fitoussi, J.P. Błąd Pomiaru: Dlaczego PKB nie Wystarcza (Mismeasurement: Why is GDP not Enough); Raport Komisji ds. Pomiaru Wydajności Ekonomicznej i Postępu Społecznego; PTE: Warsaw, Poland, 2013. [Google Scholar]
- Stanny, M. Spatial Diversification of the Balance on the Labour Market in Rural areas in Poland. Bull. Geogr. Socio. Econ. Ser. 2010, 14, 103–111. [Google Scholar] [CrossRef] [Green Version]
- Komorowski, Ł.; Stanny, M. Public transport in rural areas—Studies conclusions. Ann. Pol. Assoc. Agric. Agribus. Econ. 2017, 3, 129–136. [Google Scholar] [CrossRef] [Green Version]
- Brzóska, A.; Swianiewicz, P. Elastyczność popytu na lokalny transport zbiorowy w polskich miastach (Demand elasticity of local public transport in Polish cities). SRiL 2020, 80, 67–91. [Google Scholar] [CrossRef]
- Wilson, G. Multifunctional ‘quality’ and rural community resilience. Trans. Inst. Br. Geogr. 2010, 35, 364–381. [Google Scholar] [CrossRef]
- Hałasiewicz, A. Koncepcje Ożywienia i Wzmocnienia Rozwoju Wsi (Concepts for Revitalising and Strengthening Rural Development); Wilkin, J., Ed.; Polska wieś 2020; Raport o stanie wsi; FDPA: Warsaw, Poland, 2020. [Google Scholar]
- Wang, Y.; Liu, Y.; Li, Y.; Li, T. The spatio-temporal patterns of urban—Rural development transformation in China since 1990. Habitat Int. 2016, 53, 178–187. [Google Scholar] [CrossRef]
- Kukuła, K.; Bogocz, D. Zero unitarization method and its application in ranking research in agriculture. Econ. Reg. Stud. 2014, 7, 5–13. [Google Scholar]
- Młodak, A. Analiza Taksonomiczna w Statystyce Regionalnej (Taxonomic Analysis in a Regional Statistics); Difin: Warsaw, Poland, 2006. [Google Scholar]
- Siegel, S.; Castellan, N.J. Nonparametric Statistics for the Behavioral Sciences, 2nd ed; McGraw-Hill: New York, NY, USA, 1988. [Google Scholar]
- Davies, N. God’s Playground: A History of Poland; Oxford University Press: New York, NY, USA, 2005; Volume 2. [Google Scholar]
- Rosner, A.; Śpiewak, R.; Kozdroń, E. Glimpses of the Countryside: One Hundred Years of Polish Countryside; IRWiR PAN, Scholar: Warsaw, Poland, 2018. [Google Scholar]
- Stanny, M.; Rosner, A.; Kozdroń, E. Changes in the Spatial Distribution of the Level and Dynamics of Socio-Economic Development of Rural Areas in Poland. WiR 2016, 173, 29–47. [Google Scholar] [CrossRef]
- Churski, P.; Perdał, R.; Herodowicz, T. Can a biggie get more? The role of regional centres in the process of absorption of European funds in Polish voivodeships. Eur. XXI 2016, 30, 59–76. [Google Scholar] [CrossRef] [Green Version]
- Rodríguez-Pose, A.; Garcilazo, E. Quality of Government and the Returns of Investment: Examining the Impact of Cohesion Expenditure in European Regions. Reg. Stud. 2015, 49, 1274–1290. [Google Scholar] [CrossRef]
- GUS. Labour Force Survey in Poland IV Quarter 2018. 2019. Available online: https://stat.gov.pl/download/gfx/portalinformacyjny/pl/defaultaktualnosci/5475/4/32/1/aktywnosc_ekonomiczna_ludnosci_polski_iv_kwartal_2018.pdf (accessed on 20 April 2020).
- Smętkowski, M. The role of exogenous and endogenous factors in the growth of regions in Central and Eastern Europe: The metropolitan/non-metropolitan divide in the pre- and post-crisis era. Eur. Plan. Stud. 2017, 26, 256–278. [Google Scholar] [CrossRef]
- Drejerska, N. Good governance w polskiej polityce regionalnej (Good governance in Polish regional policy). EOGŻ 2010, 83, 45–54. [Google Scholar]
- Śleszyński, P. Polska Średnich Miast. Założenia i Koncepcja Deglomeracji w Polsce (Poland of Medium-Sized Cities. Assumptions and Concept of Deglomeration in Poland); Klub Jagielloński: Warsaw, Poland, 2018. [Google Scholar]
- MR. Strategy for Responsible Development for the Period up to 2020 (Including the Perspective up to 2030. Summary). 2017. Available online: https://www.gov.pl/documents/33377/436740/SOR_2017_streszczenie_en.pdf (accessed on 19 April 2020).
- Amending the Treaty on European Union and the Treaty establishing the European Community. In Treaty of Lisbon; Official Journal of the European Union: Lisbon, Portugal, 2007.
- Churski, P. Structural Funds of the European Union in Poland—Experience of the First Period of Membership. Eur. Plan. Stud. 2008, 16, 579–607. [Google Scholar] [CrossRef]
- Dunford, M.; Perrons, D. Regional Inequality in the EU: How to Finance Greater Cohesion. Eur. Plan. Stud. 2012, 20, 895–922. [Google Scholar] [CrossRef]
| 1 | KSI-SIMIK National Information System. |
| 2 | The central IT system. |
| 3 | In view of projects in the 2014–2020 framework being in progress, and the fact that time is needed to observe the effects of an intervention, only projects with “completed” status were analysed. |
| 4 | Average exchange rate between January 2007 and July 2018: 1 PLN = 0.24 EUR. |
| 5 | Data obtained from the GUS Local Data Bank (BDL), available on the www.bdl.stat.gov.pl website. |
| 6 | The overall number of business entities (denominator) also includes the farms of direct payment beneficiaries registered with the ARiMR, according to plot location and without any limits on plot area. |
| 7 | ** statistical significance of about 0.01. |
| 8 | This is one of the three fundamental Community objectives that was officially introduced by the Treaty of Lisbon (Article 2) [72]. |
Figure 1.
Absorption of Cohesion Policy funding in rural areas 2007–2018. Source: Authors’ calculations based on the KSI SIMIK 07-13 and SL2014 databases.
Figure 1.
Absorption of Cohesion Policy funding in rural areas 2007–2018. Source: Authors’ calculations based on the KSI SIMIK 07-13 and SL2014 databases.

Figure 2.
Rural socio-economic development level. Source: Authors’ compilation.

Figure 3.
Spatial distribution of commune types according to the relationship between socio-economic development and the level of Cohesion Policy funding absorption. Source: Authors’ compilation.
Figure 3.
Spatial distribution of commune types according to the relationship between socio-economic development and the level of Cohesion Policy funding absorption. Source: Authors’ compilation.

Figure 4.
Absorption structure according to socio-economic development level. Source: Authors’ compilation.
Figure 4.
Absorption structure according to socio-economic development level. Source: Authors’ compilation.


Table 1.
Basic descriptive statistics of the absorption level in the quartile groups.
| Absorption Level | Basic Descriptive Statistics | ||
|---|---|---|---|
| Average in PLN per Capita | Median in PLN per Capita | Coefficient of Variation | |
| 1 | 1590 | 1617 | 37 |
| 2 | 3524 | 3475 | 17 |
| 3 | 6509 | 6336 | 20 |
| 4 | 23,870 | 15,978 | 96 |
| Overall | 8877 | 4633 | 164 |
Source: Authors’ calculations based on the KSI SIMIK 07-13 and SL2014 databases.
Table 2.
Selected socio-economic features of the commune categories (descriptor: median).
| Type: Absorption Level & Development Class | Average per Capita CP Outlays (PLN) | Population Density (people/sq. km) | Balance of Migration per 1000 Residents | Proportion of Residents of Post-Working Age (%) | Percentage of Villages Reachable by Public Transport (%) | Percentage of Non-Agricultural Businesses in the Total Number of Businesses (Including Farms) (%) | Number of Agricultural Social Insurance Fund Pensioners per 100 Residents of Post-Working Age | Number of PIT and CIT Taxpayers per 1000 Residents | Communes’ Own Revenues as a Proportion of Their Total Revenue (%) | Number of Applications for Funding of CP Projects for 2007–2013 per 10,000 Residents | Number of Applications for LEADER Project Funding for 2007–2013 per 10,000 Residents | Share of Local Council Members Who Are University or High-School Graduates (%) |
|---|---|---|---|---|---|---|---|---|---|---|---|---|
| LOCATION ATTRACTIVENESS | DEMOGRAPHY | SPATIAL ACCESSIBILITY | DEAGRARIANISATION | AGRICULTURAL SECTOR | NON-AGRICULTURAL SECTOR | LOCAL FINANCE | ABSORPTION CAPACITY | |||||
| I. non-high & low | 3259 | 42 | −3.7 | 19.3 | 72.7 | 15.2 | 54 | 30 | 29.3 | 103 | 35 | 72.7 |
| IV. high & low | 22,253 | 36 | −4.0 | 18.4 | 65.0 | 16.6 | 50 | 31 | 33.7 | 144 | 37 | 65.0 |
| II. non-high & medium | 3963 | 59 | −1.9 | 16.5 | 83.0 | 31.4 | 29 | 42 | 37.1 | 86 | 30 | 83.0 |
| V. high & medium | 23,911 | 52 | −1.2 | 16.5 | 80.0 | 32.1 | 25 | 43 | 40.3 | 111 | 28 | 80.0 |
| III. non-high & high | 4561 | 94 | 0.9 | 15.5 | 92.3 | 55.4 | 17 | 55 | 49.8 | 73 | 22 | 92.3 |
| VI. high & high | 24,620 | 103 | 3.8 | 15.2 | 94.4 | 56.6 | 14 | 60 | 57.2 | 97 | 22 | 94.4 |
Source: Authors’ compilation.
Publisher’s Note: MDPI stays neutral with regard to jurisdictional claims in published maps and institutional affiliations. |
© 2020 by the authors. Licensee MDPI, Basel, Switzerland. This article is an open access article distributed under the terms and conditions of the Creative Commons Attribution (CC BY) license (http://creativecommons.org/licenses/by/4.0/).
Share and Cite
MDPI and ACS Style
Komorowski, Ł.; Mróz, A.; Stanny, M. The Spatial Pattern of the Absorption of Cohesion Policy Funds in Polish Rural Areas. Land 2021, 10, 26. https://doi.org/10.3390/land10010026
AMA Style
Komorowski Ł, Mróz A, Stanny M. The Spatial Pattern of the Absorption of Cohesion Policy Funds in Polish Rural Areas. Land. 2021; 10(1):26. https://doi.org/10.3390/land10010026
Chicago/Turabian StyleKomorowski, Łukasz, Agata Mróz, and Monika Stanny. 2021. "The Spatial Pattern of the Absorption of Cohesion Policy Funds in Polish Rural Areas" Land 10, no. 1: 26. https://doi.org/10.3390/land10010026
Note that from the first issue of 2016, this journal uses article numbers instead of page numbers. See further details here.