Spatial Distribution, Adsorption/Release Characteristics, and Environment Influence of Phosphorus on Sediment in Reservoir

1
Institution of water and environment research, Dalian University of Technology, Dalian 116024, China
2
North China University of Water Resources and Electric Power, Zhengzhou 450045, China
*
Author to whom correspondence should be addressed.
Water 2017, 9(9), 724; https://doi.org/10.3390/w9090724
Submission received: 26 August 2017
/
Revised: 12 September 2017
/
Accepted: 19 September 2017
/
Published: 20 September 2017
Abstract
:Sediment gradually accumulates at the bottom of reservoirs after decades of running. To explore the influences of sediments on the water quality of reservoirs, the spatial distribution, adsorption/release characteristics, and environment influence of sediment pollutants should be analyzed. In this paper, the spatial distributions of phosphorus (P) and P fractions in the Biliuhe reservoir (river valley reservoirs) sediments were investigated. The adsorption and release characteristics of sediments P were studied in the experiment, while its environmental influence was analyzed too. The results indicate that the concentration of P in sediments was higher at the dam and the Zhongling site, while lower at other entrances of the reservoir and the smallest in the water-level fluctuating zone. Total Phosphorus (TP) varied from 355.46 to 764.57 mg/kg. Inorganic Phosphorus (IP) was the main form of TP in sediments, making up a proportion of 56–75%, while the correlation coefficient of P bound to Al, Fe, and Mn oxides was 0.922. Hydroxide (Fe/Al-P) was the main form of IP, which accounted for 46–83% with a correlation coefficient of 0.888. The maximum adsorption capacity calculated by Langmuir model was between 714.29 and 3333.33 mg/kg. The adsorption efficiency obtained by the Freundlich model was within the range of 0.40–1.42, which indicated that P adsorption was more difficult in the water-level fluctuating zone. The critical adsorption and release concentration range was 0.1–0.2 mg/L for the majority of the sampling points. The amount of P released in 24 h (the initial concentration of TP in the overlying water was 0 mg/L) accounted for 1.15–4.16% of TP in sediments, which was higher than the average concentration in the reservoir. It is concluded that the sediment is the potential pollution source. The relationship between the change of environmental factors and the release of sediment contaminants should be considered in the future.
1. Introduction
As important hydraulic engineering structures, reservoirs have many functions, such as flood control, water supply, and power generation. With the development of the social economy, the function of a water supply has become a mainstream issue and reservoir water quality attracts more attention [1]. Especially in north China, reservoirs are key drinking water supply sources, such as the Biliuhe reservoir, Miyun reservoir, Dahuofang reservoir, Xinlicheng reservoir, etc. [2]. However, the natural runoff process has been changed into a complex artificial-natural bivariate process as a result of the construction of reservoirs. Generally, the operation mode of reservoirs to store water during floods makes it easier for pollutants to be deposited instead of being removed with the flood, which accelerates the accumulation of sediment pollutants at the bottom of reservoirs [3]. The organic carbon, total nitrogen, and active phosphate in the sediment pollutants of the Karla reservoir exaggerate the risk of eutrophication [4]. Furthermore, the Zn, Pb, Fe, Mn, and Cu in sediments found in the Cauvery reservoir pose a threat to the organisms [5]. Sediments of Gonghu Bay are rich in Cd, Zn, and Cu [6]. The contents of HCHs (hexachloro-cyclohexane soprocide) and DDTs (Dichlorodiphenyltrichloroethane) in sediments of Guanting Reservoir reached up to 0.73 ng/g and 6.46 ng/g, respectively in 2009. Both of these substances have become highly persistent pollution risk factors [7]. The Polycyclic Aromatic Hydrocarbons (PAHs) in sediments increased the risk of aquatic organisms in the Songhua River [8]. So sediment pollutant is the endogenous source of various pollutants in reservoirs.
Eutrophication is one of the hot issues in the field of water environment. The Chinese Water Environment Bulletin shows that 85.7% of the key lakes and reservoirs of China have the problem of eutrophication in 2015, with phosphorus (P) found to be an important factor [9]. After decades of running, phosphorus gradually accumulates at the sediment of the reservoir, which might release and aggravates algal blooms [10]. In fact, Sediments can play either sink or source roles under different physicochemical and biological conditions, which can be explored from distribution, fractions, adsorption/release characteristics etc. [11]. Conducting field investigation is effective in gathering fundamental information for research into sediments phosphorus (P). Wang et al., studied the distribution characteristics of sediment P in Poyang Lake and found that the sediment P could be released to the water [12]. Lucas et al., explored the spatial and temporal trends of sediment P in a narrow river-valley reservoir, finding that the surficial Total Phosphorus (TP) concentrations were strongly related to depth [13]. P fractions contribute to analyzing the release of sediment, which can be characterized as P bound to Al, Fe, and Mn oxides and hydroxides (Fe/Al-P); P associated with Ca (Ca-P); Inorganic P (IP); Organic P (OP); and, Total P (TP), based on the release ability [14]. Generally, the Langmuir and the Freundlich equations can be used to describe the sediment adsorption process, which can calculate the maximum adsorption capacity and the adsorption efficiency to analyse the characteristics of sediment. Zhang et al. studied the adsorption and release of sediment P in the Three Gorges Reservoir and showed that the maximum adsorption capacity varied from 137.79 to 1975.5 mg/kg [15]. Dong et al., researched the adsorption and release characteristics of P in sediments of Baiyangdian Lake, which showed that P was a risk factor for water quality and ecosystems [16]. Experiments and the mass balance equation have been widely used to study the release flux of P in sediments, which is the effective method for exploring the influences of sediments on water quality [17,18,19,20]. Wu et al., studied the release of sediment P under the influence of PH, dissolved oxygen, and temperature, verifying that these were important influencing factors [21]. Overall, the detection methods, distribution, and environmental factors influencing the adsorption and the release processes of sediment P have been studied, which provides the methods for this present study. Other researchers have proposed additional methods, including in-situ remediation, dredging, and aeration to restore water environment, and contribute to the treatment of sediment [22,23]. However, the influence of water quality on sediment formation is debatable. Actually, P distribution and fractions in sediment, P concentration in overlying water and so on are the determining factors of the adsorption or release behavior of the sediment P, which should be carefully considered. In addition, due to significant regional differences of the distribution of P in sediment, different types of reservoirs need to be analyzed.
The objectives of this paper are to: (1) investigate the distribution and fractions of sediment P in Biliuhe reservoir (river valley reservoirs); (2) simulate the adsorption and release characteristics of sediment P; and, (3) analyze the environmental influences of sediment P.
2. Materials and Methods
2.1. Study Area and Sediment Sampling
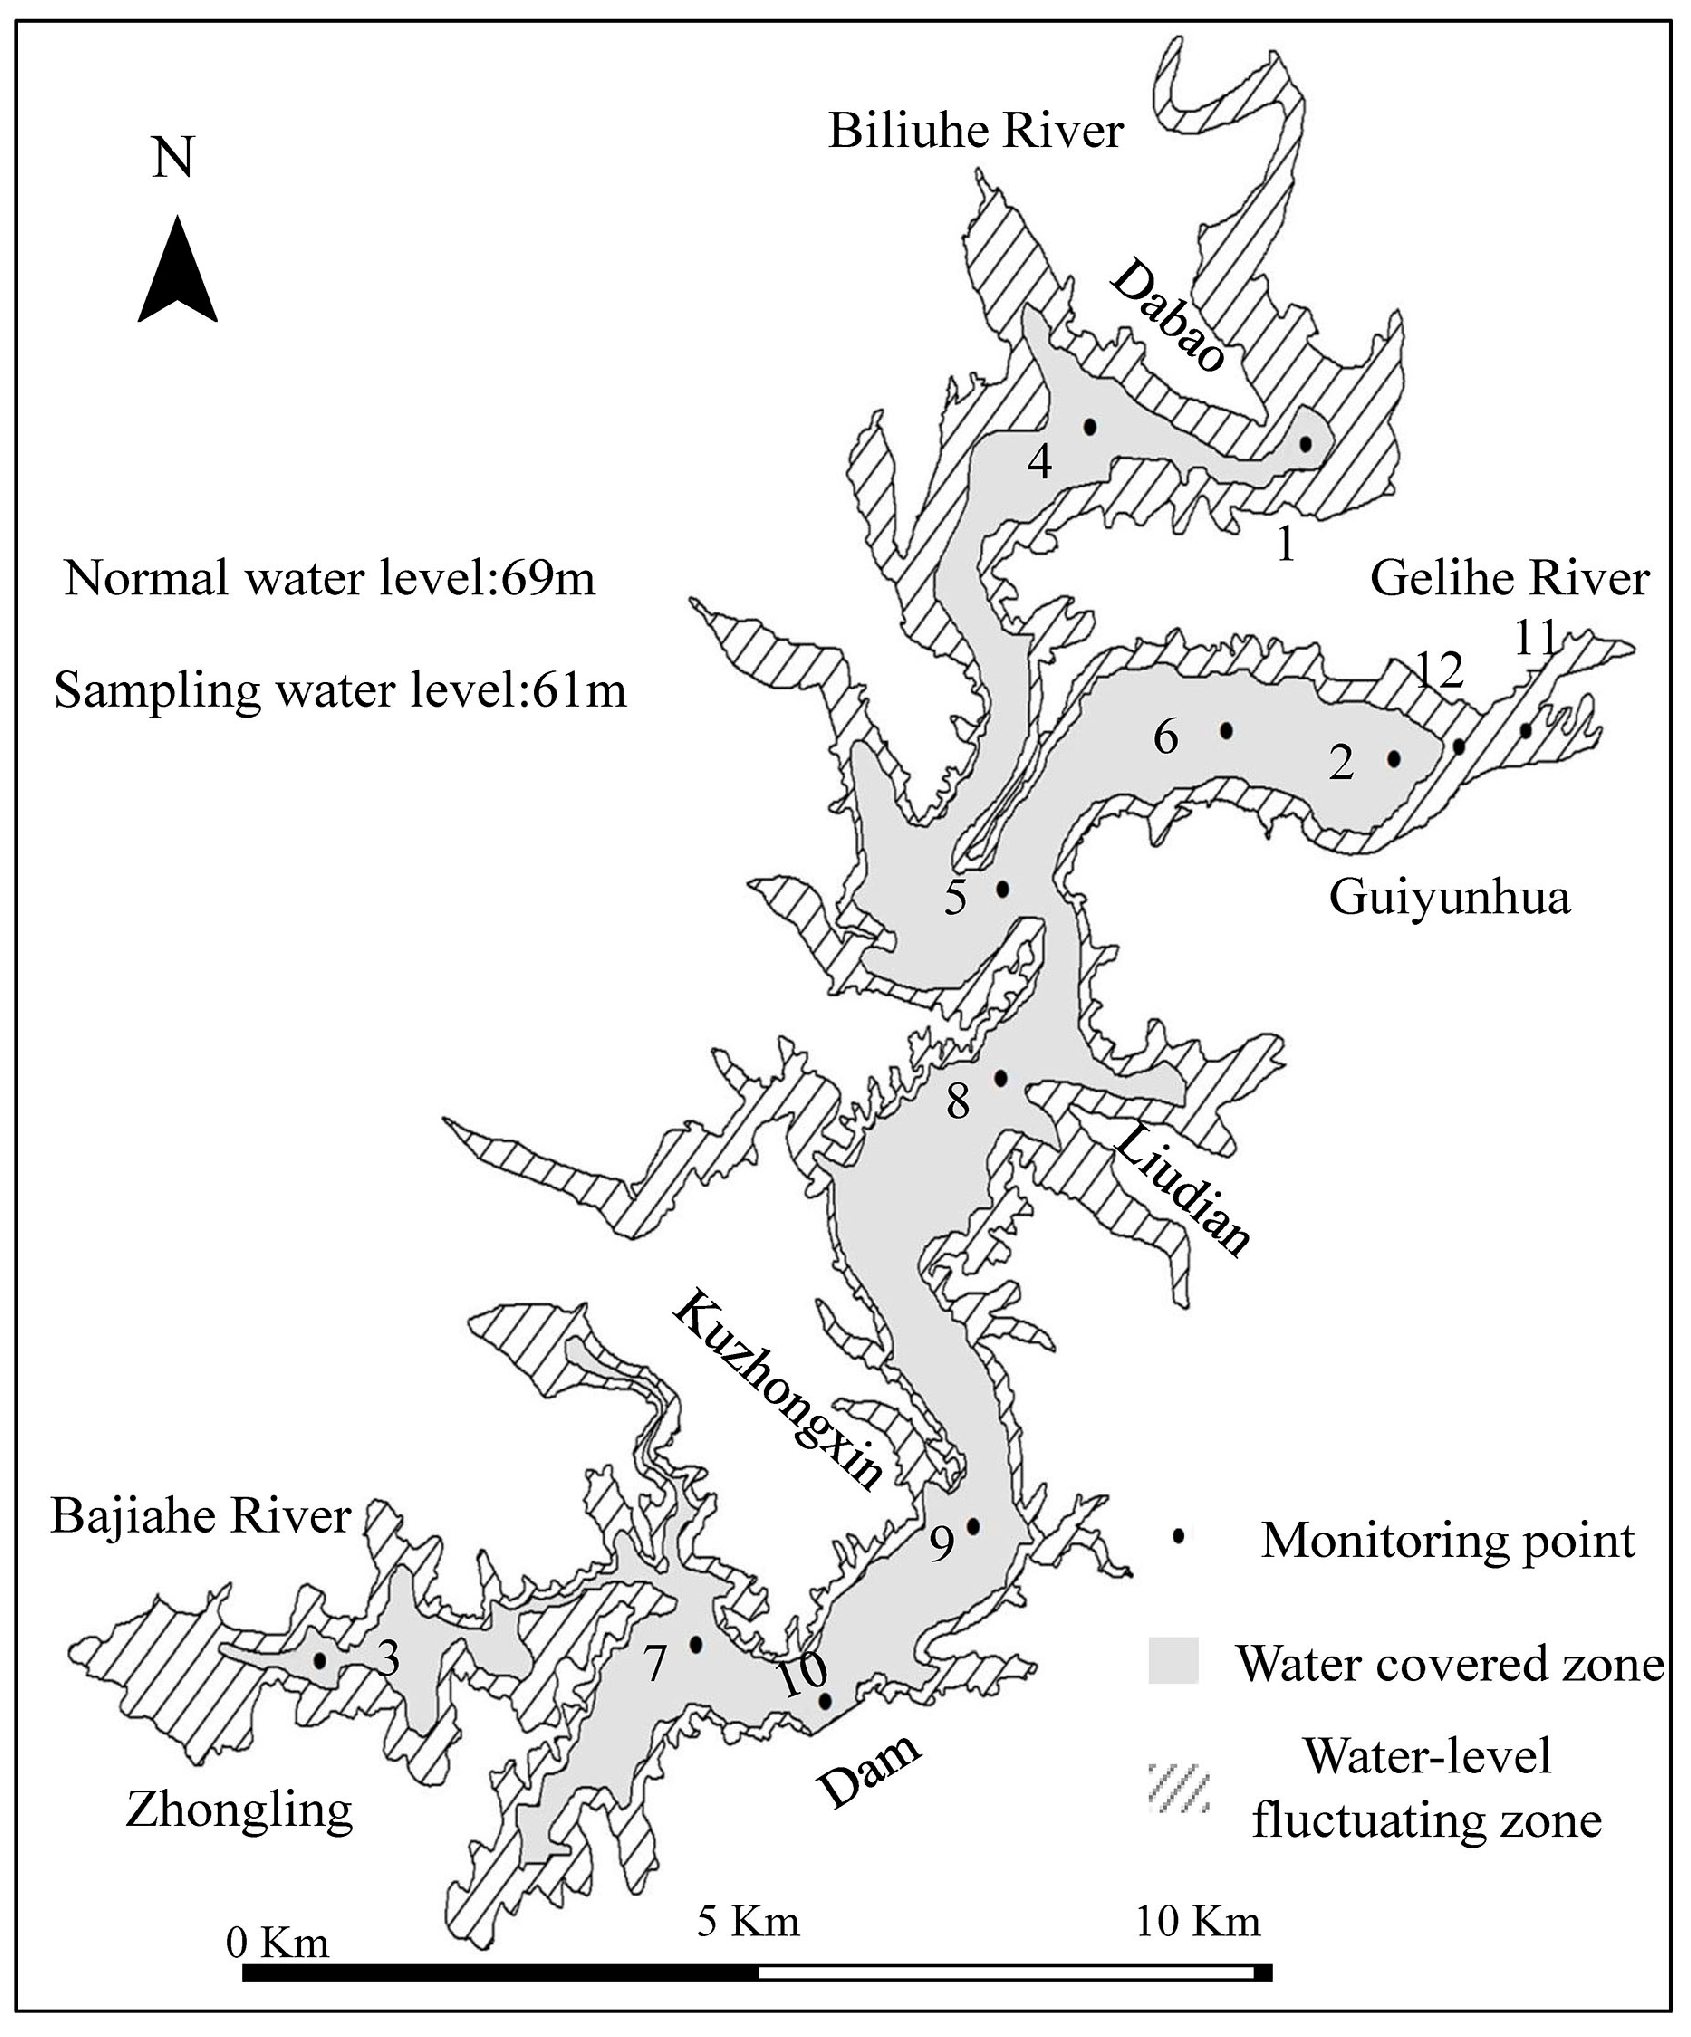
The Biliuhe reservoir is a river valley reservoir, which was built in 1983 (39°49′11.85″ N; 122°29′24.43″ E, Figure 1). The main dam is 708.5 m wide and has a maximum height of 53.5 m. Its total storage capacity is 9.34 × 10⁸ m3, and its control drainage area is 2085 km2. It has three main tributaries, which are namely the Biliuhe river, Gelihe river, and the Bajiahe river. The Biliuhe reservoir has supplied water for Dalian city since 1984, which accounts for about 80% of the city’s total water supply. Statistical analysis shows that the total nitrogen (TN) in the reservoir exceeds the level 3 of the standard (GB3838-2002) throughout the year, with an average concentration of 2.32 mg/L. However, the total phosphorus (TP) is relatively low, with an average concentration of 0.015 mg/L. Generally, eutrophication will probably happen when the concentration of TP reaches 0.02 mg/L and TN reaches 0.2 mg/L simultaneously. So, TP is the controlling factor for eutrophication in the Biliuhe reservoir. As a water source reservoir, the protection and treatment of the reservoir environment has received considerable attention. As a result, there are no large enterprises that may discharge point pollution, and a water source protection area has been set up using isolation fences. However, it is noticeable that a considerable amount of sediment has accumulated at the bottom of the Biliuhe reservoir during the past 30 years. Therefore, it is important to study the spatial distribution, fractions, and environmental influences of P in reservoir sediments.
The hydrology, meteorology, and topography conditions, in addition to the pollutant sources, pollution characteristics, and characteristics for the occurrence of pollutants were first comprehensively considered. Following this, the sediment-sampling scheme was planned based on the water and wastewater monitoring, analysis method, and the regulation for water environmental monitoring (SL 219-98). The distribution of monitoring points is shown in Figure 1. The surface sediment samples (0–20 cm) were collected from the main stream, the two tributaries, and the water-level fluctuating zone at the entrance to the reservoir of Gelihe River in October 2014. Global positioning system (GPS) was used to record the locations of the monitoring points and the geostatistical analysis was applied to analyze the distribution of sediment P. The sampling instruments used were Van Veen sediment samplers (3.14 L) in water covered zone and small shovels in water-level fluctuating zone. The samples were preserved with plastic film and delivered to the laboratory. After natural drying, debris removal, and being filtrated with a 100-mesh sieve (0.15 mm), the samples were then preserved under freezing-drying conditions.
2.2. Experiments of PAdsorption/Releasein Sediment
This paper studied the adsorption/release of sediment P under different concentrations of overlying water through a simulation experiment. Sediment samples were placed in a cool and dry place to let them naturally air dry. Following this, the samples were filtered through a 100 mesh sieve (0.15 um) and preserved at −20 °C. Sediment samples (0.2 g each) were placed in a 20 mL centrifuge tube and 20 mL standard solution was added. The phosphorous standard solutions of 0, 0.1, 0.2, 1, 2, 4, 6, 10, 15, and 20 mg/L were made using potassium dihydrogen phosphate (KH2PO4, GR). The centrifuge tubes were shaken (180–200 rpm) at an indoor temperature (20 ± 1 °C) for 24 h. After that, the samples were then centrifuged (3000 rpm) for 10 min and the filtrates were collected through a 0.45 um fiberglass filter membrane. Finally, the concentration of the filtrate was tested. Parallel experiments were conducted at the same time for quality control. The experimental results were expressed with average values and the errors of the parallel experiments were less than 5%.
2.3. Samples Detection and Analysis
The P fractions of the 12 sediment samples were determined by the method of SMT (Standard Measurements and Testing), by which the P in sediments was classified into P bound to Al, Fe, and Mn oxides and hydroxides (Fe/Al-P), P associated with Ca (Ca-P), Inorganic P (IP), Organic P (OP) and Total P (TP). The Fe/Al-P was extracted by NaOH, while the Ca-P was extracted by HCl. IP was extracted by HCl and the residual was treated at 450 °C to detect OP content. TP was detected after the sample was treated at 450 °C and extracted by HCl [14]. The filtrate was tested by the ammonium molybdate spectrophotometric method using a spectrophotometer (GB 11893-89). Samples were triplicated and results were analyzed using IBM SPSS Statistics 22 with relative errors of the average values less than 5%.
3. Results
3.1. Results of Field Surveys
Results of concentrations of TP and P fractions in sediments are shown in Table 1. TP concentration in sediments of water covered zone ranged from 452.73 to 764.57 mg/kg with a mean value of 571.56 mg/kg, while these concentrations were in the range of 355.46–523.96 mg/kg, with an average of 439.71 mg/kg in the water-level fluctuating zone.
The concentrations of IP ranged from 284.40 to 549.73 mg/kg, with an average value of 380.28 mg/kg in the water covered zone, while these concentrations were in the range of 242.81–334.79 mg/kg with an average of 288.80 mg/kg in the water-level fluctuating zone. The concentration of OP ranged from 336.05 to 135.68 mg/kg, with a mean value of 191.28 mg/kg in the water covered area, but this concentration was 112.65–189.18 mg/kg with an average of 150.91 mg/kg in the water-level fluctuating zone. Fe/Al-P content ranged from 173.90 to 455.00 mg/kg, with the average of 277.52 mg/kg in the water covered area, while this concentration was 112.71–219.56 mg/kg with an average of 166.13 mg/kg in the water-level fluctuating zone. Ca-P ranged from 53.20 to 194.14 mg/kg with an average of 102.76 mg/kg in the water covered area, and from 115.23 to 130.10 mg/kg, with the average of 122.67 mg/kg in the water-level fluctuating zone.
3.2. Results of Simulation Experiments
The characteristics of sediment P adsorption and the release of each area in the Biliuhe reservoir are shown in Figure 2.
The initial concentration is the concentration in overlying water during the initial stage of experiment; the equilibrium concentration is the concentration in overlying water after 24 h; and, the amount of adsorption and release is the ability to adsorb or release P (<0 for release and >0 for adsorption). It can be easily seen in Figure 2 that there are high correlations between the initial concentration and equilibrium concentration, as well as the amount of adsorption and release, which is consistent with previous studies [21,24]. Qmax is the maximum adsorption (mg/kg); Kd is the adsorption efficiency (L/kg) calculated by Langmuir model; and, 1/n is the adsorption efficiency as calculated by the Freundlich model. The characteristics of P adsorption and release of sediment were analyzed in the discussion.
4. Discussion
4.1. Distribution and Fractions of Sediments P in Biliuhe Reservoir
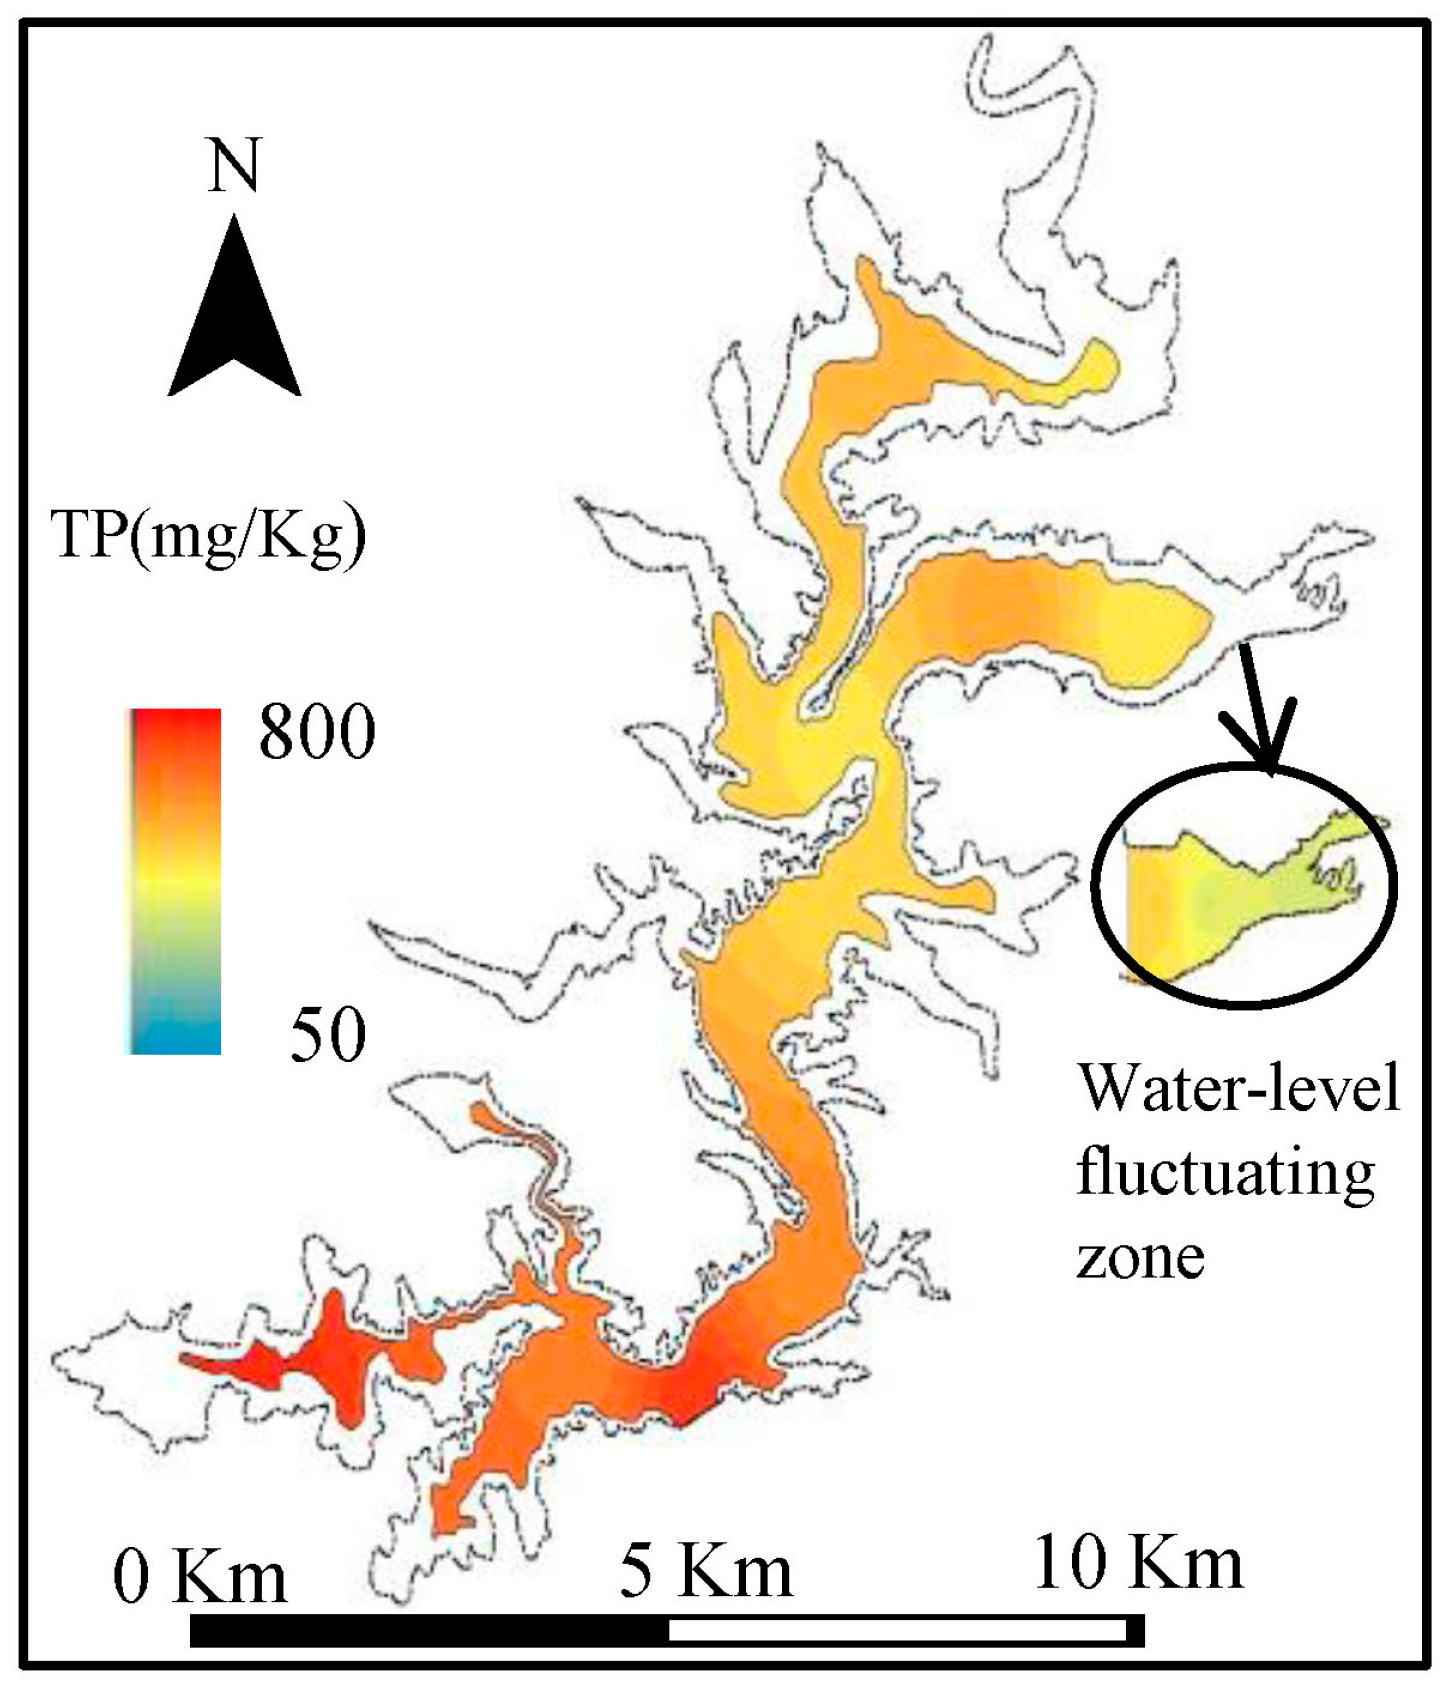
The TP content of sediments can give an indication of recent P loading in aquatic systems [25]. There are differences in the TP of sediments in the Biliuhe reservoir (the mean value is 571.56 and C.V. is 0.21). The spatial distribution of P in sediments is shown in Figure 3 with ArcGIS, which shows an increasing trend from the entrance to the dam site, and that is consistent with the literature results [13]. This trend is in accordance with the hydraulic gradient, which contributes to sediment deposits [24,26]. The dam site (point 10) had the second highest content of sediment P, which reached 750.5 mg/kg. The highest sediment P concentration in Zhongling site (point 3, 764.5 mg/kg) was probably caused by sand excavation and maize planting.
TP concentration in the water-level fluctuating zone was low, with a value of 355.46 mg/kg (point 11). The concentration in point 12 was 523.96 mg/kg, which was close to the average value in the water covered zone (mean: 571.56 mg/kg). This could be explained by the different exposure time of the sites in the water-level fluctuating zone. Plants have the ability to adsorb some P in a long exposed area, and rainfall erosion can also reduce the P content. Thus, sediment P in water-level fluctuating zones can result in lower values after a longer exposure time [15,27].
As mentioned in Section 3.1, the distributions of P fractions vary with space in the sediments. Figure 4 shows the specific distributions of IP, OP, Fe/Al-P, and Ca-P in the sediments of Biliuhe reservoir, and we can see that their distributions trends were consistent with TP. IP, which accounted for 56–75% of TP in sediments, had the lowest concentration at the point 11 (242.81 mg/kg) and the highest at point 10 (549.73 mg/kg). Generally, Fe/Al-P and OP can release bioavailable forms of P. Especially, Fe/Al-P can easily be released and transformed into active P through chemical and biological reactions, which might influence the overlying water quality [28]. The concentration of Fe/Al-P, accounting for 46–83% of IP in sediments, was minimum at point 11 (112.71 mg/kg) and a maximum at point 10 (455.00 mg/kg). OP accounted for 25–44% of TP in sediments, and its concentration ranged from 112.65 mg/kg (lowest at point 11) to 336.05 mg/kg (highest at point 3). Ca-P is mainly derived from clastic rock and is hardly to be used by organisms or released into overlying water [29]. Ca-P had a wide range of concentration, from 53.20 mg/kg at point 8 to 194.14 mg/kg at point 3, and accounted for 17–54% of IP in sediments. Analyses show that the Fe/Al-P is the major type in sediments of Biliuhe reservoir and has risk of release.
Next, a Pearson correlation analysis was calculated by SPSS to verify the correlation between P fractions (Table 2), and the results are shown as follows.
It is easy to see that the correlation of TP and IP was the closest with a coefficient of 0.922. The correlation equation can be obtained by linear regression fitting, which is as follows:
TP = 1.281IP + 81.309 (R2 = 0.922)
IP is mainly related to Fe/Al–P, with a correlation coefficient of 0.888. The correlation equation is shown as:
IP = 0.894 (Fe/Al-P) + 131.5 (R2 = 0.888)
The results are consistent with the analysis of monitoring results, which verified the main fractions of IP in sediments of Biliuhe reservoir, of which Fe/Al-P was the main form. The similar results were found in other reservoir sediments [30].
4.2. Adsorption and Release Characteristics of Sediments P in Biliuhe Reservoir
As seen in Figure 2, the adsorption and release of sediment phosphorus are influenced by the concentration of the overlying water. Sediment P is released when the initial concentration is lower. Conversely, sediment P is adsorbed when the initial concentration is higher. In addition, the higher the initial concentration, the larger the amount of phosphorus adsorbed. The fitting of sorption isotherm equations to experimental adsorption data is usually an important aspect of understanding the adsorption behavior. Next, the P adsorption characteristics of sediment were analyzed by fitting Langmuir and Freundlich model. The Langmuir model is a single molecule adsorption equation derived from the view of kinetic and some assumptions [31,32].
where q is the adsorption (mg/kg), C is the equilibrium concentration (mg/L), Qmax is the maximum adsorption (mg/kg), and Kd is the adsorption efficiency (L/kg).
Freundlich model formula is [33,34]:
where q is the adsorption (mg/kg), C is the equilibrium concentration (mg/L), 1/n is the adsorption efficiency. A smaller value means better adsorption properties. It is easier to adsorb when the adsorption efficiency is 0.1–0.5, and adsorption becomes difficult when the adsorption efficiency is greater than 2.
q = KC1/n
The adsorption characteristics of sediment were studied by inputting data into the model for fitting analysis, with results shown in Table 3 and Table 4.
From Table 3 and Table 4, it can be seen that both the Langmuir model and Freundlich model fit the process of P adsorption well. The maximum adsorption capacity of TP (Qmax) in the sediments of the Biliuhe reservoir was between 714.29 and 3333.33 mg/kg, which indicates a high potential adsorption capacity. Similar characteristics were also found in Northern Waihai, Dianchi Lake, which had a Qmax of 1088.93–3195.53 mg/kg [35]. The maximum P adsorption capacity is larger in the reservoir area (point 7, 10), while it is smaller in the three entrances of the reservoir (point 1–3). This is mainly related to the form of sand in sediments at the entrances. Kd was the adsorption efficiency obtained by the Langmuir model, which is related to the adsorption free energy. A previous paper indicated that Kd was 20–40 L/kg in oxic sediments in UK lakes and could reach nearly 4000 L/kg in iron-rich oceanic sediments [36]. Kd ranged from 0.571 to 14.786 L/kg in sediments of the Biliuhe reservoir and was larger in the water-level fluctuating zone (point 11, 12), which might be attributed to the higher organic matter content [37]. The adsorption efficiency (1/n was calculated by the Freundlich model and represented the adsorption capacity of the adsorbent) was between 0.40 and 0.77 in the water covered zone and larger (0.94–1.42) in the water-level fluctuating zone, which indicates that P adsorption is more difficult in the water-level fluctuating zone. The similar results are reported in research examining the Three Gorges Reservoir research [15].
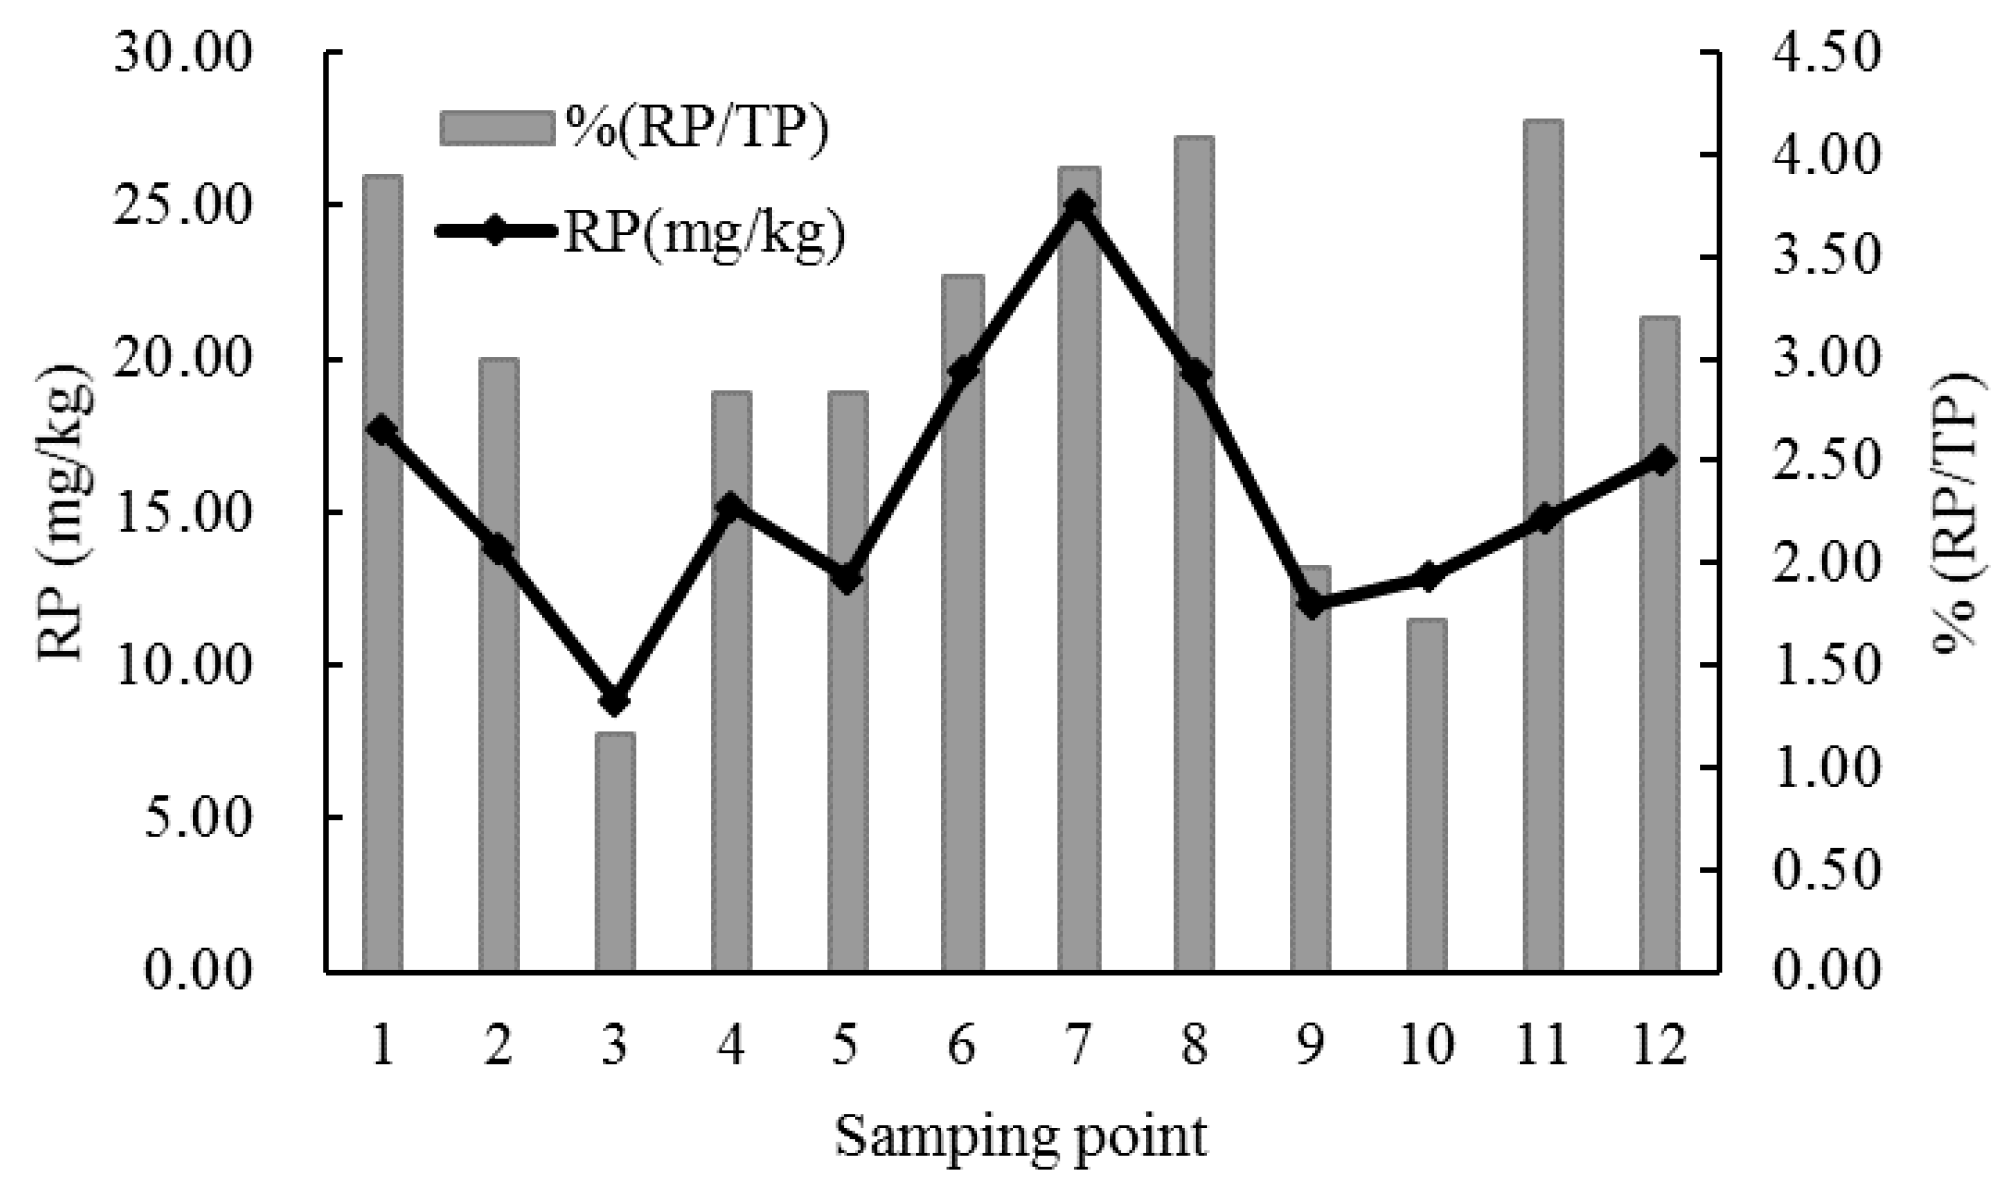
Further, the release characteristics were analyzed based on observed experimental results (Figure 5, Table 5). Statistical analysis revealed that there were differences in the released amount of P (RP) in 24 h (when the concentration of overlying was 0 mg/L) at different sites (8.8–25.13 mg/kg). Zhongling site (point 3) has the smallest released amount, and point 7 has the largest released amount. The released amount of P in 24 h accounted for 1.15–4.16% of TP in sediments.
As can be seen in Table 5, the most critical concentration intervals of P adsorption and release were 0.1–0.2 mg/L. When the overlying water concentration was greater than the critical concentration, the sediment is adsorbed. Conversely, sediment is released.
The annual average content of TP was 0.015 mg/L, which is less than the critical concentration. Therefore, there is potential release risk for P in the Biliuhe reservoir.
4.3. Environment Influence of Sediment P
Sediment phosphorus is one of the factors contributing to water eutrophication due to the dual ability of pollutants acting as sources and sinks. Surveys show that the content of sediment phosphorus differs greatly in different zones. For instance, the concentration of total phosphorus in sediments is between 152.18 mg/kg and 275.12 mg/kg in the Antalya Lake of Turkey, and the contamination risk is low [38]. The concentration of sediment phosphorus ranges from 443 mg/kg to 611 mg/kg in Baiyangdian Lake, which has become a potential factor of water eutrophication [16]. Similarly, sediment P concentration is between 390 mg/kg and 810 mg/kg in the Three Gorges reservoir [15]. In Nyanza Lake in Africa, the concentration ranges from 812.7 mg/kg to 1738 mg/kg, and this relatively high concentration results in high contamination risk [39]. There is also a high risk of contamination in Dianchi Lake, where the concentration can reach 843.96–8144.44 mg/kg [35]. As mentioned above, the concentration of sediment phosphorus in the Biliuhe reservoir ranges from 452.73 mg/kg to 764.57 mg/kg, which is much closer to that in the Three Gorges reservoir. As studied before, the released amount during 24 h in the Three Gorges reservoir is between 1.67 mg/kg to 7.00 mg/kg, with a release ratio of 0.43–0.86%. These values in Biliuhe reservoir are 8.8–25.13 mg/kg and 1.16–4.16%, respectively. In the Three Gorges reservoir, Ca-P is the main fraction of IP, while Fe/Al-P is the main fraction of IP in Biliuhe reservoir, and Fe/Al-P is more easily released [15]. Through comparison, it is obvious that there is a greater release capacity in the Biliuhe reservoir, which is related to the fraction of phosphorus in the sediment. Therefore, sediment phosphorus is a potential factor of water eutrophication in Biliuhe reservoir. This paper quantified the ecological risk of P in sediments by referring to the method in literature and standard by Ontario Department of Environment and Energy of Canada (1992). The evaluation criterion is shown in Table 6 [40].
The security level means that there is no contamination effect on aquatic organisms. The lowest level means that the sediments have been contaminated but most benthos can endure. A serious level indicates that benthic organisms have suffered obvious damage.
The equation of pollution index method is as follows [36]:
where Ki is the pollution index of i, Ciis the measured concentration of i, and Coi is the evaluation standard of i.
The pollution index is computed by comparison with the evaluation criteria of the lowest level.
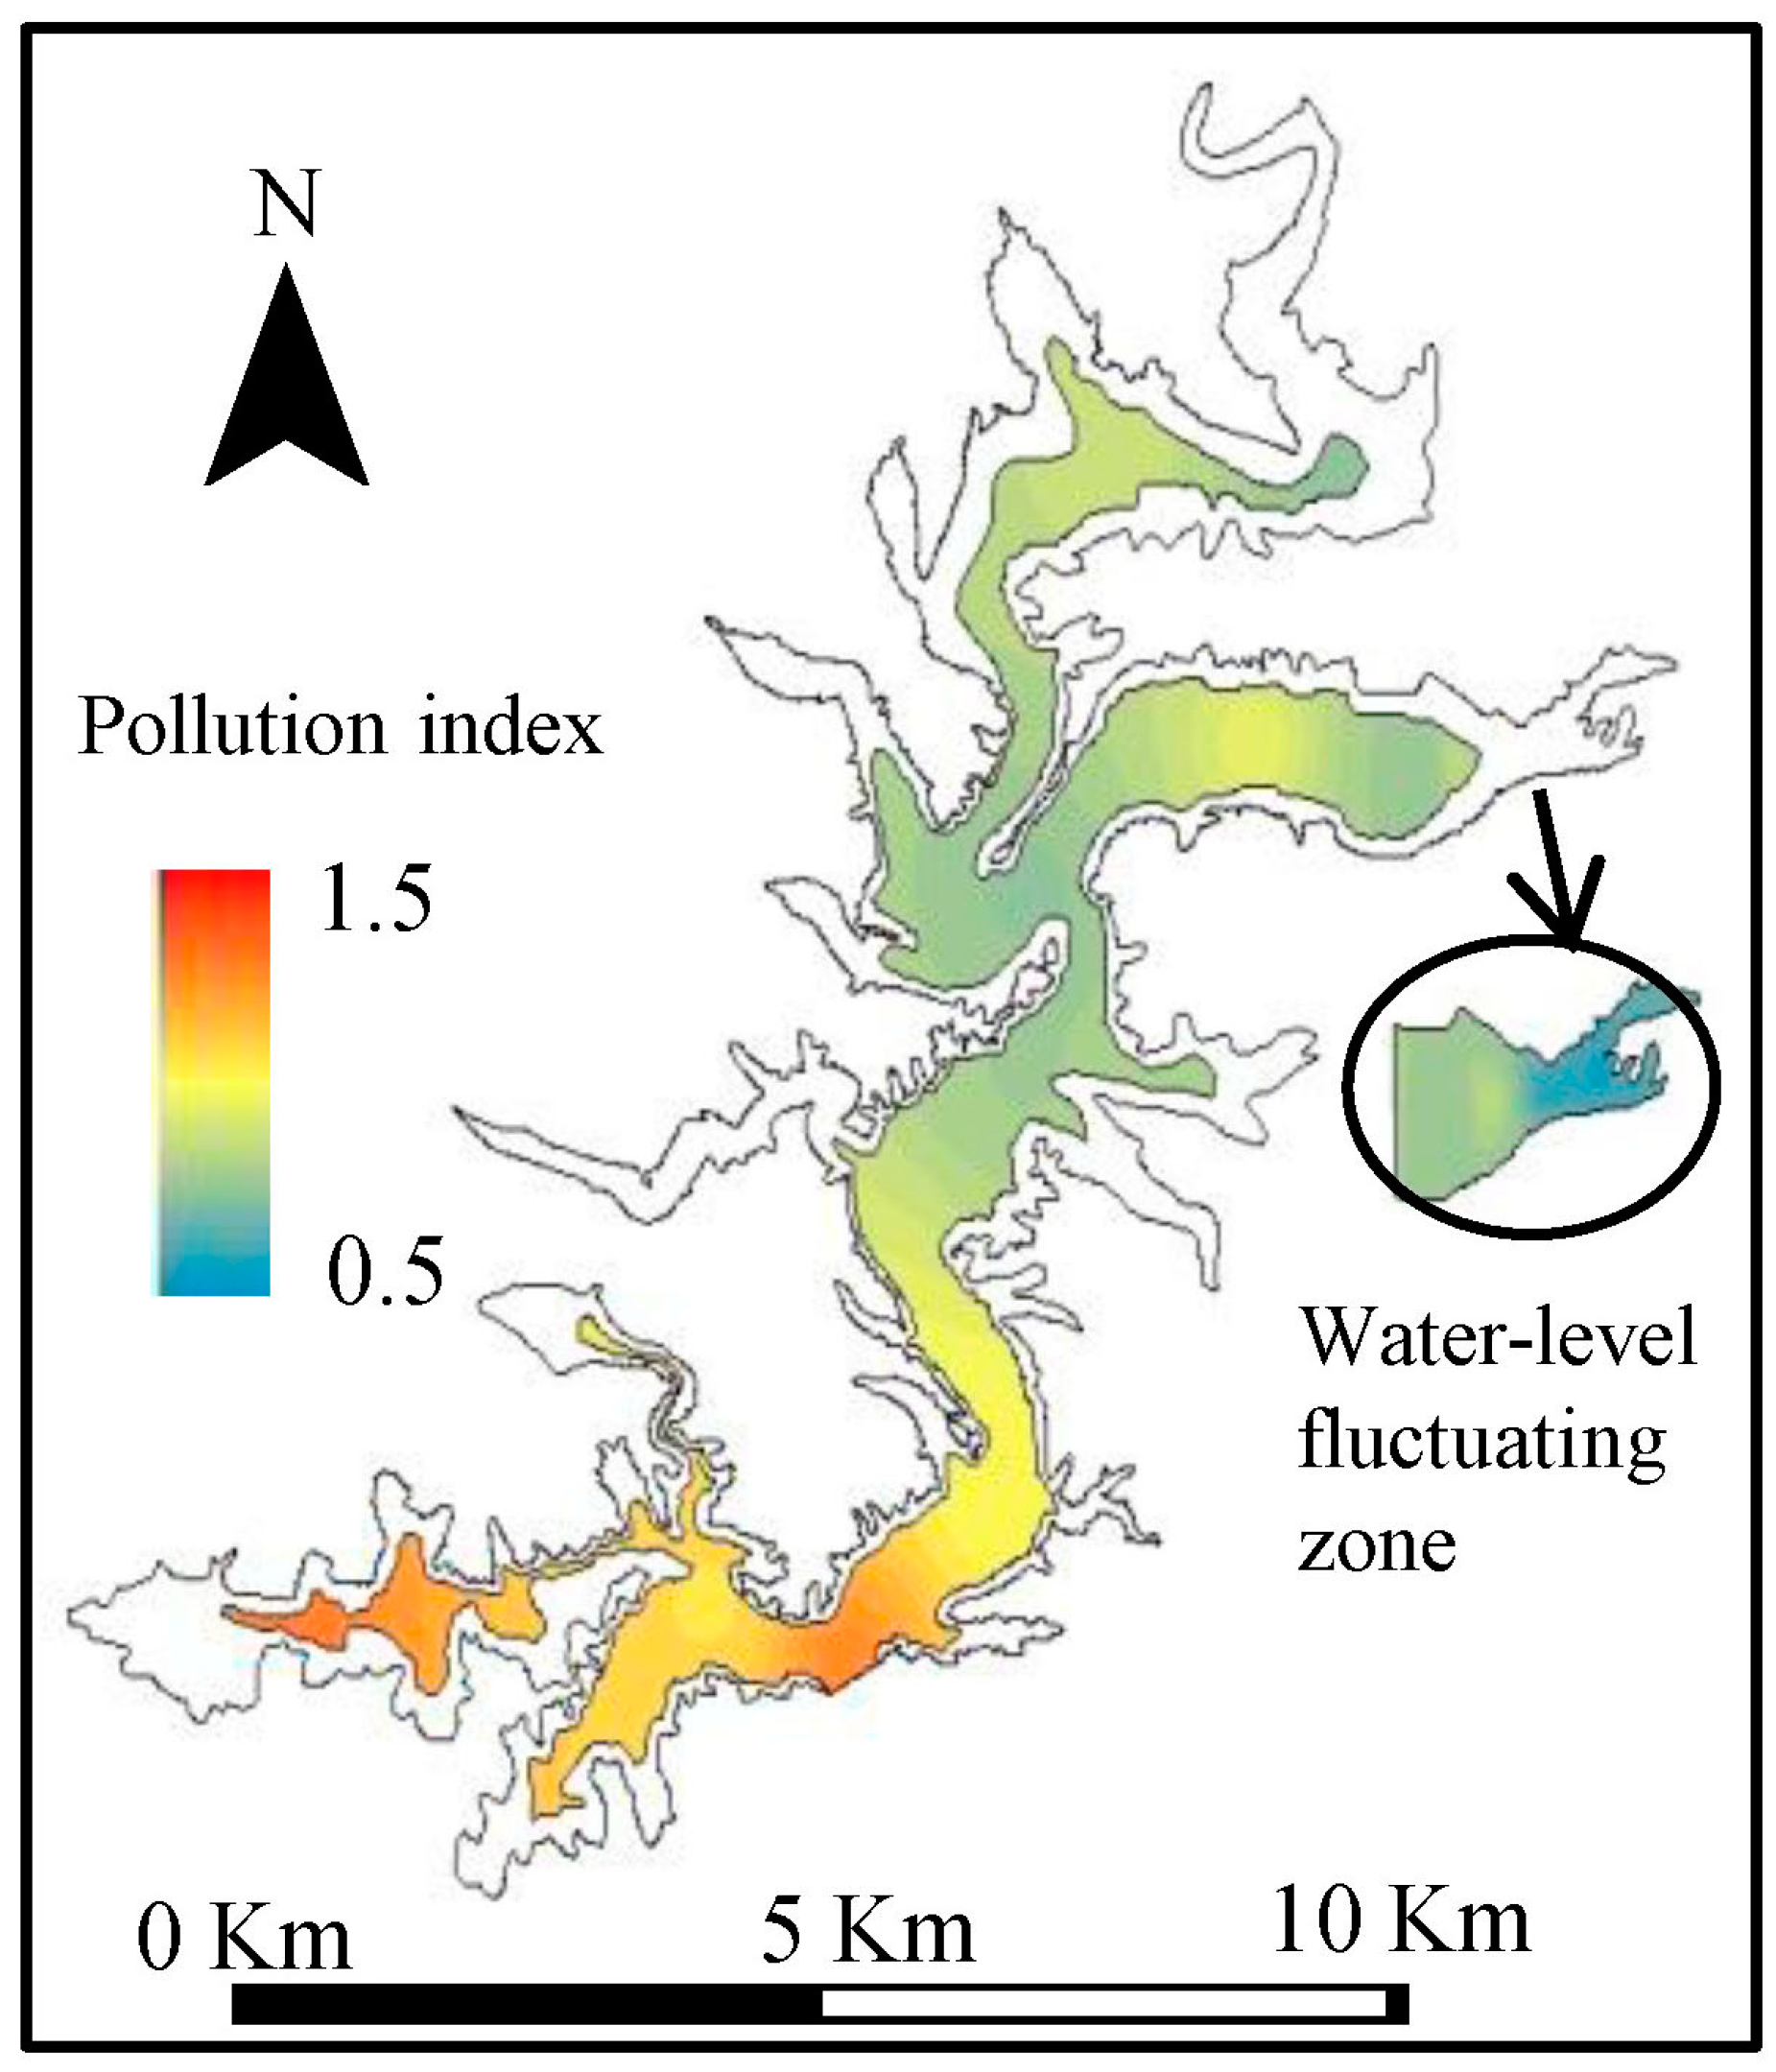
As can be seen in Figure 6, the pollution index of TP in sediments ranged from 0.59 to 1.27. Site 7, the center of the reservoir (point 9), area in front of the dam (point 10), and the Zhongling (point 3) site had the P pollution index that were larger than 1 and less than 3.33 (the ratio of serious level and the lowest level). The P pollution indexes in the rest points were all less than 1. The average pollution index of sediment was 0.95 in water covered areas and 0.69 in the water-level fluctuating zone. Results show that sediment phosphorus poses ecological risks, although the degree of this risk is relatively low.
Interestingly, the simulated experiments produced results that were not consistent with this conclusion. The equilibrium concentration of each point site is between 0.088 mg/L and 0.152 mg/L, while the initial concentration of total phosphorus in the overlying water is 0 mg/L. This indicates that the release could prominently increase the load of phosphorus in water. During the same period, the concentration of total phosphorus is 0.01–0.04 mg/L in reservoir, which is far below the equilibrium concentration considering the release of sediment. This phenomenon could be attributed to the following reasons. First, the actual concentration of phosphorus in the overlying water in Biliuhe reservoir is greater than 0 mg/L, so the release capacity declines correspondingly. Second, the disturbance in simulated experiments promotes the release of sediment phosphorus. Third, the release process is divided into two procedures. In the first stage, P accumulates in interstitial water, and diffuses into the water overlay, so the influence in the overlaying water is weakened. Therefore, sediment phosphorus has a smaller influence on water in Biliuhe reservoir, but there is still a potential ecological risk.
5. Conclusions
This paper selected a typical reservoir as a case study, and then investigated the spatial distribution and fractions of phosphorus in sediments, explored sediment P adsorption/release characteristics using laboratory simulation experiment, and finally analyzed the environmental influence of phosphorus in sediments.
The distributions of TP, IP, OP, Fe/Al-p, and Ca-P were consistent with that of TP in Biliuhe reservoir, of which the contents were large in front of the dam and the Zhongling site, smaller at the entrance of the reservoir and smallest in the water-level fluctuating zone. The TP concentration in the sediments of the Biliuhe reservoir ranged from 355.46 to 764.57 mg/kg. IP was the main form of sediment P, which accounted for 56–75% of TP with a correlation coefficient of 0.922. Fe/Al-P was the main form of IP, accounting for 46–83% of IP with a correlation coefficient of 0.888. There were two states of sediment TP in the Biliuhe reservoir, i.e., adsorption and release. The TP in sediments was mainly in the release state as most critical concentration intervals of P adsorption and release were 0.1–0.2 mg/L, which was larger than the average concentration of TP in water. The maximum adsorption amount obtained by the Langmuir model was 714.29–3333.33 mg/kg. The adsorption efficiency, calculated by Freundlich model was 0.40–1.42, and P adsorption was more difficult in the water-level fluctuating zone. The released amount of P in 24 h accounted for 1.15–4.16% of TP in sediments. Generally, the reservoir water is at a low risk of pollution of TP in sediments.
This paper is helpful to promote the research on environmental behaviors of sediment P and provides references for similar researches. The influence of the micro-environmental factors (pH, temperature, dissolved oxygen, hydraulic disturbance, water pressure etc.) need to be considered in the future studies.
Acknowledgments
The authors would like to thank anonymous reviewers. This work was supported by the National Key Research and Development Program of China (2016YFC0400903), the National Natural Science Foundation of China (No. 51327004; No. 51679026; No. 51209030), Project of comprehensive investigation of water quality in Biliuhe reservoir and the Fundamental Research Funds for the Central Universities (DUT17JC17).
Author Contributions
Tianxiang Wang and Jianwei Liu conceived and designed the experiments; Tianxiang Wang and Guoshuai Qin performed the experiments; Tianxiang Wang, Ya Sun and Fuqiang Wang analyzed the data; Shiguo Xu contributed reagents/materials/analysis tools; Tianxiang Wang wrote the paper.
Conflicts of Interest
The authors declare no conflict of interest.
References
- Shi, D.M.; Wang, W.L.; Jiang, G.Y.; Peng, X.D.; Yu, Y.L.; Li, Y.X.; Ding, W.B. Effects of disturbed landforms on the soil water retention function during urbanization process in the Three Gorges Reservoir Region, China. Catena 2016, 144, 84–93. [Google Scholar] [CrossRef]
- Xu, S.G.; Wang, T.X.; Hu, S.D. Dynamic assessment of water quality based on a Variable Fuzzy Pattern Recognition model. Int. J. Environ. Res. Public Health 2015, 12, 2230–2248. [Google Scholar] [CrossRef] [PubMed]
- Xu, S.G.; Wang, T.X. Review of research on accumulation process and effect of internal pollution of reservoir. Adv. Sci. Technol. Water Resour. 2015, 35, 162–167. [Google Scholar] [CrossRef]
- Skordas, K.; Kelepertzis, E.; Kosmidis, D.; Panagiotaki, P.; Vafidis, D. Assessment of nutrients and heavy metals in the surface sediments of the artificially lake water reservoir Karla, Thessaly, Greece. Environ. Earth Sci. 2015, 73, 4483–4493. [Google Scholar] [CrossRef]
- Dhanakumar, S.; Solaraj, G.; Mohanraj, R. Heavy metal partitioning in sediments and bioaccumulation in commercial fish species of three major reservoirs of river Cauvery delta region, India. Ecotox. Environ. Saf. 2015, 113, 145–151. [Google Scholar] [CrossRef] [PubMed]
- Wang, P.F.; Liu, J.J.; Wang, C.; Qian, J.; Hou, J.; Ren, L.X. Seasonal, Spatial Distribution and Ecological Risk Assessment of Heavy Metals in Surface Sediments from a Watershed Area in Gonghu Bay in Taihu Lake, China. Terr. Atmos. Ocean. Sci. 2014, 25, 605–616. [Google Scholar] [CrossRef]
- Wang, T.Y.; Tan, B.; Lu, Y.L. HCHs and DDTs in Soils around Guanting Reservoir in Beijing, China: Spatial-Temporal Variation and Countermeasures. Sci. World J. 2012, 12, 1–10. [Google Scholar] [CrossRef] [PubMed]
- Cui, S.; Fu, Q.; Li, T.X.; Ma, W.L.; Liu, D.; Wang, M. Sediment-Water Exchange, Spatial Variations, and Ecological Risk Assessment of Polycyclic Aromatic Hydrocarbons (PAHs) in the Songhua River, China. Water 2016, 8, 1–13. [Google Scholar] [CrossRef]
- Ministry of Environmental Protection of the People’s Republic of CHINA. Chinese Water Environment Bulletin; Ministry of Environmental Protection of the People’s Republic of CHINA: Beijing, China, 2015.
- Read, E.K.; Ivancic, M.; Hanson, P.; Cade-Menun, B.J.; Mcmahon, K.D. Phosphorus speciation in a eutrophic lake by 31P NMR spectroscopy. Water 2014, 62, 229–240. [Google Scholar] [CrossRef] [PubMed]
- Zhu, G.W.; Wang, F.; Gao, G.; Zhang, Y.L. Variability of phosphorus concentration in large, shallow and eutrophic Lake Taihu, China. Water Environ. Res. 2008, 80, 832–839. [Google Scholar] [CrossRef] [PubMed]
- Wang, L.Q.; Liang, T. Distribution Characteristics of Phosphorus in the Sediments and Overlying Water of Poyang Lake. PLoS ONE 2015, 10, 1–12. [Google Scholar] [CrossRef] [PubMed]
- Lucas, B.T.; Liber, K.; Doig, L.E. Spatial and temporal in reservoir physicochemistry and phosphorus speciation within lake Diefenbaker, a great plains reservoir, as inferred form depositional sediments. J. Great Lakes Res. 2015, 41, 67–80. [Google Scholar] [CrossRef]
- Ruban, V.; López-Sánchez, J.F.; Pardo, P.; Rauret, G.; Muntau, H.; Quevauviller, P. Harmonized protocol and certified reference material for the determination of extractable contents of phosphorus in freshwater sediments—A synthesis of recent works. Fresenius J. Anal. Chem. 2001, 370, 224–228. [Google Scholar] [CrossRef] [PubMed]
- Zhang, B.; Fang, F.; Guo, J.S.; Chen, Y.P.; Guo, S.S. Phosphorus fractions and phosphate sorption-release characteristics relevant tothe soil composition of water-level-fluctuating zone of Three Gorges Reservoir. Ecol. Eng. 2012, 40, 153–159. [Google Scholar] [CrossRef]
- Dong, L.M.; Yang, Z.F.; Liu, X.H. Phosphorus fractions, sorption characteristics, and its release in the sediments of Baiyangdian Lake, China. Environ. Monit. Assess. 2011, 179, 335–345. [Google Scholar] [CrossRef] [PubMed]
- Li, H.Y.; Shi, A.B.; Li, M.Y.; Zhang, X.R. Effects of pH, temperature, dissolved oxygen, and flow rate of overlying water on heavy metals release from storm sewer sediments. J. Chem. 2013, 8, 1–8. [Google Scholar] [CrossRef] [PubMed]
- He, W.; Bai, Z.L.; Liu, W.X.; Kong, X.Z.; Yang, B.; Yang, C.; Jorgensen, S.E.; Xu, F.L. Occurrence, spatial distribution, sources, and risks of polychlorinated biphenyls and heavy metals in surface sediments from a large eutrophic Chinese lake (Lake Chaohu). Environ. Sci. Pollut. Res. 2016, 23, 10335–10348. [Google Scholar] [CrossRef] [PubMed]
- Liu, J.Z.; Luo, X.X.; Zhang, N.M.; Wu, Y.H. Phosphorus released from sediment of Dianchi Lake and its effect on growth of Microcystis aeruginosa. Environ. Sci. Pollut. Res. 2016, 23, 16321–16328. [Google Scholar] [CrossRef] [PubMed]
- Zhang, Q.Y.; Fan, J.; Zhang, X.P. Effects of simulated wind followed by rain on runoff and sediment yield from a sandy loessial soil with rills. J. Soil. Sediment. 2016, 16, 2306–2315. [Google Scholar] [CrossRef]
- Wu, Y.H.; Wen, Y.J.; Zhou, J.X.; Wu, Y.Y. Phosphorus release from lake sediments: Effects of pH, temperature and dissolved oxygen. KSCE J. Civ. Eng. 2014, 18, 323–329. [Google Scholar] [CrossRef]
- Kleeberg, A.; Freidank, A.; Joehnk, K. Effects of ice cover on sediment resuspension and phosphorus entrainment in shallow lakes: Combining in situ experiments and wind-wave modeling. Limnol. Oceanorgr. 2013, 58, 1819–1833. [Google Scholar] [CrossRef]
- Wasserman, J.C.; Wasserman, M.A.V.; Barrocas, P.R.G.; Almeida, A.M. Predicting pollutant concentrations in the water column during dredging operations: Implications for sediment quality criteria. Mar. Pollut. Bull. 2016, 108, 24–32. [Google Scholar] [CrossRef] [PubMed]
- Banasiak, R. Hydraulic performance of sewer pipes with deposited sediments. Water Sci. Technol. 2008, 11, 1743–1748. [Google Scholar] [CrossRef] [PubMed]
- Belmont, M.A.; White, J.R.; Reddy, K.R. Phosphorus sorption and potential phosphorus storage in sediments of Lake Istokpoga and the upper chain of lakes, Florida, USA[J]. J. Environ. Qual. 2009, 38, 987. [Google Scholar] [CrossRef] [PubMed]
- Zhang, W.L.; Zeng, C.S.; Tong, C.; Zhai, S.J.; Lin, X.; Gao, D.Z. Spatial distribution of phosphorus speciation in marsh sediments along a hydrologic gradient in a subtropical estuarine wetland, China. Estuar. Coast. Shelf. Sci. 2015, 154, 30–38. [Google Scholar] [CrossRef]
- Baastrup-Spohr, L.; Moller, C.L.; Sand-Jensen, K. Water-level fluctuations affect sediment properties, carbon flux and growth of the isoetidLittorellauniflora in oligotrophic lakes. Freshw. Biol. 2016, 61, 301–315. [Google Scholar] [CrossRef]
- Brdgeman, T.B.; Chaffin, J.D.; Kane, D.D.; Conroy, J.D.; Panek, S.E.; Armenio, P.M. From river to lake: Phosphorus partitioning and algal community compositional changes in Western lake Erie. J. Great Lakes Res. 2012, 38, 90–97. [Google Scholar] [CrossRef]
- Zhu, M.; Zhu, G.; Li, W.; Zhang, Y.; Zhao, L.; Gu, Z. Estimation of the algal-available phosphorus pool in sediments of a large, shallow eutrophic lake (Taihu, China) using profiled SMT fractional analysis. Environ. Pollut. 2013, 173, 216–223. [Google Scholar] [CrossRef] [PubMed]
- Jin, X.D.; He, Y.L.; Kirumba, G. Phosphorus fractions and phosphate sorption-release characteristics of the sediment in the Yangtze River estuary reservoir. Ecol. Eng. 2013, 55, 62–66. [Google Scholar] [CrossRef]
- Bai, X.; Liu, Y.Q.; Yu, L.; Hua, Z.L. Distribution behavior of superparamagnetic carbon nanotubes in an aqueous system. Sci. Rep. 2016, 6, 1–11. [Google Scholar] [CrossRef] [PubMed]
- Tayo, O.O.; John, O.O.; Georges-Ivo, E.E. Fluoride Sorption Efficiency of Vermiculite Functionalised with Cationic Surfactant: Isotherm and Kinetics. Appl. Sci. 2016, 6, 277. [Google Scholar] [CrossRef]
- Qiu, H.; Vijver, M.G.; He, E.K.; Peijnenburg, W.J.G.M. Predicting Copper Toxicity to Different Earthworm Species Using a Multicomponent Freundlich Model. Environ. Sci. Technol. 2013, 47, 4796–4803. [Google Scholar] [CrossRef] [PubMed]
- Hafeznezami, S.; Zimmer-Faust, A.G.; Dunne, A.; Tran, T.; Yang, C.; Lam, J.R.; Reynolds, M.D.; Davis, J.A.; Jay, J.A. Adsorption and desorption of arsenate on sandy sediments from contaminated and uncontaminated saturated zones: Kinetic and equilibrium modelling. Environ. Pollut. 2016, 215, 290–301. [Google Scholar] [CrossRef] [PubMed]
- Chen, C.Y.; Deng, W.M.; Xu, X.M.; He, J.; Wang, S.R.; Jiao, L.X.; Zhang, Y. Phosphorus adsorption and release characteristics of surface sediment in Dianchi lake, China. Environ. Earth Sci. 2015, 74, 3689–3700. [Google Scholar] [CrossRef]
- Wang, S.R.; Jin, X.C.; Pang, Y.; Zhao, H.C.; Zhou, X.N.; Wu, F.C. Phosphorus fractions and phosphate sorption characteristics in relation to the sediment compositions of shallow lakes in the middle and lower reaches of Yangtze River region China. J. Colloid Interface Sci. 2005, 289, 339–346. [Google Scholar] [CrossRef] [PubMed]
- Wang, C.; Fan, X.L.; Wang, P.F.; Hou, J.; Ao, Y.H.; Miao, L.Z. Adsorption behavior of lead on aquatic sediments contaminated with cerium dioxide nanoparticles. Environ. Pollut. 2016, 219, 416–424. [Google Scholar] [CrossRef] [PubMed]
- Gunduz, B.; Aydin, F.; Aydin, I.; Hamamci, C. Study of phosphorus distribution in coastal surface sediment by sequential extraction procedure (NE Mediterranean Sea, Antalys-Turkey). Microchem. J. 2011, 98, 72–76. [Google Scholar] [CrossRef]
- GikumaNjuru, P.; Hecky, R.E.; Guildford, S.J. Surficial sediment phosphorus fractions along a biogeochemical gradient in Nyanza Gulf, northeastern lake Victoria and their possible role in phosphorus recycling and internal loading. Biogeochemistry 2010, 97, 247–261. [Google Scholar] [CrossRef]
- Ye, H.X. A Study on the Spatial Differention and Potential Ecological Risk of Nutrients and Heavy Metals in the Sediments of Zhalong Wetland in China; Harbin Normal University Press: Harbin, China, 2014. [Google Scholar]
Figure 1.
The distribution map of monitoring points of Biliuhe reservoir.

Figure 2.
The characteristics of P adsorption and release in sediments.
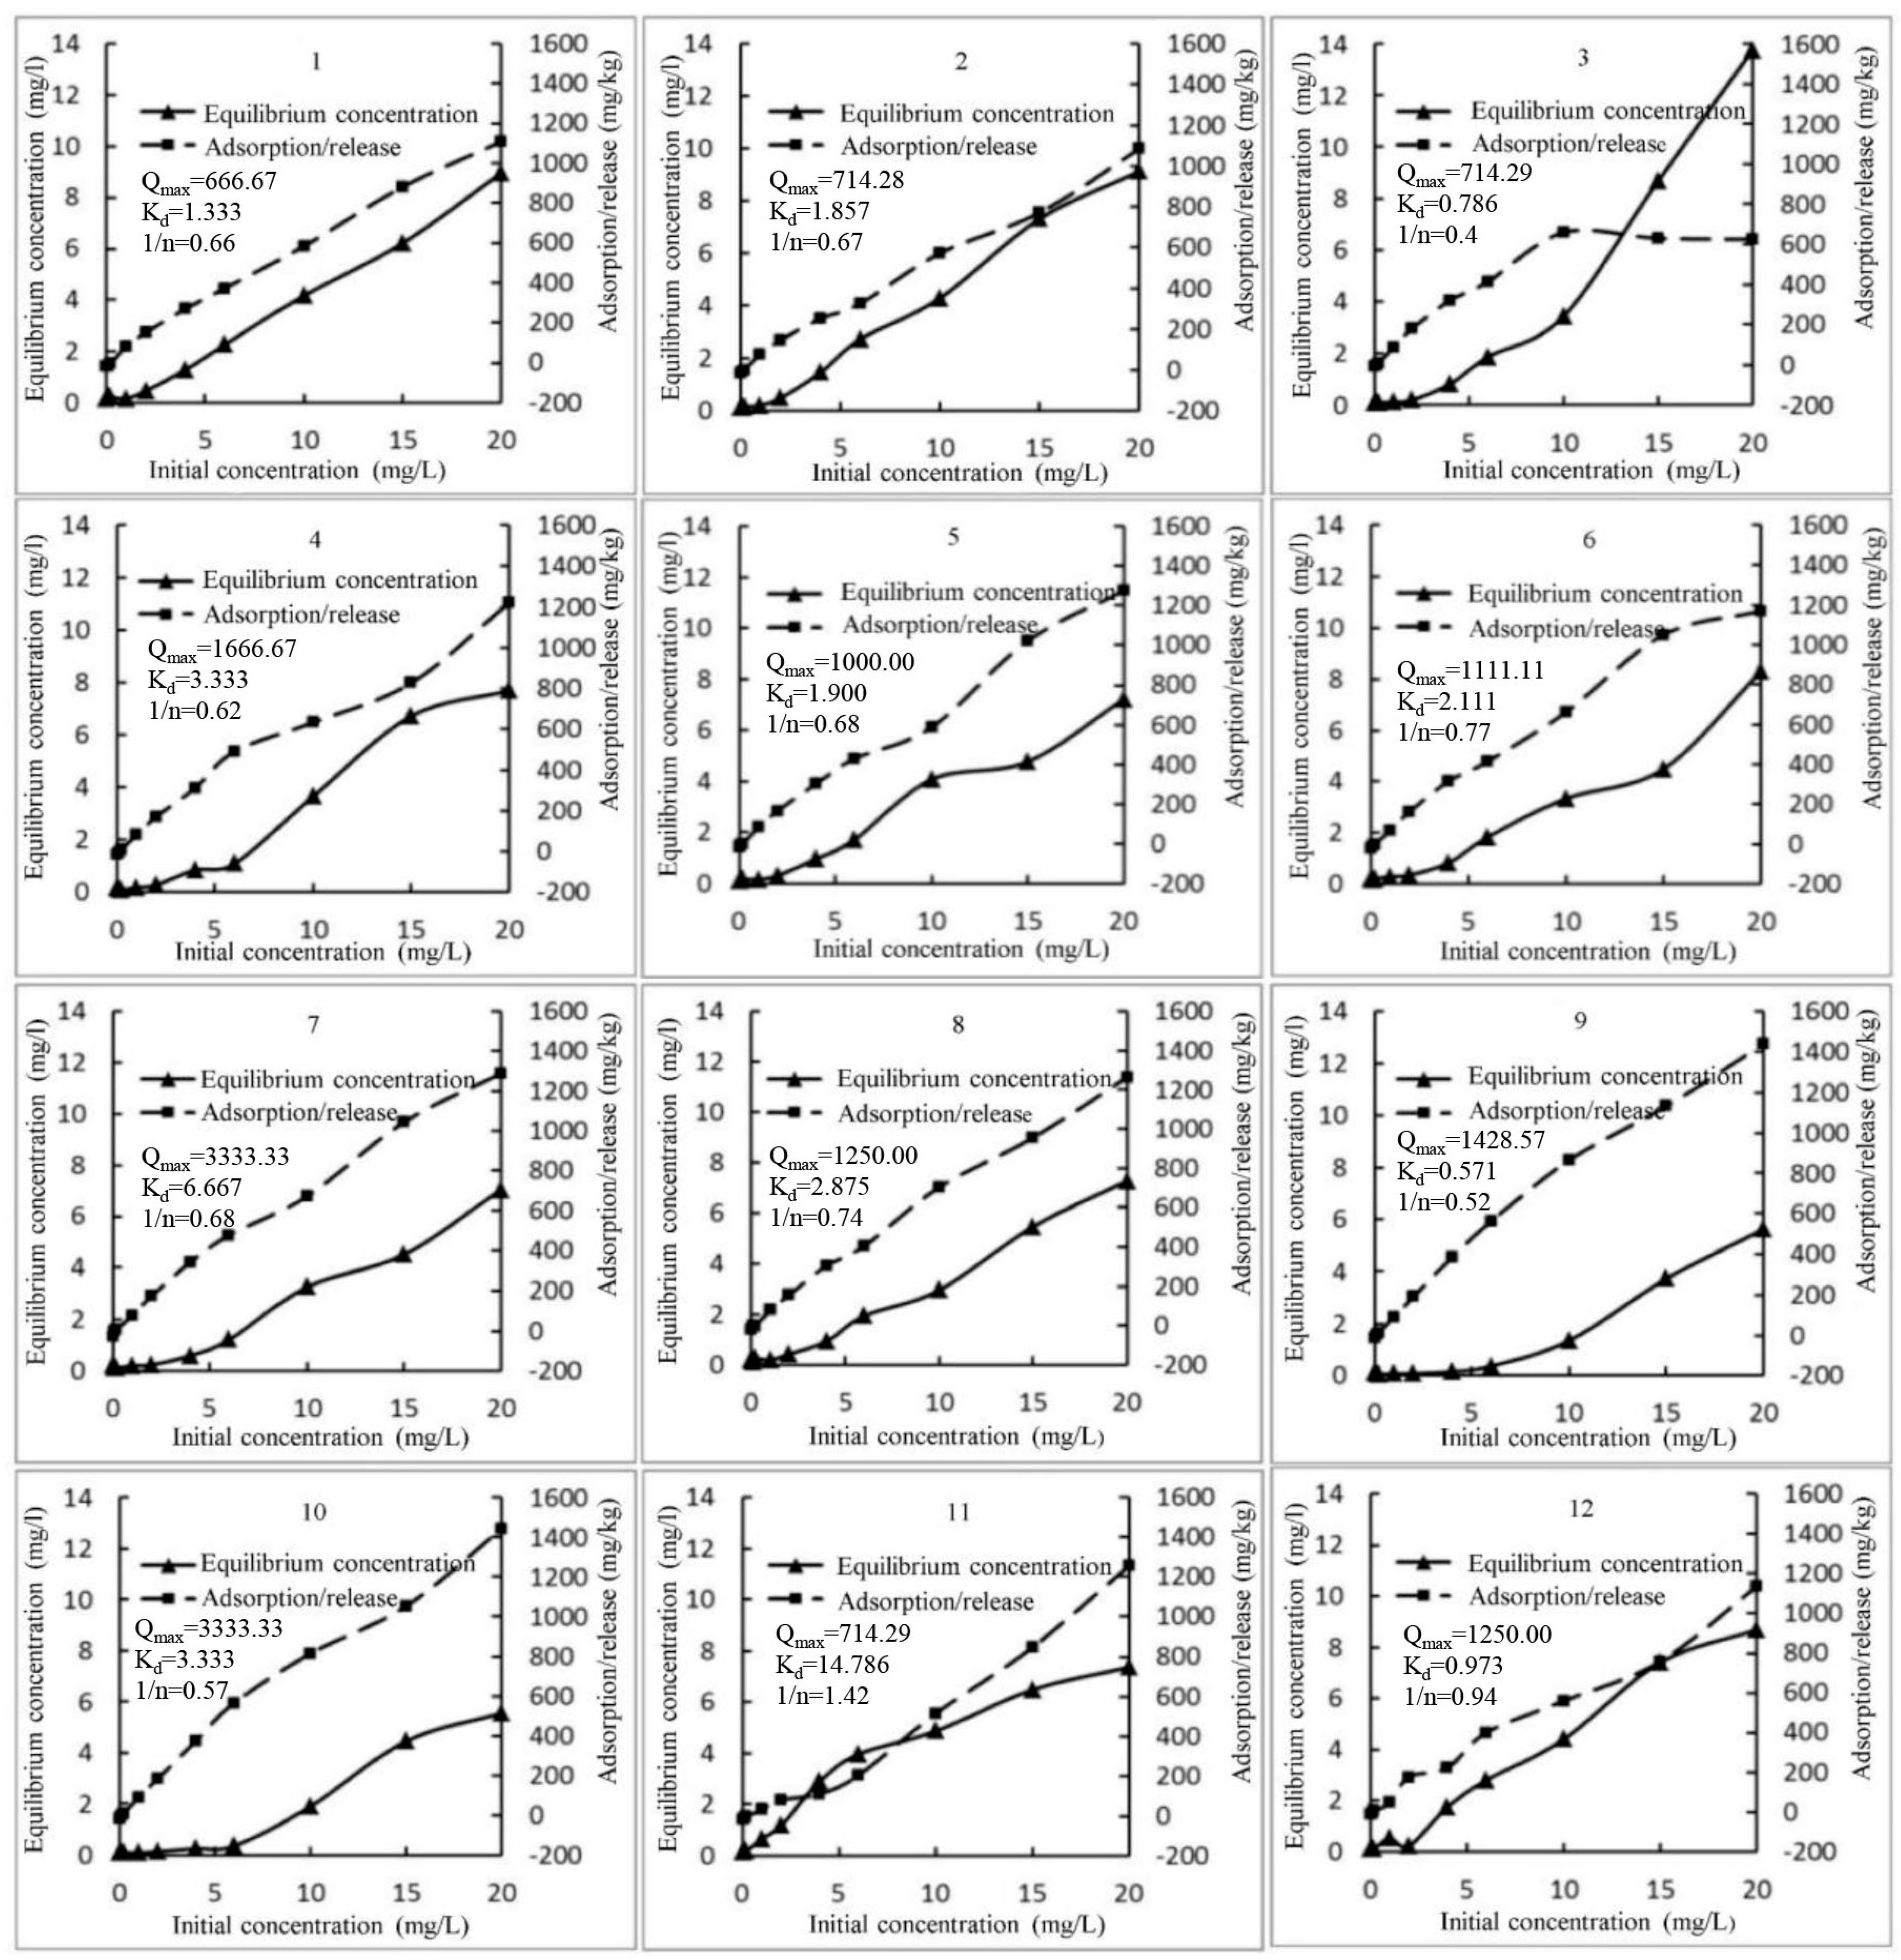
Figure 3.
Distribution of TP in sediments.

Figure 4.
Distributions of P fractions in sediments.
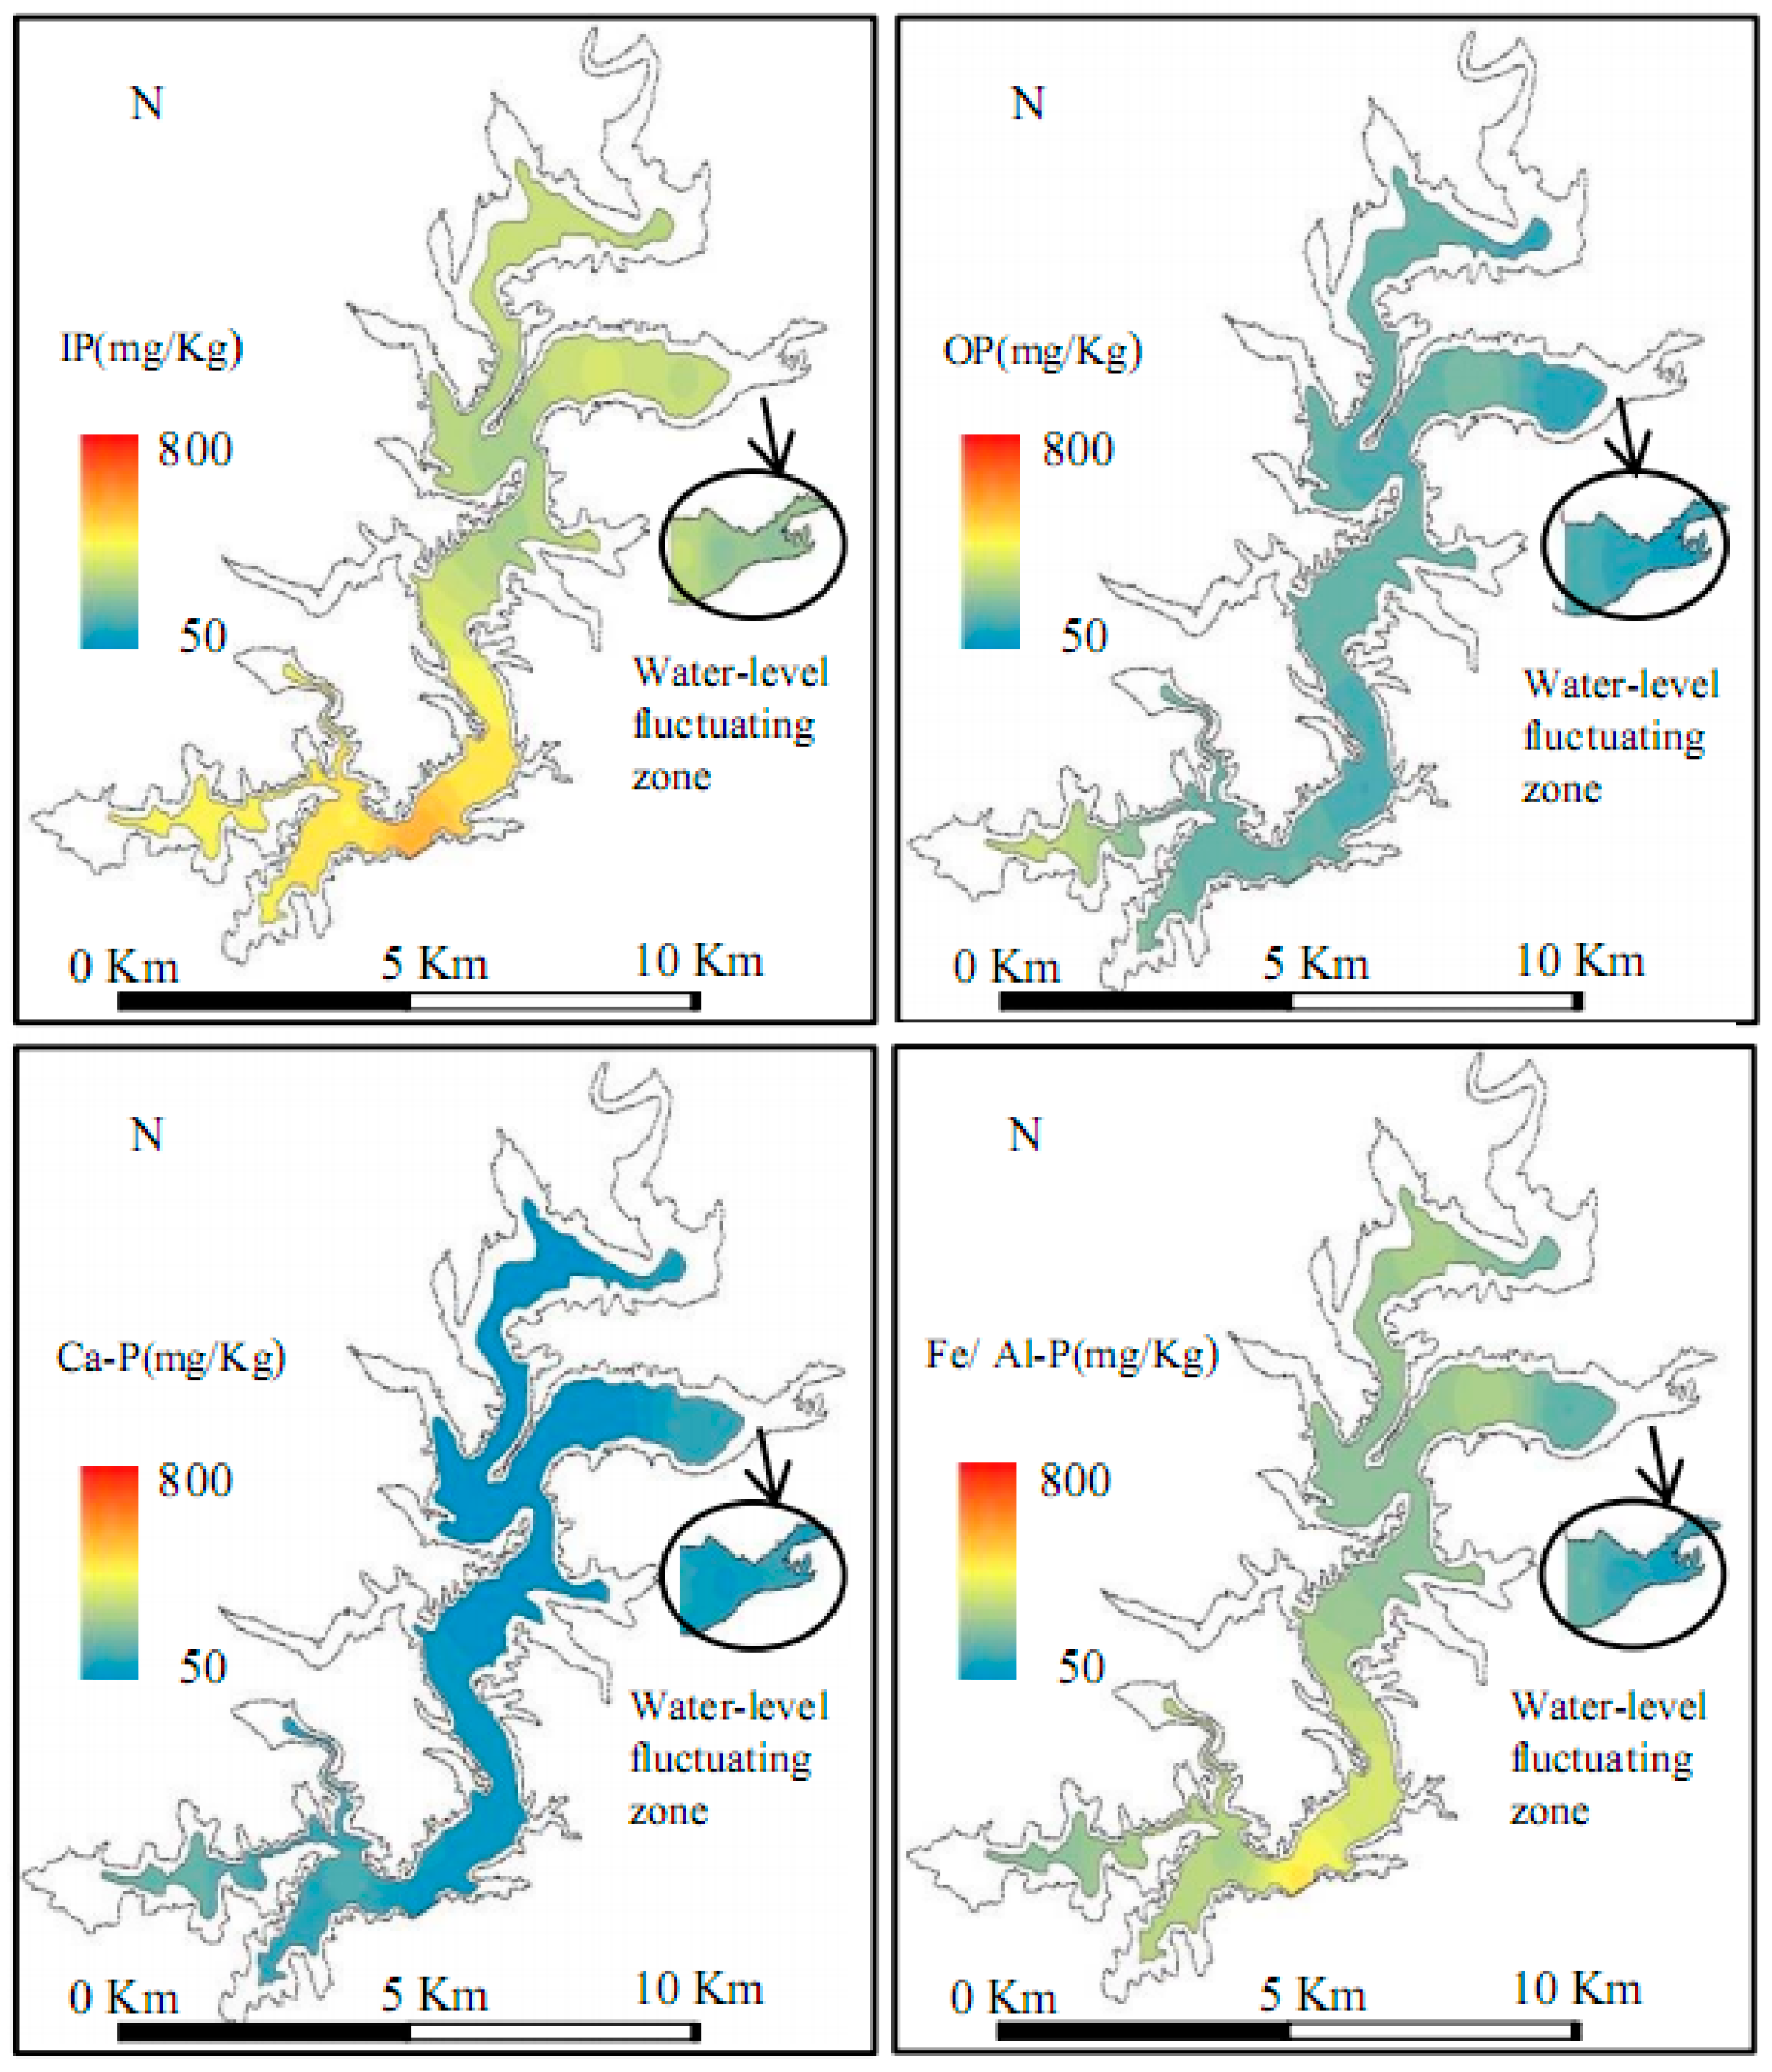
Figure 5.
The release amount and proportion of P in sediments.

Figure 6.
The ecological risk of sediment P pollution.


Table 1.
Total Phosphorus (TP) and Phosphorus (P) fractions in sediments.
| Type | Item | Maximum (mg/kg) | Minimum (mg/kg) | Mean (mg/kg) | Standard Deviation | Coefficient of Variation |
|---|---|---|---|---|---|---|
| Water covered zone (n = 10) | TP | 764.57 | 452.73 | 571.56 | 117.85 | 0.21 |
| Fe/Al-P | 455.00 | 173.90 | 277.52 | 82.51 | 0.30 | |
| Ca-P | 194.14 | 53.20 | 102.76 | 49.39 | 0.48 | |
| IP | 549.73 | 284.40 | 380.28 | 86.66 | 0.23 | |
| OP | 336.05 | 135.68 | 191.28 | 57.93 | 0.30 | |
| Water-level fluctuating zone (n = 2) | TP | 523.96 | 355.46 | 439.71 | 119.15 | 0.27 |
| Fe/Al-P | 219.56 | 112.71 | 166.13 | 75.55 | 0.45 | |
| Ca-P | 130.10 | 115.23 | 122.67 | 10.51 | 0.09 | |
| IP | 334.79 | 242.81 | 288.80 | 65.04 | 0.23 | |
| OP | 189.18 | 112.65 | 150.91 | 54.11 | 0.36 |
Table 2.
Results of Pearson correlation analysis (n = 12).
| TP | Fe/Al-P | Ca-P | IP | OP | |
|---|---|---|---|---|---|
| TP | 1 | 0.778 ** | 0.316 | 0.922 ** | 0.770 ** |
| Fe/Al-P | 0.778 ** | 1 | −0.223 | 0.888 ** | 0.320 |
| Ca-P | 0.316 | −0.223 | 1 | 0.250 | 0.312 |
| IP | 0.922 ** | 0.888 ** | 0.250 | 1 | 0.465 |
| OP | 0.770 ** | 0.320 | 0.312 | 0.465 | 1 |
Note: ** p < 0.01.
Table 3.
Fitting model of Langmuir.
| Sampling Site | Equation | Qmax | Kd | R2 |
|---|---|---|---|---|
| 1 | 1/q = 0.002/C + 0.0015 | 666.67 | 1.333 | 0.970 |
| 2 | 1/q = 0.0026/C + 0.0014 | 714.28 | 1.857 | 0.981 |
| 3 | 1/q = 0.0011/C + 0.0014 | 714.29 | 0.786 | 0.960 |
| 4 | 1/q = 0.002/C + 0.0006 | 1666.67 | 3.333 | 0.959 |
| 5 | 1/q = 0.0019/C + 0.001 | 1000.00 | 1.900 | 0.986 |
| 6 | 1/q = 0.0019/C + 0.0009 | 1111.11 | 2.111 | 0.977 |
| 7 | 1/q = 0.002/C + 0.0003 | 3333.33 | 6.667 | 0.864 |
| 8 | 1/q = 0.0023/C + 0.0008 | 1250.00 | 2.875 | 0.996 |
| 9 | 1/q = 0.0004/C + 0.0007 | 1428.57 | 0.571 | 0.985 |
| 10 | 1/q = 0.001/C + 0.0003 | 3333.33 | 3.333 | 0.949 |
| 11 | 1/q = 0.0207/C + 0.0014 | 714.29 | 14.786 | 0.960 |
| 12 | 1/q = 0.0035/C + 0.0008 | 1250.00 | 4.375 | 0.973 |
Table 4.
Fitting model of Freundlich.
| Sampling Site | Equation | 1/n | R2 |
|---|---|---|---|
| 1 | Log(q) = 0.6589Log(C) + 2.3855 | 0.66 | 0.993 |
| 2 | Log(q) = 0.6707Log(C) + 2.3193 | 0.67 | 0.981 |
| 3 | Log(q) = 0.3977Log(C) + 2.4667 | 0.40 | 0.888 |
| 4 | Log(q) = 0.6159Log(C) + 2.5049 | 0.62 | 0.935 |
| 5 | Log(q) = 0.6821Log(C) + 2.4805 | 0.68 | 0.972 |
| 6 | Log(q) = 0.7654Log(C) + 2.4433 | 0.77 | 0.935 |
| 7 | Log(q) = 0.6771Log(C) + 2.5598 | 0.68 | 0.935 |
| 8 | Log(q) = 0.7439Log(C) + 2.4545 | 0.74 | 0.992 |
| 9 | Log(q) = 0.5189Log(C) + 2.825 | 0.52 | 0.879 |
| 10 | Log(q) = 0.5663Log(C) + 2.7532 | 0.57 | 0.872 |
| 11 | Log(q) = 1.4172Log(C) + 1.6828 | 1.42 | 0.900 |
| 12 | Log(q) = 0.9388Log(C) + 2.1797 | 0.94 | 0.899 |
Table 5.
Critical concentration ranges of phosphorus adsorption and release in sediments.
| Samping Point | Critical Concentration (mg/L) | Sampling Point | Critical Concentration (mg/L) |
|---|---|---|---|
| 1 | 0.2–1.0 | 7 | 0.1–0.2 |
| 2 | 0.1–0.2 | 8 | 0.2–1.0 |
| 3 | 0.1–0.2 | 9 | 0–0.1 |
| 4 | 0.1–0.2 | 10 | 0.1–0.2 |
| 5 | 0.1–0.2 | 11 | 0.2–1.0 |
| 6 | 0.2–1.0 | 12 | 0.1–0.2 |
Table 6.
Evaluation standard of Nitrogen and Phosphorus in the Sediments.
| Level/Index | TN (mg/kg) | TP (mg/kg) |
|---|---|---|
| Security level | - | - |
| Lowest level | 550 | 600 |
| Serious level | 4800 | 2000 |
© 2017 by the authors. Licensee MDPI, Basel, Switzerland. This article is an open access article distributed under the terms and conditions of the Creative Commons Attribution (CC BY) license (http://creativecommons.org/licenses/by/4.0/).
Share and Cite
MDPI and ACS Style
Wang, T.; Liu, J.; Xu, S.; Qin, G.; Sun, Y.; Wang, F. Spatial Distribution, Adsorption/Release Characteristics, and Environment Influence of Phosphorus on Sediment in Reservoir. Water 2017, 9, 724. https://doi.org/10.3390/w9090724
AMA Style
Wang T, Liu J, Xu S, Qin G, Sun Y, Wang F. Spatial Distribution, Adsorption/Release Characteristics, and Environment Influence of Phosphorus on Sediment in Reservoir. Water. 2017; 9(9):724. https://doi.org/10.3390/w9090724
Chicago/Turabian StyleWang, Tianxiang, Jianwei Liu, Shiguo Xu, Guoshuai Qin, Ya Sun, and Fuqiang Wang. 2017. "Spatial Distribution, Adsorption/Release Characteristics, and Environment Influence of Phosphorus on Sediment in Reservoir" Water 9, no. 9: 724. https://doi.org/10.3390/w9090724
Note that from the first issue of 2016, this journal uses article numbers instead of page numbers. See further details here.