Forecasting of Industrial Water Demand Using Case-Based Reasoning—A Case Study in Zhangye City, China


College of Public Administration, Huazhong Agricultural University, Wuhan 430070, China
*
Author to whom correspondence should be addressed.
Water 2017, 9(8), 626; https://doi.org/10.3390/w9080626
Submission received: 30 June 2017
/
Revised: 3 August 2017
/
Accepted: 18 August 2017
/
Published: 22 August 2017
(This article belongs to the Special Issue Sustainable Water Management within Inland River Watershed)
Abstract
:Forecasting the industrial water demand accurately is crucial for sustainable water resource management. This study investigates industrial water demand forecasting by case-based reasoning (CBR) in an arid area, with a case study of Zhangye, China. We constructed a case base with 420 original cases of 28 cities in China, extracted six attributes of the industrial water demand, and employed a back propagation neural network (BPN) to weight each attribute, as well as the grey incidence analysis (GIA) to calculate the similarities between target case and original cases. The forecasting values were calculated by weighted similarities. The results show that the industrial water demand of Zhangye in 2030, which is the t arget case, will reach 11.9 million tons. There are 10 original cases which have relatively high similarities to the target case. Furthermore, the case of Yinchuan, 2010, has the largest similarity, followed by Yinchuan, 2009, and Urumqi, 2009. We also made a comparison experiment in which case-based reasoning is more accurate than the grey forecast model and BPN in water demand forecasting. It is expected that the results of this study will provide references to water resources management and planning.
1. Introduction
Water scarcity is becoming increasingly severe in arid and semi-arid regions of the world [1,2,3,4], whereby access is not only limited by water resources availability, but also by resource conservation, environmental friendliness, appropriateness of technologies, economic viability, and social acceptable of development issues [5]. Water resources have become a bottleneck economies all over the world [6]. If there is no further action, more than 40% of countries will face a water resources crisis in 2030; arid regions will bear the brunt [7].
Industry plays a fundamental role in the national economy of China. Over the past decades, it has been proved that the forecasting results by some departments of China are obviously greater than actual water uses [8]. Industrial water demand forecasting is complicated due to various departments and enormous differences in industries, which were unfavourable for analysis and calculation [9]. To forecast the industrial water demand accurately and scientifically is always the key point to water resources planning and management in the current socio-economic development period. Time series methods, such as regression analysis [10], quota method [11], constant rate model [12], principal component analysis [13], etc., calculate and forecast water demand through constructing statistic models of data series. However, the industrial water demand has many affection factors, such as zone, infrastructure, industrial category, production, population, climate, etc., which interact with each other. Past forecasting models cannot completely simulate this non-linear relationship, i.e., there are always large uncertainties in industrial water demand forecasting. To reduce these uncertainties, non-linear theories, such as chaos [14], neural network [15,16,17], marginal analysis [18], scenario simulation [19,20], and multi-model [21,22] have been introduced into water demand forecasting. To a certain extent, these methods have improved the forecasting accuracy; nevertheless, they still have not considered the internal mechanism of industrial water demand variations adequately. Furthermore, regardless of time series methods or non-linear theories, they were driven by historic regulation of water demands. However, the trend of the industrial water demand is not fixed in time. With the variation of natural resources and the environment, and the adjustment of industrial policies, the simulation results of past methods did not always agree with the facts. For different periods of economic development, the evolving regulars of industrial water consumption are different. It is hard to define particular models or restrained regulations to reflect the relationship between the industrial water demand and other socio-economic factors.
To process the bottleneck, this study proposed an approach to forecast the industrial water demand by case-based reasoning (CBR). CBR is an object-oriented method [23,24,25] of comprehensive analysis, and is affiliated with artificial intelligence [26]. The most obvious feature of CBR is that it does not need to define unambiguous rules, but uses the underlying expression of cases, which would reduce the model construction time, and effectively solve the problems of fuzziness and uncertainty when acquiring knowledge. CBR can use historic data and choose appropriate cases to analyze and forecast accurately, without a clear internal mechanism of objects development [27]. CBR is advantageous in simplifying knowledge acquisition, improving efficiency and quality of problem-solving, and accumulating knowledge [27,28,29], and is widely applied in fields that have abundant experiences but weak theory models, such as fault diagnosis [30,31], business administration [32,33,34], medical application [35,36,37], emergency management [38,39], land use development [40,41] etc. In the long-term forecasting of the industrial water demand, the training samples and target object are at different development stages; they may present uncertainties of internal resources use level, technical transformation process and institutional evolution. Therefore, methods constructed by paradigms may have difficulties to meet the demand of uncertain planning. Instead, CBR can avoid uncertainties and regulations of complex forecasts without a linear hypothesis [27].
To forecast the industrial water demand of Zhangye City in 2030, the approach was divided into three parts: First, we constructed an industrial water demand case base, which contains 420 original cases of 28 cities in China from 2000 to 2014. Secondly, six attributes were extracted as case attributes and weighted by back propagation neural network (BPN). Finally, we applied grey incidence analysis to calculate the similarities between the target case and original cases, and used the similarity weighted method to forecast the industrial water demand of the target case.
2. Study Area and Data Sources
2.1. Study Area
Zhangye city is the largest economic zone and the largest water consumption area of the Heihe River Basin and is also a critical hub of “the Silk Road Economic Belt and the 21st-Century Maritime Silk Road” (B&R) (Figure 1). The city covers 40,874 km2 containing six counties. Zhangye is a typical arid area with a continental climate. From the perspective of added value in 2016, the dominant industries of Zhangye are mining, manufacturing and electricity, gas, water production and supply.
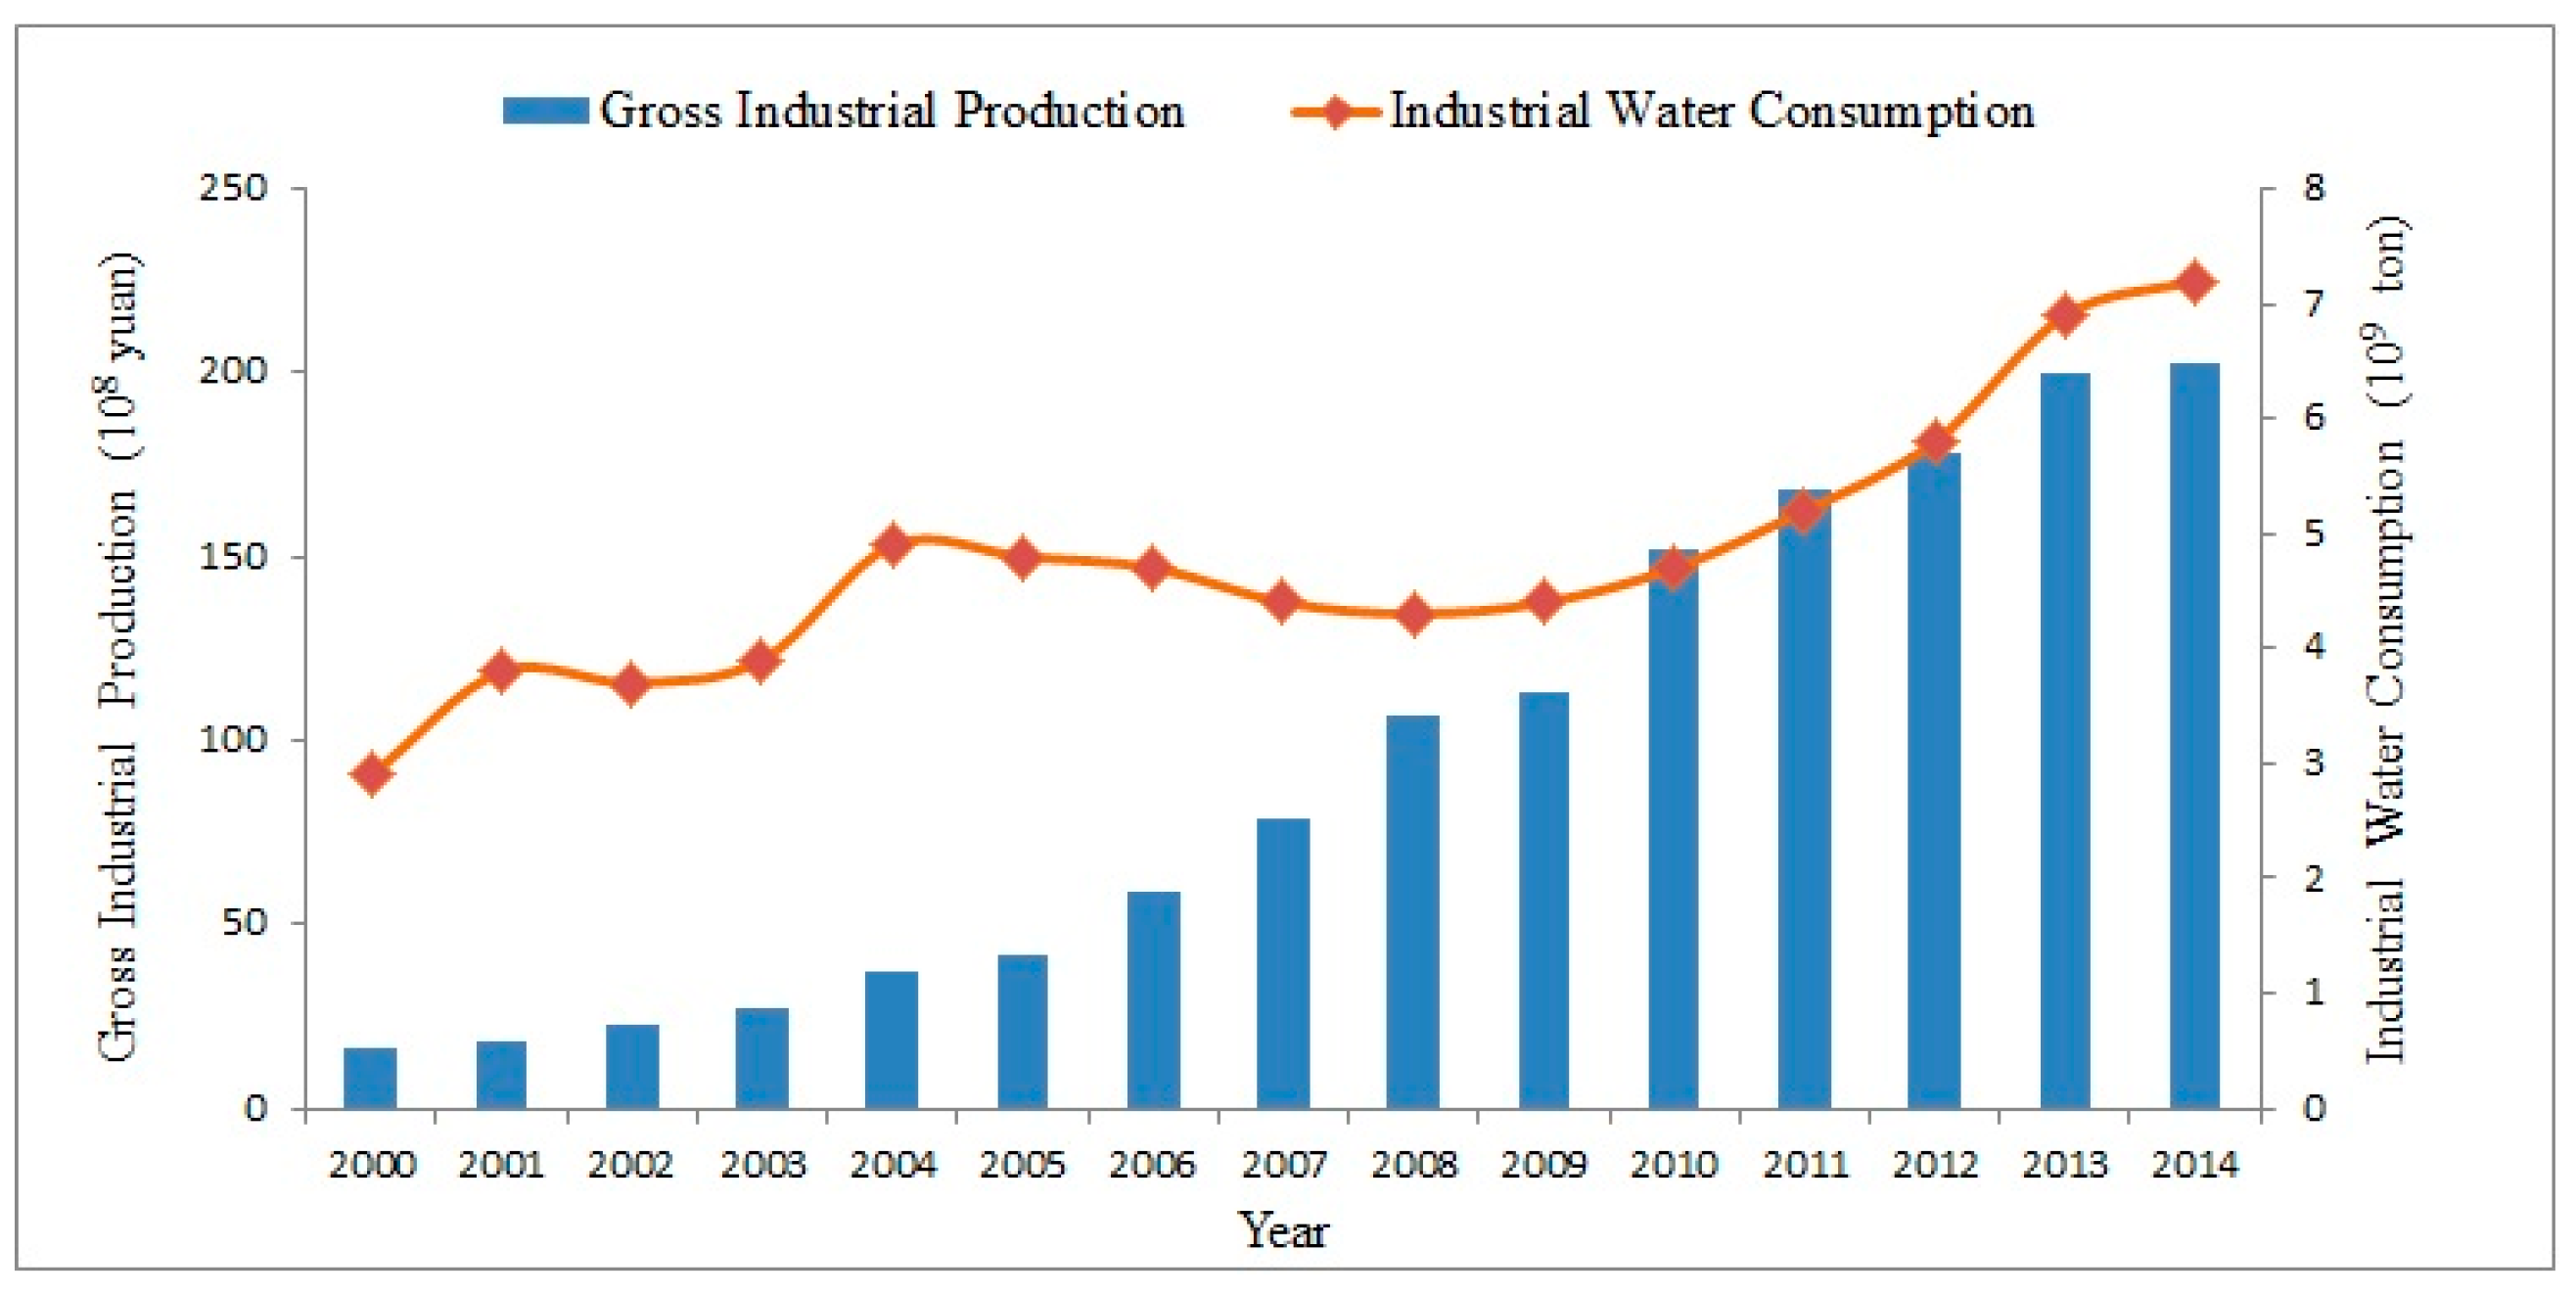
In the future, industry will continue to play an important role in Zhangye’s economy. Figure 2 shows the trend of industrial water consumption and industrial added value in Zhangye from 2000 to 2014. In general, the trend of industrial water consumption can be considered as fluctuating growth. In the current period of industrial transportation, the industrial water consumption may be greatly affected by the breaking of the water balance in Zhangye City. Therefore, it is necessary to forecast the industrial water demand scientifically and accurately in the context of excessive use of the region’s water resources due to rapid economic growth and increasing population pressure, and the result will provide a reference for water management in Zhangye city, even in Heihe River basin.
2.2. Data Sources
The data of industrial population, per capita GDP, gross industrial production, industrial fixed assets investment and industrial electricity consumption from 2000 to 2014 were obtained from the Statistical Yearbook of each city (2001–2015). The data of industrial water consumption and gross amount of water resources from 2000 to 2014 were obtained from the Water Resources Bulletin of each city (2001–2015).
3. Methodology
3.1. CBR Forecasting Framework
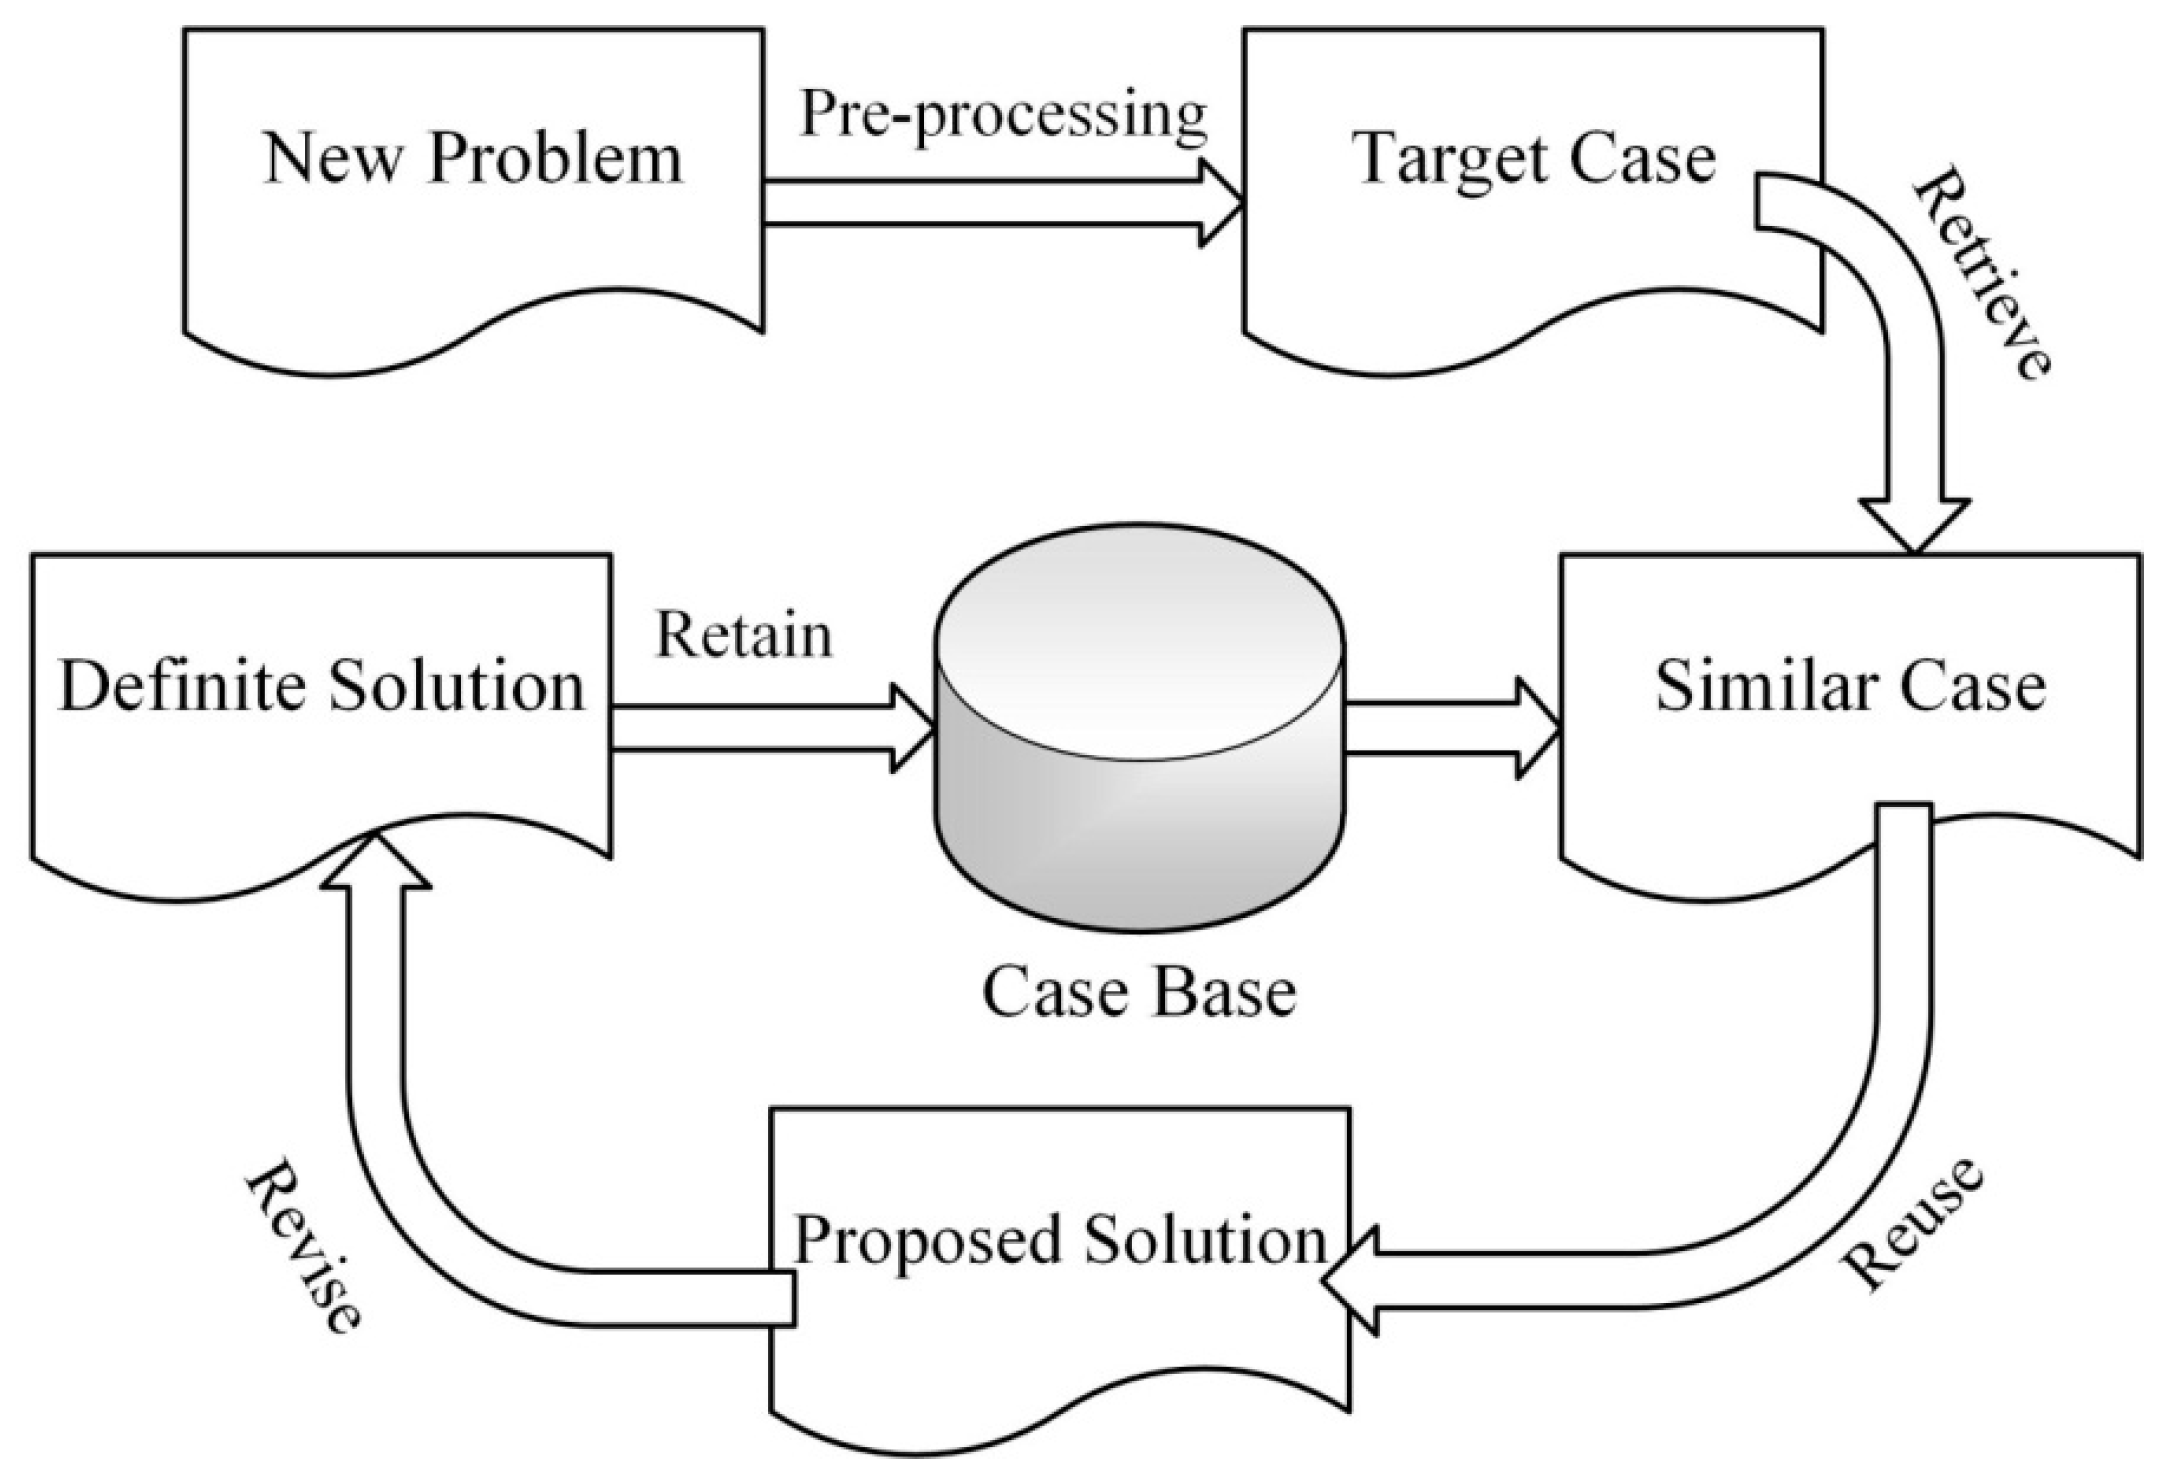
Case-based reasoning is a methodology that uses previous cases to solve new problems [42]. The basic assumptions of CBR are that similar problems have similar solutions [29]. The paradigm of CBR processing problems is inspired by the human decision-making process [43]. It collects a set of cases, which are original cases, to form a case base. Each original case has a problem and a solution. When a new problem appears, CBR can retrieve the most similar original case from the case base according to the conditions, and apply its solution to the new problem through analysis and modification. As a new original case, the solved target case and its solution will be kept to renew the case base. Therefore, the CBR problem-solving architecture, as shown in Figure 3, typically consists of four components: Retrieve, Reuse, Revise and Retain—commonly referred to as “4Rs” [44]. CBR has the merits that it is easy to obtain knowledge, simple to express it and fast to reason it, especially in the fields of fault diagnosis and decision support which have abundant experiential knowledge but lack strong theoretical models and a complete domain knowledge system [27,28,29].
This paper used the core theory of CBR to forecast the industrial water demand in Zhangye City. Specifically, the technique flow (Figure 4) of this paper contains four steps: Step 1 constructed the case base by integrating the data of industrial water consumptions and its attributes of 28 cities evenly distributed over China. Step 2 computed the weights of each influential factor by the BPN. Step 3 calculated the similarities between the target case and original cases by Grey Incidence Analysis. Step 4 screened out the cases with low similarities and kept the higher ones, then forecasted the industrial water demand by weighted similarity.
3.2. Extraction of Case Attributes
The attributes of industrial water can be categorized into environmental factors, economic factors and social factors. Although environmental factors are critical to the industrial development of a city, they are also relatively stable and will not have a noticeable impact on urban industry in the short term. However, socio-economic factors, such as rapid economic development, population growth, industrialization level and technological change, play a decisive role in urban industry. Accordingly, combining with previous studies and availability of data, we chose per capita GDP to characterize the regional economic development; industrial population and industrial electricity to characterize the industrial scale; industrial production and industrial fixed assets investment to characterize the regional industrial level; and gross amount of water resources to characterize the constraint of regional natural environment. Hence, the above six indexes were selected as the attributes of the industrial water demand in this paper. Due to the different impacts of each factor on the industrial water demand, it is important to scientifically and reasonably estimate the weights of each factor which may affect the forecasting accuracy. Therefore, it may lead to a large error if the weights are inadequate.
3.3. Attributes Weighting Based on the Back Propagation Neural Network (BPN)
Subjective weighting methods, such as the analytic hierarchy process (AHP) and the Delphi Method, may bring weights instability and one-sidedness. However, the method of the BPN can self-adapt the weights according to the impacts of each influential factor on the industrial water demand [45].
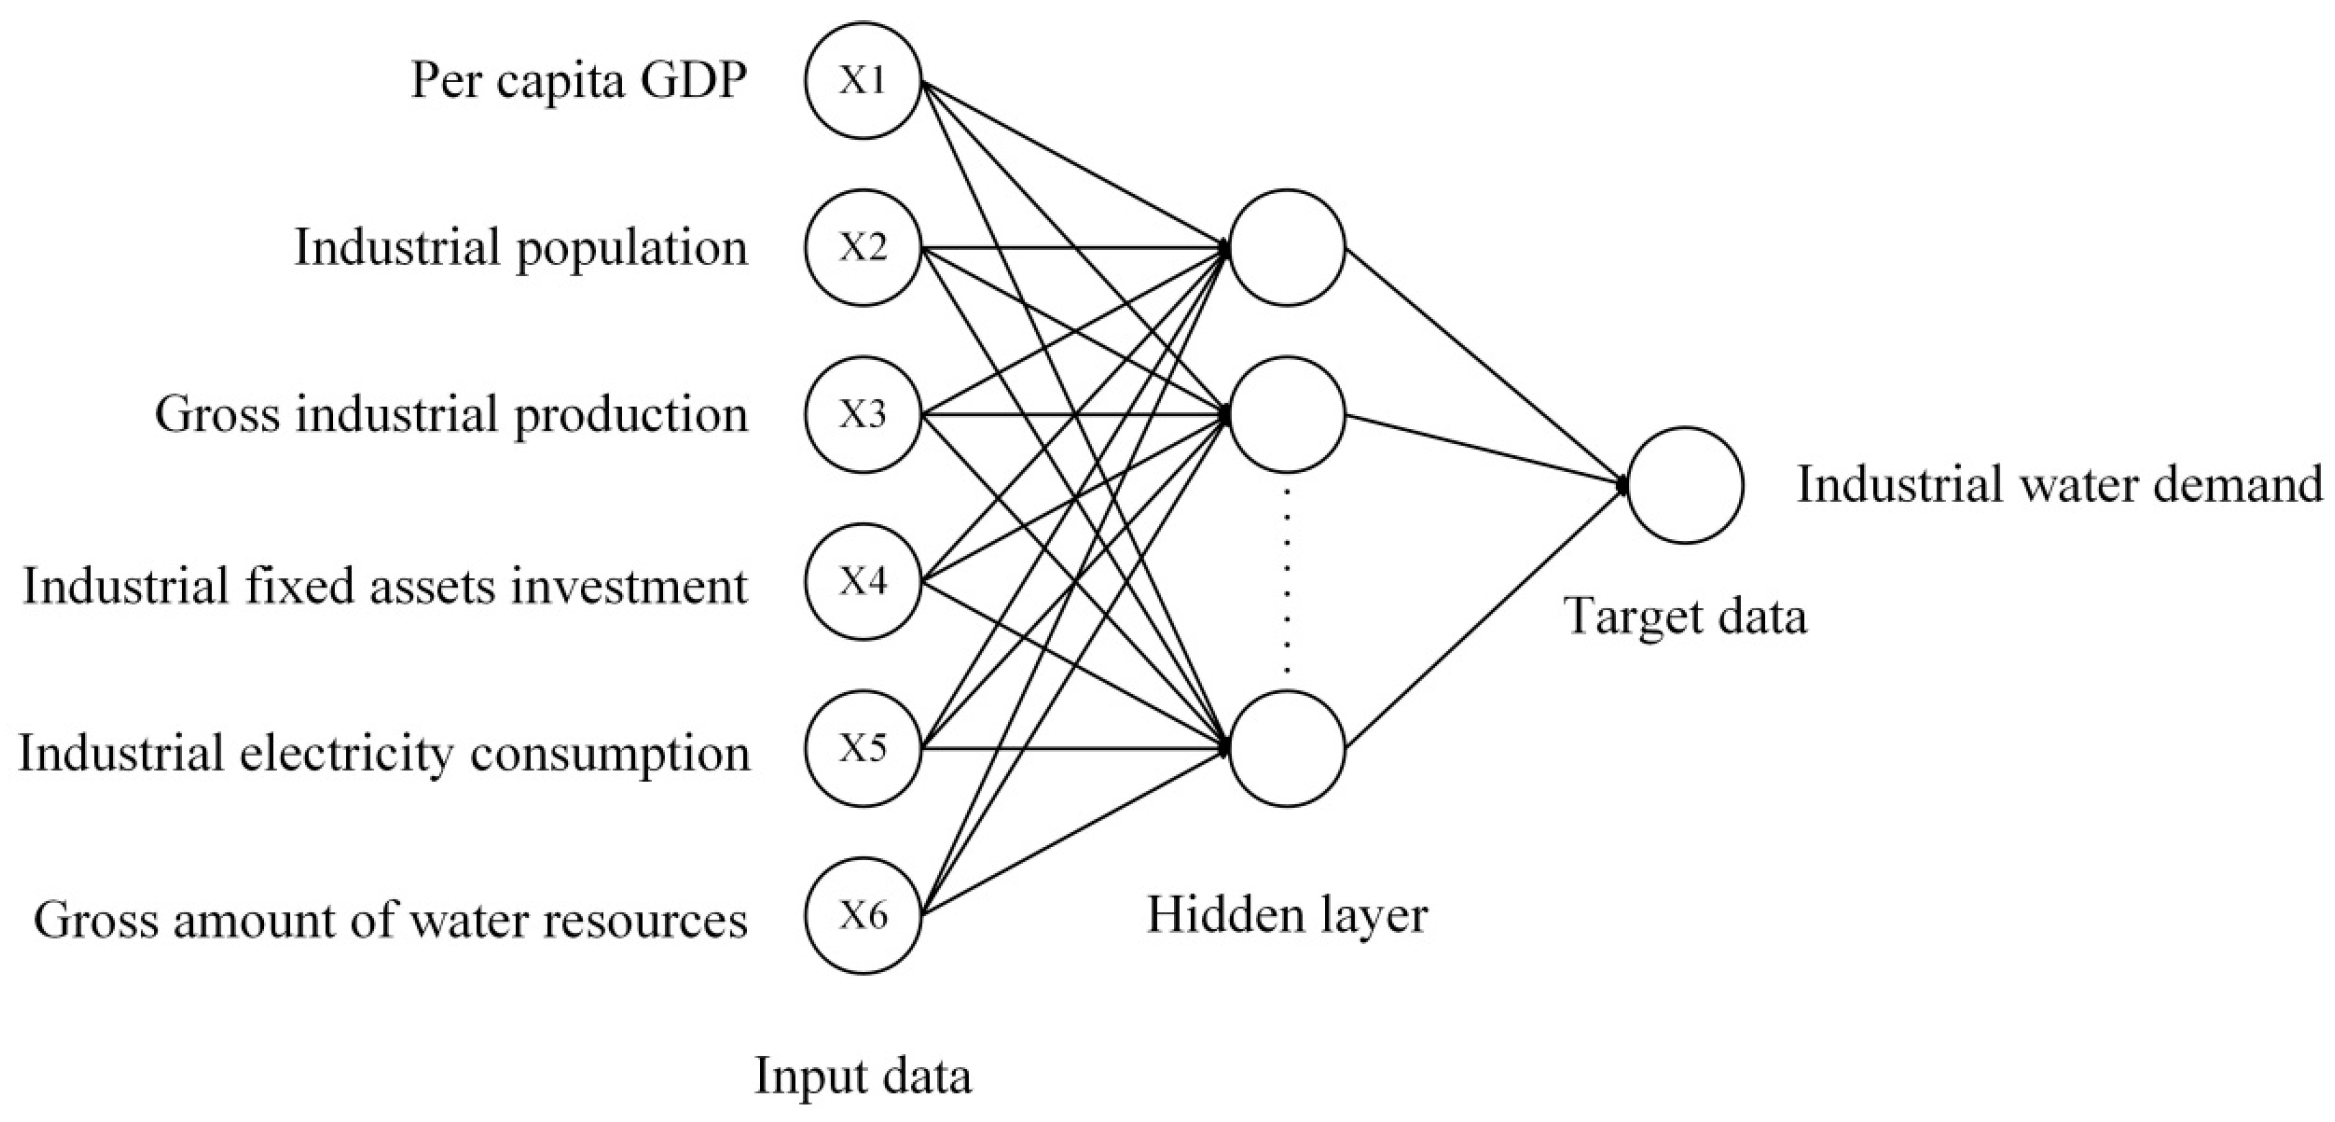
The BPN is one of the most widely used artificial neural networks (ANN) in learning methods of the feed-forward neural network [46]. It has the abilities of self-learning and self-adapting. The BPN has been widely applied in many fields, such as pattern recognition, expert system, prediction and signal processing, etc. In the classical structure of the BPN, the outputs of each layer are sent directly to each neuron of the next layer. A three-layered BPN contains an input layer that receives and distributes inputs, a middle (or hidden) layer that captures the nonlinear relationships of inputs and outputs, and an output layer that produces calculated data. When the weights are trained, if the outputs of the network are not equal to the expected outputs, the network will send the errors back to the input layer and the middle layer and retrain to control the errors at a very low level. After the training, the weights can be obtained according to the weight matrix throughout the network. In this study, we used 364 cases of 28 cities during 2000–2012 in which case attributes were used as input data, and observed industrial water consumptions were used as target data (Figure 5). The training algorithm for the BPN was Traingdm. The coefficients of the hidden layer, which were the weights of each attribute, were calculated after self-learning.
3.4. Similarities Calculation Based on Grey Incidence Analysis
Whether it can retrieve reasonable cases, thus obtaining the optimized solution, is key to the success of a CBR model. The selection of similar cases in this paper applied grey incidence analysis (GIA) by calculating the similarities between the target case and original cases. In comparison with other methods, GIA had a better applicability in this research, and could also compute the degrees of correlation accurately.
Assuming the case set has n cases, namely the original case set C = {C1, C2, …, Cn}; each case has m attributes, namely the factor set of the original case F = {fi1, fi2, …, fim}, i = 1, 2, …, n; the target case set T = {T1, T2, …, Tq} and the factor set of target case A = {ap1, ap2, …, apm}, p = 1, 2, …, q. Thus, the n dimensional weighted grey similarity (G(Tp,Ci)) between target case (Tp) and each original case (Ci) can be expressed as:
where ωj is the weight of the jth influential factor; ρ(ap(j),fi) represents the similarity of the jth factor between the target case and the original case; λ is discrimination coefficient values 0.5 by experience.
After calculating the similarities between the target case and each original case, combining with the threshold (σ), whether the target case is similar to each original case could be judged. The threshold was determined by expert experience, and was constantly adjusted in the process of selection. Specifically, when G(ap,Ci) ≥ σ, namely the target case is similar to the original case, and both of them have a similar socio-economic development level and almost the same industrial water demand. Therefore, it can forecast the industrial water demand of the target case by analyzing the industrial water consumption of similar original case/cases. Conversely, when G(ap,Ci) < σ, there are few similarities of socio-economic situations and the industrial water demand between the target case and original case.
3.5. Industrial Water Demand Forecasting
The retrieval process was not to choose one case which has the largest similarity, but a case set inside which the similarities of every case were all above the threshold. Then, the industrial water demand of the target case could be obtained by analyzing the features and industrial water consumptions of similar original cases. At present, stepwise regression analysis, the optimized case method and the weighted similarity method are the widely applied approaches to forecast the target case. Due to the relatively lower error, this paper used the weighted similarity method to forecast the industrial water demand.
where Rp is the forecasting result of the pth target case; Sj is the industrial water consumption of the jth original case.
4. Results
4.1. Validation of the CBR Model
The validation process used the data between 2000 and 2012 to forecast the industrial water demand of the years 2013 and 2014 in Zhangye City. The case set contained 364 cases by using the statistics of 28 cities in China from 2000 to 2012. Table 1 shows the weighting result of each influential factor which were calculated by the BPN.
From the above table, industrial population had the highest weight among the six features. In contrast, gross industrial production was the lowest. Then, grey incidence analysis was used to calculate the similarities between the target case and each original case. With the modified threshold σ (=0.95), the number of similar cases according to the target cases of Zhangye City in the years 2013 and 2014 were screened by 16 and 14, respectively.
Further, these screened cases were applied to forecast the target cases by grey incidence analysis. This paper used the relative error to test the accuracy of the CBR model. The smaller the error was, the higher the accuracy would be. Table 2 gives the forecasting results in comparison with the observed value in 2013 and 2014.
The forecasting results of the industrial water demand in Zhangye City were 65 million tons in 2013 and 73 million tons in 2014. Comparably, the observed values were 69 and 72 million tons, respectively. Thus, the relative errors were −5.80% in 2013 and 1.39% in 2014. Apart from the comparison of different years, this paper also compared different methods of forecasting to make sure CBR was more suitable for industrial water demand forecasting. Table 3 illustrates the different forecast results of the Grey Model (GM(1, 1)), BPN and CBR in Zhangye City for the year 2013.
From the above table, the forecast results of the industrial water demand were 81 million tons of GM(1, 1) and 55 million tons of BPN, respectively. Accordingly, the relative errors were 17.39% and −20.29%, respectively. By contrast, the forecast result of CBR had relatively high accuracy, which suggested that the forecasting result of CBR was fully justified by real conditions of industrial water consumptions in Zhangye City.
4.2. Forecasting of the Target Case
After the above analysis, CBR can be applied to forecast the industrial water demand of Zhangye City in 2030. In light of the validation process, the casebase extended to 420 cases of 28 cities from 2000 to 2014. Firstly, we used the autoregressive integrated moving average model (ARIMA (q, d, p)) to predict the attributes’ values of Zhangye City in 2030 (Table 1). Secondly, we calculated the similarities between the target case in 2030 and each original case (Appendix A). When the threshold σ = 0.95, the number of original cases similar to the target case was 10 (Table 4). Finally, we applied the weighted similarity method to forecast the industrial water demand of Zhangye City in 2030, which was 11.9 million tons.
5. Discussion
In this study, industrial water demand forecasting by CBR is more accurate in comparison with GM(1, 1) and the BPN. However, the case base construction in this paper just considered the socio-economic factors, but lacked environmental factors. The incompleteness of case attributes may restrain accuracy improvement. In order to construct a case base that is as comprehensive as possible, we collected original cases with a wide coverage. Not only the industrially developed cities such as Beijing, Shanghai, and Guangzhou, but also the relatively backward ones were collected as original cases.
The BPN was applied to weight case attributes, which has been proved to be feasible. However, the BPN also has some disadvantages, such as a poor rate of convergence, and easily getting stuck in the local minimum. Furthermore, as the BPN is based on the gradient information of the error function, when the problems are complex or the gradient information is hard to obtain, BPN may be helpless. To overcome the disadvantages, many optimization algorithms have been introduced in the study and design of neural networks such as constructing a neural network based on the particle swarm optimization algorithm [47], and using evolutionary algorithms to optimize the neural networks [48,49,50], which have been proved feasible and effective.
To validate that the CBR has a relatively high accuracy in industrial water demand forecasting, a control experiment was implemented by GM (1, 1) and the BPN. The accuracy of GM (1, 1) is lower than that of the CBR, and is suitable for short-term period forecasting. The forecasting of the BPN needs more consistent internal regulations of training samples. However, each city has a distinctive driving mechanism of development mode and industrial water consumption, which makes it difficult to train the network simulation. Therefore, CBR is more appropriate for industrial water demand forecasting.
6. Conclusions
This study used case-based reasoning to forecast the industrial water demand in Zhangye City. We extracted six attributes of the industrial water demand as features of the case and constructed a case base containing 420 cases. The BPN was employed to calculate the weights of features. We also selected grey incidence analysis to compute the similarities between the target case and original cases. After constantly adjusting the threshold, the cases with relatively high similarities were screened to forecast the industrial water demand. Our main conclusions are as follows.
(1) The effectiveness, workability and accuracy of CBR in the process of forecasting the industrial water demand have been validated by both longitudinal and crosswise comparisons. The forecasting accuracies reached −5.80% and 1.39% respectively in 2013 and 2014 by using CBR. Moreover, when forecasting the industrial water demand of Zhangye in 2013, accuracies of only −17.39% and 20.29% were obtained for the Grey Model and BPN, respectively. Therefore, CBR showed better adaptation in forecasting the industrial water demand of Zhangye in 2030.
(2) In the validation process, 13 and 11 similar original cases were screened for the target case in 2013 and 2014 respectively. Accordingly, the forecasted industrial water demands of Zhangye were 65 and 73 million tons in 2013 and 2014, respectively. In light of the validation results, the forecasting value of the industrial water demand in Zhangye in 2030 was 11.9 million tons, with 10 similar original cases.
The development of the industrial water demand has characteristics of uncertainty and fluctuation. This study proposed a CBR method to forecast the industrial water demand, which proved to provide relatively high accuracy. With the implementation of strict water resource management policies in China, the government departments are responsible for water management by scientifically planning the industrial water demand and use, which is crucial for guiding water consumption control in Zhangye as well as in other cities in China and other developing countries. Therefore, the results of this paper provide a reference for water resources management and planning, for the consideration of decision-makers.
Acknowledgments
This study was supported by the National Natural Science Foundation of China (No. 91325302, 41371113, 41101098), and Fundamental Research Funds for the Central Universities of China (No. 2662017PY063). The authors would like to thank Shaohua Hu, Kunpeng Pu, Hongyan Li, Bingying Wen from Huazhong Agricultural University for their contributions on data-gathering and calculation.
Author Contributions
Bohan Yang, Weiwei Zheng and Xinli Ke designed research; Bohan Yang performed research; Bohan Yang and Weiwei Zheng analyzed data; Bohan Yang and Xinli Ke wrote the paper.
Conflicts of Interest
The authors declare no conflict of interest.
Appendix A

Table A1.
Similarities between Original Cases and the Target Case (Industrial Water Demand of Zhangye City in 2030).
Table A1.
Similarities between Original Cases and the Target Case (Industrial Water Demand of Zhangye City in 2030).
| Cities | 2000 | 2001 | 2002 | 2003 | 2004 | 2005 | 2006 | 2007 | 2008 | 2009 | 2010 | 2011 | 2012 | 2013 | 2014 |
|---|---|---|---|---|---|---|---|---|---|---|---|---|---|---|---|
| Hefei | 0.9057 | 0.9109 | 0.9070 | 0.9072 | 0.9052 | 0.9090 | 0.9209 | 0.9066 | 0.9093 | 0.9100 | 0.8582 | 0.8371 | 0.8042 | 0.7794 | 0.7104 |
| Guangzhou | 0.7721 | 0.7963 | 0.7949 | 0.7248 | 0.7150 | 0.7122 | 0.7547 | 0.7502 | 0.7167 | 0.6338 | 0.6845 | 0.6931 | 0.6740 | 0.6559 | 0.6122 |
| Fuzhou | 0.8711 | 0.8686 | 0.8691 | 0.8820 | 0.8508 | 0.8371 | 0.8404 | 0.8117 | 0.7913 | 0.8182 | 0.8044 | 0.7972 | 0.7769 | 0.7473 | 0.7062 |
| Guiyang | 0.8908 | 0.8854 | 0.8834 | 0.8910 | 0.8991 | 0.8825 | 0.8933 | 0.8898 | 0.8743 | 0.8940 | 0.8894 | 0.8877 | 0.9123 | 0.8821 | 0.8821 |
| Xining | 0.9023 | 0.9019 | 0.9020 | 0.9057 | 0.9067 | 0.8956 | 0.8898 | 0.8975 | 0.8954 | 0.9312 | 0.9418 | 0.9512 | 0.9530 | 0.9520 | 0.9376 |
| Yinchuan | 0.9047 | 0.9061 | 0.9073 | 0.9116 | 0.9179 | 0.9227 | 0.9312 | 0.9453 | 0.9560 | 0.9600 | 0.9677 | 0.9401 | 0.9215 | 0.8841 | 0.8748 |
| Qingdao | 0.8367 | 0.8397 | 0.8275 | 0.8247 | 0.8081 | 0.7875 | 0.7927 | 0.7838 | 0.7461 | 0.7221 | 0.6951 | 0.6694 | 0.6378 | 0.6105 | 0.6053 |
| Suzhou | 0.8239 | 0.8235 | 0.8103 | 0.7577 | 0.7258 | 0.6989 | 0.6631 | 0.6332 | 0.6132 | 0.5992 | 0.5531 | 0.5405 | 0.5212 | 0.5030 | 0.5058 |
| Kunming | 0.8654 | 0.8675 | 0.8672 | 0.8730 | 0.8762 | 0.8589 | 0.8660 | 0.8587 | 0.8630 | 0.8709 | 0.8697 | 0.8746 | 0.8669 | 0.8506 | 0.8471 |
| Shenyang | 0.8752 | 0.8844 | 0.8923 | 0.8989 | 0.8970 | 0.8842 | 0.8769 | 0.8804 | 0.8526 | 0.8249 | 0.7979 | 0.7802 | 0.7558 | 0.7454 | 0.7380 |
| Changchun | 0.8943 | 0.8979 | 0.9077 | 0.9154 | 0.9186 | 0.9141 | 0.9047 | 0.8942 | 0.8927 | 0.8842 | 0.8700 | 0.8594 | 0.8346 | 0.8123 | 0.7866 |
| Urumqi | 0.9106 | 0.9119 | 0.9153 | 0.9193 | 0.9234 | 0.9279 | 0.9330 | 0.9384 | 0.9523 | 0.9585 | 0.9566 | 0.9268 | 0.8957 | 0.8923 | 0.8802 |
| Chongqing | 0.7586 | 0.7605 | 0.7406 | 0.7352 | 0.7229 | 0.7130 | 0.7086 | 0.6593 | 0.6400 | 0.6316 | 0.6110 | 0.6114 | 0.6183 | 0.6053 | 0.5642 |
| Tianjin | 0.8076 | 0.8063 | 0.8035 | 0.8021 | 0.8016 | 0.8057 | 0.8005 | 0.7612 | 0.7126 | 0.6760 | 0.6274 | 0.5952 | 0.5849 | 0.5554 | 0.5399 |
| Zhengzhou | 0.8300 | 0.8241 | 0.8165 | 0.8216 | 0.8252 | 0.8296 | 0.8223 | 0.8034 | 0.8022 | 0.7851 | 0.7600 | 0.7297 | 0.7395 | 0.7256 | 0.7125 |
| Chengdu | 0.8349 | 0.8283 | 0.8224 | 0.8158 | 0.8073 | 0.7968 | 0.7981 | 0.7740 | 0.7570 | 0.7742 | 0.7424 | 0.7022 | 0.6598 | 0.6475 | 0.6617 |
| Dalian | 0.8859 | 0.8779 | 0.8917 | 0.9040 | 0.9200 | 0.9081 | 0.9050 | 0.8817 | 0.8386 | 0.8042 | 0.7790 | 0.7715 | 0.7331 | 0.7254 | 0.7127 |
| Shanghai | 0.7132 | 0.7093 | 0.7135 | 0.7128 | 0.7025 | 0.6817 | 0.6606 | 0.6315 | 0.6087 | 0.6054 | 0.5858 | 0.5721 | 0.5665 | 0.5550 | 0.5521 |
| Wuhan | 0.8295 | 0.8314 | 0.8371 | 0.8259 | 0.8386 | 0.8406 | 0.8350 | 0.8345 | 0.8134 | 0.7899 | 0.7408 | 0.7123 | 0.6725 | 0.6430 | 0.6239 |
| Beijing | 0.8001 | 0.8008 | 0.8025 | 0.8049 | 0.8078 | 0.7887 | 0.7715 | 0.7408 | 0.7489 | 0.7372 | 0.7108 | 0.6855 | 0.6833 | 0.6698 | 0.6639 |
| Changsha | 0.8558 | 0.8552 | 0.8557 | 0.8576 | 0.8568 | 0.8624 | 0.8693 | 0.8728 | 0.8700 | 0.8343 | 0.7890 | 0.7686 | 0.7187 | 0.6982 | 0.6872 |
| Nanchang | 0.8558 | 0.8643 | 0.8593 | 0.8647 | 0.8779 | 0.8747 | 0.8850 | 0.8934 | 0.8922 | 0.8848 | 0.8597 | 0.8391 | 0.7886 | 0.7707 | 0.7528 |
| Nanjing | 0.8688 | 0.8637 | 0.8640 | 0.8665 | 0.8700 | 0.8643 | 0.8604 | 0.7396 | 0.8040 | 0.7861 | 0.7461 | 0.7134 | 0.6813 | 0.6642 | 0.6656 |
| Jinan | 0.8462 | 0.8490 | 0.8519 | 0.8606 | 0.8629 | 0.8607 | 0.8642 | 0.8654 | 0.8455 | 0.8277 | 0.8023 | 0.7949 | 0.7831 | 0.7598 | 0.7495 |
| Wuxi | 0.8582 | 0.8564 | 0.8551 | 0.8329 | 0.7904 | 0.7708 | 0.7421 | 0.7212 | 0.6861 | 0.6729 | 0.6403 | 0.6264 | 0.6091 | 0.5997 | 0.5959 |
| Shijiazhuang | 0.8810 | 0.8847 | 0.8851 | 0.8827 | 0.8835 | 0.8659 | 0.8605 | 0.8517 | 0.8495 | 0.8434 | 0.8353 | 0.8341 | 0.8204 | 0.8002 | 0.7826 |
| Xi’an | 0.8899 | 0.8928 | 0.8907 | 0.8911 | 0.8922 | 0.8962 | 0.8990 | 0.8950 | 0.8930 | 0.8975 | 0.9022 | 0.9091 | 0.8821 | 0.8605 | 0.8553 |
| Zhangye | 0.9061 | 0.9082 | 0.9100 | 0.9087 | 0.9090 | 0.9136 | 0.9157 | 0.9179 | 0.9192 | 0.9236 | 0.9293 | 0.9347 | 0.9447 | 0.9465 | 0.9525 |
References
- Rijsberman, F.R. Water scarcity: Fact or fiction? Agric. Water Manag. 2006, 80, 5–22. [Google Scholar] [CrossRef]
- Deng, X.; Zhao, C. Identification of water scarcity and providing solutions for adapting to climate changes in the Heihe River Basin of China. Adv. Meteorol. 2015, 2015. [Google Scholar] [CrossRef]
- Mekonnen, M.M.; Hoekstra, A.Y. Four billion people facing severe water scarcity. Sci. Adv. 2016, 2, e1500323. [Google Scholar] [CrossRef] [PubMed]
- Katz, D. Water use and economic growth: Reconsidering the Environmental Kuznets Curve relationship. J. Clean. Prod. 2015, 88, 205–213. [Google Scholar] [CrossRef]
- Johannsen, I.M.; Hengst, J.C.; Goll, A.; Höllermann, B.; Diekkrüger, B. Future of Water Supply and Demand in the Middle Drâa Valley, Morocco, under Climate and Land Use Change. Water 2016, 8, 313. [Google Scholar] [CrossRef]
- Nian, Y.; Li, X.; Zhou, J.; Hu, X. Impact of land use change on water resource allocation in the middle reaches of the Heihe River Basin in northwestern China. J. Arid Land 2014, 6, 273–286. [Google Scholar] [CrossRef]
- Connor, R. The United Nations World Water Development Report 2015: Water for a Sustainable World; UNESCO Publishing: Paris, France, 2015. [Google Scholar]
- Bai, M.; Zhou, S.; Zhao, M.; Yu, J. Water use efficiency improvement against a backdrop of expanding city agglomeration in developing countries—A case study on industrial and agricultural water use in the Bohai Bay region of China. Water 2017, 9, 89. [Google Scholar] [CrossRef]
- Deng, X.; Zhang, F.; Wang, Z.; Li, X.; Zhang, T. An Extended Input Output Table Compiled for Analyzing Water Demand and Consumption at County Level in China. Sustainability 2014, 6, 3301–3320. [Google Scholar] [CrossRef]
- Adamowski, J.; Karapataki, C. Comparison of multivariate regression and artificial neural networks for peak urban water-demand forecasting: Evaluation of different ANN learning algorithms. J. Hydrol. Eng. 2010, 15, 729–743. [Google Scholar] [CrossRef]
- Zhai, Y.; Wang, J.; Teng, Y.; Zuo, R. Water demand forecasting of Beijing using the time series forecasting method. J. Geogr. Sci. 2012, 22, 919–932. [Google Scholar] [CrossRef]
- Mohamed, M.M.; Almualla, A.A. Water demand forecasting in Umm Al-Quwain (UAE) using the the IWR-MAIN specify forecasting mode. Water Resour. Manag. 2010, 24, 4093–4120. [Google Scholar] [CrossRef]
- Haque, M.M.; Rahman, A.; Hagare, D.; Kibria, G. Principal component regression analysis in water demand forecasting: An application to the blue mountains, NSW, Australia. J. Hydrol. Environ. Res. 2016, 1, 49–59. [Google Scholar]
- Jain, A.; Varshney, A.K.; Joshi, U.C. Short-term water demand forecast modelling at IIT Kanpur using artificial neural networks. Water Resour. Manag. 2001, 15, 299–321. [Google Scholar] [CrossRef]
- Liu, J.; Savenije, H.H.; Xu, J. Forecast of water demand in Weinan City in China using WDF-ANN model. Phys. Chem. Earth Parts A/B/B 2003, 28, 219–224. [Google Scholar] [CrossRef]
- Bai, Y.; Wang, P.; Li, C.; Xie, J.; Wang, Y. A multi-scale relevance vector regression approach for daily urban water demand forecasting. J. Hydrol. 2014, 517, 236–245. [Google Scholar] [CrossRef]
- Adamowski, J.F. Peak daily water demand forecast modeling using artificial neural networks. J. Water Resour. Plan. Manag. 2008, 134, 119–128. [Google Scholar] [CrossRef]
- Zhang, Q.; Diao, Y.; Dong, J. Regional water demand prediction and analysis based on Cobb-Douglas model. Water Resour. Manag. 2013, 27, 3103–3113. [Google Scholar] [CrossRef]
- Weatherhead, E.K.; Knox, J.W. Predicting and mapping the future demand for irrigation water in England and Wales. Agric. Water Manag. 2000, 43, 203–218. [Google Scholar] [CrossRef]
- Gato, S.; Jayasuriya, N.; Roberts, P. Temperature and rainfall thresholds for base use urban water demand modelling. J. Hydrol. 2007, 337, 364–376. [Google Scholar] [CrossRef]
- Mo, X.; Liu, S.; Lin, Z.; Xu, Y.; Xiang, Y.; Mcvicar, T.R. Prediction of crop yield, water consumption and water use efficiency with a SVAT-crop growth model using remotely sensed data on the north China plain. Ecol. Model. 2005, 183, 301–322. [Google Scholar] [CrossRef]
- Pulido-Calvo, I.; Montesinos, P.; Roldán, J.; Ruiznavarro, F. Linear regressions and neural approaches to water demand forecasting in irrigation districts with telemetry systems. Biosyst. Eng. 2007, 97, 283–293. [Google Scholar] [CrossRef]
- Bello-Tomás, J.J.; González-Calero, P.A.; Díaz-Agudo, B. Jcolibri: An object-oriented framework for building CBR systems. In Advances in Case-Based Reasoning, Proceedings of the 7th European Conference on Case-Based Reasoning, Madrid, Spain, 30 August–2 September 2004; Springer: Berlin/Heidelberg, Germany, 2004; pp. 29–39. [Google Scholar]
- Bergmann, R.; Stahl, A. Similarity measures for object-oriented case representations. In Proceedings of the Forth European Workshop on Case-Based Reasoning, Dublin, Ireland, 23–25 September 1998; Springer: Berlin/Heidelberg, Germany; pp. 25–36. [Google Scholar]
- Reyes, E.R.; Negny, S.; Robles, G.C.; Le Lann, J.M. Improvement of online adaptation knowledge acquisition and reuse in case-based reasoning: Application to process engineering design. Eng. Appl. Artif. Intell. 2015, 41, 1–16. [Google Scholar] [CrossRef]
- Shin, K.S.; Han, I. Case-based reasoning supported by genetic algorithms for corporate bond rating. Expert Syst. Appl. 1999, 16, 85–95. [Google Scholar] [CrossRef]
- Kolodner, J. Case-Based Reasoning; Morgan Kaufmann Publishers Inc.: San Meteo, CA, USA, 1993. [Google Scholar]
- Leake, D.B. Problem solving and reasoning: Case-based. Int. Encycl. Soc. Behav. Sci. 2015, 2015, 56–60. [Google Scholar]
- Zhao, K.; Yu, X. A case based reasoning approach on supplier selection in petroleum enterprises. Expert Syst. Appl. 2011, 38, 6839–6847. [Google Scholar] [CrossRef]
- Olsson, E.; Funk, P.; Xiong, N. Fault diagnosis in industry using sensor readings and case-based reasoning. J. Intell. Fuzzy Syst. Appl. Eng. Technol. 2004, 15, 41–46. [Google Scholar]
- Yang, B.S.; Han, T.; Kim, Y.S. Integration of ART-Kohonen neural network and case-based reasoning for intelligent fault diagnosis. Expert Syst. Appl. 2004, 26, 387–395. [Google Scholar] [CrossRef]
- Madhusudan, T.; Zhao, J.L.; Marshall, B. A case-based reasoning framework for workflow model management. Data Knowl. Eng. 2004, 50, 87–115. [Google Scholar] [CrossRef]
- Li, Y.F.; Xie, M.; Goh, T.N. A study of mutual information based feature selection for case based reasoning in software cost estimation. Expert Syst. Appl. 2009, 36, 5921–5931. [Google Scholar] [CrossRef]
- Shin, K.S.; Han, I. A case-based approach using inductive indexing for corporate bond rating. Decis. Support Syst. 2001, 32, 41–52. [Google Scholar] [CrossRef]
- Fan, C.Y.; Chang, P.C.; Lin, J.J.; Hsieh, J.C. A hybrid model combining case-based reasoning and fuzzy decision tree for medical data classification. Appl. Soft Comput. 2011, 11, 632–644. [Google Scholar] [CrossRef]
- Holt, A.; Bichindaritz, I.; Schmidt, R.; Perner, P. Medical applications in case-based reasoning. Knowl. Eng. Rev. 2005, 20, 289–292. [Google Scholar] [CrossRef]
- Huang, M.J.; Chen, M.Y.; Lee, S.C. Integrating data mining with case-based reasoning for chronic diseases prognosis and diagnosis. Expert Syst. Appl. 2007, 32, 856–867. [Google Scholar] [CrossRef]
- Amailef, K.; Lu, J. Ontology-supported case-based reasoning approach for intelligent m-Government emergency response services. Decis. Support Syst. 2013, 55, 79–97. [Google Scholar] [CrossRef]
- Liu, W.; Hu, G.; Li, J. Emergency resources demand prediction using case-based reasoning. Saf. Sci. 2012, 50, 530–534. [Google Scholar] [CrossRef]
- Du, Y.; Wen, W.; Cao, F.; Ji, M. A case-based reasoning approach for land use change prediction. Expert Syst. Appl. 2010, 37, 5745–5750. [Google Scholar] [CrossRef]
- Li, X.; Liu, X. An extended cellular automaton using case-based reasoning for simulating urban development in a large complex region. Int. J. Geogr. Inf. Sci. 2006, 20, 1109–1136. [Google Scholar] [CrossRef]
- Jonassen, D.H.; Hernandez-Serrano, J. Case-based reasoning and instructional design: Using stories to support problem solving. Educ. Technol. Res. Dev. 2002, 50, 65–77. [Google Scholar] [CrossRef]
- Shen, Y.; Colloc, J.; Jacquet-Andrieu, A.; Kai, L. Emerging medical informatics with case-based reasoning for aiding clinical decision in multi-agent system. J. Biomed. Inf. 2015, 56, 307–317. [Google Scholar] [CrossRef] [PubMed]
- De Mantaras, R.L.; McSherry, D.; Bridge, D.; Leake, D.; Smyth, B.; Craw, S.; Keane, M. Retrieval, reuse, revision and retention in case-based reasoning. Knowl. Eng. Rev. 2005, 20, 215–240. [Google Scholar] [CrossRef]
- Ding, S.; Su, C.; Yu, J. An optimizing BP neural network algorithm based on genetic algorithm. Artif. Intell. Rev. 2011, 36, 153–162. [Google Scholar] [CrossRef]
- Guan, Q.; Wang, L.; Clarke, K.C. An artificial-neural-network-based, constrained CA model for simulating urban growth. Cartogr. Geogr. Inf. Sci. 2005, 32, 369–380. [Google Scholar] [CrossRef]
- Chen, G.; Yu, J. Two Sub-swarms Particle Swarm Optimization Algorithm. In Advances in Natural Computation, Procedings of the International Conference on Natural Computation, Changsha, China, 27–29 August 2005; Springer: Berlin/Heidelberg, Germany; pp. 515–524.
- Venkatesan, R.; Kumar, V. A genetic algorithms approach to growth phase forecasting of wireless subscribers. Int. J. Forecast. 2002, 18, 625–646. [Google Scholar] [CrossRef]
- Harpham, C.; Dawson, C.W.; Brown, M.R. A review of genetic algorithms applied to training radial basis function networks. Neural Comput. Appl. 2004, 13, 193–201. [Google Scholar] [CrossRef]
- Salajegheh, E.; Gholizadeh, S. Optimum design of structures by an improved genetic algorithm using neural networks. Adv. Eng. Softw. 2005, 36, 757–767. [Google Scholar] [CrossRef]
Figure 1.
Location of Zhangye City in Heihe River Basin, China.
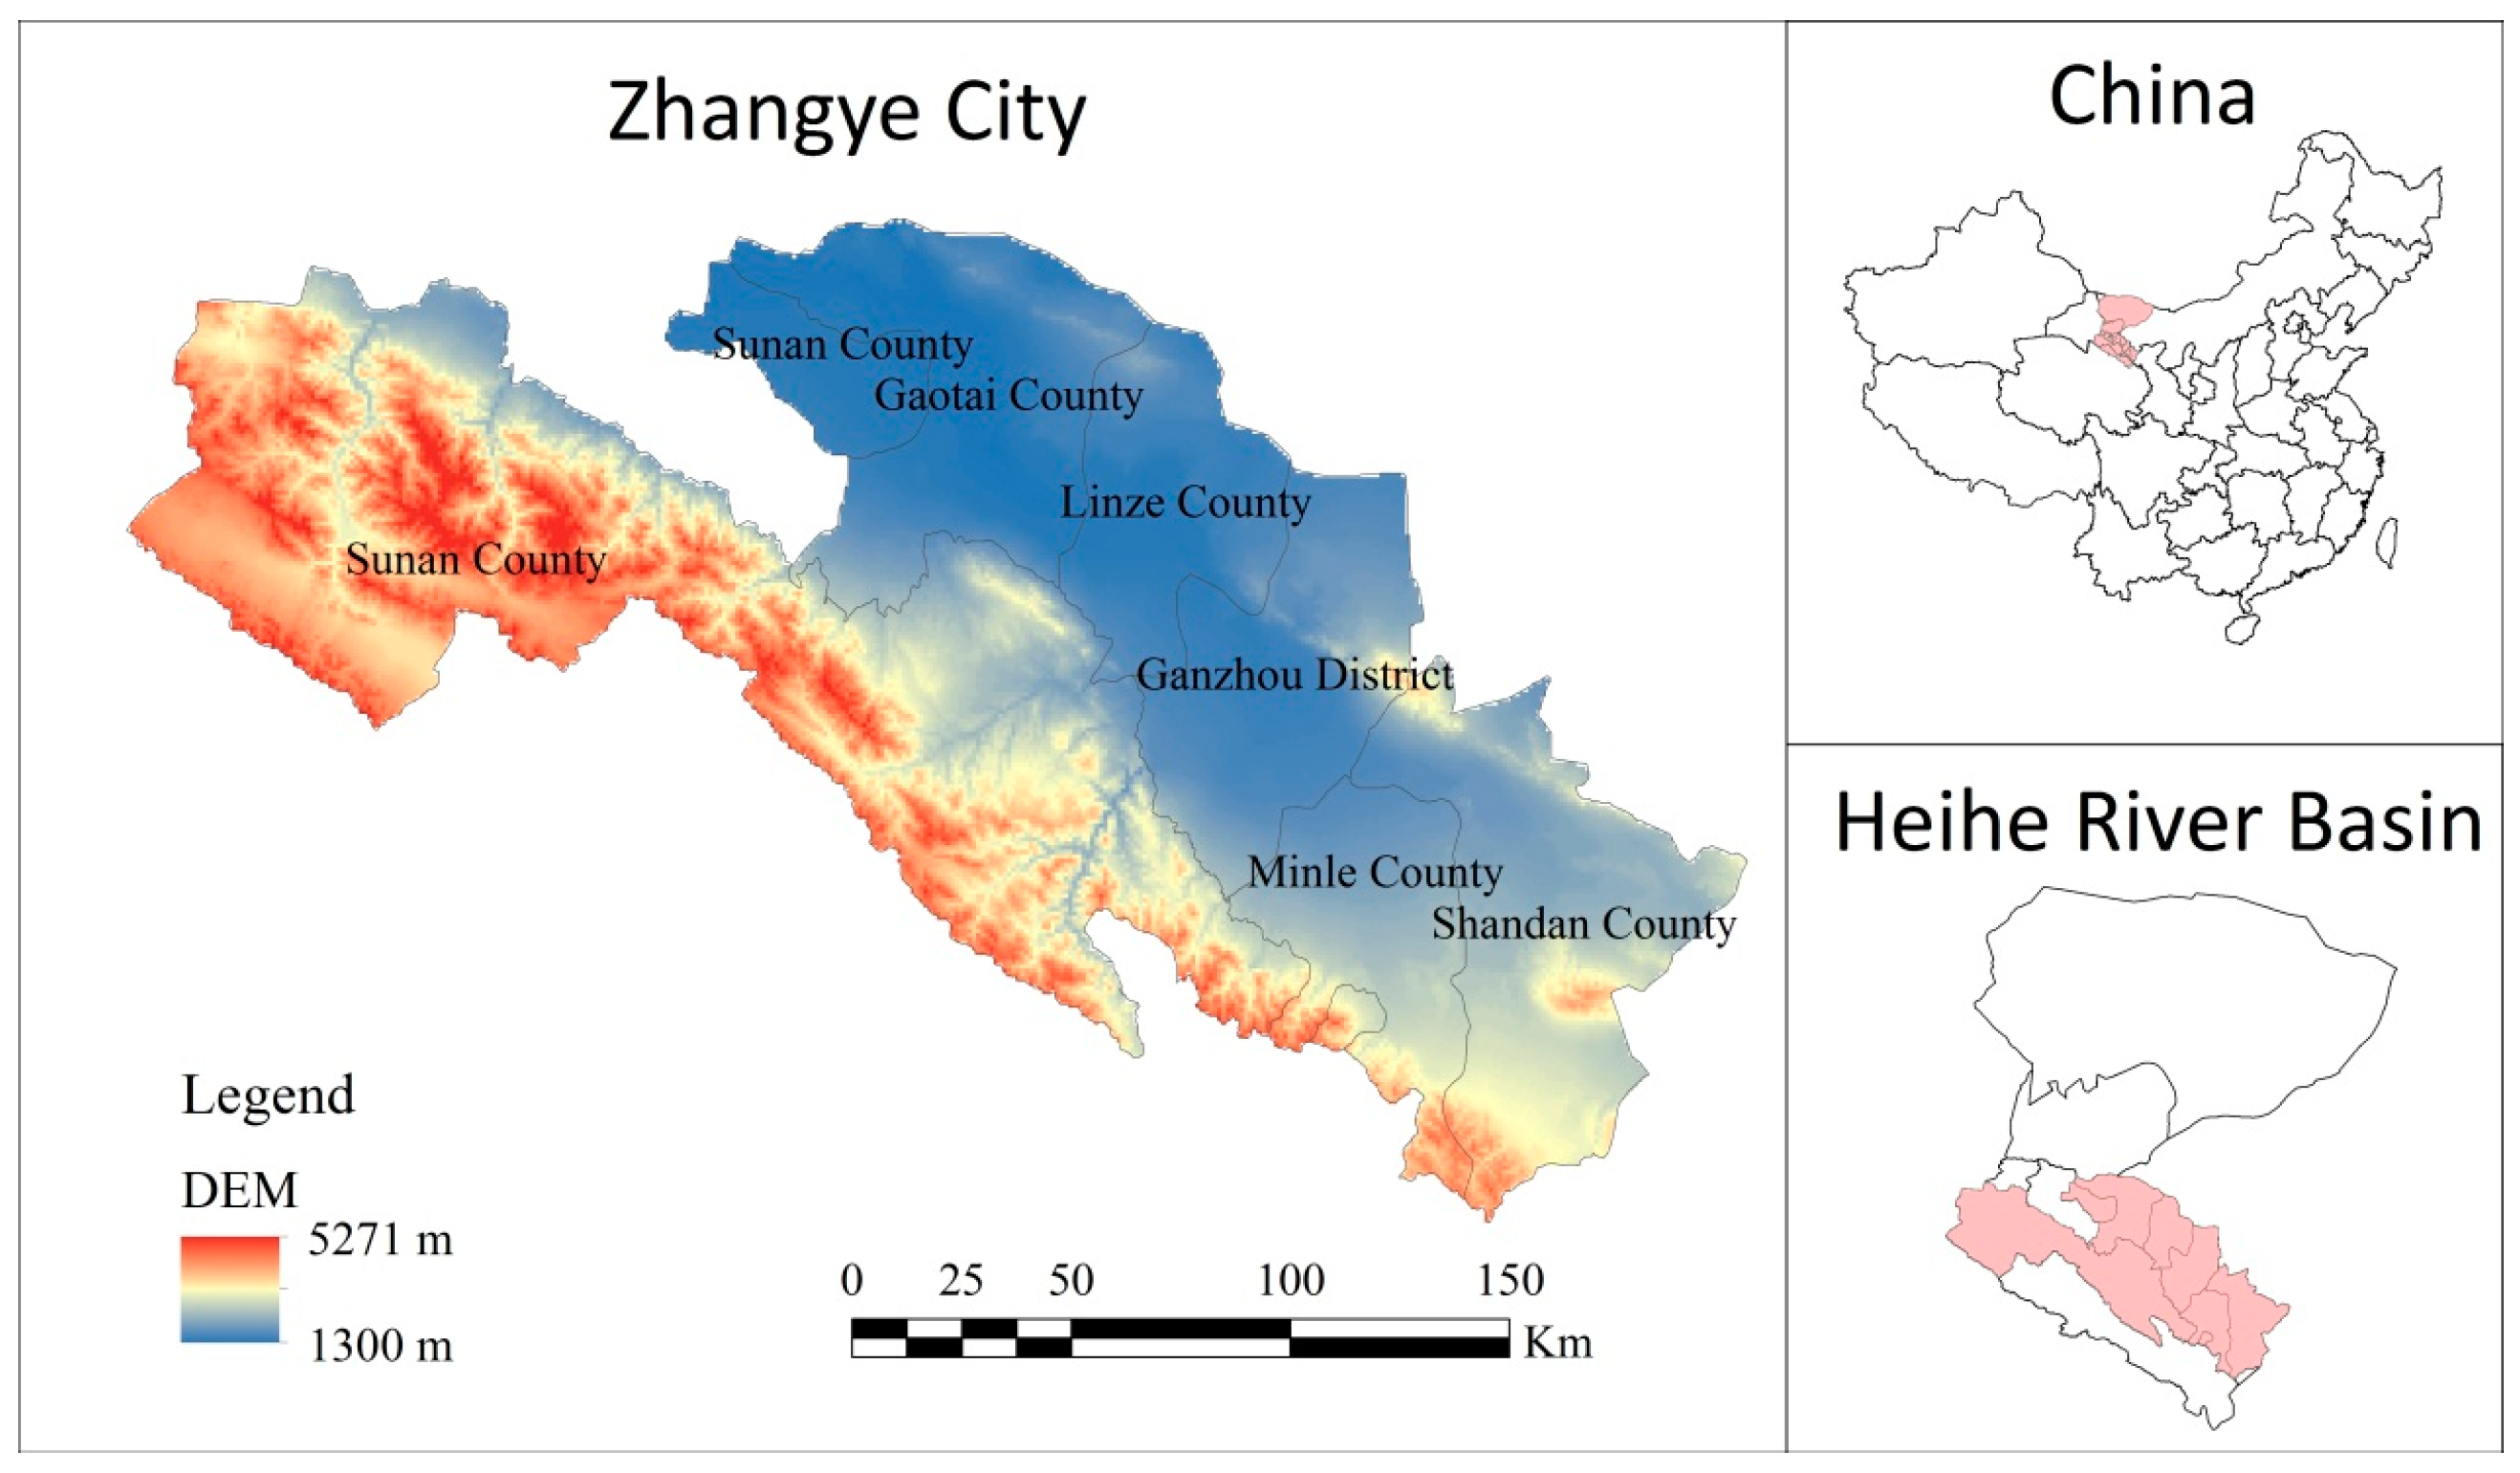
Figure 2.
Gross industrial production and industrial water consumption in Zhangye during 2000–2014.

Figure 3.
Case-based reasoning (CBR) circle.

Figure 4.
CBR-based framework of industrial water demand forecasting.
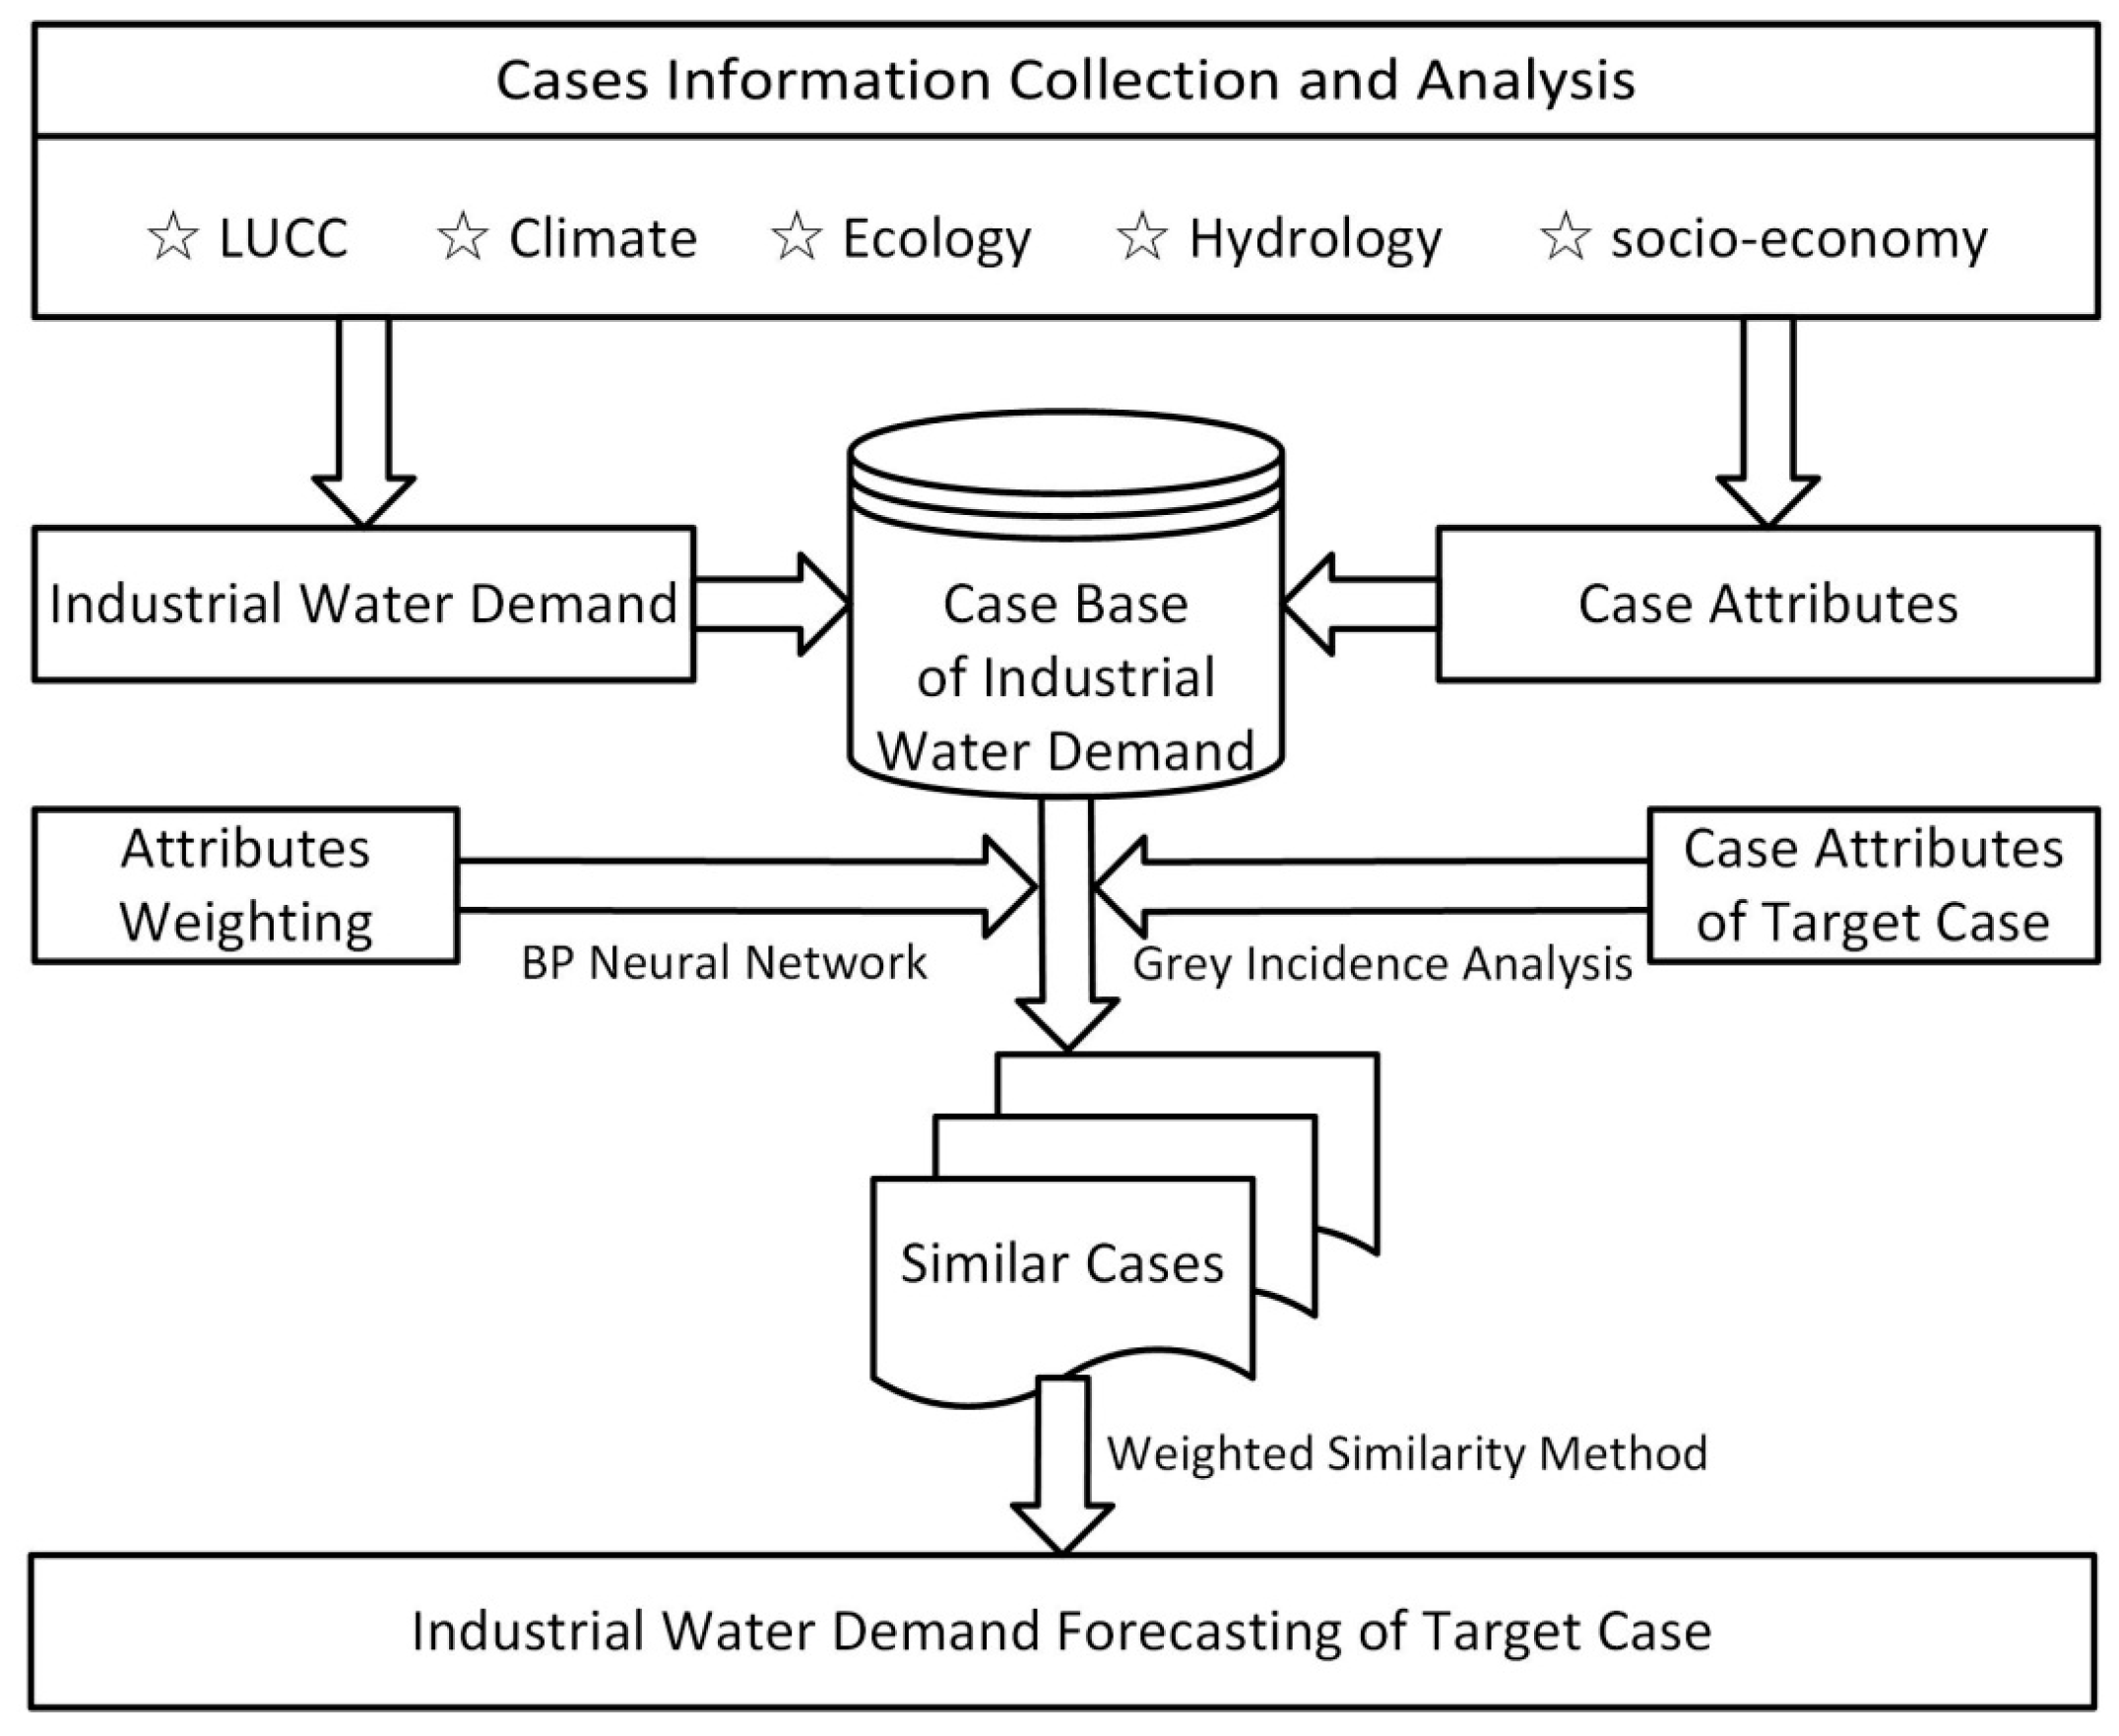
Figure 5.
Structure of the Back Propagation Neural Network (BPN) to train the weights of case attributes.
Figure 5.
Structure of the Back Propagation Neural Network (BPN) to train the weights of case attributes.

Table 1.
Weights of case attributes.
| Case Attributes | Weight | Predicted Value of Zhangye in 2030 |
|---|---|---|
| industrial population | 0.2200 | 39.10 × 10³ |
| per capita GDP | 0.1874 | 41.91 × 10³ yuan |
| gross industrial production | 0.1176 | 37.53 × 10⁹ yuan |
| industrial fixed assets investment | 0.1951 | 19.06 × 10⁹ yuan |
| industrial electricity consumption | 0.1247 | 2.37 × 10⁹ kw·h |
| gross amount of water resources | 0.1553 | 3.63 × 10⁹ ton |
Table 2.
Comparison between forecasting based on CBR and observed values in 2013 and 2014 (×106 tons).
Table 2.
Comparison between forecasting based on CBR and observed values in 2013 and 2014 (×106 tons).
| Year | Forecast | Observed | Relative Error |
|---|---|---|---|
| 2013 | 65 | 69 | −5.80% |
| 2014 | 73 | 72 | 1.39% |
Table 3.
Comparison of industrial water demand forecasts in Zhangye, 2013 (×106 tons).
| Methods | Forecast | Observed | Relative Error |
|---|---|---|---|
| CBR | 65 | 69 | −5.80% |
| GM(1, 1) | 81 | 69 | 17.39% |
| BPN | 55 | 69 | −20.29% |
Table 4.
Similar cases and similarities to the target case.
| City_Year | Similarity | City_Year | Similarity |
|---|---|---|---|
| Yinchuan_2008 | 0.9560 | Urumqi_2010 | 0.9566 |
| Urumqi_2008 | 0.9523 | Xining_2011 | 0.9512 |
| Yinchuan_2009 | 0.9600 | Xining_2012 | 0.9530 |
| Urumqi_2009 | 0.9585 | Xining_2013 | 0.9520 |
| Yinchuan_2010 | 0.9677 | Zhangye_2014 | 0.9525 |
© 2017 by the authors. Licensee MDPI, Basel, Switzerland. This article is an open access article distributed under the terms and conditions of the Creative Commons Attribution (CC BY) license (http://creativecommons.org/licenses/by/4.0/).
Share and Cite
MDPI and ACS Style
Yang, B.; Zheng, W.; Ke, X. Forecasting of Industrial Water Demand Using Case-Based Reasoning—A Case Study in Zhangye City, China. Water 2017, 9, 626. https://doi.org/10.3390/w9080626
AMA Style
Yang B, Zheng W, Ke X. Forecasting of Industrial Water Demand Using Case-Based Reasoning—A Case Study in Zhangye City, China. Water. 2017; 9(8):626. https://doi.org/10.3390/w9080626
Chicago/Turabian StyleYang, Bohan, Weiwei Zheng, and Xinli Ke. 2017. "Forecasting of Industrial Water Demand Using Case-Based Reasoning—A Case Study in Zhangye City, China" Water 9, no. 8: 626. https://doi.org/10.3390/w9080626
Note that from the first issue of 2016, this journal uses article numbers instead of page numbers. See further details here.