Spatiotemporal Patterns of Crop Irrigation Water Requirements in the Heihe River Basin, China


1
Key Laboratory of Land Surface Pattern and Simulation, Institute of Geographic Sciences and Natural Resources Research, Chinese Academy of Sciences, Beijing 100101, China
2
University of Chinese Academy of Sciences, No. 19(A), Yuquan Road, Shijingshan District, Beijing 100049, China
3
Center for Chinese Agricultural Policy, Chinese Academy of Sciences, Beijing 100101, China
*
Author to whom correspondence should be addressed.
Water 2017, 9(8), 616; https://doi.org/10.3390/w9080616
Submission received: 30 June 2017
/
Revised: 14 August 2017
/
Accepted: 15 August 2017
/
Published: 17 August 2017
(This article belongs to the Special Issue Sustainable Water Management within Inland River Watershed)
Abstract
:Agricultural expansion, population growth, rapid urbanization, and climate change have all significantly impacted global water supply and demand and have led to a number of negative consequences including ecological degradation and decreases in biodiversity, especially in arid and semi-arid areas. The agricultural sector consumes the most water globally; crop irrigation alone uses up more than 80% of available agricultural water. Thus, to maintain sustainable development of the global economy and ecosystems, it is crucial to effectively manage crop irrigation water. We focus on the arid and semi-arid Heihe River Basin (HRB), China, as a case study in this paper, extracting spatiotemporal information on the distribution of crop planting using multi-temporal Thematic Mapper and Enhanced Thematic Mapper Plus (TM/ETM+) remote sensing (RS) images. We estimate the spatiotemporal crop irrigation water requirements (IWRc) using the Food and Agriculture Organization of the United Nations (FAO) Penman-Monteith method and reveal variations in IWRc. We also analyze the impact of changes in crop planting structure on IWRc and discuss strategies for the rational allocation of irrigation water as well as policies to alleviate imbalance between water supply and demand. The results of this study show that effective rainfall (ER) decreases upstream-to-downstream within the HRB, while crop evapotranspiration under standard conditions (ETc) increases, leading to increasing spatial variation in IWRc from zero up to 150 mm and between 300 and 450 mm. Data show that between 2007 and 2012, annual mean ER decreased from 139.49 to 106.29 mm, while annual mean ETc increased from 483.87 to 500.38 mm, and annual mean IWRc increased from 339.95 to 370.11 mm. Data show that monthly mean IWRc initially increased before decreasing in concert with crop growth. The largest values for this index were recorded during the month of June; results show that IWRc for May and June decreased by 8.14 and 11.67 mm, respectively, while values for July increased by 5.75 mm between 2007 and 2012. These variations have helped to ease the temporal imbalance between water supply and demand. Mean IWRc values for oilseed rape, corn, barley, and other crops all increased over the study period, from 208.43, 349.35, 229.26, and 352.85 mm, respectively, in 2007, to 241.81, 393.10, 251.17, and 378.86 mm, respectively, in 2012. At the same time, the mean IWRc of wheat decreased from 281.53 mm in 2007 to 266.69 mm in 2012. Mainly because of changes in planting structure, the total IWRc for the HRB in 2012 reached 2692.58 × 106 m3, an increase of 332.16 × 10⁶ m3 (14.07%) compared to 2007. Data show that 23.11% (76.77 × 10⁶ m3) of this increase is due to crop transfers, while the remaining 76.89% (255.39 × 10⁶ m3) is the result of the rapid expansion of cultivated land. Thus, to maintain both the sustainable development and ecological security of the HRB, it is crucial to efficiently manage and utilize agricultural water in light of spatiotemporal patterns in IWRc changes as well as IWRc variations between different crops. The cultivation of water-demanding crops and the further expansion of agricultural land should also be avoided.
1. Introduction
Water is the most ubiquitous and active substance on Earth, intimately involved in the formation and evolution of all facets of the environment, including biogeochemical cycles, climate change, and the configuration of the planet [1,2]. Water is critical to the survival of biological organisms and ecosystems, and thus to sustainable development, especially food security [3,4]. In light of the comprehensive effects of various factors, including the natural environment, social economy, and technology, more than 40 countries worldwide (about 40% of the global population) currently face critical water shortages, severely restricting their sustainable social and ecological development [1,5,6]. Imbalances in water supply and demand lead to shortages; specifically, global climate change, population growth, rapid urbanization, and agricultural expansion have all caused the water demands of different sectors to increase rapidly [7,8,9,10,11]. Global warming leads to increased evapotranspiration, which aggravates water cycling processes and causes increased rainfall [12,13,14,15]. However, in most arid regions where water is scarce, rainfall is decreasing, leading to an increasing imbalance between global water supply and demand [16,17,18,19]. At the same time, wastewater and pollution exacerbate water shortages and cause a number of negative effects including ecosystem degradation and decreases in biodiversity [20,21,22,23]. It is therefore critical to understand the water supply available to, and the demand of, the main water-using sectors as well as to explore reasonable and sustainable ways to utilize this resource to ensure regional sustainable development and ecological security.
Research on the supply of water has mainly focused on total and available volumes. A range of climate and hydrological models, including the Soil and Water Assessment Tool (SWAT), the Global Hydrologic Evaluation Model (GHEM), the Regional Hydro-climate Model (Reg-HCM), the Rainfall-Runoff Modeling System (PRMS), and the Water Balance/Transport Model (WBM/WTM), have all been used to quantitatively estimate rainfall and runoff at different scales, including globally, nationally, and at the level of individual basins [24,25,26,27]. In contrast, research on water demand has mainly focuses on the usage of different sectors such as agricultural, urban domestic and ecological. In this context, water demand is usually estimated based on factors such as population size, cultivated and ecological land area, and water use efficiency [1,2,28,29]. Amongst the different user sectors, agriculture consumes the highest volumes of water globally; irrigation water, for example, accounts for more than 80% of total worldwide agricultural consumption. Thus, research to date has estimated crop irrigation water requirement (IWRc) based mainly on models such as CROPWAT, AquaCrop, and PolyCrop [30,31,32,33,34]. These approaches, however, are unable to evaluate spatiotemporal patterns in IWRc at high spatial resolution and thus cannot be used to determine differences over time and space and due to crop types. This lack of spatiotemporal data on IWRc for different crop types has hampered the scientific research that underlies comprehensive water management.
Compared with developed countries, water shortages in developing regions globally are more acute and less well-studied, especially in arid and semi-arid regions. China is one of the largest developing countries and one of the most arid; 20% of the global population live in this country yet it boasts between just 5% and 7% of global freshwater resources. The available water per capita in China is just a quarter of the global mean [35,36]. Arid and semi-arid regions in Northwest China make up 30% of the national land area, but have less than 20% of total national available water resources because rainfall is low and evapotranspiration is high; thus, water shortages in this region are of particular concern [1,9]. This issue is even more critical because much of the irrigated cultivated land in China is also distributed in these arid and semi-arid areas; natural rainfall cannot meet the water requirements of crops in this region and so supplementary irrigation is essential to increase yields and to guarantee food security in these areas [15,37,38]. Agricultural irrigation water nationally accounts for 60% of total water use, but more than 80% of total consumption in the arid and semi-arid areas of Northwest China [2,25]. Thus, accurate IWRc calculations are crucial to the regional social-economic and ecological sustainable development of these areas where water is scarce [37,39].
The rapid expansion of agricultural oases combined with population growth and urbanization have further exacerbated the imbalance between urban and agricultural water use in China [28]. Thus, to meet escalating water demands for crop irrigation, agricultural producers have utilized increasing volumes of runoff and groundwater which leads to ecosystem degradation including the seasonal cutoff of rivers, groundwater overdraft, and decreasing ecological land area [1,40,41]. To mitigate these issues, the Chinese government has implemented a range of water management measures concerning water yield, water rights, and water prices and has also promoted the application of new technologies including drip and sprinkler irrigation [28,42,43]. However, managers and producers are still unable to effectively allocate irrigation water according to actual demand because of the absence of high-precision, fine-scale spatiotemporal IWRc data. This situation has led to inefficient water use including irrigation waste and deficits [28]. It is therefore critically important to provide comprehensive data on water usage as it relates to the spatiotemporal distribution of crops, climate, and evapotranspiration in order to precisely estimate IWRc. Such data will support decision making, enable the formulation of efficient irrigation schemes, and allow the implementation of comprehensive water management measures to alleviate the negative economic and ecological effects caused by shortages.
Water shortages are restricting the sustainable development of society, the economy, and ecosystems within the Heihe River Basin (HRB), a continental system that encompasses both arid and semi-arid regions of China. The rapid expansion of agricultural oases in recent decades, as well as expansion and changes to crop planting structures, have led to rapidly increasing demands for agricultural water in the HRB [44,45,46]. At the same time, however, the water supply of this region has not kept pace with demand, even though it has increased slowly and intermittently as climate has become warmer and wetter. Rapid population growth and urbanization has further exacerbated the water supply and demand imbalance between agriculture, cities, and ecology and has led to negative effects, including ecological degradation. Understanding changes in spatiotemporal IWRc patterns because of changes in crop planting structures is therefore critical to the comprehensive management of water resources. Thus, using the HRB as our study area, we extracted spatiotemporal distributional information on crop planting structures using multi-temporal Thematic Mapper and Enhanced Thematic Mapper Plus (TM/ETM+) remote sensing (RS) images and calculated spatiotemporal IWRc using the Food and Agriculture Organization of the United Nations (FAO) Penman-Monteith formula. The objectives of this study are: (1) To reveal the spatiotemporal characteristics of variation in effective rainfall (ER), crop evapotranspiration, and IWRc between 2007 and 2012 in the HRB; (2) To analyze the influences of crop planting structure changes on IWRc; (3) To understand the reasons underlying spatiotemporal variation in IWRc; and (4) To discuss the implementation of policies that could contribute to alleviating the imbalance between agricultural water supply and demand.
2. Research Area and Data Sources
2.1. Research Area
The HRB is the second largest continental river basin within the arid and semi-arid areas of Northwest China, located in the center of the “One Belt And One Road” and “Silk Roads” economic belts (97°30′ E–101°43′ E, 37°55′ N–40°00′ N) (Figure 1). The HRB borders the Qinghai-Tibet Plateau in the southwest, the Shule River Basin in the west, the Shiyang River Basin in the east, and Mongolia in the north. The entire basin encompasses an area of 12.80 × 10⁶ ha and consists of 11 administrative counties. The upper, middle, and lower reaches of the HRB are demarcated by the Yingluo and Zhengyi gorges; the upper reaches of this system mainly comprise the Qilian Mountain (Qilian and Sunan counties) water conservation area, while the middle reaches encompass agricultural oases in the center of the Hexi Corridor (i.e., Shandan, Minle, Ganzhou, Linze, Gaotai, Suzhou, and Jiayuguan counties), and the lower reaches extend into the Gobi Desert (Jinta and Egina counties). The HRB is located in the central part of the Eurasian plate, and is characterized by a temperate continental climate. This region is typically dry and water is scarce; the small amount of rainfall seen within the HRB tends to have a non-uniform spatiotemporal distribution. Mean annual rainfall in the upper, middle, and lower reaches of the HRB decreases gradually, from 250–500 mm, 100–250 mm, and less than 50 mm, respectively; 70% of the rainfall are concentrated in June, July, and August, with an annual potential evapotranspiration of 2400–3000 mm.
Water resources are the most important factor for ecosystem maintenance and the social and economic development of the HRB. The mean annual available amount of water within this basin is 28.0 × 10⁸ m3, of which surface water comprises 24.7 × 10⁸ m3 and groundwater comprises 3.3 × 10⁸ m3. In addition, the HRB is one of the ten largest commodity grain bases nationally; the main crops grown between March and September in this region include corn, wheat, barley, and oilseed rape. Agriculture is also the sector that consumes the most water in the HRB; irrigation water alone accounts for more than 85% of total water consumption in the basin. However, because of the lack of rainfall and runoff water, groundwater is used excessively in this area for irrigation. Because of the expansion of cultivated land area, rapid population growth, and urbanization in recent years, competition for water in the HRB among different sectors has become more-and-more intense, while the use of flood irrigation-oriented methods also waste a substantial volume, reducing agricultural water use efficiency to between 20% and 30%. In the face of these issues, a number of aspects of current water management within the HRB are unreasonable; the irrigation quota, for example, is far higher than the actual IWRc. It is therefore critical to develop management strategies for the use of agricultural water according to the spatiotemporal water requirements of crops in order to avoid water waste, yield losses, and environmental degradation.
2.2. Data Sources
We utilized TM/ETM+ RS images at a spatial resolution of 30 m and a temporal resolution of 16 d in this study to extract crop planting structures for 2007 and 2012 in the HRB. The images we selected were then subjected to a series of systematic radiometric, geometric, and atmospheric corrections, as well as radiometric calibration and de-striping to obtain a mosaic of HRB images that included seven time phases for 2007 and ten time phases for 2012. The numbers of useable mosaic images differed between the two years because of cloud cover; for both years, the number of effective mosaic images was far less than the total number of time phases.
We used ground monitoring data collected at 20 meteorological sites in the HRB and adjacent areas to calculate reference crop evapotranspiration (including under standard conditions), ER, and IWRc. Meteorological data included mean monthly rainfall, temperature, maximum and minimum temperature, relative humidity, wind speed, and pressure for 2007 and 2012.
We then utilized the Advanced Spaceborne Thermal Emission and Reflection Radiometer Global Digital Elevation Model (ASTER GDEM) Version 2 elevation data with a spatial resolution of 30 m and an elevation resolution of 7 m to calculate net surface crop radiation [47]. Besides, phenological data from corn, wheat, barley, and oilseed rape were used to determine crop planting structures and coefficients at different growing stages.
3. Methods
3.1. Mapping Crop Planting Structure
3.1.1. The Multi-Temporal Normalized Difference Vegetation-Water Index (NDVWI)
We identified crop types in this study using the multi-temporal NDVWI, a new spectrum index that we developed based on the Normalized Difference Vegetation Index (NDVI) and the Normalized Difference Water Index (NDWI) [45]. Because the NDVI can effectively, empirically, and simply characterize vegetation growth status, it is one of the most widely used indexes in vegetation classification [48]. At the same time, the NDWI is sensitive to moisture in the vegetation canopy and is therefore also helpful for classification [49]. Our index, the NDVWI, combines the merits of both the NDVI and the NDWI and can achieve higher crop classification accuracy than either, especially in arid and semi-arid regions. Values for the NDVWI range between −2 and 2 and are dimensionless. The formula used to calculate this index is as follows:
In this expression, ρ(red), ρ(nir), and ρ(swir) denote the surface reflectance of red, near-infrared, and short-wave infrared bands, the third, fourth, and fifth bands in TM/ETM+ images, respectively.
3.1.2. Decision Tree Algorithm
A decision tree algorithm is a top-down classification approach which is used to organize complex data sets step-by-step by effectively combining their characteristics with professional knowledge [45,50]. A decision tree comprises root, internal, and leaf nodes; of these, parent nodes (i.e., root or internal nodes) are further classified as child nodes (i.e., internal or leaf nodes) based on classification rules. Thus, applying the multi-temporal NDVWI as well as variations and differences in crop phenological information over time, we developed a series of classification rules for different crops by sample training in this study. Use of a classification decision tree enabled us to extract HRB crop planting structures for 2007 and 2012.
3.2. The Thin Plate Spline (TPS) Method
We applied a TPS method using the software ANUSPLIN to interpolate meteorological data. This method enables the spatial interpolation of multivariate data via comprehensive statistical analysis, data diagnosis, and the use of spatial distribution standard errors to allow the introduction of related covariates and increase interpolation precision [51].
3.3. Effective Rainfall (ER)
For agricultural production, ER refers to that portion of rainfall that can effectively be used by crops. This concept is important; not all rainfall is useful for agriculture as a component is always lost through runoff and infiltration. Thus, applying the method developed by the United States Department of Agriculture and Soil Conservation Service (USDA-SCS) [52], we calculated ER in monthly steps as follows:
In this expression, ERmonth and ARmonth refer to the effective and actual rainfall in each month, respectively.
3.4. Reference Crop Evapotranspiration (ETo)
This measure, ETo, refers to the evapotranspiration that would be recorded if the whole surface of the Earth were covered with hypothetical crops all growing actively with a sufficient water supply [53,54]. In 1990, the FAO convened a large group of experts and researchers to collaborate with the International Commission for Irrigation and Drainage and the World Meteorological Organization to jointly improve the IWRc, calculation methodology. This process resulted in the development of the FAO Penman-Monteith method for the calculation of ETo [33,54]. This approach overcomes the numerous shortcomings of earlier methods; ETo values calculated using the FAO Penman-Monteith method are more consistent with global actual crop water consumption data. We computed the FAO Penman-Monteith method as follows:
and
In these expressions, ETo denotes reference crop evapotranspiration (mm/d), Rn is crop surface net radiation (MJ·m−2·d−1), G is soil heat flux (MJ·m−2·d−1), ∆ is the slope of the saturated water vapor pressure curve (kPa/°C), γ is the psychrometric constant (kPa/°C), u2 is wind speed at a height of 2 m (m/s), Tmean, Tmax, and Tmin refer to mean temperature, mean maximum temperature, and mean minimum temperature, respectively (°C), es denotes the saturated water vapor pressure (kPa), ea is the actual water vapor pressure (kPa), e(Tmean), e(Tmax), and e(Tmin) are water vapor pressures at temperatures of Tmean, Tmax, and Tmin, respectively, RH is relative humidity (%), P is atmospheric pressure (kPa), and z is the elevation from the surface of the Earth when measuring wind speed.
3.5. Crop Evapotranspiration under Standard Conditions (ETc)
In this context, ETc is defined as crop evapotranspiration when a particular plant is growing actively with sufficient water supply under standard conditions. Similarly, the crop coefficient (Kc) distinguishes a specific crop from the reference [33,55]. We calculated ETc (mm) for the major crops grown in the HRB for the period between March and September as follows:
However, because Kc varies with plant growth period, we corrected and determined this value for different crop stages using a survey based on FAO Irrigation and Drainage Paper No. 56 [54] and crop phenological information (Table 1). Oilseed rape and corn are autumn crops, so their growth stages are longer than those of summer crops such as barley and wheat; the growth phase of oilseed rape is between April and August, while that of corn is between April and September, those of barley and wheat are between March and July, and those of other crops are between April and August.
3.6. Crop Irrigation Water Requirement (IWRc)
In this context, IWRc is the volume of water required to replenish losses due to evapotranspiration. This value is the difference between ER and ETc [54], calculated as follows:
4. Results
4.1. Spatiotemporal ER Changes
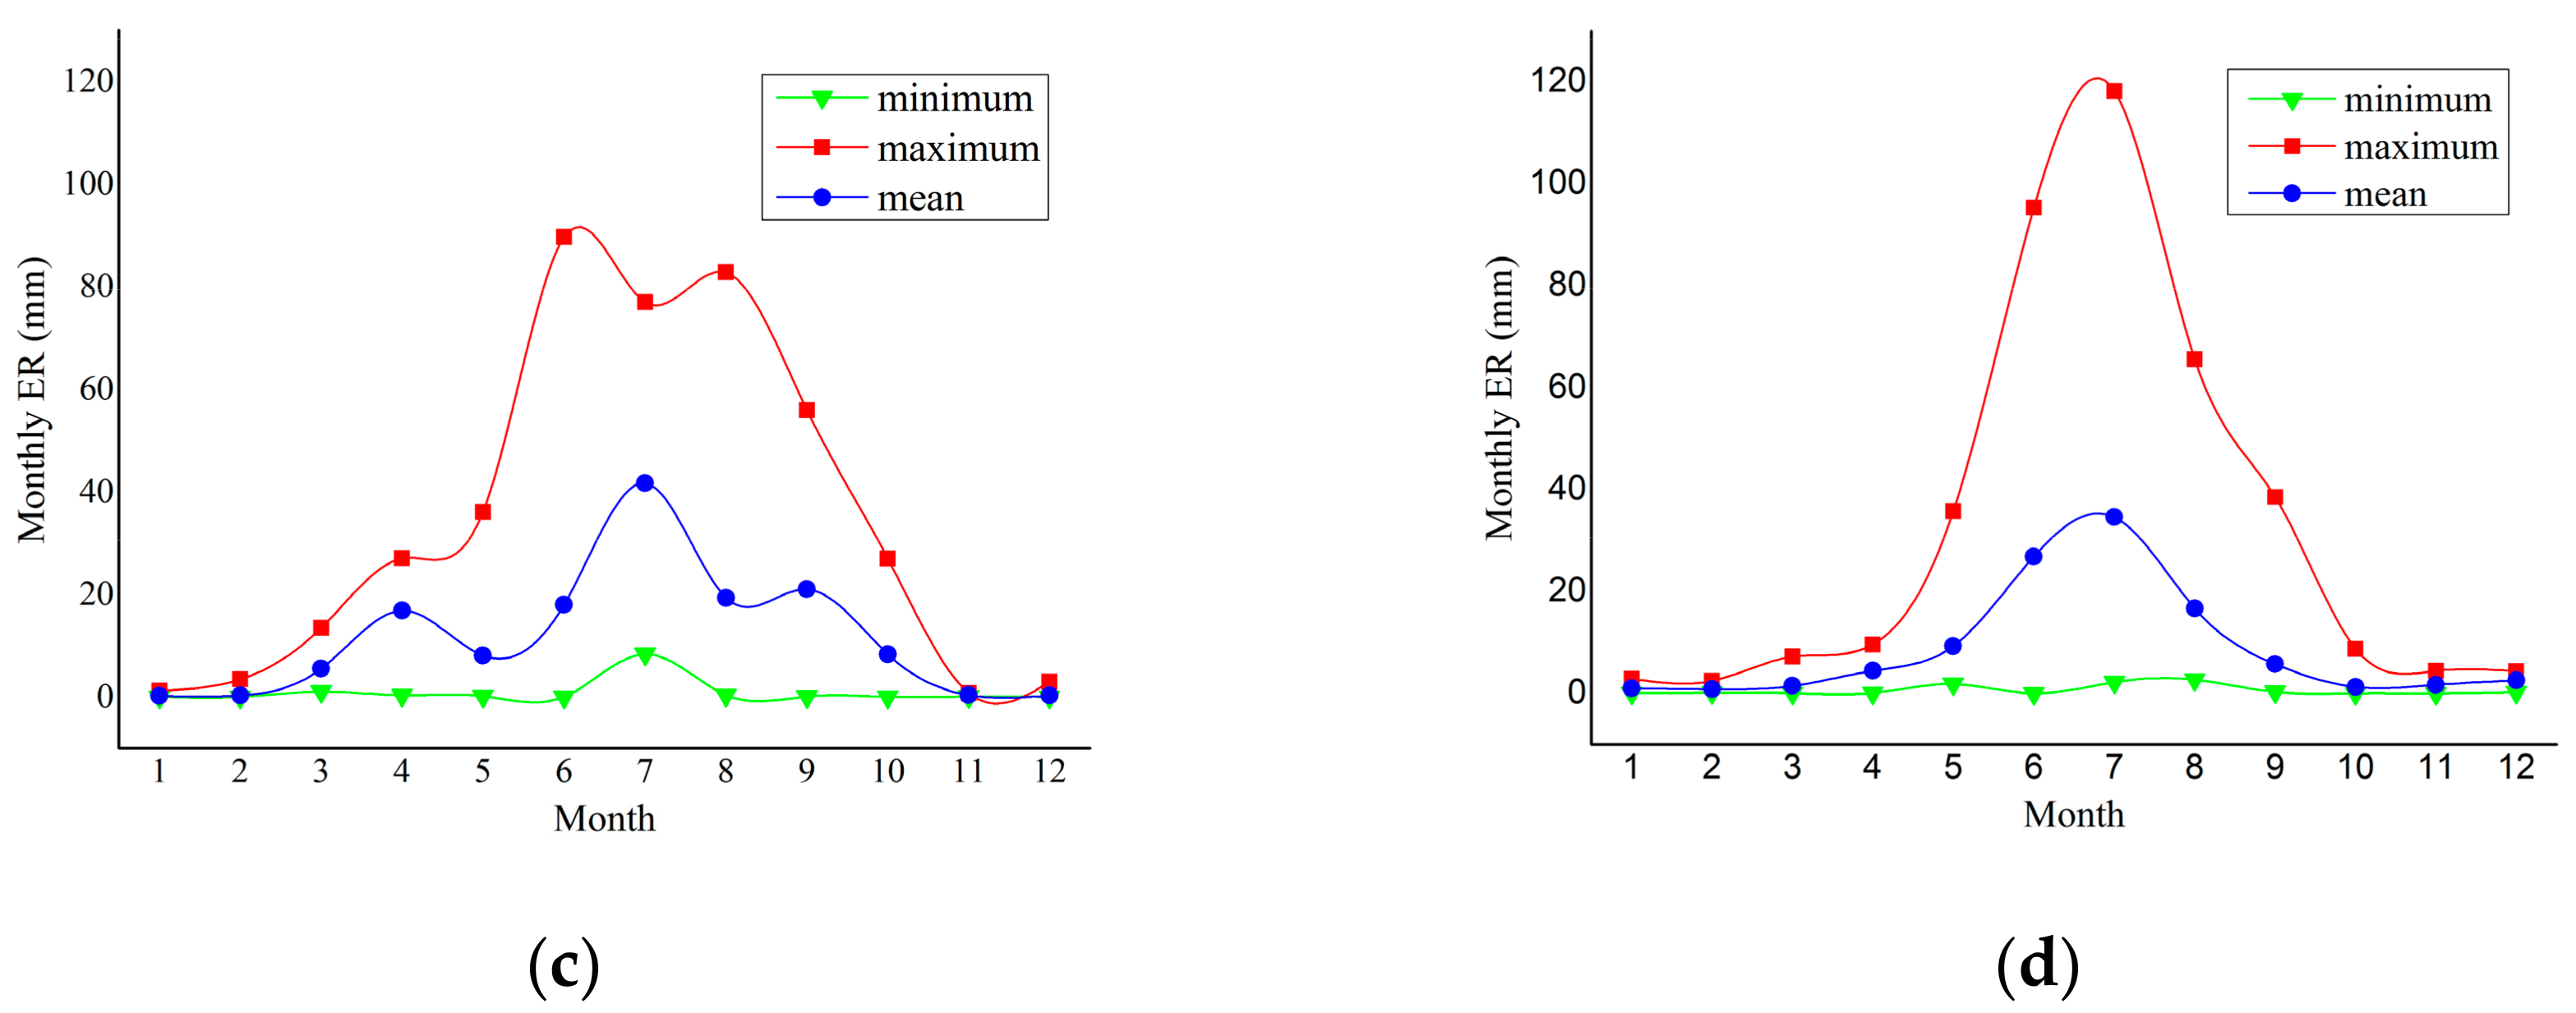
Results show that between 2007 and 2012, ER values in the HRB were non-uniform in their spatiotemporal distribution (Figure 2). Specifically, annual ER values gradually fell along an upstream-to-downstream transect; in the upper reaches of the HRB, annual ER was higher than 250 mm, while values were between 100 mm and 200 mm in the middle reaches, falling to below 100 mm in the lower reaches. Data show that the annual mean ER of the HRB decreased from 139.49 mm in 2007 to 106.29 mm in 2012 (Figure 2a,b). Thus, given the same evapotranspiration, decreasing ER means that the IWRc in 2012 was greater than that of the same crop in 2007. Monthly ER also significantly differed within the same year, exhibiting a tendency to initially increase before decreasing (Figure 2c,d). In both years, mean and minimum ER values were highest in July; highest monthly maximum values were recorded in June 2007 and in July 2012, while within each year, 70% of ER was concentrated between June and August. Results show that mean ER values in June 2007, July 2007, and August 2007 were 17.99, 41.68, and 19.29 mm, respectively, while in June 2012, July 2012, and August 2012 they were 26.82, 34.56, and 16.65 mm, respectively. Interestingly, mean ER values in April 2007 (16.79 mm) and September 2007 (20.97 mm) were significantly higher than those in April 2012 (4.42 mm) and September 2012 (5.74 mm). Some growth phases of dominant crops were also characterized by lowered ER values, including the seeding period between March and April, and the late growing period in September. In contrast, some fast growth periods, including between May and June and the intermediate phase between July and August were characterized by higher ER values. In other months, ER values were lower that those seen during crop growth periods (i.e., in January, February, October, November, and December).
4.2. Spatiotemporal Changes in Crop Evapotranspiration
4.2.1. Spatiotemporal Changes in ETo
Data show that annual ETo values for the HRB tend to increase along an upstream-to-downstream transect. Thus, in water conservation areas in the upper reaches, values were as low as 750 mm, increasing to between 750 and 1250 mm in agricultural oases regions in the middle reaches, and were higher, between 1250 and 2500 mm, in the lower reaches. Annual ETo exceeded 1750 mm in the northeastern ecological conservation area in the lower reaches of the HRB (Figure 3a,b). Results show that between 2007 and 2012, mean annual ETo decreased from 1406.04 to 1392.44 mm; monthly mean ETo values in 2007 and 2012 were between 0.67 and 8.42 mm/d (mean: 3.84 mm/d) and between 0.54 and 7.52 mm/d (mean: 3.80 mm/d), respectively. Mean ETo in June was highest (Figure 3c,d), while monthly minimum ETo values in 2007 and 2012 were 1.34 and 1.46 mm/d, respectively. The lowest recorded monthly minimum ETo values in 2007 (0.36 mm/d) and 2012 (0.30 mm/d) were both in January, while mean values of monthly maximum ETo in 2007 and 2012 were 6.66 and 6.70 mm/d, respectively. Highest monthly maximum ETo values were recorded in June 2007 (16.63 mm/d) and July 2012 (15.34 mm/d); results show that standard variations in mean monthly ETo were 1.40 and 1.23 mm/d in the two years, respectively, and that monthly ETo values were greater in 2007 than they were in 2012. During the main growth phases of dominant crops, mean ETo values were higher during fast and medium growing stages in the months between June and August; values of 7.77, 8.42, 6.60, and 6.43 mm/d, respectively, were recorded in 2007, compared to 6.56, 7.52, 6.90, and 6.65 mm/d, respectively, in 2012.
4.2.2. Spatiotemporal Changes in ETc
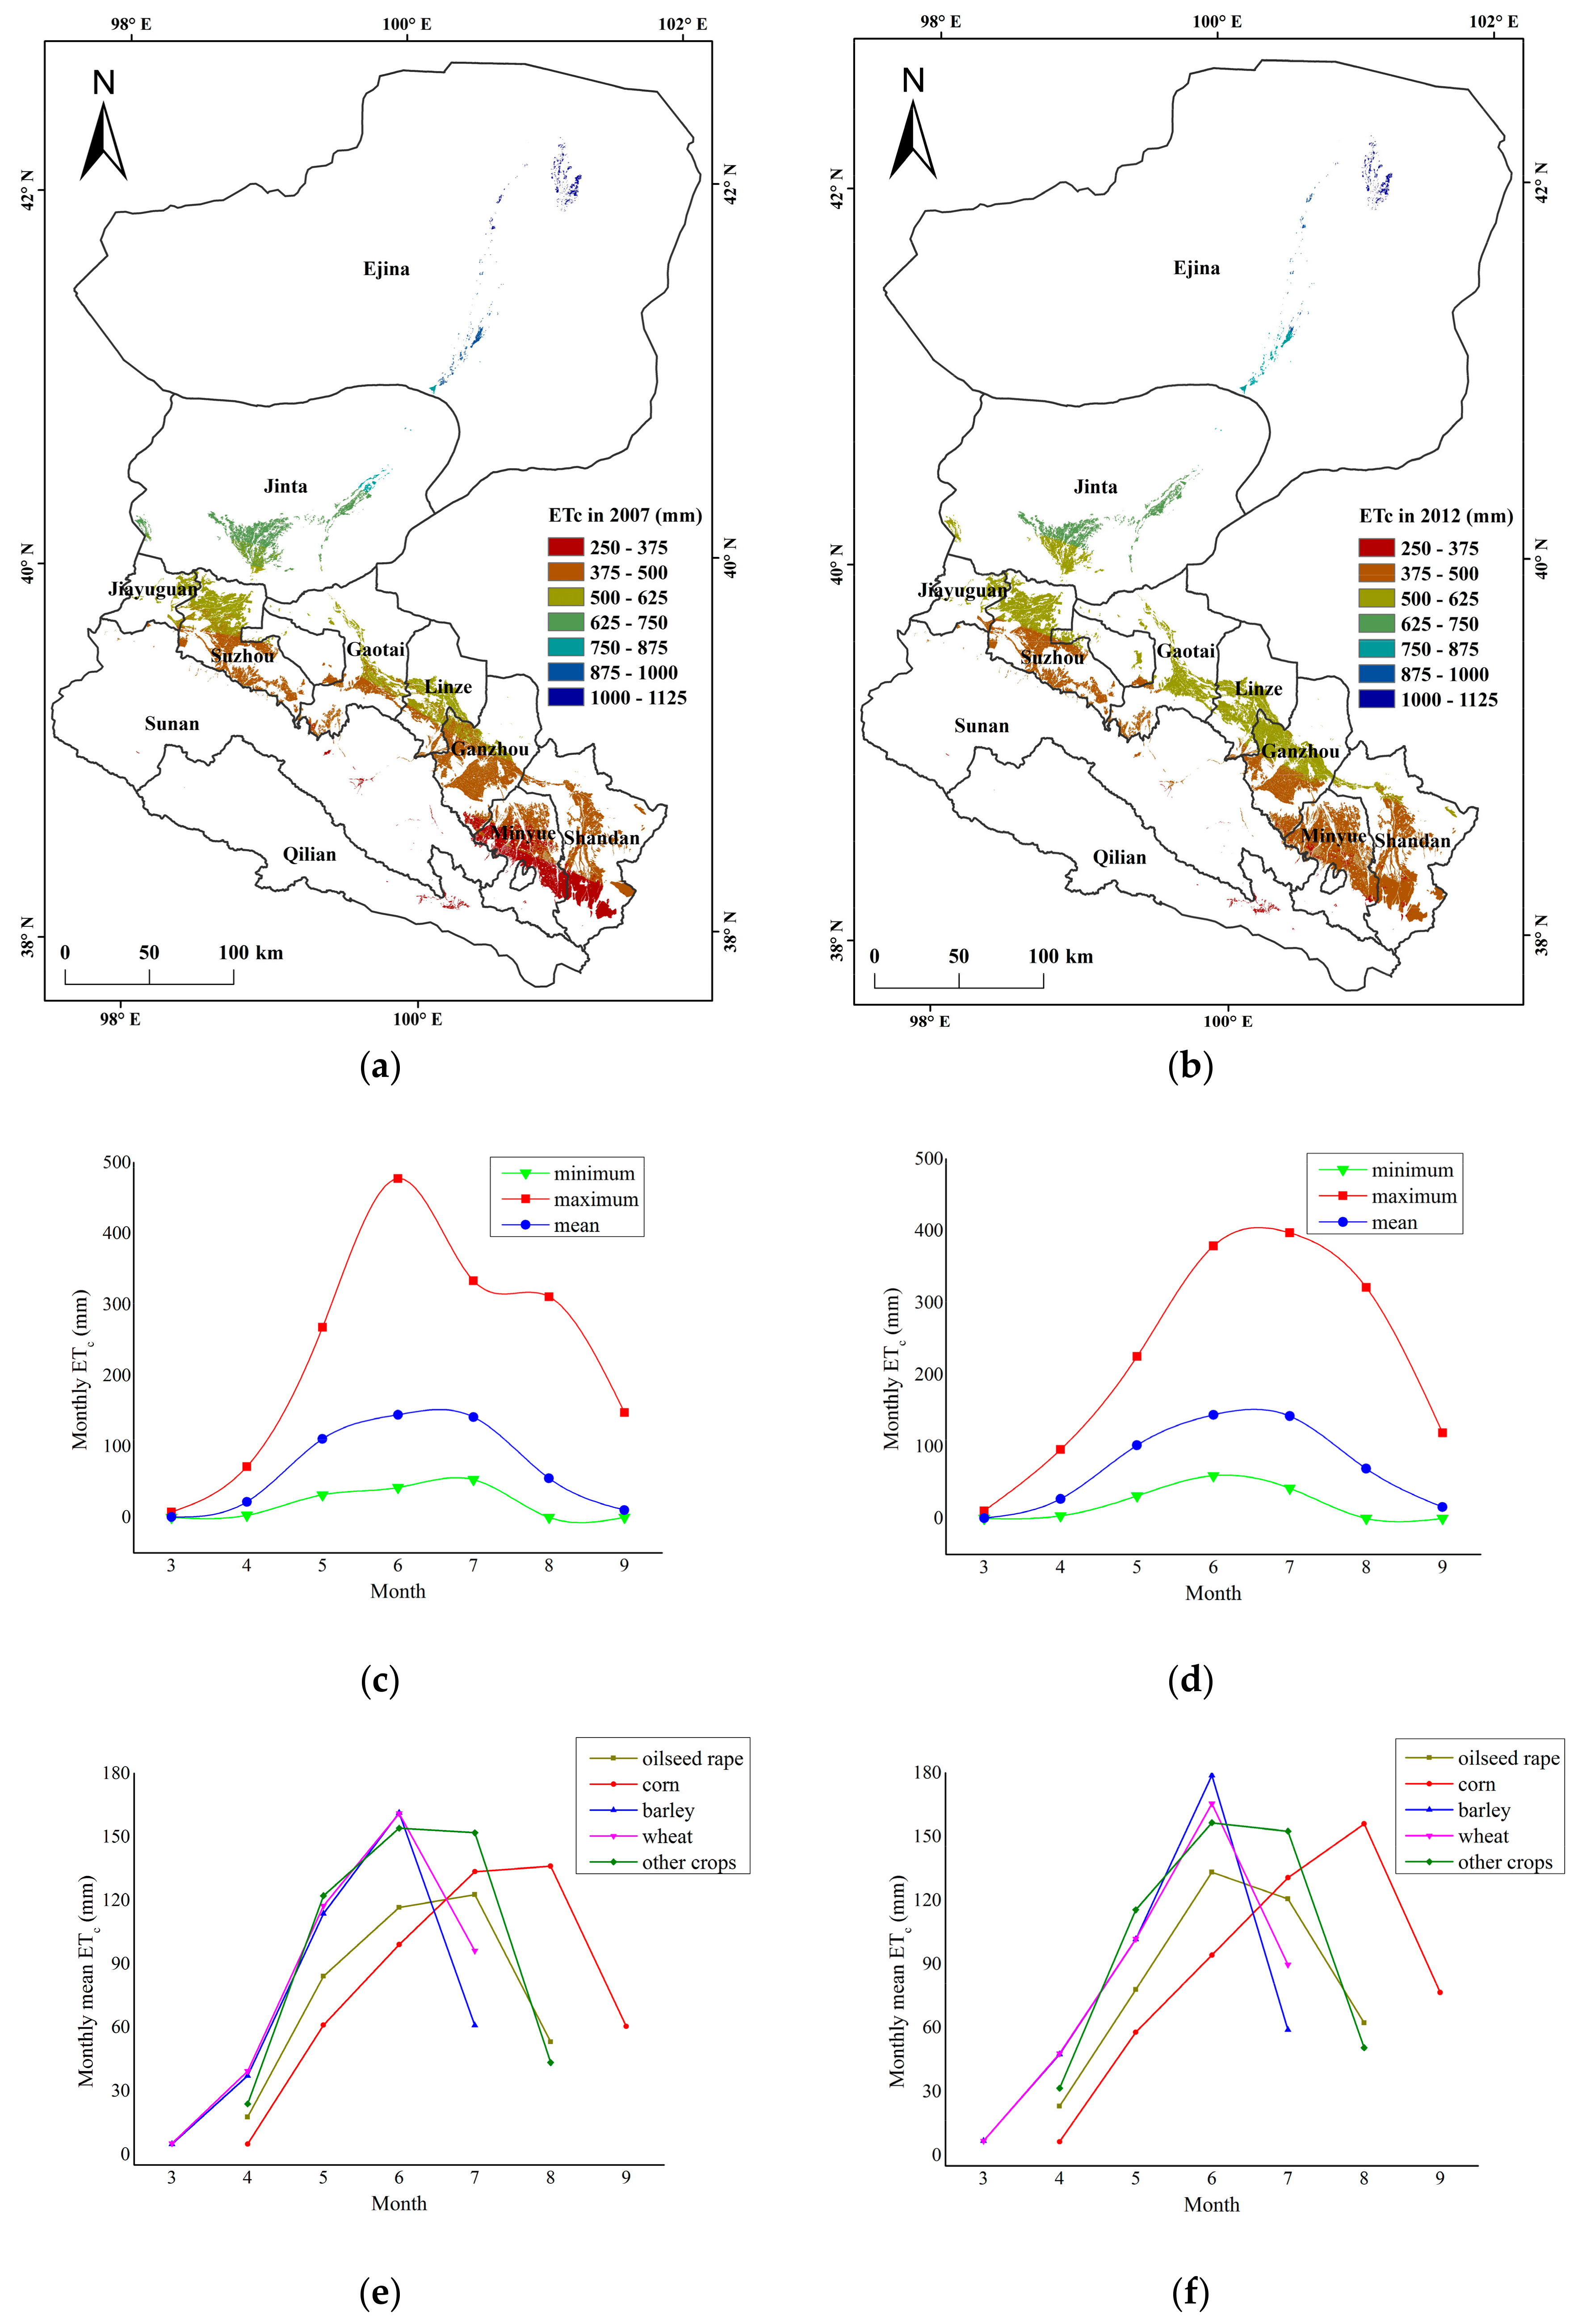
Results show that annual ETc values within the HRB exhibit similar spatial variation to annual ETo; increasing along an upstream-to-downstream transect (Figure 4a,b). As a small proportion of cultivated land within the upper reaches of the HRB is located in the river valley, annual ETc was as low as 375 mm in this area. In contrast, 85% of cultivated land is within oases in the middle reaches where annual ETc values fall between 375 and 625 mm. In the lower reaches, the annual ETc of cultivated land in the Gobi Desert was between 625 and 1125 mm, while values for this land use type in the northeast exceeded 1000 mm. Results show that mean ETc was 483.87 mm in 2007 and that it increased to 500.38 mm in 2012; during crop growth phases, mean, maximum, and minimum ETc values for May, June, and July (middle growth stage) were relatively elevated, while those for early and late growth stages were relatively lower (Figure 4c,d). Mean HRB ETc values for May 2007, June 2007, and July 2007 were 100.28, 144.53, and 141.32 mm, respectively, while they were 101.69, 143.95, and 142.24 mm, respectively, in 2012.
Data show that mean ETc values for oilseed rape, corn, barley, and other crops increased from 394.26, 495.11, 377.89, and 495.32 mm, respectively, in 2007 to 417.03, 521.50, 393.53, and 506.58 mm in 2012. Interestingly, the mean ETc of wheat decreased from 418.94 mm in 2007 to 411.39 mm in 2012 (Figure 4e,f); mean values for barley and wheat were at their highest in June 2007, 161.40 and 160.98 mm, respectively, but increased in 2012 to 178.77 and 165.48 mm, respectively. Mean ETc values for barley and wheat in May 2007 were relatively higher, 113.66 and 117.39 mm, respectively, but fell to 101.65 and 101.83 mm, respectively, in 2012. Oilseed rape was characterized by higher mean ETc values in June and July of each year; mean values in 2007 were 116.59 and 122.68 mm, respectively, and 133.19 and 120.65 mm in 2012. Similarly, corn was characterized by relatively higher mean ETc values, 133.57 and 136.13 mm, in July 2007 and August 2007, respectively, and these values rose to 130.62 mm and 155.98 mm, respectively, in 2012. Other crops also had higher mean ETc values in May 2007, June 2007, and July 2007, 122.20, 154.06, and 151.90 mm, respectively, corresponding to 115.50, 156.52, and 152.51 mm, respectively, in 2012.
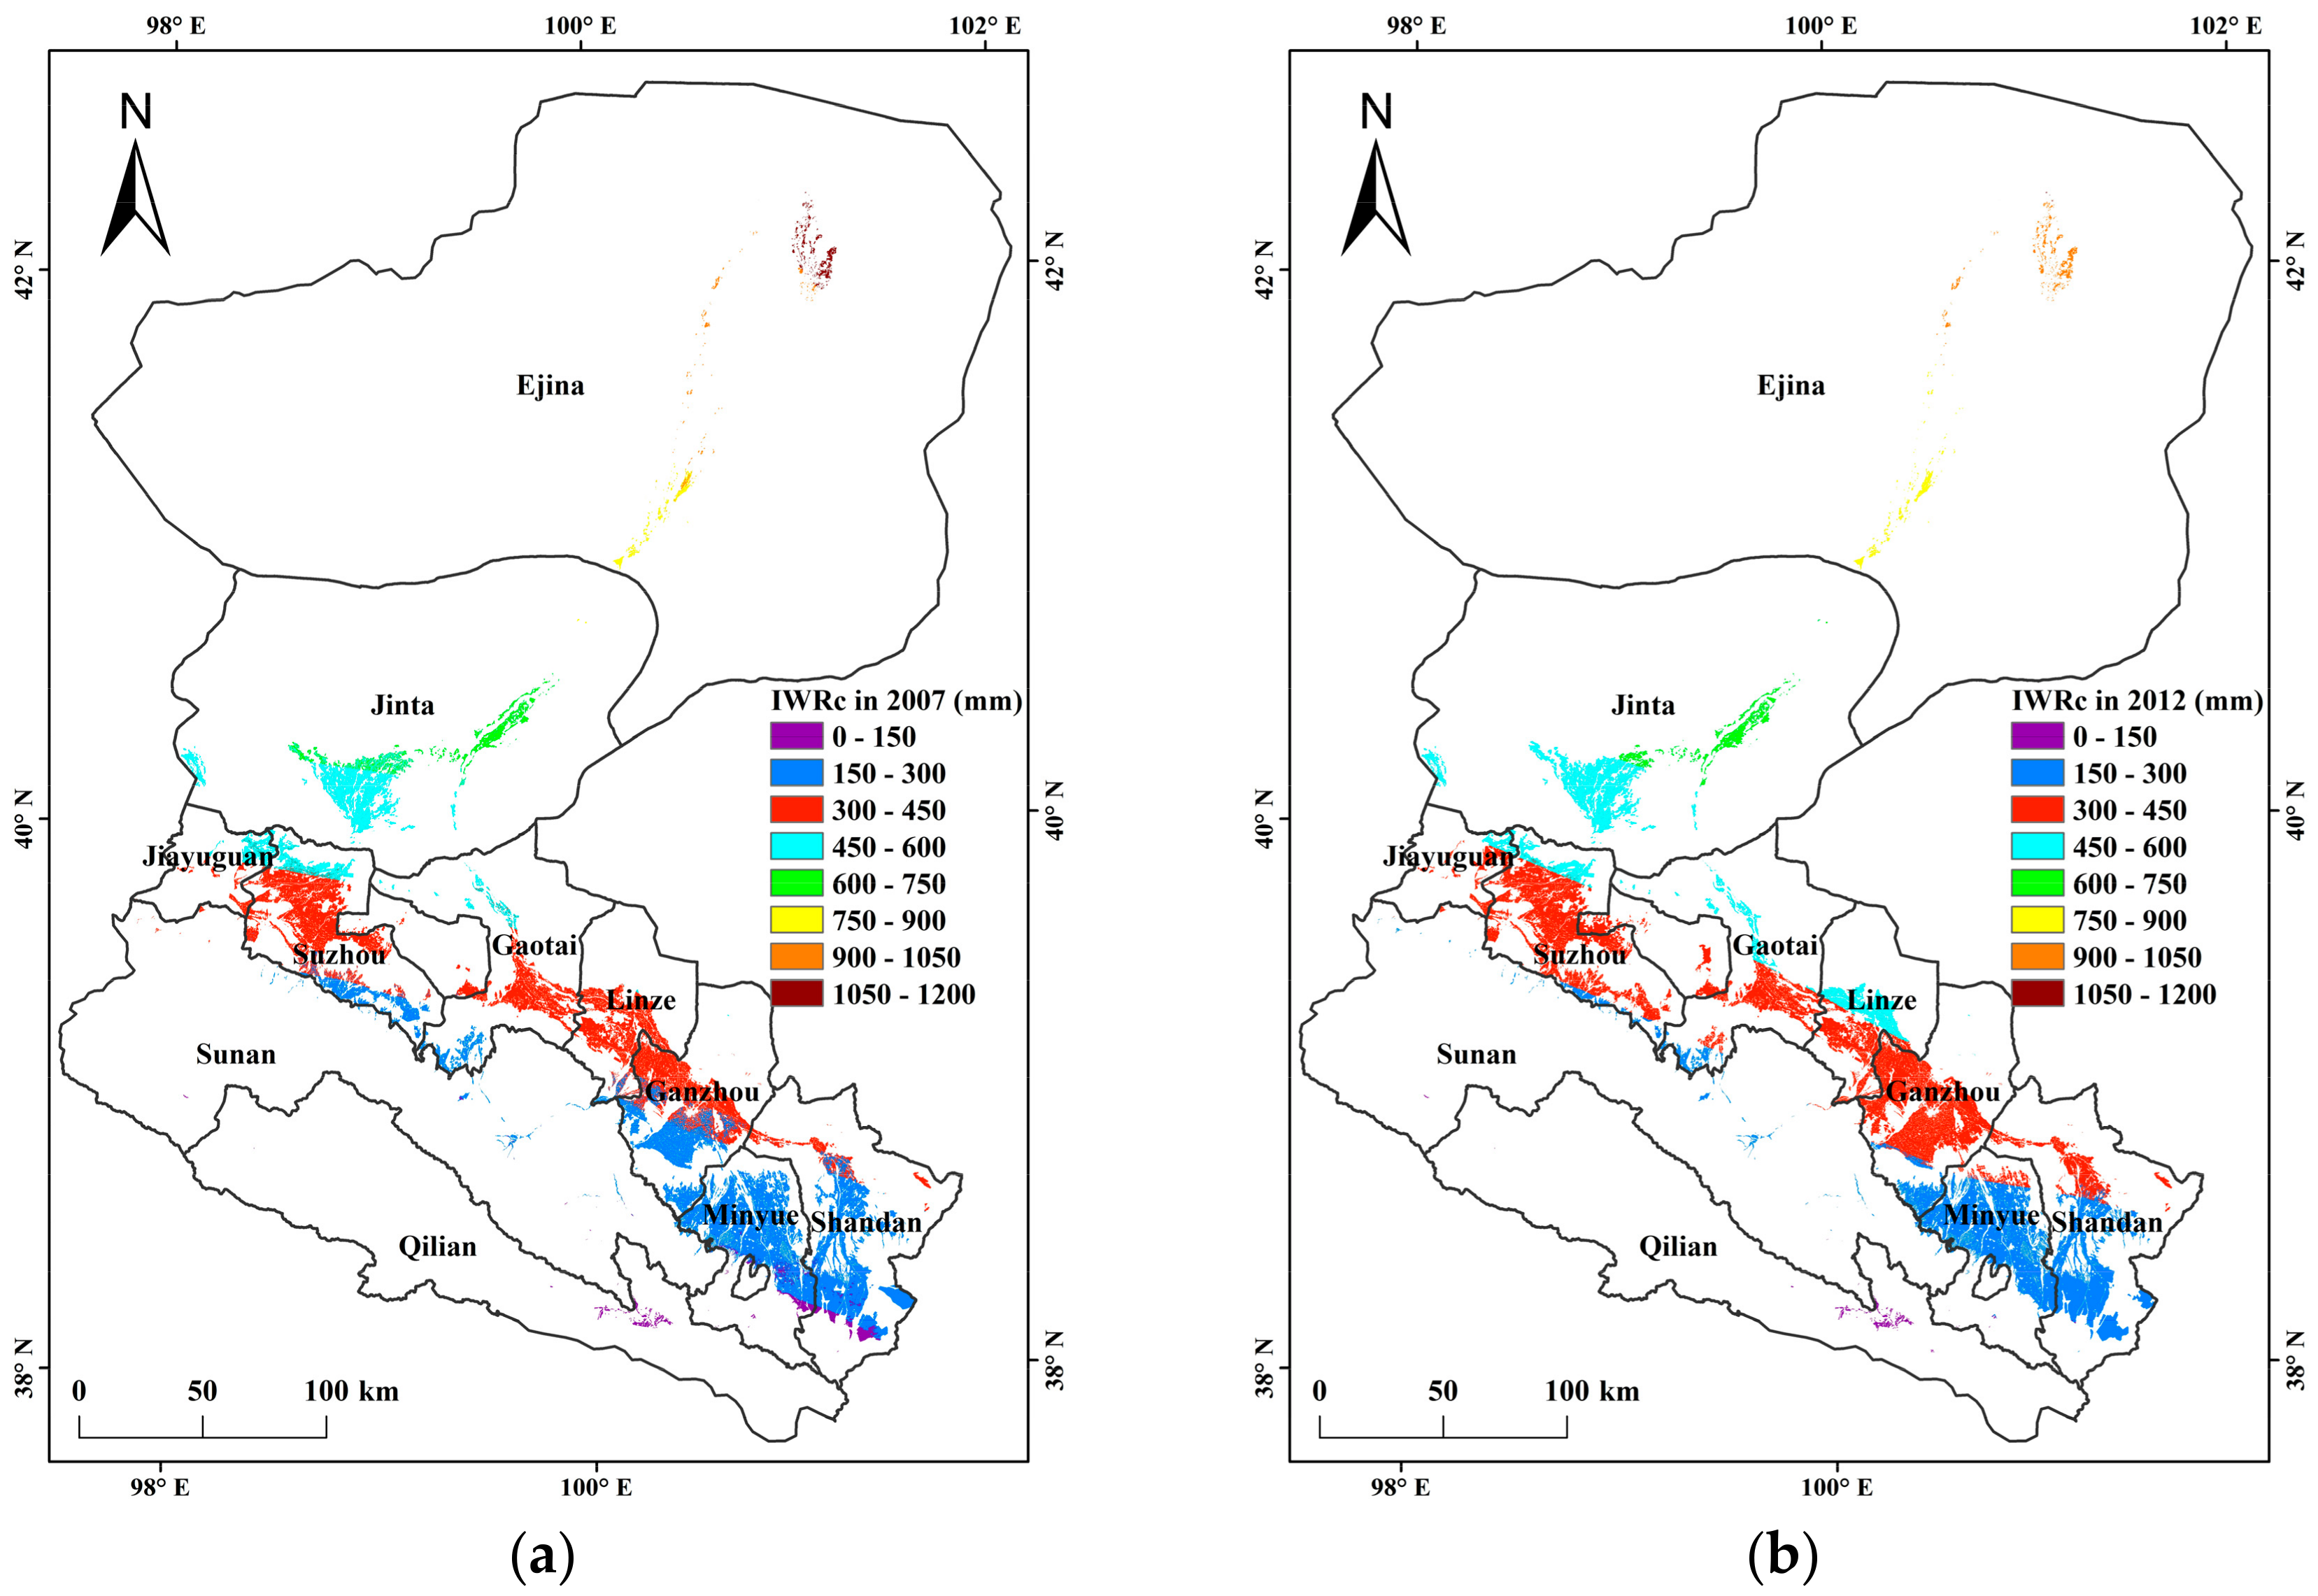
4.3. Spatiotemporal Changes in IWRc
Results show that annual IWRc values within the HRB tend to increase along an upstream-to-downstream transect (Figure 5a,b). Thus, in 2012, the number of regions with IWRc values between zero and 150 mm in the upper reaches decreased compared to 2007; a similar trend was seen in the number of regions with IWRc values between 150 and 300 mm in the middle reaches, while the values of some regions increased to between 300 and 450 mm over the time period of this study. At the same time, some regions with initial (2007) IWRc values between 300 and 450 mm increased to between 450 and 600 mm, while the number of regions with values greater than 1050 mm in the lower reaches also fell. These changes resulted in an overall increase in annual mean IWRc, from 339.95 mm in 2007 to 370.11 mm in 2012. Data also show that in both years, 2007 and 2012, mean IWRc values in May, June, and July were all higher (Figure 5c); values were 96.36, 114.01, and 88.39 mm in 2007, and 88.22, 102.34, and 94.14 mm in 2012, respectively. Considering these 2012 values (Figure 2c,d), variation in mean IWRc between the three major water-consuming months might help to ease the imbalance between irrigation water supply and demand. Data show that the mean IWRc values for March 2007, April 2007, August 2007, and September 2007 also increased, from 0.01, 4.05, 31.96, and 4.05 mm, respectively, to 0.20, 22.32, 48.99, and 13.91 mm in 2012.
The results of this study show that mean IWRc values for oilseed rape, corn, barley, and other crops also increased, from 208.43, 349.35, 229.26, and 352.85 mm, respectively, in 2007 to 241.81, 393.10, 251.17, and 378.86 mm, respectively, in 2012. In contrast, mean IWRc values for wheat decreased from 281.53 mm in 2007 to 266.69 mm in 2012 (Figure 5d). These results suggest that barley and wheat should mostly be irrigated in May and June, oilseed rape and other crops should mostly be irrigated in May, June, and July, and corn should mostly be irrigated in July and August (Figure 5e,f). Highest mean IWRc values for oilseed rape, barley, wheat, and other crops were recorded in June; mean values for 2007 were 67.20, 116.60, 122.32, and 124.03 mm, respectively, while the corresponding values for 2012 were 77.32, 119.95, 107.87, and 117.08 mm, respectively. The highest mean IWRc for corn was recorded in August; 112.04 mm in 2007 and 135.76 mm in 2012, while in 2007 and 2012, the mean IWRc of barley and wheat increased in March. Mean IWRc values of all crops increased in April and decreased in May, while the mean values for crops still growing tended to increase between August and September.
4.4. The Influence of Changes in Crop Planting Structure on IWRc
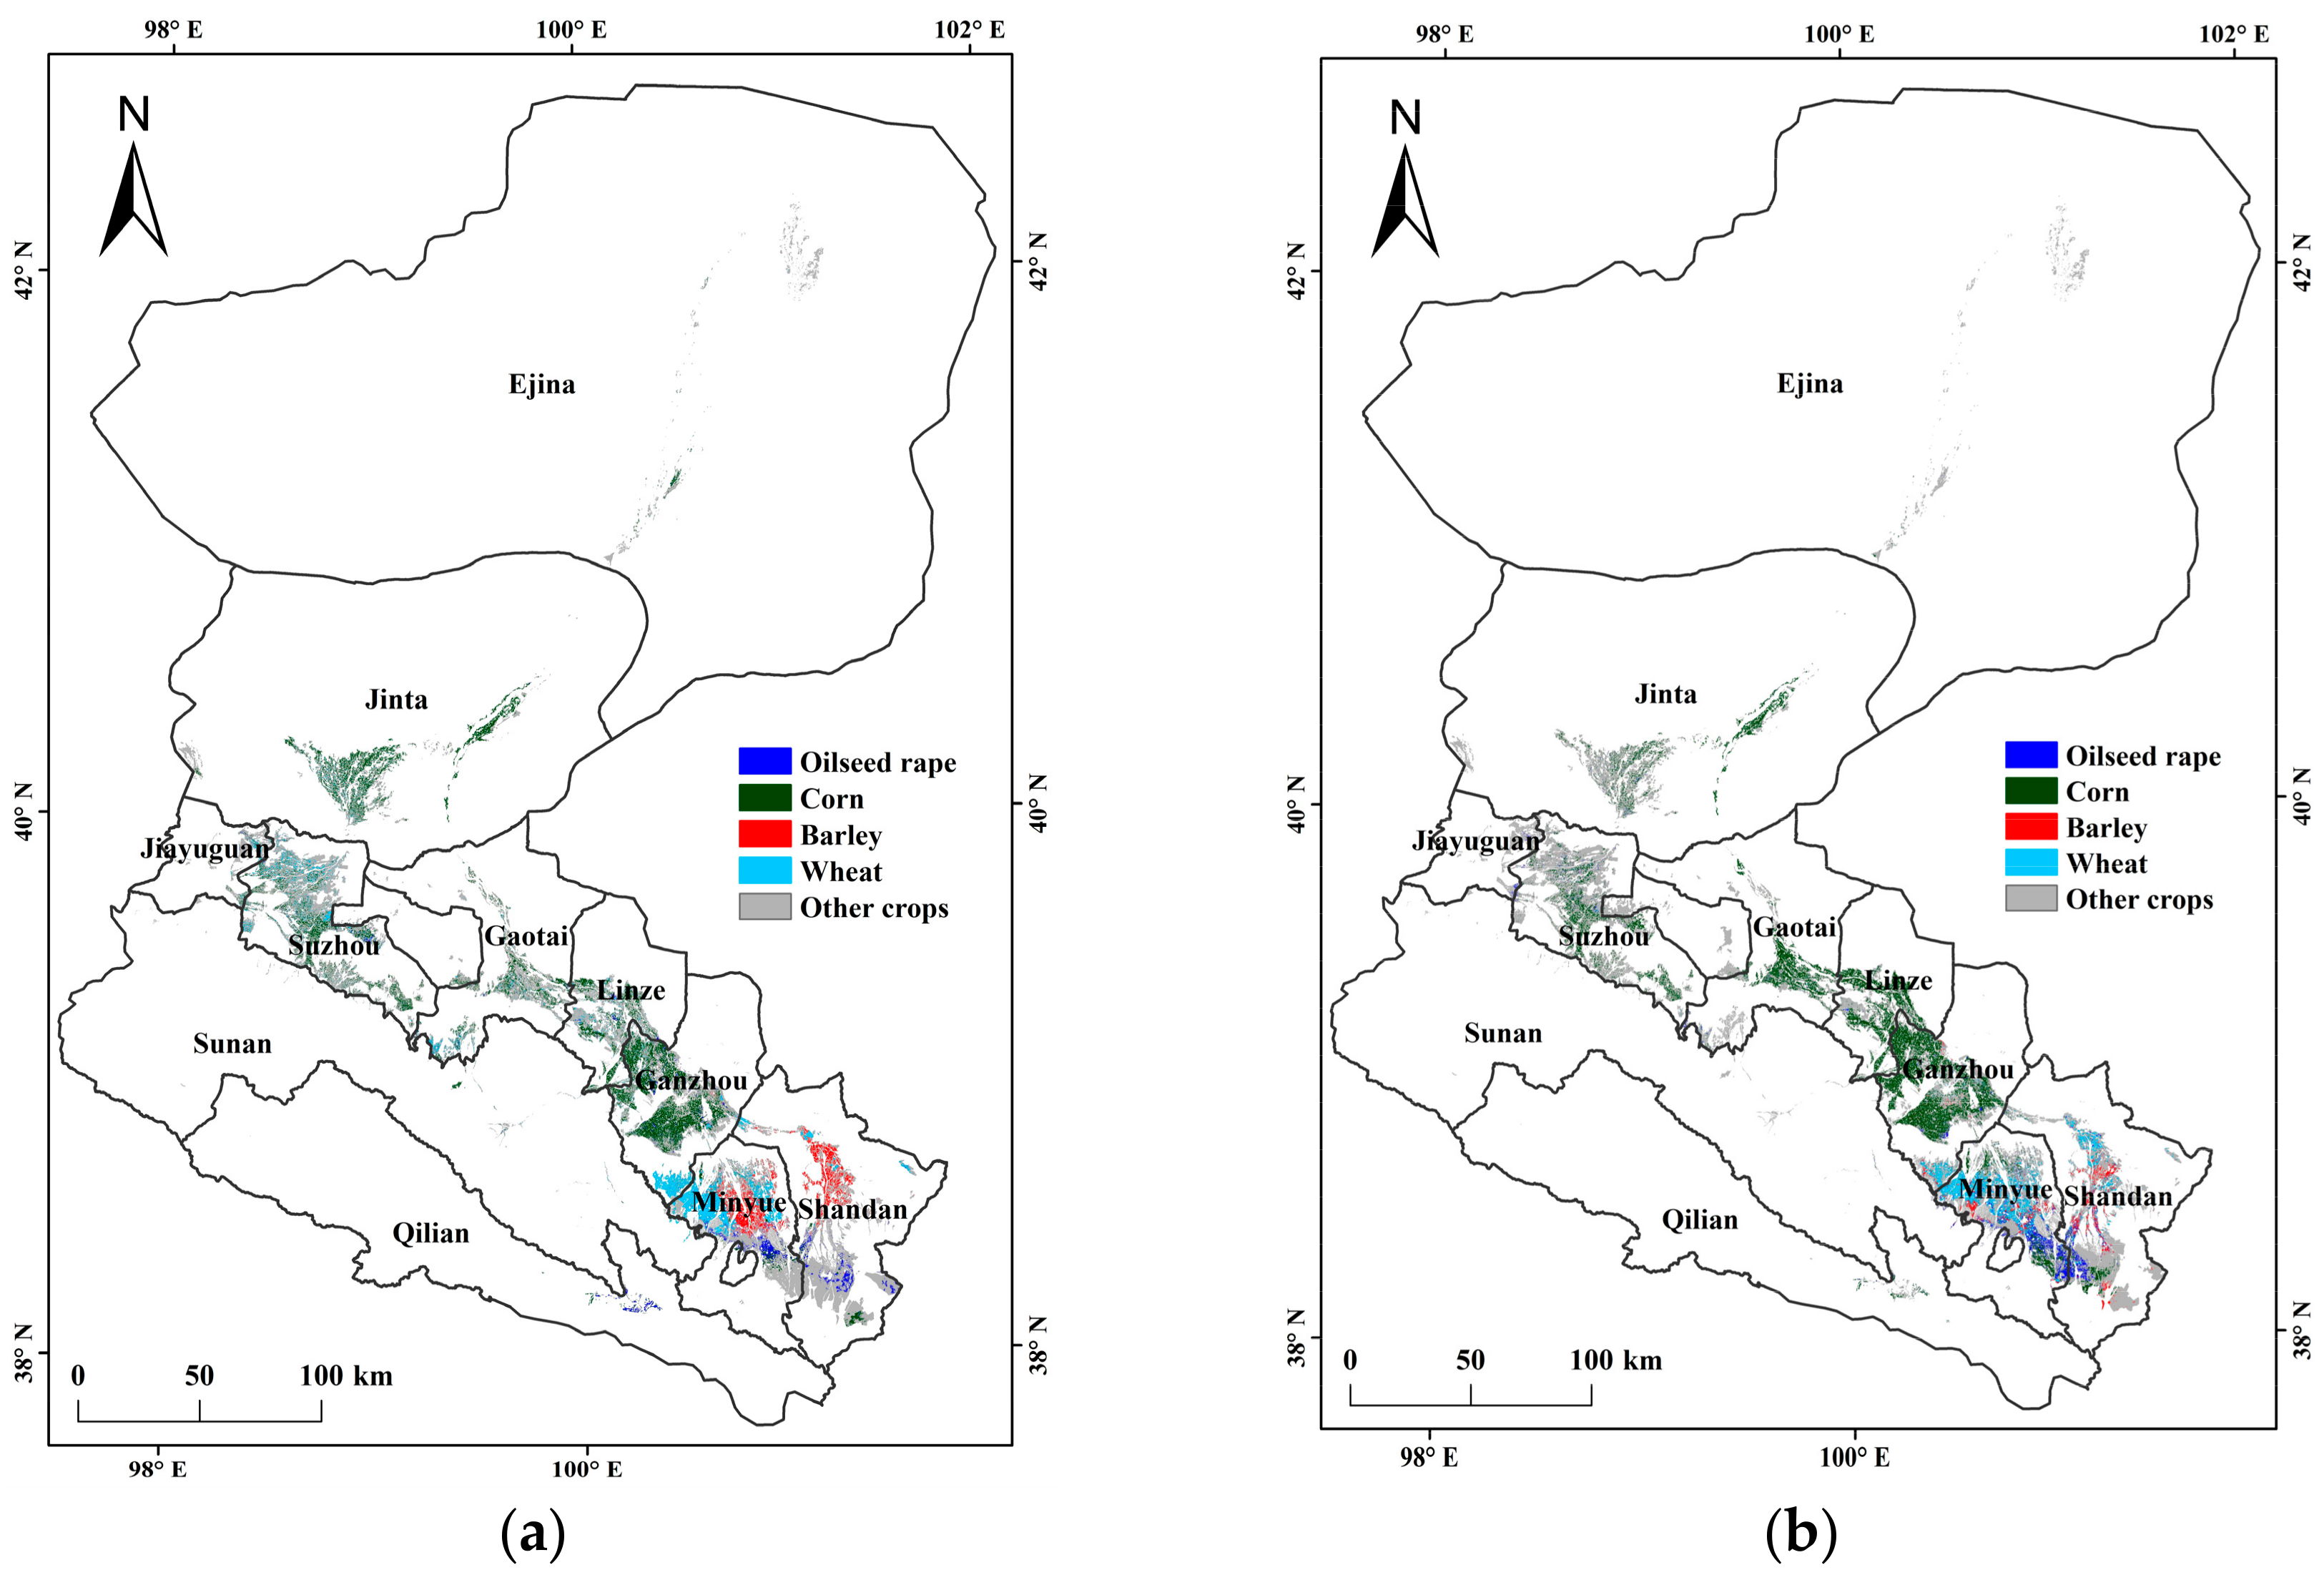
Corn is planted over the largest area within the HRB, followed by wheat, oilseed rape, and barley (Figure 6a,b). The most crop is planted mainly in Ganzhou, Linze, Gaotai, Suzhou, and Jinta counties, while oilseed rape, barley, and wheat are mainly planted in Minle and Shandan counties. Corn cultivation extends from northwestern high-latitude regions to southeastern high-elevations and planting is usually concentrated. In contrast, oilseed rape, barley, and wheat tend to be planted in a more scattered fashion within the HRB. Nevertheless, between 2007 and 2012, areas planted with oilseed rape and corn increased by 3.65 × 10³ and 31.31 × 10³ ha, respectively (Table 2), while those planted with barley, wheat, and other crops decreased by 8.08× 10³, 12.24 × 10³, and 18.51 × 10³ ha, respectively. In 2012, the cultivated land area in the HRB was 727.50 × 10³ ha, an increase of 33.15 × 10³ ha (4.77%) compared to 2007.
These changes in planting structure resulted in a IWRc increase within the HRB. Data show that in 2012, the IWRc of the HRB was 2692.58 × 106 m3, 14.07% higher than in 2007 (Table 2). At the same time, between 2007 and 2012, IWRc values for oilseed rape, corn, and other crops increased by 14.29 × 10⁶ m3 (41.88%), 174.80 × 10⁶ m3 (42.33%), and 197.67 × 10⁶ m3 (11.43%), respectively, while those for barley and wheat decreased by 15.14 × 10⁶ m3 (28.10%) and 39.46 × 10⁶ m3 (30.52%).
Data reveal a relatively large increase in the area of planted corn between 2007 and 2012 in Ganzhou, Linze, and Gaotai counties; 12,180.06, 11,941.02, and 11,941.02 ha, respectively. Over the same period, the corresponding area of planted corn in Jinta County decreased by 8135.37 ha (Table 3), while the area of planted wheat increased in just Minle and Shandan counties; 915.30 and 5092.83 ha, respectively. The areas of wheat cultivation in Ganzhou and Suzhou counties decreased significantly, by 4219.29 and 6805.26 ha, respectively, while planted areas of barley decreased by 6340.59 and 3591.54 ha, respectively, in Minle and Shandan counties and increased by 1418.31 ha in Ganzhou County. The planted area of oilseed rape in Minle County increased by as much as 5086.26 ha, but decreased significantly by 1157.58 and 1211.58 ha in Ganzhou and Qilian counties, respectively. The planted areas of other crops increased by 10,312.63 and 10,678.99 ha in Sunan and Jinta counties, respectively, but decreased by 7115.14 and 4298.19 ha in Linze and Gaotai counties, respectively. Changes to crop planting structures resulted in increased IWRc values in Ganzhou, Minle, Shandan, Linze, Gaotai, Sunan, Suzhou, Jinta, and Qilian counties; increases of 99.01 × 10⁶, 65.59 × 10⁶, 39.53 × 10⁶, 34.37 × 10⁶, 40.22 × 10⁶, 16.16 × 10⁶, 5.41 × 10⁶, and 1.33 × 10⁶ m3, respectively. Over the same time period, however, IWRc values decreased in Jiayuguan and Egina counties; reductions of 1.51 × 10⁶ and 6.80 × 10⁶ m3, respectively.
Changes in crop planting between 2007 and 2012 in the HRB resulted in an IWRc increase of 76.77 × 10⁶ m3, 23.11% of the total (Table 4). The area of corn transferred from other crop types was the largest, up to 72.58 × 10³ ha, accounting for 29.22 × 10⁶ m3 (8.80%) of the total IWRc increment. The areas of other crops transferred from oilseed rape, corn, barley, and wheat were also relatively large, 8.16 × 10³, 46.25 × 10³, 11.27 × 10³, and 26.41 × 10³ ha, respectively; these equate to contributions of 13.91 × 10⁶ m3 (4.19%), 13.65 × 10⁶ m3 (4.11%), 16.86 × 10⁶ m3 (5.08%), and 25.71 × 10⁶ m3 (7.74%) of the total IWRc increment, respectively. In contrast, transfer of other crops to oilseed rape, barley, and wheat were largely negative in their contributions, decreasing the total IWRc increment within the HRB by 14.97 × 10⁶ m3 (4.51%), 8.25 × 10⁶ m3 (2.48%), and 10.07 × 10⁶ m3 (3.03%), respectively. The remaining change in total IWRc, 76.89% (255.39 × 10⁶ m3), was the direct result of the cultivated land expansion (i.e., the transfer of other land use types to agriculture).
5. Discussion
5.1. Reasons for IWRc Changes
Our results show that changes in crop planting structure are the main explanation for increasing IWRc values within the HRB; specifically, the expansion of cultivated land has made the largest contribution to this increase. This result is important because in order to generate additional economic benefits, farmers often choose to either reclaim cultivated land or adjust the types of crops grown on existing land [45]. Our results show that a rapid expansion in cultivated land leads directly to increased crop irrigation requirements. The dominant crop in the HRB is seed corn, an agricultural product with higher economic benefits than oilseed rape, barley, or wheat. This crop, however, also consumes far more water than others; thus, increasing the planted area of corn (high water consumption) while decreasing the planted areas of barley and wheat (low water consumption) will only serve to further increase the IWRc in the HRB.
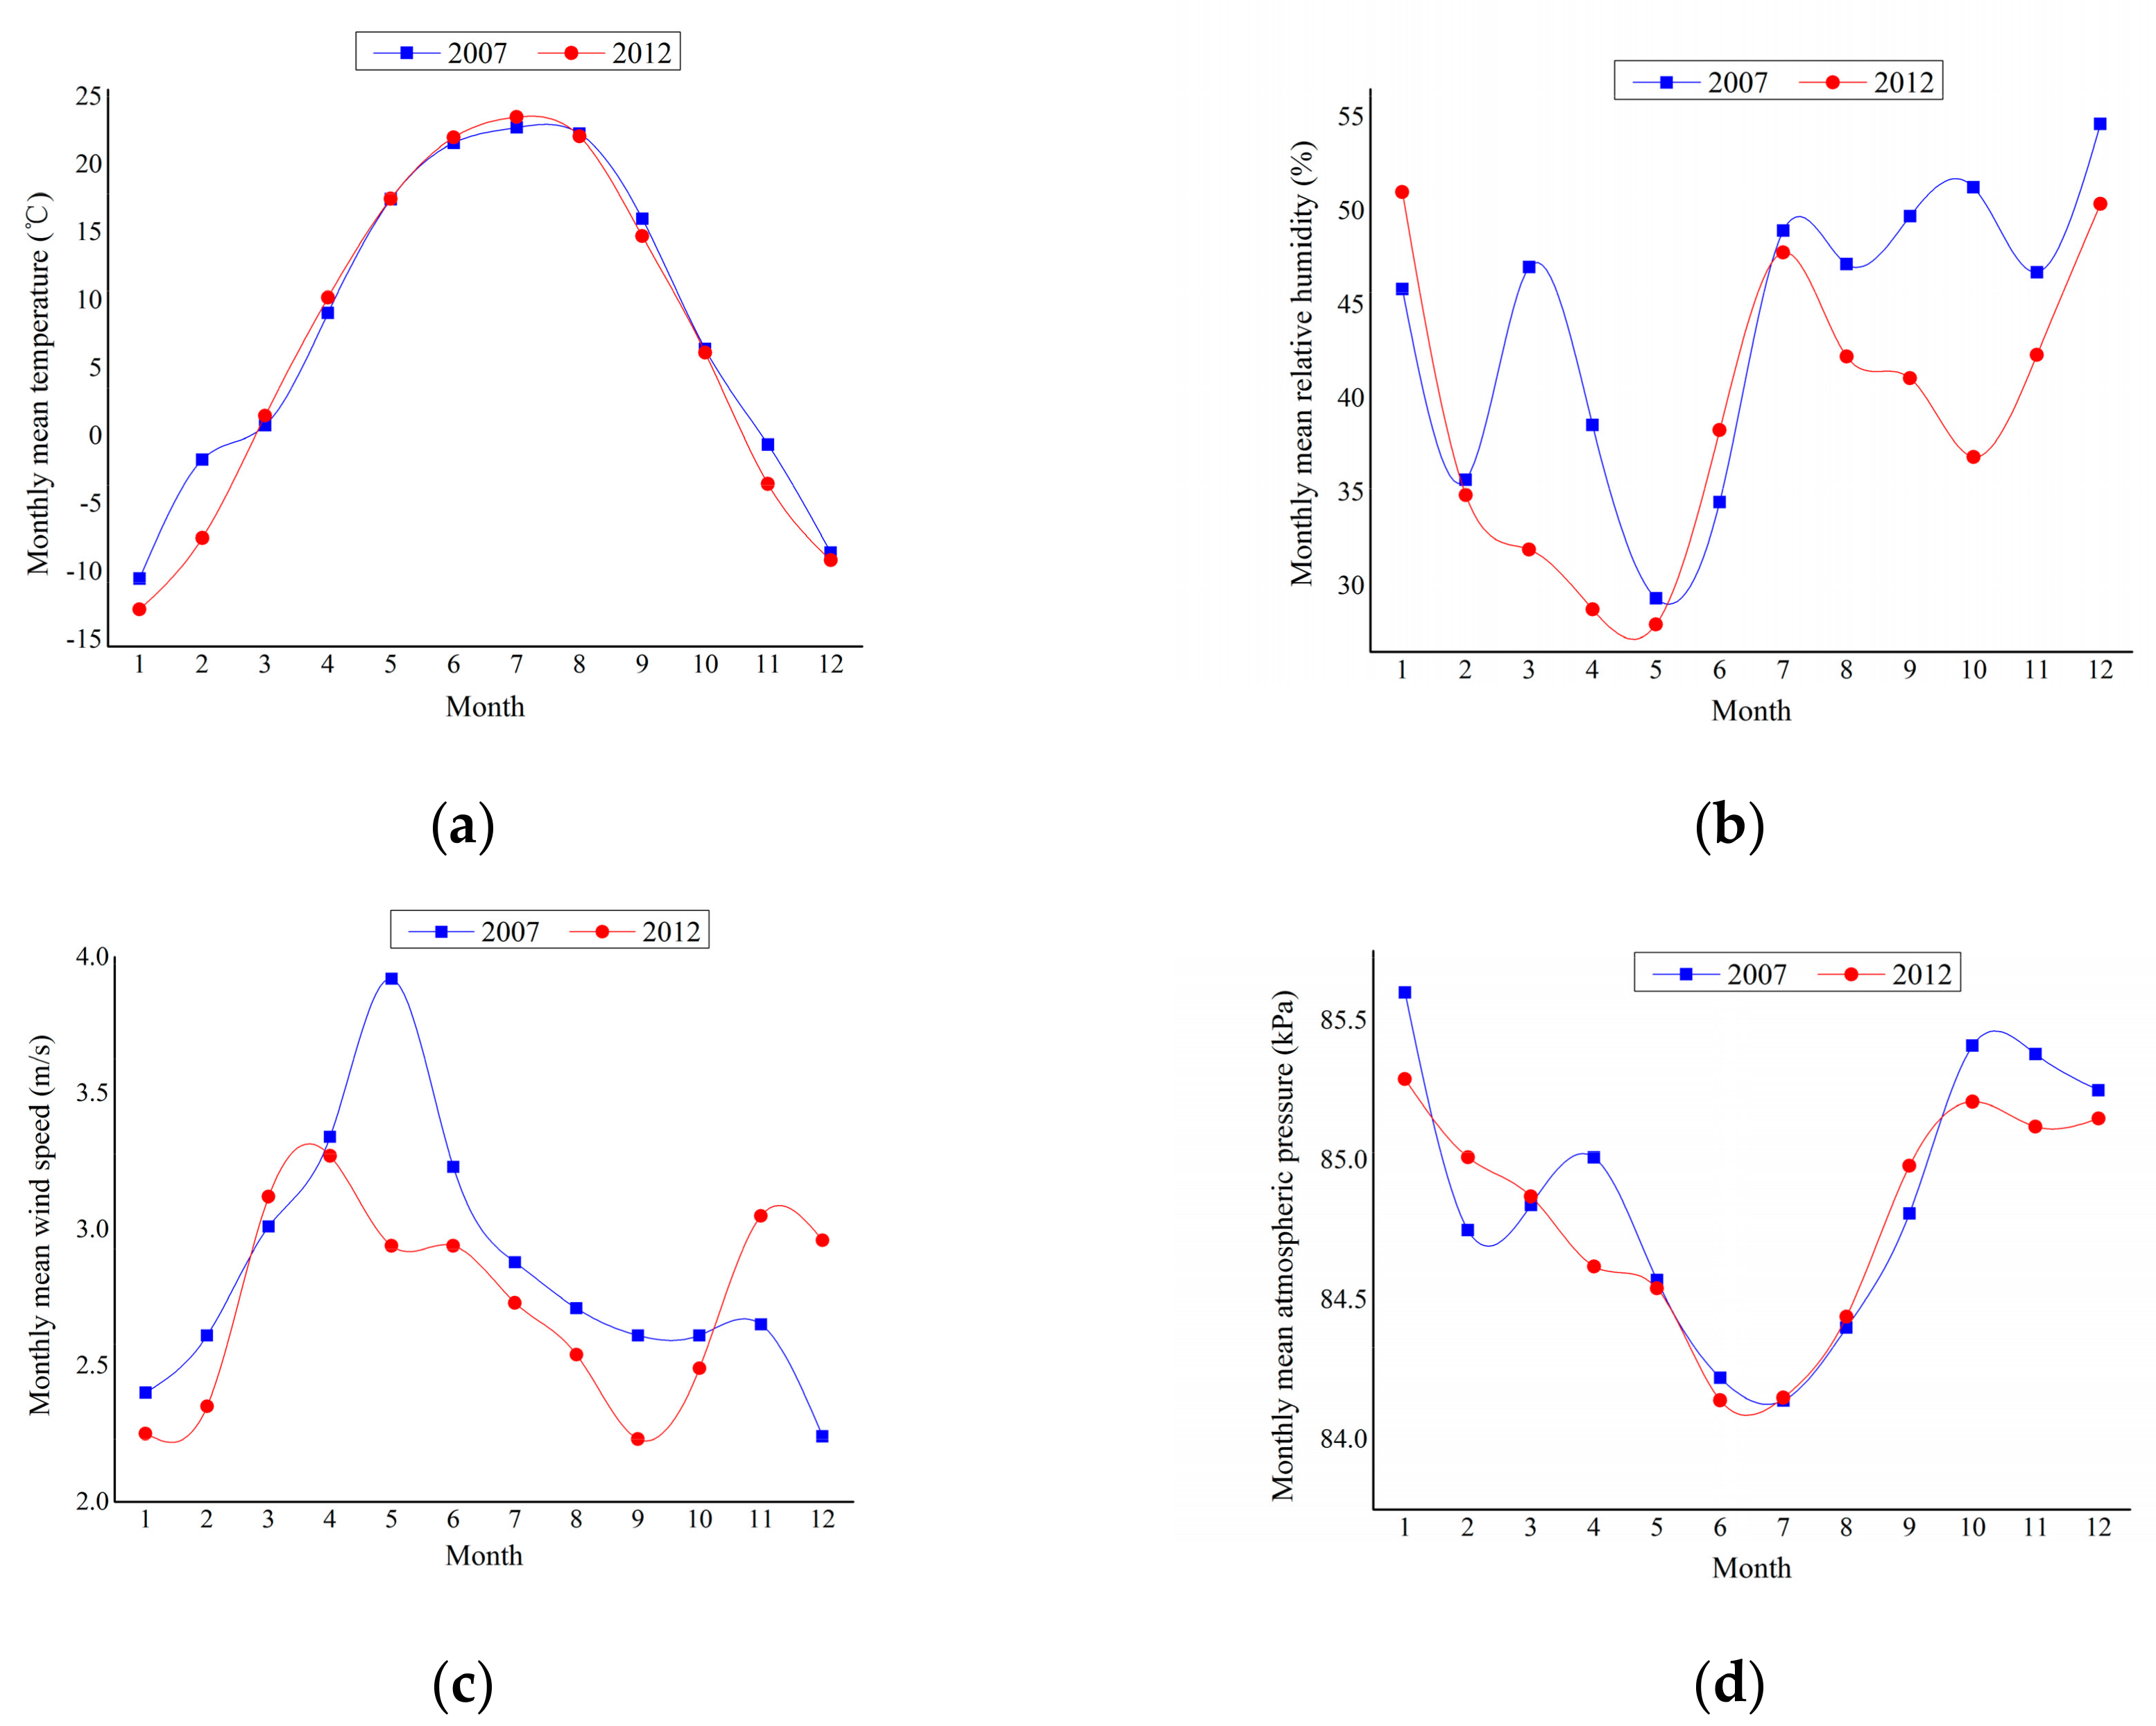
Variation in IWRc of the same crop over time due of climate change is another factor that underlies the overall increase in these values within the HRB. Climatic factors, such as monthly mean temperature, relative humidity, wind speed, and atmospheric pressure all directly influence ETo and indirectly IWRc [54]. The data presented in this study show that temporal changes in monthly mean temperature and atmospheric pressure were more regular in the HRB than the other two factors in both 2007 and 2012 (Figure 7). Temperature exerts a positive controlling influence on ETo; both ETo loss and IWRc are enhanced in warm compared to cold weather (Figure 7a). Besides, both relative humidity and wind speed influence vapor removal; water vapor is stored in humid air, while wind promotes the transport of water allowing more water vapour to be taken up (Figure 7b,c). Although tending to fluctuate in the same place very little over time, atmospheric pressure nevertheless determines the psychrometric constant, which is negatively correlated with both ETo and IWRc (Figure 7d). Thus, as a result of the joint impacts of crop planting structure and climate changes, IWRc values per unit area of oilseed rape, corn, barley, and other crops all increased between 2007 and 2012, and caused a concomitant overall increase across the whole HRB.
5.2. Policy Implications
Agriculture is the sector that consumes the most water in the HRB. Thus, the management of agricultural water based on sequential variation and spatial differences in IWRc, as well as differences due to crop types, will directly determine sustainable development of both the social economy and ecological system. Data show that IWRc values for the same crop vary depending on growth stage; in other words, crop water requirements are highest during the middle growth stage but are lower during early and late stages. According to our field survey results, most farmers currently do not take sequential variation in IWRc into account when irrigating their crops. This means that both irrigation time and water supply do not correspond with the actual water requirements of crops and result in the inefficient use of irrigation water. Thus, in order to efficiently allocate and utilize available agricultural water, it will be necessary to adjust both irrigation times and volumes based on sequential variations in IWRc.
The results of this study show that IWRc values gradually increased between 2007 and 2012 along an upstream-to-downstream transect; this means that, especially in arid areas where water is extremely scarce, IWRc values exceeded 1000 mm. We therefore recommend that agricultural production in the lower reaches of the HRB should at least be reduced to preserve water and enhance ecological conservation. Unfortunately, however, the area of cultivated land in the lower reaches of the HRB expanded unreasonably between 2007 and 2012. It is therefore critical to establish a more effective mechanism of ecological compensation [56,57] that enables farmers to abandon crop cultivation in the lower reaches of the HRB.
Our results show that over the time period of this study and driven by economic interests, cultivated areas of autumn crops (e.g., oilseed rape and corn) increased, while those of summer crops (e.g., barley and wheat) decreased; these changes led to a decrease in IWRc during May and June within the HRB and a concomitant increase in July. As the volumes of rainfall and runoff water within the HRB are largest and concentrated in June, July, and August, such a change to crop planting structures would help to ease the imbalance between water supply and demand. At the same time, however, results show that IWRc values for corn were significantly higher than those for the other major crops; thus, a rapid expansion in the area of cultivated corn would only serve to intensify the water supply imbalance [44]. We argue that a continuous increase in the area of cultivated corn is not feasible; rather, it is crucial to minimize the cultivation of water-intensive crops and the expansion of cultivated land, emphasizing instead the husbandry of plants that require less water [45,58,59].
5.3. The Merits and Drawbacks of this Study
Compared with previous research on IWRc [31,32,33], we not only calculated this value for a variety of crops in this study, but also evaluated the month-by-month spatiotemporal distribution of these values. Thus, the spatiotemporal IWRc patterns obtained in this research, (based on crop planting structures and at a spatial resolution of 30 m) are likely to aid both managers and producers to reasonably and efficiently allocate and use agricultural water in temporal and spatial sequences that coincide with differences between crop types.
However, as this study classified all crops other than oilseed rape, corn, barley, and wheat as ‘other crops’, it was not possible to obtain accurate growing stage and crop coefficients. We therefore estimated IWRc values for other crops based on the growing stages and mean Kc values of the main crops. This is a drawback of our study as this grouping will have involved some plants with relatively low water consumption as well as fallow cultivated land; this means that our processing method, use of mean Kc values, may have consequently overestimated the duration of each growing stage and Kc values for other crops. This would therefore have resulted in overestimates of IWRc for 2007 and 2012 as well as for the whole HRB. It is also clear that, in addition to changes in crop planting structures, crop IWRc per unit area will also vary with time; these two factors will both affect spatiotemporal IWRc patterns. We did not exclude the influence of variation in crop IWRc per unit area in this study when analyzing the influences of crop planting structure changes, a feature of this research that will require further attention. Finally, this research is also limited by the time period we considered, just between 2007 and 2012. Our aim in future studies is to estimate the IWRc of the HRB over a longer time period. Furthermore, predicting future IWRc changes associated with crop conversion potentials [45] will also be critical for the integrated water resource management of river basins, especially in arid and semi-arid areas.
6. Conclusions
Water resources are intimately related to regional sustainable development and ecological security. Water wastage and inefficient use in regions subject to shortages results in serious negative economic, social, and ecological impacts. Typical for an inland river basin in an arid or semi-arid area, water consumption for crop irrigation in the HRB accounts for more than 80% of total regional consumption. It is therefore critical to understand the differences and variation in IWRc temporally, spatially, and in terms of different crop types. We used the spatiotemporal distribution of crop planting structures to estimate spatiotemporal IWRc values for 2007 and 2012 in the HRB. To do this, we used the FAO Penman-Monteith method, revealed the characteristics of spatiotemporal variation in IWRc, and analyzed the resultant impacts of crop planting structure changes.
The results of this study show that the IWRc within the HRB varied between zero and 1250 mm and that the amplitude of variation increased along an upstream-to-downstream transect. Values for IWRc in the lower reaches of the HRB were as high as 1000 mm, which suggests that agricultural production in this region should be minimized in order to save water for ecological conservation. Data show that the annual mean IWRc of the HRB increased from 339.95 mm in 2007 to 370.11 mm in 2012; at the same time, monthly mean IWRc initially increased before gradually decreasing with the highest values each year seen in June. Between 2007 and 2012, IWRc values in May and June decreased by 8.14 and 11.67 mm, respectively, while those for July increased by 5.75 mm. As the ER in May and June is less than that in July, this change in IWRc might be useful to help alleviate the imbalance between water supply and demand for irrigation. In terms of crop types, IWRc values for corn were significantly higher than those for oilseed rape, barley, and wheat; nevertheless, mean IWRc values of oilseed rape, corn, barley, and other crops increased, respectively, from 208.43, 349.35, 229.26, and 352.85 mm in 2007 to 241.81, 393.10, 251.17, and 378.86 mm in 2012. At the same time, the mean IWRc for wheat decreased from 281.53 mm in 2007 to 266.69 mm in 2012. Therefore, in order to efficiently manage and utilize agricultural water, we argue that it is necessary to adjust both irrigation times and amounts in different areas depending on the differences and characteristics of IWRc variation temporally, spatially, and by crop types.
To increase their economic benefits, farmers have tended to adjust planting structures to favor more profitable crops that also need more water (e.g., corn) or reclaim more cropland. Our data show that planting structure changes took place within the HRB between 2007 and 2012 to increase areas of corn and oilseed rape, while simultaneously decreasing areas of planted barley and wheat and expanding the cultivated land area. These changes resulted in an IWRc increase from 2360.42 × 106 m3 in 2007 to 2692.58 × 106 m3 in 2012, corresponding to an increase by 332.16 × 10⁶ m3 (14.07%). Data show that 23.11% (76.77 × 10⁶ m3) of this change can be explained by crop type transfers, and that the remaining 76.89% (255.39 × 10⁶ m3) was caused by the rapid expansion of cultivated land. Although farmers obtained economic benefits in the short term, this approach was not conducive to maintaining the sustainable development and ecological security of the HRB. We recommend that, in future, the cultivation of water-demanding crops and the expansion of cultivated land should be kept to a minimum.
The analysis of spatiotemporal changes in IWRc presented in this paper will enable both managers and producers to develop more efficient irrigation strategies that those presently available in the absence of these data. Future research is nevertheless essential for the integrated management of water resources in river basins. Studies should include estimating large scale spatial (e.g., at the national or global scale) IWRc over longer time periods, predicting future IWRc changes associated with crop conversion potential, and the multi-objective optimization of water resources between agriculture and other sectors in light of different scenarios for development. All of these directions are essential if we are to guarantee regional and global sustainability.
Acknowledgments
The research was supported by the National Natural Science Foundation of China (Grant Nos. 91325302, 91325303 and 41671177).
Author Contributions
Wei Song designed the research. Yaqun Liu processed the data, developed the methodology, performed the research, and wrote the manuscript. Wei Song reviewed the paper and supported the analysis of the results. Wei Song and Xiangzheng Deng supervised the research and contributed with valuable discussions and scientific advice.
Conflicts of Interest
The authors declare no conflict of interest.
References
- Xu, Q.; Song, W.; Zhang, Y. Forecast and optimal allocation of production, living and ecology water consumption in Zhangye, China. Phys. Chem. Earth 2016, 96, 16–25. [Google Scholar] [CrossRef]
- Li, Z.H.; Deng, X.Z.; Wu, F.; Hasan, S.S. Scenario analysis for water resources in response to land use change in the middle and upper reaches of the Heihe River Basin. Sustainability 2015, 7, 3086–3108. [Google Scholar] [CrossRef]
- Bekchanov, M.; Karimov, A.; Lamers, J.P.A. Impact of water availability on land and water productivity: A temporal and spatial analysis of the case study region Khorezm, Uzbekistan. Water 2010, 2, 668–684. [Google Scholar] [CrossRef]
- Mancosu, N.; Snyder, R.L.; Kyriakakis, G.; Spano, D. Water scarcity and future challenges for food production. Water 2015, 7, 975–992. [Google Scholar] [CrossRef]
- Vorosmarty, C.J.; Green, P.; Salisbury, J.; Lammers, R.B. Global water resources: Vulnerability from climate change and population growth. Science 2000, 289, 284–288. [Google Scholar] [CrossRef] [PubMed]
- Wallace, J.S. Increasing agricultural water use efficiency to meet future food production. Agric. Ecosyst. Environ. 2000, 82, 105–119. [Google Scholar] [CrossRef]
- Song, W.; Pijanowski, B.C. The effects of China’s cultivated land balance program on potential land productivity at a national scale. Appl. Geogr. 2014, 46, 158–170. [Google Scholar] [CrossRef]
- Lee, J.L.; Huang, W.C. Impact of climate change on the irrigation water requirement in northern Taiwan. Water 2014, 6, 3339–3361. [Google Scholar] [CrossRef]
- Deng, X.Z.; Shi, Q.L.; Zhang, Q.; Shi, C.C.; Yin, F. Impacts of land use and land cover changes on surface energy and water balance in the Heihe River Basin of China, 2000–2010. Phys. Chem. Earth 2015, 79–82, 2–10. [Google Scholar] [CrossRef]
- Song, W.; Pijanowski, B.C.; Tayyebi, A. Urban expansion and its consumption of high-quality farmland in Beijing, China. Ecol. Indic. 2015, 54, 60–70. [Google Scholar] [CrossRef]
- Yu, B.H.; Song, W.; Lang, Y.Q. Spatial patterns and driving forces of greenhouse land change in Shouguang City, China. Sustainability 2017, 9, 359. [Google Scholar] [CrossRef]
- Teshager, A.D.; Gassman, P.W.; Schoof, J.T.; Secchi, S. Assessment of impacts of agricultural and climate change scenarios on watershed water quantity and quality, and crop production. Hydrol. Earth Syst. Sci. 2016, 20, 3325–3342. [Google Scholar] [CrossRef]
- Du, Y.H.; Berndtsson, R.; An, D.; Zhang, L.; Hao, Z.C.; Yuan, F.F. Hydrologic response of climate change in the source region of the Yangtze River, based on water balance analysis. Water 2017, 9, 115. [Google Scholar] [CrossRef]
- Ning, T.T.; Li, Z.; Liu, W.Z. Vegetation dynamics and climate seasonality jointly control the interannual catchment water balance in the Loess Plateau under the Budyko framework. Hydrol. Earth Syst. Sci. 2017, 21, 1515–1526. [Google Scholar] [CrossRef]
- Fan, L.; Lu, C.H.; Yang, B.; Chen, Z. Long-term trends of precipitation in the North China Plain. J. Geogr. Sci. 2012, 22, 989–1001. [Google Scholar] [CrossRef]
- Shi, Q.L.; Chen, S.Y.; Shi, C.C.; Wang, Z.; Deng, X.Z. The impact of industrial transformation on water use efficiency in northwest region of China. Sustainability 2015, 7, 56–74. [Google Scholar] [CrossRef]
- Deng, X.P.; Shan, L.; Zhang, H.P.; Turner, N.C. Improving agricultural water use efficiency in arid and semiarid areas of China. Agric. Water Manag. 2006, 80, 23–40. [Google Scholar] [CrossRef]
- De Wit, M.; Stankiewicz, J. Changes in surface water supply across Africa with predicted climate change. Science 2006, 311, 1917–1921. [Google Scholar] [CrossRef] [PubMed]
- Jenerette, G.D.; Larsen, L. A global perspective on changing sustainable urban water supplies. Glob. Planet Chang. 2006, 50, 202–211. [Google Scholar] [CrossRef]
- Song, W.; Deng, X.Z. Land-use/land-cover change and ecosystem service provision in China. Sci. Total Environ. 2017, 576, 705–719. [Google Scholar] [CrossRef] [PubMed]
- Tao, F.L.; Yokozawa, M.; Hayashi, Y.; Lin, E.D. A perspective on water resources in China: Interactions between climate change and soil degradation. Clim. Chang. 2005, 68, 169–197. [Google Scholar] [CrossRef]
- Qi, S.Z.; Luo, F. Water environmental degradation of the Heihe River Basin in arid northwestern China. Environ. Monit. Assess. 2005, 108, 205–215. [Google Scholar] [CrossRef] [PubMed]
- Yang, F.B.; Lu, C.H. Spatiotemporal variation and trends in rainfall erosivity in China’s dryland region during 1961–2012. Catena 2015, 133, 362–372. [Google Scholar] [CrossRef]
- Vorosmarty, C.J.; Willmott, C.J.; Choudhury, B.J.; Schloss, A.L.; Stearns, T.K.; Robeson, S.M.; Dorman, T.J. Analyzing the discharge regime of a large tropical river through remote sensing, ground-based climatic data, and modeling. Water Resour. Res. 1996, 32, 3137–3150. [Google Scholar] [CrossRef]
- Uniyal, B.; Jha, M.; Verma, A. Assessing climate change impact on water balance components of a river basin using SWAT model. Water Resour. Manag. 2015, 29, 4767–4785. [Google Scholar] [CrossRef]
- Van Beusekom, A.E.; Viger, R.J. A glacier runoff extension to the Precipitation Runoff Modeling System. J. Geophys. Res. 2016, 121, 2001–2021. [Google Scholar] [CrossRef]
- Kavvas, M.L.; Chen, Z.Q.; Tan, L.; Soong, S.T.; Terakawa, A.; Yoshitani, J.; Fukami, K. A regional-scale land surface parameterization based on areally-meand hydrological conservation equations. Hydrol. Sci. J. 1998, 43, 611–631. [Google Scholar] [CrossRef]
- Zhou, Q.; Wu, F.; Zhang, Q. Is irrigation water price an effective leverage for water management? An empirical study in the middle reaches of the Heihe River basin. Phys. Chem. Earth 2015, 89–90, 25–32. [Google Scholar] [CrossRef]
- Ge, L.Q.; Li, S.M.; Xie, G.D.; Cheng, Y.P.; Ni, Z.S. The population carrying capacity of waters ecosystem in China. J. Resour. Ecol. 2016, 7, 21–27. [Google Scholar]
- Ye, Q.; Yang, X.G.; Dai, S.W.; Chen, G.S.; Li, Y.; Zhanga, C.X. Effects of climate change on suitable rice cropping areas, cropping systems and crop water requirements in southern China. Agric. Water Manag. 2015, 159, 35–44. [Google Scholar] [CrossRef]
- Shrestha, L.; Shrestha, N.K. Assessment of climate change impact on crop yield and irrigation water requirement of two major cereal crops (rice and wheat) in Bhaktapur district, Nepal. J. Water Clim. Chang. 2017, 8, 320–335. [Google Scholar] [CrossRef]
- Rotich, S.C.; Mulungu, D.M.M. Adaptation to climate change impacts on crop water requirements in Kikafu catchment, Tanzania. J. Water Clim. Chang. 2017, 8, 274–292. [Google Scholar] [CrossRef]
- Luo, X.P.; Xia, J.; Yang, H. Modeling water requirements of major crops and their responses to climate change in the North China Plain. Environ. Earth Sci. 2015, 74, 3531–3541. [Google Scholar] [CrossRef]
- Bocchiola, D. Impact of potential climate change on crop yield and water footprint of rice in the Po valley of Italy. Agric. Syst. 2015, 139, 223–237. [Google Scholar] [CrossRef]
- Shen, Y.J.; Li, S.; Chen, Y.N.; Qi, Y.Q.; Zhang, S.W. Estimation of regional irrigation water requirement and water supply risk in the arid region of Northwestern China 1989–2010. Agric. Water Manag. 2013, 128, 55–64. [Google Scholar] [CrossRef]
- Yang, Y.M.; Liu, D.L.; Anwar, M.R.; O’Leary, G.; Macadam, I.; Yang, Y.H. Water use efficiency and crop water balance of rainfed wheat in a semi-arid environment: Sensitivity of future changes to projected climate changes and soil type. Theor. Appl. Climatol. 2016, 123, 565–579. [Google Scholar] [CrossRef]
- Lu, C.H.; Fan, L. Winter wheat yield potentials and yield gaps in the North China Plain. Field Crop. Res. 2013, 143, 98–105. [Google Scholar] [CrossRef]
- Jin, T.; Qing, X.Y.; Huang, L.Y. Changes in grain production and the optimal spatial allocation of water resources in China. J. Resour. Ecol. 2016, 7, 28–35. [Google Scholar]
- Lang, Y.Q.; Song, W.; Zhang, Y. Responses of the water-yield ecosystem service to climate and land use change in Sancha River Basin, China. Phys. Chem. Earth 2017. [Google Scholar] [CrossRef]
- Deng, X.Z.; Singh, R.B.; Liu, J.G.; Guneralp, B. Water productivity and integrated water resources management. Phys. Chem. Earth 2016, 96, 1. [Google Scholar] [CrossRef]
- Deng, X.Z.; Singh, R.B.; Liu, J.G.; Guneralp, B. Water use efficiency and integrated water resource management for river basin. Phys. Chem. Earth 2015, 89–90, 1–2. [Google Scholar]
- Mamitimin, Y.; Feike, T.; Doluschitz, R. Bayesian network modeling to improve water pricing practices in northwest China. Water 2015, 7, 5617–5637. [Google Scholar] [CrossRef]
- Deng, X.Z.; Zhao, C.H. Identification of water scarcity and providing solutions for adapting to climate changes in the Heihe River Basin of China. Adv. Meteorol. 2015. [Google Scholar] [CrossRef]
- Liu, Y.Q.; Song, W.; Mu, F.Y. Changes in ecosystem services associated with planting structures of cropland: A case study in Minle County in China. Phys. Chem. Earth 2017. [Google Scholar] [CrossRef]
- Liu, Y.Q.; Song, W.; Deng, X.Z. Changes in crop type distribution in Zhangye City of the Heihe River Basin, China. Appl. Geogr. 2016, 76, 22–36. [Google Scholar] [CrossRef]
- Song, W.; Zhang, Y. Expansion of agricultural oasis in the Heihe River Basin of China: Patterns, reasons and policy implications. Phys. Chem. Earth 2015, 89–90, 46–55. [Google Scholar]
- Fu, P.D.; Rich, P.M. A geometric solar radiation model with applications in agriculture and forestry. Comput. Electron. Agric. 2002, 37, 25–35. [Google Scholar] [CrossRef]
- Huete, A.; Didan, K.; Miura, T.; Rodriguez, E.P.; Gao, X.; Ferreira, L.G. Overview of the radiometric and biophysical performance of the MODIS vegetation indices. Remote Sens. Environ. 2002, 83, 195–213. [Google Scholar] [CrossRef]
- Gao, B.C. NDWI—A normalized difference water index for remote sensing of vegetation liquid water from space. Remote Sens. Environ. 1996, 58, 257–266. [Google Scholar] [CrossRef]
- Tayyebi, A.; Pijanowski, B.C. Modeling multiple land use changes using ANN, CART and MARS: Comparing tradeoffs in goodness of fit and explanatory power of data mining tools. Int. J. Appl. Earth Obs. Geoinf. 2014, 28, 102–116. [Google Scholar] [CrossRef]
- Hutchinson, M.F. Interpolation of rainfall data with thin plate smoothing splines: I two dimensional smoothing of data with short range correlation. J. Geogr. Inf. Decis. Anal. 1998, 2, 152–167. [Google Scholar]
- Nagarajan, N.; Poongothai, S. Spatial mapping of runoff from a watershed using SCS-CN method with remote sensing and GIS. J. Hydrol. Eng. 2012, 17, 1268–1277. [Google Scholar] [CrossRef]
- Penman, H.L. Natural evaporation from open water, bare soil and grass. Proc. R. Soc. Lond. Ser. A 1948, 193, 120–145. [Google Scholar] [CrossRef]
- Allan, R.G.; Pereira, L.S.; Raes, D.; Smith, M. Crop Evapotranspiration: Guidelines for Computing Crop Water Requirements; FAO Irrigation and Drainage Paper No. 56; FAO: Rome, Italy, 2005; p. 56. [Google Scholar]
- Smith, P.C.; Calanca, P.; Fuhrer, J. A simple scheme for modeling irrigation water requirements at the regional scale applied to an alpine river catchment. Water 2012, 4, 869–886. [Google Scholar] [CrossRef]
- Han, Z.; Song, W.; Deng, X.Z. Progress in the research on benefit-sharing and ecological compensation mechanisms for transboundary rivers. J. Resour. Ecol. 2017, 8, 129–140. [Google Scholar]
- Jiang, Q.O.; Deng, X.Z.; Zhan, J.Y.; Yan, H.M. Impacts of economic development on ecosystem risk in the Yellow River Delta. Procedia Environ. Sci. 2011, 5, 208–218. [Google Scholar] [CrossRef]
- Davis, K.F.; Seveso, A.; Rulli, M.C.; D’Odorico, P. Water savings of crop redistribution in the United States. Water 2017, 9, 83. [Google Scholar] [CrossRef]
- Jiang, Q.O.; Deng, X.Z.; Zhan, J.Y.; He, S.J. Estimation of land production and its response to cultivated land conversion in North China Plain. Chin. Geogr. Sci. 2011, 21, 685–694. [Google Scholar] [CrossRef]
Figure 1.
Map to show the geographical location and administrative divisions of the HRB.
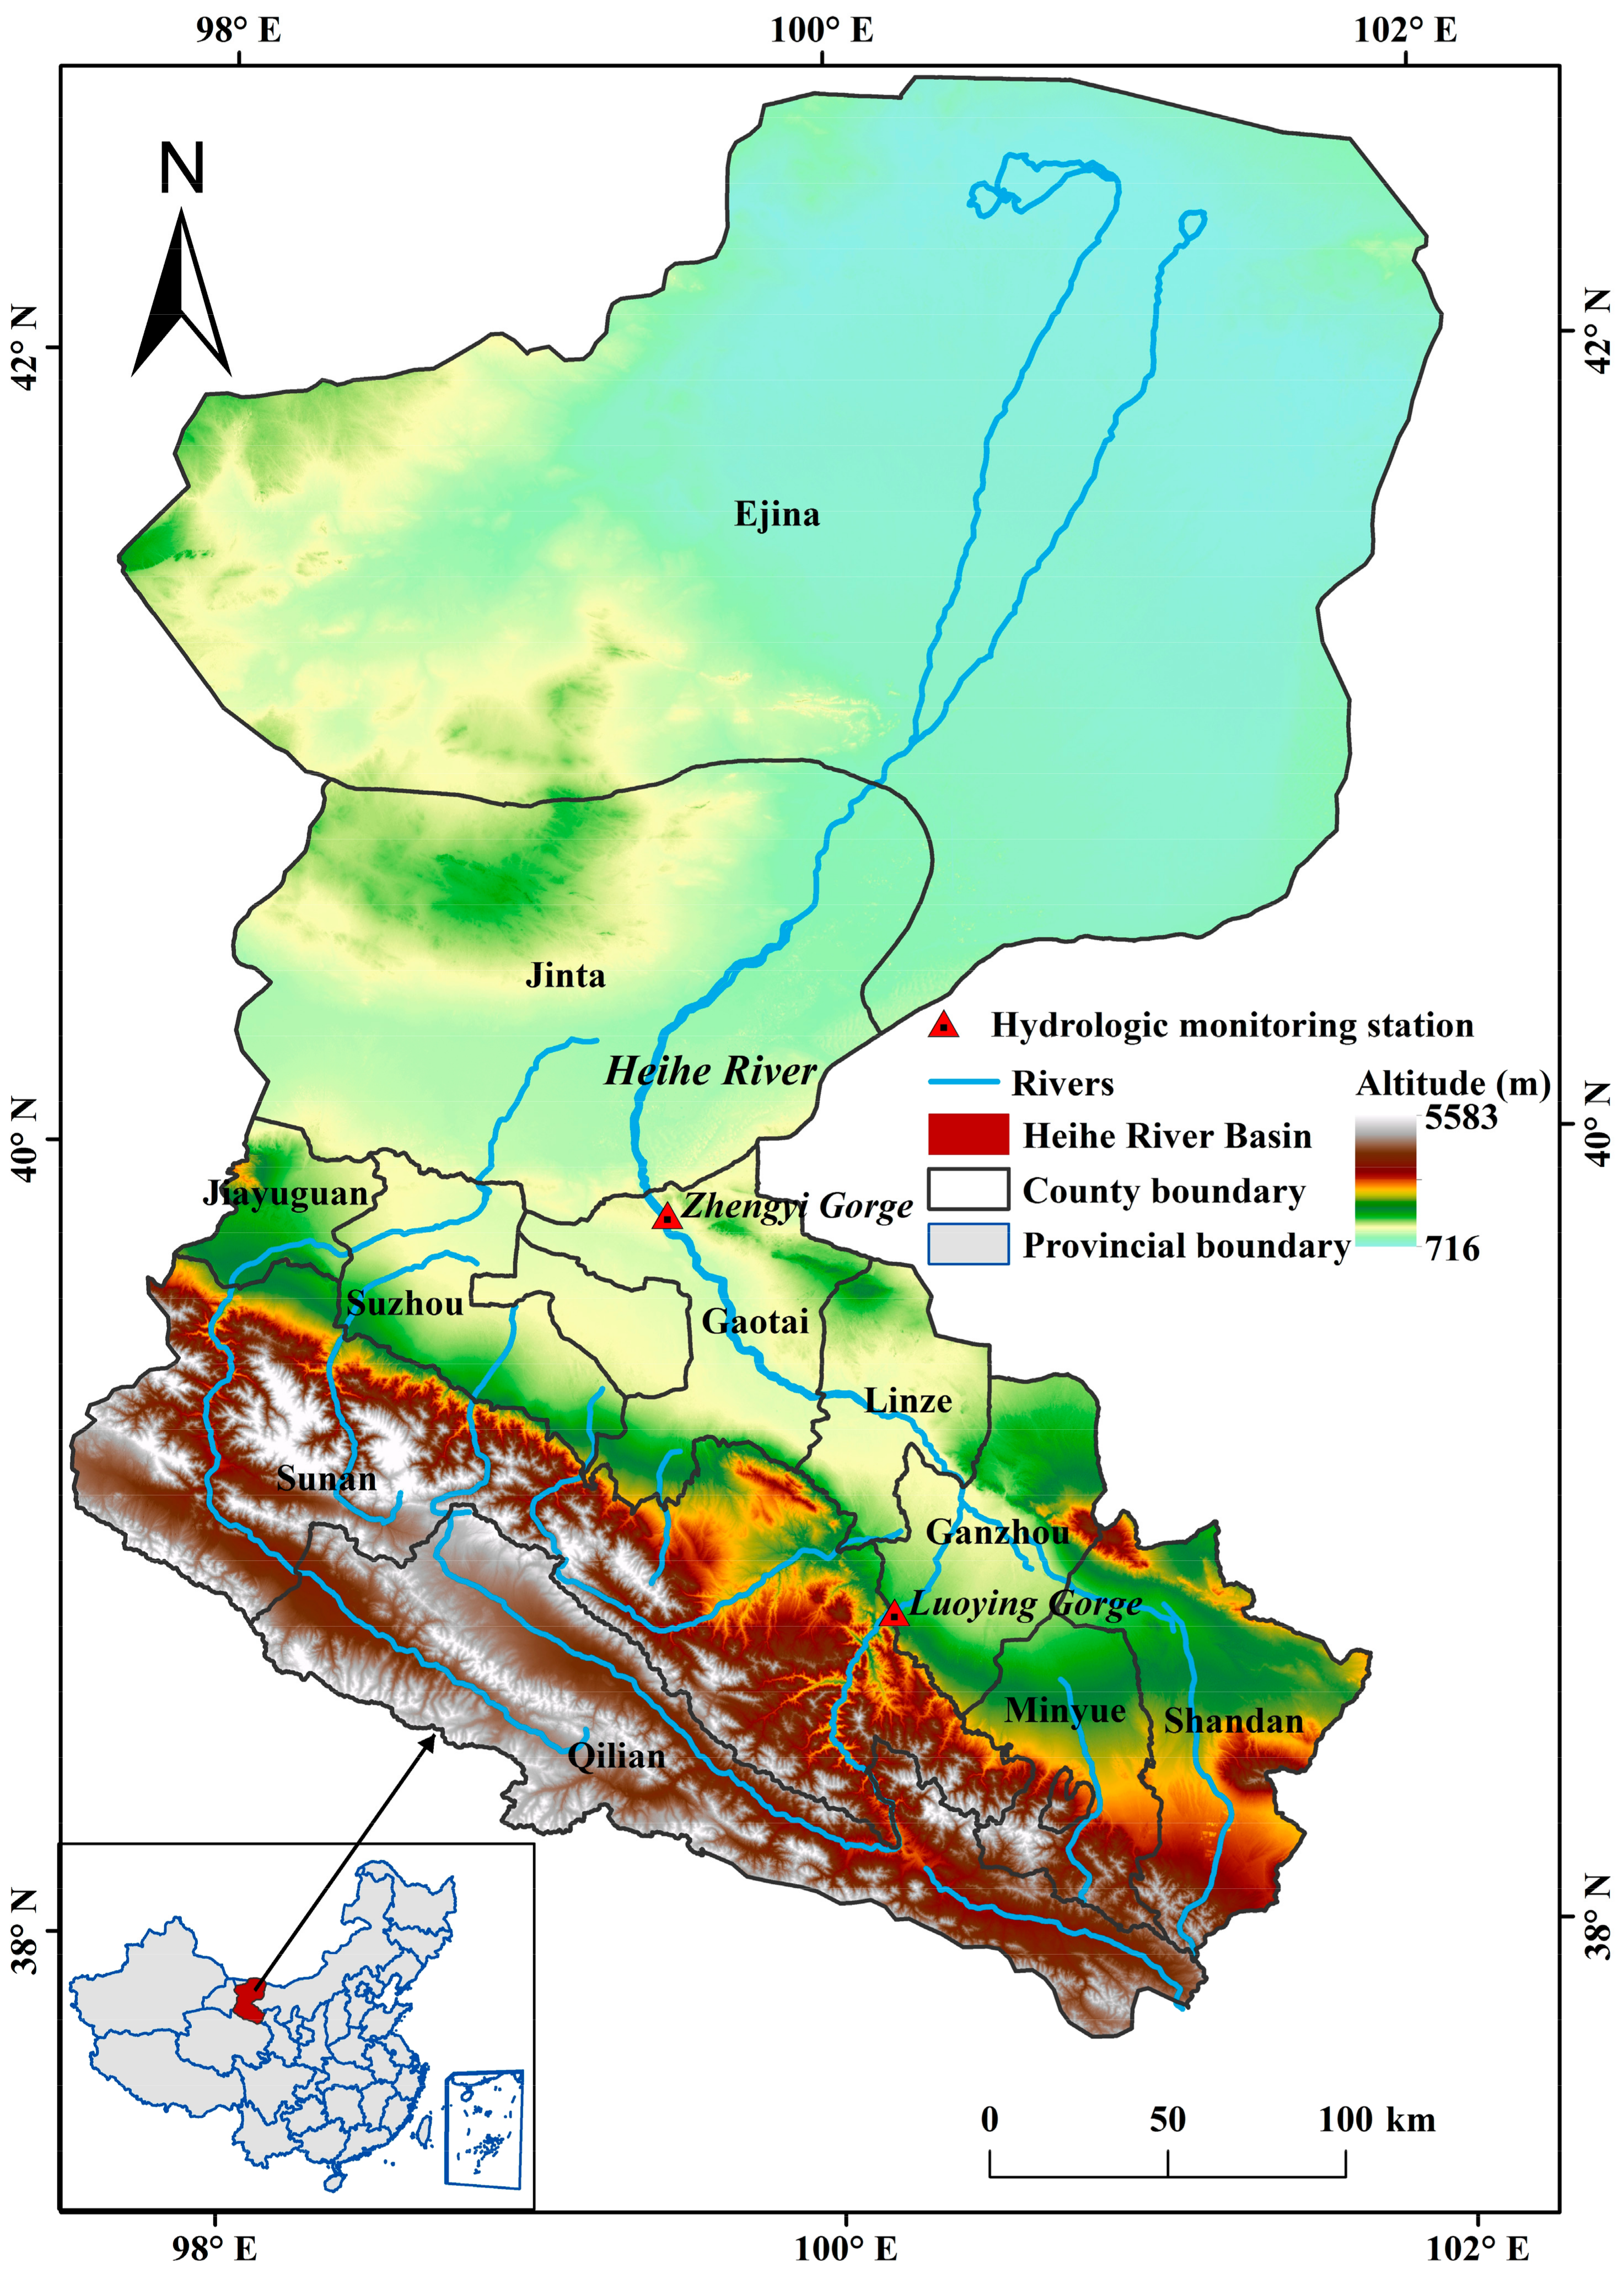
Figure 2.
ER within the HRB in 2007 and 2012: (a) Spatial distribution of ER in 2007; (b) Spatial distribution of ER in 2012; (c) Monthly mean, maximum, and minimum ER in 2007; (d) Monthly mean, maximum, and minimum ER in 2012.
Figure 2.
ER within the HRB in 2007 and 2012: (a) Spatial distribution of ER in 2007; (b) Spatial distribution of ER in 2012; (c) Monthly mean, maximum, and minimum ER in 2007; (d) Monthly mean, maximum, and minimum ER in 2012.
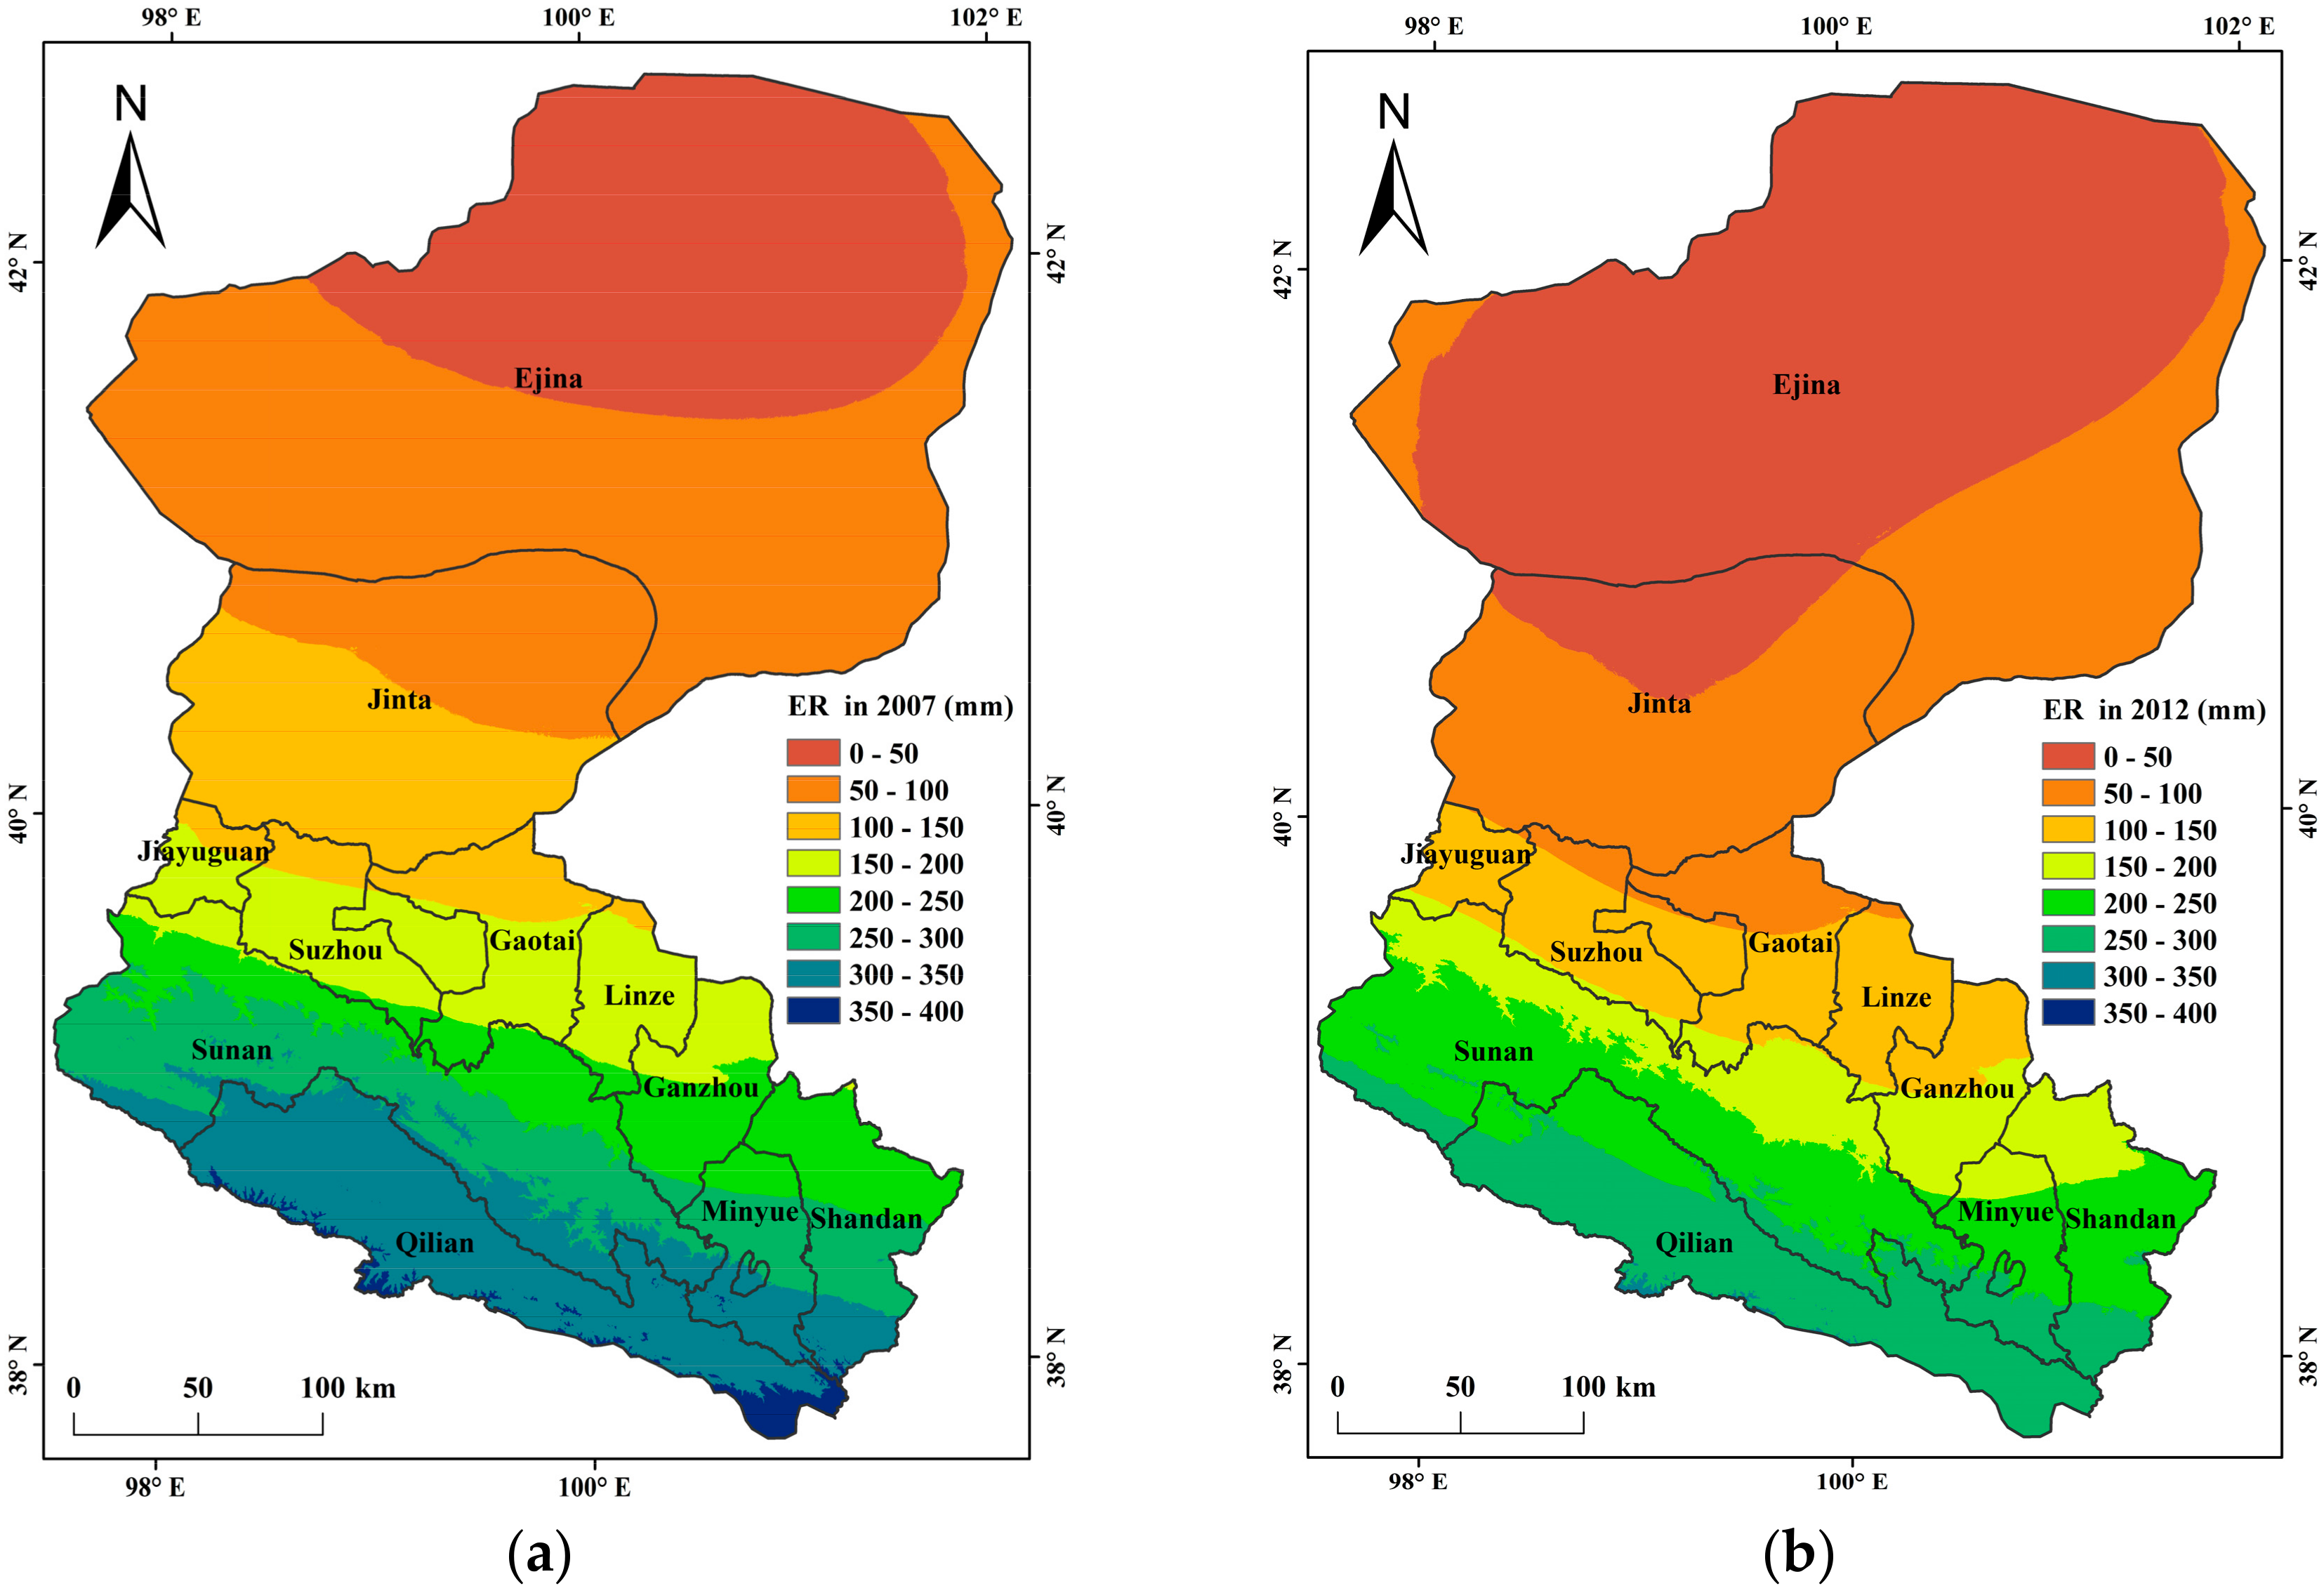

Figure 3.
HRB ETo values for 2007 and 2012: (a) Spatial distribution of ETo in 2007; (b) Spatial distribution of ETo in 2012; (c) Monthly mean, maximum, and minimum ETo, as well as monthly standard deviation for 2007; (d) Monthly mean, maximum, and minimum ETo, as well as monthly SD for 2012.
Figure 3.
HRB ETo values for 2007 and 2012: (a) Spatial distribution of ETo in 2007; (b) Spatial distribution of ETo in 2012; (c) Monthly mean, maximum, and minimum ETo, as well as monthly standard deviation for 2007; (d) Monthly mean, maximum, and minimum ETo, as well as monthly SD for 2012.
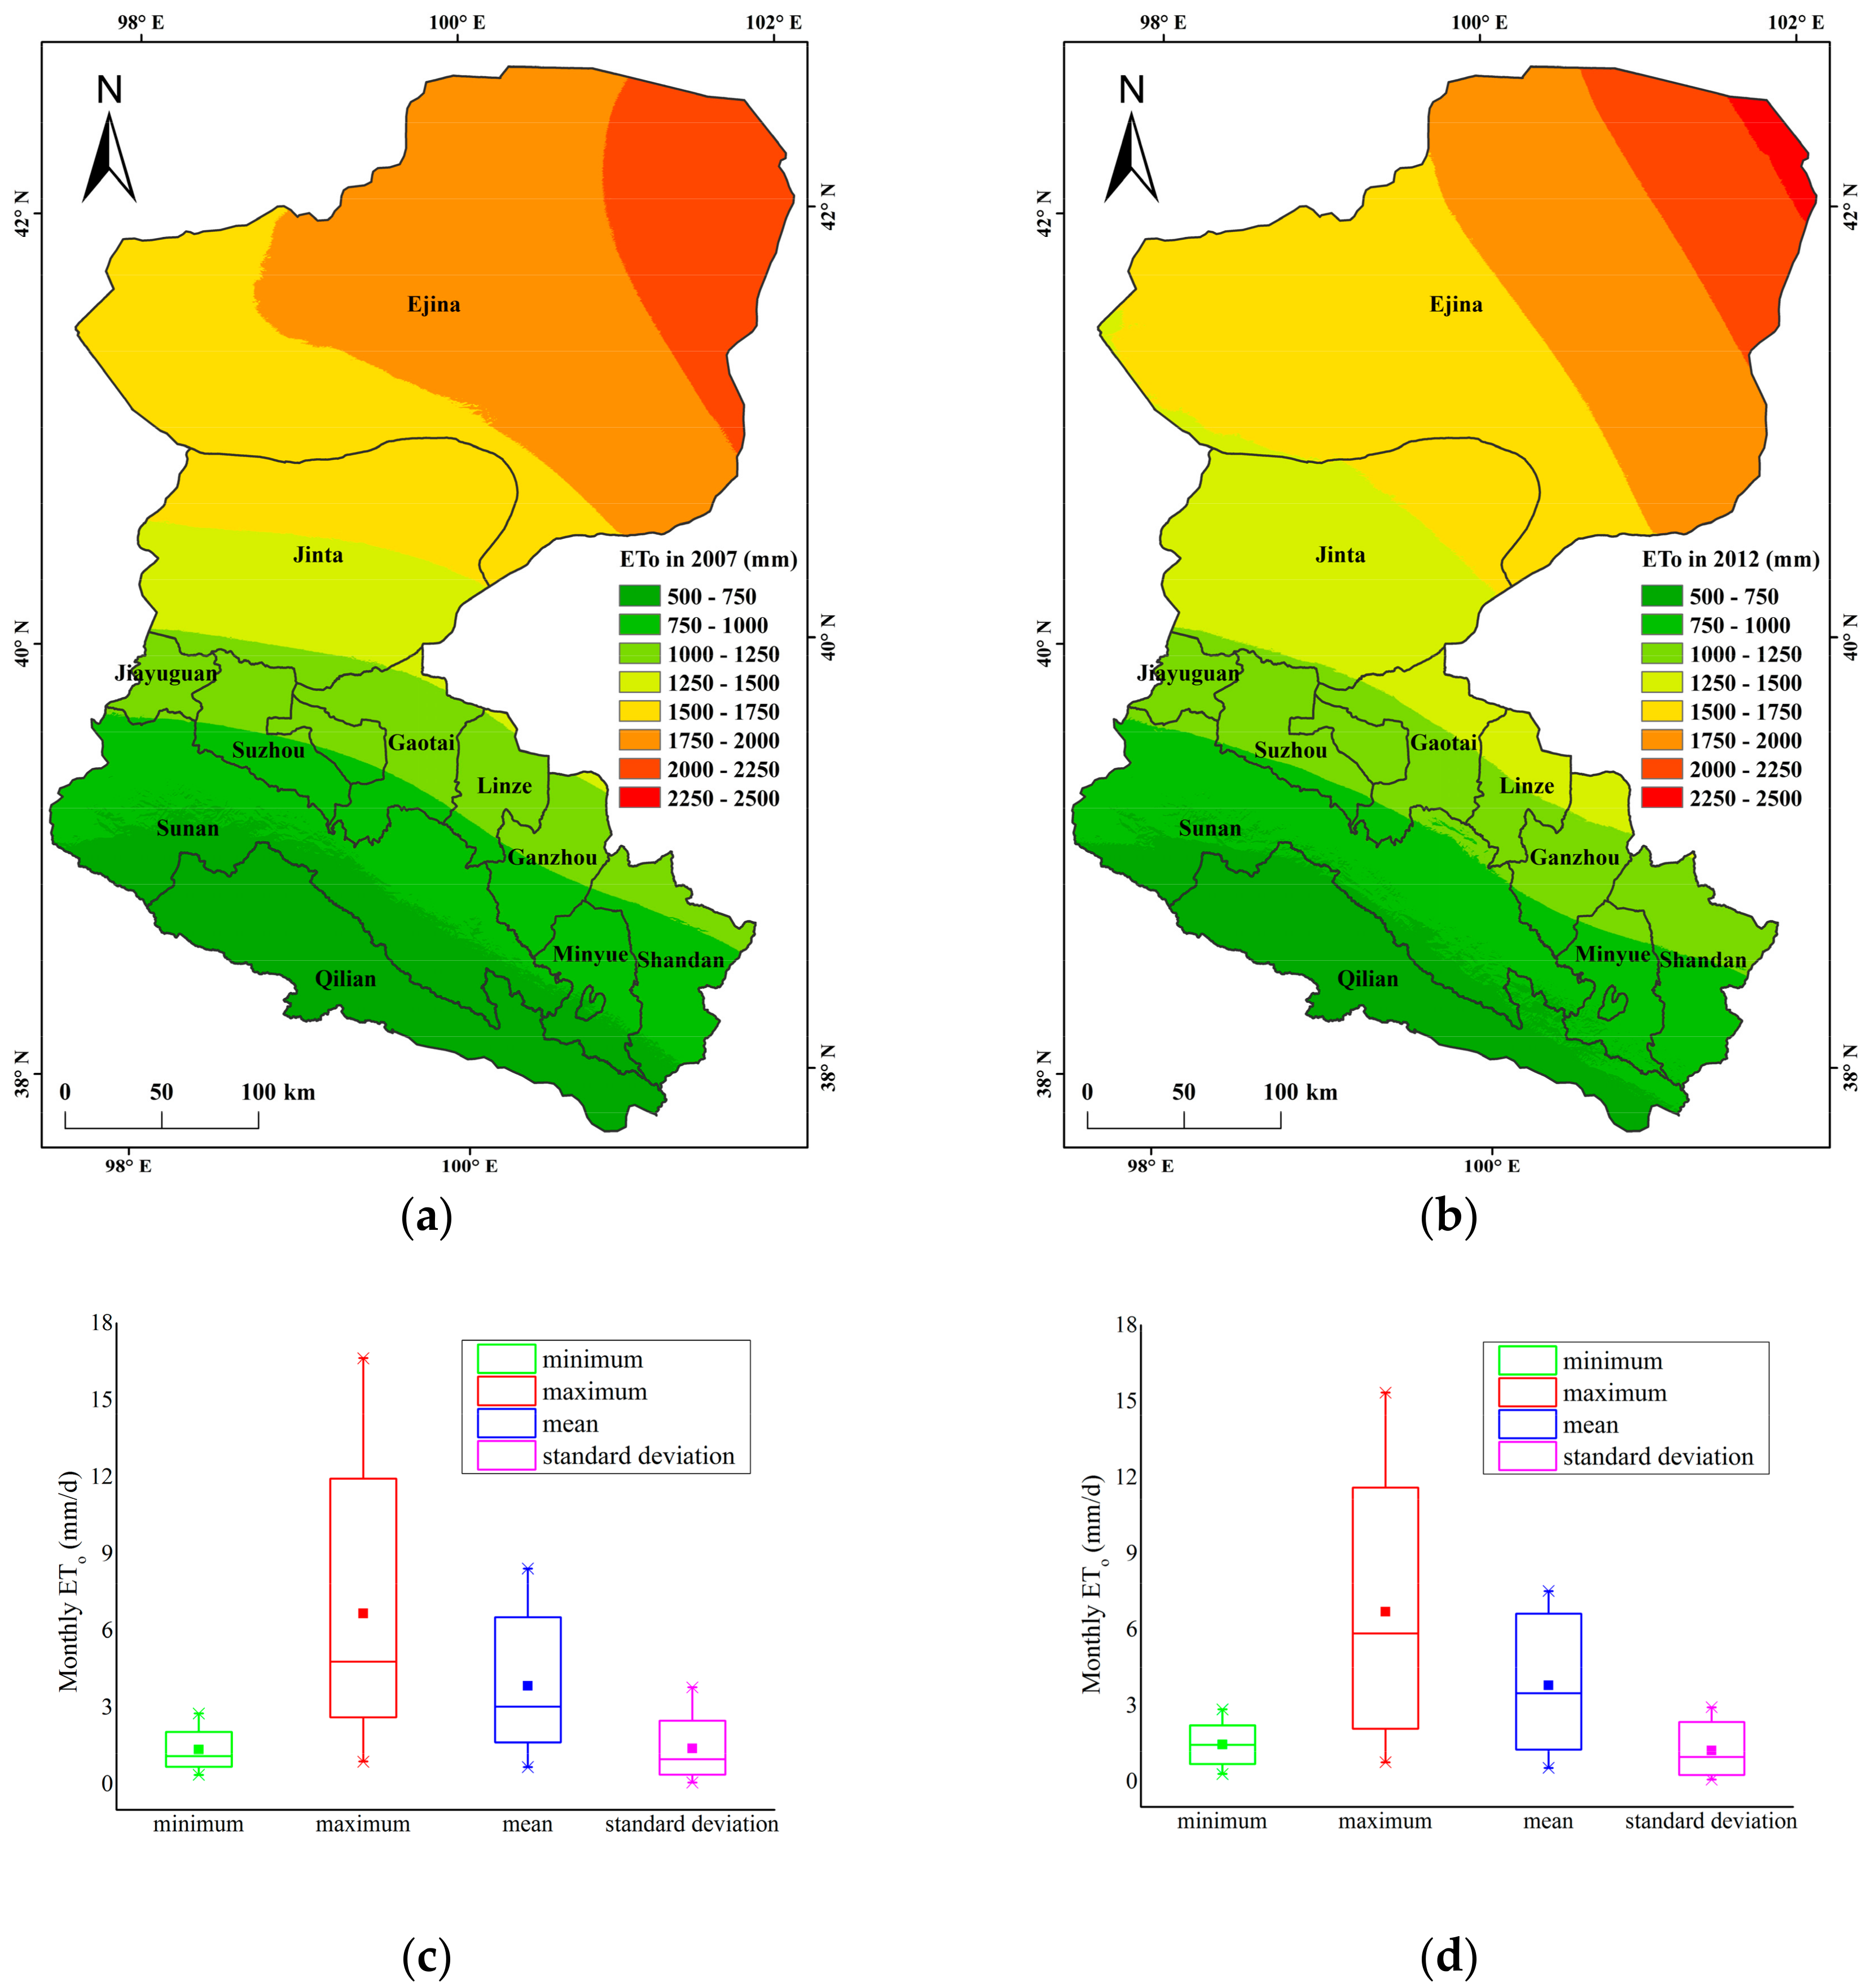
Figure 4.
HRB ETc values for 2007 and 2012: (a) Spatial distribution of ETc in 2007; (b) Spatial distribution of ETc in 2012; (c) Monthly mean, maximum, and minimum ETc for 2007; (d) Monthly mean, maximum, and minimum ETc for 2012; (e) Monthly mean ETc of different crops in 2007; (f) Monthly mean ETc of different crops in 2012.
Figure 5.
HRB IWRc values for 2007 and 2012: (a) Spatial distribution of IWRc in 2007; (b) Spatial distribution of IWRc in 2012; (c) Monthly mean IWRc for 2007 and 2012; (d) Annual mean IWRc of different crops in 2007 and 2012; (e) Monthly mean IWRc of different crops in 2007; (f) Monthly mean IWRc of different crops in 2012.

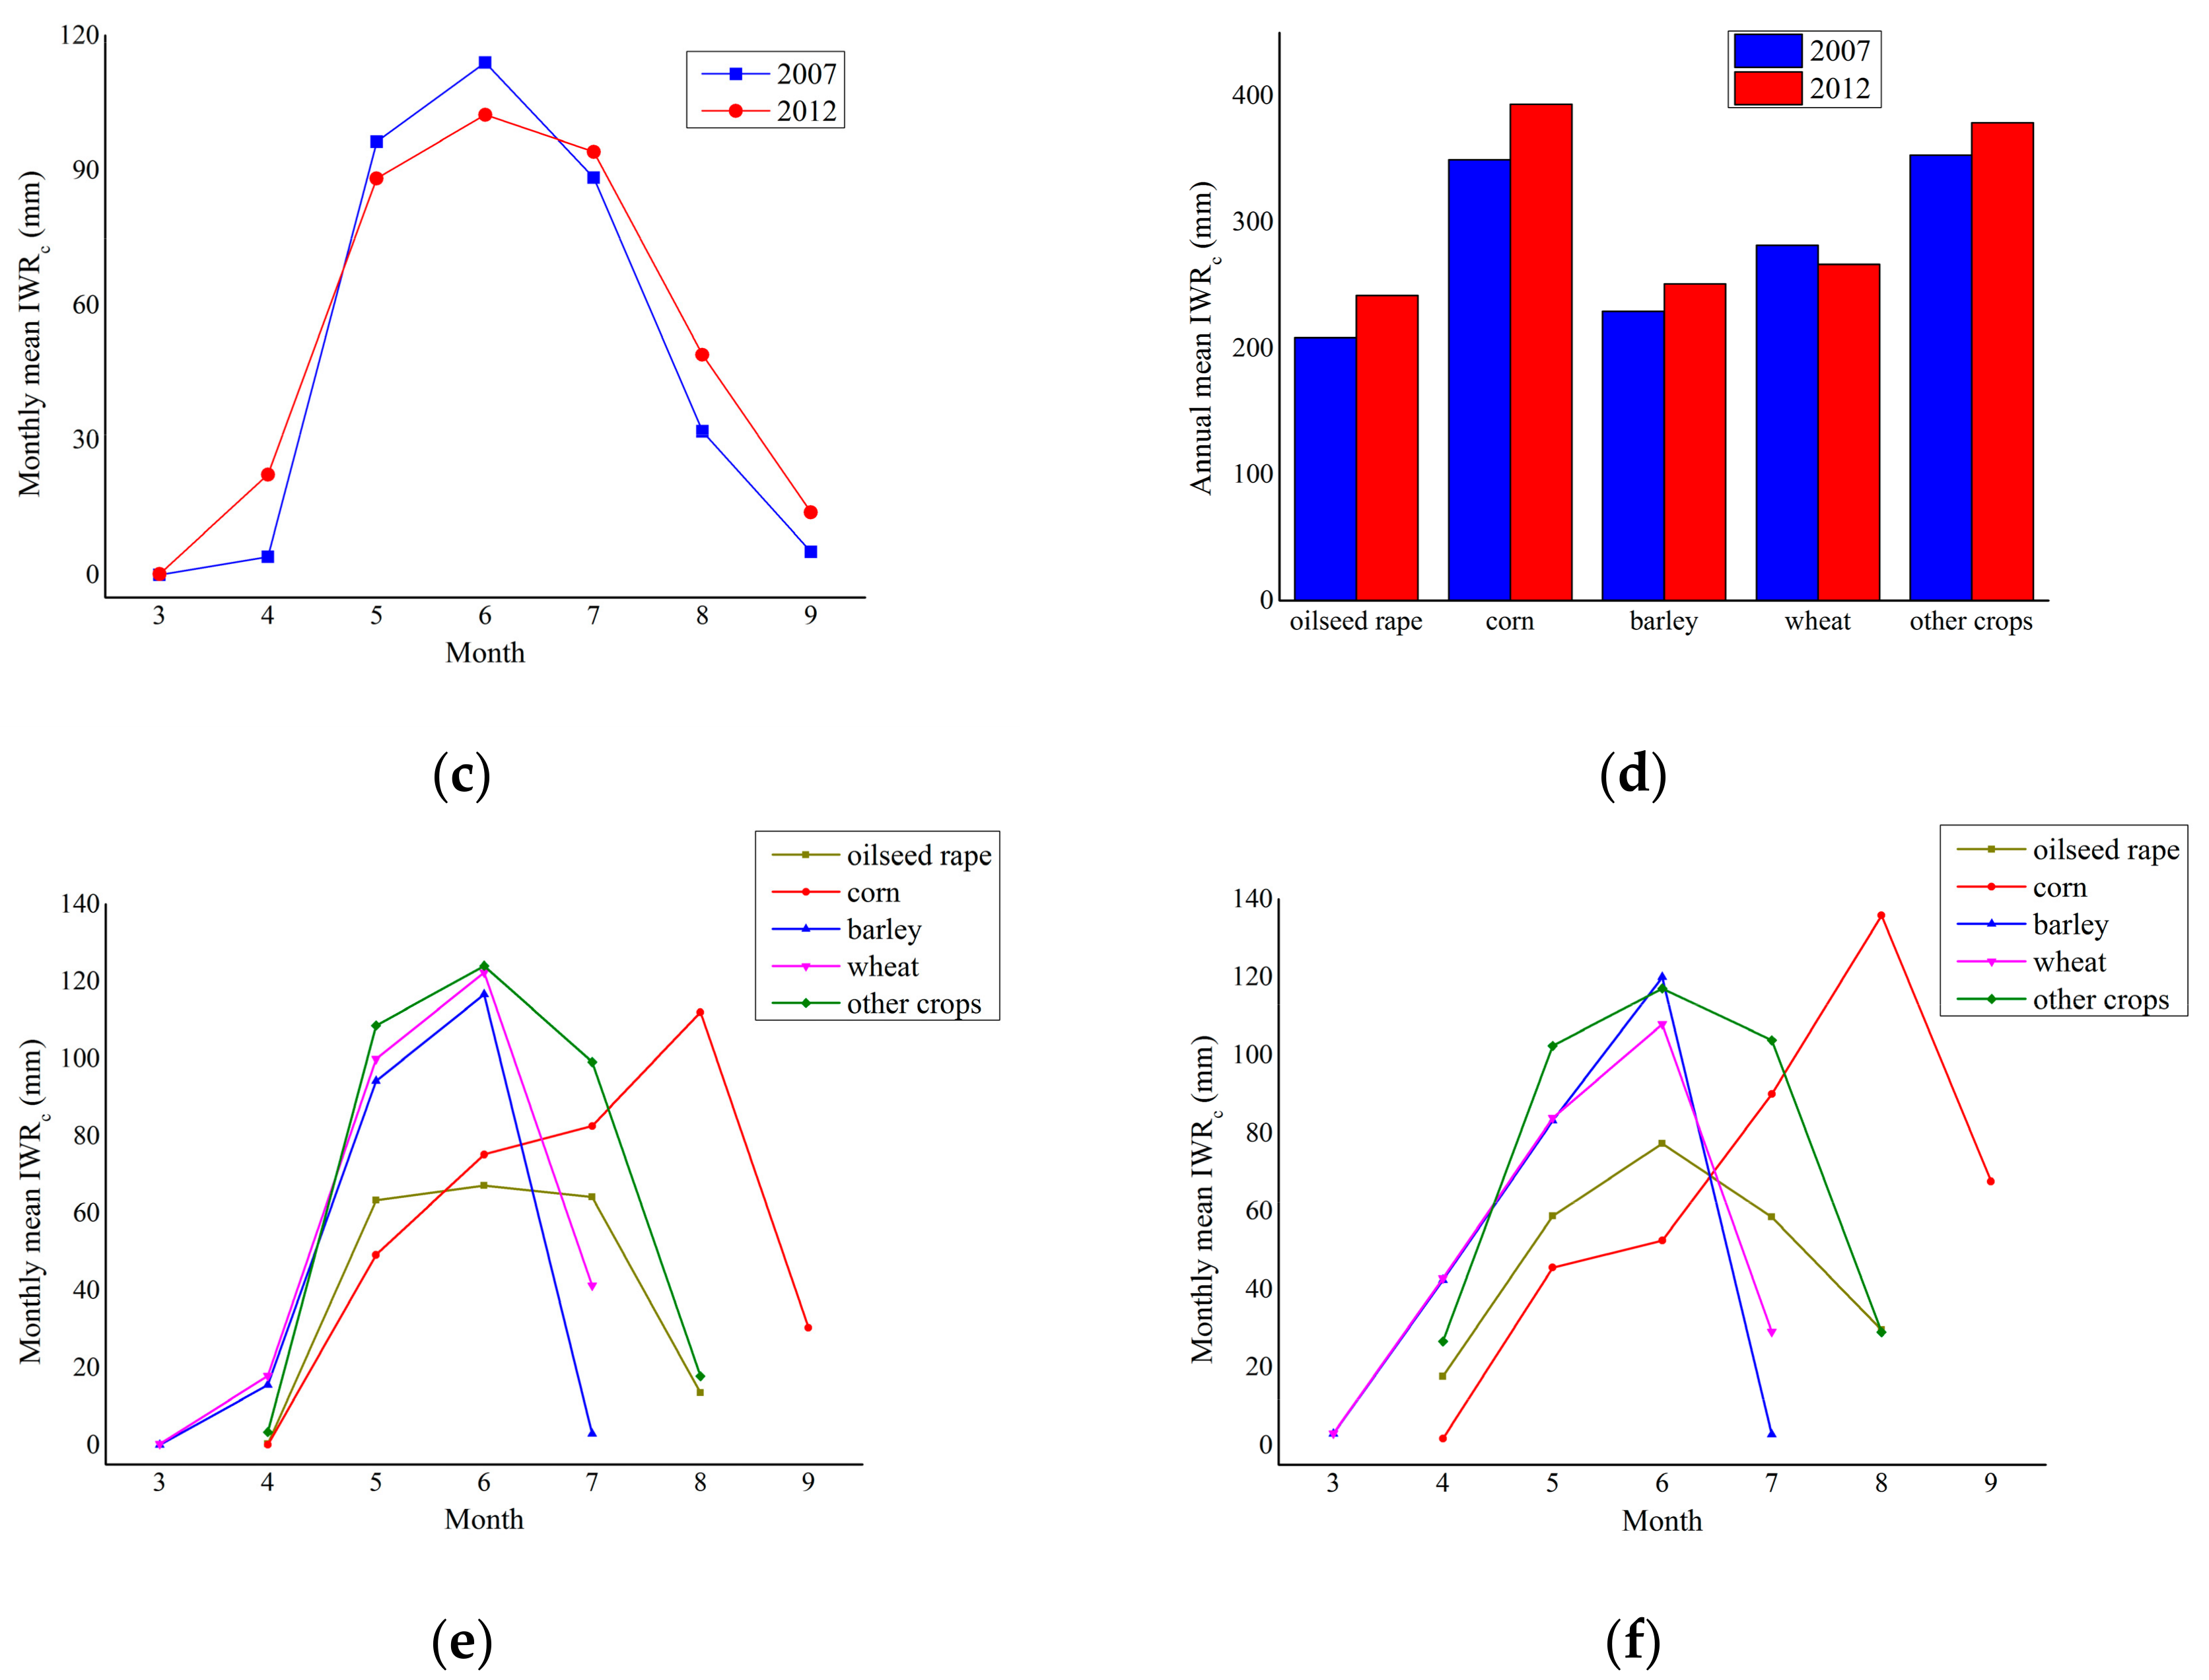
Figure 6.
Maps to show the spatiotemporal distribution of crop planting within the HRB in (a) 2007 and (b) 2012.
Figure 6.
Maps to show the spatiotemporal distribution of crop planting within the HRB in (a) 2007 and (b) 2012.

Figure 7.
Monthly mean changes in climate between 2007 and 2012 in the HRB: (a) Temperature; (b) Relative humidity; (c) Wind speed; (d) Atmospheric pressure.
Figure 7.
Monthly mean changes in climate between 2007 and 2012 in the HRB: (a) Temperature; (b) Relative humidity; (c) Wind speed; (d) Atmospheric pressure.

Table 1.
Kc values for different crop growth stages within the HRB in 2007 and 2012.
| Crop | Sowing Date | Initial Stage | Development Stage | Mid-Season Stage | End-Season Stage | ||||
|---|---|---|---|---|---|---|---|---|---|
| Duration (d) | Kc ini | Duration (d) | Kc dev | Duration (d) | Kc mid | Duration (d) | Kc end | ||
| Oilseed rape | 10 April | 30 | 0.35 | 36 | 0.73 | 35 | 1.10 | 32 | 0.73 |
| Corn | 15 April | 30 | 0.10 | 56 | 0.56 | 57 | 1.02 | 21 | 0.79 |
| Barley | 20 March | 30 | 0.30 | 43 | 0.78 | 26 | 1.25 | 22 | 0.75 |
| Wheat | 20 March | 30 | 0.30 | 50 | 0.77 | 26 | 1.24 | 22 | 0.77 |
| Others | 1 April | 30 | 0.26 | 46 | 0.71 | 36 | 1.15 | 24 | 0.75 |
Note: Values for the duration and Kc of others (i.e., other crops) are mean values for the four main crops at different growth stages.
Table 2.
Changes in HRB crop planting area and IWRc between 2007 and 2012.
| Crop Type | Planting Area (103 ha) | IWRc per Unit Area (m3/ha) | Total IWRc (106 m3) | ||||||
|---|---|---|---|---|---|---|---|---|---|
| 2007 | 2012 | Change | 2007 | 2012 | Change | 2007 | 2012 | Change | |
| Oilseed rape | 16.37 | 20.02 | 3.65 | 2084.35 | 2418.08 | 333.74 | 34.12 | 48.41 | 14.29 |
| Corn | 118.21 | 149.52 | 31.31 | 3493.53 | 3931.04 | 437.51 | 412.97 | 587.77 | 174.80 |
| Barley | 23.51 | 15.43 | −8.08 | 2292.60 | 2511.72 | 219.12 | 53.90 | 38.76 | −15.14 |
| Wheat | 45.92 | 33.68 | −12.24 | 2815.27 | 2666.86 | −148.41 | 129.28 | 89.82 | −39.46 |
| Other crops | 490.34 | 508.85 | 18.51 | 3528.48 | 3788.59 | 260.11 | 1730.15 | 1927.83 | 197.67 |
| Cropland | 694.35 | 727.50 | 33.15 | 3399.45 | 3701.12 | 301.67 | 2360.42 | 2692.58 | 332.16 |
Table 3.
HRB county-level changes in crop planting area and IWRc values between 2007 and 2012.
| County | Changes in Crop Planting Area (ha) | Changes of Total IWRc (106 m3) | ||||||
|---|---|---|---|---|---|---|---|---|
| Oilseed Rape | Corn | Barley | Wheat | Other Crops | 2007 | 2012 | Change | |
| Ganzhou | −1157.58 | 12,180.06 | 1418.31 | −4219.29 | 155.09 | 366.24 | 465.25 | 99.01 |
| Minle | 5086.26 | 5924.07 | −6340.59 | 915.30 | 1644.33 | 225.74 | 291.33 | 65.59 |
| Shandan | 405.36 | 2257.65 | −3591.54 | 5092.83 | −2829.03 | 228.86 | 268.39 | 39.53 |
| Linze | −469.62 | 11,941.02 | 8.64 | −2069.64 | −7115.14 | 207.61 | 247.08 | 39.47 |
| Gaotai | −98.82 | 8488.89 | 0.81 | −2062.71 | −4298.19 | 191.43 | 225.80 | 34.37 |
| Sunan | 126.54 | −1125.54 | 52.20 | −511.56 | 10,312.63 | 36.51 | 76.73 | 40.22 |
| Suzhou | 374.13 | 1097.46 | 276.75 | −6805.26 | 6231.75 | 459.84 | 476.00 | 16.16 |
| Jinta | 334.71 | −8135.37 | 53.91 | −1747.80 | 10,678.99 | 418.61 | 424.02 | 5.41 |
| Jiayuguang | 286.20 | −782.73 | 36.18 | −728.10 | 1663.32 | 70.93 | 69.43 | −1.51 |
| Egina | −17.28 | −715.32 | 0.00 | −82.26 | 917.89 | 150.41 | 143.61 | −6.80 |
| Qilian | −1211.58 | 175.50 | 8.64 | −24.39 | 1151.96 | 3.49 | 4.82 | 1.33 |
Table 4.
Crop conversion contributions to IWRc changes within the HRB between 2007 and 2012.
| Conversion Type | Converted Area (103 ha) | Contribution Value (106 m3) | Contribution Rate (%) | Conversion Type | Converted Area (103 ha) | Contribution Value (106 m3) | Contribution Rate (%) |
|---|---|---|---|---|---|---|---|
| OR to C | 3.70 | 6.83 | 2.06 | B to W | 7.58 | 2.84 | 0.85 |
| OR to B | 1.03 | 0.44 | 0.13 | B to OC | 11.27 | 16.86 | 5.08 |
| OR to W | 1.17 | 0.68 | 0.21 | W to OR | 1.37 | −0.54 | −0.16 |
| OR to OC | 8.16 | 13.91 | 4.19 | W to C | 3.07 | 3.43 | 1.03 |
| C to OR | 2.08 | −2.24 | −0.67 | W to B | 2.43 | −0.74 | −0.22 |
| C to B | 0.44 | −0.43 | −0.13 | W to OC | 26.41 | 25.71 | 7.74 |
| C to W | 0.59 | −0.49 | −0.15 | OC to OR | 13.48 | −14.97 | −4.51 |
| C to OC | 46.25 | 13.65 | 4.11 | OC to C | 72.58 | 29.22 | 8.80 |
| B to OR | 0.85 | 0.11 | 0.03 | OC to B | 8.11 | −8.25 | −2.48 |
| B to C | 0.51 | 0.84 | 0.25 | OC to W | 11.69 | −10.07 | −3.03 |
| Total | 76.77 | 23.11 |
Abbreviations: OR: oilseed rape; C: corn; B: barley; W: wheat; OC: other crops.
© 2017 by the authors. Licensee MDPI, Basel, Switzerland. This article is an open access article distributed under the terms and conditions of the Creative Commons Attribution (CC BY) license (http://creativecommons.org/licenses/by/4.0/).
Share and Cite
MDPI and ACS Style
Liu, Y.; Song, W.; Deng, X. Spatiotemporal Patterns of Crop Irrigation Water Requirements in the Heihe River Basin, China. Water 2017, 9, 616. https://doi.org/10.3390/w9080616
AMA Style
Liu Y, Song W, Deng X. Spatiotemporal Patterns of Crop Irrigation Water Requirements in the Heihe River Basin, China. Water. 2017; 9(8):616. https://doi.org/10.3390/w9080616
Chicago/Turabian StyleLiu, Yaqun, Wei Song, and Xiangzheng Deng. 2017. "Spatiotemporal Patterns of Crop Irrigation Water Requirements in the Heihe River Basin, China" Water 9, no. 8: 616. https://doi.org/10.3390/w9080616
Note that from the first issue of 2016, this journal uses article numbers instead of page numbers. See further details here.