Article

Effects of the Food-to-Microorganism (F/M) Ratio on N2O Emissions in Aerobic Granular Sludge Sequencing Batch Airlift Reactors

1
Shandong Provincial Key Laboratory of Water Pollution Control and Resource Reuse, School of Environmental Science and Engineering, Shandong University, 27 Shanda Nanlu, Jinan 250100, China
2
Environmental Research Institute, Shandong University, 27 Shanda Nanlu, Jinan 250100, China
3
School of Municipal and Environmental Engineering, Shandong Jianzhu University, Fengming Licheng District Lingang Development Zone, Jinan 250101, China
*
Author to whom correspondence should be addressed.
Water 2017, 9(7), 477; https://doi.org/10.3390/w9070477
Submission received: 30 April 2017 / Revised: 11 June 2017 / Accepted: 22 June 2017 / Published: 29 June 2017
(This article belongs to the Special Issue Modeling of Water Systems)

Abstract

:
The present study investigated the effect of the food-to-microorganism (F/M) ratio on nitrous oxide (N2O) emissions in aerobic granular sludge sequencing batch airlift reactors. Three identical sequencing batch airlift reactors were fed with sodium acetate-based wastewater at different chemical oxygen demand (COD) concentrations, resulting in F/M ratios from 0.2 to 0.67 g COD/g SS. The results indicated that N2O emissions increased with an increase of the F/M ratio. N2O emissions at the high F/M ratio of 0.67 g COD/g SS were the highest (4.4 ± 0.94 mg/d). The main source of the high N2O emissions at the F/M ratio of 0.67 g COD/g SS was nitrifier denitrification, rather than heterotrophic denitrification, confirmed by the qPCR (quantitative real-time PCR) results. The heterotrophic denitrification was destroyed by the DO (dissolved oxygen) diffusing into the sludge particles with porous structures. This study offers theoretical support to study the N2O emissions in aerobic granular sludge, and can provide guidance for conducting risk assessment and enhancing our ability to predict N2O production in aerobic granular sludge at different F/M ratios.

1. Introduction

Aerobic granular sludge technology is a promising new environmental biotechnological process [1,2,3]. Aerobic granules have the advantages of excellent settling abilities, a dense granule structure, and a high biomass retention, compared to conventional activated sludge. Therefore, aerobic granular sludge technology is increasingly drawing the interest of researchers committed to biological wastewater treatment technology.
It is generally accepted that the biological treatment process of wastewater occupies an important position among the main sources of nitrous oxide (N2O) [4,5]. N2O is one kind of greenhouse gas, and its half-life is as long as 114 years in the atmosphere. The global warming potential of N2O is 310 times higher than for carbon dioxide, and the doubling volume of N2O in the atmosphere will make the average global temperature rise by 0.4 °C [6]. It is therefore of great importance to study the mechanism of N2O emissions in wastewater treatment processes.
It has been reported that simultaneous nitrification and denitrification (SND) can be achieved in granular sludge reactors because of the distribution of autotrophic nitrifying bacteria and heterotrophic denitrifying bacteria. Denitrification of both nitrifying bacteria in the aerobic process and denitrifying bacteria in the anaerobic process are the sources of N2O [7]. Therefore, the emission of N2O as an intermediate or end product in the metabolism of microorganisms in aerobic granules cannot be neglected.
The organic loading is one of the most critical parameters for the cultivation of aerobic granular sludge [8,9], as the substrate concentration will influence the granulation process by optimizing and enriching different microbe species [10]. Many efforts have been made to evaluate the effects of different organic loadings on aerobic granular sludge [11]. A relatively low organic loading (0.5–2 kg COD/(m3·d); COD—chemical oxygen demand) results in a slow microbial growth rate, while a high organic loading (21.3 kg COD/m3·d) contributes to disintegrated granules and unstable reaction systems [12]. Furthermore, the organic loading could affect the performance of SND. A low organic loading will result in the limiting substrate for denitrification [13]. The limited performance of denitrification will further influence N2O emissions. In addition, a high organic loading will consume more dissolved oxygen (DO), resulting in a low DO concentration. It has been acknowledged that a low DO concentration can promote N2O emissions in SND [14,15]. However, the effect of the organic loading on N2O emissions in aerobic granular sludge has not been well studied.
This study aimed to investigate the mechanism of effects of F/M ratios on the N2O emission in aerobic granules. The morphology of the granules was determined by scanning electron microscopy (SEM), and the key components of extracellular polymeric substances (EPS) were also measured. A quantitative real-time PCR (qPCR) method was used to determine the abundances of functional genes, including amoA, nirK, and nosZ genes. This work could be helpful to offer a theoretical basis for N2O reduction in aerobic granular sludge technology.

2. Materials and Methods

2.1. Aerobic Granular Sludge Bioreactor Setup and Operation

This study was conducted with three identical sequencing batch airlift reactors (SBARs). Aerobic granular sludge cultivated earlier with synthetic wastewater at the COD of 600 mg/L was used as the seed sludge for the reactors [16]. The seed sludge was well-mixed before it was loaded into the three reactors, to make sure that the three reactors had the same initial mixed liquor suspended solids (MLSS) concentration of 3000 mg/L. A 6 h working cycle was applied over the entire experiment, which was composed of 10 min of feeding, a 320 min aerobic stage, 5 min of settling, 5 min of discharging and 20 min of idling. The hydraulic retention time (HRT) was 12 h, the air supply was provided by virtue of an aeration pump at the bottom of the reactor at an aeration rate of around 3 L/min during the aeration stage, and the DO concentration in the reactors was measured throughout the 6 h cycle. The SBARs were operated at room temperature (20 ± 2 °C).
The operating conditions were the same for the three reactors, R1, R2 and R3, except for the loading substrate concentration. The carbon source in the synthetic wastewater was sodium acetate. The COD concentrations of the influent to the three SBARs were controlled at 600, 1025, and 2000 mg/L by adjusting the sodium acetate concentrations, and this resulted in F/M ratios of 0.2, 0.34 and 0.67 g COD/g SS for R1, R2 and R3, respectively. Correspondingly, the organic loading rates were 1, 1.71 and 3.33 kg COD/(m3·d). Other components of the synthetic wastewater were 240 mg of NH4Cl, 58 mg of K2HPO4, 24 mg of KH2PO4, 67 mg of CaCl2, 42 mg of MgSO4·7H2O, 42 mg of EDTA, 250 mg of NaHCO3, and 1 mL/L of a trace element solution. The composition of the trace element solution was: FeCl3·6H2O (150 µg·L−1), H3BO3 (150 µg·L−1), CuSO4·5H2O (30 µg·L−1), KI (30 µg·L−1), MnCl·4H2O (120 µg·L−1), NaMoO4·2H2O (60 µg·L−1), ZnSO4·7H2O (120 µg·L−1), and CoCl2·6H2O (150 µg·L−1). NaHCO3 was dosed into the synthetic wastewater to maintain the reactor pH in the range between 7.0 and 7.8.
At the end of the settling phase of every 6 h cycle, a certain amount of the sludge suspension was withdrawn using a siphon; thus the slow-settling flocs in the suspension sludge were removed. The volume of the daily sludge discharge was adjusted to keep the MLSS concentration at around 3000 mg/L in the three reactors. The batch experiments were started when the MLSS concentrations could be kept constant, which implied that the SBARs had reached a steady state (about 60 days after the reactor started running). Meanwhile, the COD and ammonium removal rates were above 90%. The batch experiments were performed in triplicate consecutively. In the batch experiments, nitrogen compounds including ammonium (NH4+-N), nitrite (NO2-N) and nitrate (NO3-N), and the N2O emissions were measured. During the aeration reaction stage, the emission gas was sampled every 30 min during the 6 h working cycle. Off-gas was collected from the reactor headspace into a plastic bag by a plastic tube [16].

2.2. DNA Extraction and qPCR

Sludge samples were taken from the three reactors at the end of three 6 h batch experiments. For every sample, 1 mL of sludge mixed liquor was centrifuged at 10,000 g for 5 min at 4 °C. After that, the precipitate (wet weight) was extracted for DNA extraction using a PowerSoil DNA extraction kit (MO BIO Laboratories, Carlsbad, CA, USA) following the manufacturer’s instructions. DNA was extracted in triplicate for every sample. A Thermo NanoDrop 1000 spectrophotometer was used to measure the DNA concentration and purity. The extracted DNA was stored at −20 °C until it was used in later analyses.
The 16S rRNA gene fragment and amoA, nirK and nosZ gene fragments were amplified using primer sets F338/R518, amoA-1F/amoA-2R, FlaCu/R3Cu, and nosZ-F/nosZ-1622R, respectively, as shown in Table 1. Standard plasmids carrying the target genes were attained by PCR and molecular cloning [17], followed by extraction using a Plasmid Mini Kit according to the manufacturer’s instructions (Omega, San Antonio, TX, USA).
Six-point standard curves were constructed from 10-fold serial dilutions of plasmids ranging from 1010 to 104 copies µL−1. The 16S rRNA, amoA, nirK and nosZ genes of microbes were quantified for all samples using a Roche LightCycler 480 system. The 20 µL qPCR reaction mixture consisted of 10 μL of SYBR Premix Ex Taq (Takara, Kusatsu, Shiga, Japan), 0.4 µL of forward primer, 0.4 µL of reverse primer, 2 µL of the template DNA, and 7.2 µL of sterile distilled water. Each qPCR run consisted of 5 min of initial denaturation at 95 °C, followed by 40 cycles of denaturation at 95 °C for 30 s, and annealing and extending at 72 °C for 30 s [18]. All sample measurements were performed in triplicate. The average slopes of all qPCR assays were from −3.1 to 3.5 with R2 > 0.98.

2.3. EPS Extraction and Chemical Analysis

The extraction of EPS was performed using the cation exchange resin (CER) method [19]. The sludge samples were centrifuged at 2000 g for 15 min at 4 °C, and the supernatant was decanted. Using distilled water, the precipitates were diluted and mixed. The mixture was transferred into an extraction flask and the CER was added. The suspension was stirred for 6 h at 4 °C. The EPS extract was obtained by centrifugation at 12,000 g for 1 min. After filtration, the supernatant was used to measure the concentration of the EPS. The content of proteins (PNs) and humic acid were determined by the correction Bradford approach [20]. Polysaccharides (PS) were measured using the phenol–sulfuric method using glucose as the standard [21]. The EPS were extracted in triplicate for every sludge sample.

2.4. Analytical and Statistic Analysis Methods

NH4+-N, NO2-N and NO3-N, MLSS concentrations, and the sludge volume index (SVI) were measured according to the standard methods [22]. The DO and pH were determined using DO and pH probes (HACH HQ40d, Loveland, CO, USA). In addition, the morphology of the granules was examined with SEM (S-520, Hitachi, Tokyo, Japan) according to the sample treatment method described by previous study [23]. The N2O concentration was measured with gas chromatography (SP-3410, Beijing, China) using an electron capture detector (ECD) and a Poropak Q column. The N2O emission quantity was calculated as presented by previous study [24]. The Significant Difference (p) of EPS, nitrogen concentration and functional genes under different F/M ratios were calculated with a t-test. Average values of three samples were reported as the results (including nitrogen concentration, N2O emission and DO concentration).

3. Results

3.1. Characterization of Aerobic Granular Sludge under Different F/M Ratios

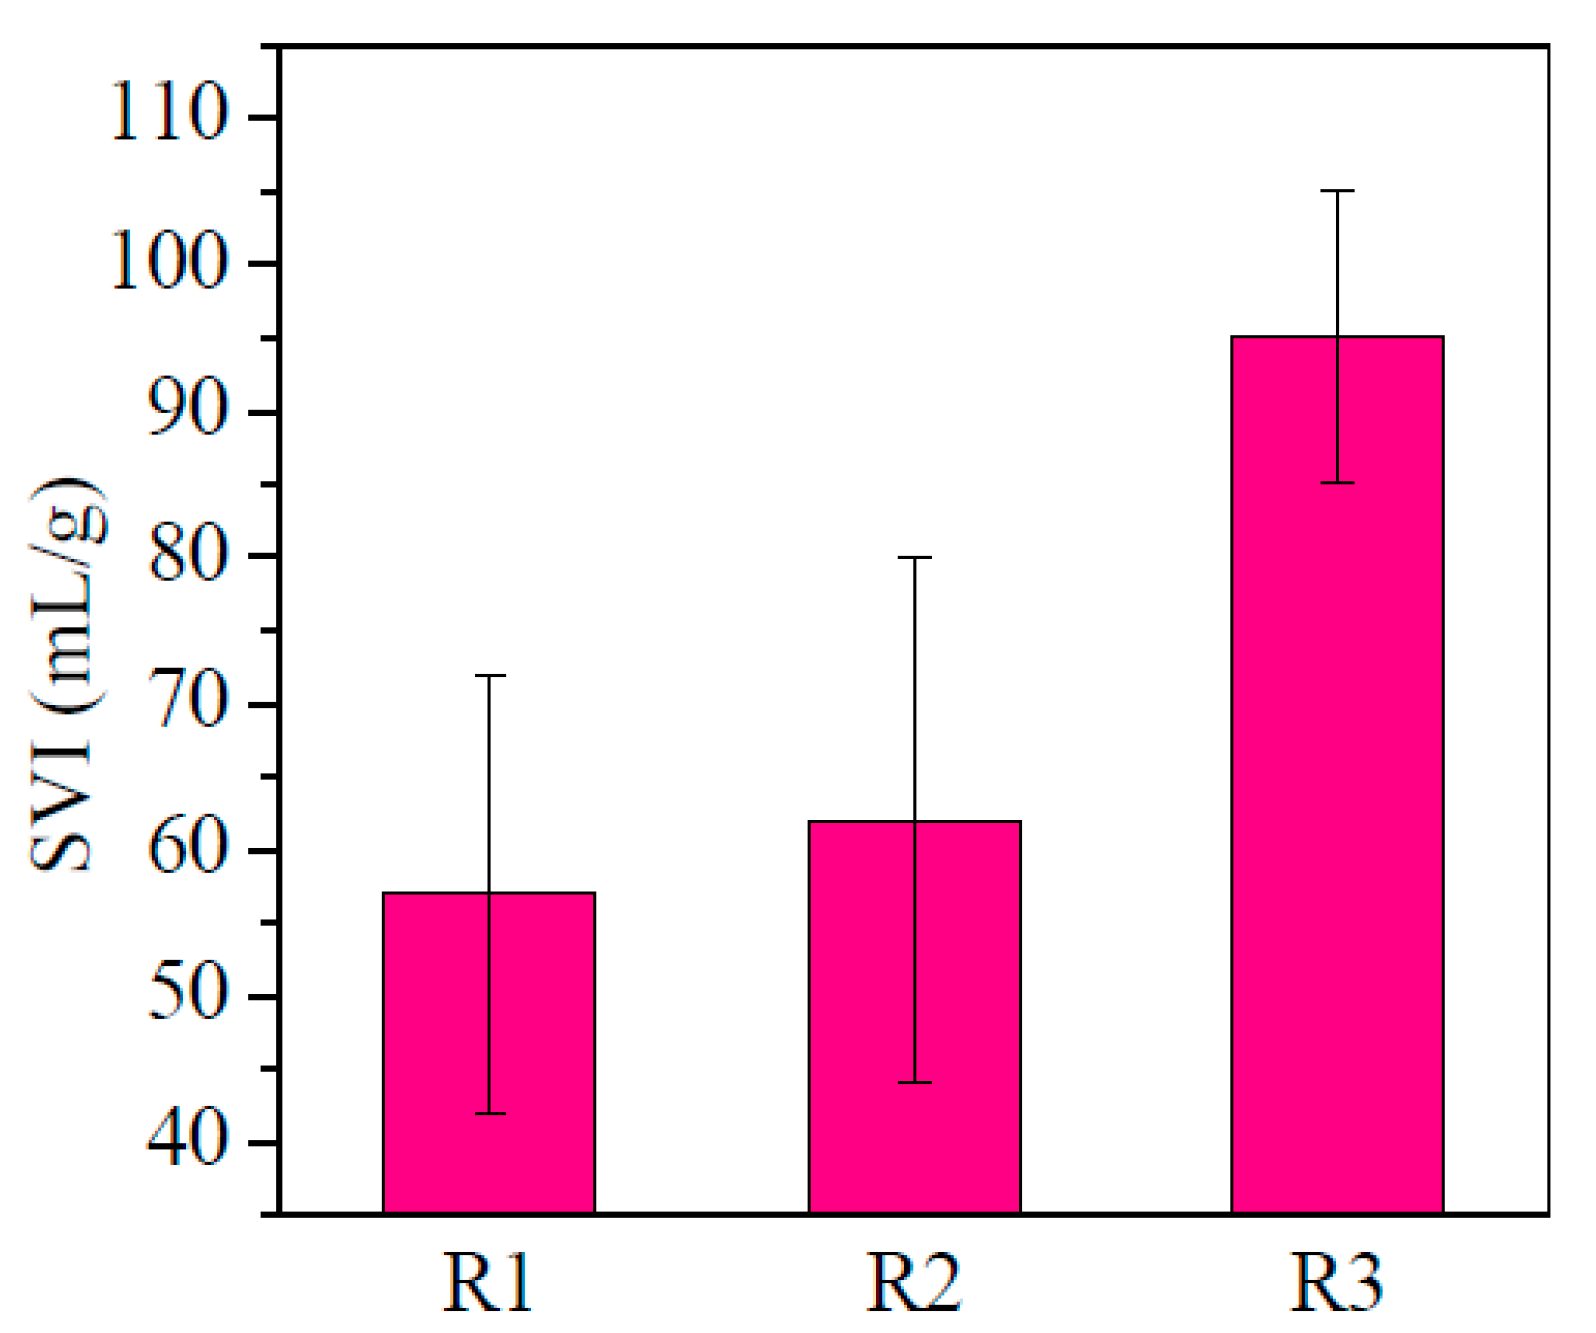
3.1.1. The Settling Ability
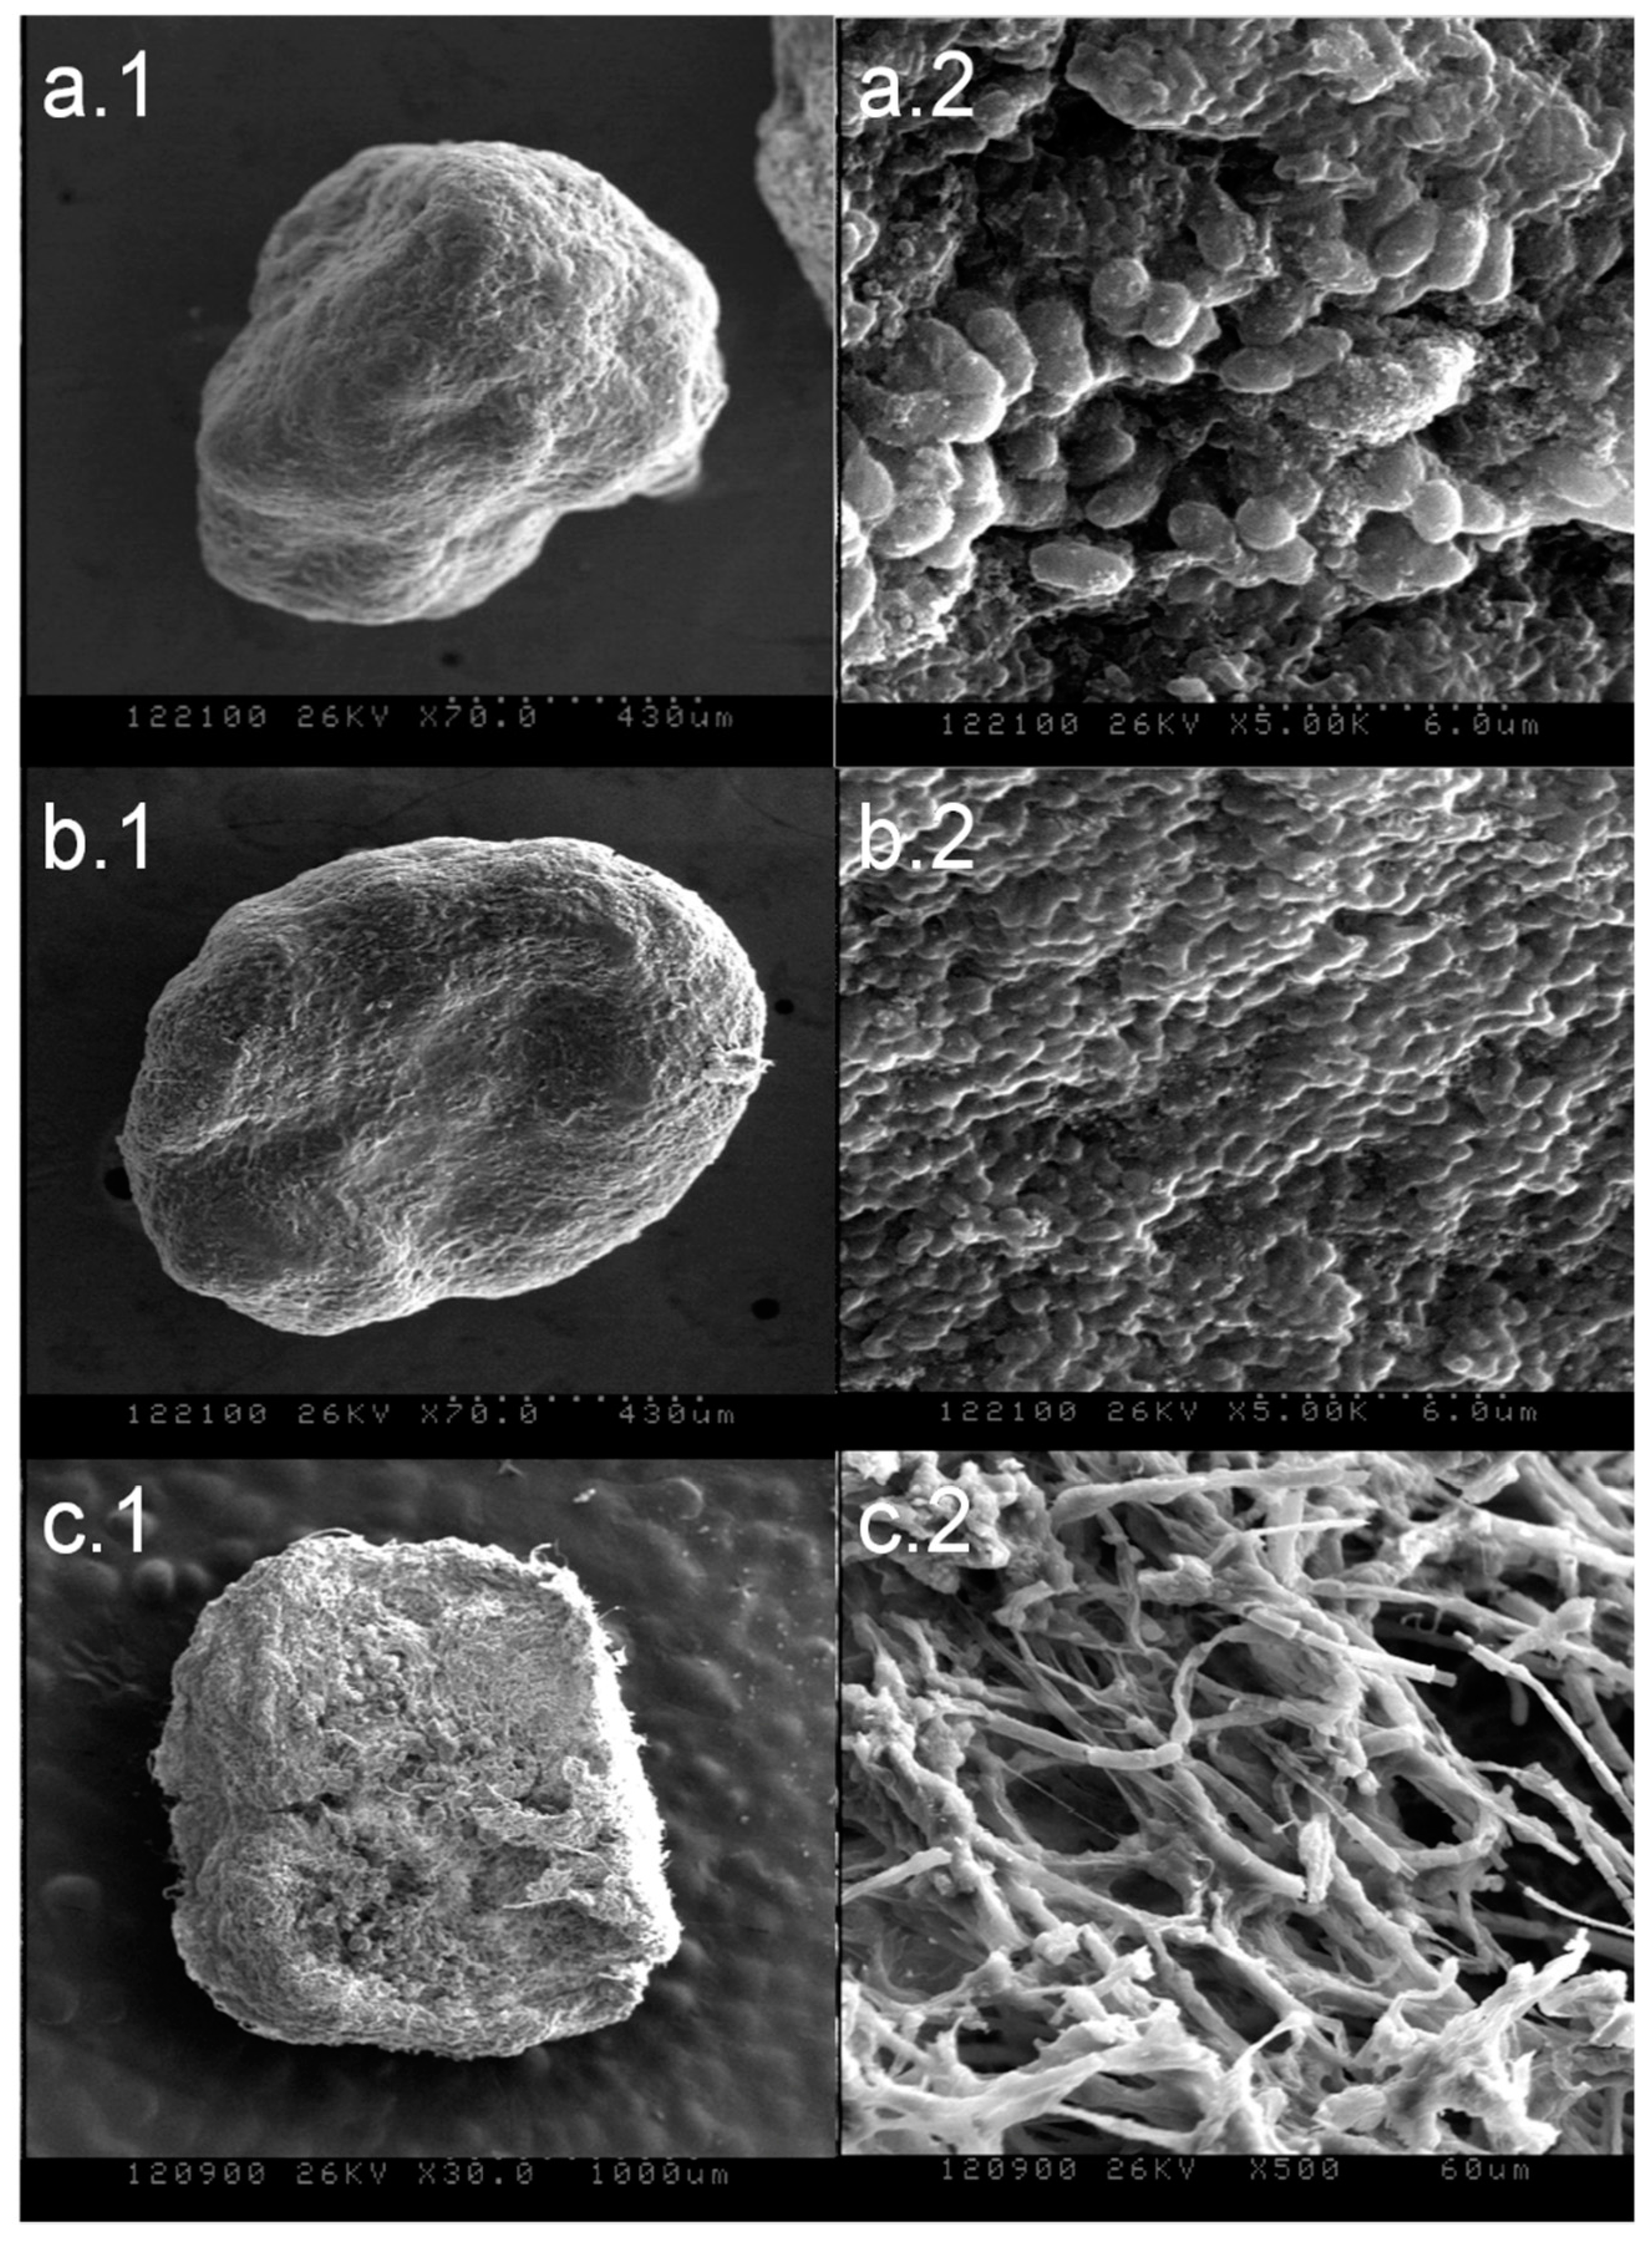
Figure 1 shows the SVI values under different F/M ratios. The F/M ratios had an important influence on the settling ability of aerobic granular sludge. The SVI of R3 (F/M ratio of 0.67 g COD/g SS) was the highest among the three reactors, indicating that the settling ability of R3 was poor. The SVI values of R1 and R2 were lower than for R3, indicating that the settling ability of R1 and R2 were better than for R3.

3.1.2. SEM Analysis

SEM was conducted to determine the specific microstructures of aerobic granules. As shown in Figure 2, granules of both R1 and R2 (lower F/M ratios; 0.2 and 0.34 g COD/g SS) had a distinct and dense physical structure; in addition, rod-shaped bacteria were predominant microorganisms, and cells were tightly attached. Aerobic granules of R3 (higher F/M ratio; 0.67 g COD/g SS) exhibited a loose, fluffy morphology (Figure 2c.1), and several granules with crude surfaces and porous structures had disintegrated. Moreover, the dominant bacteria were filamentous bacteria (Figure 2c.2).

3.1.3. The Characteristics of EPS

EPS are viscous substances secreted by microorganisms, which are mainly composed of PS, PN and humic acid [25]. Table 2 shows that the EPS content increased with an increase of the F/M ratio. The EPS of R3 at a high F/M ratio was 20.34 mg/g MLSS, which was the largest among the different F/M ratios. PS was the major constituent of EPS, relative to PN and humic acid. PS of R3 (8.27 mg/g MLSS) was significantly less than that of the other reactors. The content of humic acid in R3 (4.27 ± 0.62 mg/g MLSS) was the most abundant among the three reactors.

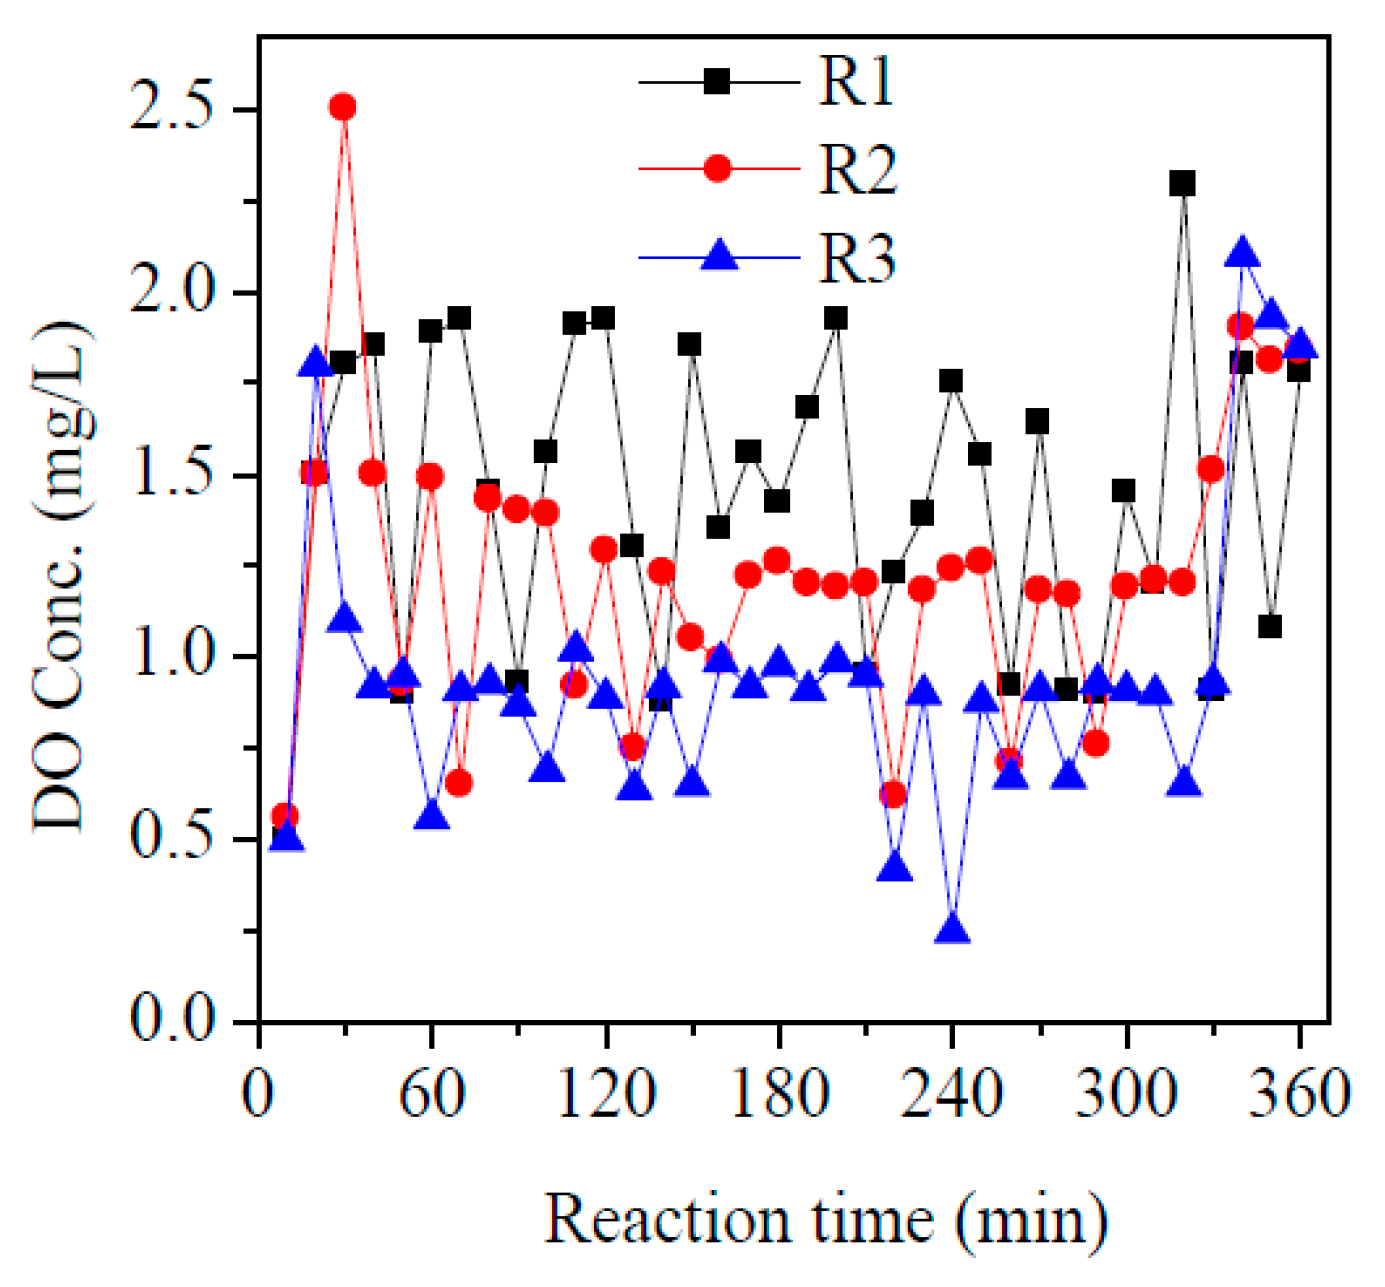
3.2. Performance of Aerobic Granular Sludge SBARs under Different F/M Ratios

To investigate the degradation process of the pollutants and N2O emissions, batch experiments were carried out. The performance of aerobic granular sludge SBARs under different F/M ratios is shown in Figure 3. Figure 3 shows that the performance of the three reactors had a similar trend of change during the 6 h cycle. NH4+-N of all reactors was removed rapidly, and the effluent concentration was maintained under 2 mg/L. The NO3-N concentration increased gradually. The NO2-N concentration changed in a similar way to N2O emissions in R3, especially at 240 min, demonstrating that the NO2-N concentration played an important role in N2O emissions.
The specific N2O emissions and N2O-N conversion results are shown in Table 3. The emission of N2O increased with an increased F/M ratio. The N2O emission in R3 was the highest (4.4 ± 0.94 mg/d) and the N2O-N conversion was 3.79%. Moreover, the results indicated that NH4+-N and COD removal efficiencies of R1, R2, and R3 were above 90%. It should be noted that the NH4+-N removal efficiency was the highest. Thus an excellent NH4+-N and COD removal were obtained in aerobic granular sludge SBARs.
The DO concentration under different F/M ratios is shown in Figure 4. The DO concentration decreased as the F/M ratio increased. The DO concentration of R3 was much lower than for R1 and R2. This indicated that under the same aeration rate, more DO was consumed by a higher F/M ratio in aerobic granular sludge.

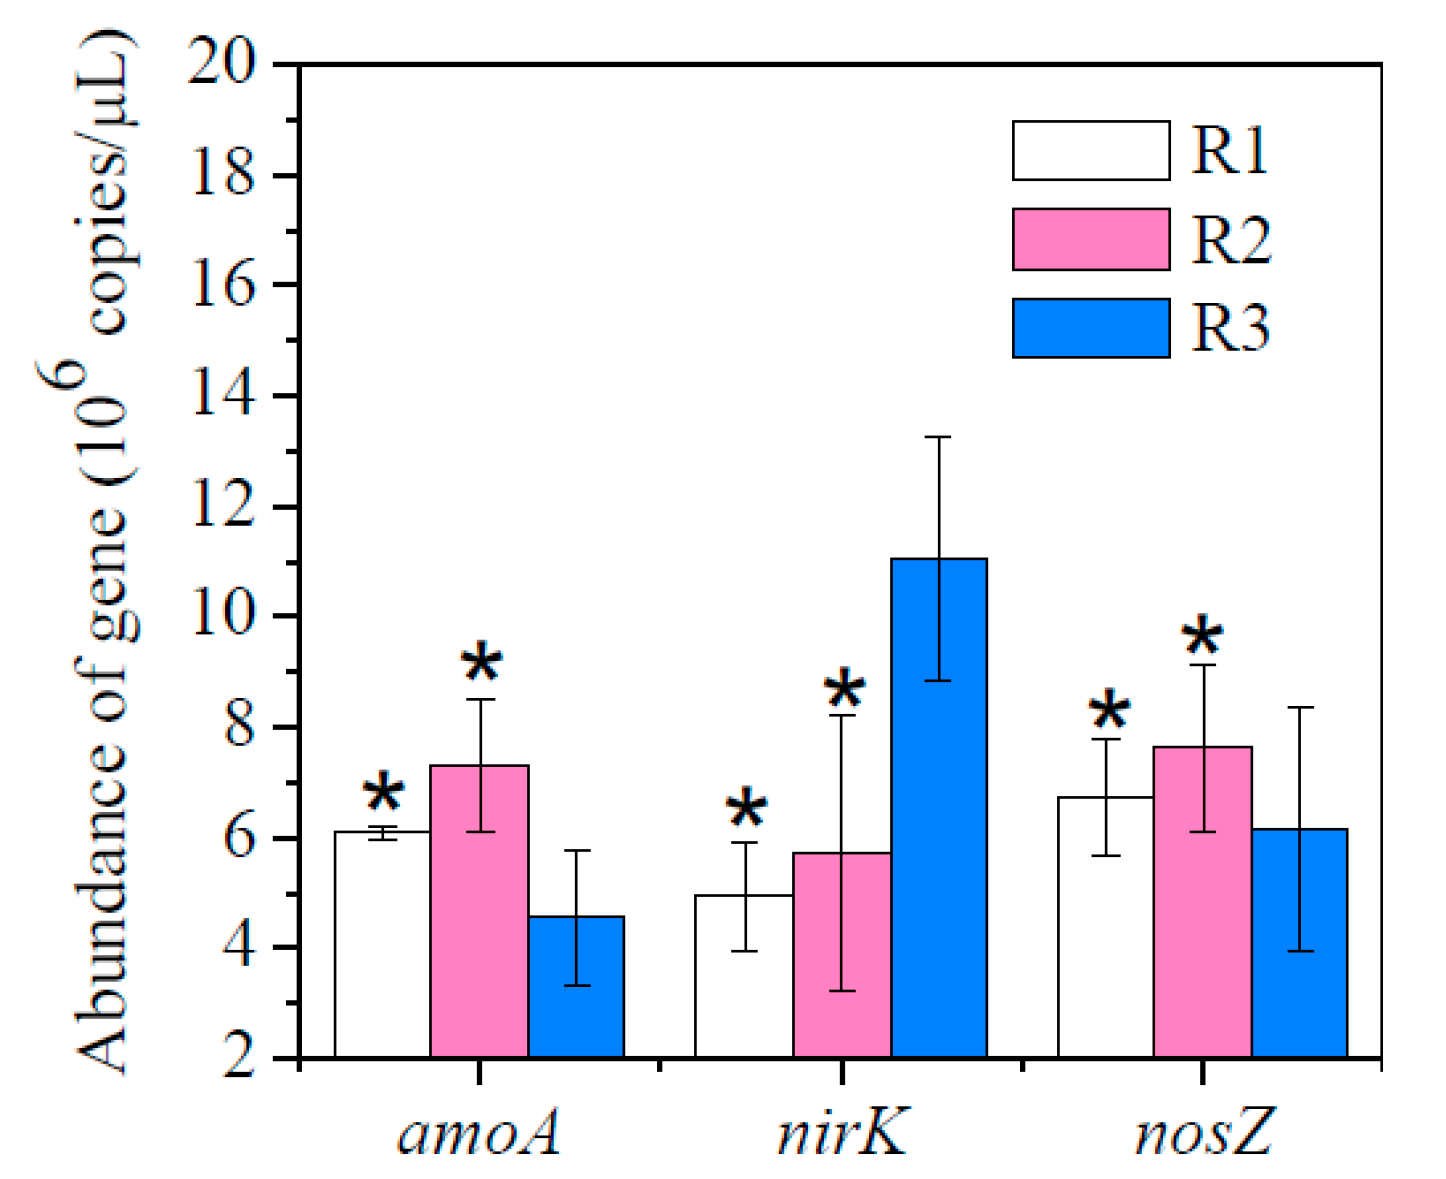
3.3. The Abundance of Functional Genes under Different F/M Ratios

The ammonia monooxygenase submit A gene (amoA) is an especially useful molecular marker for ammonia-oxidizing bacteria, and the denitrification of ammonia-oxidizing bacteria (AOB) is catalyzed by a copper-containing nitrite reductase (nirK). The nitrous oxide reductase enzyme (nosZ) represents denitrifiers [14]. The three functional genes were quantified using qPCR to determine the main N2O emission sources in the three reactors. Figure 5 shows the abundances of amoA, nirK and nosZ genes in aerobic granular sludge under different F/M ratios. The results indicated that there were big differences in the abundances of amoA, nirK, and nosZ genes in the three reactors. The abundance of amoA and nosZ in R3 were the lowest; in contrast, the abundance of nirK was the highest.

4. Discussion

4.1. Characterization of Aerobic Granular Sludge

4.1.1. The Stability of Aerobic Granular Sludge

We found that the settling ability of R3 was poor, and aerobic granules of R3 exhibited a loose, fluffy morphology. This indicated that the granules were unstable. However, this was inconsistent with the previous studies finding that glucose-fed aerobic granular sludge had a compact shape under a higher organic loading (15 kg COD/(m3·d)), with the same MLSS as for R3 [26]. This was likely due to the organic loading threshold for the instability of aerobic granules depending on the varieties of substrates [27]. The granules could not suffer higher organic loadings when the main carbon source was sodium acetate, however, glucose-fed granules could sustain a higher organic loading.
Furthermore, the dominance of filamentous bacteria resulting in the porous structure of the granules was another contributor to the instability of the aerobic granules in R3. It has been reported that the overgrowth of filamentous microorganisms could result in the disintegration of granules [28]. However, excess filamentous bacteria were generally caused by lower F/M ratios in previous study [28]. This was due to low DO concentrations (<1.1 mg/L) having a strong positive effect on the proliferation of filaments [29]. Therefore, the lowest DO concentration in R3 among the three reactors resulted in the dominance of filamentous bacteria. In contrast, rod-shaped bacteria were the predominant microorganisms in R1 and R2 with higher DO concentrations.
Moreover, PS was also an important factor for the unstable structure of aerobic granules in R3. PS has been reported as a polymeric viscous material that can stick to microbes and enhance the aggregation of microbes. In addition, the filamentous PS among the microbes can connect the dispersive microbes and the communities [30]. Therefore, the fewer PS of R3, relative to R1 and R2, partially resulted in the poor stability of granular sludge.

4.1.2. The Characteristics of EPS

The EPS of R3 at high F/M ratios was the largest among the different F/M ratios. This could be explained by sufficient organic materials sustaining the metabolism of many microbes. In addition, the storages in EPS can serve as substrates for bacterial maintenance in the famine period; the biomass at low F/M ratios would consume more EPS for bacterial maintenance, which would result in less EPS. The content of humic acid in R3 was the most abundant among the three reactors. It has been reported that the sludge retention time affects the content and composition of EPS, and a low sludge retention time could result in a high content of humic acid [31]. Based on the amount of sludge discharge from the three reactors, the sludge retention time was the lowest in R3 among the three reactors. The lowest sludge retention time in R3 may have resulted in the most abundant humic acid among the three reactors.

4.2. N2O Emission of Aerobic Granular Sludge

Nitrifer denitrification and heterotrophic denitrification are widely acknowledged to be the two main processes responsible for N2O emissions in aerobic granular sludge [16]. N2O emissions during nitrifier denitrification and heterotrophic denitrification have been known to be executed by certain bacteria species, mainly AOB and denitrifiers [14,15]. To determine the mechanism of N2O emission in aerobic granular sludge, the genes nirK and nosZ, which represented the denitrification of AOB, and denitrifiers were quantified using qPCR method. The results of this study showed that the abundance of nirK was the highest, while the abundance of nosZ in R3 was the lowest among the three reactors. This indicated that the high N2O emissions in R3 were mainly from nitrifier denitrification, and heterotrophic denitrification was inhibited.
The inhibited heterotrophic denitrification was due to the anaerobic environment being destroyed by the DO diffusing into the sludge particles of R3 with the porous structure. The poor performance of heterotrophic denitrification resulted in the accumulation of NO2-N. However, NO3-N was not accumulated at the end of batch experiment. This partially resulted from adsorption by the porous granules of R3. Moreover, as discussed in detail later, the inhibited nitrification was another contributor to the low NO3-N concentration. The enhanced nitrifier denitrification might be attributable to the lowest DO concentration and the accumulation of NO2-N in R3. It has been reported that oxygen stress was an important factor for nitrifier denitrification, and N2O yields under oxygen limiting conditions by nitrifier denitrification could increase [32]. Furthermore, the accumulated NO2-N promoted the denitrification of AOB through boosting the expression of the nirK gene [33].
The lowest abundance of amoA indicated that nitrification in R3 was inhibited. The lower DO concentration in R3 was the major driver for the inhibited nitrification [34]. However, the NH4+-N removal was not inhibited. This was likely due to adsorption by the porous granules of R3. Nevertheless, the specific adsorbing capacity was not determined in this study because of the complex adsorption process. Therefore, further investigation is needed. In addition, the relatively low sludge retention time may have contributed to the poor nitrification. It has been reported that a low sludge retention time affects the ammonia oxidation [35].

5. Conclusions

It was found that the F/M ratio had an important effect on the N2O emissions in aerobic granular sludge SBARs. N2O emissions increased with an increased F/M ratio. The ratios of N2O-N to the removed NH4+-N were 2.77%, 2.94% and 3.79% at F/M ratios of 0.2, 0.34, and 0.67 g COD/g SS, respectively. The high N2O emission under the F/M ratio of 0.67 g COD/g SS was mainly from nitrifier denitrification rather than heterotrophic denitrification. The heterotrophic denitrification was destroyed by the DO diffusing into the sludge particles at the high F/M ratio of 0.67 g COD/g SS with porous structures. The enhanced nitrifier denitrification may have been attributable to the low DO concentration and the accumulation of NO2-N. This study could provide scientific reference for research on N2O emissions, and can offer guidance for conducting risk assessment and enhancing our ability to predict N2O production in aerobic granular sludge at different F/M ratios.

Acknowledgments

This research was supported by the National Natural Science Foundation of China (51178254, 51208283 and 51508309).

Author Contributions

N.G., J.Z. and H.-J.X. conceived and designed the experiments; N.G. and L.-R.T. performed the experiments; N.G., Z.-Y.T. and J.-N.L. analyzed the data; J.Z. and S.-G.W. contributed reagents/materials; N.G. wrote the paper.

Conflicts of Interest

The authors declare no conflict of interest.

References

  1. Shi, Y.-J.; Wang, X.-H.; Yu, H.-B.; Xie, H.-J.; Teng, S.-X.; Sun, X.-F.; Tian, B.-H.; Wang, S.-G. Aerobic granulation for nitrogen removal via nitrite in a sequencing batch reactor and the emission of nitrous oxide. Bioresour. Technol. 2011, 102, 2536–2541. [Google Scholar] [CrossRef] [PubMed]
  2. Cassidy, D.P.; Belia, E. Nitrogen and phosphorus removal from an abattoir wastewater in a SBR with aerobic granular sludge. Water Res. 2005, 39, 4817–4823. [Google Scholar] [CrossRef] [PubMed]
  3. Adav, S.S.; Lee, D.-J.; Show, K.-Y.; Tay, J.-H. Aerobic granular sludge: Recent advances. Biotechnol. Adv. 2008, 26, 411–423. [Google Scholar] [CrossRef] [PubMed]
  4. Foley, J.; de Haas, D.; Yuan, Z.; Lant, P. Nitrous oxide generation in full-scale biological nutrient removal wastewater treatment plants. Water Res. 2010, 44, 831–844. [Google Scholar] [CrossRef] [PubMed]
  5. Kampschreur, M.J.; Temmink, H.; Kleerebezem, R.; Jetten, M.S.M.; van Loosdrecht, M.C.M. Nitrous oxide emission during wastewater treatment. Water Res. 2009, 43, 4093–4103. [Google Scholar] [CrossRef] [PubMed]
  6. Sabba, F.; Picioreanu, C.; Perez, J.; Nerenberg, R. Hydroxylamine diffusion can enhance N2O emissions in nitrifying biofilms: A modeling study. Environ. Sci. Technol. 2015, 49, 1486–1494. [Google Scholar] [CrossRef] [PubMed]
  7. Wunderlin, P.; Mohn, J.; Joss, A.; Emmenegger, L.; Siegrist, H. Mechanisms of N2O production in biological wastewater treatment under nitrifying and denitrifying conditions. Water Res. 2012, 46, 1027–1037. [Google Scholar] [CrossRef] [PubMed]
  8. Trussell, R.S.; Merlo, R.P.; Hermanowicz, S.W.; Jenkins, D. The effect of organic loading on process performance and membrane fouling in a submerged membrane bioreactor treating municipal wastewater. Water Res. 2006, 40, 2675–2683. [Google Scholar] [CrossRef] [PubMed]
  9. Tang, H.; Liu, G. Cross effects of organic loadings rates and substrate COD/N/P ratios on aerobic granulation. In Proceedings of the 4th International Conference on Bio-informaticsand Biomedical Engineering, Chengdu, China, 18–20 June 2010. [Google Scholar]
  10. Tay, J.H.; Yan, Y.-G. Influence of substrate concentration on microbial selection and granulation during start-up of upflow anaerobic sludge blanket reactor. Water Environ. Res. 1996, 68, 1140–1150. [Google Scholar] [CrossRef]
  11. Moy, B.Y.; Tay, J.-H.; Toh, S.-K.; Liu, Y.; Tay, S.T. High organic loading influences the physical characteristics of aerobic sludge granules. Lett. Appl. Microbiol. 2002, 34, 407–412. [Google Scholar] [CrossRef] [PubMed]
  12. Adav, S.S.; Lee, D.J.; Lai, J.Y. Potential cause of aerobic granular sludge breakdown at high organic loading rates. Appl. Microbiol. Biotechnol. 2010, 85, 1601–1610. [Google Scholar] [CrossRef] [PubMed]
  13. Meyer, R.L.; Zeng, R.J.; Giugliano, V.; Blackall, L.L. Challenges for simultaneous nitrification, denitrification, and phosphorus removal in microbial aggregates: Mass transfer limitation and nitrous oxide production. FEMS Microbiol. Ecol. 2005, 52, 329–338. [Google Scholar] [CrossRef] [PubMed]
  14. Jia, W.L.; Liang, S.; Zhang, J.; Ngo, H.H.; Guo, W.S.; Yan, Y.J.; Zou, Y.N. Nitrous oxide emission in low-oxygen simultaneous nitrification and denitrification process: Sources and mechanisms. Bioresour. Technol. 2013, 136, 444–451. [Google Scholar] [CrossRef] [PubMed]
  15. Pijuan, M.; Tora, J.; Rodriguez-Caballero, A.; Cesar, E.; Carrera, J.; Perez, J. Effect of process parameters and operational mode on nitrous oxide emissions from a nitritation reactor treating reject wastewater. Water Res. 2014, 49, 23–33. [Google Scholar] [CrossRef] [PubMed]
  16. Kong, Q.; Zhang, J.; Ngo, H.H.; Ni, S.Q.; Fu, R.S.; Guo, W.S.; Guo, N.; Tian, L. Nitrous oxide emission in an aerobic granulation sequencing batch airlift reactor at ambient temperatures. Int. Biodeterior. Biodegrad. 2013, 85, 533–538. [Google Scholar] [CrossRef]
  17. Guo, N.; Wang, Y.; Yan, L.; Wang, X.; Wang, M.; Xu, H.; Wang, S. Effect of bio-electrochemical system on the fate and proliferation of chloramphenicol resistance genes during the treatment of chloramphenicol wastewater. Water Res. 2017, 117, 95–101. [Google Scholar] [CrossRef] [PubMed]
  18. Ligi, T.; Truu, M.; Truu, J.; Nõlvak, H.; Kaasik, A.; Mitsch, W.J.; Mander, Ü. Effects of soil chemical characteristics and water regime on denitrification genes (nirS, nirK, and nosZ) abundances in a created riverine wetland complex. Ecol. Eng. 2014, 72, 47–55. [Google Scholar] [CrossRef]
  19. Frølund, B.; Palmgren, R.; Keiding, K.; Nielsen, P.H. Extraction of extracellular polymers from activated sludge using a cation exchange resin. Water Res. 1996, 30, 1749–1758. [Google Scholar] [CrossRef]
  20. Bradford, M.M. A rapid and sensitive method for the quantitation of microgram quantities of protein utilizing the principle of protein-dye binding. Anal. Biochem. 1976, 72, 248–254. [Google Scholar] [CrossRef]
  21. DuBois, M.; Gilles, K.A.; Hamilton, J.K.; Rebers, P.A.; Smith, F. Colorimetric Method for Determination of Sugars and Related Substances. Anal. Chem. 1956, 28, 350–356. [Google Scholar] [CrossRef]
  22. Walter, W.G. Standard methods for the examination of water and wastewater (11th ed.). Am. J. Public Health Nations Health 1961, 51, 940. [Google Scholar] [CrossRef]
  23. Diao, M.; Li, X.Y.; Gu, J.D.; Shi, H.C.; Xie, Z.M. Electron microscopic investigation of the bactericidal action of electrochemical disinfection in comparison with chlorination, ozonation and Fenton reaction. Process. Biochem. 2004, 39, 1421–1426. [Google Scholar] [CrossRef]
  24. Hu, Z.; Zhang, J.; Xie, H.; Li, S.; Zhang, T.; Wang, J. Identifying sources of nitrous oxide emission in anoxic/aerobic sequencing batch reactors (A/O SBRs) acclimated in different aeration rates. Enzyme Microb. Technol. 2011, 49, 237–245. [Google Scholar] [CrossRef] [PubMed]
  25. Adav, S.S.; Lee, D.J.; Tay, J.H. Extracellular polymeric substances and structural stability of aerobic granule. Water Res. 2008, 42, 1644–1650. [Google Scholar] [CrossRef] [PubMed]
  26. Xavier, J.B.; De Kreuk, M.K.; Picioreanu, C.; Van Loosdrecht, M.C.M. Multi-scale individual-based model of microbial and bioconversion dynamics in aerobic granular sludge. Environ. Sci. Technol. 2007, 41, 6410–6417. [Google Scholar] [CrossRef] [PubMed]
  27. Osaka, T.; Shirotani, K.; Yoshie, S.; Tsuneda, S. Effects of carbon source on denitrification efficiency and microbial community structure in a saline wastewater treatment process. Water Res. 2008, 42, 3709–3718. [Google Scholar] [CrossRef] [PubMed]
  28. Liu, Y.; Liu, Q.-S. Causes and control of filamentous growth in aerobic granular sludge sequencing batch reactors. Biotechnol. Adv. 2006, 24, 115–127. [Google Scholar] [CrossRef] [PubMed]
  29. Martins, A.M.P.; Heijnen, J.J.; van Loosdrecht, M.C.M. Effect of dissolved oxygen concentration on sludge settleability. Appl. Microbiol. Biotechnol. 2003, 62, 586–593. [Google Scholar] [CrossRef] [PubMed]
  30. Tay, J.H.; Liu, Q.S.; Liu, Y. The role of cellular polysaccharides in the formation and stability of aerobic granules. Lett. Appl. Microbiol. 2001, 33, 222–226. [Google Scholar] [CrossRef] [PubMed]
  31. Al-Halbouni, D.; Traber, J.; Lyko, S.; Wintgens, T.; Melin, T.; Tacke, D.; Janot, A.; Dott, W.; Hollender, J. Correlation of EPS content in activated sludge at different sludge retention times with membrane fouling phenomena. Water Res. 2008, 42, 1475–1488. [Google Scholar] [CrossRef] [PubMed]
  32. Colliver, B.B.; Stephenson, T. Production of nitrogen oxide and dinitrogen oxide by autotrophic nitrifiers. Biotechnol. Adv. 2000, 18, 219–232. [Google Scholar] [CrossRef]
  33. Martin, G.K.; Lisa, Y.S. Nitrifier genomics and evolution of the nitrogen cycle. FEMS Microbio. Lett. 2008, 278, 146–156. [Google Scholar]
  34. Meng, Q.; Yang, F.; Liu, L.; Meng, F. Effects of COD/N ratio and DO concentration on simultaneous nitrifcation and denitrifcation in an airlift internal circulation membrane bioreactor. J. Environ. Sci. 2008, 20, 933–939. [Google Scholar] [CrossRef]
  35. Pai, T.-Y.; Wan, T.-J.; Tsai, Y.-P.; Tzeng, C.-J.; Chu, H.-H.; Tsai, Y.-S.; Lin, C.-Y. Effect of Sludge Retention Time on Nitrifiers’ Biomass and Kinetics in an Anaerobic/Oxic Process. CLEAN Soil Air Water 2010, 38, 167–172. [Google Scholar] [CrossRef]
Figure 1. The settling ability of aerobic granular sludge of different F/M ratios.
Water 09 00477 g001
Figure 2. SEM (scanning electron microscopy) images of the mature aerobic granular sludge of different F/M ratios. (ac) represent 0.2, 0.34 and 0.67 g COD/g SS, respectively, for which (1) and (2) represent different magnifications.
Water 09 00477 g002
Figure 3. Performance of aerobic granular sludge SBARs under different F/M ratios.
Water 09 00477 g003
Figure 4. DO concentrations during a 6 h cycle in aerobic granular sludge SBARs under different F/M ratios.
Water 09 00477 g004
Figure 5. Quantitative changes in the abundances of functional genes in aerobic granular sludge SBARs under different F/M ratios.
Water 09 00477 g005
Table 1. Target genes and primers used in this study.
Target PrimersPrimersPrimer SequenceAnnealing (°C)
16SF338/R518ACTCCTACGGGAGGCAGCAGATTACCGCGGCTGCTGG55
amoAamoA-1F/amoA-2RGGGGTTTCTACTGGTGGTCCCCTCKGSAAAGCCTTCTTC53
nirKFlaCu/R3CuATCATGGTSCTGCCGCGGCCTCGATCAGRTTGTGGTT55
nosZnosZ-F/nosZ-1622RCGYTGTTCMTCGACAGCCAGCGSACCTTSTTGCCSTYGCG56
Table 2. The content of EPS 1 and components of aerobic granular sludge SBARs 2 under different F/M ratios.
EPS Compostions (mg/g MLSS)R1R2R3
Protein content3.86 ± 0.23 *5.23 ± 0.28 *7.81 ± 0.97
Humic acid content1.57 ± 0.16 *1.55 ± 0.19 *4.27 ± 0.62
Polysaccharide content9.21 ± 0.33 *11.83 ± 0.46 *8.27 ± 0.48
EPS content14.64 ± 0.74 *18.6 ± 0.96 *20.34 ± 1.24
Note: An asterisk (*) represents a statistical difference of content in EPS between the samples among R1, R2 and R3 (p < 0.05). 1 Extracellular polymeric substances. 2 Sequencing batch airlift reactors.
Table 3. The N2O emissions and NH4+-N and COD removal efficiencies in aerobic granular sludge SBARs under different F/M ratios.
Removal Efficiency and N2O EmissionR1R2R3
N2O emission (mg/d); N2O-N conversion (%)3.32 ± 0.86 *; 2.77 ± 0.56 *3.64 ± 0.38 *; 2.6 ± 0.69 *4.4 ± 0.94; 3.79 ± 0.48
NH4+-N removal (%)95.20 ± 3.1396.30 ± 2.9899.30 ± 2.79
COD removal (%)93.50 ± 3.494.5 ± 4.590.3 ± 6.91
Note: An asterisk (*) represents a statistical difference of removal efficiency and N2O emissions among R1, R2 and R3 (p < 0.05).

