Combined Impact of Acute Exposure to Ammonia and Temperature Stress on the Freshwater Mussel Unio pictorum


1
Aquatic Systems Biology Unit, Technical University of Munich, School of Life Sciences Weihenstephan, Muehlenweg 22, D-85350 Freising, Germany
2
Laboratory of Applied Physiology, Department of Aquatic Production, ICBAS-Abel Salazar Institute for Biomedical Sciences—University of Porto, Rua Jorge Viterbo Ferreira 228, 4050-313 Porto, Portugal
3
CIIMAR—Interdisciplinary Centre of Marine and Environmental Research—University of Porto—Terminal de Cruzeiros do Porto de Leixões, Av. General Norton de Matos s/n, 4450-208 Matosinhos, Portugal
*
Author to whom correspondence should be addressed.
Water 2017, 9(7), 455; https://doi.org/10.3390/w9070455
Submission received: 13 April 2017
/
Revised: 8 June 2017
/
Accepted: 20 June 2017
/
Published: 23 June 2017
Abstract
:Nitrogen compounds, particularly ammonia, and temperature are suspected major stressors for aquatic organisms, but little is known about their impact on globally declining freshwater mussels (Unionoida). In this study, we tested the combined effects of ammonia and temperature stress on painter’s mussel (Unio pictorum) survival, filtration behavior, hemocyte abundance, hemocyte mortality and glycogen energy status, at concentrations ranging from 0.3 to 9.0 mg·L−1 total ammonia nitrogen (NH4-N) in 96 h acute exposures at two temperatures, 17 °C and 25 °C and a pH of 8.8. The results indicate a low sensitivity of U. pictorum to elevated ammonia concentrations after short-term exposure, although effects on cell morphology were evident and delayed mortality occurred at the highest test concentration. Most pronounced effects were observed for sublethal physiological endpoints due to elevated temperature, but no synergistic effects with ammonia were evident. Temperature increase resulted in significant effects on tissue glycogen, hyalinocyte mortality and clearance rates. Hemocyte mortalities showed a linear dependency on initial mussel activity as measured by their clearance rate. Since the main stressors tested in this study, ammonia and temperature, are predicted to increase in most freshwater ecosystems, their impact on other freshwater mussel species including different life-stages should be comprehensively assessed.
1. Introduction
Freshwater mussels, particularly Unionoidae and Margaritiferidae, rank among the most endangered organisms in freshwater ecosystems and have experienced a global decline in species richness, distribution and abundance [1,2,3]. Their specific life-history traits, feeding types, constrained mobility, complex life-cycles and comparatively long life spans make them extremely sensitive to disturbances in habitat and water quality such as environmental pollution [1,3,4,5]. Mussels are known to play a key role in ecosystem processes by their influence on nutrient cycling, bioturbation and deposition of suspended materials [6,7,8,9,10,11]. For instance, they can transfer nutrients from open water to the benthic zone, e.g., through biodeposition of (pseudo)feces and excretion of ammonium. The understanding of possible causes for population declines as well as evidence-based conservation and restoration approaches for freshwater mussels are urgently needed, due to the high conservation priority of this taxonomic group [12,13,14].
In terms of water contaminants, reactive nitrogen compounds, mainly ammonia and nitrate, are suspected to have negative effects on freshwater fish [15] and mussels [16,17,18,19,20]. On a local scale, the respective land-use practices in the watershed are known to contribute to increased nitrogen input and negative effects on freshwater community compositions [21]. Anthropogenic sources, including industrial wastes, sewage discharge, agricultural runoff, and animal farming, contribute mostly to total nitrogen emission that are then transported into aquatic ecosystems at potentially hazardous concentrations [22]. For instance, leakages of digestates from biogas fermenters have been linked with peak contaminations of ammonia in stream habitats [23]. Physiological responses associated to ammonia exposure are suspected to lead to reduction in feeding, fecundity and survivorship, resulting in decreased bivalve populations [24].
Ammonia and ammonium are in equilibrium between the toxic unionized form NH3 and the ionized form NH4+, with the percentage of the toxic form increasing at higher pH values, and a greater toxicity at higher temperatures [25]. Consequently, simultaneous exposure to ammonia and temperature stress in light of climate change was considered a highly interesting interaction due to the dissociation behavior of the ammonia ion under elevated temperatures.
Previous studies have demonstrated the toxicity of unionized ammonia to larval [20] and juvenile stages of North American Unionid mussels [18,19]. Acute effect concentrations determined in standard bioassays ranged between 5 and >16 mg·L−1 total ammonia nitrogen for glochidia (24 h EC50) at 20 °C and pH 8.3 and 5.7 to 11.1 mg·L−1 N for juveniles (96 h EC50) at 20 °C and pH 8.3. However, there is a lack of information regarding the toxicity of ammonia to species of European freshwater mussels, which is essential in terms of environmental regulation, conservation and restoration of mussel populations. According to the US Environmental Protection Agency [22], the threshold concentration for protecting freshwater organisms from potential adverse effects of ammonia is 17 mg·L−1 total ammonia nitrogen (TAN) and the final chronic ambient water quality criteria (AWQC) for ammonia is 1.9 mg·L−1 TAN, both at pH 7.0 and temperature 20 °C respectively.
It is generally assumed that accurate measures of toxicity in adult mussels are difficult to obtain, due to their ability to detect toxicants in the water and their avoidance response by closing their valves [26,27,28]. However, Cope et al. [29] reported that the toxicant avoidance response only lasted 24 h after which mussels reopened their valves and became exposed, probably forced by metabolic respiration requirements. Therefore, we assumed that sublethal effects to stressor exposures >24 h could be determined using adequate endpoints such as filtration behavior. The filtration capacity in freshwater bivalves may vary with the experimental design, species, size, age and sex of the animals, but they normally can filter up to several liters of water per hour [30], leading to a high rate of accumulation of environmental contaminants.
The identification of ecotoxicological biomarkers and assays in freshwater mussels is still not consensual, but the content of glycogen as storage carbohydrate has been established as a useful marker for the energetic status of the organism, also making it a physiological indicator for overall fitness in response to stressor exposures [31]. For example, a drastic depletion of glycogen reserves was observed as a consequence of heavy trematode parasitism in Anodonta anatina [32]. In addition to this energy-status related marker, less standardized methods of assessing changes in the immunological response have been proposed as biomarkers for stressor exposure, such as the quantification of hemolymph cells [33]. The cells in the hemolymph, the hemocytes, are the main intervenients in the immune response. The cells together with the humoral components from the hemolymph are very efficient in neutralizing pathogens or other foreign particles. Hemocytes are involved in functions such as phagocytosis, encapsulation, nodule formation, pearl formation, tissue reparation and cell nutrition, but there is little knowledge on the mechanistic interactions among these processes [34,35]. Any effect that environmental stressors exert on the hemocyte composition or functioning may ultimately result in a reduction of immune response effectivity. Their filtration feeding exposes mussels to a variety of toxic compounds and pathogens [36,37] that they seem to overcome well if the immune system is not over-challenged.
We chose the painter´s mussel Unio pictorum (Linnaeus, 1758) as ideal test organism for various reasons: In contrast to other species of freshwater mussels, U. pictorum still have a wide distribution, inhabit a wide range of habitats including lakes and rivers, and are more readily available than other species, which is an important factor in using them as bioindicator in ecotoxicological studies. U. pictorum have been ranked as ´least concern´ by the IUCN in comparison with others native species of more vulnerable status [38], which disqualifies those for standard ecotoxicological experiments. In the present work, we tested the combined impacts of ammonia concentration and temperature stress on U. pictorum evaluating mortality, sublethal effects on filtration behavior, hemocyte composition and morphology (as indicators for impacts on the immune system) as well as energetic status through glycogen quantification. Specifically, we hypothesized a synergistic negative effect of ammonia and temperature on the mussels. This work also intends to evaluate the suitability of different biomarkers to evaluate stressor effects. The assay was conducted at two different temperatures, 17 and 25 °C, which are within the typical average summer temperatures of the habitats of this species. These temperatures are also considered average high and extreme, as reachable due to the climate change scenario [39]. This was done particularly since the increase of temperature was expected to modulate the response of the organisms and since it is known that ammonia toxicity and temperature are positively correlated due to the shift towards the toxic ammonia form NH3.
2. Materials and Methods
2.1. Test Organisms
Adult painter’s mussels (Unio pictorum) were obtained from a commercial supplier (OBI, Wermelskirchen, Germany). Mussels were transported to the Aquatic Systems Biology Unit of TU Munich in Freising (Bavaria, Germany), maintained in aerated containers and allowed to acclimatize to laboratory conditions for three weeks prior to experimental setup. Upon arrival in the laboratory, mussels were held in a flow-through system supplied with local well water (water temperature (T) 12.9 ± 0.22 °C, dissolved oxygen (DO) 8.9 ± 1.2 mg·L−1, electric conductivity (EC, at 25 °C) 1125 ± 5 µS·cm−1, pH ~ 8, hardness (as CaCO3) 482.14 ppm). Mussels were fed every other day with a commercially available shellfish diet, which contains a mixture of four marine microalgae: Isochrysis sp., Pavlova sp., Thalossiosira weissflogii, and Tetraselmis sp. (Shellfish Diet 1800, Reed Mariculture, Campbell, NJ, USA). Each mussel was marked with an individual number (waterproof marker) and length, width, height (measured to the nearest mm) as well as wet weight (measured to the nearest g) was recorded. Measurements were repeated at the end of the experiments. Mussels had a mean ± standard deviation (SD) length, width and height of 83.7 ± 9.3, 36.5 ± 3.9 and 26.5 ± 3.0 mm, respectively, and a mean initial wet weight of 52.1 ± 16.7 g. Additional measurements of dry weight (after 48 h at 60 °C, measured to the nearest g) were taken for shell and soft-tissue of each individual 24 h after termination of the experiment, in order to be able to relate clearance rates and glycogen content to the body mass. Dry weight without shell was on average 2.1 ± 0.9 g. Before dissection of the test animals, delayed mortality effects were recorded within the 24 h after test termination.
2.2. Mussel Exposure
The experimental design for the two selected temperatures (17 °C and 25 °C) comprised several water bath tanks of 50 L, temperature controlled with a programmable thermostat (Biotherm, Dohse Aquaristik, Grafschaft-Gelsdorf, Germany). Individual mussels, each with a specific identification number, were randomly placed in submerged 1.7 L glass beakers and distributed in the tanks following a calculated randomization scheme. One mussel was placed in each beaker. Beakers were individually aerated by air stones. For each test concentration, 6 replicate mussels were used in the 17 °C experiment and 5 replicates in the 25 °C experiment. Additional 18 (17 °C) and 10 (25 °C) replicate mussels served as control without addition of ammonia. Additional beakers without mussels served as water control at each temperature. Acclimatization to experimental temperature conditions were conducted according to the American Standard for Testing and Materials (ASTM) [40], by gradually adjusting the temperature at an increase of no more than 3 °C per hour. When the test temperature was reached, the mussels were maintained for additional 24 h before addition of the test solutions. Before addition of the test solution, the water levels in the tanks were lowered to separate the individual glass beakers containing the mussels. For preparation of the test concentrations, an ammonia stock solution (1000 mg·L−1 total ammonia nitrogen nominal) was prepared using ammonium chloride (Carl Roth GmbH, Karlsruhe, Germany). Respective amounts of the stock solution were added to the test beakers to reach nominal ammonium nitrogen concentrations of 0.3, 0.9, 3.0 and 9.0 mg·L−1. In each tank, all concentrations of ammonia were tested to avoid possible effects from individual water tanks. Concentrations of total NH4-N were determined photometrically for each individual test beaker according to DIN 38406 E5 (Spectroquant® Merk Millipore, Darmstadt, Germany). Concentrations were measured prior to and after the exposure. Fractions of unionized ammonia were calculated using the individual temperature and pH values of each test vessel. Nominal, measured and calculated values are given in Table 1.
Temperature was maintained with thermostats and checked twice a day, as well as the oxygen concentration and pH (Oxi 330i, Multi 340i, WTW, Weilheim, Germany). Water was exchanged every two days with a 50% renewal (850 mL). The mussels were exposed to ammonia for a period of 96 h. Within each temperature treatment, water chemistry and temperature remained constant during the experiment and no significant deviations in any of the measure variables between tanks were detected (with mean values at 17.0 ± 0.22 °C of O2 9.1 ± 0.52 mg·L−1 and pH 8.8 ± 0.1 and at 25.14 ± 0.28 °C of O2 7.2 ± 0.49 mg·L−1 and pH 8.47 ± 0.05).
2.3. Mussel Behavior Assessment
We used three different measures to assess the effects of ammonia nitrogen on mussel behavior: (1) visual observation on filtering activity; (2) filtering activity based on clearance rate (as compared to control mussels); and (3) clearance rate. Experimental determination of clearance rates and visual observations were conducted at the same time.
2.3.1. Visual Observation on Filtering Activity
Visual determination of filtration activity was recorded for each mussel by observing the opening of the shells and visibility of the siphons. Observations were conducted at three time points, 24 h before start of the exposure experiment, at initiation of the exposure experiment and after the 96 h exposure period. We classified the activity status distinguishing to two categories: shell open with visible siphons and active filtration (visually active), or shell closed with no visible siphon and no filtration (visually not active).
2.3.2. Clearance Rate
Clearance rates of U. pictorum were determined following the procedure described by McIvor [30]. For clearance measurement a 4 mL suspension of 154 cells·mL−1 Shellfish Diet 1800® (Reed Mariculture Inc., Campbell, NJ, USA) was mixed into the water in each beaker by agitation. Filtration in form of clearance rate was measured by the reduction of the water samples fluorescence at 460 nm during a 90 min interval (Excitation: 460 ± 20 nm, Emission: >665 nm). Therefore, a 3 mL water sample was removed from the middle of the water column in each beaker in duplicate and measured using a handheld fluorescence photometer (Aquafluor Turner Designs, San Jose, CA, USA). Clearance measurements were conducted at three time points during the exposure period, 24 h before start of the exposure experiment, at initiation of the exposure experiment and after the 96 h exposure period. Beakers were not aerated during these procedures (<2 h), but oxygen levels did not drop below a critical concentration (>6 mg·L−1) as recommended by ASTM [40].
Clearance rates were calculated using Equation (1) [30,41]:
where V is the Volume of the test vessel, C0 is the initial concentration and Ct is the concentration at time t. Control measurements in beakers without mussel were subtracted to account for settlement of the algae over time. The fluorometer was previously calibrated against algal cell density determined by an improved Neubauer chamber (Merck Millipore, Darmstadt, Germany). After determination of clearance rates for each individual, the values were normalized against dry weight (Wd) of the mussels’ soft tissue (CR·Wd−1).
CR = V × ((lnC0 − lnCt)/t)·(mL·h−1)
2.3.3. Filtering Activity Based on Clearance Rate
Filtration of an individual mussel was defined “active” if the clearance rate value was above the mean value for natural sedimentation rates of the added food particles measured in the test vessels without mussels. If clearance values were equal to or below this sedimentation rate value, the mussel was defined as “not active”.
2.4. Hemolymph Collection and Hemocyte Assessment
At termination of the experiment after 96 h, a volume of 1 mL hemolymph was collected from each living specimen. Hemolymph from all mussels used was carefully extracted using a 21 G needle (B. Braun, Melsungen, Germany) attached to a 2 mL sterile syringe (B. Braun, Melsungen, Germany), by insertion between the valves across the inner layer of the mantle into the interepithelial space. Hemolymph samples were put on ice immediately after collection, to avoid aggregation [42,43] and an anticoagulant solution (0.05 M N-ethylmaleimide) was added in a proportion of 1/10 of total volume [44].
Per mussel, three replicate subsamples of hemolymph were analyzed under a light microscope (CKX41, Olympus, Hamburg, Germany) coupled with a digital camera (DP72, Olympus, Hamburg, Germany). Hemocytes were classified into granulocytes and hyalinocytes. To assess the concentration of different hemocytes, cells were counted using an improved Neubauer chamber (Merck Millipore, Darmstadt, Germany). For determination of hemocyte mortality, the viability of the cells was determined using the trypan blue exclusion assay [45,46], which selectively stains cells with damaged membranes. Mortality ratios were calculated from counted stained and colorless cells per sample.
In additional to hemocyte mortality, a qualitative morphological comparison of hemocytes was conducted on a small subsample; therefore three aliquots from the hemolymph of each mussel were set onto a glass slide for adhesion. The coloration technique was conducted following the procedure of Hemacolor® (Merck Millipore, Darmstadt, Germany). Briefly, air dried smears were fixed with methanol, stained and then air-dried again. Prior to observation under the light microscope, the slides were mounted with DPX (Merck Millipore, Darmstadt, Germany) for preservation. Morphological parameters, like cell shape and size, tendency of the cells to aggregate, presence/absence of granules and pseudopods where observed and evaluated for each treatment.
2.5. Glycogen Quantification
After collection of hemolymph samples, biopsies (0.091 ± 0.04 g) from the foot tissue from each mussel were collected, weighed (nearest 0.001 mg), snap frozen in liquid nitrogen and then stored at −80 °C until further analysis. Quantification of glycogen followed the method by Keppler and Decker [47]. Briefly, the enzyme amyloglucosidase was used to digest glycogen into glucose, which was then quantified photometrically.
2.6. Data Analyses
Mussel activity based on binomial classification (active, non-active) was compared using exact binomial tests for each temperature and the time points 0 and 96 h of exposure.
To account for differences between experimental conditions and possible interaction between factors we applied a multivariate general linear model (GLM) using clearance rates, total hemocyte count (THC), granulocyte and hyalinocyte mortality, granulocyte–hyalinocyte ratio and tissue glycogen as dependent variables, and fixed factors temperature and total ammonia nitrogen. Pairwise comparison between treatment groups (e.g., test concentrations) was conducted by Tukeys’ post hoc test. Additionally, a paired samples t-test was performed to compare clearance rates for each test concentration at the beginning and after 96 h of the exposure period.
Bivariate linear models (ordinary least squares regression) were used to comparatively test the relationships between concentrations of ammonia and physiological indicators (clearance rate, hemocyte composition and mortality, tissue glycogen and THC) at the two temperatures. Effect sizes were calculated according to Cohen (1992) [48]. Normality and heteroscedasticity were tested using Shapiro Wilk’s test and Levene’s test, respectively. Significance was accepted at α = 0.05. Statistical analyses were conducted using SPSS 22 (IBM, Armonk, NY, USA).
3. Results
3.1. Mortality
One mussel at the highest ammonia treatment died during the 96 h exposure period at 17 °C (16.6% mortality), and another one in the highest ammonia treatment at 25 °C was in moribund state, only slowly closing the valves after disturbance. Two additional mussels from the two highest concentrations at 25 °C died within 24 h after the end of the experiment, suggesting a delayed mortality effect (33.3% mortality). It needs to be noted, however, that this delayed mortality may also be a result of additional stress induced by hemolymph collection and biopsies.
3.2. Overall Results—Multivariate GLM
The main outcome of this study was that ammonia exposure resulted in no significant overall effects on the test variables (F(28,188.911) = 0.929; p = 0.957; Wilks’ Λ = 0.744; Table 2 and Table S1). Within the ranges of exposure concentrations and temperature, there was no statistically significant interaction between temperature and ammonia exposure on the combined variables clearance rate, tissue glycogen, granulocyte and hyalinocate mortality and ratios, and THC (F(28,188.911) = 0.929; p = 0.572; Wilks’ Λ = 0.628; Table 2). However, between-subject comparison revealed a significant effect of temperature on tissue glycogen (F(1,58) = 14.931; p < 0.001), hyalinocyte mortality (F(1,58) = 13.618; p < 0.001) and clearance rate at time point 96 h (F(1,58) = 51.625; p < 0.001) (Table S1).
3.3. Clearance Rate and Filtration Activity
At exposure initiation, most of the mussels in the 17 °C group were not actively filtering (69% not active, exact binomial test, two-tailed, p = 0.02, n = 42; Table 3), in contrast to the 25 °C group with a significantly higher proportion of active mussels (70% active, exact binomial test, two-tailed, p = 0.04, n = 30). Over the 96 h experimental period, the measured filtration activity was temperature-dependent, with greater activity at higher temperatures at the 96 h time point (differences in normalized clearance rates: p < 0.01 in all cases; Figure 1 and Table 3).
After the 96 h exposure period, the proportion of active mussels decreased, with 74% not active at the 17 °C treatments (exact binomial test, two-tailed, p = 0.003, n = 42) and 43% not active at 25 °C (exact binomial test, two-tailed, p = 0.58, n = 30). The visual estimation of filtration activity was not considered a reliable endpoint, since discrepancies between measurable particle retention (filtering activity based on clearance rate) and observed activity were high (Table 3).
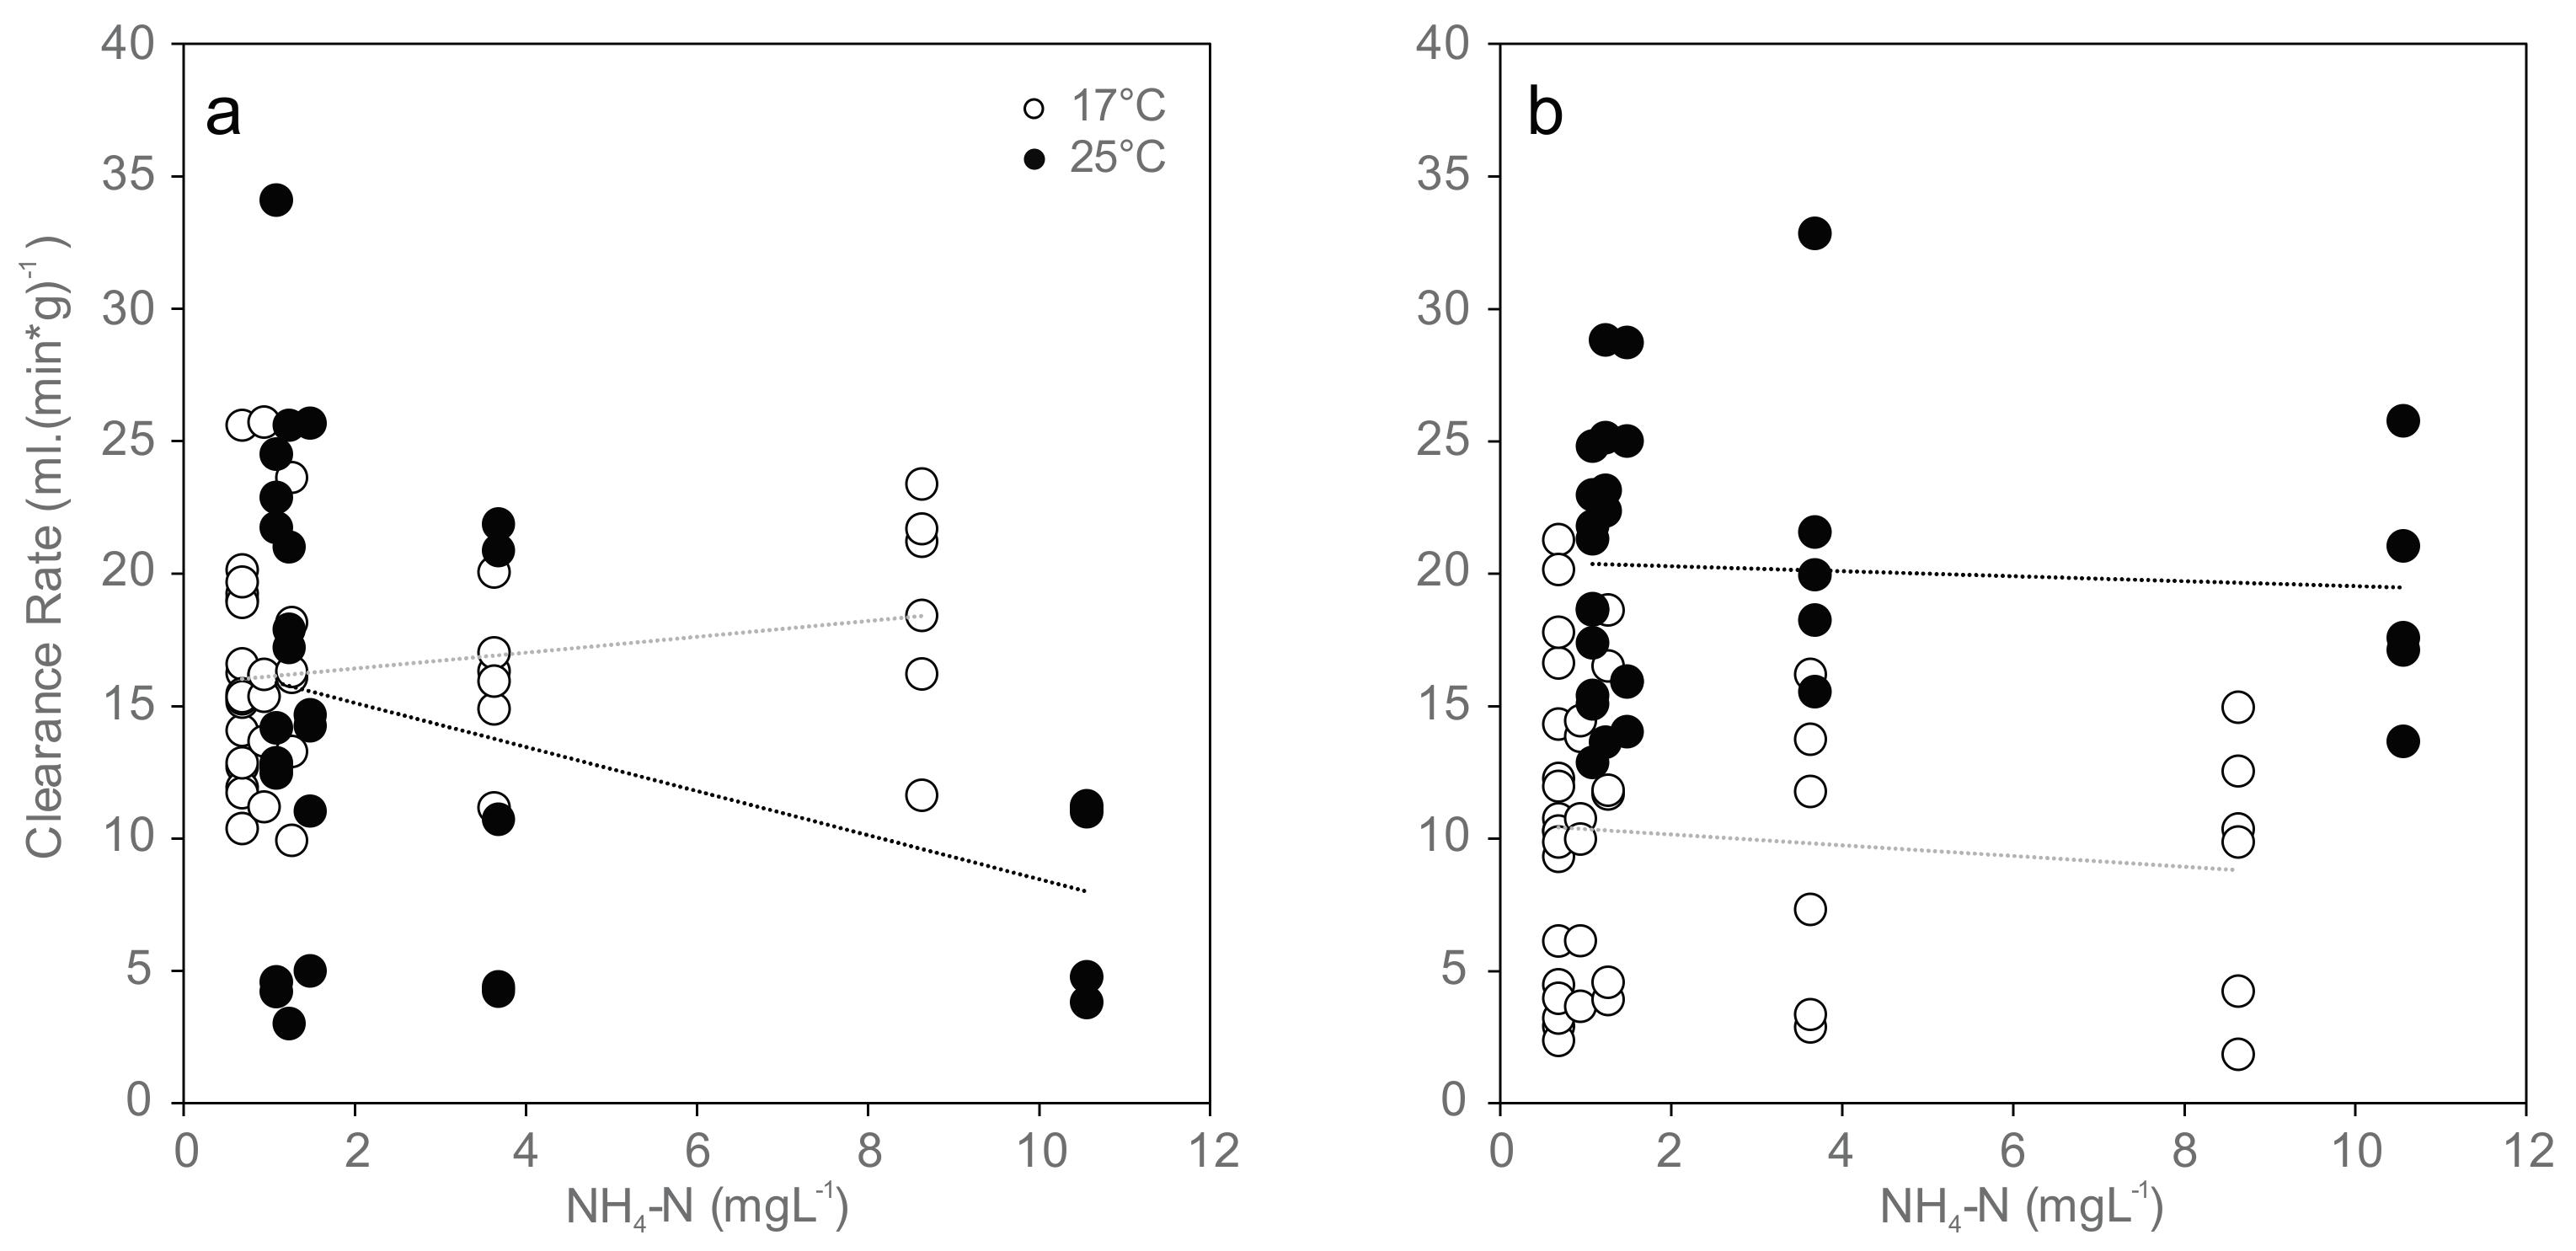
Clearance rate was significantly reduced only in the beginning of the 96 h experiment and negatively correlated with increasing ammonia concentrations at 25 °C (Ordinary Least Square Regression, r2 = 0.189, p = 0.016), and no significant trend was found at the end of the experiment or at 17 °C (Figure 1). Mean values ranged between 16 and 18 mL (min·g)−1 in the 17 °C trial and between 8 and 16 mL (min·g)−1 in the 25 °C trial in the beginning of exposure (Figure 1a), between 9 and 10 mL (min·g)−1 in the 17 °C trial and between 19 and 22 mL (min·g)−1 in the 25 °C trial after 96 h exposure (Figure 1b). Paired sample t-tests showed no statistically significant differences between clearance rates at the beginning and 96 h after exposure.
3.4. Hemocyte Density and Viability
The cell densities of all types of hemocytes (granulocytes and hyalinocytes) were not affected by temperature and were largely independent from total ammonia nitrogen concentration due to high variation (Figure 2). Among the different cell specimens, none of the cell densities were significantly different between treatments. Hyalinocytes were generally less abundant by a factor of 8 in hemolymph than granulocytes. Their abundance did not differ significantly between the combinations of temperature and ammonia treatments.
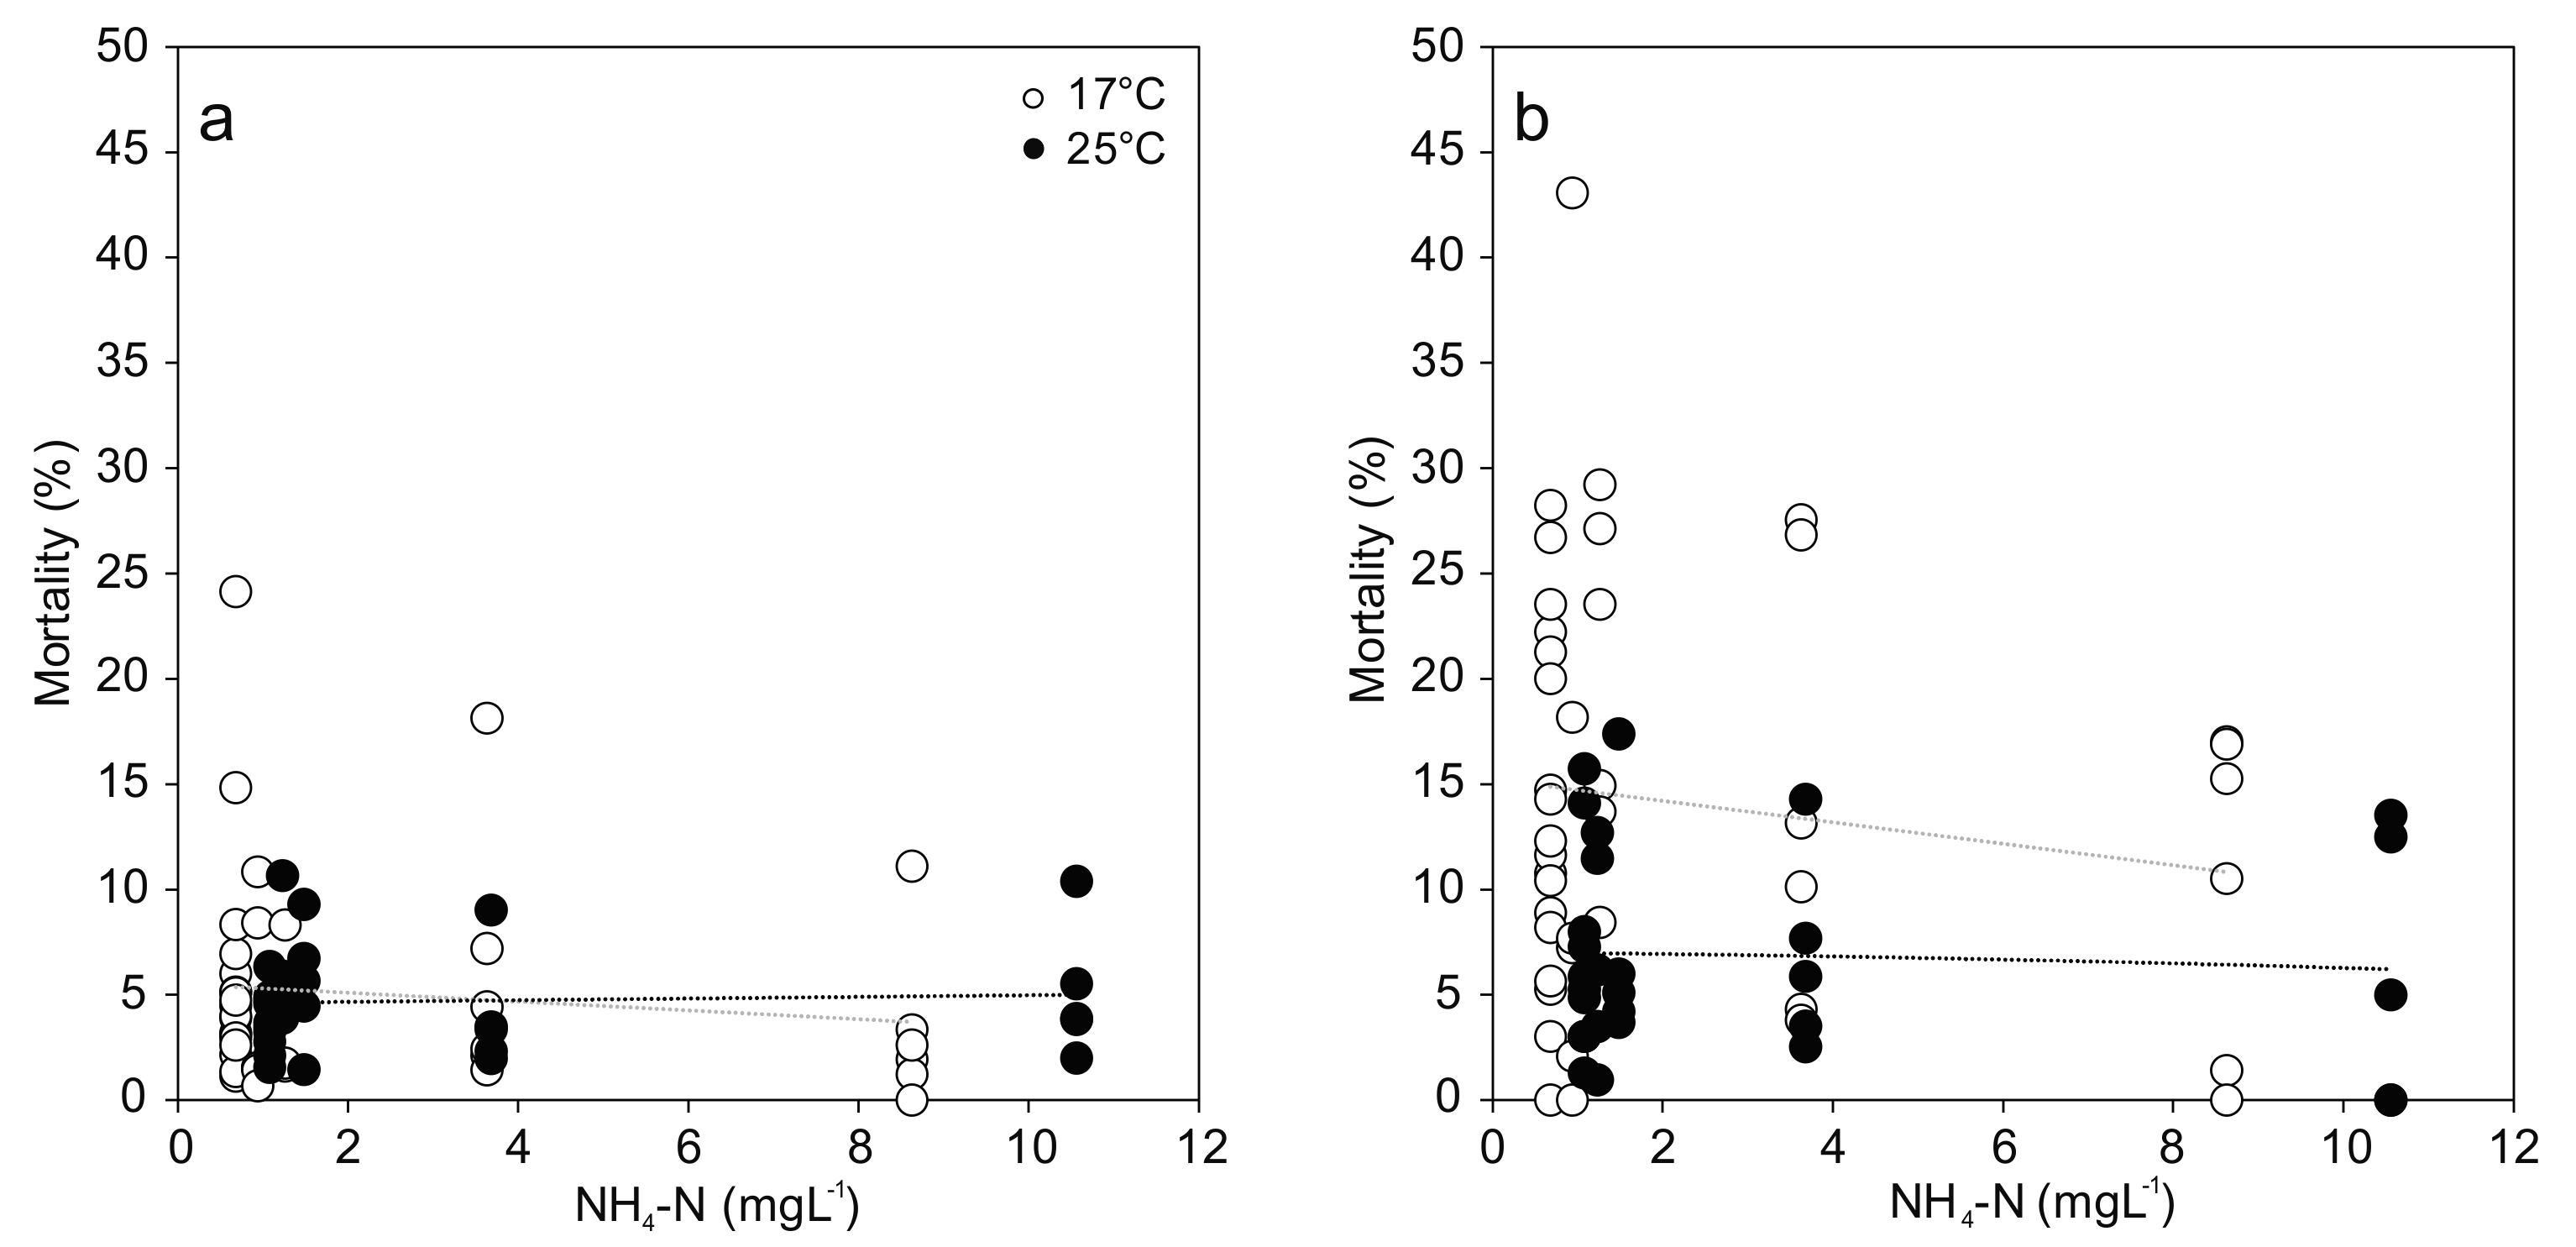
For the comparison of viable hemocytes, the strongest effects occurred in response to temperature stress, with differences between cell types: Hyalinocyte mortality was two-fold and significantly increased at 25 °C compared to 17 °C (F(1,58) = 13.618; p < 0.001; Figure 3). No effect of temperature was evident in the granulocyte mortality. In both cell types, no statistically significant effect of increased ammonia nitrogen concentration was found (Figure 3). Great variation in hemocyte mortality was generally observed between individuals from the same treatment, resulting in low statistical power.
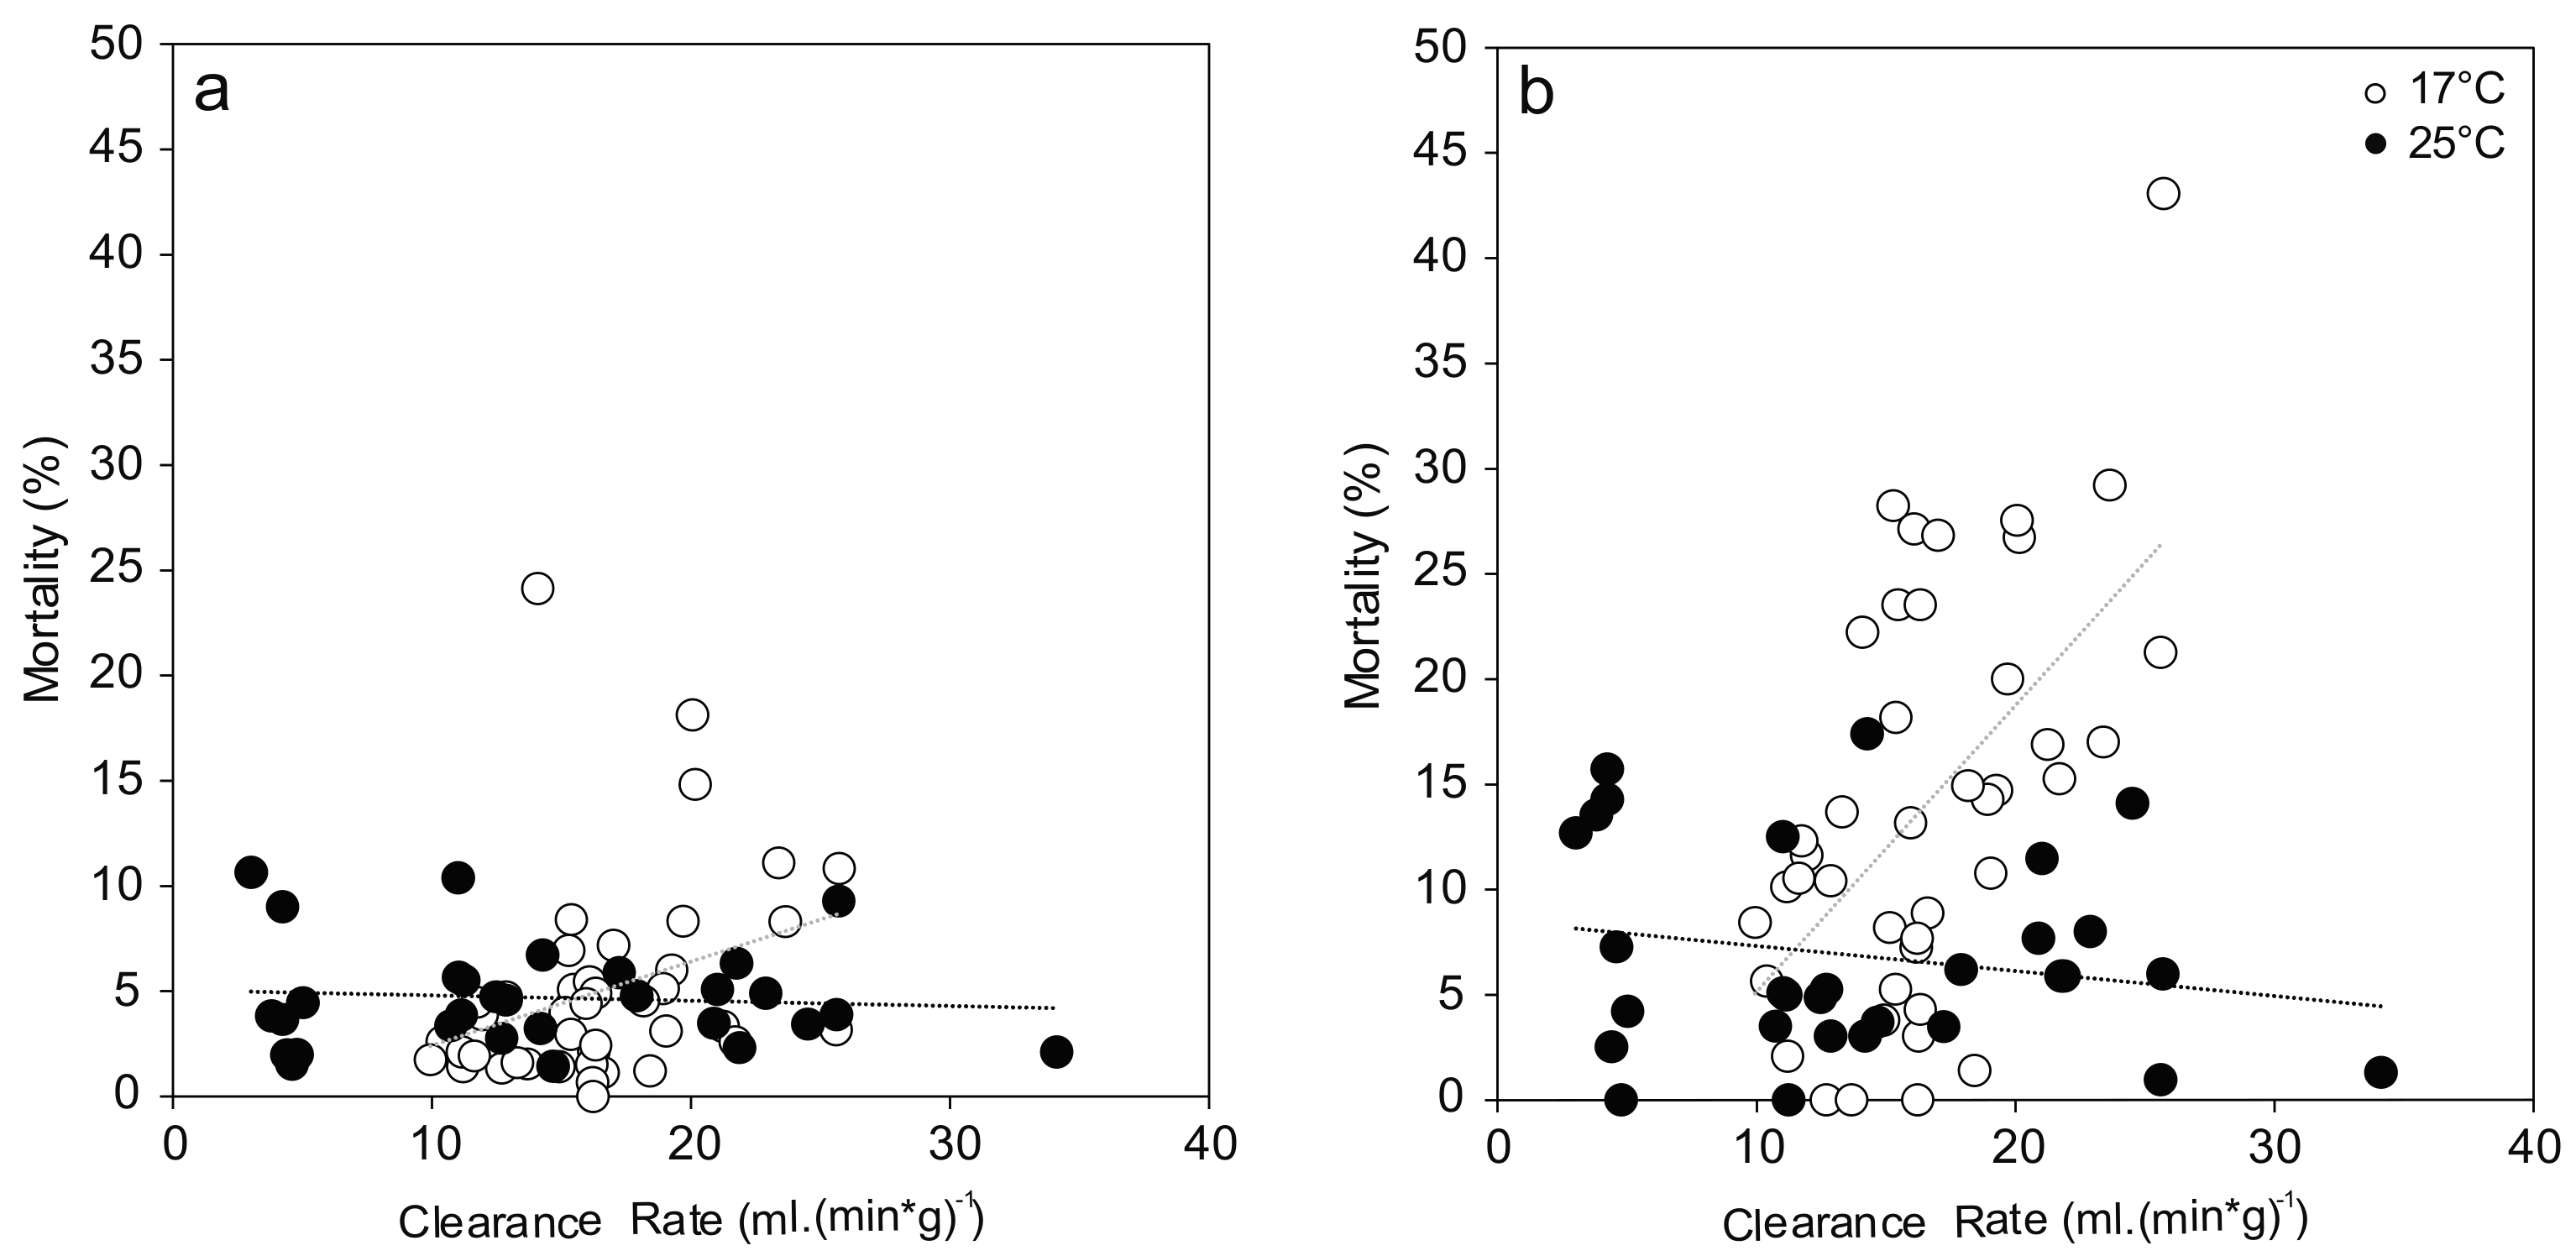
Hemocyte mortalities showed a linear dependency on initial mussel activity as measured by their clearance rate (Figure 4). At 17 °C, clearance rate showed a significant correlation with granulocyte mortality (F(1,40) = 4.749, p = 0.035) and explained 8.4% of the variation, which can be interpreted as medium effect. This effect was even stronger in case of hyalinocyte mortality (F(1,40) = 17.485, p < 0.001) with 28.7% of the variation explained. There was no trend observed at 25 °C for both hemocyte types.
3.5. Hemocyte Morphology
Altered cell morphologies of the stained hemocytes included swelling or shrinkage of cells, changes in the number of granules present in the cytoplasm of granulocytes, and occurrence of pseudopods were observed (summarized in the Supplementary Materials, Table S2 and Figure S1a–j). However, these alterations were obvious in all examined samples including the control and were based on qualitative observations of small sample sizes (n = 3), suggesting that they should not be over-interpreted. A tendency of an increase in the number of cells showing more projections (pseudopods) and granulocyte aggregation at higher ammonia-nitrogen concentration and the higher temperature were observed (Figure S1, Table S2).
Most of the cells observed on the smears were granulocytes because this is generally the dominant cell type [35,43]; hyalinocytes were smaller and fewer (10% of total cell numbers). Alterations in relation to the control situation, that correspond to cells with a rounder shape, some tendency to aggregate, and no or few granules or pseudopods, were observed. A qualitative analysis of the smears showed that even the smallest concentration of ammonia induced alterations in the cells, with most of the cells showing signs of swelling (Table S2). With increasing concentration, these effects were more pronounced and, additionally, other morphological alterations became evident. This included an increased number of pseudopods, and a greater number of granules in the cells (Table S2 and Figure S1d,e,i,j).
3.6. Energy Reserves
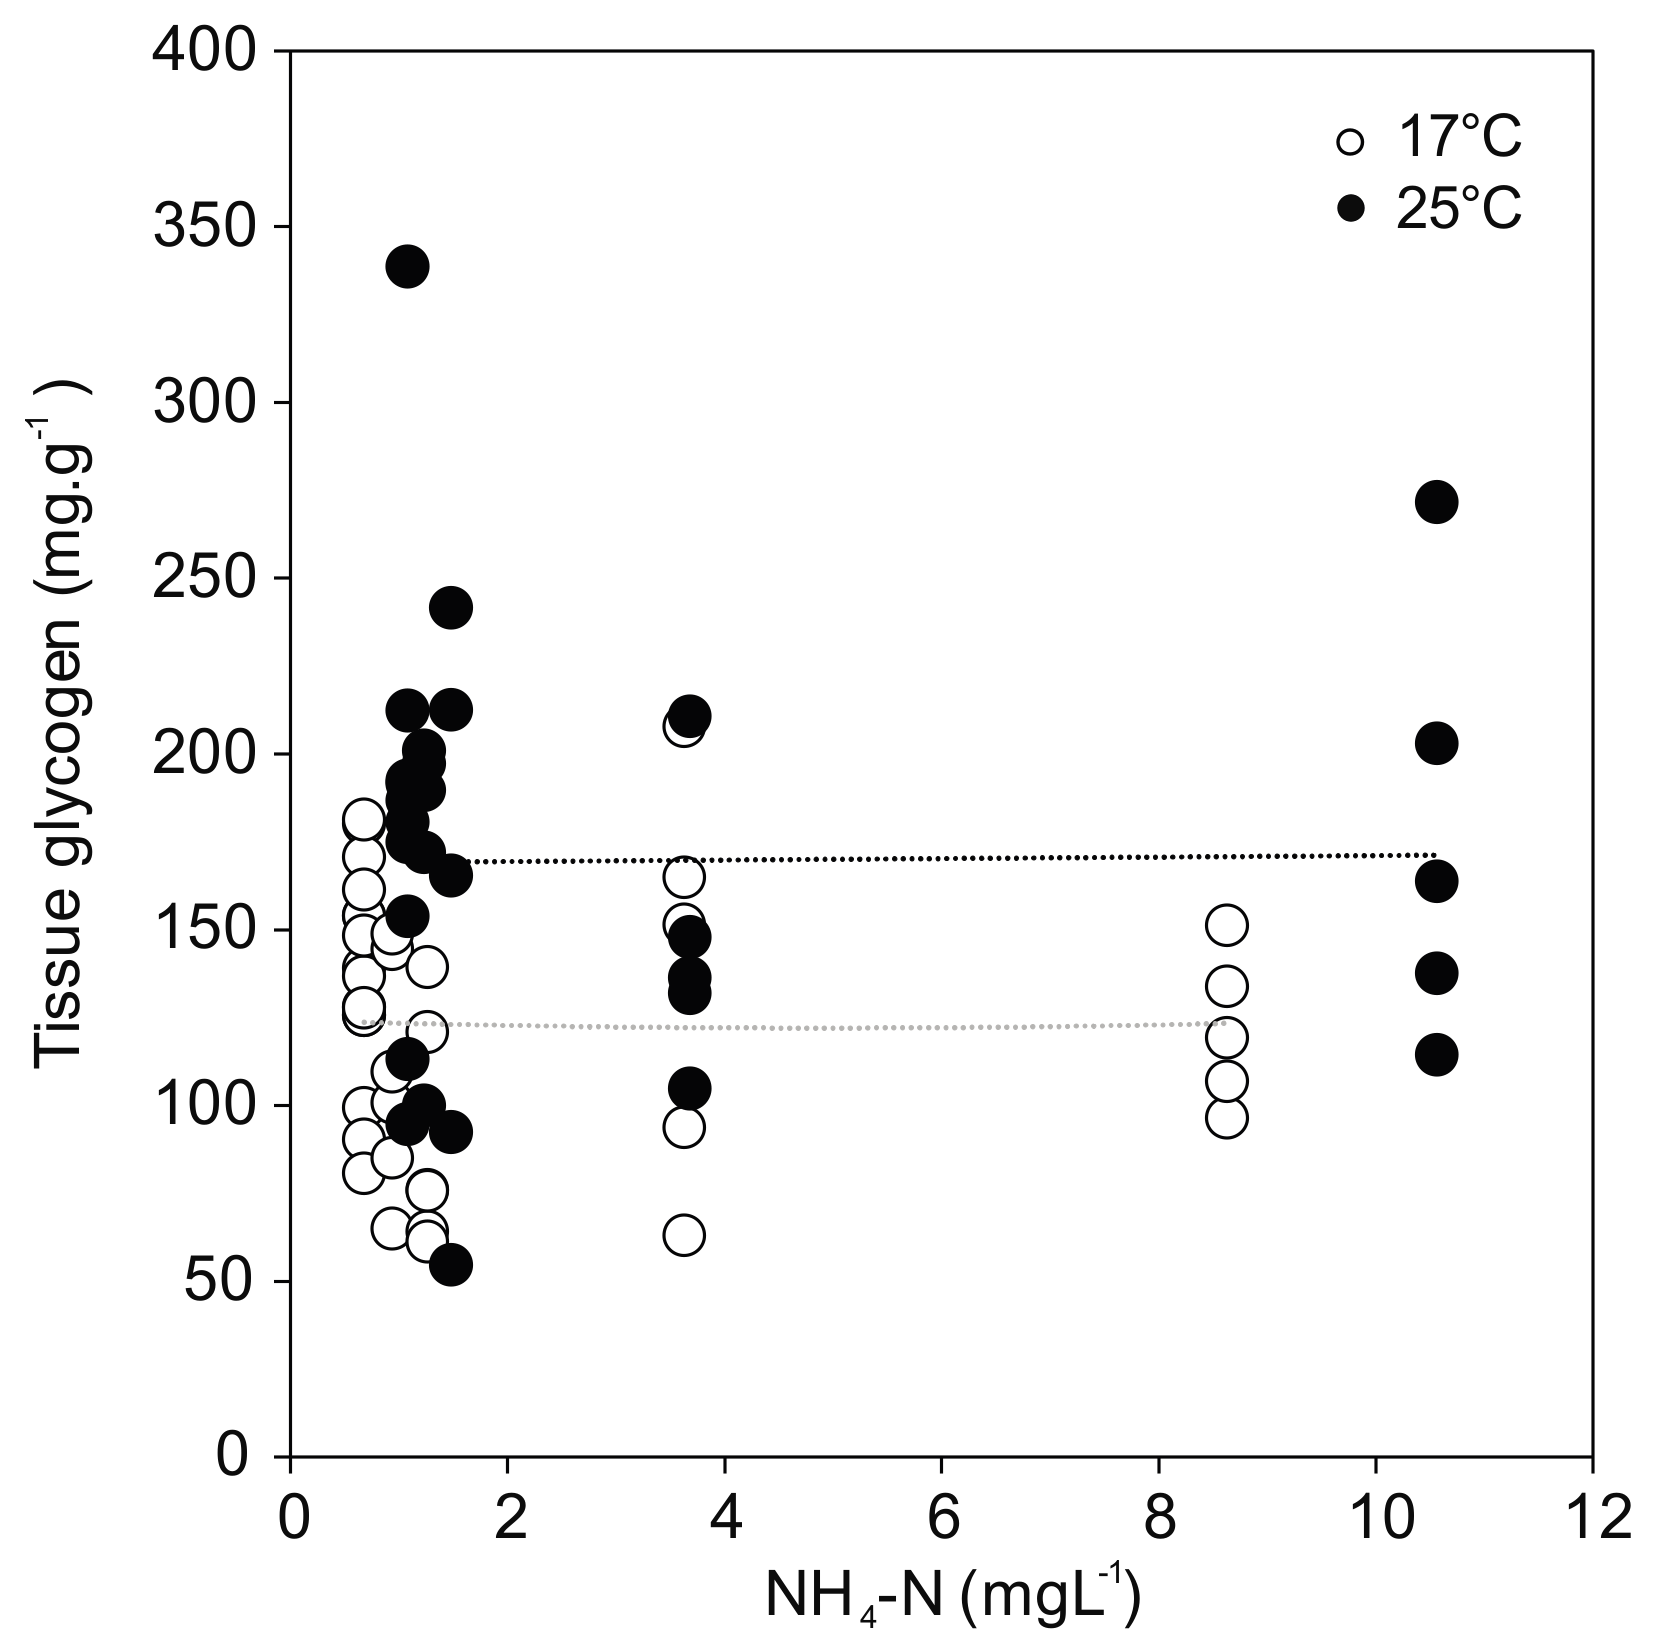
Glycogen concentration as a proxy for energy reserves in the foot tissue of the mussels revealed a positive effect of temperature regardless of treatment (F(1,58) = 14.931; p < 0.001) (Figure 5). The greatest temperature effect was found in the control, where the glycogen content reached the highest value for the mussels at 25 °C (183.9 ± 65.7 mg·g−1), but much lower values at 17 °C (137.8 ± 29.9 mg·g−1). No relationship was observed between glycogen and ammonia exposure. In line with the overall model results in Section 3.2, the post hoc comparisons showed no statistically significant differences between controls and ammonia treated mussels, except for the ammonia concentration of 10.56 mg·L−1 (p = 0.011) at 25 °C.
4. Discussion
The results of this study did not confirm the initially hypothesized synergistic stressor effect of increased temperature and ammonia nitrogen concentration on adult Unio pictorum within the tested ammonia and temperature ranges. The observed effects on combined behavioral, physiological and cellular endpoints could mostly be attributed to temperature increase, which highlights the increasing threat of subtle and global pressures such as climate change on mussel populations.
Whilst the acute 96 h exposure scenario used in this study cannot be directly translated into chronic long-term effects, it shows that adult U. pictorum are not very sensitive to short-term total ammonia nitrogen exposure. This is of particular importance since ammonia increase, as a result of aquatic pollution is considered one of innumerous causes for freshwater mussel declines [16]. However, different species of mussels have highly different sensitivities to environmental stressors [49], and thus the finding of a low sensitivity of the tested species of mussel must not be generalized. The general knowledge concerning the sensitivity of adult Unionid mussels to environmental stressors is still scarce, and almost no information is available concerning European species. Based on existing data, mussels are considered highly sensitive to total ammonia nitrogen depending on species and specific life-stage; therefore, early stages are mostly used for impact assessment [20,50,51,52], but information on the susceptibility of adults remains scarce. Available toxic thresholds are currently available almost exclusively for North American mussel species and reflect the broad range of species-specific sensitivity distributions of this taxonomic group. As recently reported by Wang et al. [53], EC50 values for juvenile mussels from different tribes and families range between 1.5 and 8 mg·L−1 total ammonia nitrogen after 96 h exposure. Effect concentrations for glochidia (24 h EC50) show even higher ranges between 5 and >16 mg·L−1 total ammonia nitrogen [20]. Given the great sensitivity in North American species, similar differences among European mussel species appear likely. The responses of U. pictorum to ammonia nitrogen exposure cannot be extrapolated to other European mussel species and further research in this field is urgently needed, especially for species with higher conservation status and expected higher sensitivities such as Unio crassus or Margaritifera margaritifera.
Despite the overall necessity to determine thresholds for sensitive early life-stages, the ecological impact on adults is equally important since their life style as sedentary filter-feeders exposes them to different environments than the juveniles and since they provide important ecosystem services [7,11]. Despite the inconclusive effects of ammonia exposure on adult U. pictorum from this study, the general approach to integrate behavioral, physiological and cellular endpoints appears advantageous in comprehensively assessing the ecotoxicological effects of stressors to adult freshwater mussels. Such different sublethal endpoints can provide functional information about the first signs of intoxications in terms of behavior, energy resources and immune system, as presented in this and other studies [54].
The effect of temperature stress in this study resulted in a significant effect on hyalinocyte mortality and morphological hemocyte alterations. Generally, the greatest differences between the different temperature treatments occurred at the lowest ammonia concentrations, which may be explained by the higher filtration activities of mussels and a more intense exposure under these circumstances. Based on the observations from our study, mussels seem to be able to detect elevated concentrations of ammonia, and reduce their filtering and thus exposure. In contrast to most mortality-based toxicological assays, the combined sublethal endpoints used in this study can be utilized to interpret the cause of negative impacts and delayed effects as demonstrated by our data. This needs to be considered in the conservation and preservation measures for these species [16]. Synergistic effects of different pollutants suggest that a mere quantification of ammonia can underestimate the real threat to mussel populations [51] which tend to be exposed to chemical mixtures rather than to single substances.
The protectiveness of water quality criteria for single substances highly depends on the substance-specific behavior under changing environmental parameters that can alter uptake and toxicity. In case of ammonia nitrogen, the equilibrium of the ionized and the un-ionized form is mainly controlled by pH and temperature [25,55]. The exposure of a specific organism however is influenced by the ion gradient at the osmoregulatory membranes like the gill-surface, which can result in different toxicities dependent on the total ion concentration in the water matrix. Previous studies reported a reduction of ammonia nitrogen toxicity for the invertebrate Hyallela azteca under a generally high ion concentration, especially hardness, in the exposure water [56]. Armstrong et al. [57] proposed a mechanism for ammonium ion toxicity to the freshwater prawn Macrobrachium rosenbergii in which the excretion of ammonium ion from the body is accomplished by a simultaneous uptake of sodium ions, and ammonia toxicity at low pH results from competitive inhibition of sodium transport by ammonium ions. Less information is available on freshwater mollusks, except for Hickey and Martin [58] who reported ammonia toxicity on the freshwater bivalve Sphaerium novaezelandiae being influenced by water hardness. In the present study, we may underestimate the sensitivity for U. pictorum, since the total ion concentration and hardness were relatively high and interactions between the ammonium ion other cations are likely. Since we did not address the effect of different water matrices there is no proof for an influence on U. pictorum sensitivity, but according to results from other studies on invertebrates, the ammonia toxicity can be expected to be much higher at low pH and low hardness [56].
Due to their ability to accumulate toxins, Unio species have been used as bioindicators since the 1960s, despite of little consideration of associated physiological alterations [59]. The different endpoints used in our study all revealed different levels of sensitivity and thus vary in their applicability as stress indicators. Mortality, despite its direct relevance in assessing adverse outcomes and observability in the highest concentration, only seems to be a weak indicator, at least in the range of temperatures and ammonia concentrations used herein and at within short exposures that do not consider delayed effects. Increasing the post-exposure observation periods may be important, especially if linked with a longer observation of glycogen as energy reserves. In this context, the clear trend of decreased glycogen content with increased ammonia concentrations and lower temperatures is likely to be more pronounced if longer exposure and holding periods are considered. Behavioral endpoints including mussel activity and clearance rates were found to be both useful and meaningful since they indicated a response to both stressors, and since they provide a direct link with a concrete ecosystem service provided by the mussels. However, the pronounced behavioral variability observed among individuals in this study, as well as in previous studies addressing mussel filtration [26,27] and glochidia attachment [60] suggest that long enough time intervals and sufficiently high numbers of replicates are needed to use it as a powerful indicator. Based on our findings, clearance rate measurement as an ecotoxicological endpoint needs to be carefully interpreted due to several reasons. First, filtration behavior can be controlled by an internal rhythm, which is not necessarily synchronized within the test population [27]. As measurements include only distinct time points, it is not clear for how long individual mussels were active within this period. Second, clearance rate is measured by the addition of food particles, which should trigger feeding behavior (e.g., particle clearance), although some mussel species seem to be unable to distinguish food from non-food particles [7]. Video analysis or more sophisticated tools such as real-time assessment of shell gaping would allow the quantification of the duration in avoidance responses or feeding [26,27]. Recent studies have demonstrated that the nature and concentration of seston may greatly influence bivalve filtration rates, with low and high algal concentrations causing reductions in filtration, making comparison between studies difficult [7,61,62,63].
In contrast to the above-discussed endpoints, hemocyte ratios, mortality and cell morphology are supposed to be sensitive and informative indicators of physiological disturbance. Moreover, they can be directly linked with immunological consequences. In particular, morphological changes indicating apoptosis on the cellular level seem to be a currently underestimated biomarker in freshwater mussel ecotoxicology, despite of the great relevance of this endpoint in fish [15,64] and mollusks [65,66]. Although functional attributes of hemocytes are not entirely clear, some studies suggest that hyalinocytes are associated to detoxification mechanisms [43,67], which is in line with our data. The granulocytes function is more associated to phagocytic activities [67,68], being less influenced under toxicity stress. A higher recruitment of these cells for detoxification may compromise other physiological roles, and—in the long run—diminish these cell types and weaken the immune system with direct consequence for the health status.
As evident from this study and previous publications, mussels can be considered important model species in ecotoxicology, as they are sessile filter-feeders, taking up water, dissolved and suspended particles when filtering. Therefore they accumulate substances from their surrounding environment, mirroring the pollution of their habitat. Additionally, mussels play a key role in nutrient cycling and biodeposition of suspended matter, representing essential processes in ecosystem functioning [7,10,11]. These key roles of mussels for freshwater ecosystem functioning and their observed ongoing declines require delineation of effective conservation strategies that also include water quality standards. In light of global change, elevated water temperatures and increasing concerns about ammonia in aquatic ecosystems, this study underlines the importance of including freshwater mussel fauna in assessing environmental stressors, environmental regulation and conservation plans.
Supplementary Materials
The following are available online at www.mdpi.com/2073-4441/9/7/455/s1, Table S1: Full Model Results, Table S2: Qualitative Hemocyte Alterations, Figure S1: Light microscopy images from stained hemocytes of U. pictorum.
Acknowledgments
This study was partly funded by the Portuguese Foundation for Sciences and Technology (FCT) for the PhD grant of MH (SFRH/BD/76265/2011). We also acknowledge the laboratory assistance of Barbara Ziegler and Manuela Rost during the experiments.
Author Contributions
S.B. and J.G. conceived and designed the experiments; M.H. performed the experiments; S.B. and M.H. analyzed the data; S.B., and M.H. and J.G. wrote the manuscript. As part of M.H.’s PhD committee, J.M. provided important guidance throughout the project.
Conflicts of Interest
The authors declare no conflict of interest.
References
- Bogan, A.E. Freshwater Bivalve Extinctions (Mollusca: Unionoida): A Search for Causes. Integr. Comp. Biol. 1993, 33, 599–609. [Google Scholar] [CrossRef]
- Lopes-Lima, M.; Sousa, R.; Geist, J.; Aldridge, D.C.; Araujo, R.; Bergengren, J.; Bespalaya, Y.; Bódis, E.; Burlakova, L.; Van Damme, D.; et al. Conservation status of freshwater mussels in Europe: State of the art and future challenges. Biol. Rev. 2016, 92, 572–607. [Google Scholar] [CrossRef] [PubMed]
- Lydeard, C.; Cowie, R.H.; Ponder, W.F.; Bogan, A.E.; Bouchet, P.; Clark, S.A.; Cummings, K.S.; Frest, T.J.; Gargominy, O.; Herbert, D.G.; et al. The global decline of nonmarine mollusks. Bioscience 2004, 54, 321–330. [Google Scholar] [CrossRef]
- Naimo, T.J. A review of the effects of heavy metals on freshwater mussels. Ecotoxicology 1995, 4, 341–362. [Google Scholar] [CrossRef] [PubMed]
- Milam, C.D.; Farris, J.L.; Dwyer, F.J.; Hardesty, D.K. Acute toxicity of six freshwater mussel species (glochidia) to six chemicals: Implications for daphnids and Utterbackia imbecillis as surrogates for protection of freshwater mussels (Unionidae). Arch. Environ. Contam. Toxicol. 2005, 48, 166–173. [Google Scholar] [CrossRef] [PubMed]
- Boeker, C.; Lueders, T.; Mueller, M.; Pander, J.; Geist, J. Alteration of physico-chemical and microbial properties in freshwater substrates by burrowing invertebrates. Limnologica 2016, 59, 131–139. [Google Scholar] [CrossRef]
- Lummer, E.M.; Auerswald, K.; Geist, J. Fine sediment as environmental stressor affecting freshwater mussel behavior and ecosystem services. Sci. Total Environ. 2016, 571, 1340–1348. [Google Scholar] [CrossRef] [PubMed]
- Richter, A.; Stoeckl, K.; Denic, M.; Geist, J. Association between the occurrence of the Thick-shelled River Mussel (Unio crassus) and macroinvertebrate, microbial, and diatom communities. Freshw. Sci. 2016, 35, 922–933. [Google Scholar] [CrossRef]
- Strayer, D.L. Challenges for freshwater invertebrate conservation. J. N. Am. Benthol. Soc. 2006, 25, 271–287. [Google Scholar] [CrossRef]
- Strayer, D.L. Understanding how nutrient cycles and freshwater mussels (Unionoida) affect one another. Hydrobiologia 2014, 735, 277–292. [Google Scholar] [CrossRef]
- Vaughn, C.C. Biodiversity losses and ecosystem function in freshwaters: Emerging conclusions and research directions. Bioscience 2010, 60, 25–35. [Google Scholar] [CrossRef]
- Geist, J. Strategies for the conservation of endangered freshwater pearl mussels (Margaritifera margaritifera L.): A synthesis of Conservation Genetics and Ecology. Hydrobiologia 2010, 644, 69–88. [Google Scholar] [CrossRef]
- Geist, J. Integrative freshwater ecology and biodiversity conservation. Ecol. Indic. 2011, 11, 1507–1516. [Google Scholar] [CrossRef]
- Geist, J. Seven steps towards improving freshwater conservation. Aquat. Conserv. 2015, 25, 447–453. [Google Scholar] [CrossRef]
- Hasenbein, M.; Werner, I.; Deanovic, L.A.; Geist, J.; Javidmehr, A.; Foe, C.; Fangue, N.A.; Connon, R.E. Transcriptomic profiling permits the identification of pollutant sources and effects in ambient water samples. Sci. Total Environ. 2014, 468–469, 688–698. [Google Scholar] [CrossRef] [PubMed]
- Augspurger, T.; Keller, A.E.; Black, M.C.; Cope, W.G.; Dwyer, F.J. Water quality guidance for protection of freshwater mussels (Unionidae) from ammonia exposure. Environ. Toxicol. Chem. 2003, 22, 2569–2575. [Google Scholar] [CrossRef] [PubMed]
- Geist, J.; Auerswald, K. Physicochemical streambed characteristics and recruitment of the freshwater pearl mussel (Margaritifera margaritifera). Freshw. Biol. 2007, 52, 2299–2316. [Google Scholar] [CrossRef]
- Mummert, A.K.; Neves, R.J.; Newcomb, T.J.; Cherry, D.S. Sensitivity of juvenile freshwater mussels (Lampsilis fasciola, Villosa iris) to total and un-ionized ammonia. Environ. Toxicol. Chem. 2003, 22, 2545–2553. [Google Scholar] [CrossRef] [PubMed]
- Newton, T.J.; Allran, J.W.; O’Donell, J.A.; Bartsch, M.R.; Richardson, W.B. Effects of ammonia on juvenile unionid mussels (Lampsilis cardium) in laboratory sediment toxicity tests. Environ. Toxicol. Chem. 2003, 22, 2554–2560. [Google Scholar] [CrossRef] [PubMed]
- Wang, N.; Ingersoll, C.G.; Hardesty, D.K.; Ivey, C.D.; Kunz, J.L.; May, T.W.; Dwyer, F.J.; Roberts, A.D.; Augspurger, T.; Kane, C.M.; et al. Acute toxicity of copper, ammonia, and chlorine to glochidia and juveniles of freshwater mussels (Unionidae). Environ. Toxicol. Chem. 2007, 26, 2036–2047. [Google Scholar] [CrossRef] [PubMed]
- Poole, K.E.; Downing, J.A. Relationship of declining mussel biodiversity to stream-reach and watershed characteristics in an agricultural landscape. J. N. Am. Benthol. Soc. 2004, 23, 114–125. [Google Scholar] [CrossRef]
- US Environmental Protection Agency. Aquatic Life Ambient Water Quality Criteria for Ammonia—Freshwater; EPA 822-R-13-001; U.S. Environmental Protection Agency, Office of Water, Office of Science and Technology: Washington, DC, USA, 2013; pp. 1–242.
- Studer, I.; Boeker, C.; Geist, J. Physicochemical and microbiological indicators of surface water body contamination with different sources of digestate from biogas plants. Ecol. Indic. 2017, 77, 314–322. [Google Scholar] [CrossRef]
- Constable, M.; Charlton, M.; Jensen, F.; McDonald, K.; Craig, G.; Taylor, K.W. An ecological risk assessment of ammonia in the aquatic environment. Hum. Ecol. Risk Assess. 2003, 9, 527–548. [Google Scholar] [CrossRef]
- Erickson, R.J.; Nichols, J.W.; Cook, P.M.; Ankley, G.T. Bioavailability of Chemical Contaminants in Aquatic Systems. In The Toxicology of Fishes; DiGiulio, R.T., Hinton, D.E., Eds.; CRC Press: Boca Raton, FL, USA, 2008; pp. 9–54. [Google Scholar]
- Hartmann, J.T.; Beggel, S.; Auerswald, K.; Stoeckle, B.C.; Geist, J. Establishing mussel behavior as a biomarker in ecotoxicology. Aquat. Toxicol. 2016, 170, 279–288. [Google Scholar] [CrossRef] [PubMed]
- Hartmann, J.T.; Beggel, S.; Auerswald, K.; Geist, J. Determination of the most suitable adhesive for tagging freshwater mussels and its use in an experimental study of filtration behavior and biological rhythm. J. Molluscan Stud. 2016, 82, 415–421. [Google Scholar] [CrossRef]
- Van Hassel, J.H.; Farris, J.L. A review of the use of Unionid mussels as biological indicators of ecosystem health. In Freshwater Bivalve Ecotoxicology; Farris, J.L., Van Hassel, J.H., Eds.; CRC Press and SETAC Press: Boca Raton, FL, USA; Pensacola, FL, USA, 2007; pp. 19–49. [Google Scholar]
- Cope, W.G.; Bringolf, R.B.; Buchwalter, D.B.; Newton, T.J.; Ingersoll, C.G.; Wang, N.; Augspurger, T.; Dwyer, F.J.; Barnhart, C.; Neves, R.J.; et al. Differential exposure, duration, and sensitivity of unionoidean bivalve life stages to environmental contaminants. J. N. Am. Benthol. Soc. 2008, 27, 451–462. [Google Scholar] [CrossRef]
- McIvor, A.L. Freshwater Mussels as Biofilters. Ph.D. Thesis, Department of Zoology, University of Cambridge, Cambridge, UK, 2004. [Google Scholar]
- Naimo, T.J.; Damschen, E.D.; Rada, R.G.; Monroe, E.M. Nonlethal evaluation of the physiological health of unionid mussels: Methods for biopsy and glycogen analysis. J. N. Am. Benthol. Soc. 1998, 17, 121–128. [Google Scholar] [CrossRef]
- Jokela, J.; Uotila, L.; Taskinen, J. Effect of the castrating trematode parasite Rhipidocotyle fennica on energy allocation of fresh-water clam Anodonta piscinalis. Funct. Ecol. 1993, 7, 332–338. [Google Scholar] [CrossRef]
- Hinzmann, M.F.; Lopes-Lima, M.; Bobos, I.; Ferreira, J.; Domingues, B.; Machado, J. Morphological and chemical characterization of mineral concretions in the freshwater bivalve Anodonta cygnea (Unionidae). J. Morphol. 2014, 276, 65–76. [Google Scholar] [CrossRef] [PubMed]
- Cheng, T.C. Bivalves. In Invertebrate Blood Cells; Ratcliffe, N.A., Rowley, A.F., Eds.; Academic Press: London, UK, 1981; Volume 1, pp. 231–300. [Google Scholar]
- Hine, P.M. The inter-relationships of bivalve haemocytes. Fish Shellfish Immunol. 1999, 9, 367–385. [Google Scholar] [CrossRef]
- Antunes, F.; Hinzmann, M.F.; Lopes-Lima, M.; Machado, J.; Martins da Costa, P. Association between environmental microbiota and indigenous bacteria found in hemolymph, extrapallial fluid and mucus of Anodonta cygnea (Linnaeus, 1758). Microbiol. Ecol. 2010, 60, 304–309. [Google Scholar] [CrossRef] [PubMed]
- Antunes, F.; Hinzmann, M.F.; Lopes-Lima, M.; Vaz-Pirez, P.; Ferreira, S.; Domingues, B.; Machado, J. Antibacterial effects of Anodonta cygnea fluids on Escherichia coli and enterococci multi-drug-resistant strains: Environmental implications. Toxicol. Environ. Chem. 2014, 96, 880–889. [Google Scholar] [CrossRef]
- Van Damme, D. Unio. pictorum. The IUCN Red List of Threatened Species, 2011, e.T155543A4795613; doi:10.2305/IUCN.UK.2011-2.RLTS.T155543A4795613.en. Available online: http://www.iucnredlist.org/details/155543/0 (accessed on 22 June 2017).
- Van Vliet, M.T.H.; Franssen, W.H.P.; Yearsley, J.R.; Ludwig, F.; Haddeland, I.; Lettenmaier, D.P.; Kabat, P. Global river discharge and water temperature under climate change. Glob. Environ. Chang. 2013, 23, 450–464. [Google Scholar] [CrossRef]
- ASTM. ASTME2455-06. In Standard Guide for Conducting Laboratory Toxicity Tests with Freshwater Mussels; ASTM International: West Conshohocken, PA, USA, 2006; Available online: www.astm.org (accessed on 5 November 2011). [CrossRef]
- Coughlan, J. The estimation of filtration rates from the clearance of suspensions. Mar. Biol. 1969, 2, 256–258. [Google Scholar] [CrossRef]
- Gagnaire, B.; Thomas-Guyon, H.; Renault, T. In vitro effects of cadmium and mercury on Pacific oyster, Crassostrea gigas (Thunberg), haemocytes. Fish Shellfish Immunol. 2004, 16, 501–512. [Google Scholar] [CrossRef] [PubMed]
- Soares-da-Silva, I.M.; Ribeiro, J.; Valongo, C.; Pinto, R.; Vilanova, M.; Machado, J. Cytometric, morphologic and enzymatic characterisation of haemocytes in Anodonta cygnea. Comp. Biochem. Phys. A 2002, 132, 541–553. [Google Scholar] [CrossRef]
- Hinzmann, M.F.; Lopes-Lima, M.; Gonçalves, J.; Machado, J. Antiaggregant and toxic properties of different solutions on hemocytes of three freshwater bivalves. Toxicol. Environ. Chem. 2013, 95, 790–805. [Google Scholar] [CrossRef]
- Ford, S.E.; Haskin, H.H. Comparison of in vitro salinity tolerance of the oyster Parasite, Haplosporidium. nelsoni (msx) and hemocytes from the host, Crassostrea virginica. Comp. Biochem. Phys. A 1988, 90, 183–187. [Google Scholar] [CrossRef]
- Tirard, C.T.; Grossfeld, R.M.; Levine, J.F.; Kennedy-Stoskopf, S. Effect of Osmotic Shock on Protein Synthesis of Oyster Hemocytes in Vitro. Comp. Biochem. Phys. A 1997, 116, 43–49. [Google Scholar] [CrossRef]
- Keppler, D.; Decker, K. Glycogen determination with amyloglucosidase. In Methods of Enzymatic Analysis; Bergmeyer, H.U., Ed.; Academic Press: New York, NY, USA, 1974; Volume 3, pp. 1127–1131. [Google Scholar]
- Cohen, J. A power primer. Psychol. Bull. 1992, 112, 155–159. [Google Scholar] [CrossRef] [PubMed]
- Denic, M.; Stoeckl, K.; Gum, B.; Geist, J. Physicochemical assessment of Unio crassus habitat quality in a small upland stream and implications for conservation. Hydrobiologia 2014, 735, 111–122. [Google Scholar] [CrossRef]
- Augspurger, T.; Dwyer, F.J.; Ingersoll, C.G.; Kane, C.M. Advances and opportunities in assessing contaminant sensitivity of freshwater mussel (Unionidae) early life stages. Environ. Toxicol. Chem. 2007, 26, 2025–2028. [Google Scholar] [CrossRef] [PubMed]
- Haag, W.R. North American Freshwater Mussels: Natural History, Ecology, and Conservation; Cambridge University Press: Cambridge, UK, 2012. [Google Scholar]
- Ward, S.; Augspurger, T.; Dwyer, F.J.; Kane, C.; Ingersoll, C.G. Risk assessment of water quality in three North Carolina, USA, streams supporting federally endangered freshwater mussels (Unionidae). Environ. Toxicol. Chem. 2007, 26, 2075–2085. [Google Scholar] [CrossRef] [PubMed]
- Wang, N.; Ivey, C.D.; Ingersoll, C.G.; Brumbaugh, W.G.; Alvarez, D.; Hammer, E.; Bauer, C.R.; Augspurger, T.; Raimondo, S.; Barnhart, M.C. Acute sensitivity of a broad range of freshwater mussels to chemicals with different modes of toxic action. Environ. Toxicol. Chem. 2017, 36, 786–796. [Google Scholar] [CrossRef] [PubMed]
- Ganser, A.M.; Newton, T.J.; Haro, R.J. The effects of elevated water temperature on native juvenile mussels: Implications for climate change. Freshw. Sci. 2013, 32, 1168–1177. [Google Scholar] [CrossRef]
- Carpenter, S.R.; Caraco, N.F.; Correll, D.L.; Howarth, R.W.; Sharpley, A.N.; Smith, V.H. Nonpoint pollution of surface waters with phosphorus and nitrogen. Ecol. Appl. 1998, 8, 559–568. [Google Scholar] [CrossRef]
- Borgmann, U. Chronic toxicity of ammonia to the amphipod Hyalella azteca; Importance of ammonium ion and water hardness. Environ. Pollut. 1994, 86, 329–335. [Google Scholar] [CrossRef]
- Armstrong, D.A.; Chippendale, D.; Knight, A.W.; Colt, J.E. Interaction of ionized and un-ionized ammonia on short-term survival and growth of prawn larvae, Macrobrachium rosenbergii. Biol. Bull. 1978, 154, 15–31. [Google Scholar] [CrossRef]
- Hickey, C.W.; Martin, M.L. Chronic Toxicity of Ammonia to the Freshwater Bivalve Sphaerium novaezelandiae. Arch. Environ. Contam. Toxicol. 1999, 36, 38–46. [Google Scholar] [CrossRef] [PubMed]
- Campanella, L.; Gatta, T.; Ravera, O. Relationship between anti-oxidant capacity and manganese accumulation in the soft tissues of two freshwater molluscs: Unio pictorum mancus (Lamellibranchia, Unionidae) and Viviparus ater (Gastropoda, Prosobranchia). J. Limnol. 2005, 64, 153–158. [Google Scholar] [CrossRef]
- Beggel, S.; Geist, J. Acute effects of salinity exposure on glochidia viability and host infection of the freshwater mussel Anodonta anatina (Linnaeus, 1758). Sci. Total Environ. 2014, 502, 659–665. [Google Scholar] [CrossRef] [PubMed]
- Hawkins, A.J.S.; Fang, J.G.; Pascoe, P.L.; Zhang, J.H.; Zhang, X.L.; Zhu, M.Y. Modelling short-term responsive adjustments in particle clearance rate among bivalve suspension-feeders: Separate unimodal effects of seston volume and composition in the scallop Chlamys farreri. J. Exp. Mar. Biol. Ecol. 2001, 262, 61–73. [Google Scholar] [CrossRef]
- Liu, H.; Yang, J.; Gan, J. Trace element accumulation in bivalve mussels Anodonta woodiana from Taihu Lake, China. Arch. Environ. Contam. Toxicol. 2010, 59, 593–601. [Google Scholar] [CrossRef] [PubMed]
- Riisgard, H.U.; Kittner, C.; Seerup, D.F. Regulation of opening state and filtration rate in filter-feeding bivalves (Cardium edule, Mytilus edulis, Mya arenaria) in response to low algal concentration. J. Exp. Mar. Biol. Ecol. 2003, 284, 105–127. [Google Scholar] [CrossRef]
- Cheng, C.H.; Yang, F.F.; Liao, S.A.; Miao, Y.T.; Ye, C.X.; Wang, A.L.; Tan, J.W.; Chen, X.Y. High temperature induces apoptosis and oxidative stress in pufferfish (Takifugu obscurus) blood cells. J. Therm. Biol. 2015, 53, 172–179. [Google Scholar] [CrossRef] [PubMed]
- Kiss, T. Apoptosis and its functional significance in molluscs. Apoptosis 2010, 15, 313–321. [Google Scholar] [CrossRef] [PubMed]
- Russo, J.; Madec, L. Haemocyte apoptosis as a general cellular immune response of the snail, Lymnaea stagnalis, to a toxicant. Cell Tissue Res. 2007, 328, 431–441. [Google Scholar] [CrossRef] [PubMed]
- Lanz, H.; Tsutsumi, V.; Arechiga, A. Morphological and biochemical characterisation of Procambarus clarki blood cells. Dev. Comp. Immunol. 1993, 17, 389–397. [Google Scholar] [CrossRef]
- Bayne, B.L.; Moore, M.N.; Widdows, J.; Livingstone, D.R.; Salkeld, P.; Crisp, D.J.; Morris, R.J.; Gray, J.S.; Holden, A.V.; Newell, R.C.; et al. Measurement of the responses of individuals to environmental stress and pollution: Studies with bivalve molluscs. Philos. Trans. R. Soc. B 1979, 286, 562–581. [Google Scholar] [CrossRef]
Figure 1.
Normalized clearance rates (CR (mL·(min·g)−1)) for mussels exposed to increasing concentrations of ammonia nitrogen (NH4-N) at 17 °C (white) and 25 °C (black): (a) initial clearance rates at the beginning of exposure (17 °C: r = 0.23, p = 0.15; 25 °C: r = −0.35, p < 0.05); and (b) clearance rates at 96 h of exposure (17 °C: r = −0.14, p = 0.37; 25 °C: r = −0.064, p = 0.73). Dotted lines indicate linear trends.

Figure 2.
Cell densities of the hemocyte population ((a) Granulocytes; (b) Hyalinocytes; mean ± standard deviation) from Unio pictorum after 96 h exposure to different concentrations of total ammonia nitrogen at 17 °C (white) and 25 °C (black).
Figure 2.
Cell densities of the hemocyte population ((a) Granulocytes; (b) Hyalinocytes; mean ± standard deviation) from Unio pictorum after 96 h exposure to different concentrations of total ammonia nitrogen at 17 °C (white) and 25 °C (black).
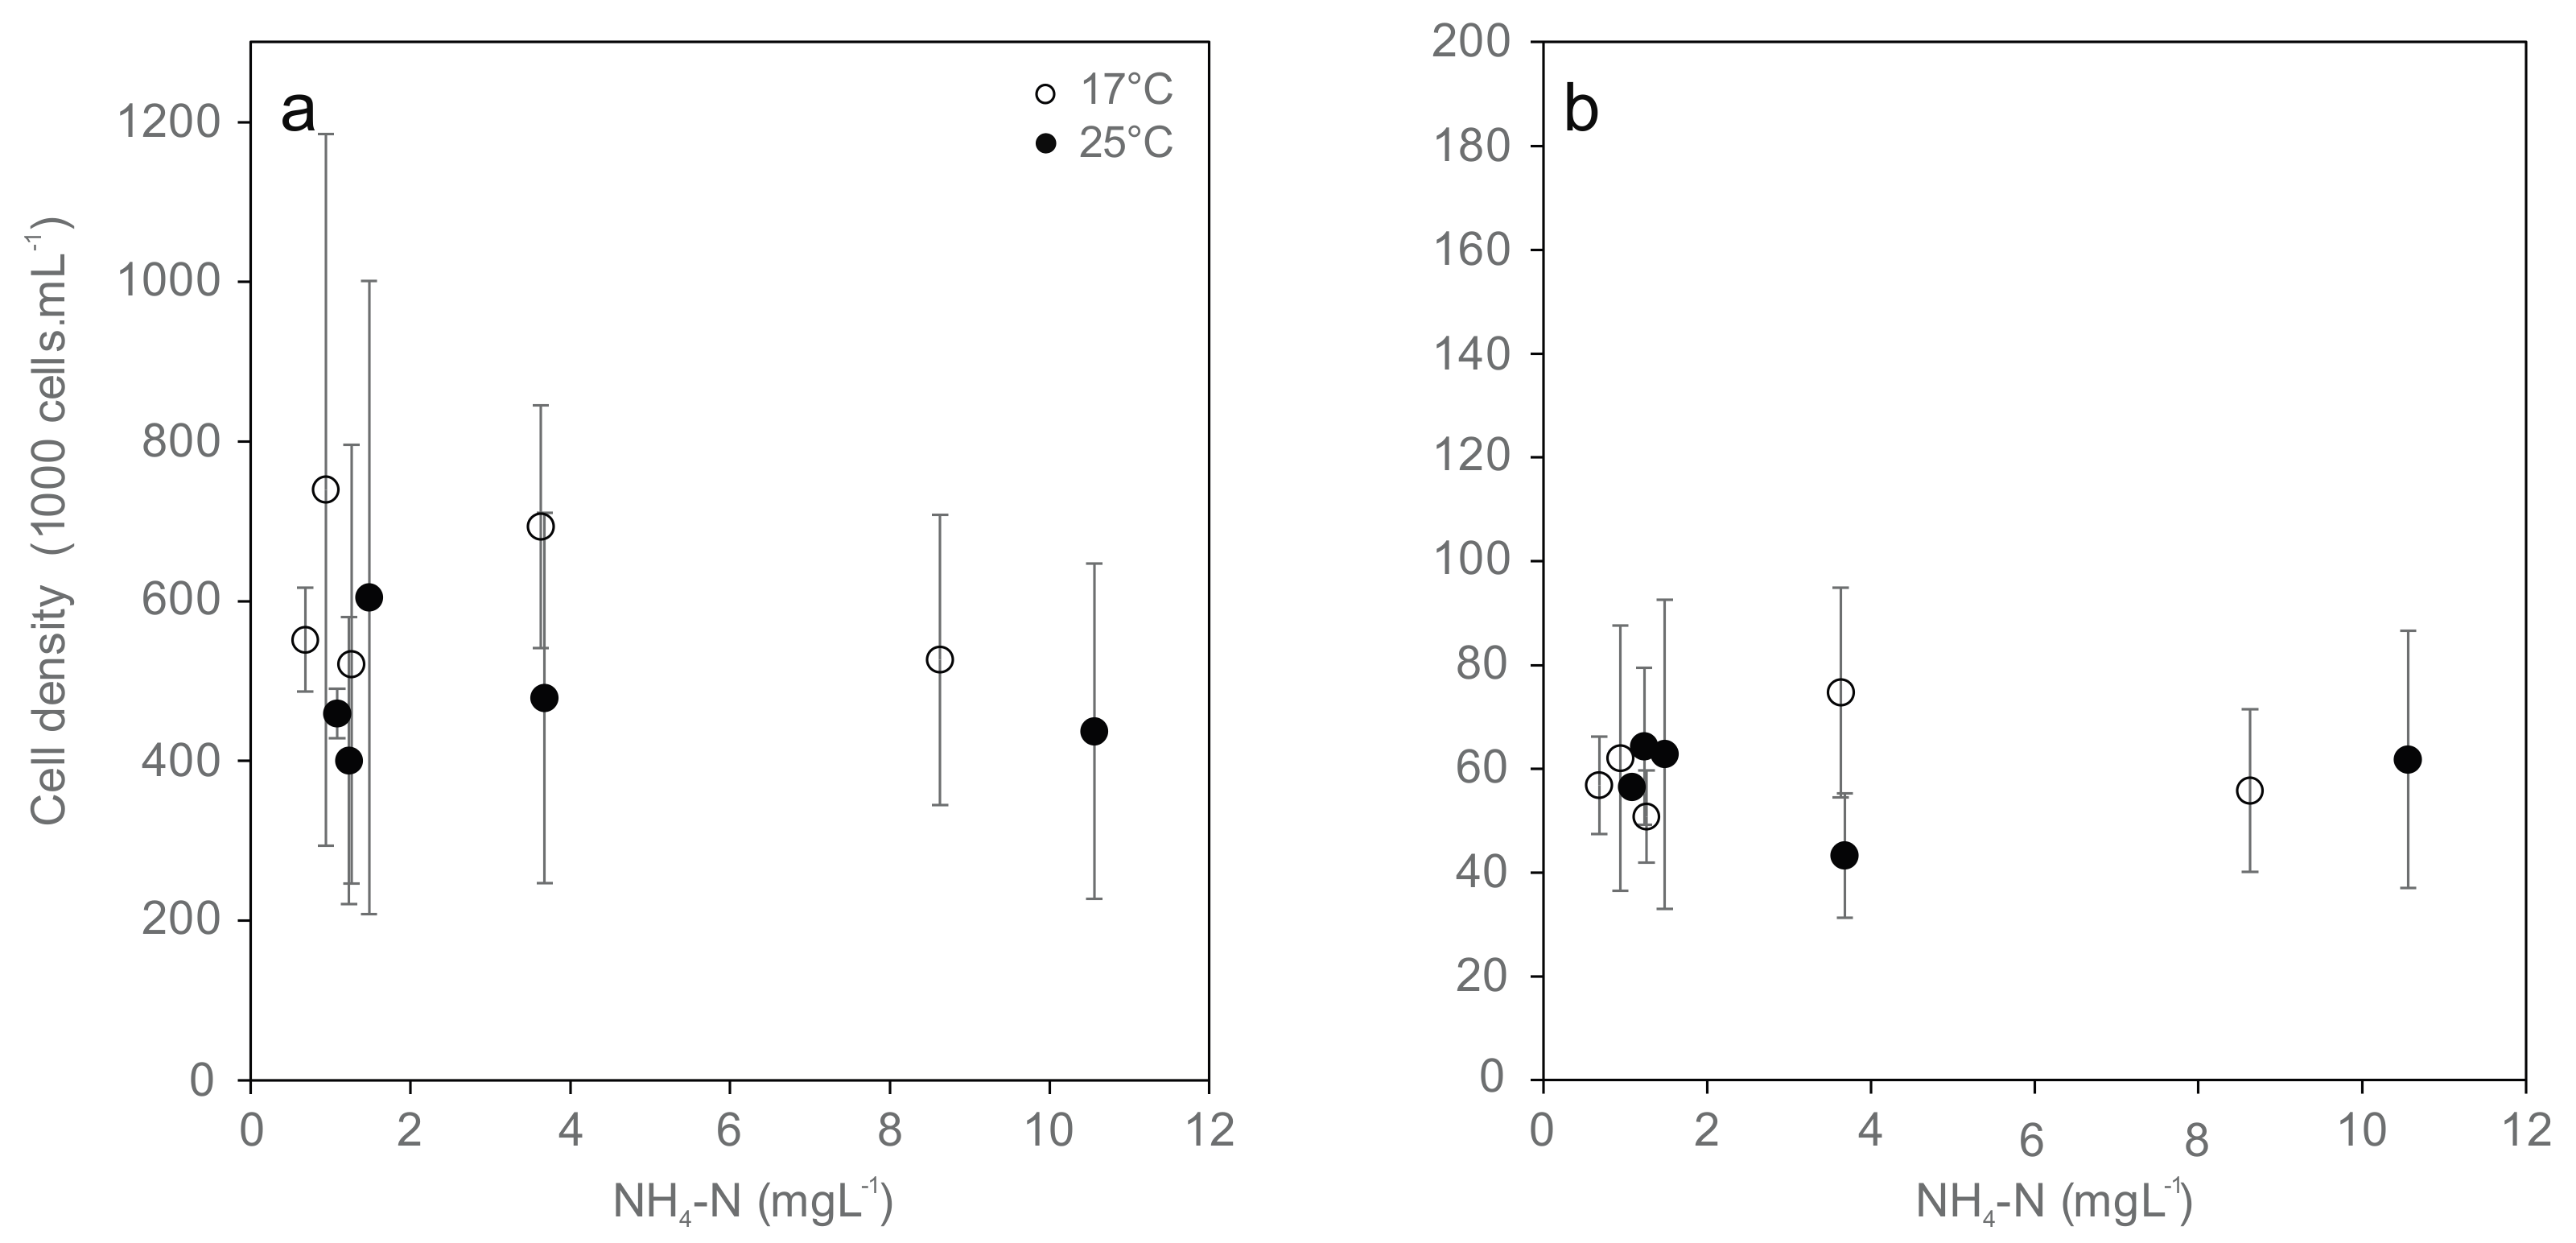
Figure 3.
Hemocyte mortality ((a) Granulocytes; (b) Hyalinocytes) from Unio pictorum exposed to different concentrations of total ammonia nitrogen at 17 °C (white) and 25 °C (black). Dotted lines indicate linear trends (Granulocytes 17 °C: r = −0.07, p = 0.68; 25 °C: r = 0.06, p = 0.77; Hyalinocytes 17 °C: −0.07, r = 0.66; 25 °C: r = −0.06, p = 0.76).

Figure 4.
Relationship between mussel filtration and observed hemocyte mortality ((a) Granulocytes; (b) Hyalinocytes). Correlations between these two endpoints show different trends at 17 °C (white; Granulocytes: r = 0.33, p = 0.03; Hyalinocytes: r = 0.56, p < 0.001) and 25 °C (black; Granulocytes: r = −0.08, p = 0.67; Hyalinocytes: r = −0.20, p = 0.29).

Figure 5.
Glycogen content in U. pictorum foot tissue after 96 h exposure to ammonia at 17 °C (white) and 25 °C (black). Dotted lines indicate linear trends (17 °C: r = −0.01, p = 0.98; 25 °C: r = 0.01, p = 0.95).
Figure 5.
Glycogen content in U. pictorum foot tissue after 96 h exposure to ammonia at 17 °C (white) and 25 °C (black). Dotted lines indicate linear trends (17 °C: r = −0.01, p = 0.98; 25 °C: r = 0.01, p = 0.95).


Table 1.
Nominal and measured test concentrations of total and un-ionized ammonia nitrogen at 17 °C and 25 °C at pH 8.8. Values are presented as mean ± standard deviation. NH4-N refers to Total Ammonia Nitrogen (TAN). Note that differences between nominal and measured values can result from mussel activity.
| Nominal | Measured (17 °C) | Measured (25 °C) | ||
|---|---|---|---|---|
| NH4+ | NH4-N | NH3-N a | NH4-N | NH3-N a |
| (mg·L−1) | (mg·L−1) | (mg·L−1) | (mg·L−1) | (mg·L−1) |
| 0.0 | 0.68 (0.04) | 0.12 (0.01) | 1.08 (0.17) | 0.28 (0.05) |
| 0.3 | 0.94 (0.16) | 0.17 (0.03) | 1.23 (0.42) | 0.32 (0.10) |
| 0.9 | 1.26 (0.24) | 0.22 (0.04) | 1.48 (0.17) | 0.39 (0.03) |
| 3.0 | 3.63 (0.37) | 0.64 (0.08) | 3.68 (0.16) | 0.97 (0.06) |
| 9.0 | 8.63 (0.99) | 1.51 (0.12) | 10.56 (0.53) | 2.78 (0.07) |
Note: a calculated fraction of un-ionized ammonia.
Table 2.
Multivariate test statistic results.
| Wilks’ Λ | F | df | Error | p | Partial ε2 | |
|---|---|---|---|---|---|---|
| Constant term | 0.025 | 285.454 | 7 | 52.000 | <0.001 | 0.975 |
| Temperature | 0.359 | 13.286 | 7 | 52.000 | <0.001 | 0.641 |
| Total ammonia N | 0.744 | 0.576 | 28 | 188.911 | 0.957 | 0.071 |
| Interaction | 0.628 | 0.929 | 28 | 188.911 | 0.572 | 0.108 |
Table 3.
Percentages of actively filtrating mussels based on visual observations and clearance data at the beginning and end of the exposure period (t = 0 h and t = 96 h). Visually active: shell open with visible siphons; measurable active: clearance rate greater than in the control without mussels.
| Temp | NH4-N (mg·L−1) | t = 0 h | t = 96 h | ||
|---|---|---|---|---|---|
| Visually Active | Measurable Active | Visually Active | Measureable Active | ||
| 17 °C | 0.68 | 28% | 28% | 40% | 50% |
| 0.94 | 0% | 33% | 20% | 40% | |
| 1.26 | 50% | 33% | 20% | 40% | |
| 3.63 | 17% | 33% | 0% | 20% | |
| 8.63 | 33% | 33% | 20% | 20% | |
| 25 °C | 1.08 | 44% | 44% | 70% | 50% |
| 1.23 | 0% | 50% | 80% | 80% | |
| 1.48 | 67% | 83% | 40% | 40% | |
| 3.68 | 67% | 50% | 100% | 60% | |
| 10.56 | 83% | 33% | 0% | 60% | |
© 2017 by the authors. Licensee MDPI, Basel, Switzerland. This article is an open access article distributed under the terms and conditions of the Creative Commons Attribution (CC BY) license (http://creativecommons.org/licenses/by/4.0/).
Share and Cite
MDPI and ACS Style
Beggel, S.; Hinzmann, M.; Machado, J.; Geist, J. Combined Impact of Acute Exposure to Ammonia and Temperature Stress on the Freshwater Mussel Unio pictorum. Water 2017, 9, 455. https://doi.org/10.3390/w9070455
AMA Style
Beggel S, Hinzmann M, Machado J, Geist J. Combined Impact of Acute Exposure to Ammonia and Temperature Stress on the Freshwater Mussel Unio pictorum. Water. 2017; 9(7):455. https://doi.org/10.3390/w9070455
Chicago/Turabian StyleBeggel, Sebastian, Mariana Hinzmann, Jorge Machado, and Juergen Geist. 2017. "Combined Impact of Acute Exposure to Ammonia and Temperature Stress on the Freshwater Mussel Unio pictorum" Water 9, no. 7: 455. https://doi.org/10.3390/w9070455
Note that from the first issue of 2016, this journal uses article numbers instead of page numbers. See further details here.