
Effects of Coordinated Operation of Weirs and Reservoirs on the Water Quality of the Geum River


National Institute of Environmental Research, Nakdong River Environment Research Center, 717-873, 24, Pyeongri-1gil, Dasan-myeon, Goryeong-gun, Gyeongsangbuk-do 40103, Korea
*
Author to whom correspondence should be addressed.
Water 2017, 9(6), 423; https://doi.org/10.3390/w9060423
Submission received: 14 March 2017
/
Revised: 22 May 2017
/
Accepted: 31 May 2017
/
Published: 12 June 2017
(This article belongs to the Special Issue Water Networks Management: New Perspectives)
Abstract
:Multifunctional weirs can be used to maintain water supply during dry seasons and to improve downstream water quality during drought conditions through discharge based on retained flux. Sixteen multifunctional weirs were recently constructed in four river systems as part of the Four Rivers Restoration Project. In this study, three multifunctional weirs in the Geum River Basin were investigated to analyze the environmental effects of multifunctional weir operation on downstream flow. To determine seasonal vulnerability to drought, the basin was evaluated using the Palmer Drought Severity Index (PDSI). Furthermore, the downstream flow regime and the effect on water quality improvement of a coordinated dam–multifunctional weir operation controlled by: (a) a rainfall–runoff model; (b) a reservoir optimization model; and (c) a water quality model, were examined. A runoff estimate at each major location in the Geum River Basin was performed using the water quality model, and examined variation in downstream water quality depending on the operational scenario of each irrigation facility such as dams and weirs. Although the water quality was improved by the coordinated operation of the dams and weirs, when the discharged water quality is poor, the downstream water quality is not improved. Therefore, it is necessary to first improve the discharged water quality on the lower Geum River. Improvement of the water quality of main stream in the Geum River is important, but water quality from tributaries should also be improved. By applying the estimated runoff data to the reservoir optimization model, these scenarios will be utilized as basic parameters for assessing the optimal operation of the river.
1. Introduction
Droughts, which are affected not only by insufficient precipitation, but also by several other factors, including dams, rivers, and underground water storage, cause demands on water resources that exceed existing supply capacity. Therefore, an analysis and evaluation of hydrologic characteristics of areas affected by droughts is crucial [1]. To overcome the effects of droughts, non-structured short-and long-term plans incorporating the operation of reservoir groups, while considering water volume and quality, are required.
Severe droughts in Korea occur in five- to seven-year cycles, requiring measures to prevent droughts and minimize drought damage. Short-term measures for overcoming drought include: (a) improvements in water supply capacity by flexible operations of existing dams and reservoir facilities during a drought; (b) a plan for switching water use among reservoirs; (c) water use restrictions and limiting water supply; and (d) promotion and education around water conservation policies. To ensure efficient water use, medium- and long-term measures against droughts are required, such as: (a) improvements in the operational efficiency of existing water resources facilities; (b) development of new water resources based on various alternative plans; (c) extension of existing regional water supply facilities; and (d) a construction plan for a belt-type integrated water supply system [2].
This study examines: (a) an alternative water supply plan; (b) a structural plan to improve the operational efficiency of basin and reservoir groups that considers water volume and quality; and (c) a redevelopment plan that incorporates conversion of existing dams, redistribution of reservoir capacities, and raising dams. Practical development plans must consider approaches, such as: (a) connected operations of usable underground water and surface water; (b) the construction of new eco-friendly dams or dam replacement; and (c) the development of medium-size auxiliary water resources [3].
The Intergovernmental Panel on Climate Change (IPCC) recently reported in its Fourth Assessment Report on Climate Change [4] that global warming is beyond dispute, based on the analysis of voluminous empirical data. The IPCC expects that frequent occurrences of severe droughts and floods caused by climate change will create challenges for environmental and water resources management.
Representative global research groups, including the Western Governors Association (WGA) and the Western States Water Council (WSWC), have established a strategy for sustainable future water supply through dam operations considering climate change in the Western USA [5]. Minville et al. [6] examined irrigation, flood and water generation capacity by tracking reservoirs in order to brace for uncertain future climates in the Peribonka River Basin using the HEC-ResSim reservoir modeling software [7]. Fang et al. [8] studied the optimization of dam operations during drought by classifying climate conditions, and irrigation and flooding seasons, thereby controlling water supply volume and minimizing the water deficit in the Huanghe-Huaige water system. Divakar et al. [9] studied the total benefit functions for agriculture, hydropower, domestic and industrial sectors under a case study of allocation practices. Lin and Rutten [10] studied the optimal operation of a network of multi-purpose reservoirs for real time control on the application of model predictive control of a reservoir system. Li et al. [11] studied the improved multi-objective optimization model for supporting reservoir operation of China’s South-to-North water diversion project.
In Korea, Shim et al. [12] discussed the discharge flow of water and evaluated stable operational conditions of an irrigation system under drought conditions, in order to develop an expert system based on the connected operation of reservoirs of the Chungju and Soyang Dams. Chung [13] simulated the hydraulic characteristics and variation in water quality of a river during flushing events using the Koriv1-WIN water quality model, and compared it with actual measurements to evaluate the effects of reservoir flushing on the water quality of a river. To examine the integrated operation of an existing dam and 16 multifunctional weirs constructed under the Four Rivers Restoration Project, Ahn et al. [14] studied the connected operation of an existing dam and three multifunctional weirs by applying the HEC-ResSim model to the Geum River Basin, and suggested an operational rule for the multifunctional weirs, in order to analyze the environmental flow and hydropower.
A number of efforts have been devoted to the development of water quality management strategies to ensure the supply of water with a targeted quality [15]. In a representative study, Hayes et al. [16] combined a water quality simulation model and an optimal control algorithm to evaluate water quality improvement opportunities through operational modifications. Although previous studies have examined runoff, reservoir operation, and water quality separately, they did not evaluate the effect of the operation of reservoir groups and irrigation facilities on water quality of a river during drought conditions using an integrated method. In Korea, 16 multifunctional weirs were recently constructed in four river systems under the Four Rivers Restoration Project. Because a multifunctional weir can be utilized to maintain water supply during dry seasons or to improve downstream water quality during drought conditions based on retained flux, this study assessed drought conditions that occurred in the Geum River Basin with the PDSI. The study also examined the effect of coordinated dam–multifunctional weir operations on water quality improvement, using: (a) a rainfall–runoff model; (b) a reservoir optimization model; and (c) a water quality model. An examination of the variation in water quality under each operational scenario, considering discharge flow and branch inflow, was used as the basis for the assessment of the optimal operation of the river.
2. Study Site: The Geum River
The area of the Geum River Basin is 9915 km2 and the length of its main stream is 398 km. The boundaries and main features of the Geum River Basin are shown in Figure 1a. The basin is significantly affected by the flow regime control of the Daecheong and Yongdam Dams, which were constructed in 1981 and 2001, respectively. In addition, three multifunctional weirs were constructed in the Geum River as part of the Four Rivers Restoration Project. Seven weather stations are located in Cheongju, Boeun, Chupungryong, Daejeon, Buyeo, Geumsan, and Jangsu. The Yongdam Dam supplies water to the towns of Jeonju, Gunsan, Iksan, and Wanju, which are located outside of the Geum River Basin. The Daecheong Dam supplies water to three local governments: Cheongju, Daejeon and Cheonan, Asan, and Danjin. The first and the second cities are located within the Geum River Basin, while the third, a group of municipalities, is located outside the basin.
The long-term water resources plan [17] assessed that the annual average precipitation and annual runoff of the Geum River Basin in its natural state are 1226.6 mm and 7008 million m3, respectively. Maximum precipitation and runoff both occur in July, whereas minimum precipitation and runoff occur in January and February, respectively. A comparison of runoff with precipitation reveals that 57.6% of precipitation is discharged to the river. In 2006, approximately 2648 million m3 of water from the Geum River Basin was consumed for domestic, industrial and agricultural uses [17]. Of the total volume of water used in this area, 2522 million m3 were supplied by the river and reservoir, and 126 million m3 were supplied by underground water. Compared with the average annual runoff, the water intake from river and reservoir comprised approximately 36%, which is significantly higher than water intake values in Japan, USA and England, which range between 10% and 20%.
In the Geum River Basin, the volume of water intake and regional water supply equals 780 million m3 of annual flow, which contributes to the continually changing flow regime of the natural river. Construction of dams and reservoirs in river basins, combined with water use and regional water supply, are the major factors influencing natural flow regimes. Inflow and outflow control by the dam and reservoir not only have the positive effect of reducing flux during the flood season and increasing flux during the dry season, but also the negative effect of simultaneously changing the flow regime.
3. Methodology
Some previous studies [18] reported that flushing discharge could improve the hydrological and ecological regimes as well as water quality below a reservoir. Examining the status of water use in the Geum River Basin and the variation in downstream water quality due to the operation of the existing dams and three multifunctional weirs constructed under the Four Rivers Restoration Project is essential for understanding continuous water flow and water management within an integrated water system. Due to population growth and accelerated urbanization and economic development in the area of the Geum River Basin, vulnerability to drought has increased. Therefore, operating the water resource facilities in an efficient manner during drought conditions through the coordinated operation of existing dams is required to minimize drought damage. Some optimizations minimize flow deficits, rather than setting hard constraints [19,20]. Goor et al. [21] revealed that the operation of the coordinated reservoirs enable an average annual saving of at least 2.5 billion m3, and would have significant positive impacts on hydropower generation and irrigation.
This study evaluated the downstream flux depending on the operational method applied to each irrigation facility by calculating the runoff at each point. Water use in the Geum River Basin was evaluated: (a) using a rainfall–runoff model; (b) by applying the calculated runoff to a reservoir operation model; and (c) by examining the variation in the downstream water quality due to the operation of an irrigation facility. For the calculation of runoff, water use and intake in the dam are not considered in the HEC-ResSim model, although water use in each small watershed is considered. To eliminate the discharge features that have changed since 2009, when the Four Rivers Restoration Project was implemented, discharge events that occurred prior to the project were examined. Runoff data over the 25-year period from 1984 to 2008 were calculated with the US Army Corps of Engineers (USACE)’s SSARR (Streamflow Synthesis And Reservoir Regulation) model, and the rate of inflow to each irrigation facility was calculated using the area rate based on the calculated runoff.
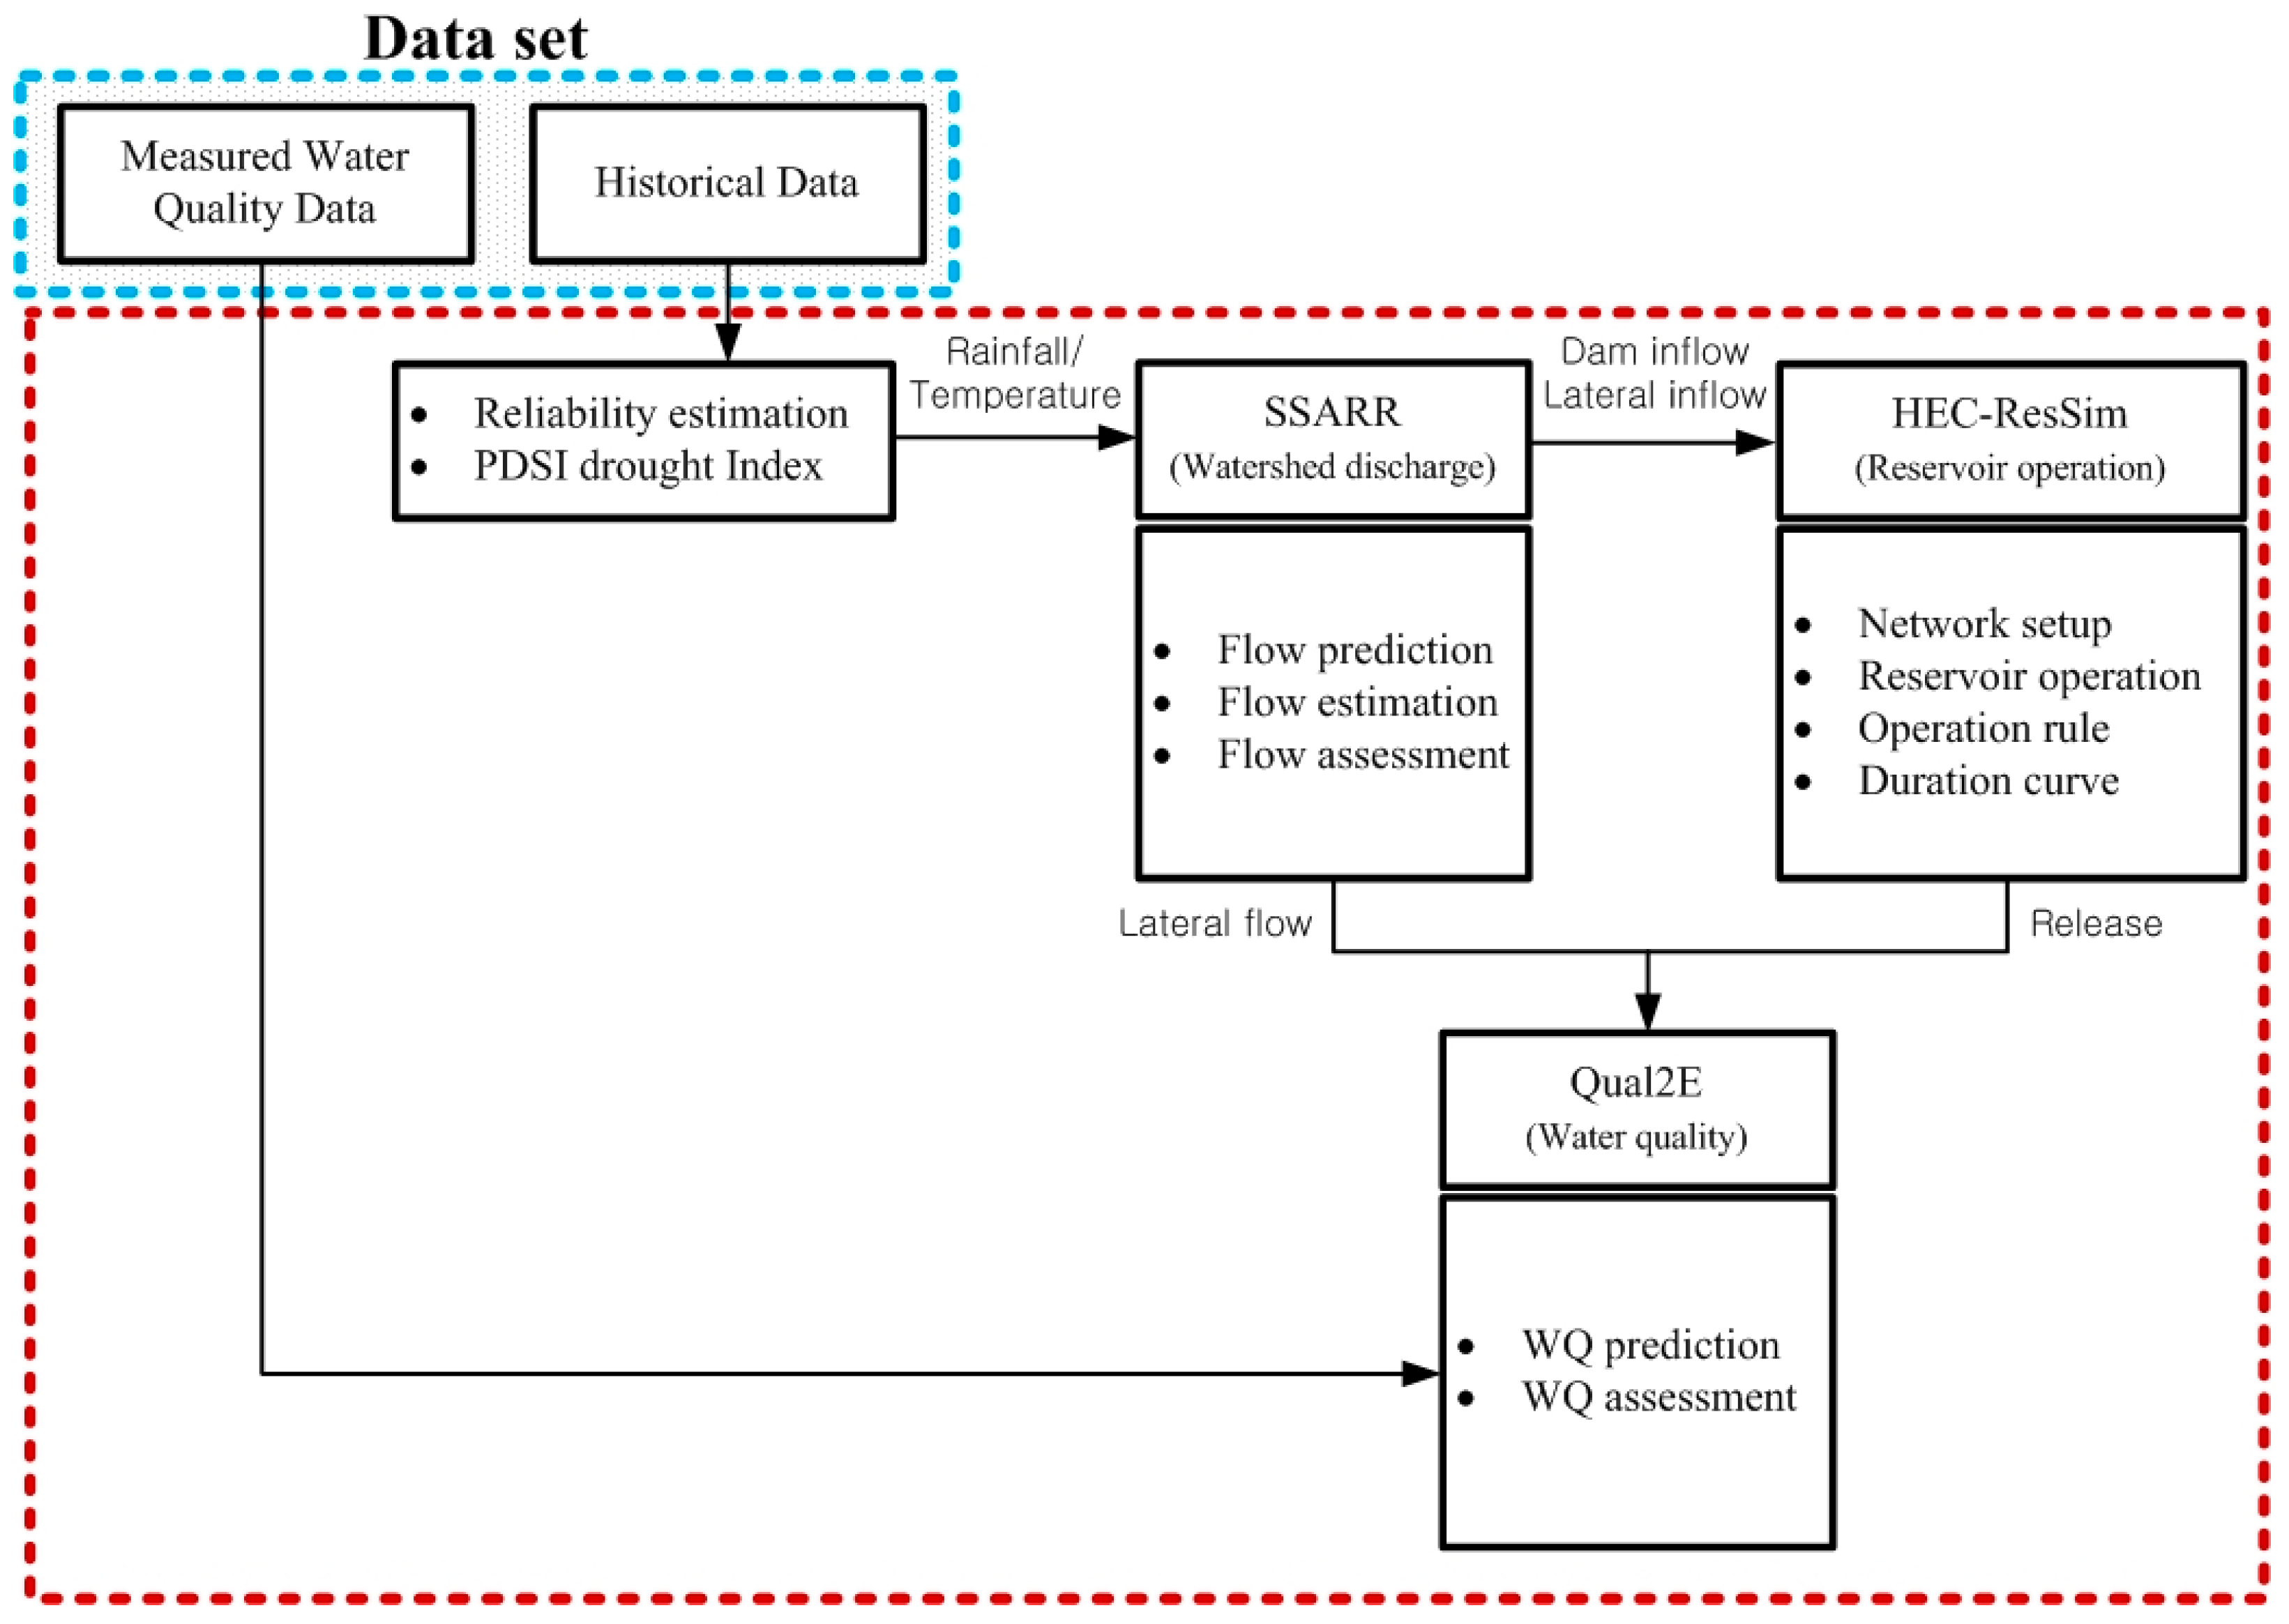
An integrated operational network for the upstream and downstream areas of the dam was established using the HEC-ResSim model to optimize the water supply in the Geum River Basin and surrounding region. The downstream flux was produced by optimal operation of the dam and multifunctional weirs. To determine the duration of drought conditions in the Geum River Basin, the PDSI was used to evaluate the drought conditions based on floodgate data from seven weather observation stations located in the basin. The drought duration was calculated using the Qual2E water quality model, based on the PDSI, and variation in the downstream water quality depending on the operation of the irrigation facility during drought conditions. Each model was calibrated using observed data, and the procedures to assess environmental impacts depending on the operation of weirs and reservoirs are shown in Figure 2.
3.1. Estimation of Impounded Runoff
The SSARR model was employed to calculate the runoff [22]. The model was used to improve the GUI (Graphic User Interface) program, which is Windows-based and was developed by the USACE in 1956. This model has been successfully applied to large rivers, such as the Columbia River in the USA [23], the Mekong River in Vietnam [24], and the Bocheongchun Basin [25] and the Geum River Basin [26,27,28,29,30] in Korea. The model was selected as the precipitation–discharge calculation program of the river discharge management system [31], which was implemented for water management purposes after the Four Rivers Restoration Project.
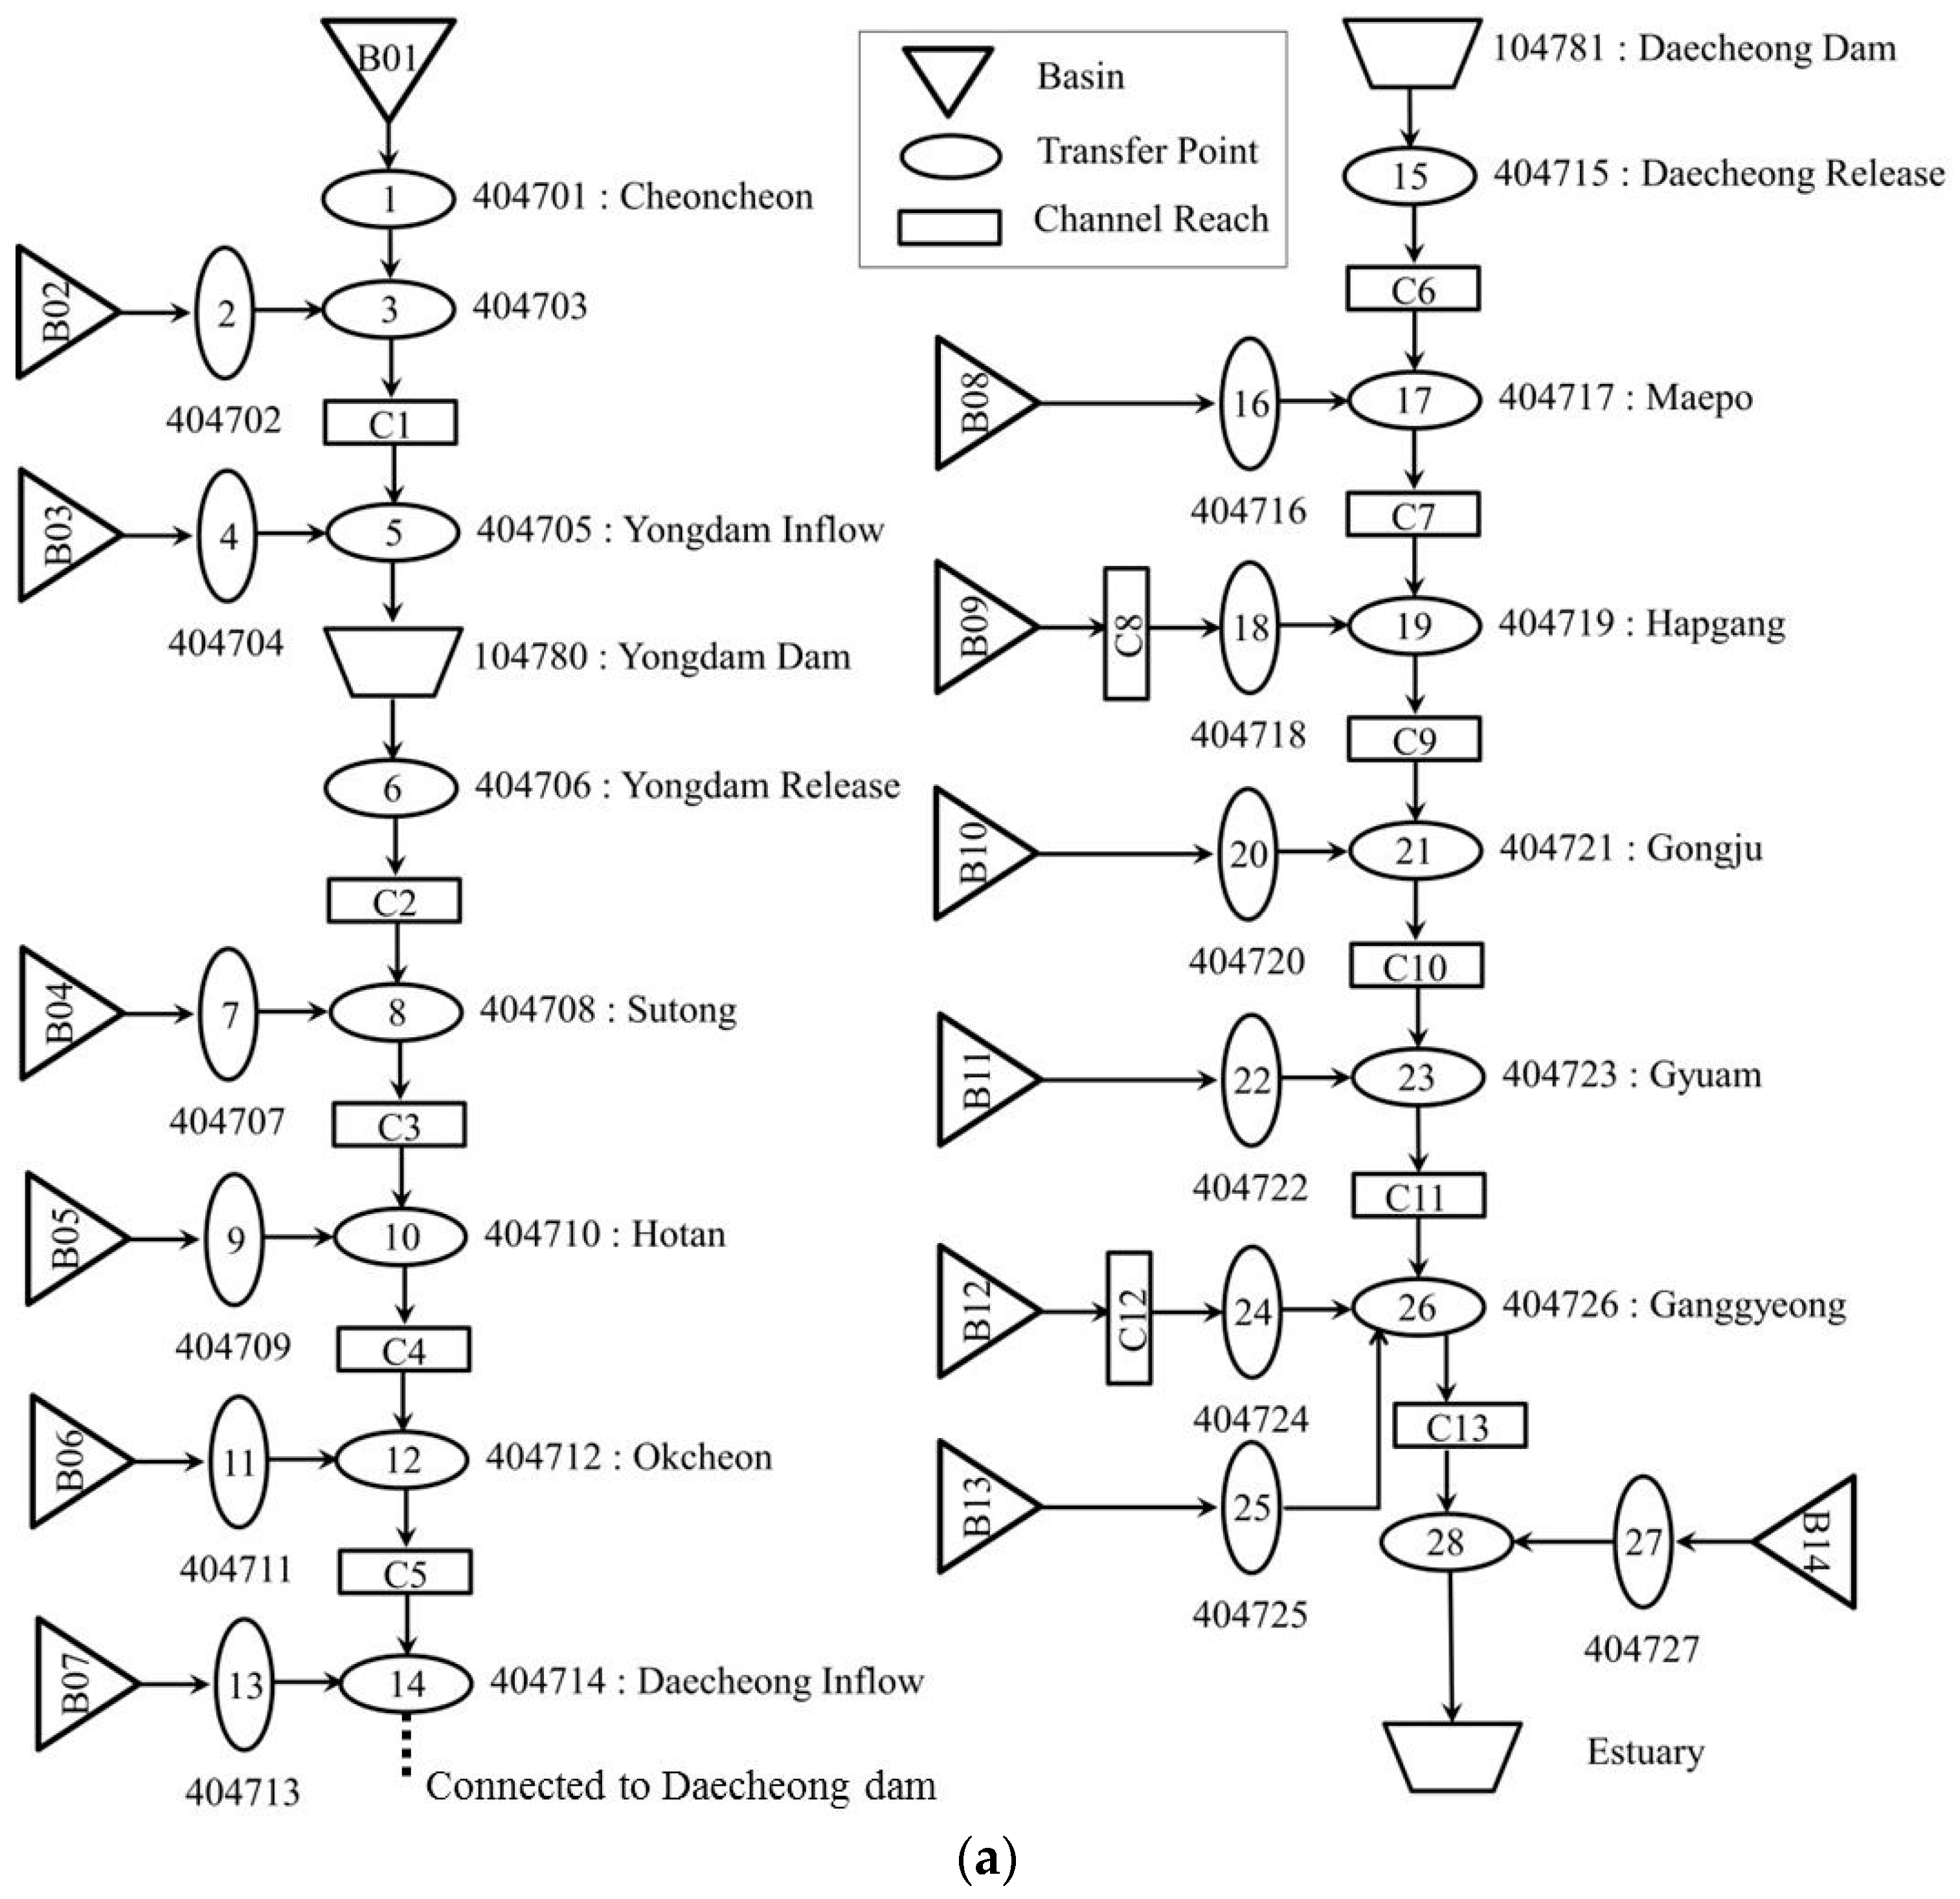
The target area in this study is the Geum River Basin, one of the basins affected by the Four Rivers Restoration Project, where field investigations have been underway for several years to acquire reliable floodgate data. To simulate discharge, the basin was divided into 14 small watersheds, and a schematic of the established SSARR model is shown in Figure 1b and Figure 3a. The parameters of the model consist of values established through research by Ahn et al. [29,30,32]. The calculated parameters, including SMI–ROP (soil moisture index-runoff percentage) and BII–BFP (baseflow infiltration index-baseflow percentage), had to be calibrated to be used as initial parameters at the time of simulation in the form of graphs (Figure 3b). The sum of precipitation and snowmelt amounts is divided into soil water and runoff according to the SMI. The SMI measures the rate of runoff according to the condition of the soil, but it does not contribute to runoff, because soil moisture is removed only by evapotranspiration. The runoff amount can be classified into direct runoff and baseflow using the Baseflow Infiltration Index (BII).
In this study, it is assumed that calibration of the calculated parameters over the period of one year can produce initial parameters at the time of simulation. Modeling and analysis procedures start with the collection of input data, including rainfall, temperature, type of water supply, intake volume and dam discharge. Rainfall–runoff relations for each divided basin are characterized by these parameters, and then corrected by comparing estimated runoff results and observed runoff results. Figure 4 shows the calibration results of SSARR for the Gongju gauging station to enable comparative analysis of the observed and simulated values. The SSARR model showed that the fitting was in good agreement between measured values and the developed model for runoff.
Statistical bias is defined as the difference between the parameter to be estimated and the mathematical expectation of the estimator. The root-mean-square error (RMSE) is a frequently used measure for the differences between values (sample and population values) predicted by a model or an estimator and the actually observed values. The RMSE depends on the scale of the dependent variable. It should be used as a relative measure to compare forecasts for the same series across different results. The smaller the error, the better the forecasting ability of that model according to the RMSE criterion. These individual differences are also called residuals, and the RMSE serves to aggregate them into a single measure of predictive power. The Nash-Sutcliffe model efficiency coefficient (NSEC) [33] is used to assess the predictive power of hydrological models. NSEC can range from to 1. An efficiency of 1 (NSEC = 1) corresponds to a perfect match of modeled discharge to the observed data. An efficiency of 0 indicates that the model predictions are as accurate as the mean of the observed data, whereas an efficiency less than zero () occurs when the observed mean is a better predictor than the model. The United States Geological Survey (USGS) reported that the Cedar River Basin model is meeting the criteria of NSEC greater than 0.5, and is a good fit of streamflow conditions for the calibration period [34]. The Theil inequality coefficient is such that it will always lie between 0 and 1. If TIC = 0, for all forecasts and there is a perfect fit, if TIC = 1 the predictive performance is as bad as possible. The three corresponding equations are shown below.
where represents the observed values, are the modeled values at time/place i, and are the average observed values.
Satisfactory model efficiency can then be established depending on the number of times (Nt) that the observations variability is greater than the mean error. If the mean model error is represented by the RMSE and the variability of the observations is given by their standard deviation (SD), SD and Nt are expressed as:
If the value of Nt is higher than 2.2 and the value of NSEC is higher than 0.90, then it can be interpreted that the model performance is very good [35], as shown in Table 1. As shown in Table 2, in the case of the Daecheong Dam, RMSE and NSEC were calculated as 15.9–86.1 and 0.7–0.9, and TIC and Nt were calculated as 0.11–0.36 and 0.69–2.99, respectively. In the case of the Gongju Weir, RMSE and NSEC were calculated as 41.6–159.2 and 0.5–0.9, respectively, and TIC and Nt were calculated as 0.16–0.25 and 0.7–1.52, respectively, suggesting “Good” and “Very Good” model performance, respectively.
For the runoff analysis, various hydrologic input data were applied, including precipitation, temperature and type of water, while dam discharge flow and intake flow were excluded in the HEC-ResSim model. For the calculation of runoff, events over the 25 years from 1984 to 2008 were analyzed, and the runoff results at major points were calculated with the SSARR model for use as input data in the HEC-ResSim and Qual2E models.
3.2. Dam-Weir Operation
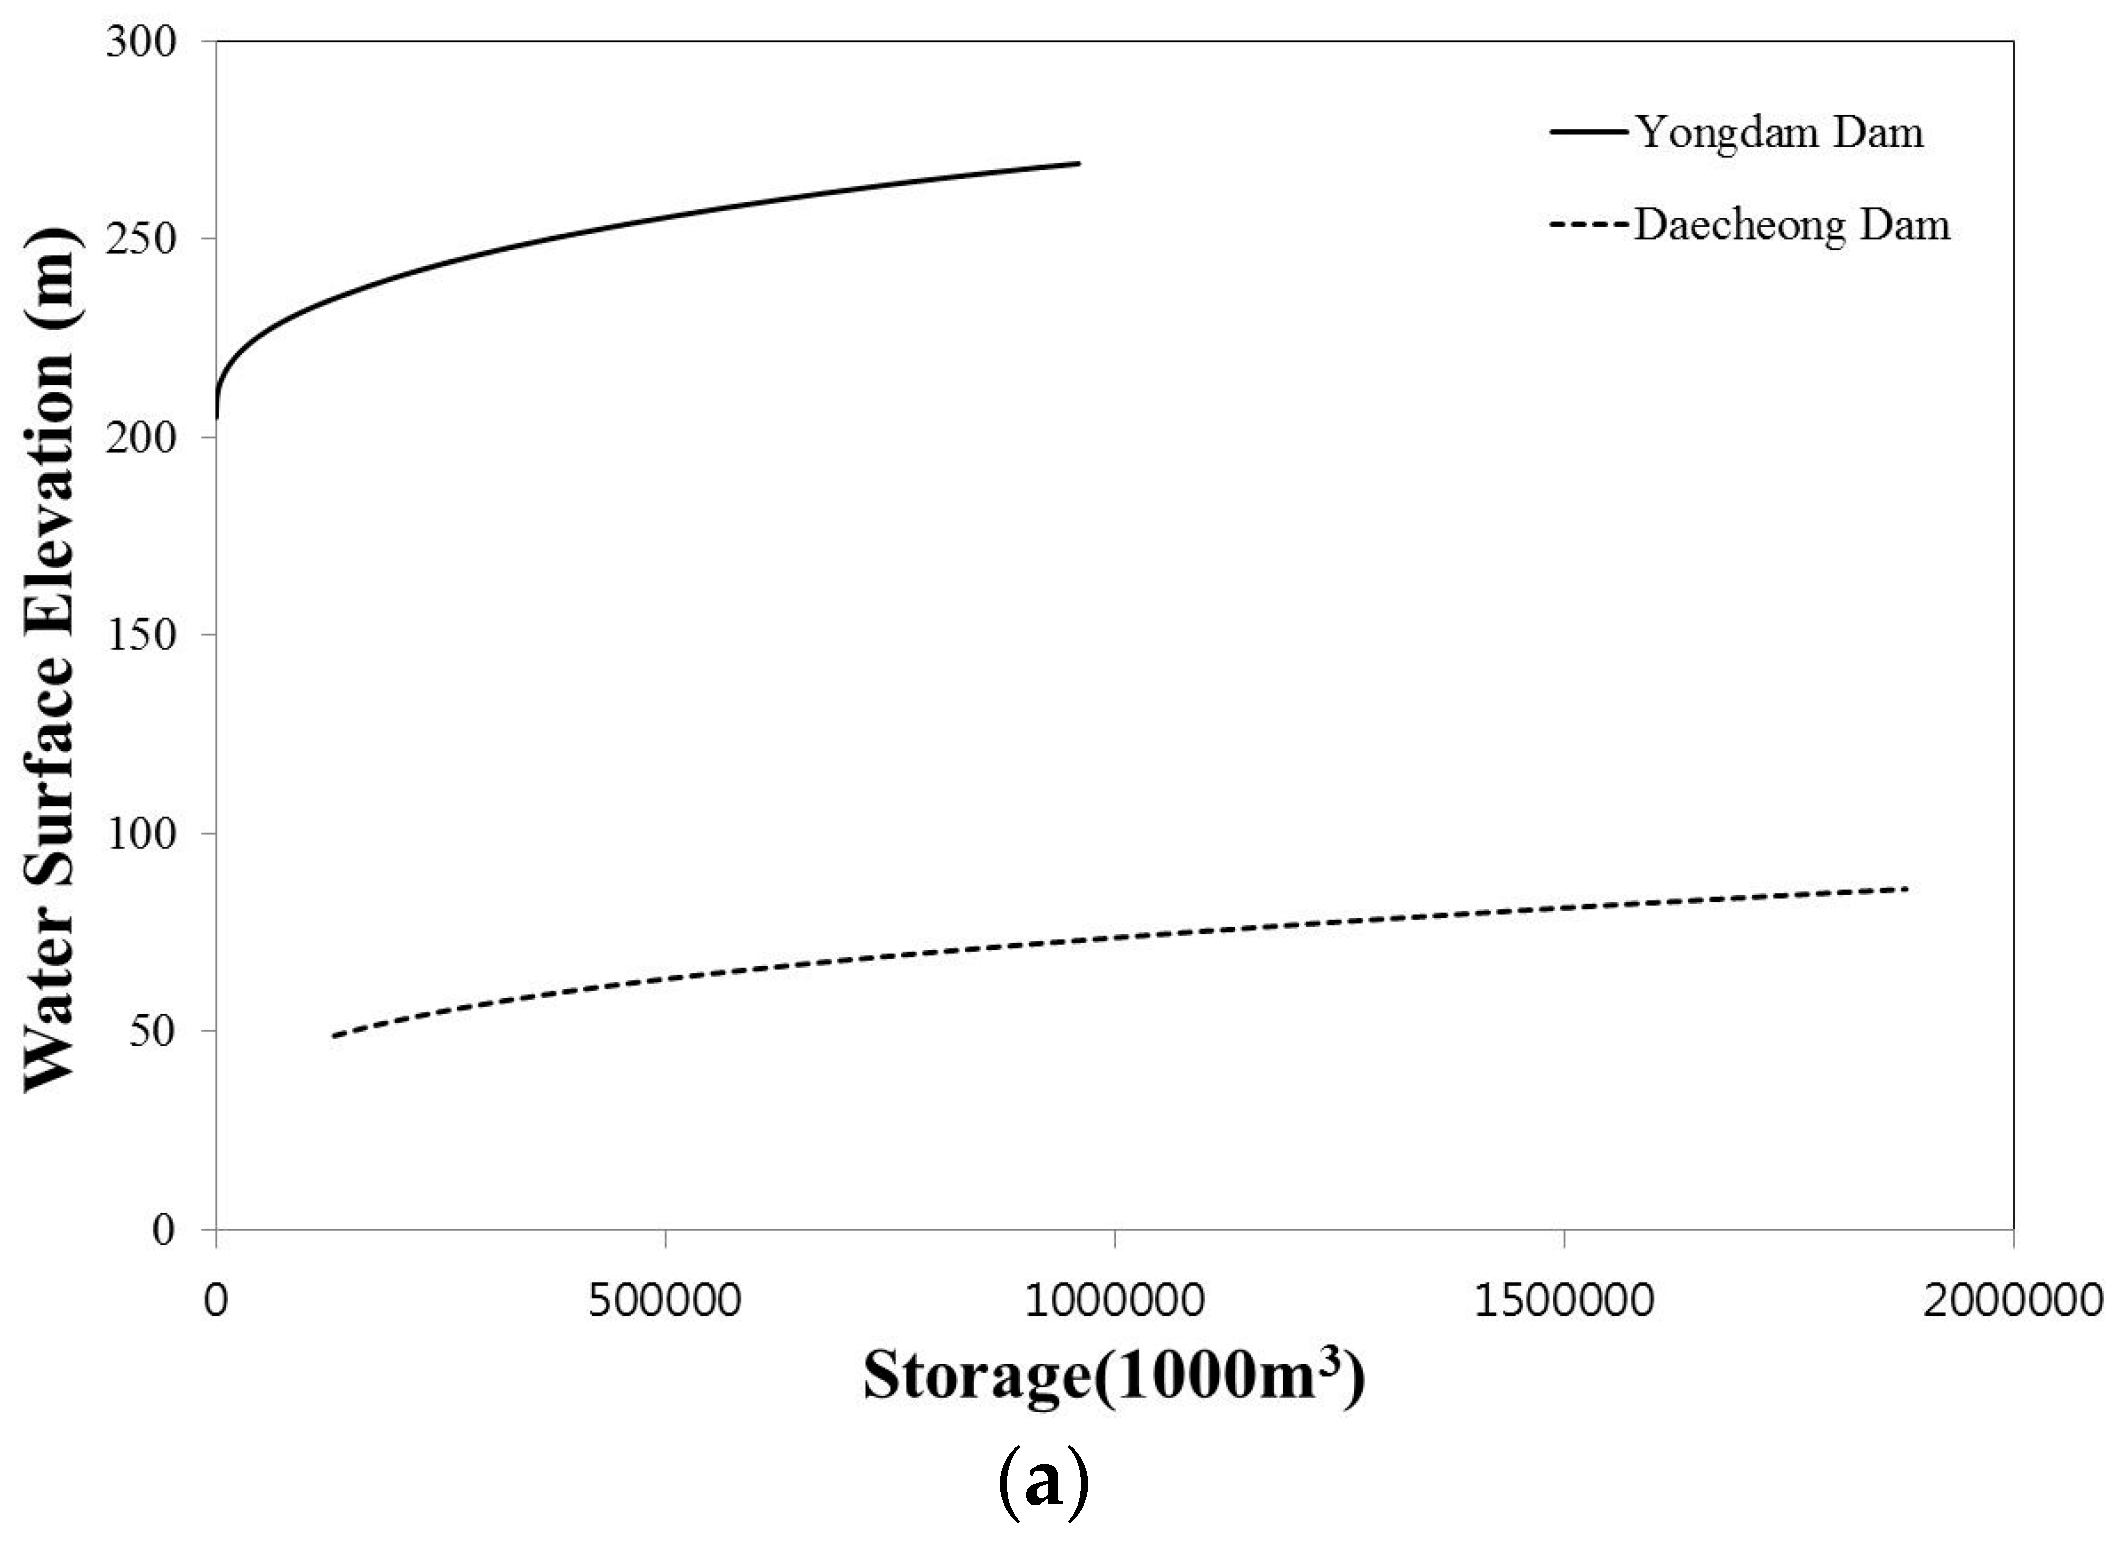
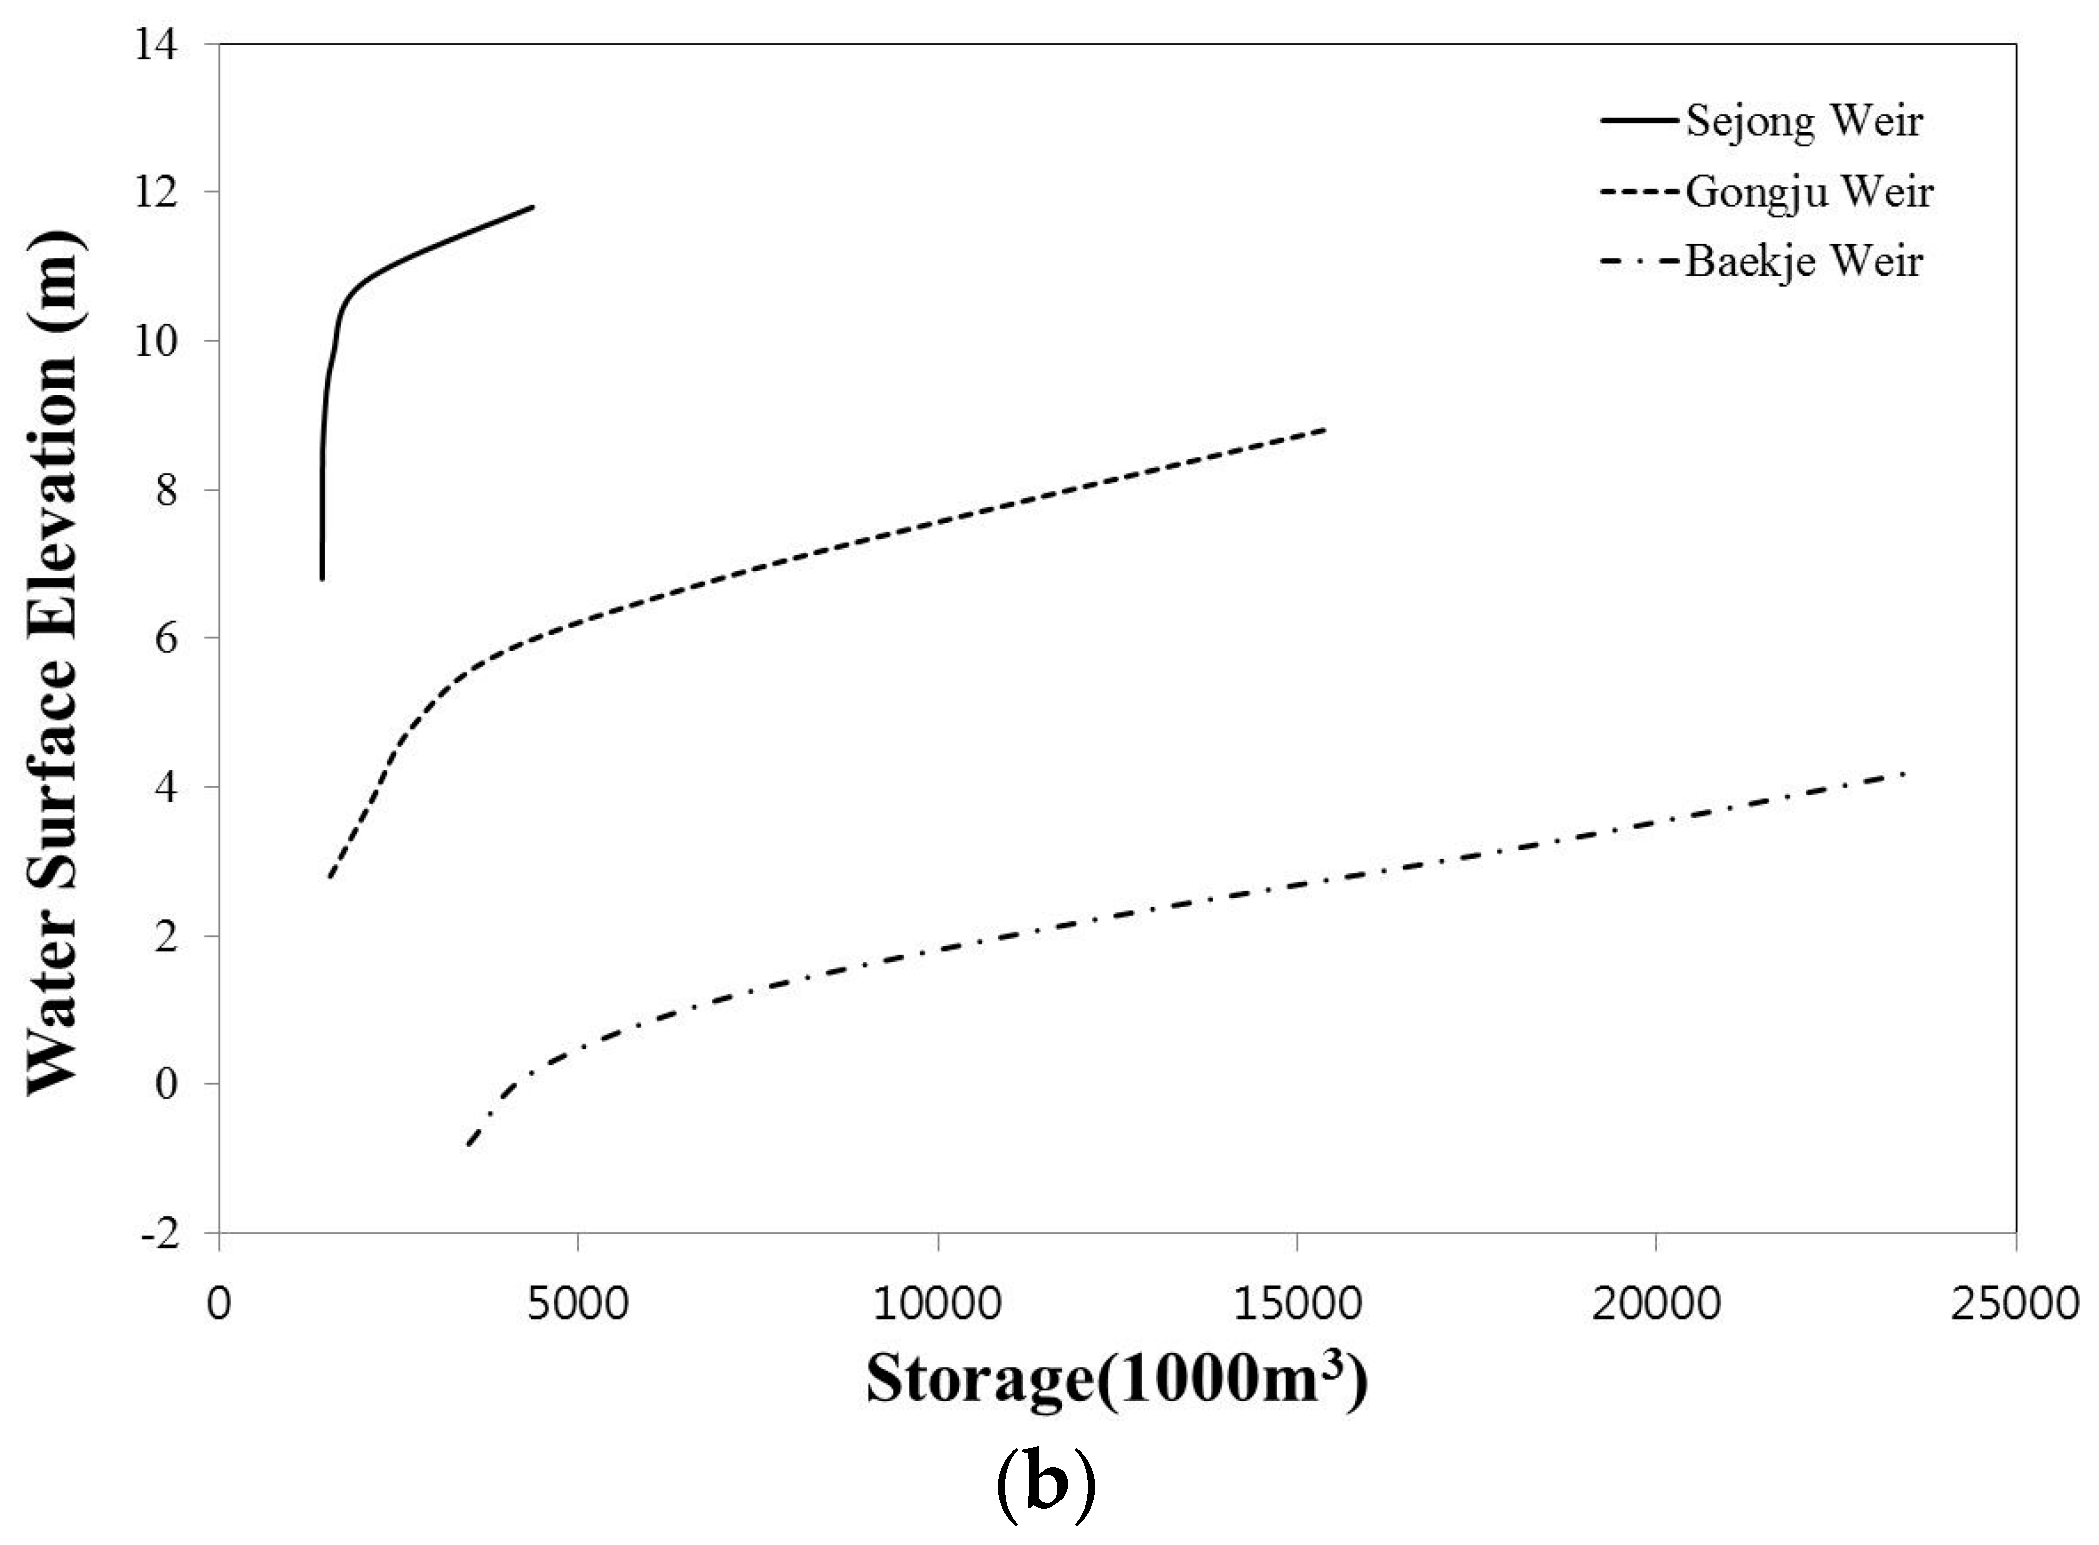
Before construction of the Daecheong and Yongdam Dams, the Geum River was assumed to be in a natural state, whereas afterwards, the physical and hydrologic characteristics of the river changed due to the construction of the dams. Following the construction of the Sejong, Gongju and Baekje Weirs under the Four Rivers Restoration Project, additional changes ensued. Figure 5 shows the relationship between the water level and the storage capacity of the dams and weirs.
By reducing uncertainty in reservoir inflows, operators can allocate less reservoir space for flood storage and increase the water provided for instream flow [36]. The control point for the operation of the irrigation facility was selected as the gauging station point of Gyuam downstream of the Daecheong Dam, where the correlation of water-level flux is relatively well established. In the area where the Yongdam and Daecheong multifunctional dams are located, the Sejong, Gongju, and Baekje Weirs have only recently been constructed. Koh et al. [37] established the K-MODSIM program for Sutong point with three scenarios, depending on the existence of the Yongdam Dam, and these included: (a) a scenario for Gongju point in which both Yongdam Dam and Daecheong Dam are nonexistent; (b) a scenario in which only Daecheong Dam exists; and (c) a scenario in which both Yongdam Dam and Daecheong Dam exist. K-MODSIM was developed by K-Water by modifying the source code of the MODSIM model originally developed by Colorado University. MODSIM 8.1, the most recent version of MODSIM, was developed for application with the unique conditions and water planning and management issues facing Korea.
This study converted the flux calculated by the SSARR model to the area ratio in order to calculate the flux for HEC-ResSim, as shown in Table 3. In order to apply the results of the SSARR model to the input conditions of the HEC-ResSim model, the transfer point results as shown in Figure 3a were used. Thus, 404,705 in Table 4 is the Yongdam Dam inflow calculated by the SSARR model. The specification, operating water level, reservoir capacity and water supply plans of the dams and multifunctional weirs applied to the model are shown in Table 4, and are referenced in the Dam Operation Manual [38].
HEC-ResSim model was carried out before and after construction of the multifunctional weirs. Generally, control discharge and flood discharge were calculated by considering downstream demand and by satisfying water level requirements of the dam under general operating conditions. Discharge control ensures that the water level does not exceed the normal pool level within the range of reservoir discharge capacity and stream discharge capacity at the downstream control point. If the water level in the reservoir falls below the minimum level due to excessive water usage, the discharge terminates. Flood discharge is determined considering the specified discharge that does not cause downstream damage, although if the water level of the dam rises continuously, the amount of water required to cause a drop in the water level must be discharged for the safety of the dam.
By operating multifunctional weirs, the water level can be maintained at a constant level, unlike during dam operation. Ahn et al. [14] reviewed the directional behavior of downstream flow, which maintains the water level (target water level) for landscape creation. An excessive amount of water is discharged through fixed weirs and additional water shortage is caused by gate operations, if downstream demand is not met. Because discharge through a fixed weir runs parallel to the discharge through fishways and other small hydropower systems, stream discharge capacity insufficient for the fixed weir is supplemented. Unlike dams, multifunctional weirs do not have a freeboard (the vertical distance between the top of the dam and the full supply level of the reservoir). If a freeboard is established in the multifunctional weir model, simulations for normal operating condition are not feasible, because additional reservoir capacity has been created. Therefore, because the freeboard is equivalent to the controlled water level established in the multifunctional weir model, virtual reservoir capacity is eliminated and must be replenished by overflow through a fixed weir. When inputting the specifications of the multifunctional weir, the simulation must be carried out with only a movable weir, primary floodgates, including sluice gates, and fishway gates. Currently, the length and width of the fixed-weir section must be input precisely, and the overflow volume through the fixed weir is calculated by the model.
The operating water levels of the dams and weirs are shown in Table 4. The operating water levels of the dams and the reservoirs correspond to the minimum water levels, while the operating water levels of the multifunctional weirs correspond to the water levels set for drought conditions before weir construction. The constant flux at Gyuam point was increased as much as possible through the coordinated operation of the structures. Although discharge assumes priority, both the independent operation of the dams and the relatively simple integrated operation can be easily simulated in the HEC-ResSim model using the serial operation rule, parallel operation rule, and simple discharge rule. However, the operating rules used in this simulation cannot be easily established in the case of the complicated dam connection structures used in Korea.
Accordingly, this study prioritizes operating rules and general operating rule settings, which can be divided into the establishment of the model and operating rule settings (Figure 6). Dam operation is similar to the operating conditions under which the water supply capacity of existing dams was investigated [39], and the operating rule is applied based on the rules suggested by Ahn et al. [14].
In the case of a tandem operating rule, discharge of the downstream dam is satisfied through coordinated operation, while maintaining the same storage capacity of the dam and the weir. Next, a downstream control function rule satisfies downstream demand, considering effective water storage, by allocating large discharge to the side where effective water storage is large and small discharge to the side where the effective water storage is small. In this study, we applied the optimized operating rules as shown in Figure 6.
Korea Institute of Construction Technology (KICT) (1994) proposed a reliability-based assessment method to improve water supply capacity assessments of multi-purpose dams [40]. Since an annual water supply plan relatively underestimates the water supply, the KICT method was selected for calculations of annual water supply reliability as shown in Equation (6):
where, is the total number of analyzed years, and is the number of satisfied years.
Reliability () is defined as the probability that the system will properly provide the water supply during time period t, and it can be expressed as shown in Equation (7). Risk () is defined as the probability that the water supply will not satisfy water demand in time period t, and it can be expressed as shown in Equation (8). The criteria used in the reliability analysis for the design and operation of the water resource system are divided into frequency-based reliability values, which show the proportion of the total period during which water shortages occurred, and quantitative reliability levels, which show the proportion of water shortages in relation to the total water supply; the relevant equations are as follows:
where α is the reliability, S is the satisfied water demand, is a risk degree, and F is the water shortage state.
Briefly describing a system optimization method, the safety degree for water shortage used to assess water supply was set as 97% calculated from Equation (6), meaning water shortage occurs for only one year in the total 25 years of discharge events. For calculation of runoff using the SSARR model, events over the 25 years from 1984 to 2008 were analyzed.
There are many operating rules applicable to the HEC-ResSim model. Figure 6 is the rule that can supply the maximum water. The optimal operation rule proposed in this study is to find the operation rule that satisfies Equation (6), and at the same time, it is when the maximum water supply is possible as shown in Figure 7.
The irrigation water (residential/industrial/agricultural) and the maintenance water supplies were fixed (constant amount), and the amount of discharge from the dams and weirs was adjusted. The optimization water supply in the coordinated operations means the maximum amount that can be supplied in the water system including the maintenance water of the river.
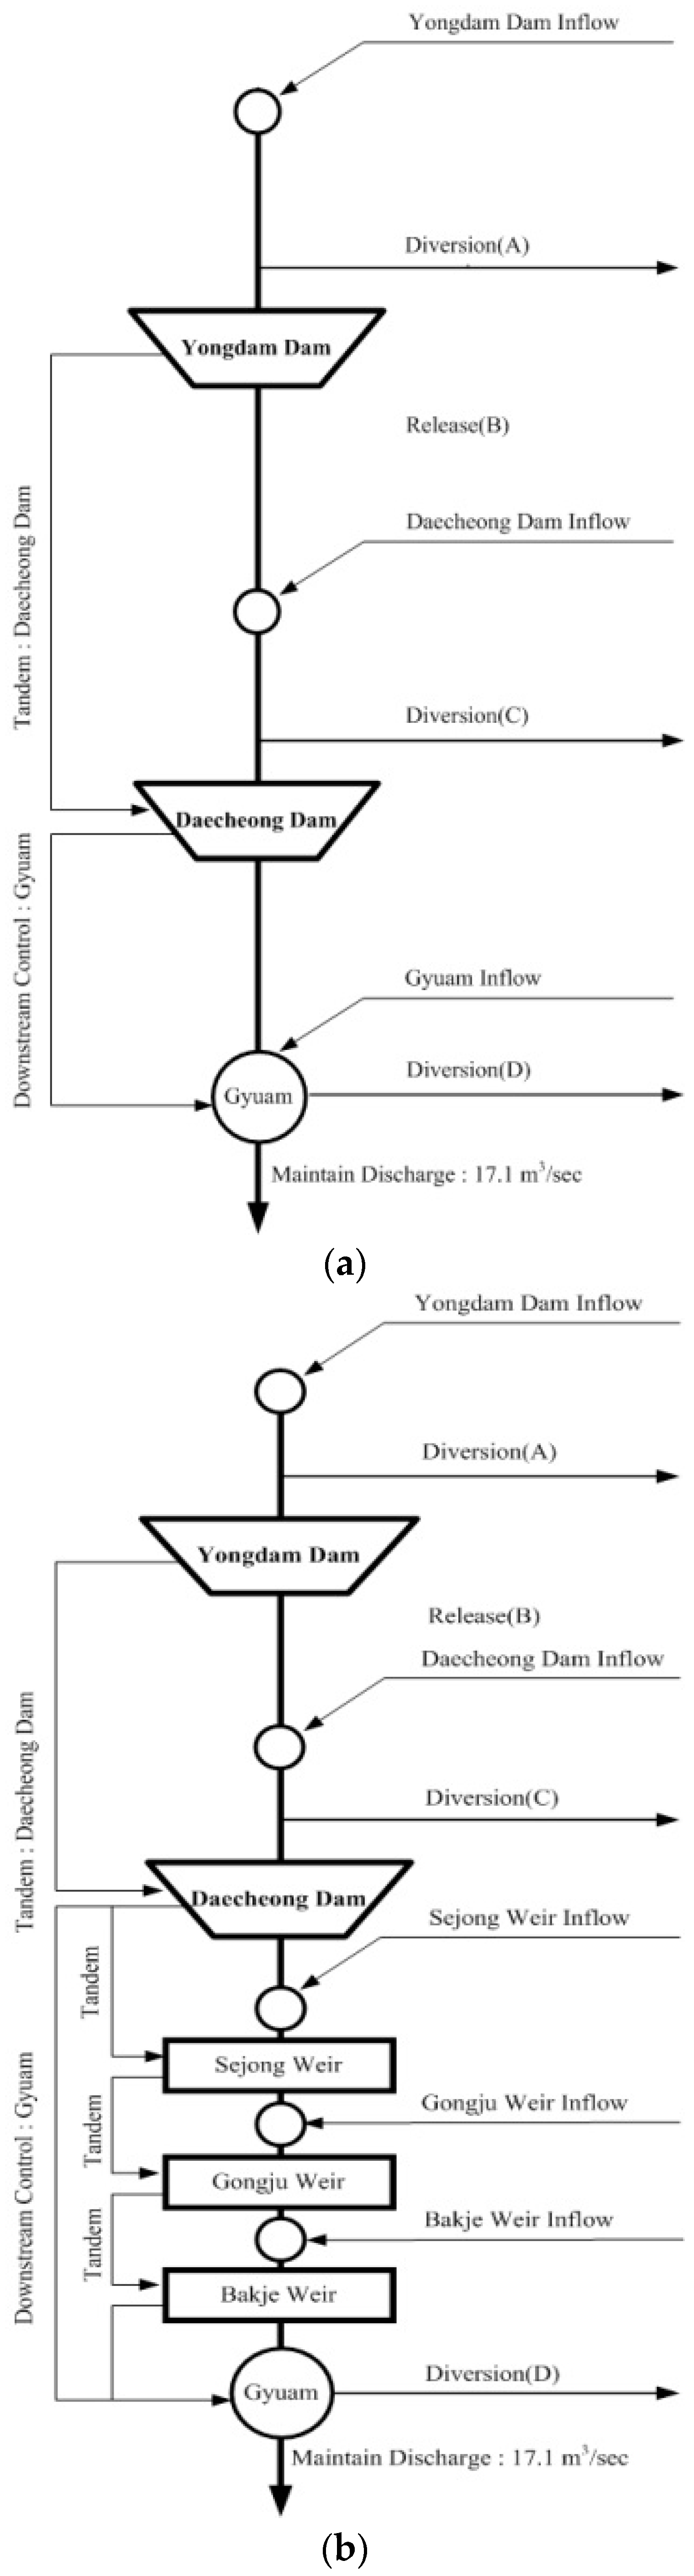
The dam-weir operation scenario created flux data for the Gyuam gauging station, which are divided into four cases: (Case 1) no dam-weir; (Case 2) independent operation of Yongdam and Daecheong Dams: (Case 3) coordinated operation of Yongdam and Daecheong Dams; and (Case 4) coordinated operation of Yongdam and Daecheong Dams and Sejong, Gongju and Baekje Weirs.
There are three operating rules that are important for the HEC-ResSim model: (a) the release function rule; (b) the tandem operating rule; and (c) the downstream control function rule. The release function rule is applied when discharges are carried out in accordance with planned discharge flow without considering their impact on downstream reservoirs. When hydraulic structures are interconnected in series, the tandem operating rule is applied to the upstream dam, and the hydrological structures subject to this rule satisfy the demand from downstream by managing the reservoir capacity based on the data from equivalent reservoirs. When hydraulic structures are interconnected in parallel, the downstream control function rule is applied to the downstream reservoirs to meet the downstream demand considering the effective storage capacity of the hydraulic structure.
In Case 1, natural streamflow was estimated because an irrigation facility was not included in the operating scenario. In the case of independent operation of the dams (Case 2), the dams were simply interconnected using the release function rule. In Case 3, under coordinated operating conditions, the dams, the multifunctional weirs, and the Gyuam gauging station were interconnected, as shown in Figure 6a. Coordinated operation between the dams and multifunctional weirs (Case 4) interconnected the dams, multifunctional weirs and the Gyuam gauging station as shown in Figure 6b. For the coordinated operation of the Yongdam, Daecheong Dams and the Sejong, Gongju, and Baekje Weirs, maintaining a flux of 17.1 m3·s−1 at the Gyuam gauging station was satisfied, and the additional discharge, considering inflow at Gyuam, was calculated. To assess the water supply capacity for each case, the minimum planned number of dams and the maintenance flows at major points in the river system must be satisfied, the amount of water needed for irrigation and maintaining a minimum water level behind the dams is fixed, and the amount of residential/industrial water is adjusted.
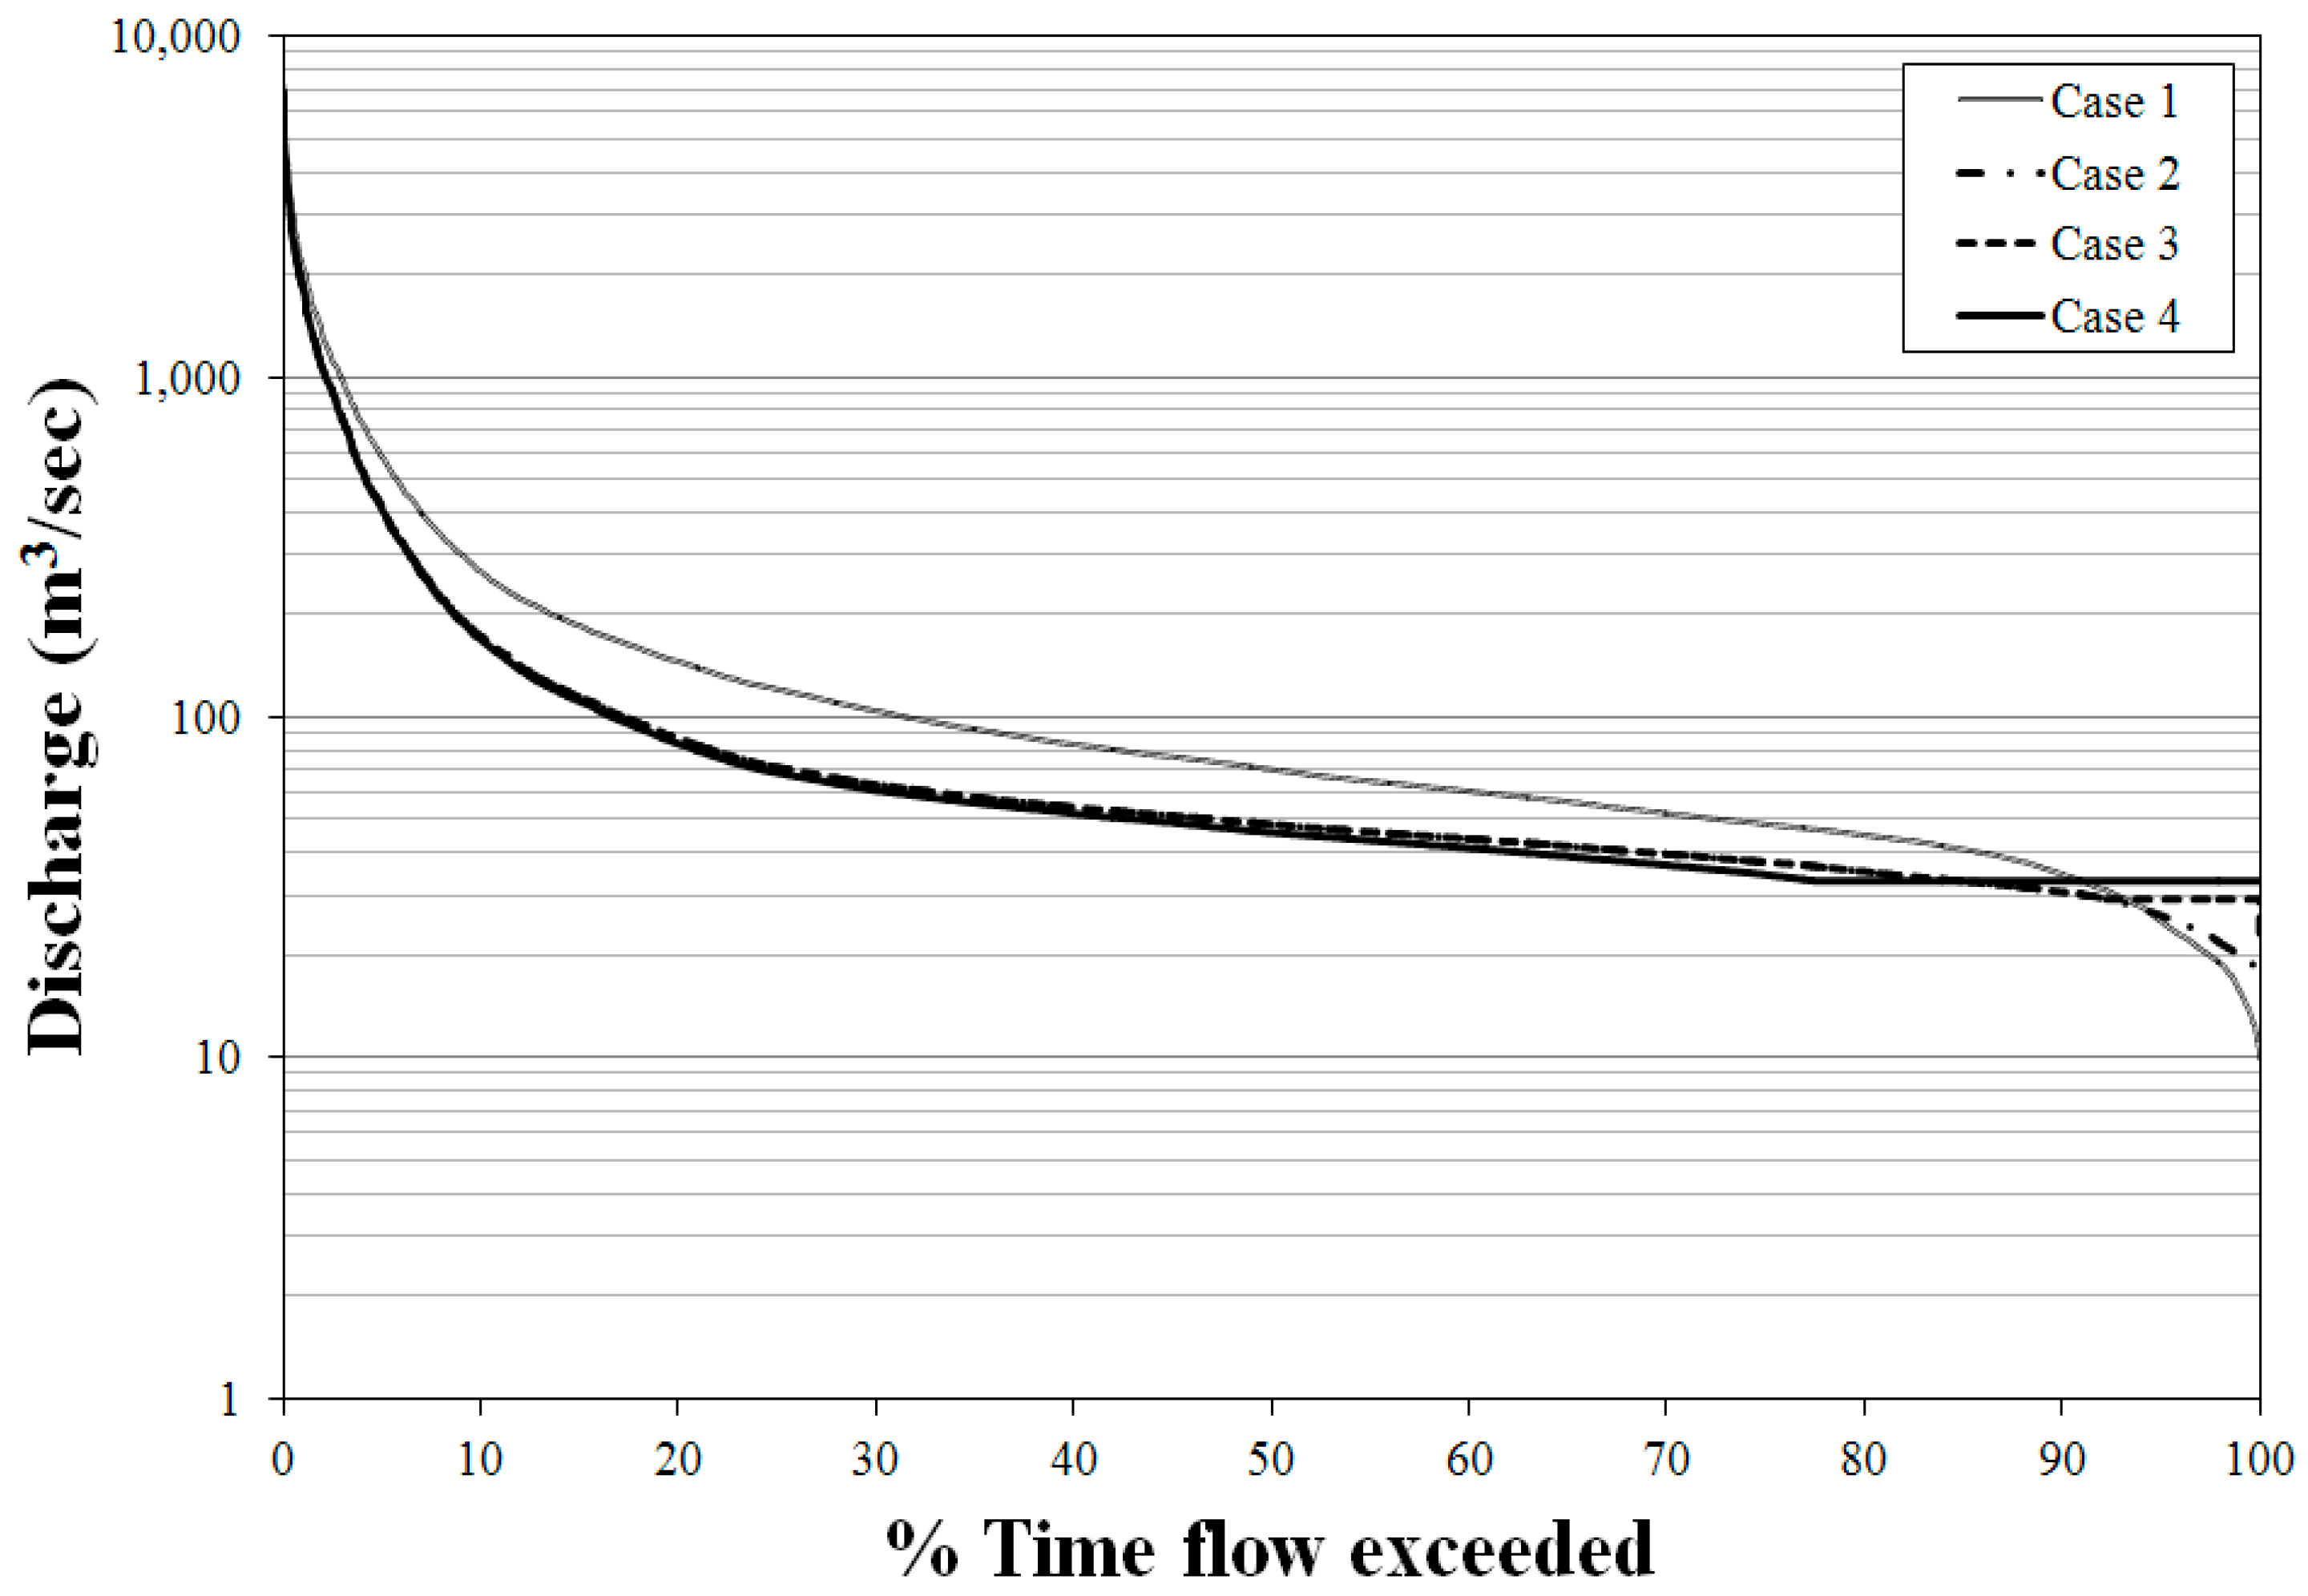
The results for Diversion (A), Release (B) and Diversion (C) for Cases 2–4 are 9.9 m3·s−1, 5.0 m3·s−1, and 29.4 m3·s−1, respectively. Flow rate is often referred to as “Q,” and the exceedance value as a subscript number, such that Q95 means that the flow rate is equaled or exceeded for 95% of the time. The results of the flow duration curve (FDC) at the Gyuam gauging station at a drought water level of Q95 are as follows (Figure 7): Case 1—12.2 m3·s−1, Case 2—16.2 m3·s−1, Case 3—30.6 m3·s−1, and Case 4—35.1 m3·s−1. Compared with the flux of 16.2 m3·s−1 measured under independent dam operating conditions (Case 2), an additional flux of 14.4 m3·s−1 is supplied by the connected operation of the dams (Case 3), and an additional flux of 18.9 m3·s−1 is supplied by the connected operation of the dams and weirs (Case 4). In order to supply water resources effectively, each operating rule applied in the study through coordinated operation of the dams and weirs. Achieving greater efficiency in water control is possible during the dry season when constant flux at the Gyuam gauging station is maintained by the coordinated operation of the dams and weirs, as shown in Figure 7.
The method simply uses the retained water level of the dam and the reservoir for the calculation of the impounded runoff index (calculated as reservoir capacity divided by mean annual runoff of the river), as suggested by Batalla et al. [41]. The impounded runoff index explains variations in flow regime characteristic factors for the dams in this study. The cumulative maximum effective reservoir capacity in the corresponding period is divided by the average annual runoff in the Geum River Basin to evaluate the variation in retention volume during each season.
Irrigation facilities constructed in the Geum River Basin were investigated, as shown in Table 5. The annual average runoff was calculated using inflows from 1967 to 2006 (long-term water resources master plan, 2006–2020) considering an annual water consumption of 5771.8 million m3. Although the water supply capacity increased according to the improved impounded runoff index since the Daecheong Dam was constructed in 1981, Lee et al. [42] described the calculated results of the flow regime coefficient for the Geum River Basin as follows: “Since the impounded runoff capacity of Daecheong Dam is relatively small, it has not largely contributed to the improvement of flow regime during floods and this implies the necessity of new supplementary dam construction at the main stream of Geum River Basin”. The flow regime coefficient is the ratio of the minimum flow rate to the maximum flow rate measured at any point in the stream during one year as shown in Equation (9). If is close to 1, the flow regime is a good river. The larger the value of , the greater the fluctuation of the flow rate.
Based on this analysis, the impounded runoff index was increased to 0.292 after the Yongdam Dam was constructed in 2001. If the additional retention volume of the multifunctional weirs is used, the impounded runoff index can be increased to 0.297, and a potential water supply of 1/3.37 (or 29.7%) of the runoff in the Geum River Basin is retained.
3.3. Drought Index
Droughts represent long-term natural disasters, whereas floods represent short-term natural disasters, whose start and end dates cannot be predicted. To appropriately define a drought, Dracup et al. [43] expressed the need for a distinct classification of factors related to droughts. Palmer [44] defined a drought as an irregular long-term water shortage, whereas Wilhite and Glantz [45] defined it by classifying the meteorological, hydrologic, agricultural, social and economic aspects of droughts based on numerous studies. Jeong [46] suggested that although various definitions of drought are based on multiple viewpoints from different fields, such as meteorology, agriculture, water resources, sociology and economics, a drought can generally be defined as a water shortage caused by the lack of rainfall over an extended period of time.
The general method for quantitatively evaluating a drought involves calculation of drought indices. Although numerous methods for evaluating drought severity based on indices exist, these indices are typically expressed as factors contributing to drought. The drought indices generally used in domestic and global studies are the Standardized Precipitation Index (SPI) and the PDSI. The SPI, which was developed by the National Drought Mitigation Center (NDMC) in the USA, calculates not only various drought indices for various time periods based on the probability of precipitation for a certain period of time, but also predicts droughts and estimates the drought severity. The PDSI, which was developed by Palmer [44], has been widely used to determine when to grant emergency drought assistance by the USA Department of Agriculture (USDA). The PDSI, which is based on climate, considers the variation in temperature and precipitation that affects droughts and is highly reliable in areas where the topography is uniform and flat. Dai [47] provided a detailed description of the PDSI and studied various drought characteristics and trends using the PDSI.
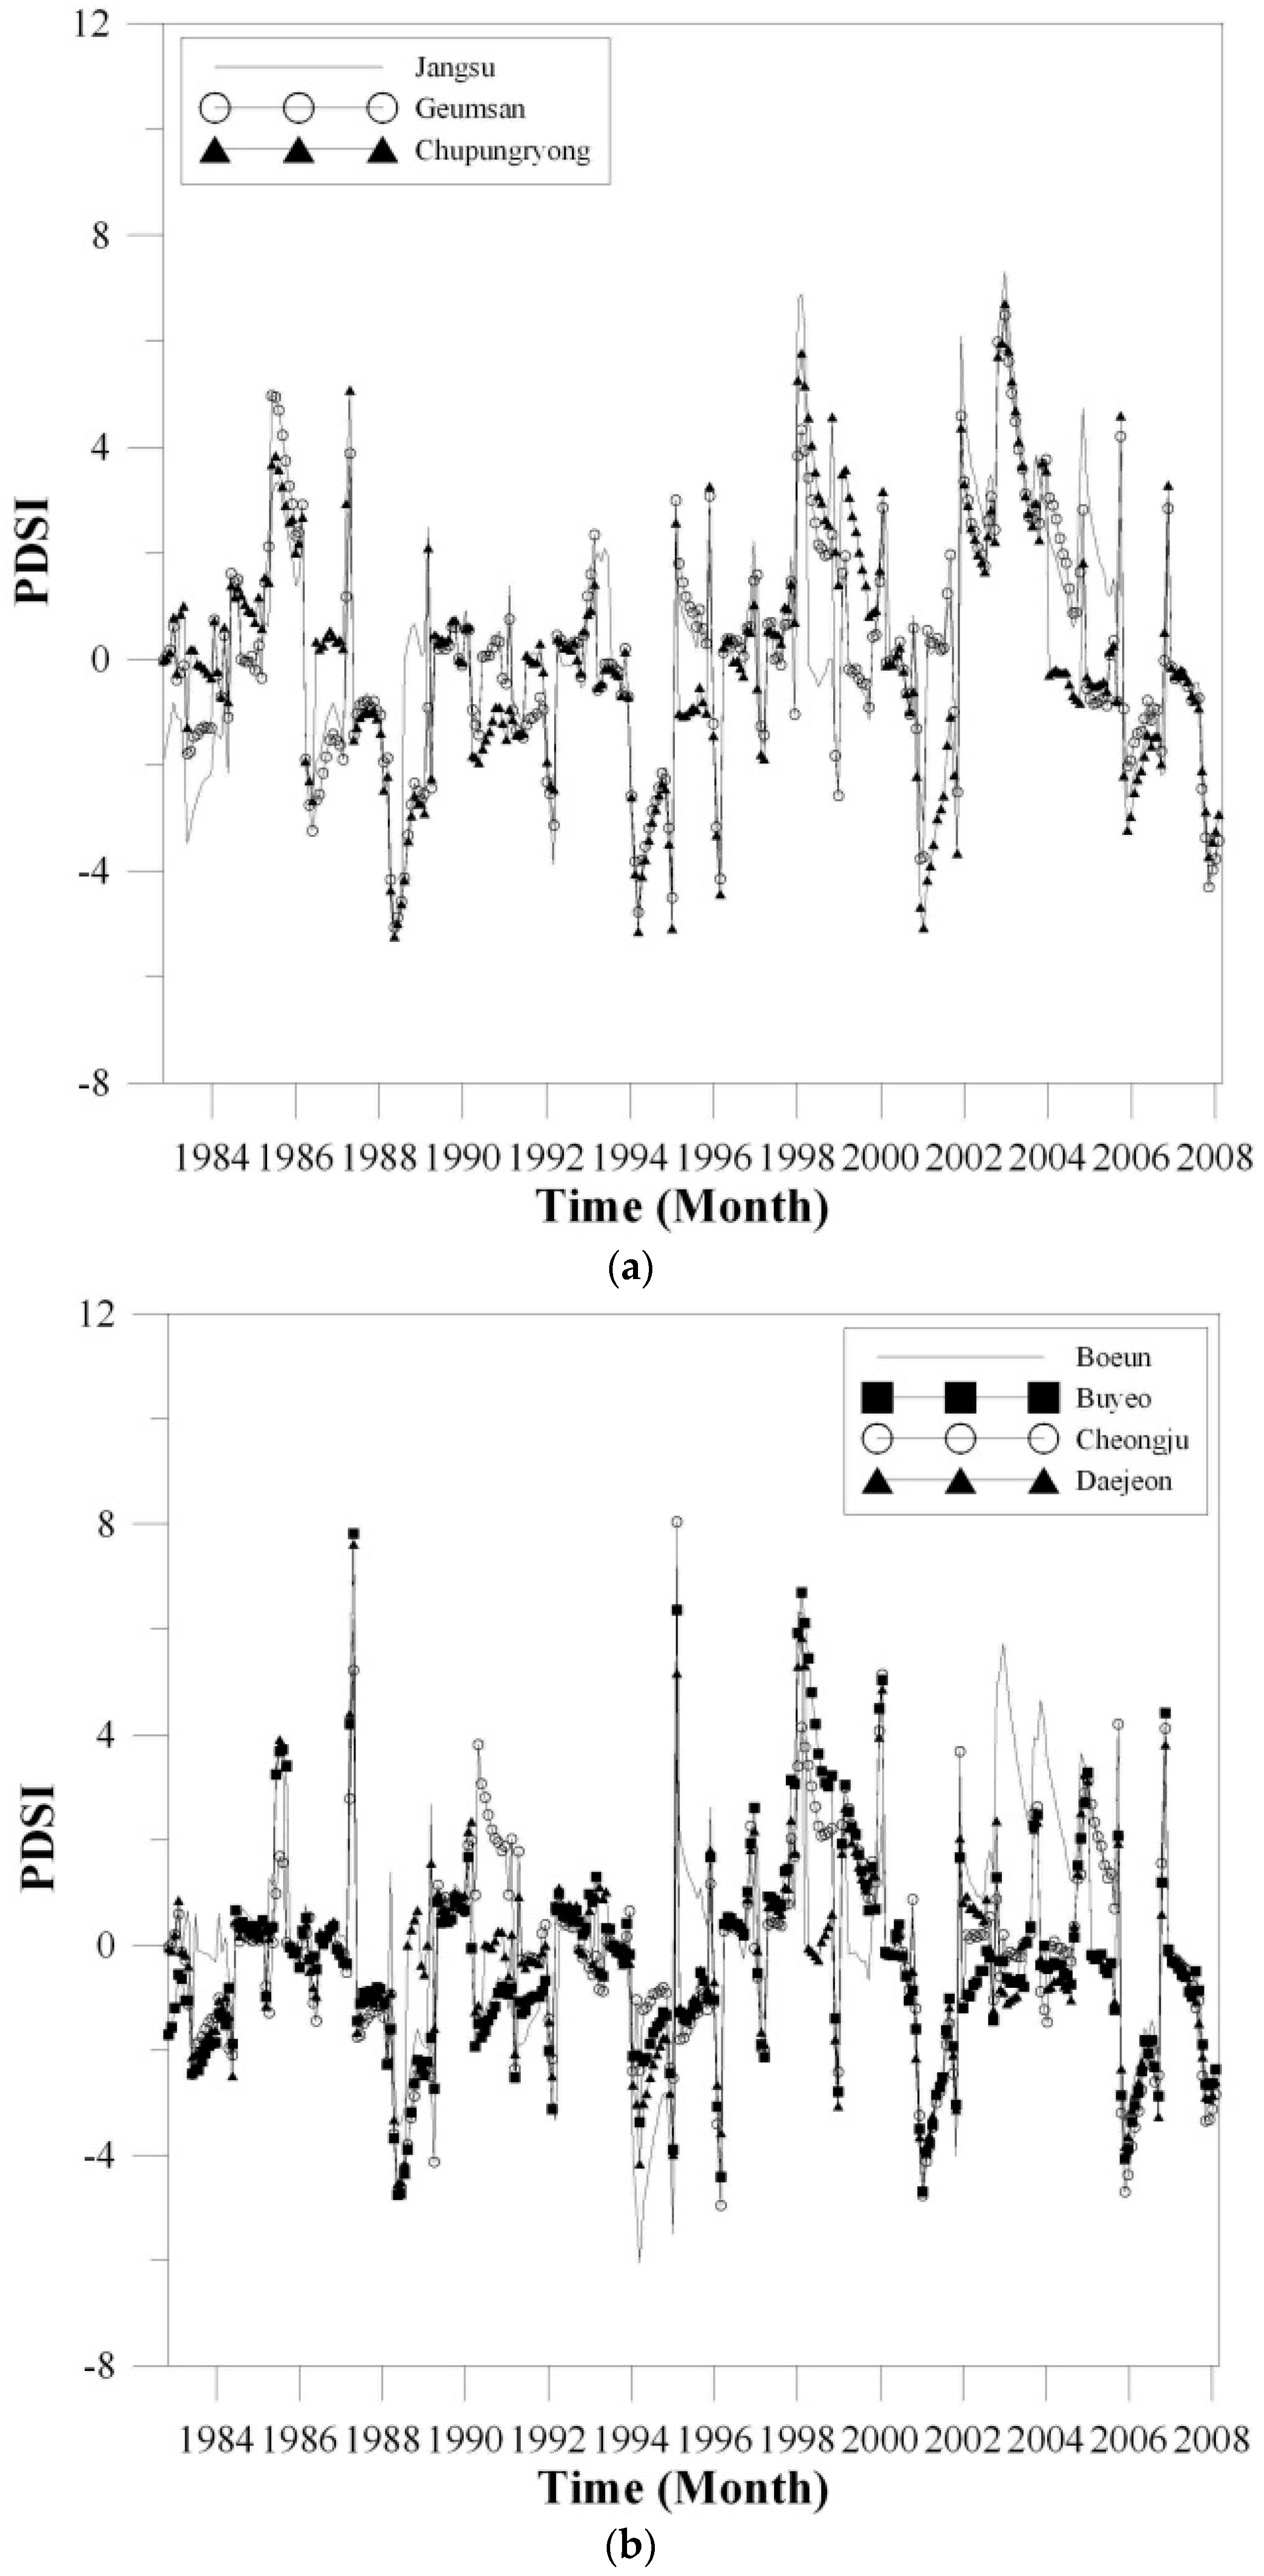
Palmer defined the range of wet and dry conditions according to the drought index, as shown in Table 6. In this study, monthly drought severity and drought indices were calculated using the Palmer method, based on precipitation and temperature data from seven weather observation stations located along the Geum River Basin for the period from 1983 to 2008, as shown in Figure 1a. Floodgate data were obtained from each weather observation station. The drought analysis was performed using existing data from the National Weather Service. Drought events were reported in Korea in 1973, 1977, 1982, 1988, 1994, 1995, 2001, 2008, 2012 and 2013 [48,49,50]. The calculated results of the PDSI for each weather observation station are shown in Figure 8. Although the PDSI exhibits differences amongst the drought years, the results indicate the overall tendency and severity of the droughts are similar. Because the duration of the existing drought coincides with the study period, and the severity and frequency of droughts in the Geum River Basin does not show significant differences, the 2008 drought was selected as the drought period for this study.
3.4. Water Quality Analysis
Because annual water use is highly dependent on river water intake, and many industrial and sewage treatment facilities are installed and operated on riverfronts in Korea, quality control of the river water downstream of the dam is critical. Optimal flow releases, through the turbines of one or more dams, are typically defined as maximizing energy production or value, while meeting water demands (e.g., [51]). Securing the availability of a sufficient quantity of water through reservoir operation is crucial for ensuring the water quality at major facilities, such as intake stations, because an appropriate level of water quality can be maintained through discharge when the water quality of the river deteriorates under drought conditions. The evaluation of changes in water quality in the watershed due to the multifunctional weirs constructed as part of the Four Major Rivers Restoration Project, and a successful promotion of the total maximum daily load (TMDL) management system, are necessary for an integrated water resource management that considers quantity and quality of the water.
Dam discharge directly influences water quality such as turbidity and nutrient concentrations, although these effects are unusual and are unlikely to occur in most channeled rivers. In this study, the Qual2E model [52], which integrates water quantity, water quality and reservoir group operation, was used for water quality analysis in the target area. A flowchart of the construction of the Qual2E model, which considers both the main stream and tributaries, is shown in Figure 9. Figure 9 shows the structure of the Qual2E model developed in the Geum River Basin. In this study, the Qual2E model is divided into four sections: (1) Daecheong Dam and Sejong Weir; (2) Sejong Weir and Gongju Weir; (3) Gongju Weir and Baekje Weir; and (4) Baekje Weir and Estuary Weir. The section between Daecheong Dam and Sejong Weir is constructed with four reaches and 26 elements. The tributary Gapcheon joins at element No. 5 and Mihocheon joins at element No. 21. The section between Sejong Weir and Gongju Weir is constructed with four reaches and 19 elements. As tributaries, Daegyocheon joins at element No. 4 and Jeongancheon joins at element No. 18. The section between Gongju Weir and Baekje Weir is constructed with three reaches and 24 elements. The tributary Yugucheon joins at element No. 4. The section between Baekje Weir and the Estuary Dam is constructed with eight reaches and 63 elements. As tributaries, Jicheon joins at element No. 2, Guemcheon joins at element No. 10, Seokseongcheon joins at element No. 21, Nonsancheon joins at element No. 25, and Gilsancheon joins at element No. 61. The upstream boundary condition for the Qual2E model was established using the runoff at the Daecheong Dam and Sejong, Gongju, and Baekje Weirs calculated by HEC-ResSim for the drought event of 2008. The basin runoff calculated in SSARR was applied to the Qual2E model as a lateral boundary condition. For the water quality at the Daecheong Dam, and Gapcheon, Mihocheon, Daegyocheon, Jeongancheon, Yugucheon, Jicheon, Guemcheon, Seokseongcheon, Nonsancheon and Gilsancheon tributaries, the monthly average water quality values observed from 2007 to 2012 were applied. For the water quality at Sejong, Gongju, and Baekje Weirs, the monthly average water quality values observed in 2010 and 2011 at Yeongi, Gomnaru, and Jeongdong, which are located upstream from the respective weirs after the Four River Restoration Project, were applied. Water quality parameters such as water temperature, Biochemical Oxygen Demand (BOD), Chemical Oxygen Demand (COD), tidal current, nitrogen, phosphorous, and Dissolved Oxygen (DO) were considered. The parameters used by Ahn et al. [32] were used for model correction, as shown in Figure 10, which shows the calibration results of the Qual2E for three water quality parameters, including BOD, Total Nitrogen (TN) and Total Phosphorus (TP), and which provide comparative analysis of the observed and simulated values. Figure 10a–c shows the calibration results of the model by distance from the Daecheong Dam for April 2006, as well as the spatial variation.
The discharge flux of the dams and weirs were calculated by an optimization operation in the previously established HEC-ResSim model, as suggested in Table 7. The inflow flux of the tributary was calculated by converting the value obtained from the 2008 drought event in the previously established SSARR model to a branch stream to basin area ratio, as suggested in Table 8. The BOD in the Geum River Basin shows a rapidly increasing trend in April and May when the temperature increases [53]. The decline in water quality during those months can be attributed to insufficient flux in the stream, because large amounts of water are used for agricultural purposes during the farming season when the effects of nonpoint source pollution by precipitation and increased temperature are dominant. Accordingly, this study performed water quality analysis for each facility in April and May 2008, which corresponds to the occurrence of drought, as shown in the calculated results of the drought index.
4. Results and Discussion
Considering water use over a 25-year period from 1984 to 2008, runoff was calculated by applying the impounded runoff model to the Geum River Basin. By applying the calculated discharge to the reservoir group operating models, which were established before and after the construction of the multifunctional weirs, discharge scenarios based on the irrigation facility operation rule were divided into four cases. The PDSI was calculated using floodgate data for 1983 to 2008 at seven weather observation stations located in the Geum River Basin, while 2008 was selected as the year of the drought event.
River water quality downstream of the dam was reviewed using runoff and branch stream inflow, which were calculated by the impounded runoff model and the reservoir operation model for integrated water management. The analysis results, based on water quality data observed at Gongju station in 2008, are shown in Figure 11 and Figure 12, and reveal that the water quality improved from January to March, but deteriorated significantly from April to May, at the commencement of the farming season. Therefore, our analyses focused on the spring drought that occurred in April and May 2008.
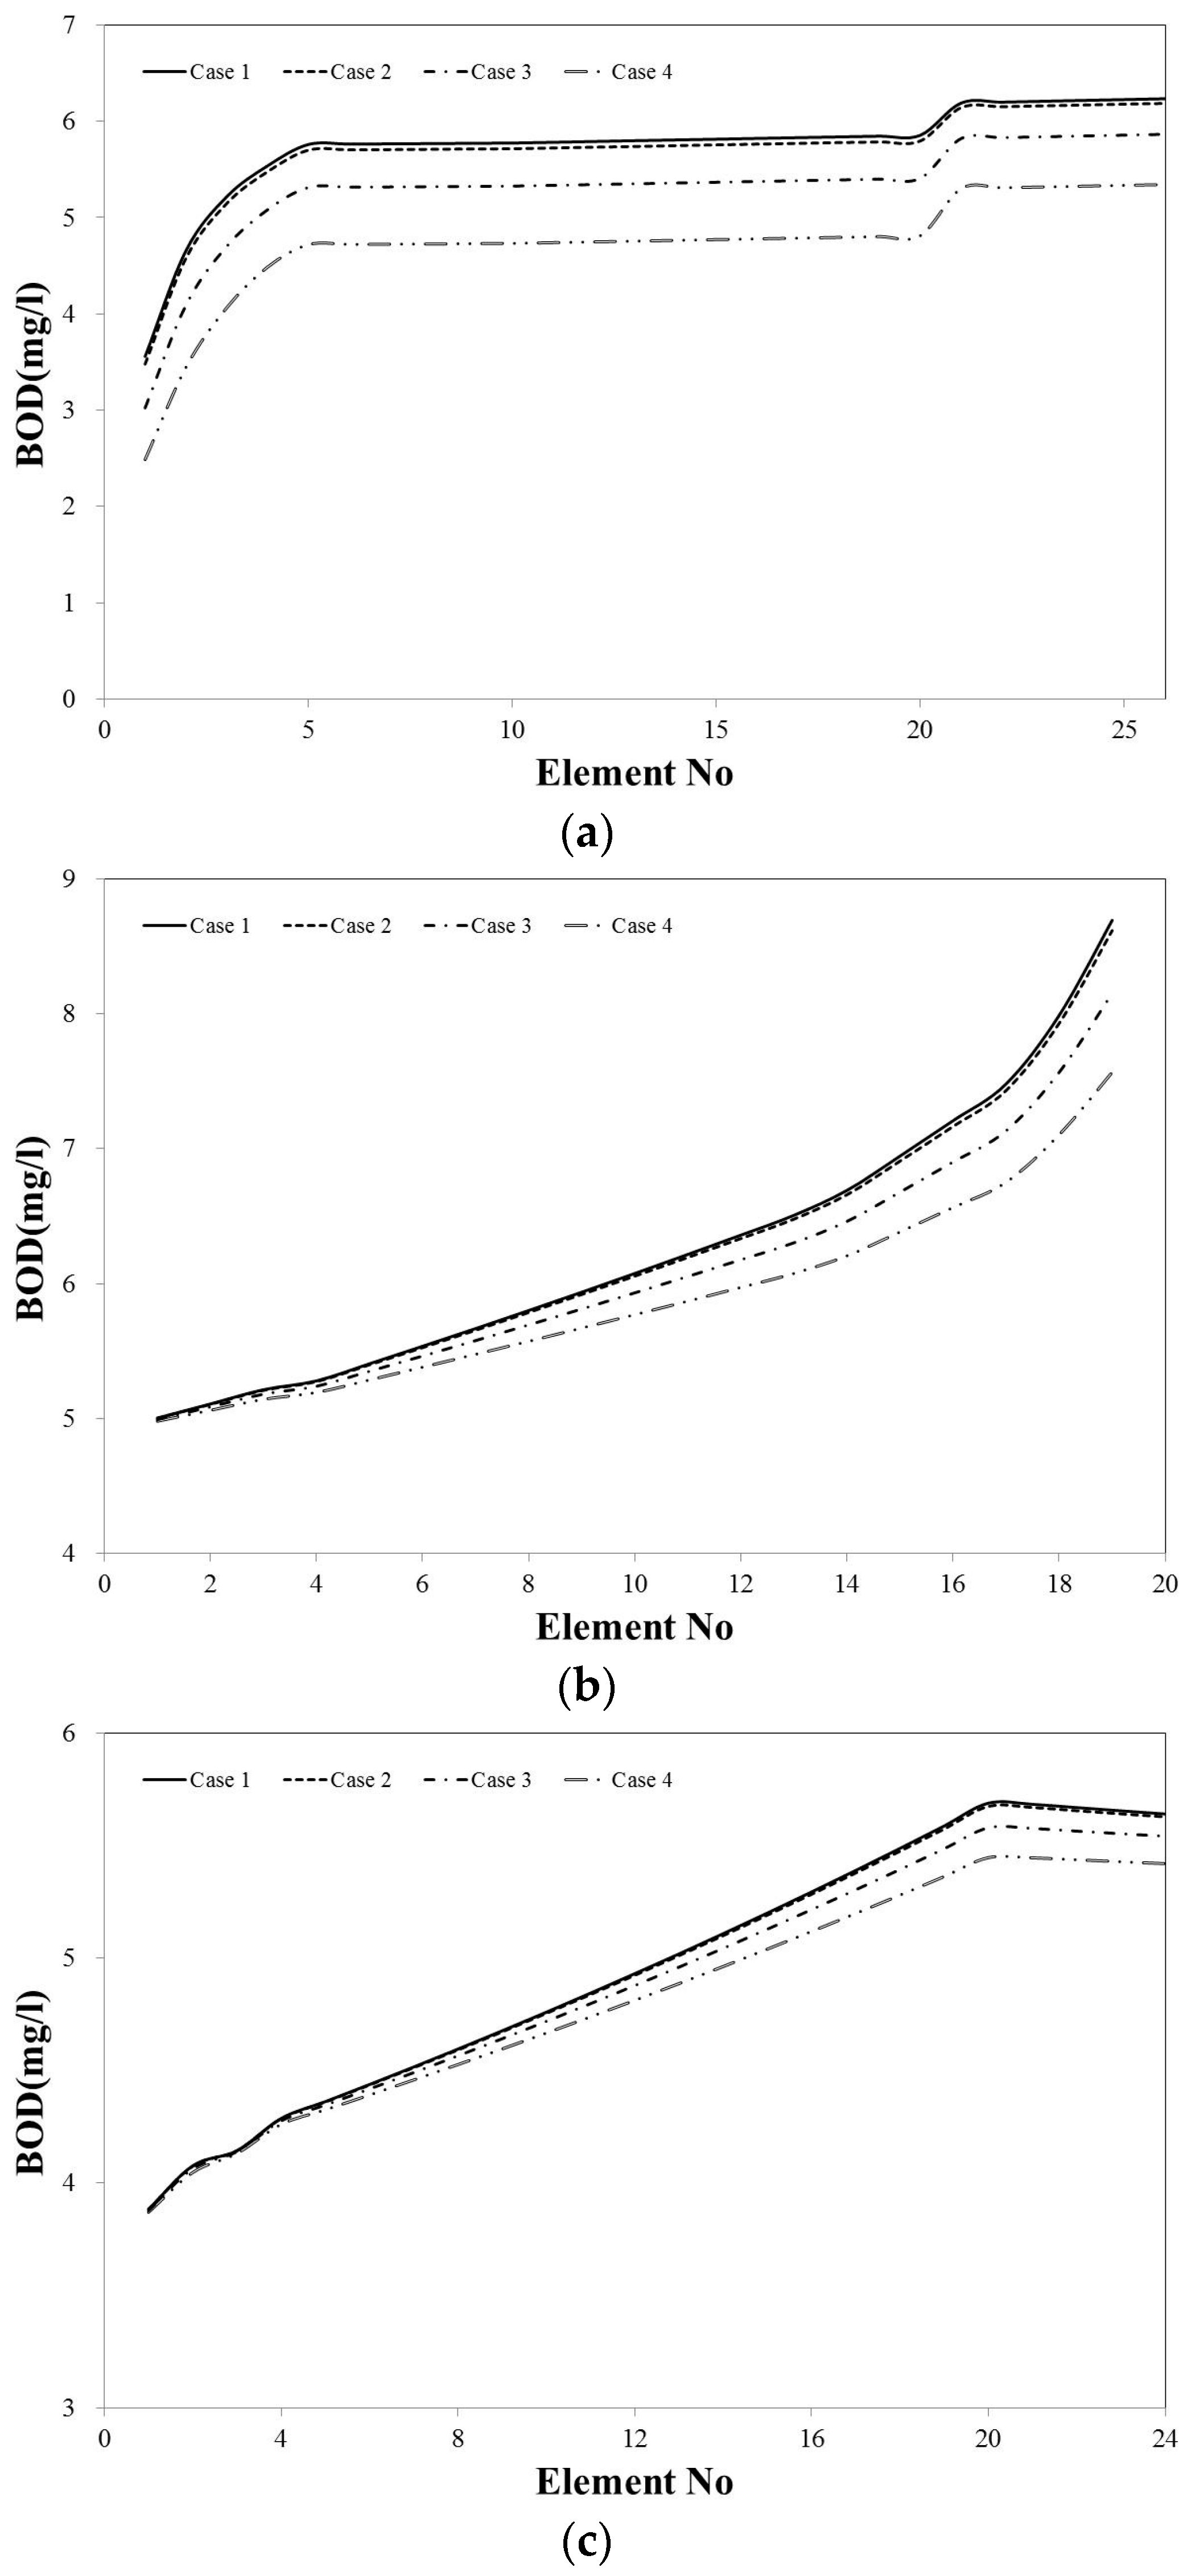
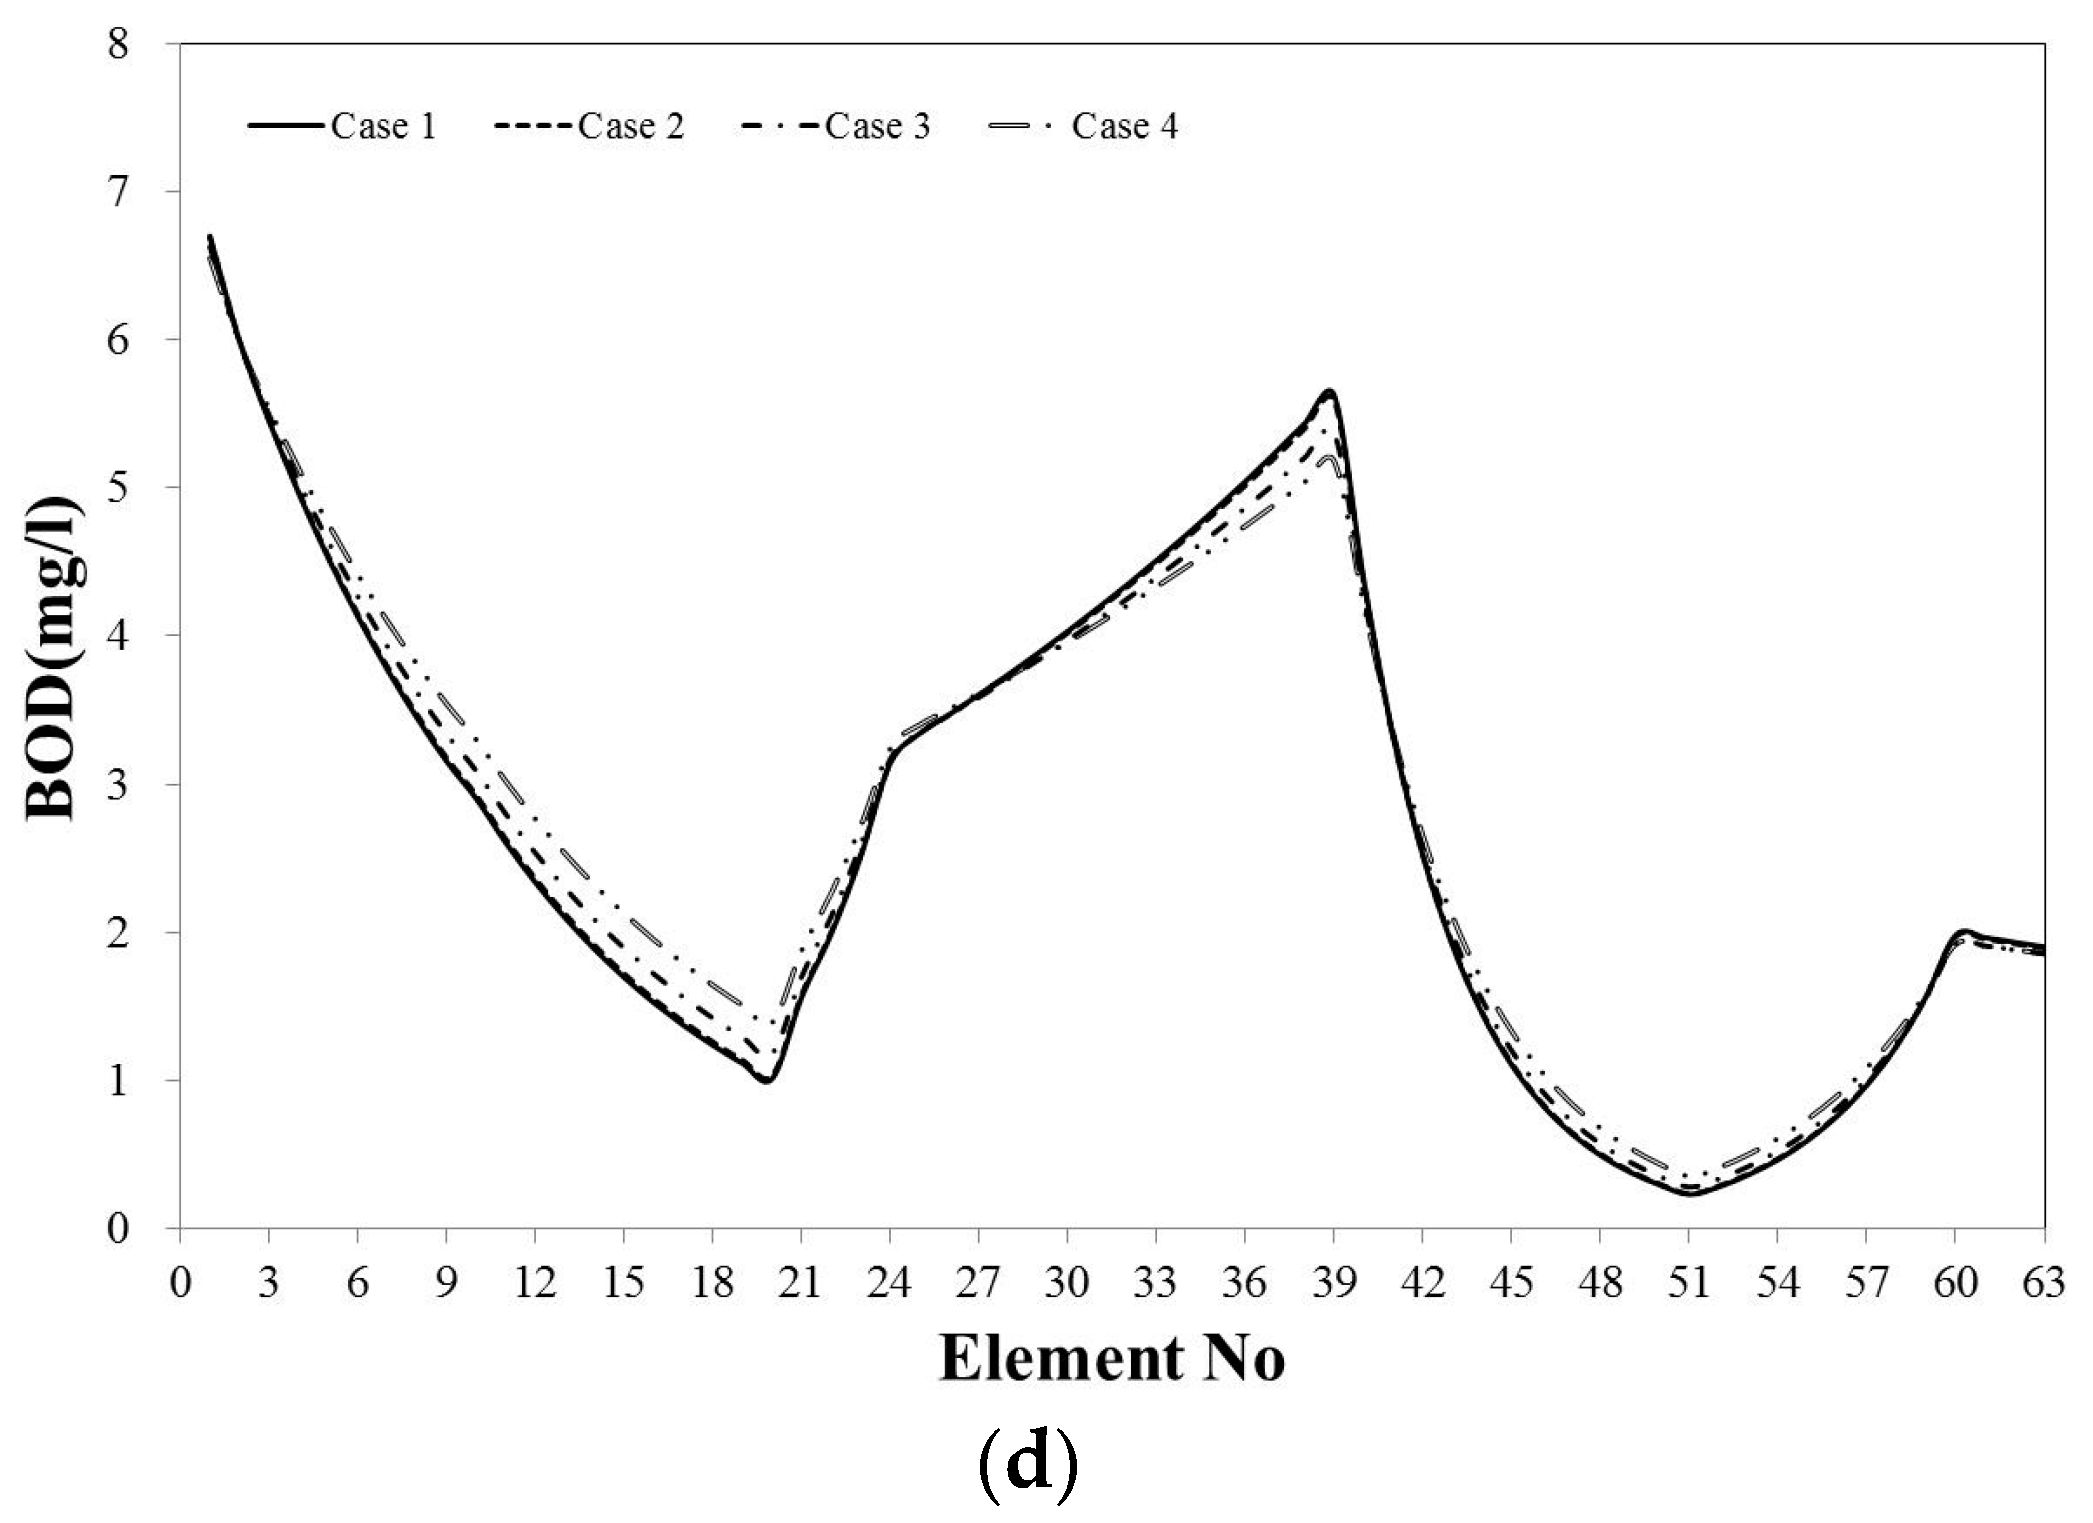
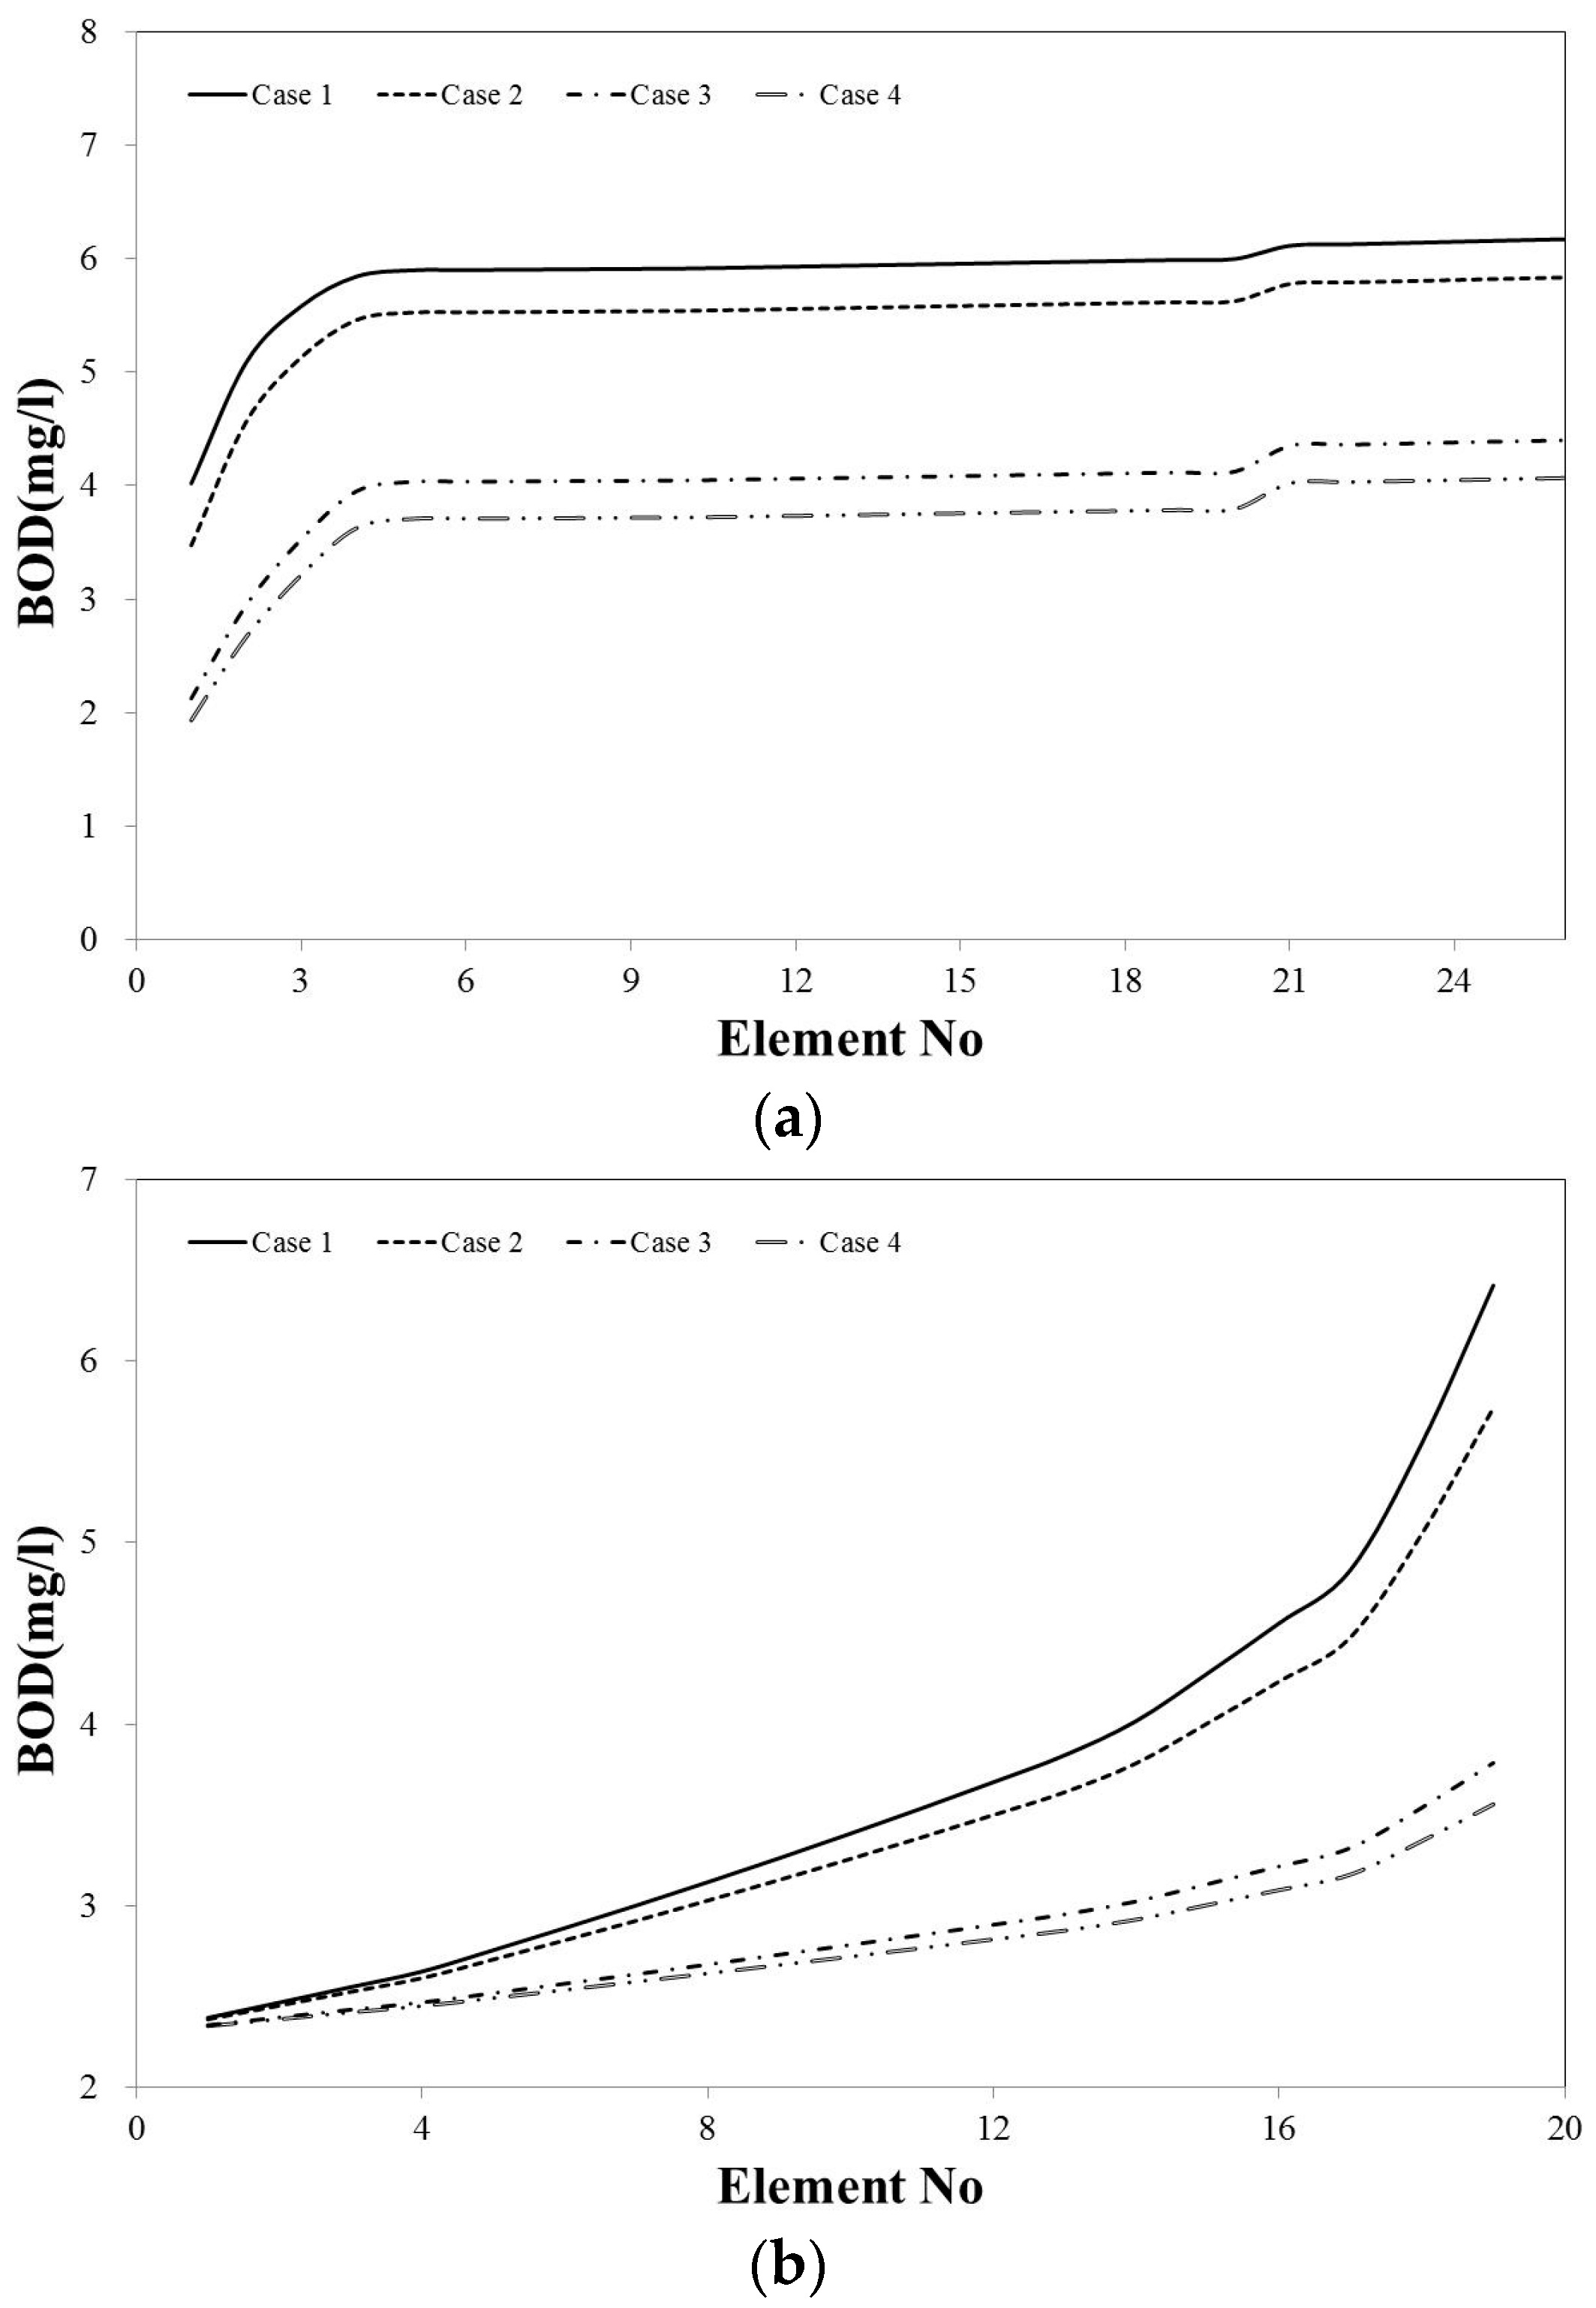
Water quality simulation was performed for April and May of 2008. The analysis results for each case show an improvement in the calculated BOD as a result of the coordinated operation of dams, multifunctional weirs, and irrigation facilities. The integrated operations in the sections between Daecheong Dam and Sejong Weir, Sejong Weir and Gongju Weir, and Gongju Weir and Baekje Weir show significant reductions in BOD, as shown in Table 9. Compared to Case 1, the BOD measured in April 2008 is reduced by 0.08 mg·L−1 (Case 2), 0.57 mg·L−1 (Case 3), and 1.21 mg·L−1 (Case 4) in the section between Daecheong Dam and Sejong Weir. In the case of the Sejong Weir–Gongju Weir section, BOD is lowered by 0.06 mg·L−1 (Case 2), 0.42 mg·L−1 (Case 3), and 0.88 mg·L−1 (Case 4). In the Gongju Weir and Baekje Weir section, BOD is decreased by 0.01 mg·L−1 (Case 2), 0.11 mg·L−1 (Case 3), and 0.24 mg·L−1 (Case 4). In the section between the Baekje Weir and Estuary Dam, no substantial difference is observed, and the BOD increases compared to Case 1 by 0.03 mg·L−1 (Case 2), 0.20 mg·L−1 (Case 3), and 0.43 mg·L−1 (Case 4). These results indicate that water was discharged without water quality improvement, because poor water quality observed at the Jeongdong water quality monitoring station is also observed in other sections. Kim and Yoo [54] demonstrated that BOD decreases by 1% when runoff increases by 50%. The effect of dam discharge on water quality can be demonstrated through a time-series model. Zhang et al. [55] showed that water resources increased by 134%, and the equivalent standard pollution index decreased by 38% at a downstream site of the Sha River Reservoir, and by 4% upstream of the Lutong floodgate. Increasing water discharge from dams before periods of flooding enhances river flow and is useful for preventing the accumulation of pollutants, which decrease the water quality. The dilution effects are represented by runoff, because upstream dams generally exhibit better water quality than downstream dams in a water system. Because the multifunctional weirs are located downstream in the water system, tributary pollution and inflow of nonpoint source pollution result in relatively poor water quality. Thus, water quality improvement downstream from the estuary dam was achieved when appropriate water quality standards were met at Baekje Weir.
Similar results were obtained for May 2008. Compared to Case 1, BOD in the section between Daecheong Dam and Sejong Weir was reduced by 0.54 mg·L−1 (Case 2), 2.14 mg·L−1 (Case 3), and 2.42 mg·L−1 (Case 4). In the case of the Sejong Weir–Gongju Weir section, compared to Case 1, BOD was reduced by 0.67 mg·L−1 (Case 2), 2.63 mg·L−1 (Case 3), and 2.86 mg·L−1 (Case 4). The BOD in the section between Gongju Weir and Baekje Weir was reduced by 0.34 mg·L−1 (Case 2), 1.66 mg·L−1 (Case 3), and 1.88 mg·L−1 (Case 4). However, the water quality in the section between Baekje Weir and the Estuary Dam deteriorated, because more water of poor quality was discharged from the point at which the tributary joins the Seokseongcheon at Baekje Weir, which is similar to the event in April 2008.
Because this study employed the Qual2E model, which is a steady state water quality model, and did not consider self-purification caused by water retention in the multifunctional weir, flux variation occurred in the upstream area and temporal and spatial variations in both flux and water quality occurred within the river. As a result, future analysis using a dynamic river water quality model is required. Based on an analysis of water supply and distribution scenarios in the basin, and the vulnerability of the area to water pollution, the setting of operational targets for the dam and multifunctional weirs is required, considering the issues of water quality and ecology.
Importantly, to anticipate new environmental problems, such as climate change, and to successfully promote a total water pollution loading system, a science-based water management system must be implemented for the rapidly changing river impacted by the Four Rivers Restoration Project. To this end, supported by the Ministry of Environment, multilateral evaluations of the ecological effect of multifunctional weirs, turbid water and tidal currents on a multifunctional weir are required.
5. Conclusions
It is anticipated that examination of data on the variation in water quality under different operational scenarios, while considering both discharge of the existing dams and multifunctional weirs under each scenario and tributary inflow, will be used as baseline data for the prudent operation of the river. The following conclusions can be made:
- (1)
- The results of the flow regime analysis at the Gyuam gauging station for a water level of Q95 during drought conditions are as follows: Case 1—12.2 m3·s−1, Case 2—16.2 m3·s−1, Case 3—30.6 m3·s−1 and Case 4—35.1 m3·s−1. Achieving greater efficiency in water control is possible during the dry season because, compared with the independent operation of dams, an additional flux of 14.4 m3·s−1 is achieved by the coordinated operation of the dams, and an additional flux of 18.9 m3·s−1 is achieved by the coordinated operation of the dams and weirs.
- (2)
- Monthly drought severity was calculated using the PDSI, based on precipitation and temperature data observed from 1983 to 2008 at seven weather observation stations located in the Geum River Basin. The results of the drought indices calculation indicate that droughts occurred in 1982, 1988, 1994, 1995, 2001 and 2008.
- (3)
- Based on the results of downstream water quality analyses, which were calculated for each operational scenario using discharge and tributary inflow calculated with the impounded runoff model and reservoir operation model, BOD improves in the sections between Daecheong Dam and Sejong Weir, Sejong Weir and Gongju Weir, and Gongju Weir and Baekje Weir. However, in the section between Baekje Weir and the Estuary Dam, downstream water quality improves only when suitable water quality at Baekje Weir is achieved. If the discharged water quality is not improved, there is no effect through the coordinated operation of the dams and weirs. Improving the water quality of the downstream and tributaries should be prioritized.
- (4)
- To implement a science-based water management system for the rapidly changing river impacted by the Four Rivers Restoration Project, to anticipate new environmental problems such as climate change, and to successfully promote a total water pollution loading system, multilateral evaluations of the ecological effects of multifunctional weirs, turbid water and tidal currents in a multifunctional weir are required.
Author Contributions
The manuscript was written by Jung Min Ahn, and he was mainly responsible for the initial research proposal, fieldwork, consultations, survey and numerical design and policy analysis, but all authors contributed to its preparation and review. Kang Young Jung was mainly responsible for designing and implementing the web based survey and hydrologic modeling portions of the manuscript. Dongseok Shin revised the language and edited the first draft and did the final overall proofreading of the manuscript.
Conflicts of Interest
The authors declare no conflict of interest.
References
- Lee, J.H.; Lee, G.J. National drought management information system development. Water and Future. Water Resour. Assoc. 2006, 39, 29–36. (In Korean) [Google Scholar]
- Shim, M.P.; Yoon, Y.N. Comprehensive measures for overcoming drought. In Proceedings of the 2002 Drought Symposium, Ministry of Construction & Transportation, Seoul, Korea, 4 May 2002. [Google Scholar]
- Koh, I.H.; Chung, S.W. Technical building measures based on integrated water resources management (I). J. Korean Water Resour. Assoc. 2002, 35, 61–70. (In Korean) [Google Scholar]
- Intergovernmental Panel on Climate Change. Climate Change 2007: The Physical Science Basis; Contribution of Working Group I to the Fourth Assessment Report of the International Panel on Climate Change; Cambridge University Press: Cambridge, UK; New York, NY, USA, 2007. [Google Scholar]
- United States Army Corps of Engineers. Climate Change and Reservoir Rule Curves. In Western States Watershed Study; U.S. Army Corps of Engineers (USACE): Washington, DC, USA, 2009. [Google Scholar]
- Minville, M.; Brissette, F.; Leconte, R. Impacts and uncertainty of climate change on water resource management of the Peribonka River System (CANADA). J. Water Resour. Plan. Manag.-ASCE 2010, 136, 376–385. [Google Scholar] [CrossRef]
- Klipsch, J.D.; Hurst, M.B. HEC-ResSim, Reservoir System Simulation User’s Manual. Version 3.0; Davis, C.A., Ed.; U.S. Army Corps of Engineers, Institute for Water Resources, Hydrologic Engineering Center: Davis, CA, USA, 2007. [Google Scholar]
- Fang, H.; Cheong, Y.; Yan, S. Optimization on water resource system operation policy during drought. J. Water Resour. Prot. 2011, 3, 140–156. [Google Scholar] [CrossRef]
- Divakar, L.; Babel, M.S.; Perret, S.R.; Gupta, A.D. Optimal allocation of bulk water supplies to competing use sectors based on economic criterion—An application to the Chao Phraya River Basin, Thailand. J. Hydrol. 2011, 401, 22–35. [Google Scholar] [CrossRef]
- Lin, N.M.; Rutten, M. Optimal operation of a network of multi-purpose reservoir: A review. Prodecia Eng. 2016, 154, 1376–1384. [Google Scholar] [CrossRef]
- Li, Y.; Cui, Q.; Li, C.; Wang, X.; Cai, Y.; Cui, G.; Yang, Z. An improved multi-objective optimization model for supporting reservoir operation of China’s South-to-North water diversion project. Sci. Total Environ. 2017, 575, 970–981. [Google Scholar] [CrossRef] [PubMed]
- Shim, S.B.; Lee, H.S.; Koh, D.K.; Kim, M.S. Development of experience knowledge based expert system for joint operation of Chungju and Soyanggang multipurpose reservoir during drought. J. Korean Soc. Civ. Eng. 1997, 17, 347–357. (In Korean) [Google Scholar]
- Chung, S.W.; Ko, I.H.; Kim, Y.K. Effect of reservoir flushing on downstream river water quality. J. Environ. Manag. 2008, 86, 139–147. [Google Scholar] [CrossRef] [PubMed]
- Ahn, J.M.; Lee, S.J.; Kang, T. Evaluation of dams and weirs operating for water resource management of the Geum River. J. Sci. Total Environ. 2014, 478, 103–115. [Google Scholar] [CrossRef] [PubMed]
- Elshorbagy, A.; Ormsbee, L. Object-oriented modeling approach to surface water quality management. Environ. Model. Softw. 2006, 21, 689–698. [Google Scholar] [CrossRef]
- Hayes, D.F.; Labadie, J.W.; Sanders, T.G.; Brown, J.K. Enhancing water quality in hydropower system operation. Water Resour. Res. 1998, 34, 471–483. [Google Scholar] [CrossRef]
- The Long-Term Water Resources Plan; Ministry of Construction and Transportation: Sejong, Korea, 2006.
- Tanaka, N.; Osugi, T.; Nanami, Y.; Okano, M. Methods of environmental restoration for downstream of dams. In Proceedings of the ICOLD 72nd Annual Meeting, Environmental Considerations for Sustainable Dam Projects, Seoul, Korea, 16–22 May 2004; p. 45. [Google Scholar]
- Escudero, L.F. WARSYP: A robust modeling approach for water resources system planning under uncertainty. Ann. Oper. Res. 2000, 95, 313–339. [Google Scholar] [CrossRef]
- Bessler, F.T.; Savic, D.A.; Walters, G.A. Water reservoir control with data mining. J. Water Resour. Plan. Manag.-ASCE 2003, 129, 26–34. [Google Scholar] [CrossRef]
- Goor, Q.; Halleux, C.; Mohamed, Y.; Tilmant, A. Optimal operation of a multipurpose multireservoir system in the Eastern Nile River Basin. Hydrol. Earth Syst. Sci. 2010, 14, 1895–1908. [Google Scholar] [CrossRef]
- United States Army Corps of Engineers. SSARR Model: Streamflow Synthesis and Reservoir Regulation. User Manual; U.S. Army Corps of Engineers (USACE), North Pacific Division: Portland, OR, USA, 1991. [Google Scholar]
- Rockwood, D.M. Columbia basin streamflow routing by computer. Trans. Am. Soc. Civ. Eng. 1961, 126, 32–56. [Google Scholar]
- Rockwood, D.M. Application of Stream-Flow Synthesis and Reservoir Regulation—“SSARR”—Program to the Lower Mekong River; UNESCO: Paris, France, 1968; Volume 80, pp. 329–344. [Google Scholar]
- Ahn, S.J.; Lee, Y.S. Watershed runoff analysis by SSARR model. J. Korean Water Resour. Assoc. 1989, 22, 109–116. (In Korean) [Google Scholar]
- Ryoo, K.S.; Hwang, M.H.; Maeng, S.J.; Lee, S.J. Analysis of runoff characteristics in the Geum River basin using watershed management model. J. Korean Soc. Water Environ. 2007, 23, 527–534. (In Korean) [Google Scholar]
- Lee, S.J.; Noh, J.W.; Ahn, J.M.; Kim, J.C. Analysis of hydrologic geo-spatial information using runoff-management model. J. Korean Spat. Inf. Soc. 2009, 11, 97–104. (In Korean) [Google Scholar]
- Woo, D.H.; Lee, S.J.; Kim, J.C.; Ahn, J.M. Log-term runoff simulation considering water for agricultural use in Geum river basin. Korean J. Limnol. 2010, 43, 349–355. (In Korean) [Google Scholar]
- Ahn, J.M.; Hur, Y.T.; Hwang, M.H.; Cheon, G.H. Study of stochastic techniques for runoff forecasting accuracy in Gonju basin. J. Korean Soc. Civ. Eng. 2011, 31, 21–27. (In Korean) [Google Scholar]
- Ahn, J.M.; Lee, S.J.; Kim, J.K.; Kim, J.C.; Maeng, S.J.; Woo, D.H. Estimation of ESP probability considering weather outlook. J. Korean Soc. Water Environ. 2011, 27, 264–272. (In Korean) [Google Scholar]
- Kim, Y.S.; Won, Y.S. River flow management: The importance and role of water management is more important than ever. In Water Resources No. 2; Han River Flood Control Office: Seoul, Korea, 2009; pp. 17–21. [Google Scholar]
- Ahn, J.M.; Lee, S.J.; Kang, T. Development of water quality forecasting system with ensemble stream prediction method in the Geum River Basin, Korea. Desalin. Water Treat. 2015, 57, 670–683. [Google Scholar] [CrossRef]
- Nash, J.E.; Sutcliffe, J.V. River flow forecasting through conceptual models part I. A discussion of principles. J. Hydrol. 1970, 10, 282–290. [Google Scholar] [CrossRef]
- Christiansen, D.E. Simulation of daily streamflows at gaged and ungagged locations within the Cedar River Basin, Iowa, using a precipitation-runoff modeling system model. U.S. Geol. Surv. Sci. Investig. Rep. 2012, 2012–5213, 20. [Google Scholar]
- Ritter, A.; Munoz-Carpena, R. Performance evaluation of hydrological models: Statistical significance for reducing subjectivity in goodness-of-fit assessments. J. Hydrol. 2013, 480, 33–45. [Google Scholar] [CrossRef]
- Hamlet, A.F.; Lettenmaier, D.P. Effects of climate change on hydrology and water resources in the Columbia River basin. J. Am. Water Resour. Assoc. 1999, 35, 1597–1623. [Google Scholar] [CrossRef]
- Koh, I.H.; Kim, J.K.; Park, S.Y. Evaluation of eco-hydrological changes in the Geum river considering dam operations: I. flow regime change analysis. J. Korean Water Resour. Assoc. 2009, 42, 1–8. (In Korean) [Google Scholar]
- Dam Operation Handbook; Korea Water Resources Corporation: Daejeon, Korea, 2009.
- Survey on the Water Supply Capacity of Existing Dams; Korea Water Resources Corporation: Deajeon, Korea, 1998.
- Korea Institute of Construction Technology (KICT). Improvement of Evaluation Techniques of Water Supply Capacity for Multipurpose Dam; Korea Institute of Construction Technology: Goyang-si, Korea, 1994. [Google Scholar]
- Batalla, R.J.; Gomez, C.M.; Kondolf, G.M. Reservoir-induced hydrological changes in Ebro River basin (NE Spain). J. Hydrol. 2004, 290, 117–136. [Google Scholar] [CrossRef]
- Lee, J.W.; Kim, H.S.; Woo, H.S. An analysis of the effect of damming on flow duration characteristics of five major rivers in Korea. J. Korean Soc. Civ. Eng. 1993, 13, 79–91. (In Korean) [Google Scholar]
- Dracup, J.A.; Lee, K.S.; Paulson, E.G., Jr. On the definition of droughts. J. Clim. Appl. Meteorol. 1980, 23, 1100–1109. [Google Scholar] [CrossRef]
- Palmer, W.C. Meteorological Drought; Office of Climatology, U.S. Weather Bureau: Washington, DC, USA, 1965.
- Wilhite, D.A.; Glantz, M.H. Understanding the drought phenomenon: The role of definitions. Water Int. 1985, 10, 111–120. [Google Scholar] [CrossRef]
- Jeong, S.M. Drought disaster response system. J. Korean Soc. Hazard Mitig. 2011, 11, 4–6. (In Korean) [Google Scholar]
- Dai, A. Characteristics and trends in various forms of the Palmer Drought Severity Index (PDSI) during 1900–2008. J. Geophys. Res. 2011, 116, D12115. [Google Scholar] [CrossRef]
- Nationwide Drought Research Report; Korea Water Resources Corporation: Daejeon, Korea, 2001.
- National Institute for Disaster Prevention. Analysis Investigating the Cause of the Drought; National Institute for Disaster Prevention: Ulsan, Korea, 2002. [Google Scholar]
- Bae, D.; Sohn, K.; Kim, H.; Lee, J.; Lee, D.; Ahn, J.; Kim, T. Standardization and evaluation of PDSI calculation method for Korean drought management agencies. Atmos. Korean Meteorol. Soc. 2013, 23, 539–547. [Google Scholar]
- Harman, C.; Stewardson, M. Optimising dam release rules to meet environmental flow targets. River Res. Appl. 2005, 21, 113–129. [Google Scholar] [CrossRef]
- Linfield, B.; Barnwell, T. The Enhanced Stream Water Quality Models QUAL2E and QUAL2E-UNCAS: Documentation and User Manual; USEPA/600/3-87/007; Athens, G.A., Ed.; Environmental Research Laboratory, USEPA: Edison, NJ, USA, 1987. [Google Scholar]
- Watershed Water Management Operating Technology; Ministry of Science and Technology: Seoul, Korea, 2007.
- Kim, S.D.; Yoo, C.S. Evaluation of the dam release effect on water quality using time series models. J. Korean Soc. Water Qual. 2004, 20, 685–691. (In Korean) [Google Scholar]
- Zhang, Y.; Xia, J.; Chen, J.; Zhang, M. Water quantity and quality optimization modeling of dams operation based on SWAT in Wenyu River Catchment, China. Environ. Monit. Assess. 2011, 173, 409–430. [Google Scholar] [CrossRef] [PubMed]
Figure 1.
Overview of the studied watershed: (a) water supply system; and (b) sub-basin and main control points.
Figure 1.
Overview of the studied watershed: (a) water supply system; and (b) sub-basin and main control points.
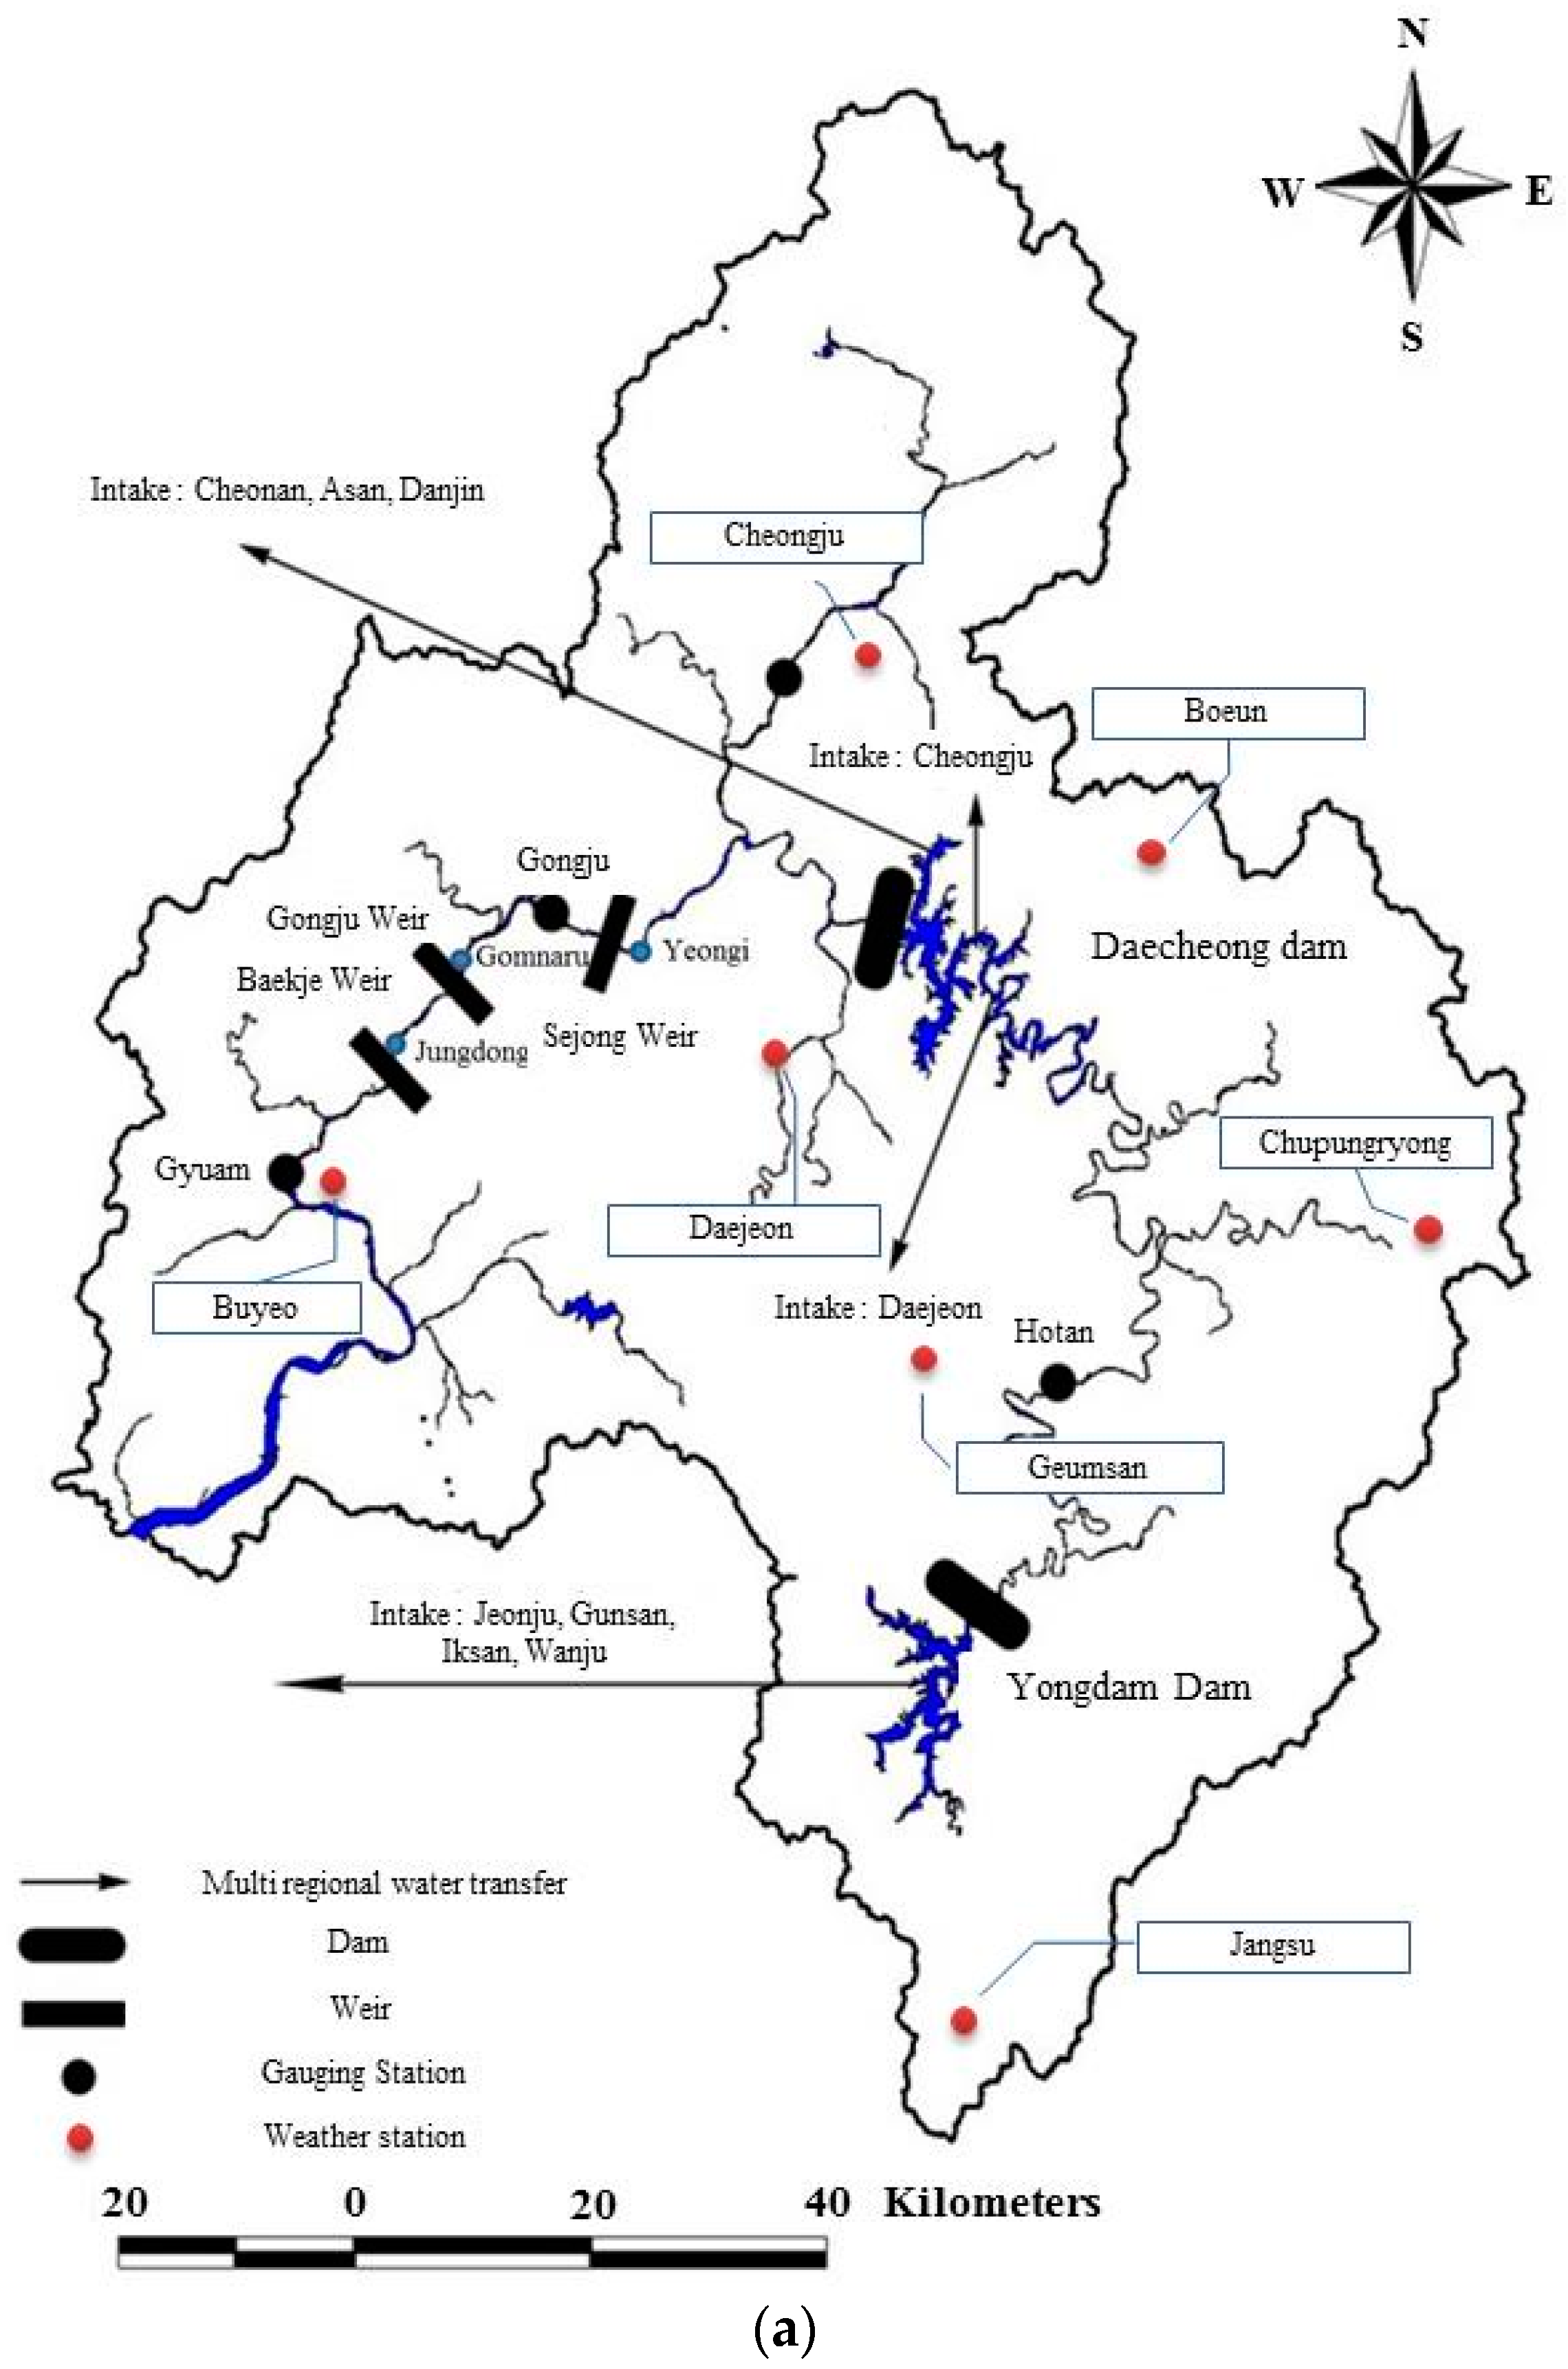
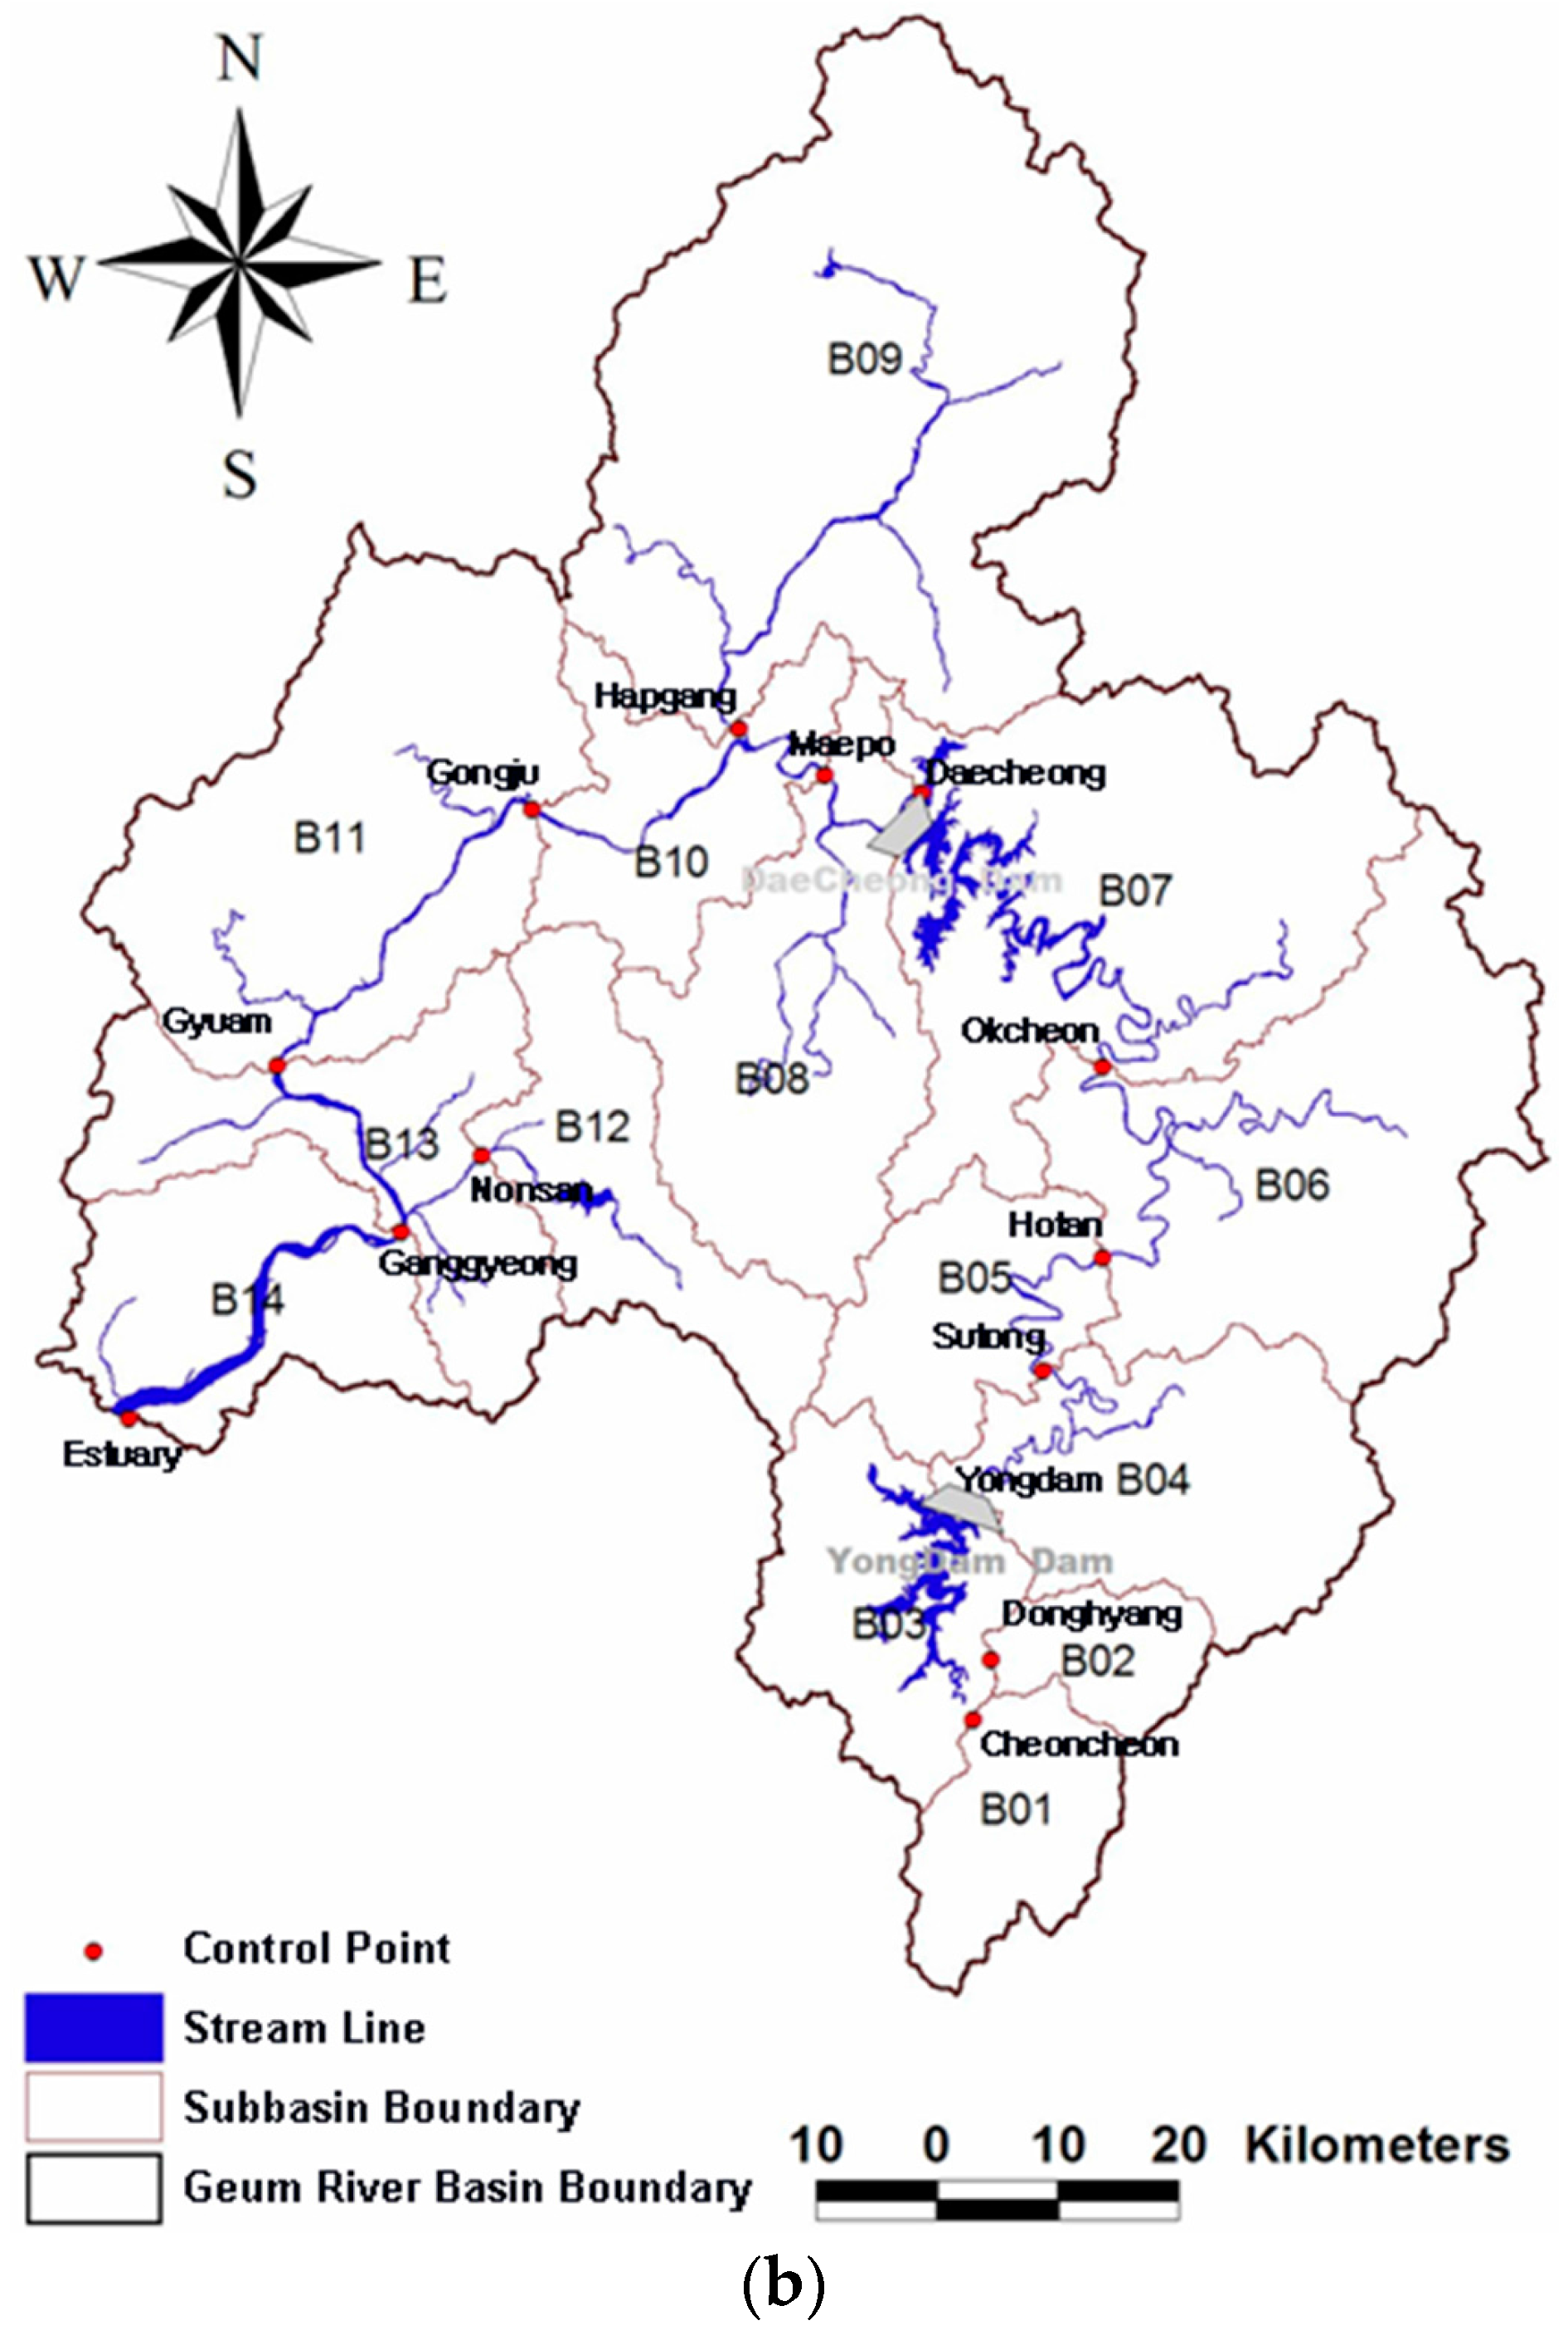
Figure 2.
Assessment procedure of environmental effects for the operation of weirs and reservoirs.

Figure 3.
The SSARR model (Ahn et al., 2015): (a) Flowchart; (b) SMI-ROP; and (c) BII-BFP.

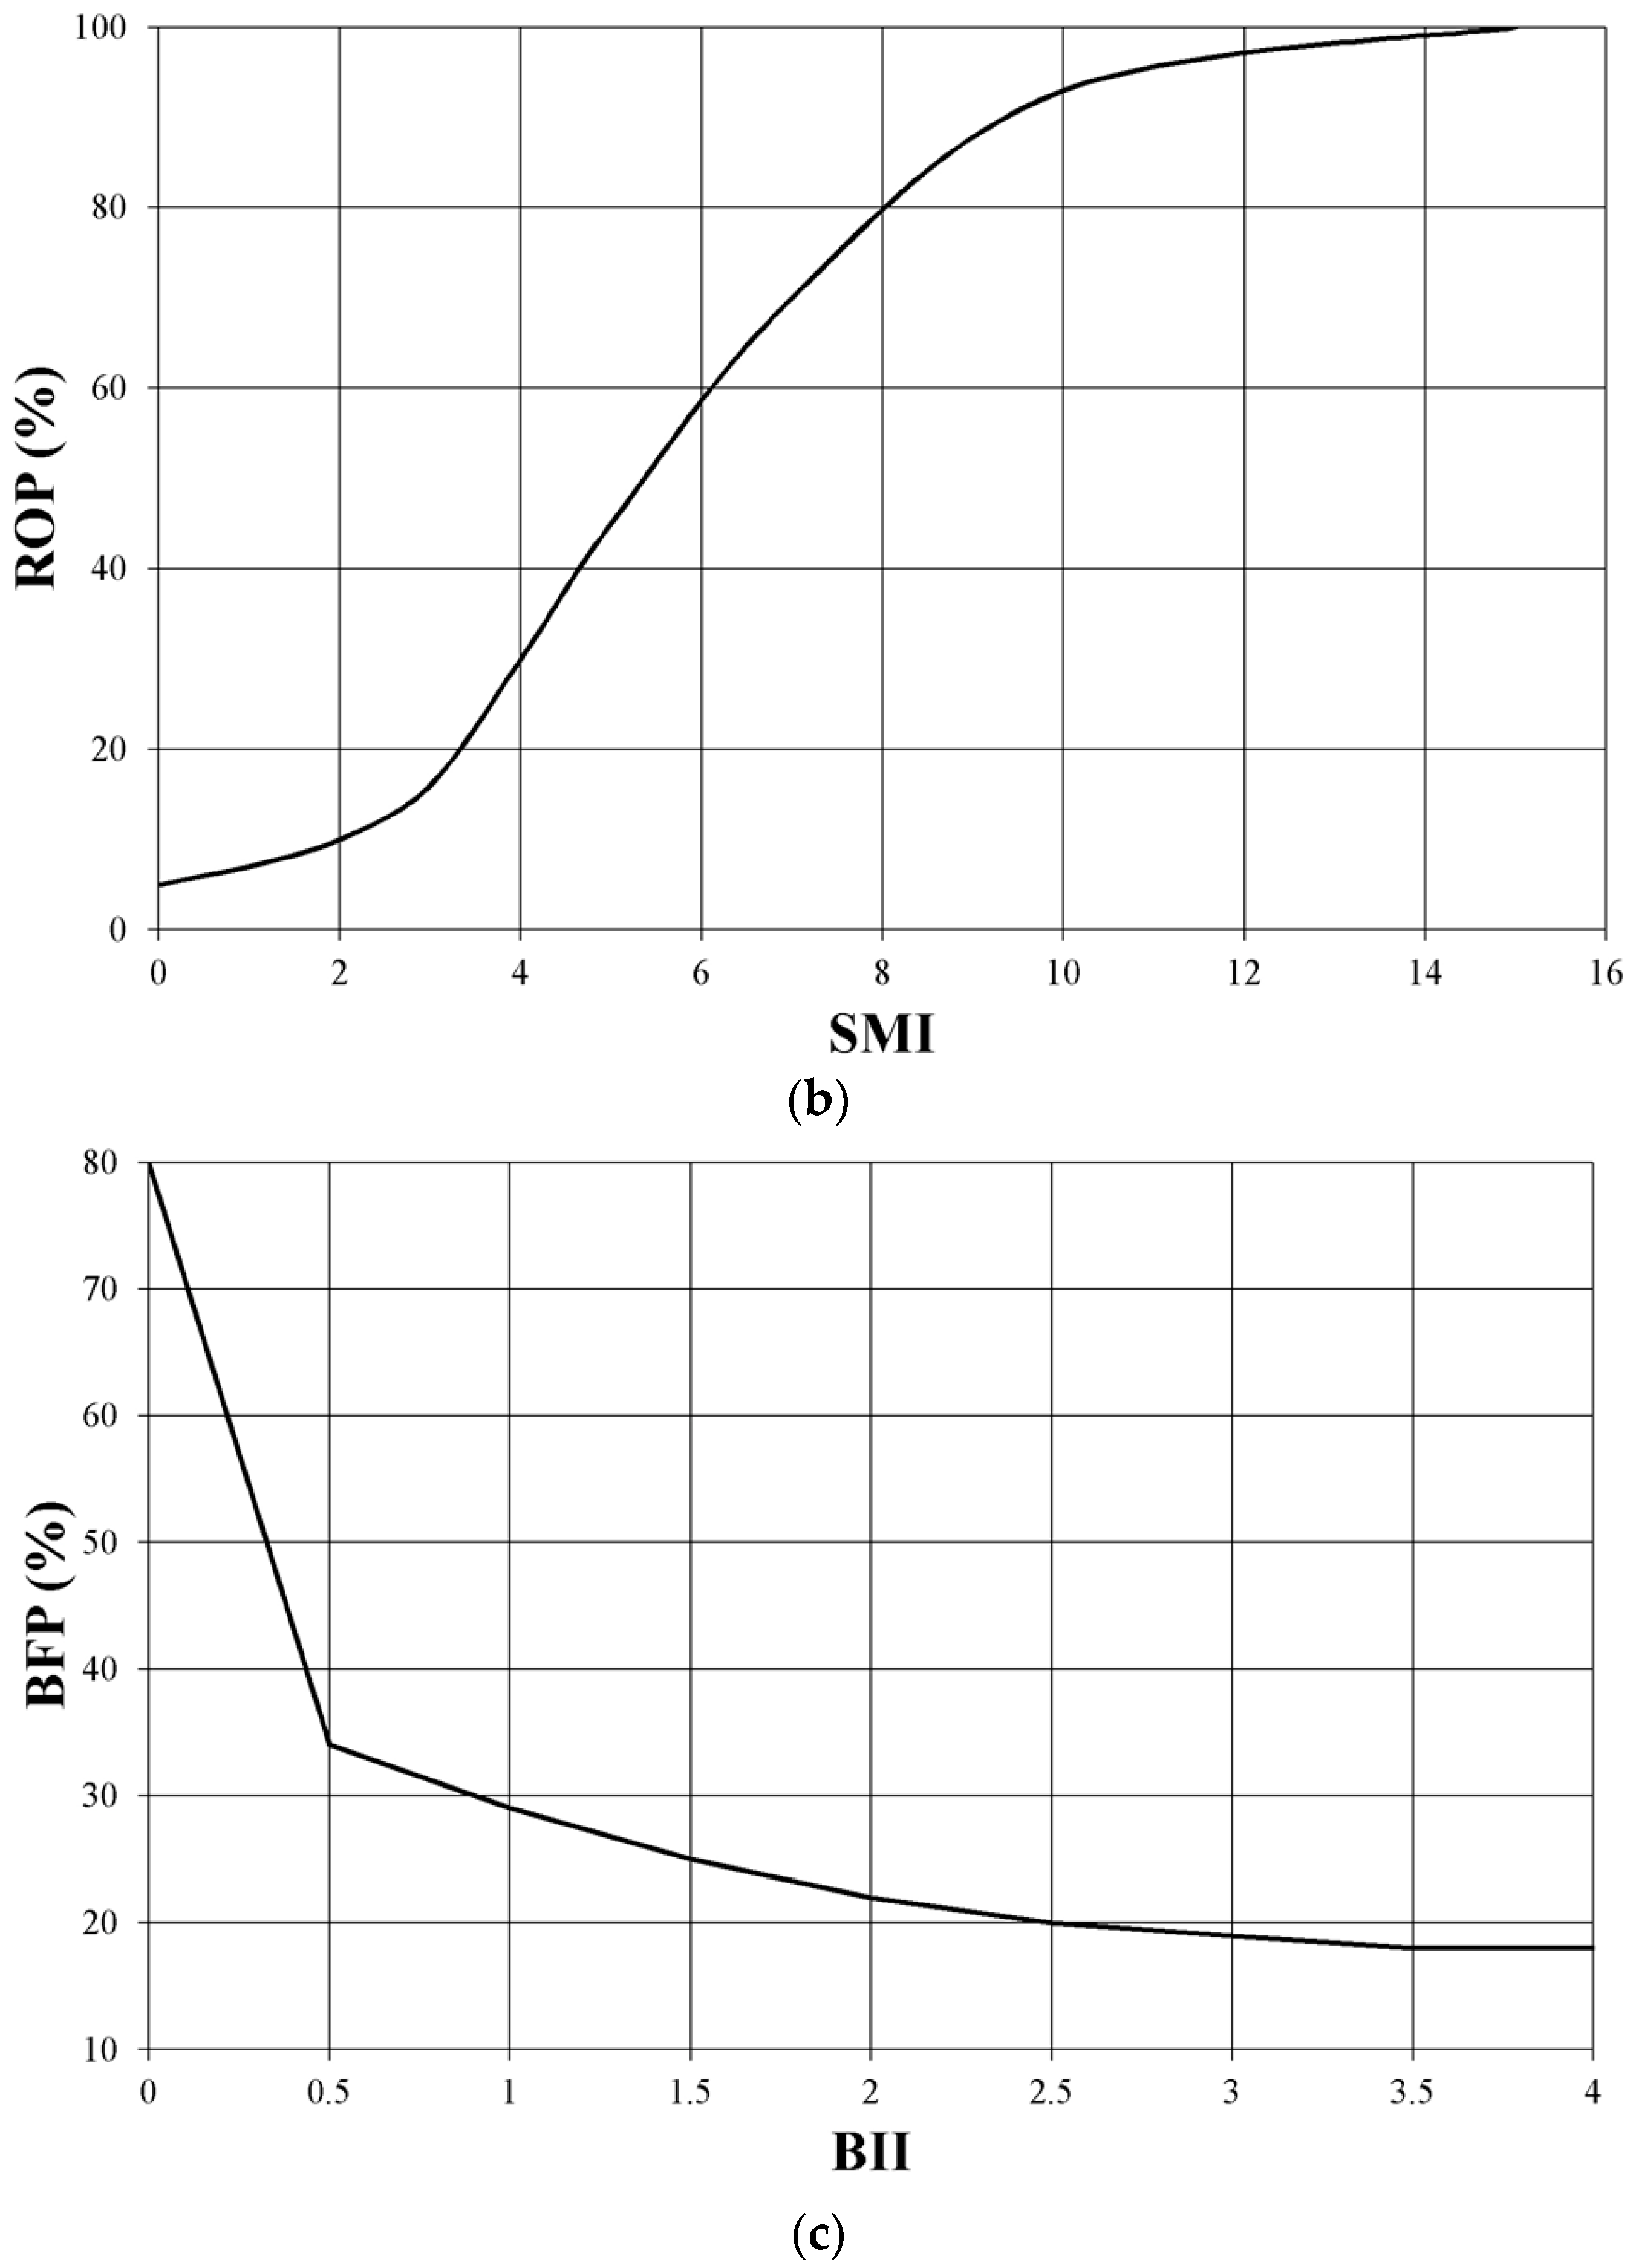
Figure 4.
Examples of calibration results of the SSARR model.
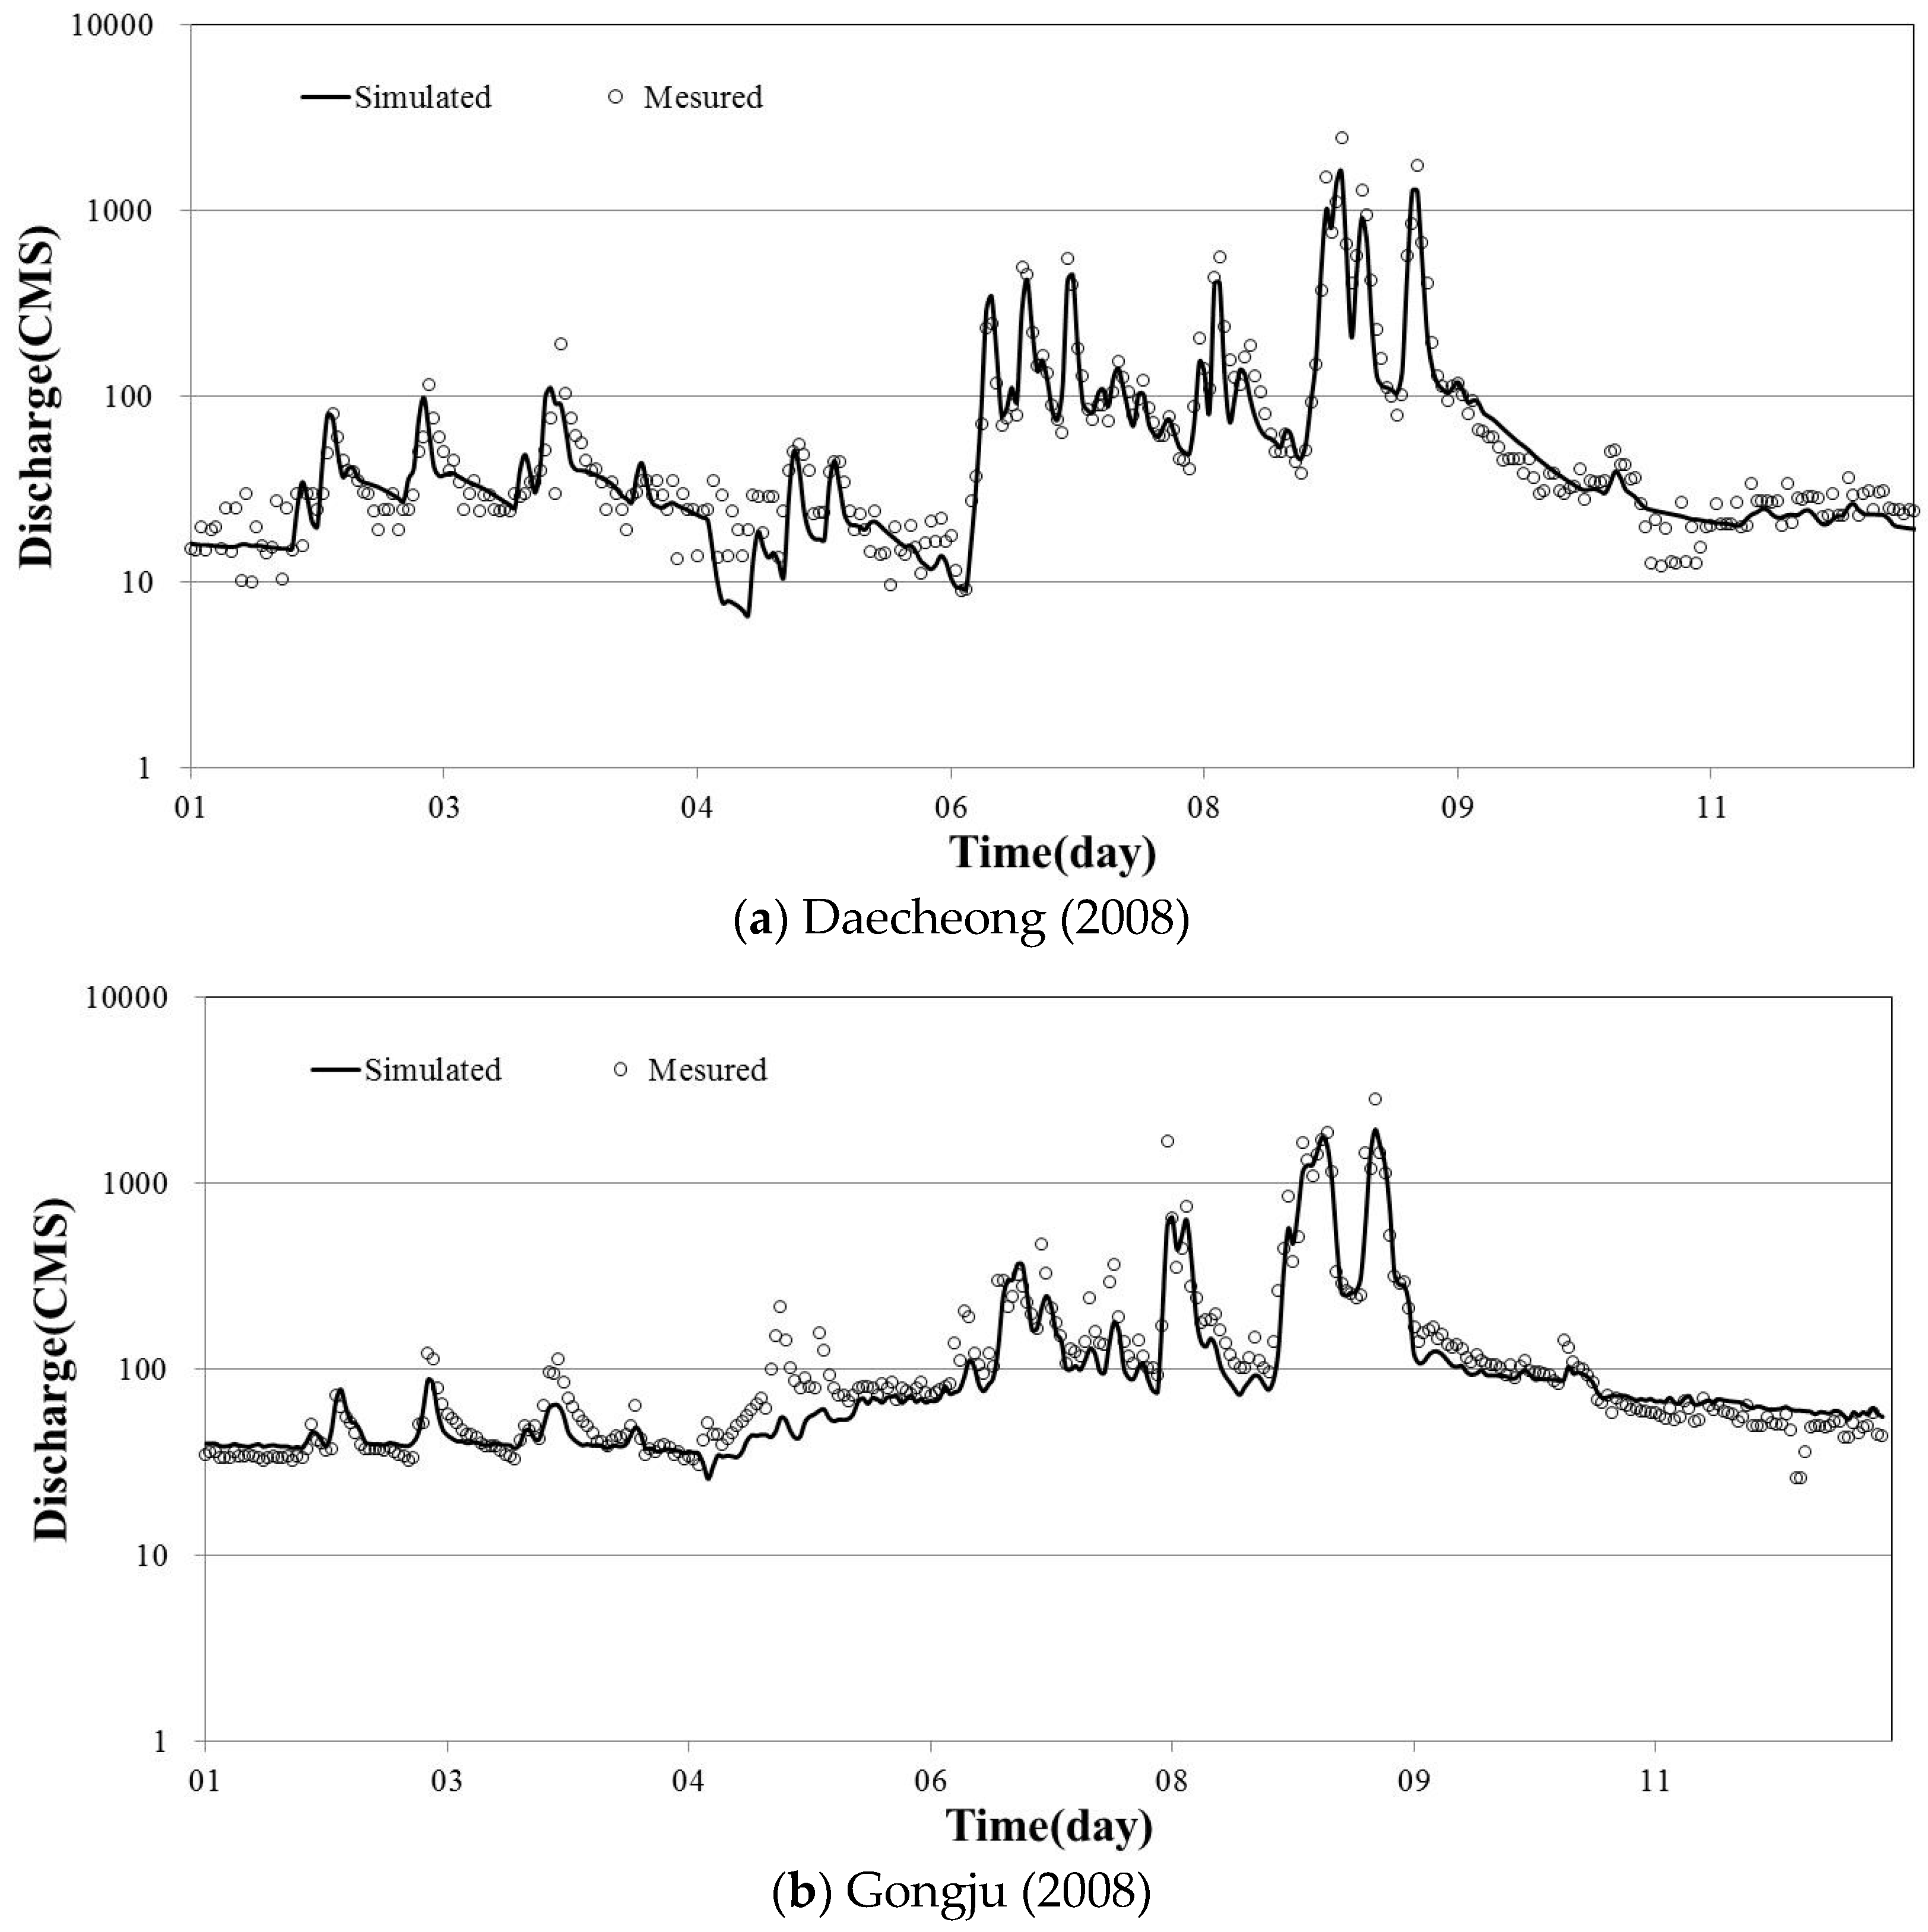
Figure 5.
Plot of water level versus storage capacity of dams and weirs: (a) dams; and (b) weirs.


Figure 6.
Operation scenario for dams and weirs: (a) operation flowchart for coupled dams; and (b) operation flowchart for coupled dams and weirs.
Figure 6.
Operation scenario for dams and weirs: (a) operation flowchart for coupled dams; and (b) operation flowchart for coupled dams and weirs.

Figure 7.
Flow duration curves according to different operation scenarios at Gyuam point.

Figure 8.
Results of PDSI calculated for the Geum River Basin: (a) Jangsu, Geumsan, and Chupungryong; and (b) Boeun, Cheongju, Daejeon, and Buyeo.
Figure 8.
Results of PDSI calculated for the Geum River Basin: (a) Jangsu, Geumsan, and Chupungryong; and (b) Boeun, Cheongju, Daejeon, and Buyeo.

Figure 9.
Flowchart of the water quality model.
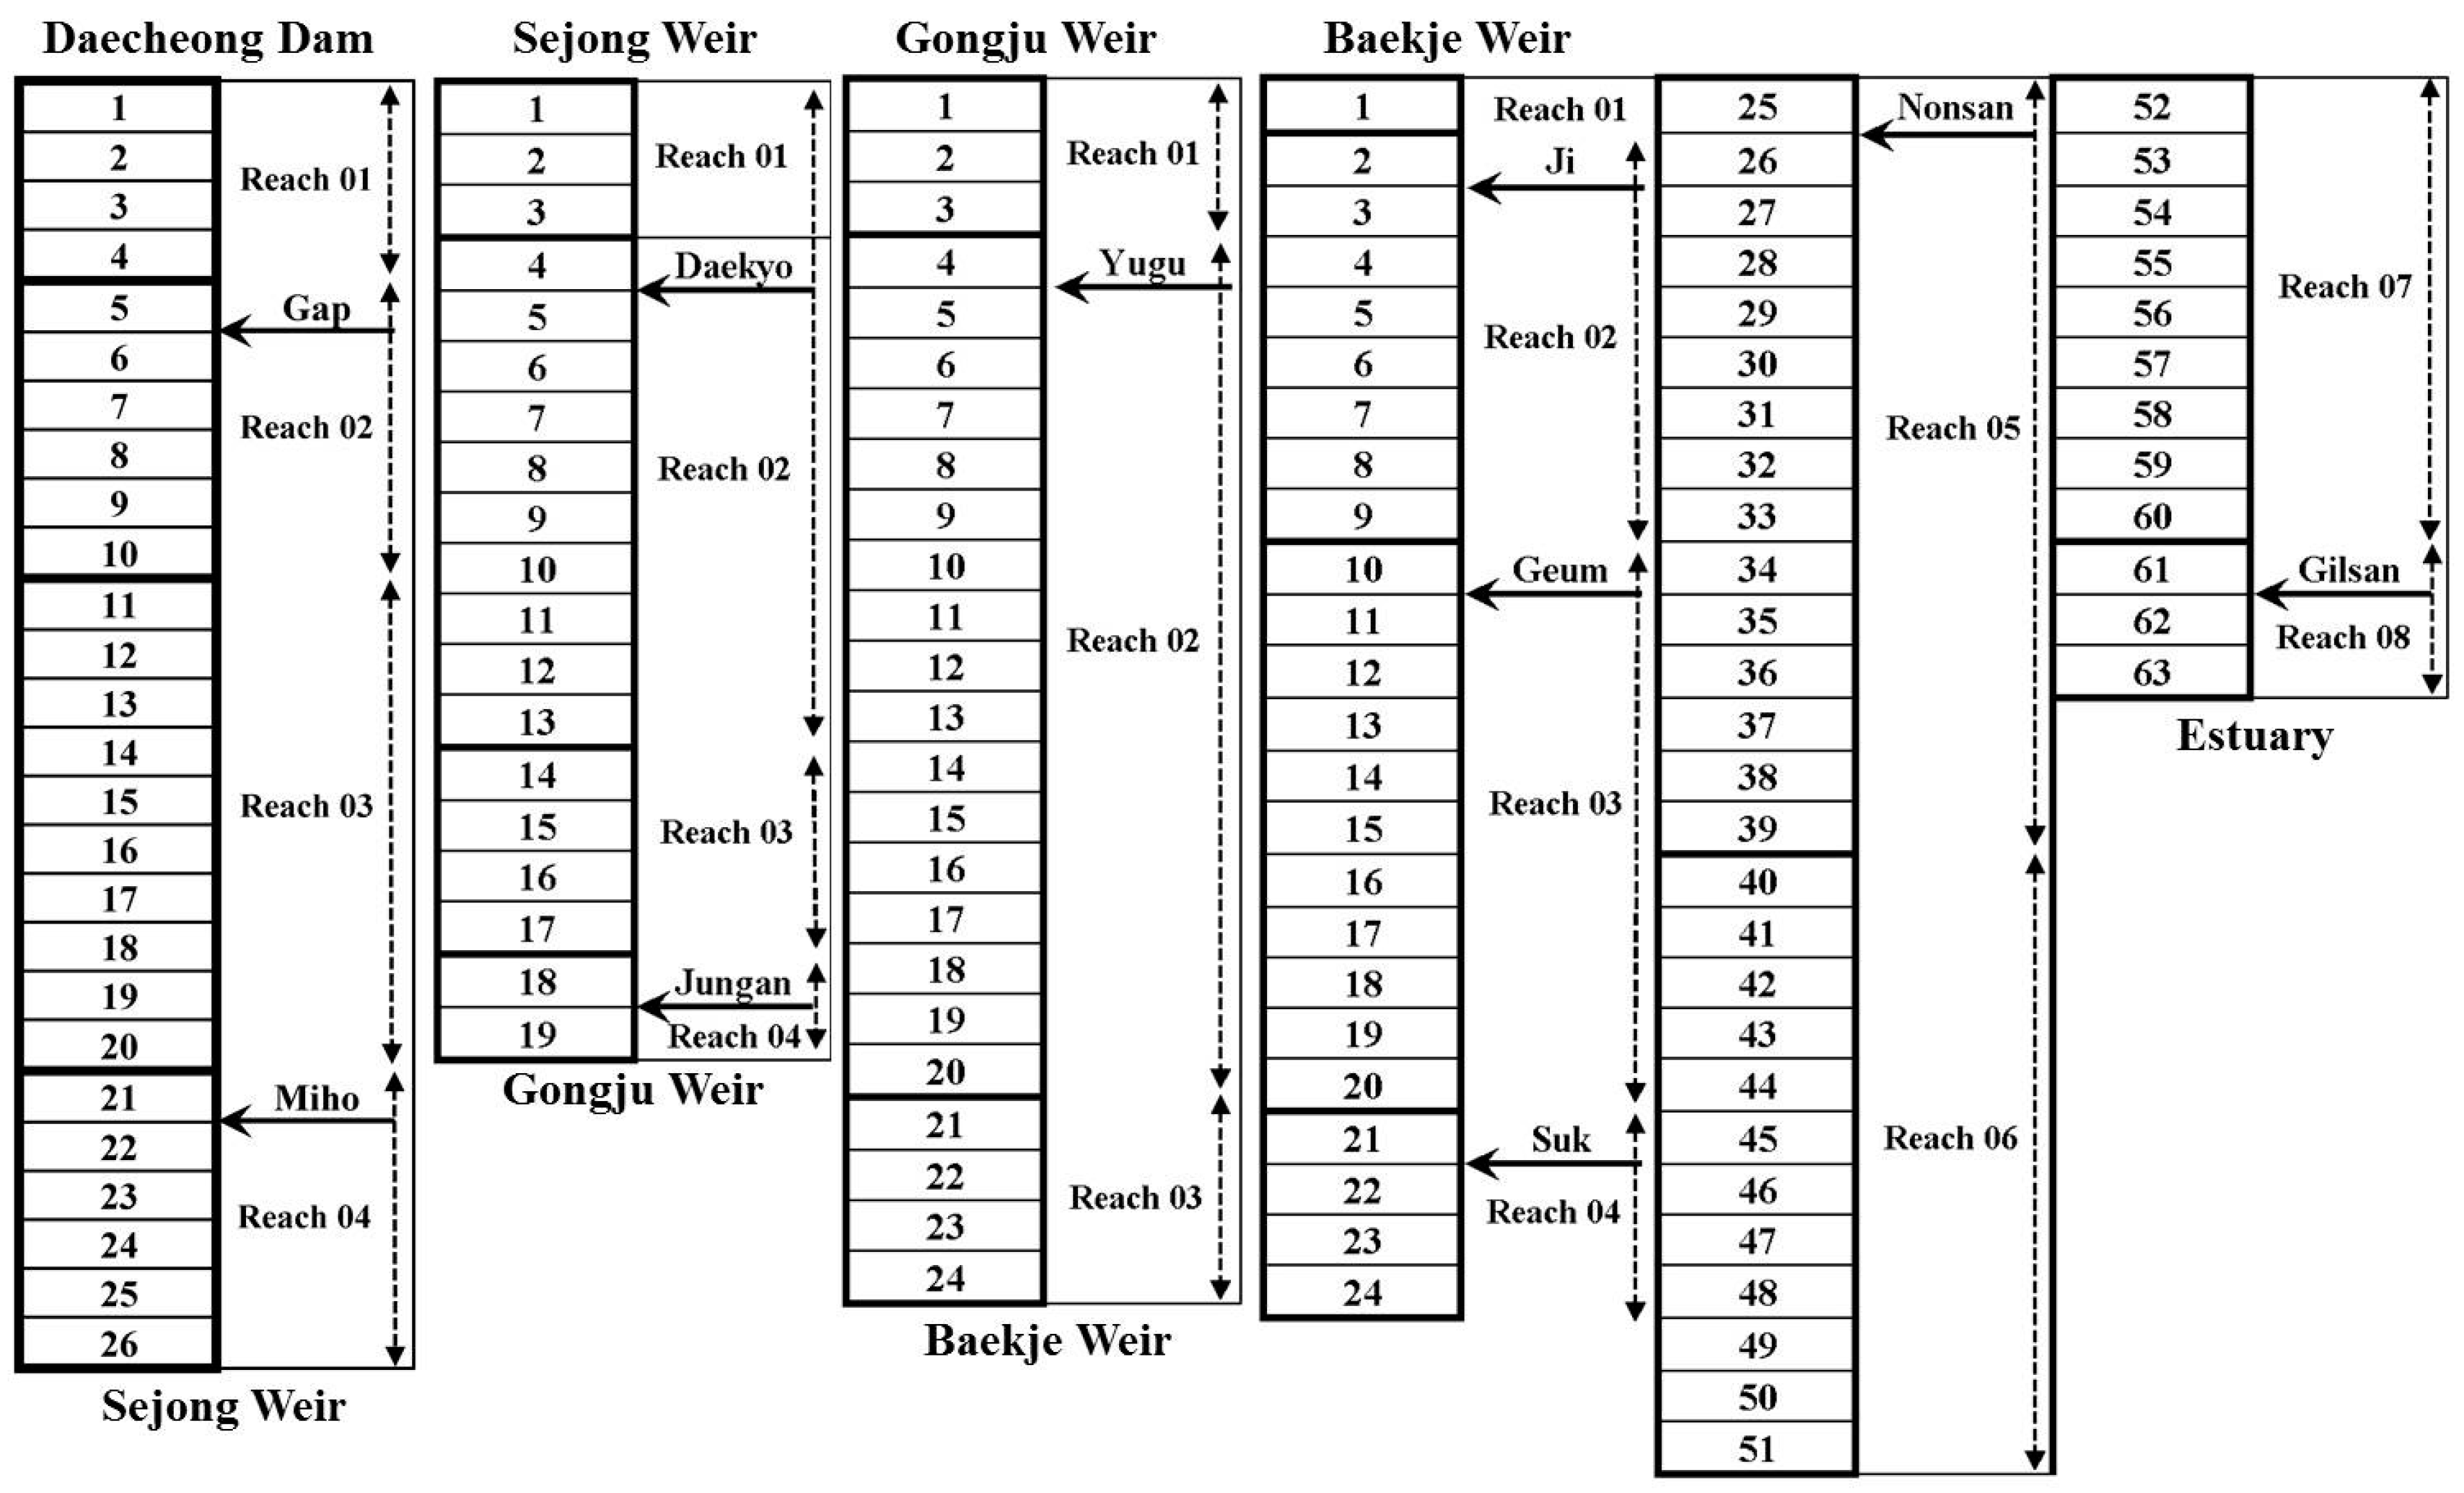
Figure 10.
Calibration results of the Qual2E model (Ahn et al., 2015): (a) BOD according to distance; (b) T-N according to distance; and (c) T-P according to distance.
Figure 10.
Calibration results of the Qual2E model (Ahn et al., 2015): (a) BOD according to distance; (b) T-N according to distance; and (c) T-P according to distance.
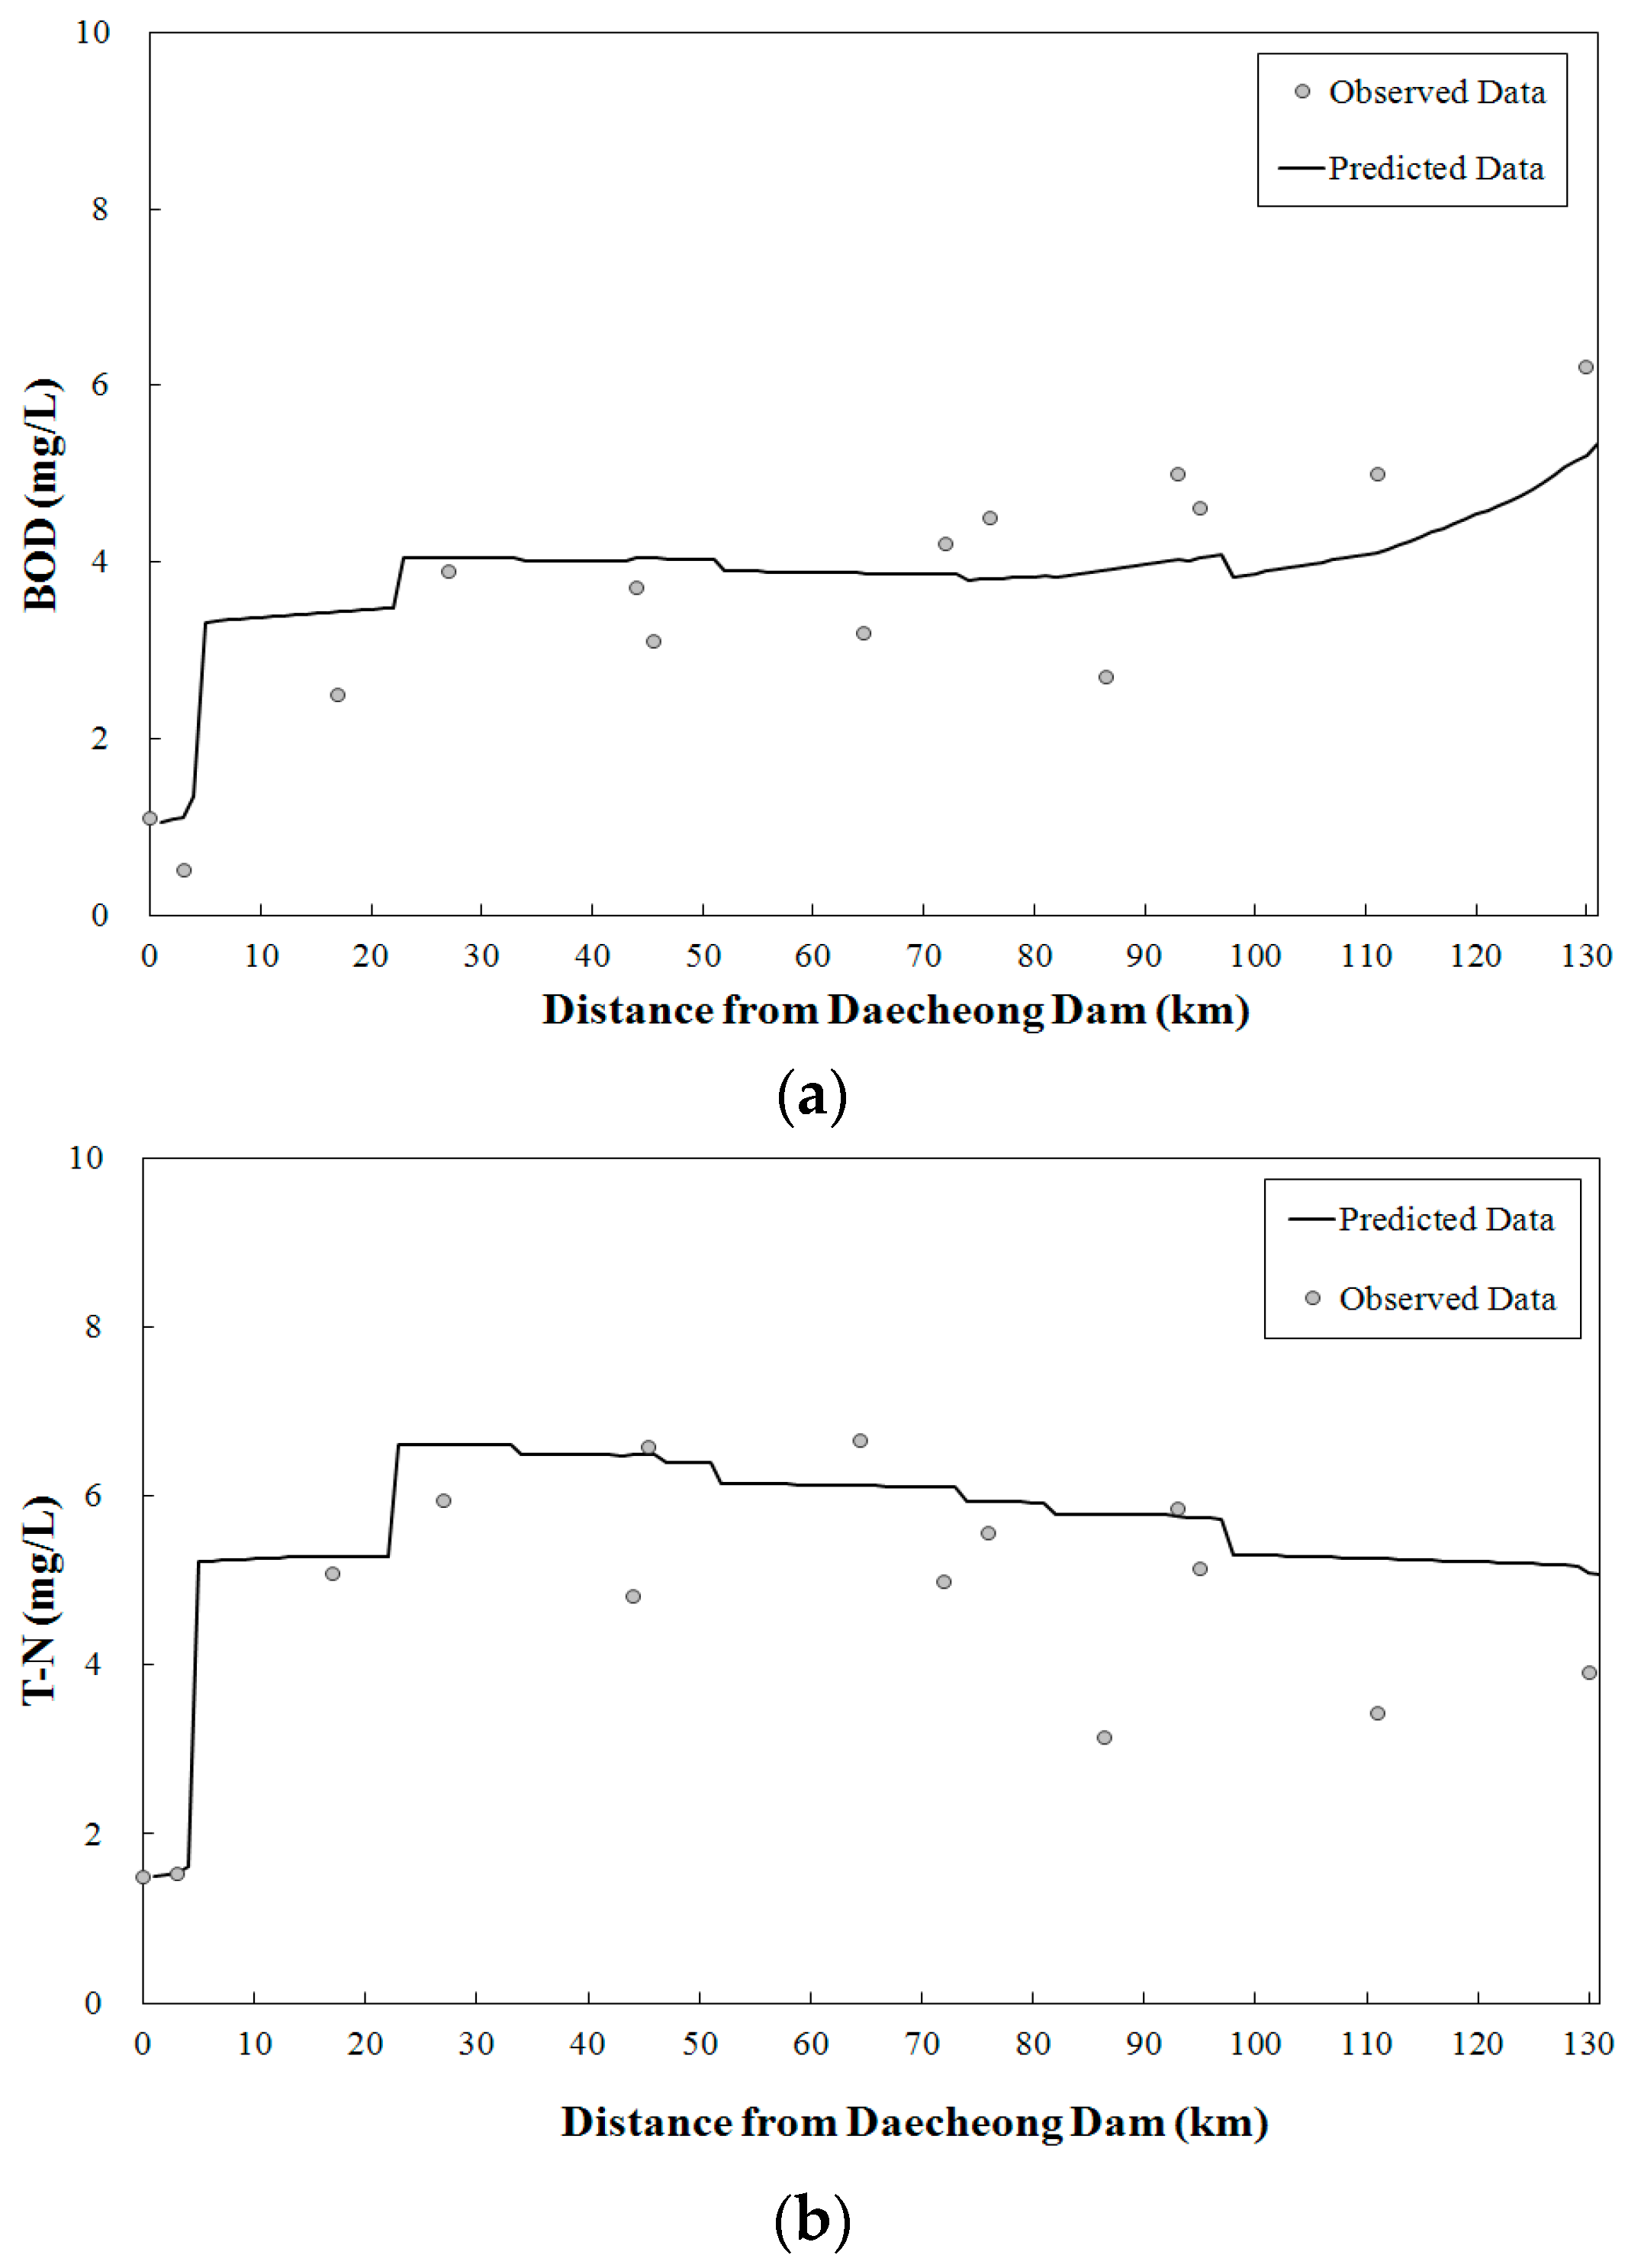
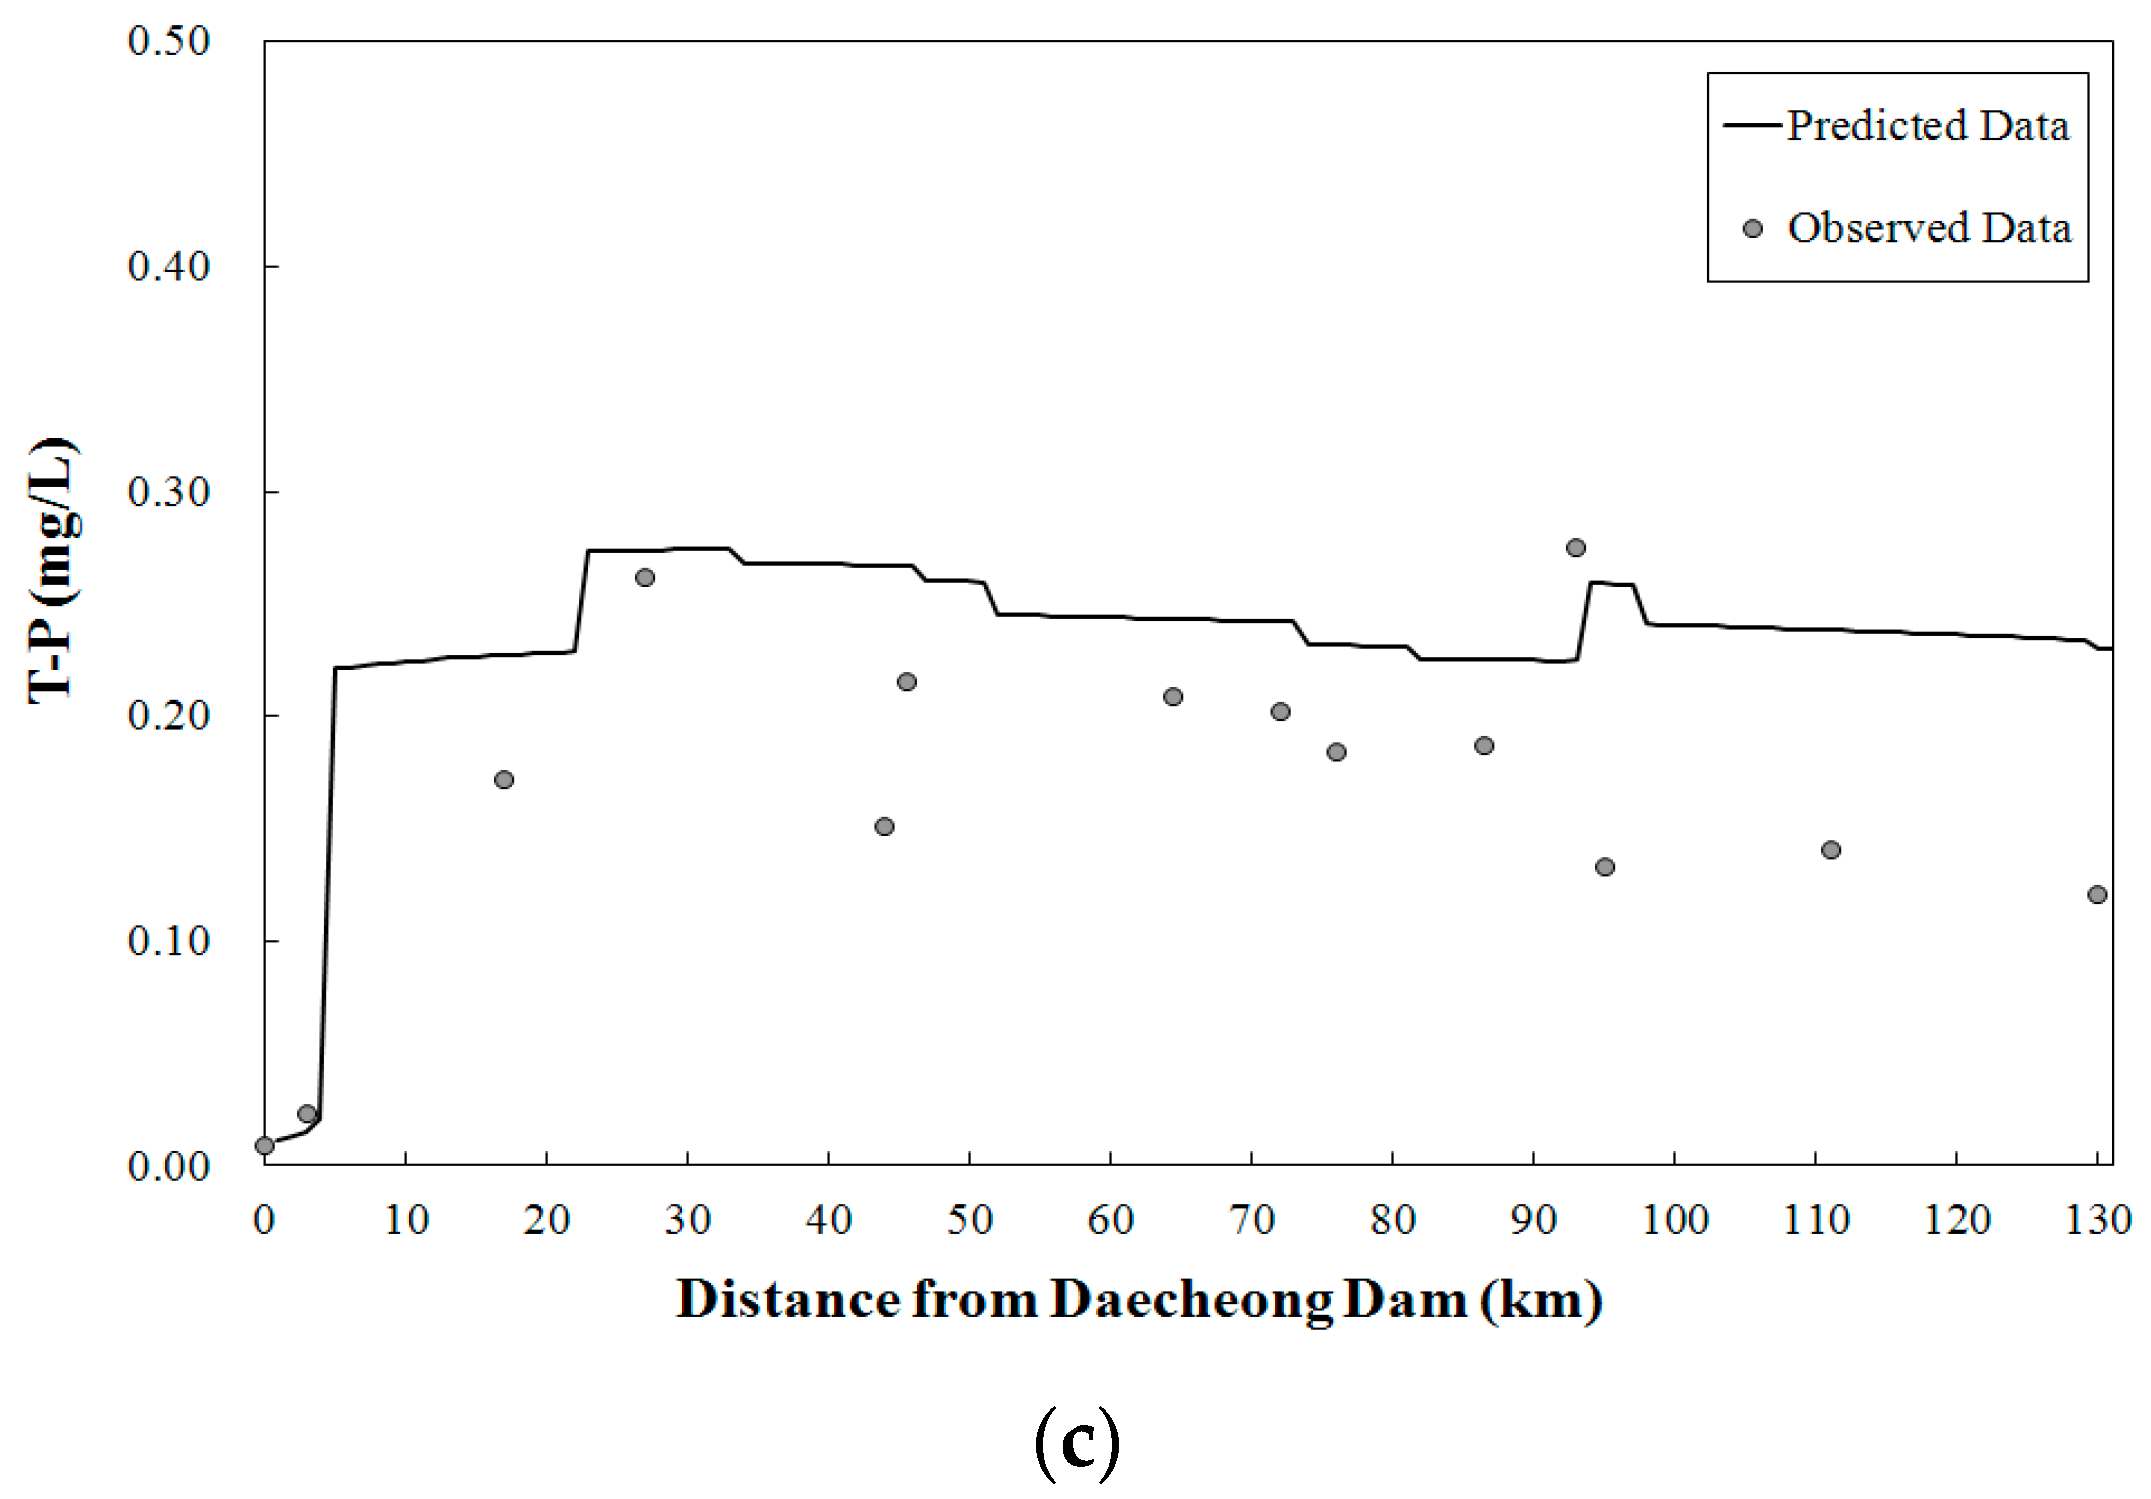
Figure 11.
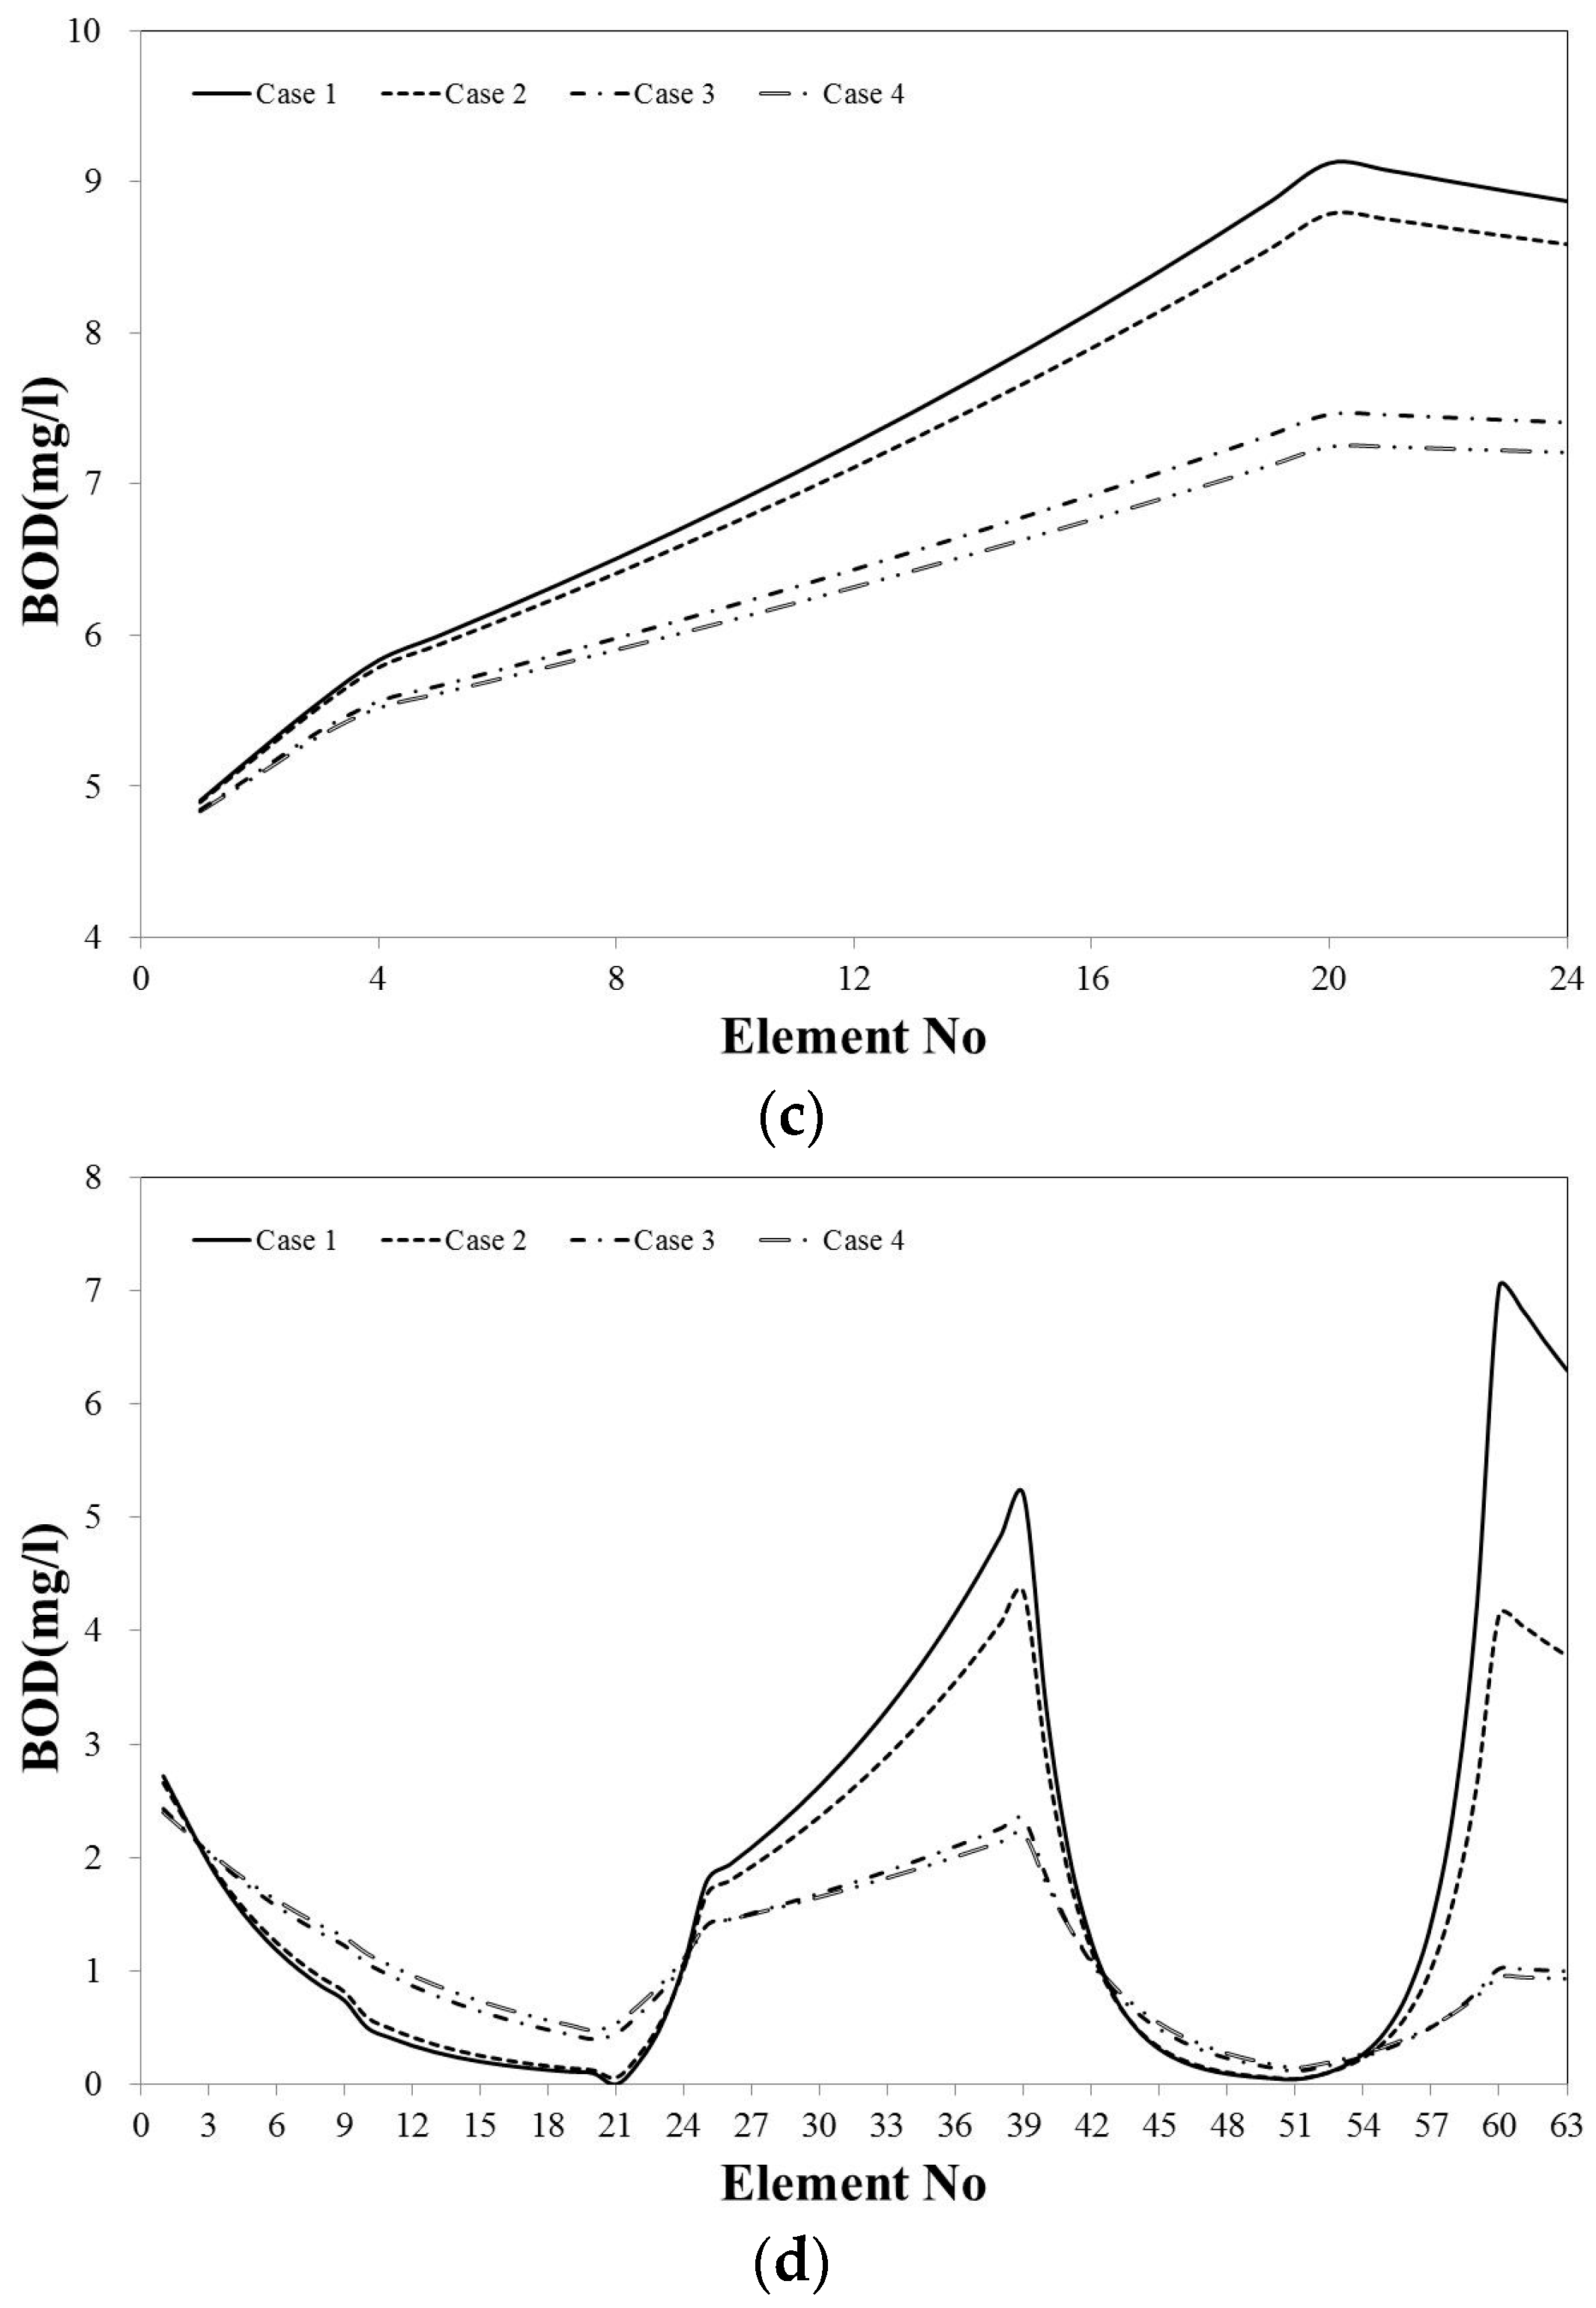
Results of BOD analysis for each case (April 2008): (a) Daecheong Dam to Sejong Weir; (b) Sejong Weir to Gongju Weir; (c) Gongju Weir to Baekje Weir; and (d) Baekje Weir to Estuary.
Figure 11.
Results of BOD analysis for each case (April 2008): (a) Daecheong Dam to Sejong Weir; (b) Sejong Weir to Gongju Weir; (c) Gongju Weir to Baekje Weir; and (d) Baekje Weir to Estuary.


Figure 12.
Results of BOD analysis for each case (May 2008): (a) Daecheong Dam to Sejong Weir; (b) Sejong Weir to Gongju Weir; (c) Gongju Weir to Baekje Weir; and (d) Baekje Weir to Estuary.
Figure 12.
Results of BOD analysis for each case (May 2008): (a) Daecheong Dam to Sejong Weir; (b) Sejong Weir to Gongju Weir; (c) Gongju Weir to Baekje Weir; and (d) Baekje Weir to Estuary.


Table 1.
Criteria for the goodness-of-fit evaluation [35].
Table 1.
Criteria for the goodness-of-fit evaluation [35].
| Performance Rating | Model Efficiency Interpretation | NSEC | |
|---|---|---|---|
| Very good | SD > 3.2 RMSE | >2.2 | >0.90 |
| Good | SD = 2.2 RMSE − 3.2 RMSE | 1.2–2.2 | 0.80–0.90 |
| Acceptable | SD = 1.2 RMSE − 2.2 RMSE | 0.7–1.2 | 0.65–0.80 |
| Unsatisfactory | SD < 1.7 RMSE | >0.7 | <0.65 |
Table 2.
Annual bias and RMSE of the control points.
| Year | Daecheong | Gongju | ||||||
|---|---|---|---|---|---|---|---|---|
| RMSE | NSEC | TIC | Nt | RMSE | NSEC | TIC | Nt | |
| 2001 | 20.9 | 0.8 | 0.18 | 1.21 | 41.6 | 0.5 | 0.22 | 0.70 |
| 2002 | 186.1 | 0.7 | 0.36 | 0.69 | 115.7 | 0.6 | 0.25 | 0.86 |
| 2003 | 150.6 | 0.8 | 0.21 | 1.39 | 150.6 | 0.8 | 0.21 | 0.84 |
| 2004 | 124.2 | 0.7 | 0.27 | 0.97 | 129.6 | 0.8 | 0.22 | 0.86 |
| 2005 | 77.4 | 0.8 | 0.2 | 1.37 | 84.3 | 0.8 | 0.18 | 1.23 |
| 2006 | 94.7 | 0.9 | 0.19 | 1.76 | 159.2 | 0.8 | 0.23 | 0.69 |
| 2007 | 75 | 0.9 | 0.17 | 1.99 | 103.4 | 0.9 | 0.17 | 1.48 |
| 2008 | 15.9 | 0.9 | 0.11 | 2.99 | 97.3 | 0.9 | 0.16 | 1.52 |
Table 3.
Estimation of inflow for application to the HEC-ResSim model.
| Site | Estimation Method |
|---|---|
| Yongdam Dam | 404,705 |
| Daecheong Dam | 404,714 |
| Sejong Weir | |
| Gongju Weir | |
| Baekje Weir | |
| Gongju Gauging Station |
Table 4.
Detailed data on the dams and weirs covered in this study.
| Reservoir and Weir | Top of Dam (El. m) | Length of Dam (m) | Flood Control (El. m) | Conservation (El. m) | Inactive (El. m) | |
|---|---|---|---|---|---|---|
| High | Low | |||||
| Yongdam | 268.5 | 498 | 265.5 | 261.5 | 263.5 | 228.5 |
| Daecheong | 83.0 | 495 | 80 | 76.5 | 60 | |
| Sejong | 11.8 | 348 | 24.44 | 11.8 | 10.7 | |
| Gongju | 8.75 | 260 | 17.72 | 8.75 | 3.28 | |
| Baekje | 4.2 | 620 | 12.71 | 4.2 | 2.34 | |
Table 5.
Storage capacity of cumulative total of reservoirs and IR index.
| Date | Agricultural Reservoir | Multi-Purpose Dam | Multifunction Weir | Cumulative Sum | IR Index |
|---|---|---|---|---|---|
| (106 m3) | (106 m3) | ||||
| 1971–1980 | 113 | - | - | 113 | 0.020 |
| 1981–1990 | 98.9 | 790 | - | 1001.9 | 0.174 |
| 1991–2000 | 13.2 | - | - | 1015.1 | 0.176 |
| 2001–2010 | - | 672 | - | 1687.1 | 0.292 |
| 2010–2020 | - | - | 26.2 | 1713.3 | 0.297 |
Table 6.
Range of PDSI according to dry and wet conditions.
| Dry Condition | Class | Wet Condition | Class |
|---|---|---|---|
| −0.5–0.5 | Near normal | PDSI 4.0 | Extremely wet |
| −1.0–−0.5 | Incipient drought | 3.0–4.0 | Very wet |
| −2.0–−1.0 | Mild drought | 2.0–3.0 | Moderately wet |
| −3.0–−2.0 | Moderate drought | 1.0–2.0 | Slightly wet |
| −4.0–−3.0 | Severe drought | 0.5–1.0 | Incipient wet spell |
| −4.0 PDSI | Extreme drought | −0.5–0.5 | Near normal |
Table 7.
Discharge volumes calculated for Gyuam point using HEC-ResSim (m3·s−1).
| Site | Case 1 | Case 2 | Case 3 | Case 4 | |
|---|---|---|---|---|---|
| Daecheong Dam | April | 8.09 | 8.5 | 11.45 | 17.1 |
| May | 6.09 | 8.50 | 23.80 | 29.28 | |
| Sejong Weir | April | 21.73 | 22.14 | 25.09 | 30.34 |
| May | 12.30 | 14.15 | 29.45 | 34.52 | |
| Gongju Weir | April | 24.91 | 25.32 | 28.27 | 33.36 |
| May | 13.02 | 14.87 | 30.17 | 35.25 | |
| Baekje Weir | April | 27.36 | 27.77 | 30.72 | 35.10 |
| May | 13.45 | 15.30 | 30.60 | 35.10 | |
Table 8.
Data on tributaries downstream of Daecheong Dam.
| Lateral River | River Length (km) | Stream Length (km) | Area (km2) | Area Ratio Flowrate |
|---|---|---|---|---|
| Ji | 50.39 | 17.80 | 250.66 | 404,722 × 0.221 |
| Geum | 26.78 | 14.70 | 165.19 | 404,725 × 0.283 |
| Suksung | 20.94 | 12.10 | 145.78 | 404,725 × 0.261 |
| Nonsan | 57.10 | 21.45 | 667.16 | 404,724 + 404,725 × 0.261 |
| Gilsan | 23.82 | 11.40 | 113.68 | 404,727 × 0.213 |
Table 9.
Comparison of the difference in BOD (mg·L−1) between Case 1 and all other cases.
| Site and Date | Case 2 | Case 3 | Case 4 | ||
|---|---|---|---|---|---|
| Daecheong Dam to Sejong Weir | April 2008 | MIN | −0.05 | −0.37 | −0.89 |
| MAX | −0.08 | −0.57 | −1.21 | ||
| May 2008 | MIN | −0.34 | −1.76 | −2.09 | |
| MAX | −0.54 | −2.14 | −2.42 | ||
| Sejong Weir to Gongju Weir | April 2008 | MIN | −0.00 | −0.01 | −0.02 |
| MAX | −0.06 | −0.42 | −0.88 | ||
| May 2008 | MIN | −0.01 | −0.04 | −0.05 | |
| MAX | −0.67 | −2.63 | −2.86 | ||
| Gongju Weir to Baekje Weir | April 2008 | MIN | −0.00 | −0.00 | −0.01 |
| MAX | −0.01 | −0.11 | −0.24 | ||
| May 2008 | MIN | −0.01 | −0.06 | −0.07 | |
| MAX | −0.34 | −1.66 | −1.88 | ||
| Baekje Weir to Estuary | April 2008 | MIN | 0.03 | 0.20 | 0.43 |
| MAX | −0.01 | −0.07 | −0.15 | ||
| May 2008 | MIN | 0.09 | 0.57 | 0.65 | |
| MAX | −0.14 | −0.48 | −0.48 | ||
© 2017 by the authors. Licensee MDPI, Basel, Switzerland. This article is an open access article distributed under the terms and conditions of the Creative Commons Attribution (CC BY) license (http://creativecommons.org/licenses/by/4.0/).
Share and Cite
MDPI and ACS Style
Ahn, J.M.; Jung, K.Y.; Shin, D. Effects of Coordinated Operation of Weirs and Reservoirs on the Water Quality of the Geum River. Water 2017, 9, 423. https://doi.org/10.3390/w9060423
AMA Style
Ahn JM, Jung KY, Shin D. Effects of Coordinated Operation of Weirs and Reservoirs on the Water Quality of the Geum River. Water. 2017; 9(6):423. https://doi.org/10.3390/w9060423
Chicago/Turabian StyleAhn, Jung Min, Kang Young Jung, and Dongseok Shin. 2017. "Effects of Coordinated Operation of Weirs and Reservoirs on the Water Quality of the Geum River" Water 9, no. 6: 423. https://doi.org/10.3390/w9060423
Note that from the first issue of 2016, this journal uses article numbers instead of page numbers. See further details here.