
Vulnerability of Buildings on Coastal Dikes due to Wave Overtopping
by
 , and
, and
Xuexue Chen
1,*, 
Sebastiaan N. Jonkman
1,
Sander Pasterkamp
2,
Tomohiro Suzuki
1,3 and
and
Corrado Altomare
3,4 1
Department of Hydraulic Engineering, Delft University of Technology, Stevinweg 1, 2628 CN Delft, The Netherlands
2
Department of Structural Engineering, Delft University of Technology, Stevinweg 1, 2628 CN Delft, The Netherlands
3
Flanders Hydraulic Research, Berchemlei 115, 2140 Antwerp, Belgium
4
Department of Civil Engineering, Ghent University, Technologiepark 904, 9052 Ghent, Belgium
*
Author to whom correspondence should be addressed.
Water 2017, 9(6), 394; https://doi.org/10.3390/w9060394
Submission received: 21 April 2017
/
Revised: 19 May 2017
/
Accepted: 26 May 2017
/
Published: 2 June 2017
(This article belongs to the Special Issue Innovative Aspects in Flood Risk Evaluation, Mapping and Communication)
Abstract
:The vulnerability of buildings on coastal dikes due to overtopping wave impacts is difficult to assess. A method is developed in this paper to quantify the vulnerability of masonry buildings on a coastal dike exposed to wave overtopping. Using previous studies, the accidental loads due to the extreme wave impacts are characterized. Using the approach from Eurocode 6, the strength of masonry buildings under these loads is assessed. Results from a case study in Belgium show that masonry buildings located 10–15 m away from the seafront would suffer from localized damage, such as windows being broken under a 1000 year storm. The building would collapse under a 10,000-year storm. The method can be used to assess the safety of existing buildings on coastal dikes and to design new buildings.
1. Introduction
Low-lying and densely-populated coastal regions in the Netherlands and Belgium are becoming more attractive areas for economic, environmental and social development [1]. In these regions, buildings and infrastructure are present quite close to the sea defense line. There is a relatively high risk of damage and loss of life that could be brought about by coastal flooding, and the risks could increase with climate change and sea level rise.
Coastal flooding can be caused by high sea level, breaching of sea defense, as well as wave overtopping. Even though the first two causes are the main concerns when assessing flood risk for the highly-developed coastal sites, overtopping effects will be important for buildings on the coast. Allsop et al. [2] pointed out that the direct hazard from overtopping for coastal buildings and human beings is being ignored, so more attention is needed.
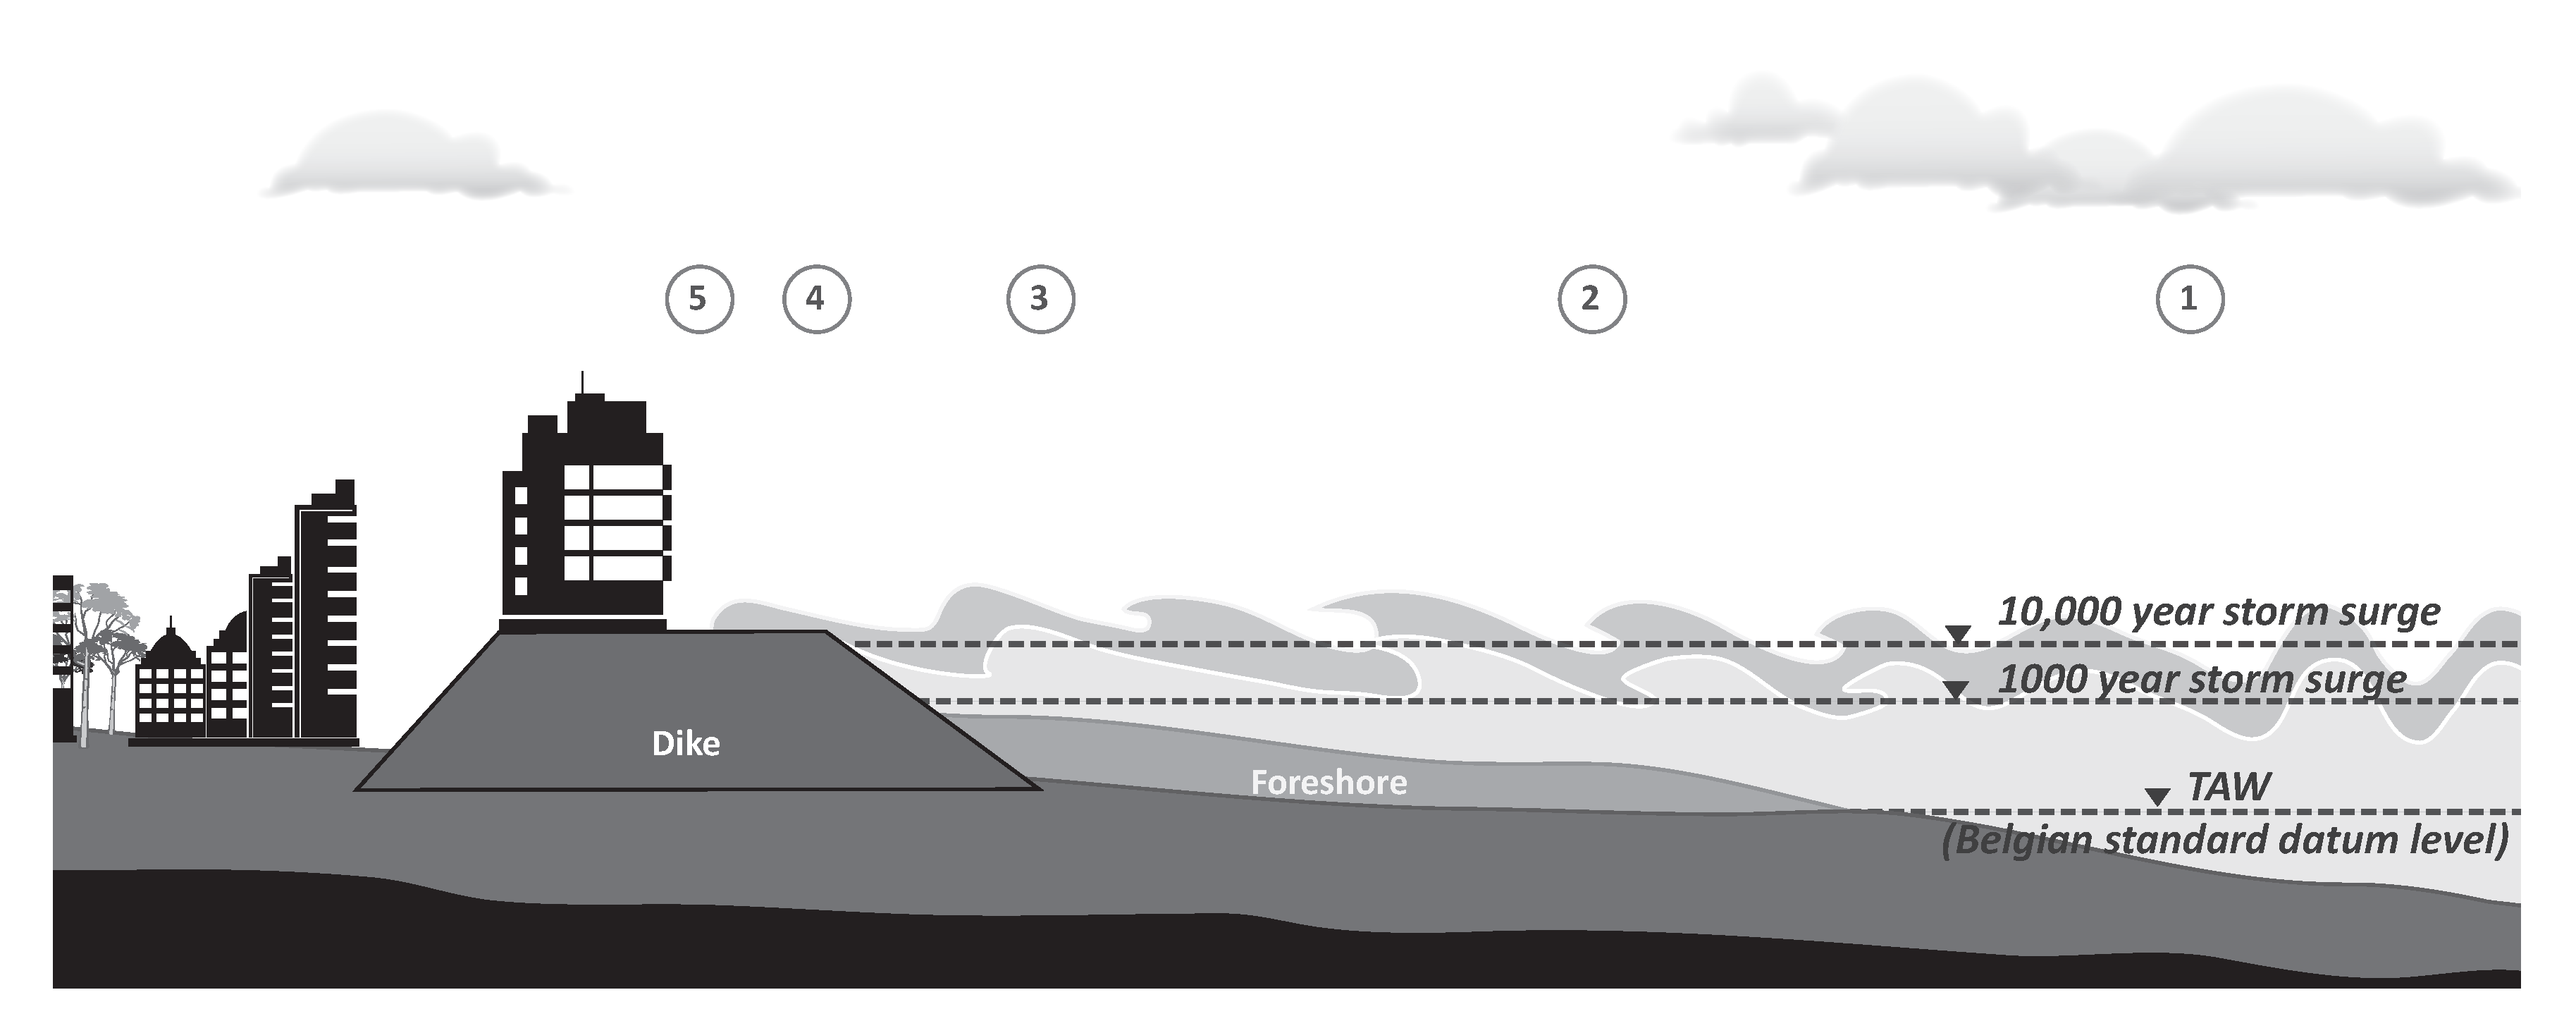
In the Netherlands and Belgium, wide crested dikes are used as flood defense structures for the densely-populated coastal front sites [3]. Overtopping for coastal dikes with slopes occurs when the incident wave runs up along the seaward slope of the dike and over its crest. The buildings on the top of the dikes are threatened from overtopping effects associated with wave runup. Figure 1 shows a typical configuration for a Belgian coastal site and the most relevant overtopping processes. In winter, storms often lead to a significant increase in surge combining with high waves that may induce serious overtopping by runup waves. This shoreward overtopping wave on the dike can exert a strong hydrodynamic force on the buildings. There are no relevant data of the direct damage from wave runup overtopping on waterfront buildings either in reality or site model tests. Even though relevant research has been done for wave impacts of tsunamis [4] and surges [5,6] on coastal buildings, to the authors’ knowledge, a method to assess the damage due to the runup of overtopping waves on structures on coastal dikes has not been formulated yet.
The objective of this paper is to develop a practical method to evaluate the vulnerability of buildings on coastal dikes caused by the impact load of overtopping waves. This method can also be used to provide guidance for designing new buildings on the dike. The study focused on the collapse and localized damage of masonry buildings as this is a common building type on the Dutch and Belgian coast. The approach is also applicable to other building types.
The structure of this paper is as follows. Section 2 describes the impact mechanism of overtopping waves and introduces the empirical method to calculate the maximum overtopping wave load during a certain storm peak. In Section 3, we analyze the failure mechanisms of masonry buildings on coastal dikes. We assess the masonry properties including material strength and support conditions. We calculate the capacity of lateral moment and define the limit state function of the masonry structural and non-structural elements. In Section 4, a case study is presented. Using realistic data for the Belgian situation, the comparison of the calculated maximum overtopping wave load and the lateral capacity of building elements for the collapse of a masonry building is considered. Discussion and conclusions are drawn in Section 5.
2. Overtopping Wave Loads
Overtopping waves are specifically defined as the waves that are generated after the incident runup waves flow over the dike crest. An estimation of the maximum load of overtopping waves is necessary in order to evaluate the vulnerability of buildings during a certain storm peak. In this section, first, we provide an overview of general flood loads on buildings. Then, the overtopping wave impacts are specified. Afterwards, an empirical estimation of the maximum overtopping wave load during a storm peak is given, which is based on previous studies, such as Chen et al. [8].
2.1. General Flood Loads
The coastal construction manual [9] classifies the general flood loads to which coastal residential buildings can be exposed. The most common flood load is the hydro-static load from flood water in both the lateral and vertical direction. The hydro-static load in the lateral direction is mainly caused by standing water or slowly moving water, whereas the hydro-static load in the vertical direction is normally due to buoyancy, as shown in Figure 2a. Another common flood load is the hydrodynamic load (or drag force), which is induced by fast moving flow, surge and tsunami around the structure, as shown in Figure 2b. For coastal buildings, especially those located in the wave breaking zone, the wave impact load is important: the horizontal breaking wave impact load is depicted in Figure 2c. Besides the direct hydro-static and hydrodynamic load from water, there are two other types of indirect load that need to be considered. One is the impact load imposed on a building by floating objects in the flood water. The other one is the localized scour around the foundation of buildings by waves and currents during the flood.
A dynamic overtopping wave load on a building consists of an impact force and a hydrodynamic drag force. Since the building is located in the path of the incident overtopping waves on the dike crest, part of the incident overtopping waves will strike the facade of the building, resulting in an impact load, and be reflected back seawards. The impact load is the dominant dynamic load on the building during this impact process. The other part of the incident waves would flow over the dike crest through the gaps between buildings. During this process, each building is subjected to hydrodynamic drag force. In this study, the hydrodynamic load induced by the impact of an overtopping wave on the external wall is considered as the primary flood load. The authors are concerned about the impact load due to wave overtopping, since it is the most relevant load to the vulnerability of the buildings, under the additional assumptions that the impact load is larger than the hydrostatic load and that the incident waves already break on coastal dikes. Details of the failure mechanisms of the building are given in Section 3.
2.2. Overtopping Wave Impact Mechanism
2.2.1. Impact Process and Characteristics
An overtopping event consists of the process of wave generation (see the processes ①–③ in Figure 1), overtopping wave formation (see the processes ③–④ in Figure 1) and the resulting impact (see the processes ④–⑤ in Figure 1). Overtopping waves are generated by storm waves, which are stochastic. Thus, it is necessary to provide an estimation of the maximum or representative overtopping impact load including the incident wave characteristics and dike geometry parameters.
Figure 3 shows a schematic sketch of two overtopping wave impact events and a schematic sketch of overtopping wave impact time series. In Figure 3a, the impact processes of two overtopping waves are shown. Stage (a–c) indicates the impact process of the individual overtopping wave (in gray color). Stage (c–e) shows the interaction between the initial reflected overtopping wave (in grey color) and the following incident overtopping wave (in white color). In Stage (d–d), the piling-up of the following incident wave on the top of the reflected wave can result in a violent impact on a high vertical position on the wall. In Figure 3b, the schematic sketch of the time series signal of an overtopping wave impact including Stage (a–c) is illustrated with a marked dynamic impact peak in Stage (a–a) and the maximum quasi-static force peaks in Stage (b–b) or (c–c). During the initial impact Stage (a–a), the overtopping wave front changes its direction suddenly and results in a sharp dynamic impact peak with a large magnitude and short duration. During the stages of deflection (b–b) or reflection (c–c), the maximum quasi-static force peak is formed with a relative lower magnitude and longer duration, which is governed by gravity. When the maximum quasi-static peak occurs, the instant pressures along the wall are almost linearly distributed [10].
Chen et al. [7] stated that the magnitudes of the dynamic force peak and the quasi-static force peak of a single overtopping wave impact do not show any obvious differences and the significance of the quasi-static force peak on the stability of building on a dike. Thus, the maximum quasi-static force peak () is selected as the overtopping impact load on the building. However, a violent impact can be expected if the interaction of multiple overtopping waves occurs in front of the wall [8]. The dynamic peak of the violent impact with a short duration (0.01–0.1 s) could influence local structural elements with a high natural frequency [7,8]. Thus, when considering the local structural element with a high natural frequency such as windows, the dynamic force () can be considered as the overtopping impact load determined by using amplified by a factor ,
It is suggested that the minimum value of is 2.5 [11], though this depends on the structure’s properties.
2.2.2. Expected Maximum Overtopping Wave Load
Due to a lack of relevant records for overtopping wave load on real buildings and systematic knowledge [2], a model to predict the extreme overtopping wave load during a single storm is required. Chen et al. [8] conducted a series of experimental model tests by using random waves. The impact loads of overtopping waves were measured by load cells with the inclusion of the violent impact influenced by the interaction of overtopping waves. The maximum value of and of each overtopping event was used for determining the maximum impact load during a storm peak. Based on the results, the authors proposed an empirical Generalized Pareto (GP) distribution to estimate the maximum impact load of overtopping waves () during a storm peak, shown as:
where is the threshold of GP distribution (N/m); is the scale parameter of GP distribution (N/m); k is the dimensionless shape parameter of GP distribution (-). is the overtopping wave impact probability (-), and is the probability of the maximum overtopping wave impact load (-). Details of the definition and determination of each parameter in Equation (2) are shown in Appendix C.
Based on the quasi-static nature of the maximum overtopping wave load , we define an equivalent overtopping runup height (, see Figure 3a) along the wall of the building as:
where is the density of the water (kg/m). When considering the real dynamic force executing on a local structural or a non-structural element with high natural frequency, we multiply by the factor as the dynamic load on local structural elements in this study. In the future, a model for concerning different types of structural materials is needed. The empirical formula is obtained from the scaled experimental model tests. The scale effect of the model tests can be neglected since is quasi-static, following the Froude scaling law.
3. Vulnerability of Buildings Caused by Overtopping Waves
In this section, the relevant failure mechanisms of buildings on a coastal dike and the corresponding limit states are defined for a masonry building and its components. An approach for assessing the vulnerability of buildings caused by overtopping waves is developed. The partial factor method, as described in Eurocode 6, is used to derive design values of load and strength and a comparison with the ultimate limit state.
3.1. Failure Mechanisms of Buildings
For the buildings on the coastal dikes, the most relevant failures due to the overtopping load are structural collapse and localized damage of elements of the building. Figure 4 shows a fault tree for the collapse failure mode. The collapse can be caused by either the loss of the support of the foundation of the building (losing stability) or the failure of a key structural element (low strength). Failure of the foundation can be caused by the loss of the bearing capacity of the subsoil. This undermining of the subsoil can be induced by scour around the foundation due to fast overtopping flow or the failure of the dike itself. Other sources may cause the foundation to lose its stability. For example, the incident overtopping wave may infiltrate in the dike. This phenomenon may increase the uplift pressure and eventually undermine the stability of the foundation. Considering the short duration of the impact of the overtopping wave on the dike comparing to the infiltration process, this undermining process can be neglected [12]. The failure of a key structural element is directly related to the lateral action from overtopping waves. Key structural elements of a building are load-bearing walls, columns and stability walls. The failure of these elements will lead to the collapse of the whole building. These structural elements are normally designed to be strong enough to withstand external loads, such as the wind load.
A large overtopping wave is expected to destroy the bearing wall or column when its impact load is beyond the strength of the structure. The collapse of the building is likely to cause loss of life if people are present. In this study, we only take into account the failure caused by the direct impact action of overtopping waves on the building (i.e., the solid lines of Figure 4).
The local damage of the building is identified as a kind of failure that does not lead to collapse. It may include the failure of windows, doors and the facade walls (non-load bearing wall). The failure of windows and doors is due to the lower strength of the elements and their connections compared to load they are subjected to, whereas the failure of a non-structural wall is similar to that of the key structural walls by either shear failure or bending failure. The local damage of the building will create openings in the facade, and the inside of the building will be exposed to the overtopping water.
3.2. Failure of the External Wall
3.2.1. Equivalent Static Load
The impact load from overtopping waves is assumed to be an accidental load. It is for a design situation that is defined as having a low probability of occurring during the working life of the structure. An additional assumption is that the dike will not breach or become unstable during the overtopping event. A rough estimation of the occurrence of wall failure under bending is made by assuming the average hydraulic pressure is approximately equal to the characteristic uniform distributed load for the failure state [13]. Figure 5 shows the illustrations of different loads applied to a wall. Figure 5a shows the characteristic uniform distributed load applied to the wall panels on the ground floor, which is typically designed for wind load. Figure 5b shows hydro-static pressures applied to the wall when . is the equivalent overtopping runup height on the wall (m), as defined in Equation (3), and h is the floor height (m). The maximum hydro-static pressure (KN/m), minimum hydro-static pressure (KN/m) and the average pressure (KN/m) are shown in Equations (4)–(6). When , , the equivalent average hydro-static pressure over the entire wall plate is expressed as shown in Equation (6). Therefore, the average pressure of a wall plate can be used to replace as the characteristic lateral load of a wall when it withstands hydraulic load.
3.2.2. Limit State Function
Masonry and concrete buildings are two common types of buildings. The first material is often used in older and historical buildings and the non-load bearing walls of some modern concrete buildings. Concrete is mainly used for high-rise modern buildings. On the coastal dikes in Belgium, most buildings are low and medium rise masonry buildings that were constructed 50–100 years ago. In this study, we focus on the masonry type buildings with the seaward external wall panel of the ground floor being the key structural wall (load bearing wall or stability wall). The presented approach could also be applied to concrete buildings.
From the fault tree shown in Figure 4, the failure of this type of external wall will lead to the collapse mode of the building. If the external wall is a non-structural wall, the failure of this wall may lead to local damage. The failure of a masonry external wall (including both the key structural and non-structural walls) consists of two basic failure modes: bending failure and shear failure when subjected to lateral overtopping wave loads. Since masonry is weak in tension, only the bending failure is considered in the current study. When designing masonry walls to resist lateral actions, the shear strength of the walls needs to be checked when the lateral resistance is large enough to withstand the design bending moment of the applied load.
The bending failure of a masonry wall panel takes into account the conditions of the vertical and horizontal supports from the floors and internal walls. The limit state function of the bending failure of a masonry wall G is expressed as:
where is the lateral resistance capacity and is the design moment of the lateral load. When , the wall panel status will be referred to the bending failure. The subscripts “S” and “R” indicate the design load and the resistance respectively in the following sections.
3.2.3. Design Moment of the Lateral Load
The design moment of the overtopping wave can be conservatively determined by assuming the load is uniformly distributed over the entire wall panel by using the design moment in Eurocode 6 [14]. The design moment, , for a uniform distributed load over an entire wall panel:
where is the safety factor for the load (load factor) (-), which is recommended to take the value of 1.0 in the accidental design situations in EN 1990 Annex A; is a bending moment coefficient, which depends on the orthogonal strength ratio , the support edge condition of the panels and the height to length ratio of the panels, ; and l is the distance between the two vertical supports of the wall panel.
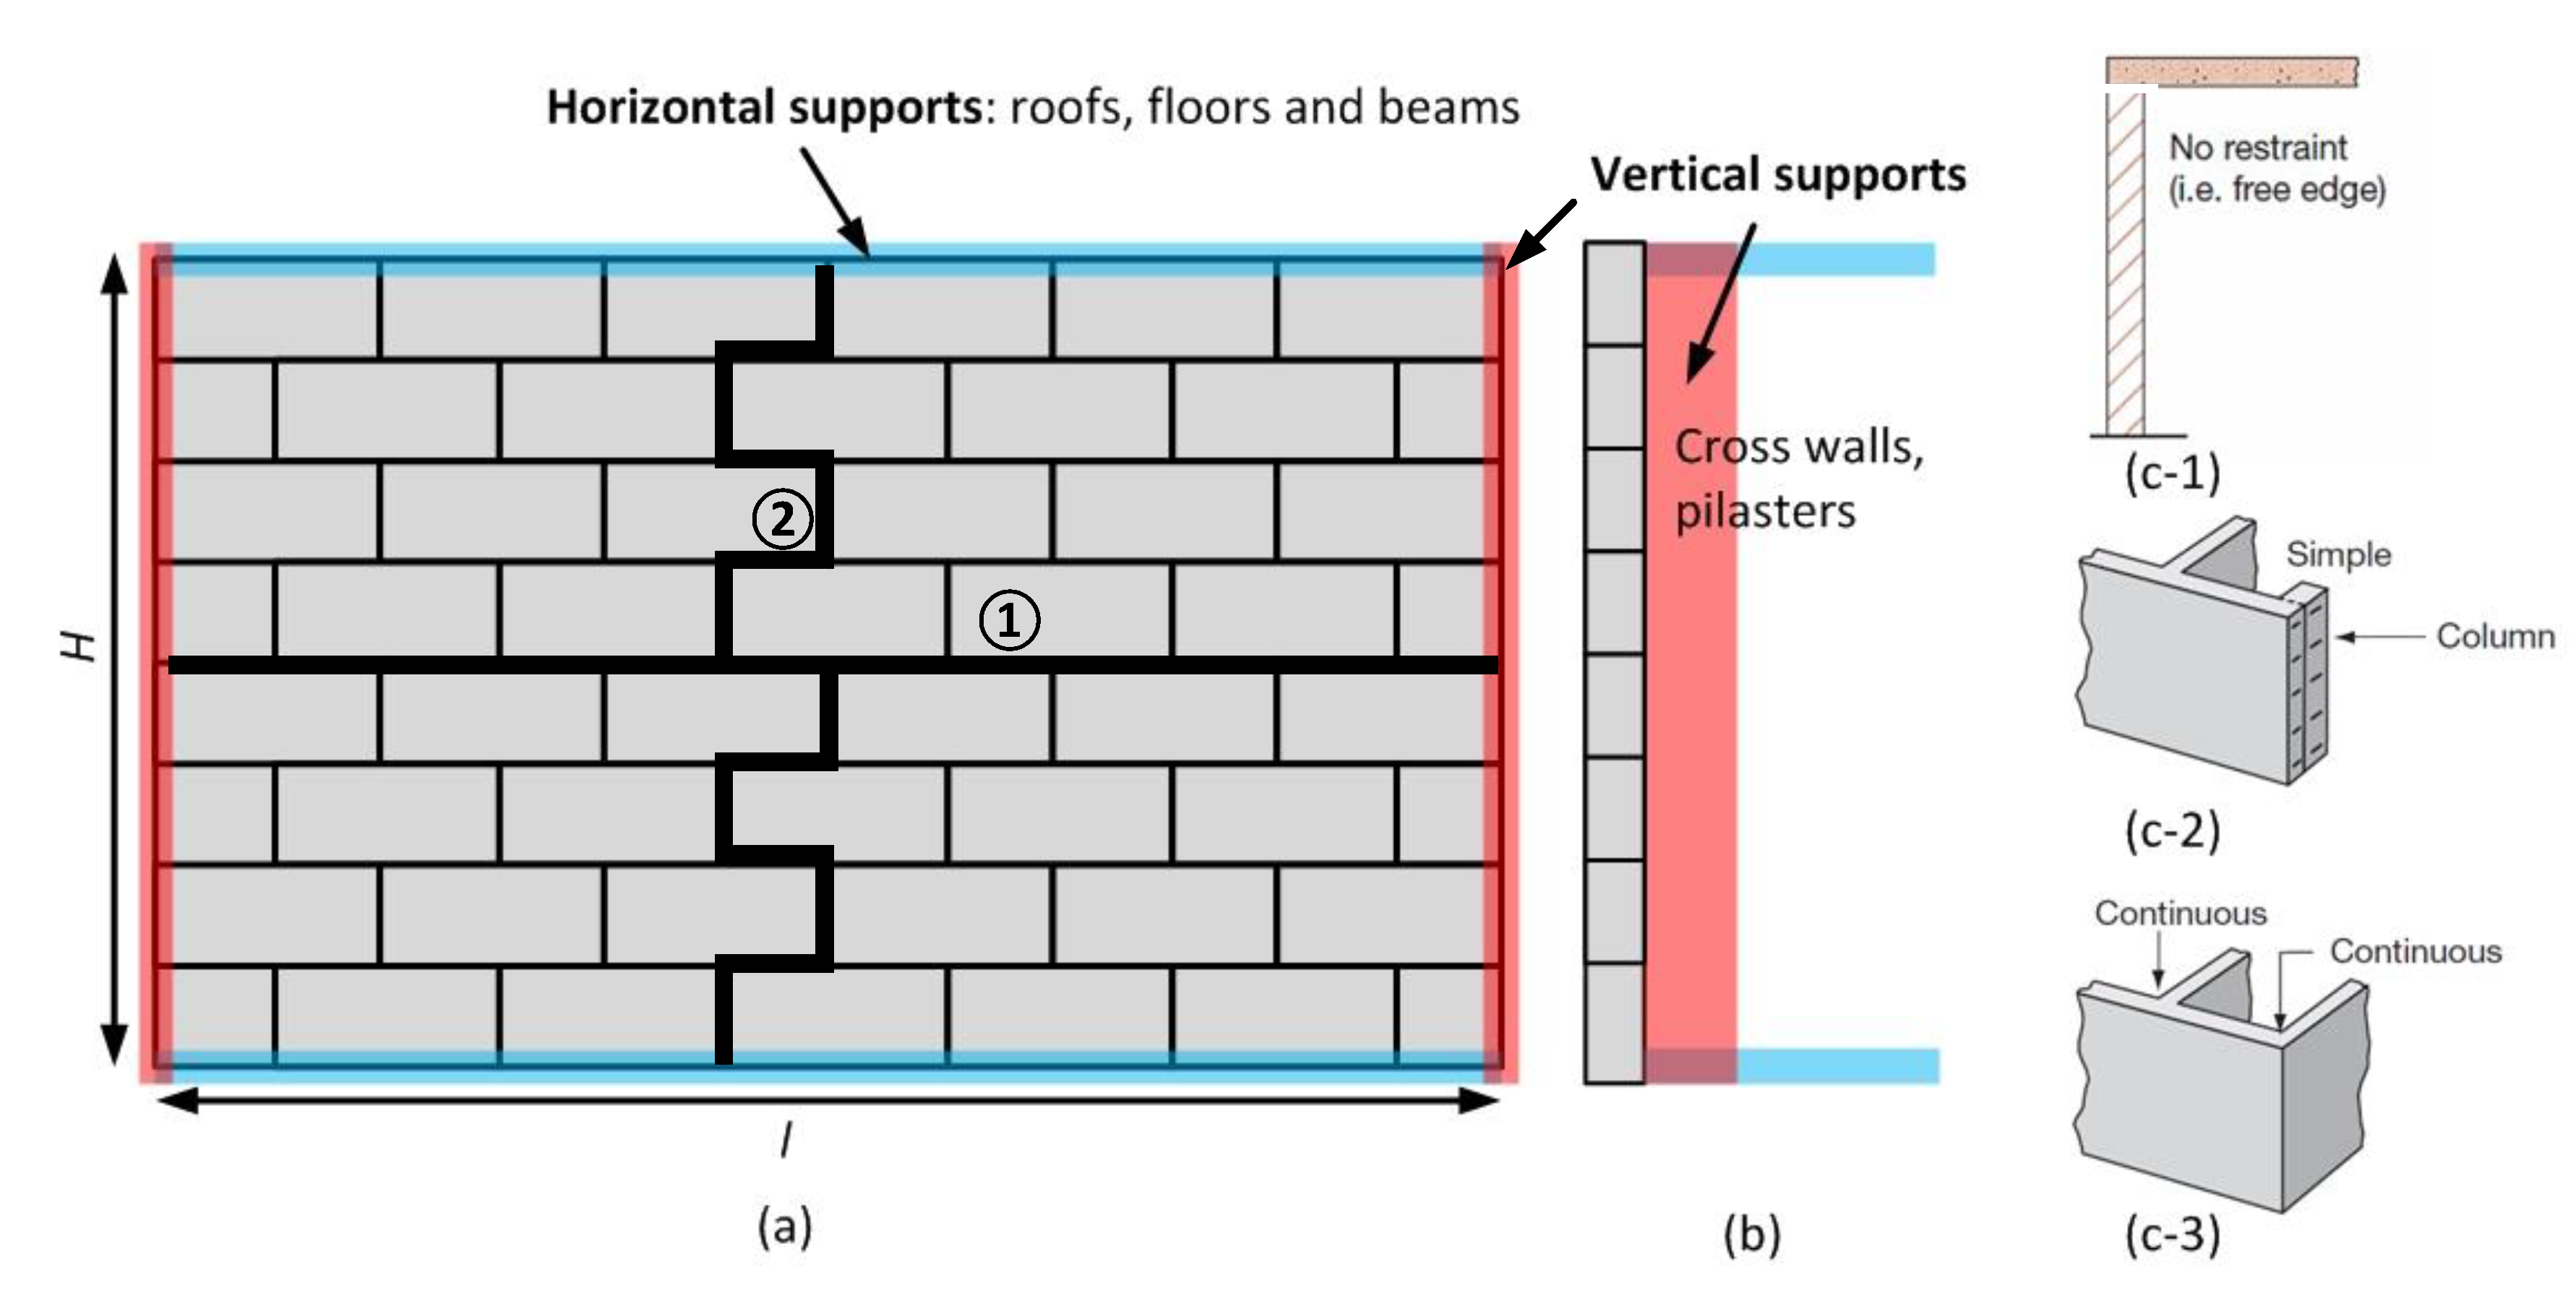
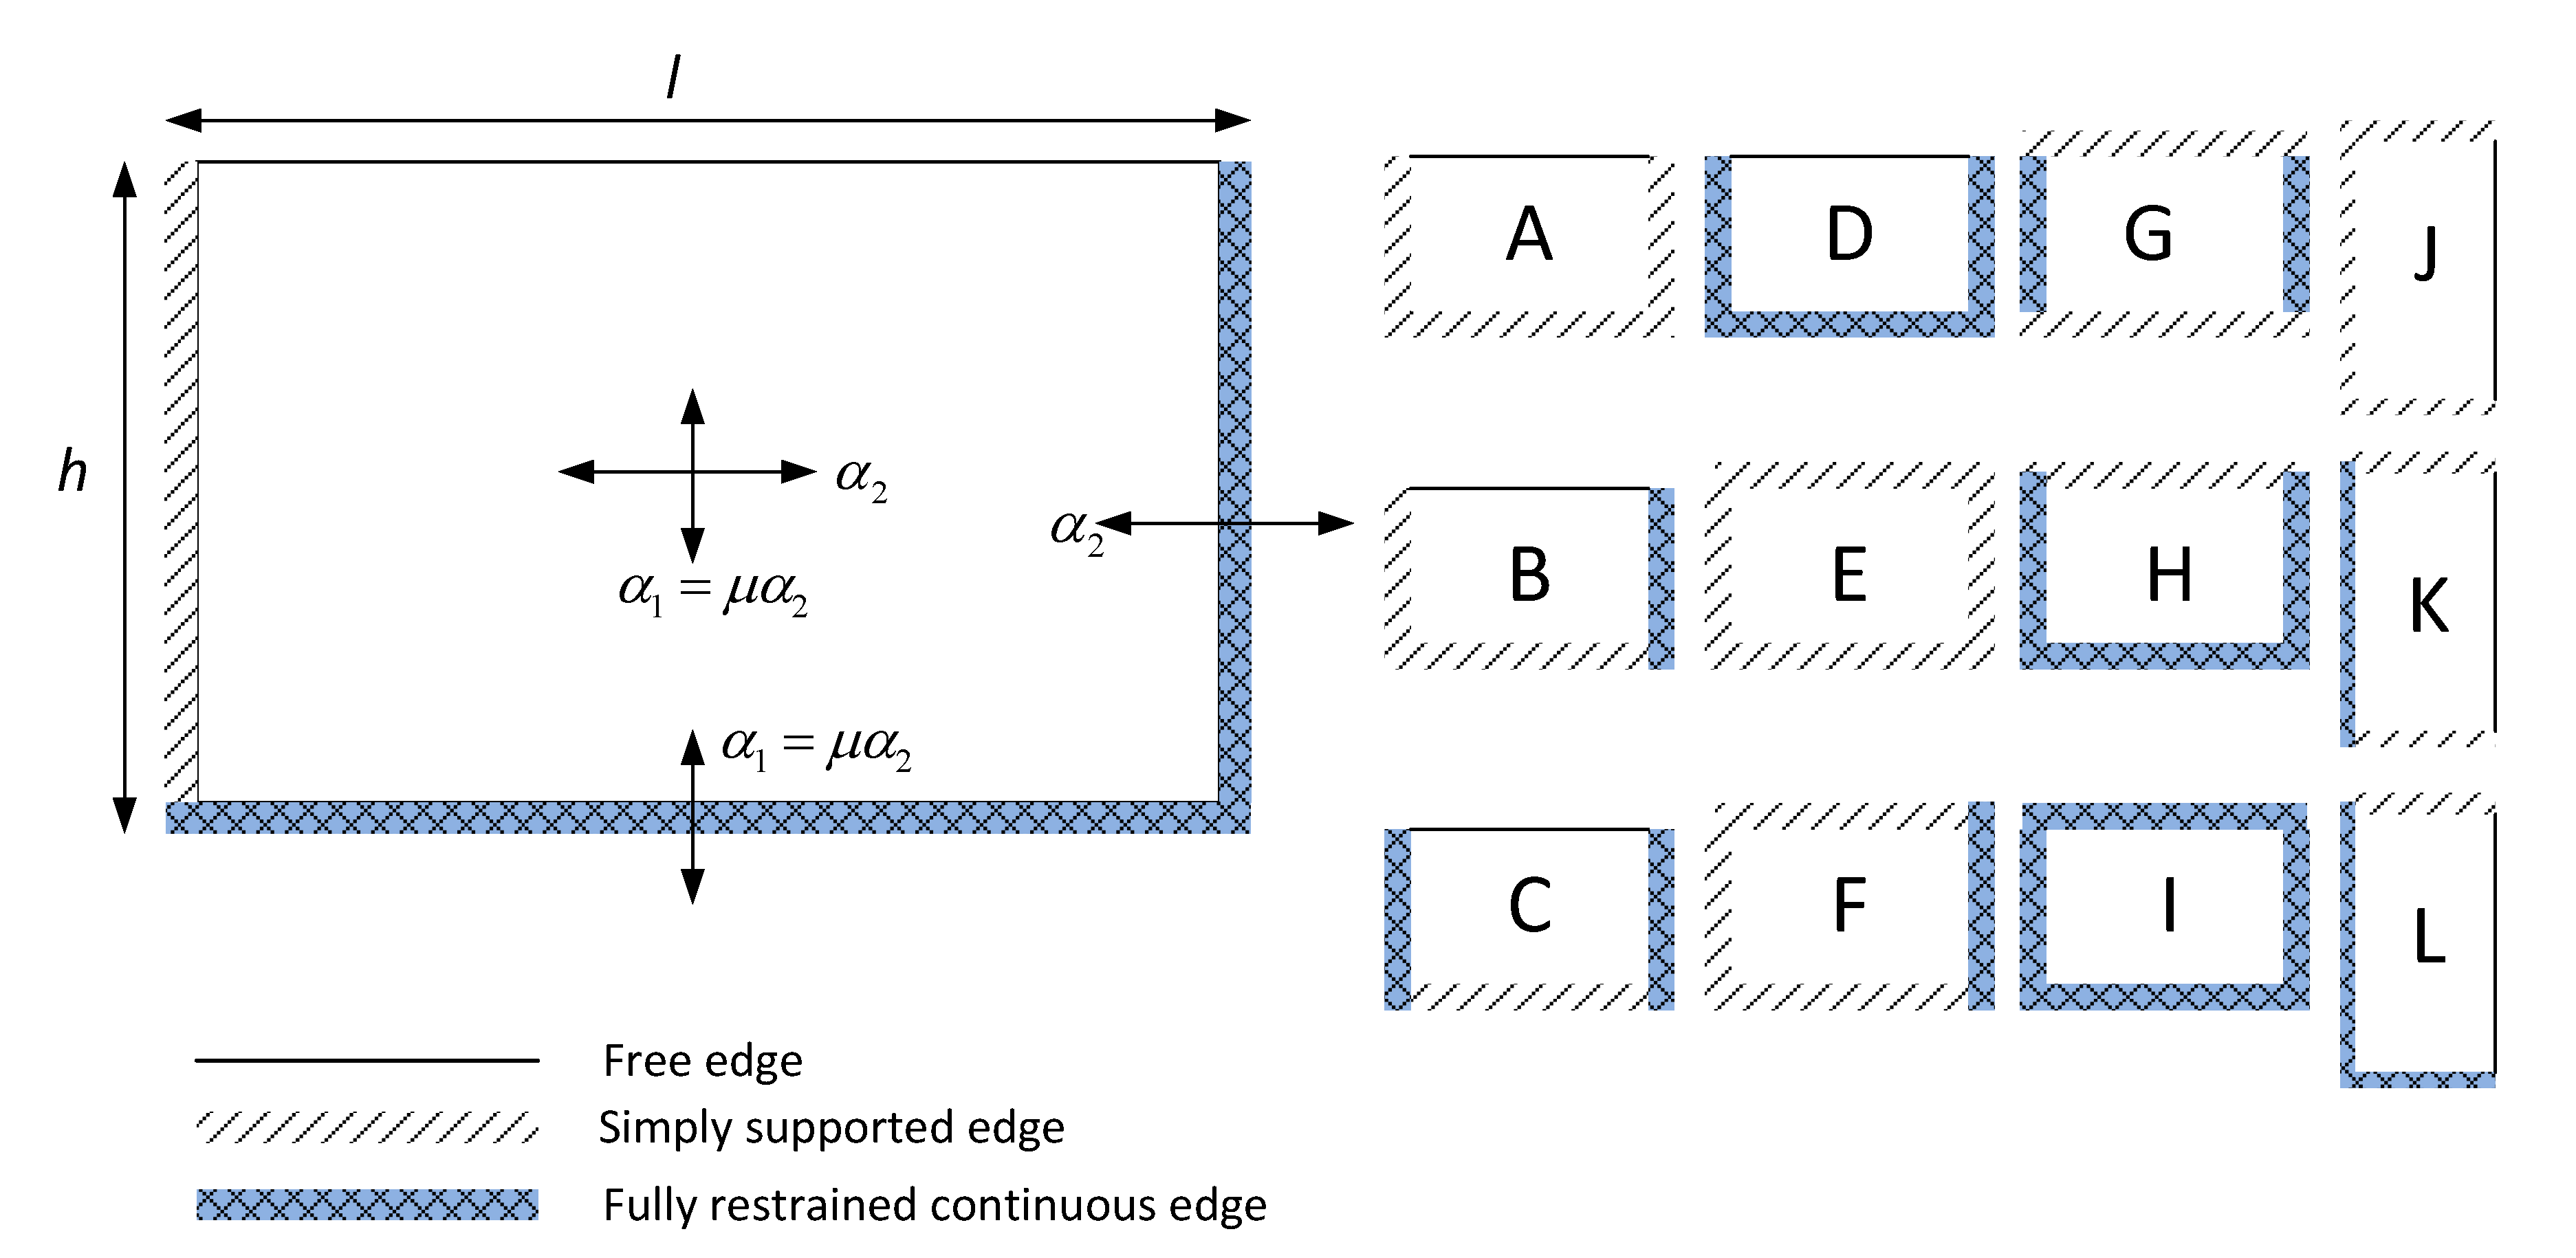
The bending coefficient perpendicular to the bed joints is written as , and that parallel to the bed joints is written as (); see Figure 19 in Appendix A. The orthogonal strength ratio depends on the unit and the mortar used, which takes into consideration the special characteristics of non-isotropy. The supports include the horizontal supports (e.g., floors, roofs, footings, beams) and vertical supports (cross walls, pilasters); see Figure 6a,b. Walls can be designed as one-way spanning considering only two edge conditions for simplicity, or two-way spanning walls considering the four edge conditions. The edge condition and the rigidity of the masonry wall determine the lateral resistance of the wall panel. There are three types of simplified edge conditions: free edge, simply supported edge and fully-restrained continuous edge. The examples of these edges are shown in Figure 6c. For a free edge, there is no moment nor shear restraint. For a wall having a simply supported edge, it is often connected to a column or slab with ties. The direct force, shear and possibly moment are limited to the strength of ties. For a fully-continuous restraint edge, the direct force and moment restraint are limited by the flexural strength of masonry. Thus, the restraint developed at each edge of the wall can influence the lateral resistance of the wall panel [15].
3.2.4. Lateral Resistance
The lateral resistance capacity of a masonry wall panel is defined as:
where is the characteristic flexural strength of masonry (N/mm), is the safety factor for material (material factor) (-) and Z is Elastic section modulus of a unit height or length of the wall (mm). For the characteristic flexural strength , it is always expressed as when considering the bending moment about an axis parallel to bed joints; if the bending moment about an axis is perpendicular to the bed joints, is used.
where is the design vertical load (N/mm), which is only considered when the wall panel is designed as a load-bearing wall. The material factor takes into account the material properties and construction method. For evaluating the existing buildings, the value of is suggested to be set as 1.2 [16].
By substituting Equations (8) and (9) into Equation (7), the limit state function of the bending failure G for a masonry wall panel is obtained:
where and are suggested to take the values of 1.2 and 1.0, respectively. When the wall panel reaches its limit state (), the resistant capacity of the characteristic static pressure and overtopping runup height of a wall can be calculated as:
and consequently, the equivalent runup height that the building can withstand () can be determined as:
Since the load factor , the actual applied overtopping wave load equals the design load or . When these values are larger than and , we expect this wall panel to fail. If the wall panel is a key structural element (load bearing wall), collapse failure will occur. Otherwise, localized damage occurs.
3.3. Failure of Windows
Similar to the external wall, the failure of single pane glass windows in the external wall facing the incident overtopping waves is analyzed. Due to the complexity of the glass failure mechanisms, Kelman’s [13] simplified model is applied regarding the window pane as a simply supported thin plate.
3.3.1. Equivalent Static Load
3.3.2. Limit State Function
The limit state function of window is defined as:
where is the applied overtopping load stress on the window. It can be calculated by using the following expression:
where b is the height of the glass pane and is the thickness of the glass pane; is the characteristic uniform distributed load; is the bending coefficient, which depends on the ratio of the length a and height b of the glass pane and the support condition of the four edges; is the thickness of the glass pane. Figure 8 shows an empirically-determined bending coefficient curve for a simply supported thin plate.
The strength value of glass pane with MPa is used as the resistant strength of a window pane, which could be interpreted as approximately a 50% failure probability [13]. Thus, the resistant capacity of the static pressure of the window is defined when :
If the actual subjected overtopping wave load is larger than , we expect this window to fail.
3.4. Steps for Vulnerability Assessment
A summary of the procedure of assessing the vulnerability of buildings on the dike is given in Figure 9. The approach consists of three main steps: determination of hydraulic load conditions, calculation of the overtopping impact load and runup height and evaluation of the structural vulnerability. In this study, only the water level, wave height and period at the toe of the dike in Step 1 are used as input for Step 2. If these conditions at the toe are not available, then extra calculations are needed by using the offshore hydraulic condition in combination with either numerical simulation or empirical determination (see the dashed lines in Figure 9). These extra calculations are not included in the present study.
4. Case Study
In the previous sections, overtopping wave loads and the failure mechanisms of buildings exposed to overtopping waves were introduced. Herein, a case study of a Belgian coastal town, Wenduine, that uses the results from the previous sections is presented.
4.1. Belgian Coastal Dikes
On coastal dikes in Belgium, many residential buildings can be found. Most of the old buildings are masonry structures with two to three floors. The ground floors are often elevated, and the entrances of the basements are closed by shutters (see Figure 10). The more modern buildings are concrete reinforced structures with concrete piles/columns as foundations. The walls can be made of either masonry or concrete. These buildings are normally 5–9 floors high. Some of the ground floors are elevated, and some are used as cafes, restaurants or stores. The ground floors are equipped with large glass windows and doors.
A representative situation for Wenduine, a coastal town in Belgium, is used for the current case study. Figure 11 shows the schematic sketch of a building placed on the top of the coastal dike in Wenduine. The beach level is set at 6.5 m above TAW (Tweede Algemene Waterpassing, which refers to the Belgian standard datum level, situated near MLLWS), which is chosen from the lowest toe position used in the study of [17]. The dike crest level is set at 8.5 m above TAW, and the distance between the building to the seaward slope of the dike (B) is chosen as 10 m in this case study.
Two storm scenarios are considered for this case study, with 1000 and 10,000 year return periods. The storm surge levels are 7.22 m for the 1000-year storm (S1) and 7.65 m for the 10,000-year storm (S2) based on [18]. For S1 and S2, the dike crest level (8.5 m above TAW) and beach level (6.5 m above TAW) are fixed, and the corresponding water depth () and freeboard () are determined. For S3, the same surge level with the 10,000-year return period is used, but the toe of the dike is set as 4 m above TAW, as some cross-sections have a relatively low toe position. The considered wave characteristics are and , where is the mean spectrum significant wave height, and is the spectral wave period, both at the toe of the dike. The hydraulic conditions are shown in Table 1, and the detailed explanation of hydraulic conditions can be found in Appendix B. The applied overtopping wave load (runup height along the wall) on the wall placed at 10 m away from the seaward slope of the dike is also shown in the same table.
4.2. Vulnerability of External Masonry Walls
4.2.1. Reference Masonry Walls
The external wall of the ground floor is simply assumed as a section of the masonry wall. The properties of plain masonry walls selected in this case are selected from Eurocode 6, which are used as the Load-Bearing wall (LB) with a design vertical load of N/mm and the Non-load-Bearing wall (NB) without considering the vertical load. This selection is expected to represent the typical masonry properties in Belgium. The construction materials are clay masonry unit Group 1 with mortar strength class and a water absorption ratio less than 7%. Since the aim of our study is to analyze the vulnerability of the existing buildings, the material factor is set as 1.2, and load factor is set as 1.0.
Due to the large influence of the edge supports on strength, four kinds of edge supports for the masonry wall panel are included in the analysis. Figure 12 shows one non-load bearing wall (1-NB) with support Condition A and three sections of load bearing masonry walls (1-LB) with N/mm with different support conditions (E–I). The dimensions, support conditions, the resistance capacity of the characteristic equivalent static pressure and equivalent overtopping runup height are shown in Table 2. The calculations of and of the masonry walls can be found in Appendix E.
4.2.2. Influence of the Incident Wave Height
An example of the vulnerability of the four masonry walls (see Table 2) exposed to the maximum overtopping wave load under S1 (1000-year condition) with a peak duration of 1 h (see Table 1) is presented.
In Figure 13, the x-axis indicates the mean spectrum wave height at the toe of the dike, and the y-axis is the equivalent overtopping runup height . The four horizontal lines are the resistance capacity expressed by the equivalent overtopping runup height for the wall panels, indicating the limits of the different wall configurations. The three lines with different markers indicate the subjected overtopping wave runup height by using S1, S2 and S3 with varied wave heights rising from 0.8 m–2.5 m. If the horizontal lines lie below the continuous lines, then the building might collapse, and if the horizontal lines lie above the continuous lines, then the masonry wall can withstand the impact loads. For the 1000-year condition with an expected wave height of 0.82 m, no damage to the wall is expected. However, for the 10,000-year condition with the expected wave height of more than 2.1 m, building collapse might be expected for most typical wall configurations.
4.2.3. Influence of the Building Location
Widening the crest of a coastal dike can dissipate the kinetic energy of overtopping waves [3]. Chen et al. [8] proposed an empirical formula for the overtopping wave load that takes into account the variation of the locations of the building on the dike. The vulnerability of the building located at different positions can be investigated using the formulas from Chen et al. [8].
Figure 14 shows the results of the vulnerability analysis of the four walls located at 3–33 m away from the seaward dike slope. The four horizontal dashed lines are the resistance capacity of the equivalent overtopping runup height for the wall panels. The curved solid lines with markers indicate the equivalent overtopping runup heights calculated based on the three scenarios shown in Table 2 with varying B. It can be seen that no wall failure is expected under Condition S1 even if buildings are quite close to the coast. For Condition S2, the overtopping wave load decreases significantly when B is larger than 28 m. Only the non-load bearing wall (1-NB) is expected to break if it is located less than 20 m from the edge of the dike, suggesting that only the local damage of the building would occur, but no collapse.
For the condition of S3, the cross-section of the dike is different from the other two conditions. The beach level at the toe is low (4 m + TAW), which results in a greater water depth in front of the dike. Thus, the wave characteristics change. The wave breaking is not so severe as in shallower conditions; therefore, the incident wave height at the toe of the structure is higher, which would result in more overtopping discharge, and large waves will impact on the building. This would likely result in greater damage for most support conditions.
4.2.4. Influence of the Wall Dimensions
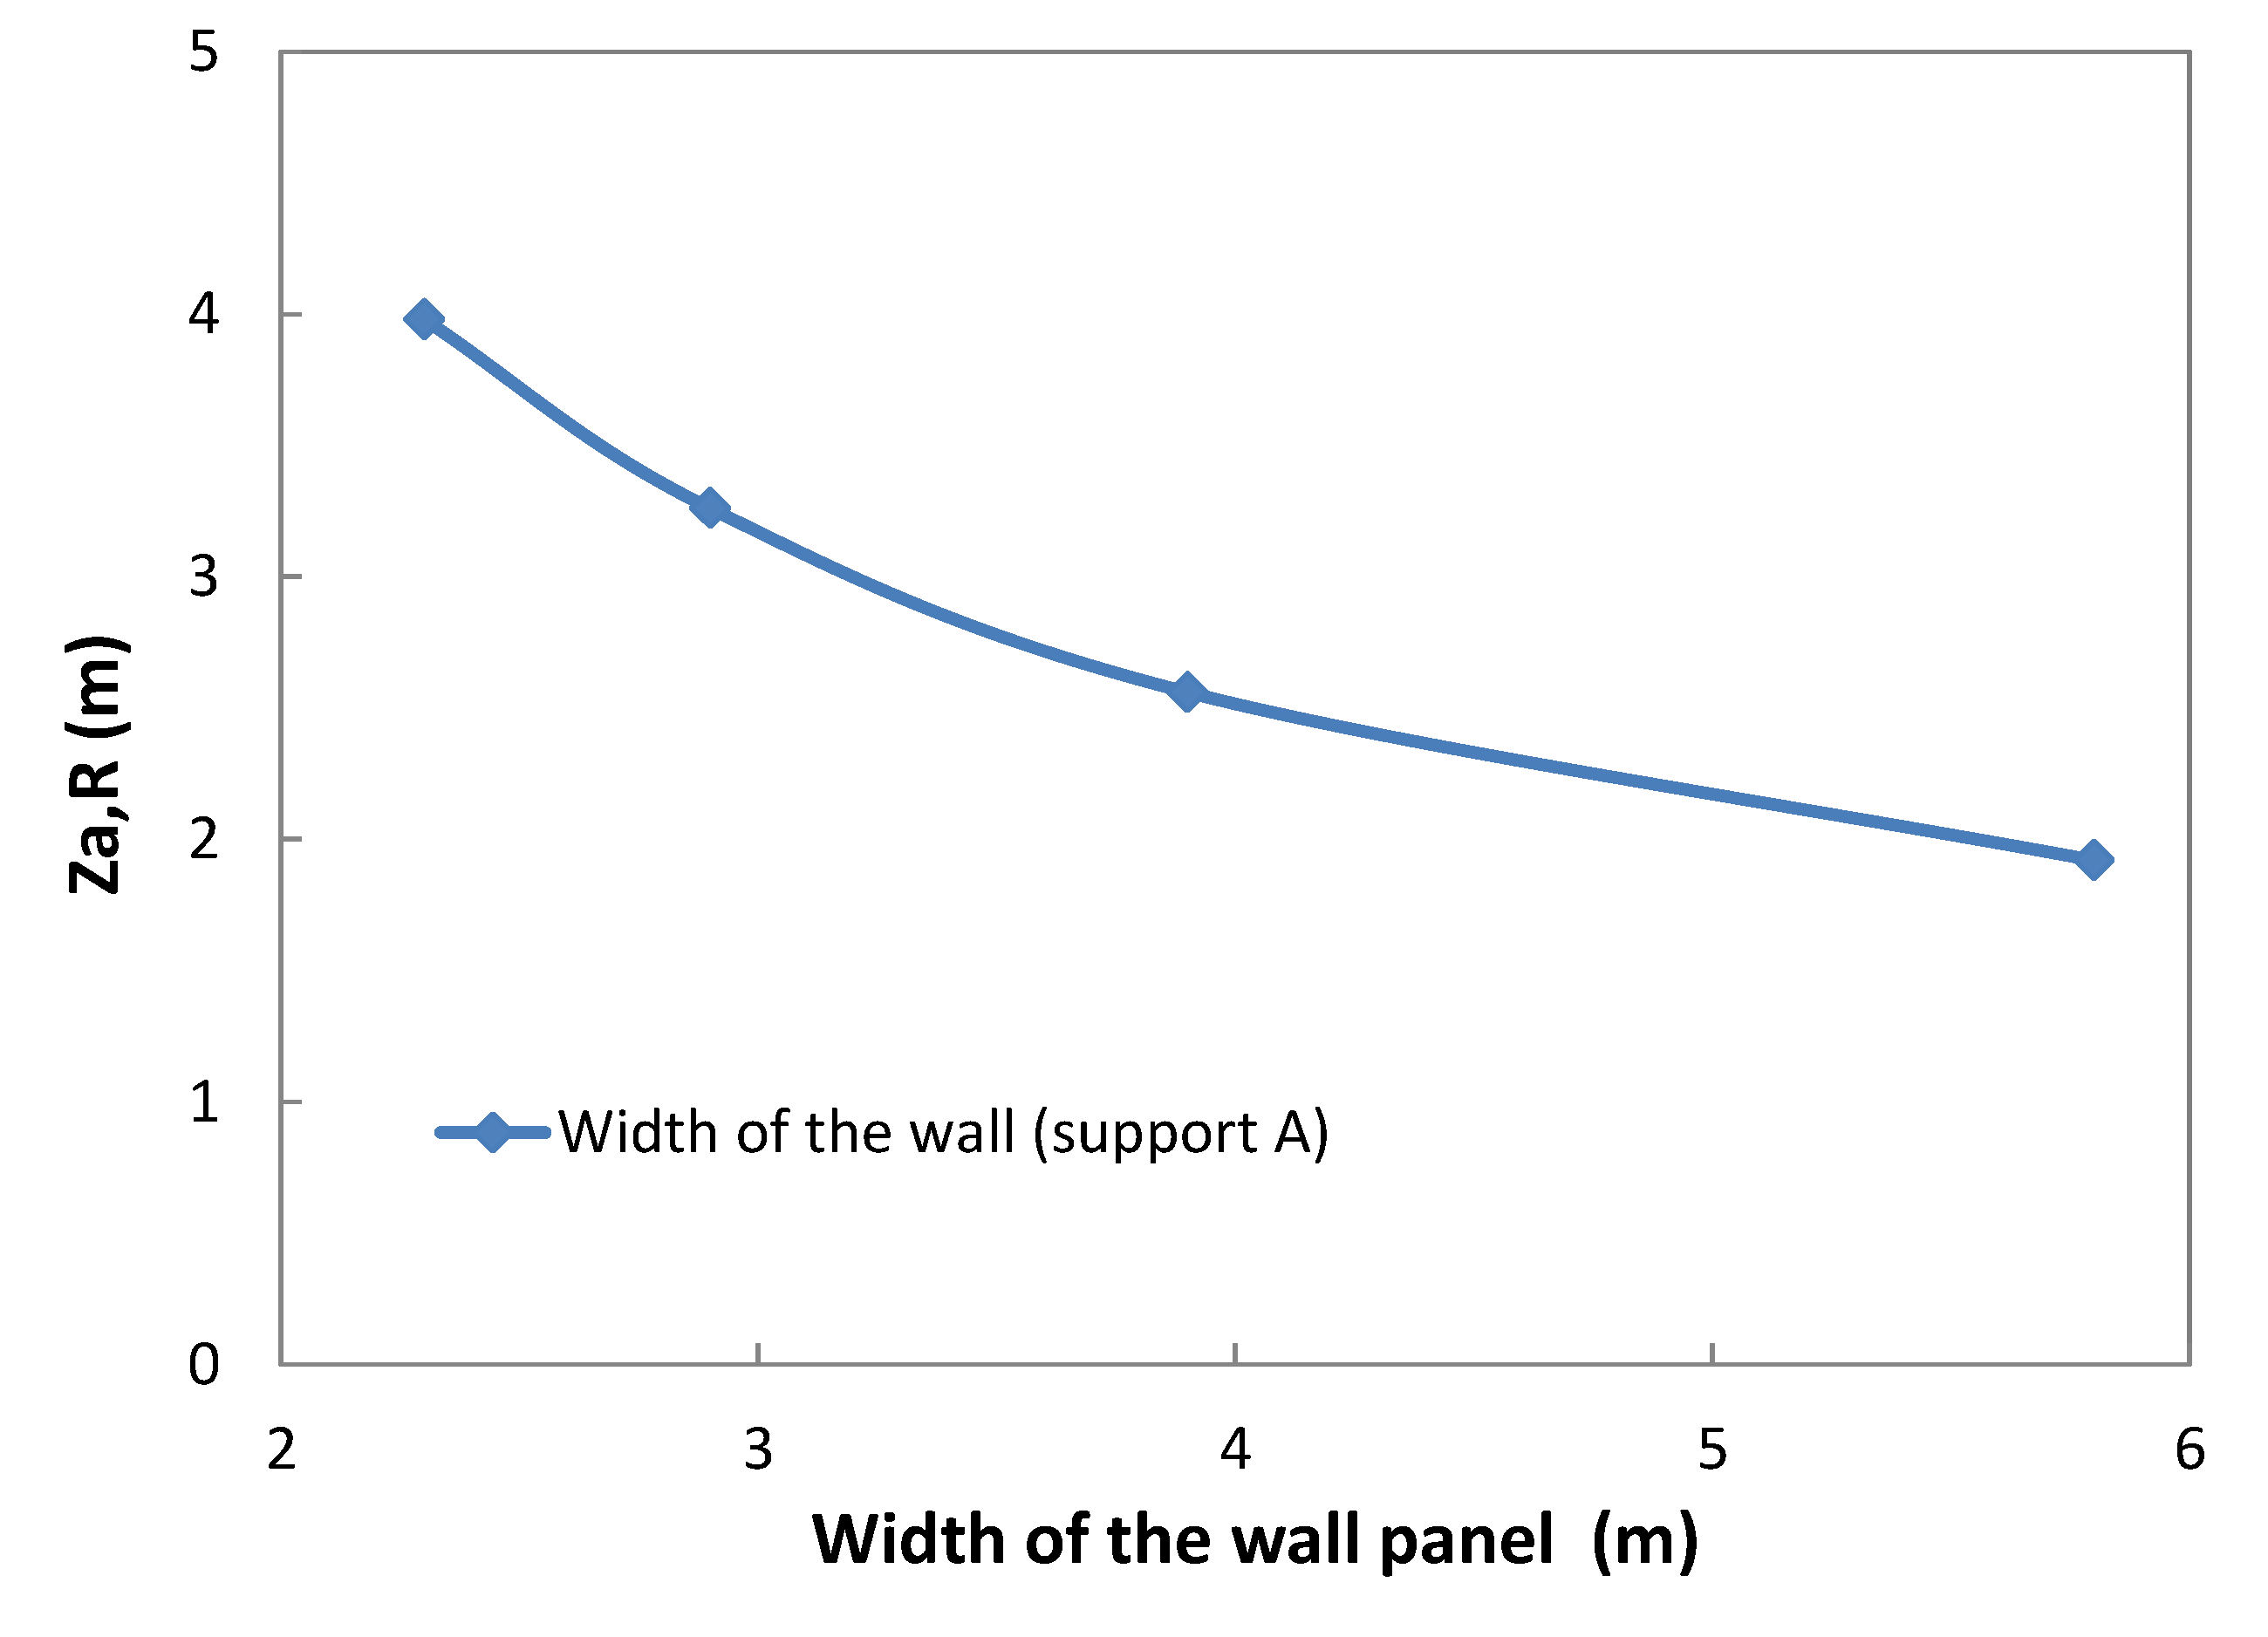
The dimensions of the wall panels can influence the lateral resistance. Figure 15 shows an example of the influence of the width of the wall panel (wall height is fixed at 2.9 m) on the resistance capacity of the equivalent overtopping runup height according to Equation (13). It can be seen that increases with decreasing the masonry wall width. It suggests that the lateral resistance can be increased by designing a smaller wall section.
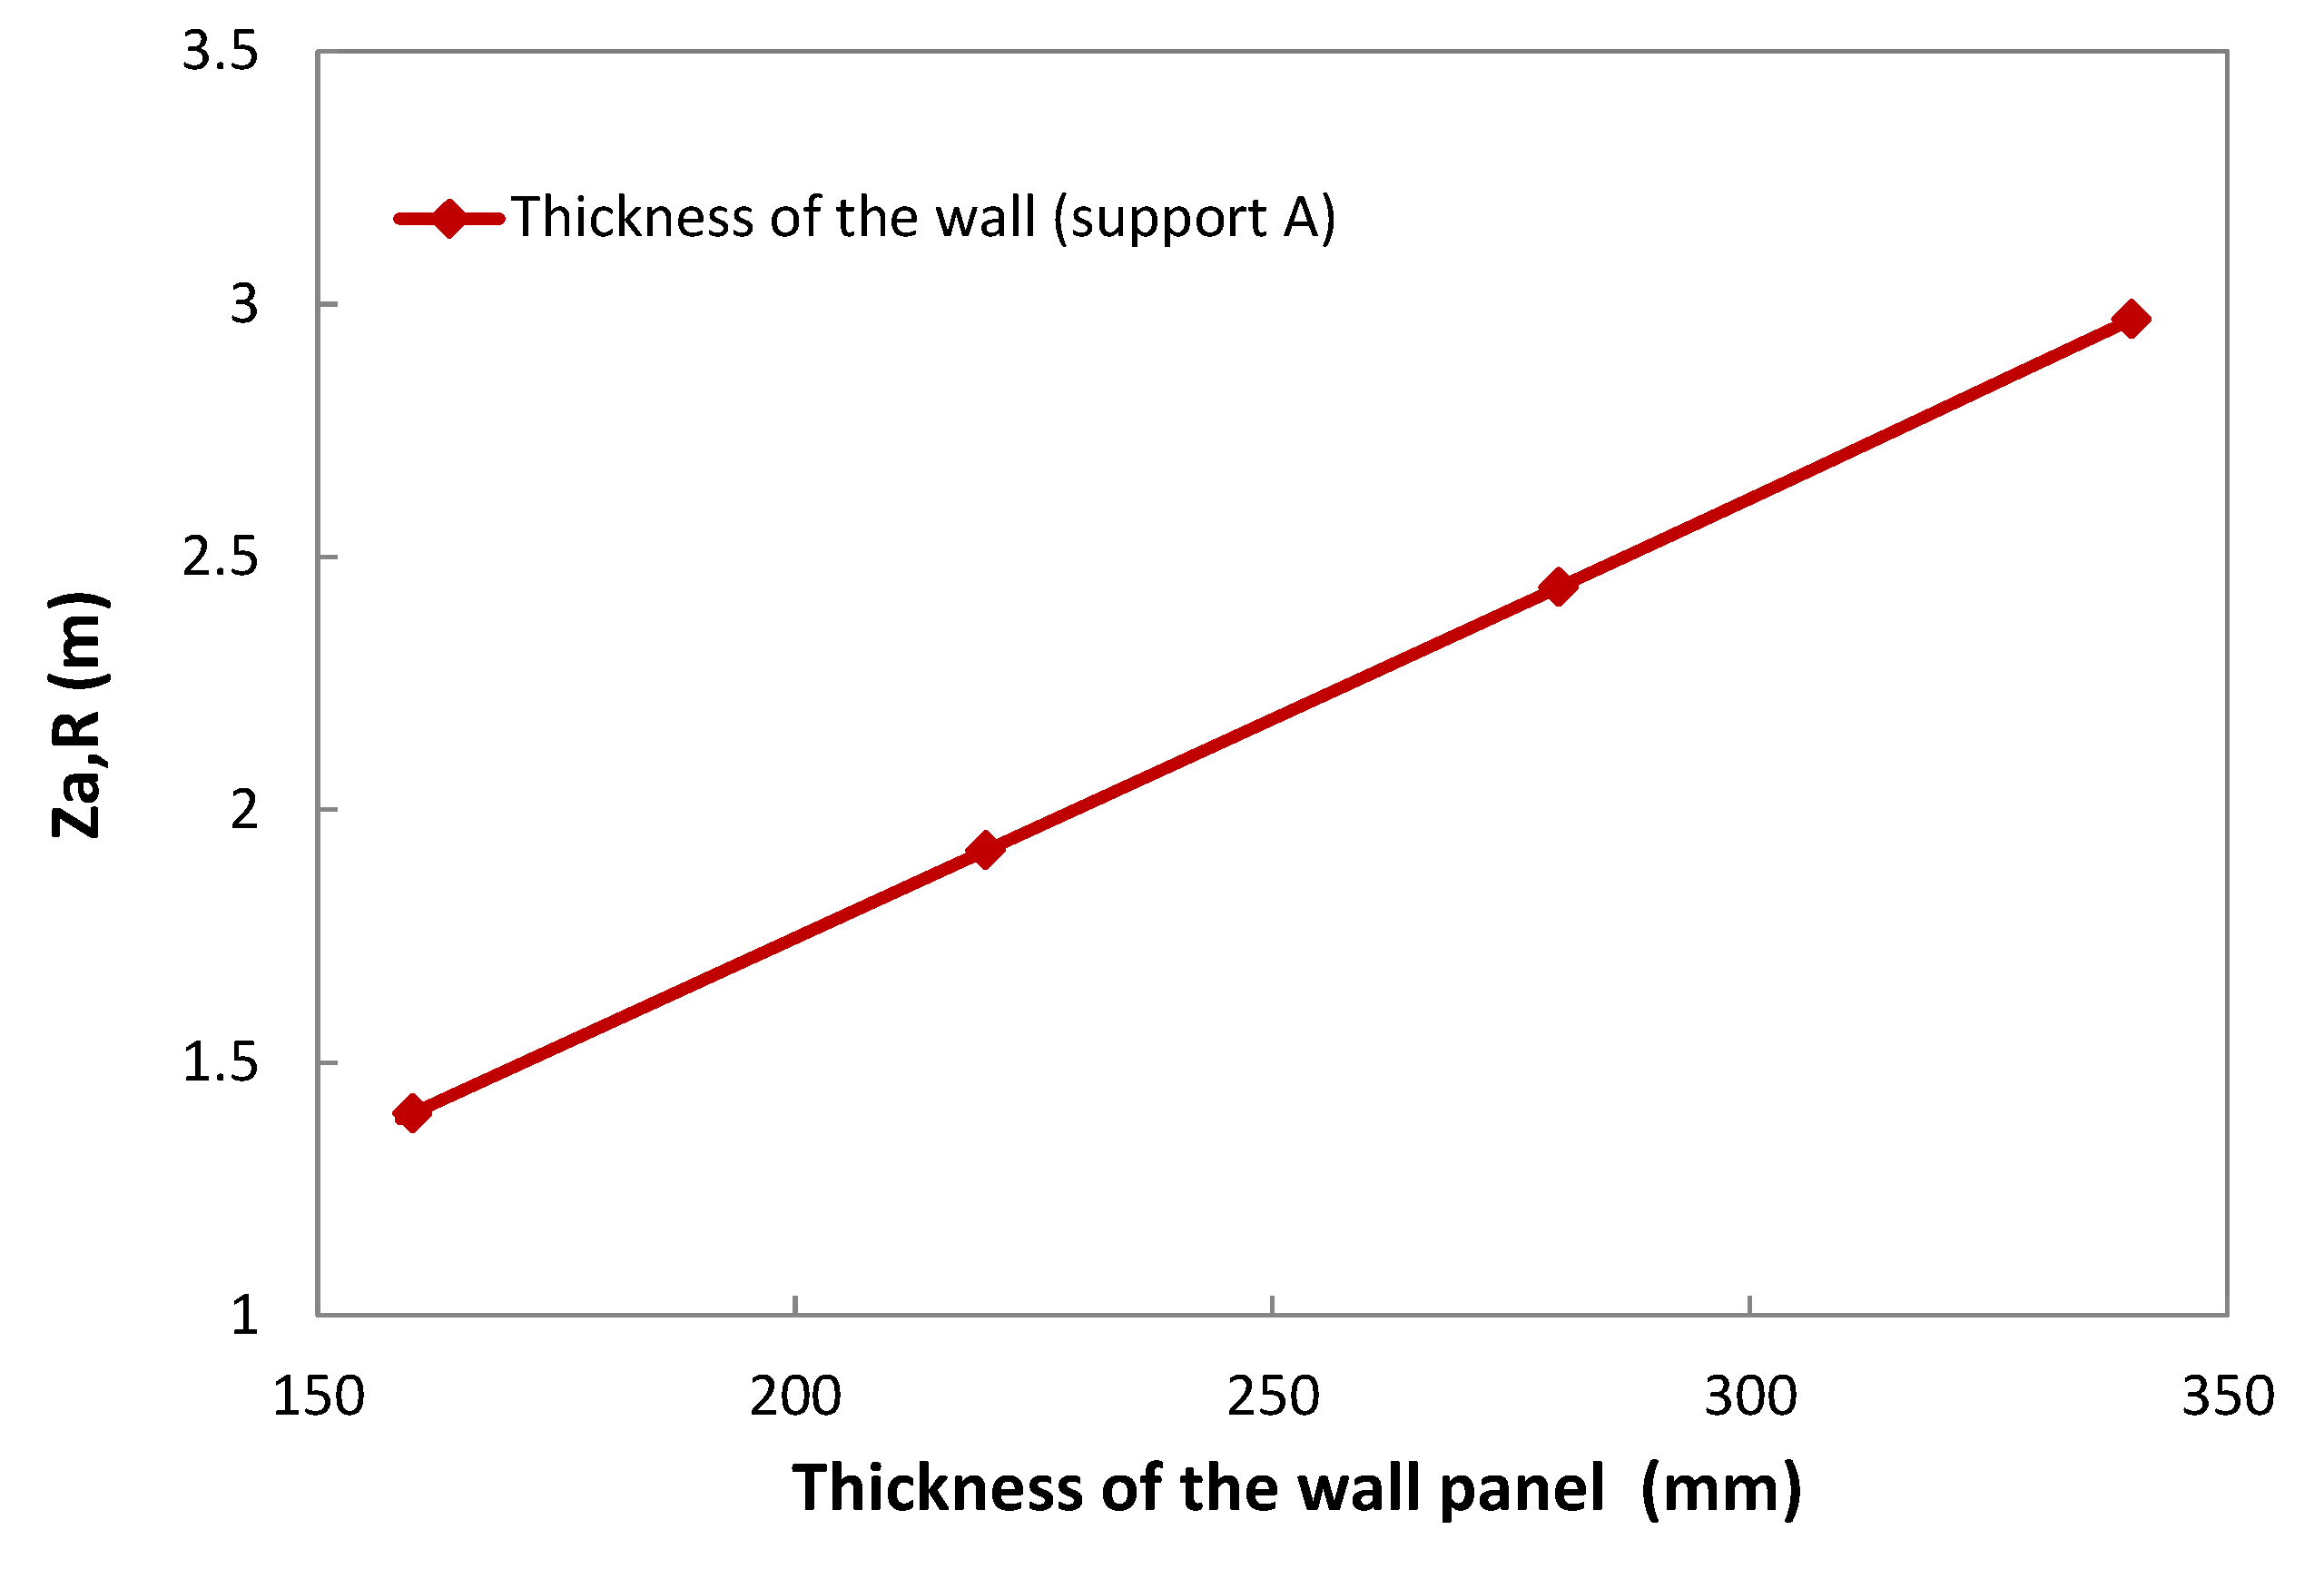
Figure 16 shows another example of the influence of the thickness of the wall panel. The thickness of Wall 1 (see Table 2) is varied. It can be seen that the resistance capacity of the equivalent overtopping runup height increases with increasing the wall thickness, indicating that the lateral resistance can be increased by designing a thick section wall.
4.3. Damage of Windows
The windows are typically located 0–1 m from the ground. The width of the window glass pane is 1–3 m, and the height is 0.5–2 m. Double-glazed window is the common type. The equivalent thickness of double-glazed window is 8 mm. Four window glass panes (WD) with different sizes are analyzed, which are assumed as thin plates with four simply supported edges. The windows with large glass pane are located at the ground floor ( m), with smaller normal glass being located above the ground. Four pieces of window pane are analyzed; see Table 3. The meaning of each parameter can be found in Figure 17.
An example of the vulnerability of the glass window on an external wall under Condition S1 (see Table 2) is provided. The building is located 10 m behind the seawards dike crest ( m). In Figure 18, the x-axis indicates the mean spectrum wave height at the toe of dike, and the y-axis is the equivalent lateral load , based on the calculated (Equation (3)), concerning the dynamic force executing on the window. The damages of the window units WD-1, WD-3 and WD-4 are analyzed. The three solid horizontal lines () in Figure 18 indicate the resistant capacity of each window calculated by using the maximum strength MPa with a failure probability of 50%. The three solid lines with markers () indicate the applied load on the window. For the window WD-1, its resistance capacity, (WD-1), is always below the applied overtopping wave load, (WD-1). This means that the window WD-1 with a maximum strength of 60 MPa will fail during the storm conditions considered; whereas for the window WD-4, its resistance capacity, (WD-4), is always above the applied overtopping wave load, (WD-4) when is greater than about 1.3 m. This means that the window can survive during the considered storm conditions. Comparing the resistance of the two window WD-1 and WD-4, this suggesting that the windows on the external wall would not survive a 1000-year storm. If the size of the window is small, there is no threat from the overtopping wave for the windows located at a certain distance above the ground.
5. Conclusions
The flood risk caused by the direct impact of wave overtopping on coastal buildings is regarded as a highly interesting, but not yet sufficiently well-developed area of research [2]. This paper investigated the vulnerability of buildings placed on a coastal dike and carried out a case study for the Belgian coast.
A method has been developed that takes into account the hydraulic loads, overtopping process, equivalent overtopping wave runup height at the vertical wall and failure mechanisms and strength of the building. From the Belgian case study, the overall results indicate that windows on the ground floor will be broken under a storm with a 1000-year return period. If a 10,000-year storm occurs, the masonry buildings located at less than 20 m away from the seafront will suffer localized damage, such as window breaking and non-load bearing wall failure. If a 10,000-year storm occurs, but the beach level at the toe of the dike is lowered, such as in Condition S3, most of the load-bearing external walls and stability walls are expected to fail when the buildings are located near the coast.
The location of the buildings on the dike is limited by the width of the dike crest. Thus, it is recommended to increase the strength of the external wall on the ground by providing extra supports and to reinforce the windows when designing a building on a dike. If the beach level is lowered, local waves conditions and expected overtopping wave loads will increase, and this could cause the collapse of the building. Thus, beach nourishment is also important for the protection of buildings. In the future, more effort should be put toward understanding the influence of beach profiles on wave overtopping.
It should be noted that this study has been primarily concerned with the existing masonry buildings with material factor . The results can be used to provide suggestions when designing new masonry on the top of the dike, but needs to change. The approach can be extended with a strength model for other structure types, such as concrete buildings.
The assessments in this study are based on semi-probabilistic analysis by using partial safety factors from the Eurocodes. However, since both resistance and strength will have a statistical variation, it is recommended to use a probabilistic approach to predict the likelihood of the failure of buildings on the coast during their lifespan. The question of whether the probability of collapse or localized damage is acceptable has to be answered by the various stakeholders, such as the owner, the government and other people whose life is in some way influenced by possible failures. It should be noted that the impact of sea level rise on sea water levels and wave characteristics was not directly included in the calculations since it will be compensated by beach nourishment as a maintenance process for the coastal safety in Belgium. Therefore, estimated overtopping can stay in a similar range after the sea level rise. Note that estimated damages on the buildings in the present paper do not represent the reality of the current situation since the new sea walls were constructed in Wenduine in 2015. Based on the findings of the case, it is suggested to further evaluate the risk of building collapse and associated risk for people living on the Belgian and Dutch coast.
Acknowledgments
The present work is sponsored by STW-programme on integral and sustainable design of multifunctional flood defences, Project No. 12760, Flanders Hydraulic Research, and the WTI 2017 project (1209437) (Research and development of safety assessment tools of Dutch flood defences), commissioned by the department WVL of Rijkswaterstaat in the Netherlands.
Author Contributions
Xuexue Chen developed the methodological framework with assistance from Sander Pasterkamp, and wrote the paper. Sebastiaan N. Jonkman contributed to the framework and overall paper. Sander Pasterkamp contributed to the determination of partial safety factors of the buildings. Tomohiro Suzuki and Corrado Altomare contributed to the hydraulic boundary conditions for the Belgian case.
Conflicts of Interest
The authors declare no conflict of interest.
Appendix A. Support Conditions of the Wall
Figure A1 shows 12 different wall support conditions used in Eurocode 6 [19]. Some of the conditions were used for the case study.
Figure A1.
Wall support conditions (adapted from Robert and Brooker [19]).
Figure A1.
Wall support conditions (adapted from Robert and Brooker [19]).

Appendix B. Hydraulic Boundary Conditions
The hydraulic boundary conditions of the considered storms shown in Table 1 are determined as follows.
- 1.
- Collection of offshore data:The storm surges with a return period of 1000 and 10,000 years are decided based on Peak-Over-Threshold (POT) selection and extreme value analysis. The data observed from the offshore buoys are determined independently, including representative water level (1925–2014) and wave properties (1984–2014). The measured water levels, wave heights and wave periods were independently analyzed. Based on this analysis, the 1000-year storm was defined in Suzuki et al. [18], and thus, the 1000- and 10,000-year storms used in this study are not based on the joint probabilities method.
- 2.
- Numerical simulation:The wave transformation from offshore to the toe of the dike is estimated by numerical simulations with two different numerical models: SWANand SWASH. The foreshore configuration used in this study was decided based on an eroded profile after the duration of an extreme storm event calculated by DUROSTA(see the details in Verwaest et al. [20]).
- Offshore to nearshore:The collected data from offshore are used as the input hydraulic boundary conditions of SWAN. The wave transformation from offshore to nearshore is calculated until −5 m below the Belgian standard datum level (TAW).
- Nearshore to the toe of dike:The transformation of waves from nearshore (−5 m TAW) is calculated till the toe of the dike. The output of SWAN is used for the input hydraulic boundary condition of SWASH. The outputs of SWASH that are used for the overtopping wave load calculation include: and and wave setup; see the details in Suzuki et al. [21].
Appendix C. Overtopping Wave Load
Appendix C.1. Empirical GP Distribution
This section briefly introduces the procedure of the application of empirical Generalized Pareto (GP) distribution proposed by Chen et al. [8] to estimate the expected maximum overtopping wave load for a certain storm peak duration. Six key parameters need to calculated before : overtopping wave impact probability , maximum overtopping force exceedance probability , characteristic force , empirical threshold , GP distribution scale parameter and shape parameter k.
- (1)
- Calculate the overtopping force impact coefficient :
- (2)
- Calculate the expected maximum overtopping force exceedance probability:
- (3)
- Calculate the characteristic force :where is the 2% wave runup height, which is empirically calculated by using the formula proposed by Van Gent [22] for shallow water environment.
- (4)
- Calculate the empirical threshold :
- (5)
- Calculate the empirical scale parameter :
- (6)
- Calculate the empirical shape parameter k:
- (7)
- Calculate the expected maximum overtopping force and its uncertainty range for a storm peak duration D:
The performance of the empirical GP distribution is evaluated by comparing the calculated with the maximum overtopping force estimated by fitting a GP distribution to experimental data. Details can be found in Chen et al. [8].
Appendix C.2. Example of Overtopping Wave Force
Given:
The 1/10,000 storm with 1 h is used as the design condition in this example to calculate the expected maximum overtopping wave load on a building located 10 m away from the seaward slope of the dike, respectively. The information of the dike geometry parameters and wave conditions is shown below:
Dike geometry parameters:
Dike crest level is 8.5 m above TAW (Belgium reference water level); the seaward dike slope is three; the beach slope in front of the dike is 1:50, m.
Wave conditions at the toe of the dike:
m, s, surge = 7.65 m, water depth at the toe m, freeboard m.
Questions
- Q1
- Wave runup height
- Q2
- Maximum overtopping wave load on the buildings during a one-hour storm surge
- Q3
- Equivalent overtopping wave runup height along the building
Solutions
- A1
- Van Gent [22] investigated the wave runup on the dikes with a shallow foreshore in the front. The results show that the wave period is the best characteristic period for the coastal processes like wave runup and overtopping in shallow water. The empirical formula for with shallow foreshore conditions is shown in Equation (A8) for breaking wave () and non-breaking waves (), and the correspondent coefficients in Equation (A8) are shown in Table A1.Table A1. Coefficients in Equation (25) for wave runup predictions. and and are the correspondent standard deviations (reprinted from [22], ©ASCE).
Wave Energy Spectra Wave Height Wave Period Total: long and short waves 1.45 3.8 0.24 Total: long and short waves 1.35 4.7 0.37 Short waves only 1.45 5.0 0.51 Short waves only 1.55 5.4 0.63 - Determine and p:In this study, total wave energy spectra including long and short waves is applied. Thus, and ; see Table A1. Then, and p can be calculated as:
- Determine :
- Determine :m
- A2
- can be calculated by following the procedure shown in Appendix C.1:
- (1)
- Calculate the overtopping force impact coefficient :
- (2)
- Calculate the expected maximum overtopping force exceedance probability :
- (3)
- Calculate the characteristic force :N/m
- (4)
- Calculate the empirical threshold :N/m
- (5)
- Calculate the empirical scale parameter :N/m
- (6)
- Calculate the empirical shape parameter k:
- (7)
- Calculate the expected maximum overtopping force :Since , can be calculated as:N/m
- A3
- Equivalent overtopping wave runup height can be calculated as:m

Appendix D. Partial Safety Factors
For partial factor method as described in the Eurocode, both the load on and the resistance or strength of a structure are supposed to have a certain statistical variation. Therefore, theoretically, the collapse of a structure is not something that can be predicted with 100% certainty. The only thing that can be predicted is the chance of collapse in the remaining life span. The question of what chance of total or partial collapse is acceptable has to be answered by the various stakeholders, such as the owner, the government and other people whose life is in some way influenced by a possible collapse. Arguments can be social, economic or otherwise, and the content and the weight of each argument can differ in time.
In EN 1990, Annex A-recommended values are given for partial safety factors for the design values of actions in the Ultimate Limit State (ULS). These can be used for the design verification of new buildings. Typical values are 1.1 for permanent loads and 1.5 for variable loads. The partial factors for loads for the ultimate limit states in the accidental design situations are given as 1.0. An accidental design situation is described as a design situation involving exceptional conditions of the structure or its exposure, including fire, explosion, impact or local failure. Recommended values for the material factors are specified in the various materials related parts of the Eurocode, e.g., EN 1996 for masonry.
Steenbergen and Vrouwenvelder [16] have made recommendations for the partial safety factors for existing structures. They argue that it would be uneconomical to require all existing buildings to comply fully with the new codes and corresponding safety levels. They argue for load factors that are lower than those for loads on new buildings based on economic considerations and a shorter design life. The material factors remain unchanged.
What load factors and material factors are used in calculations depends on the type of building, the age, the consequences of collapse and, an importance factor of the building category, the chance of occurrence of the load. According to Vrouwenvelder [23], the difference between a normal variable load and an accidental load is that the variable load is often or nearly always present, although its value may be small for a substantial part of the time. A typical accidental load, on the other hand, will most probably not occur during the working life of the structure. If the load is present, it normally will take only a short time, varying from a few seconds (explosions) to some days (floods). Accidental loads should have a probability of 0.98 per year or more to be zero.
The impact load from overtopping waves is assumed as an accidental loading. This is done under the additional assumption that the collapse of a coastal building does not influence the overall stability of the dike. The acceptability of this assumption will have to be assessed on a project-by-project basis. The partial load factor is taken as 1.0, and the material factor is taken as 1.2.
Appendix E. Example of the Wall Resistance
Given:
The information of the target wall (in Table A2) is using the following criteria:
Construction materials:
Clay masonry unit Group 1, with mortar strength class M= 12 and water absorption ratio less than 7%.
Partial safety factor: , .
Design vertical load: N/mm.
As comparison group, wall Unit 1 with the other three support conditions is also listed in Table A2; the support conditions can be referred to Figure A1.
Table A2.
Wall panel dimensions for analysis.
| Wall Unit | (mm) | h (m) | l (m) | Area (m) | h/l | Support |
|---|---|---|---|---|---|---|
| 1-NB | 220 | 2.9 | 5.8 | 16.82 | 0.5 | A |
| 2-NB | 220 | 2.9 | 3.9 | 11.21 | 0.75 | A |
| 3-NB | 2.9 | 2.9 | 8.41 | 8.41 | 1.0 | A |
| 4-NB | 220 | 2.9 | 2.3 | 6.73 | 1.25 | A |
| 5-NB | 160 | 2.9 | 5.8 | 16.82 | 0.5 | A |
| 6-NB | 280 | 2.9 | 5.8 | 16.82 | 0.5 | A |
| 7-NB | 340 | 2.9 | 5.8 | 16.82 | 0.5 | A |
| 1-LB | 220 | 2.9 | 5.8 | 16.82 | 0.5 | E |
| 1-LB | 220 | 2.9 | 5.8 | 16.82 | 0.5 | G |
| 1-LB | 220 | 2.9 | 5.8 | 16.82 | 0.5 | I |
Solution
The design bending moment per unit length of the wall depends on bending moment coefficient. The bending moment coefficient depends on:
- orthogonal ratio
- aspect ratio
- edge support conditions
- a.
- For clay masonry unit Group 1, with mortar strength class M = 12, water absorption ratio less than 7%:
- Determine :For the clay masonry unit at 220 mm thick, .
- Determine :For the clay masonry unit at 220 mm thick, .
- Orthogonal ratio :.
- b.
- Aspect ratio = ; see Table A2;
- c.
- Support Conditions A, E, G and I:In the Appendix, different wall support conditions and bending coefficient tables are given. By interpolation, with different aspect ratios and correspondent is shown in Table A3.Table A3. Bending coefficient of wall Units 1–4 for analysis.
Wall Unit Support 1-NB A 0.5 0.35 0.064 0.022 2-NB A 0.75 0.35 0.080 0.028 3-NB A 1.0 0.35 0.089 0.031 4-NB A 1.25 0.35 0.095 0.033 1-LB E 0.5 0.35 0.035 0.012 1-LB G 0.5 0.35 0.025 0.009 1-LB I 0.5 0.35 0.017 0.006 - d.
- Maximum resistant momentBased on the previous given information and calculations, N/mm, = 220 mm and the wall N/mm. Then, the design moment can be calculated following Equation (8):
- d-1
- The design resistance moment of wall Unit 1 parallel to the bed joints:KN·m/m
- d-2
- The design resistance moment of wall Unit 1 perpendicular to the bed joints:KN·m/m
- d-3
- Then, the design equivalent load of the correspondent M is:
- When the plane of failure is parallel to the bed joints:KN/m
- When the plane of failure is perpendicular to the bed joints:KN/m
- d-4
- The minimum pair of design failure loads is selected , which means the wall will fail in the direction perpendicular to the bed joints first.
- e.
- Maximum overtopping wave runup height:With the assumption of uniformly distributed over the entire wall plate, the maximum overtopping wave runup height is:m.
Table A4.
Wall panel dimensions for analysis.
| Wall Unit | (mm) | h (m) | l (m) | Area (m) | h/l | Support | (KN/m2) | (m) |
|---|---|---|---|---|---|---|---|---|
| 1-NB | 220 | 2.9 | 5.8 | 16.82 | 0.5 | A | 6.24 | 1.92 |
| 2-NB | 220 | 2.9 | 3.9 | 11.21 | 0.75 | A | 11.04 | 2.56 |
| 3-NB | 2.9 | 2.9 | 2.9 | 8.41 | 1.0 | A | 17.96 | 3.26 |
| 4-NB | 220 | 2.9 | 2.3 | 6.73 | 1.25 | A | 26.75 | 3.97 |
| 5-NB | 160 | 2.9 | 5.8 | 16.82 | 0.5 | A | 3.3 | 1.49 |
| 6-NB | 280 | 2.9 | 5.8 | 16.82 | 0.5 | A | 10.08 | 2.44 |
| 7-NB | 340 | 2.9 | 5.8 | 16.82 | 0.5 | A | 14.92 | 2.97 |
| 1-LB | 220 | 2.9 | 5.8 | 16.82 | 0.5 | E | 11.42 | 2.6 |
| 1-LB | 220 | 2.9 | 5.8 | 16.82 | 0.5 | G | 15.98 | 3.07 |
| 1-LB | 220 | 2.9 | 5.8 | 16.82 | 0.5 | I | 23.51 | 3.73 |
References
- Aerts, J.C.J.H.; Botzen, W.J.W. Flood-resilient waterfront development in New York City: Bridging flood insurance, building codes, and flood zoning. Ann. N. Y. Acad. Sci. 2011, 1227, 1–82. [Google Scholar] [CrossRef] [PubMed]
- Allsop, W.; Bruce, T.; Pullen, T.; Van der Meer, J. Direct hazards from wave overtopping–The forgotten aspect of coastal flood risk assessment? In Proceedings of the 43rd Defra Flood and Coastal Management Conference, Manchester, UK, 1–3 July 2008. [Google Scholar]
- Verwaest, T.; Vanpoucke, P.; Willems, M.; De Mulder, T. Waves overtopping a wide-crested dike. In Proceedings of the 32nd Conference on Coastal Engineering, Shanghai, China, 30 June–5 July 2010. [Google Scholar]
- Nistor, I.; Palermo, D.; Nouri, Y.; Murty, T.; Saatcioglu, M. Chapter 11: Tsunami forces on structures. Handbook of Coastal and Ocean Engineering; World Scientific: Toh Tuck Link, Singapore, 2009; pp. 261–286. [Google Scholar]
- Ramsden, J.D. Forces on a Vertical Wall due to Long Waves, Bores, and Dry-Bed Surges. J. Waterw. Port Coast. Ocean Eng. 1996, 122, 134–141. [Google Scholar] [CrossRef]
- Hatzikyriakou, A.; Lin, N.; Gong, J.; Xian, S.; Hu, X.; Kennedy, A. Component-Based Vulnerability Analysis for Residential Structures Subjected to Storm Surge Impact from Hurricane Sandy. Nat. Hazards Rev. 2015, 17, 05015005. [Google Scholar] [CrossRef]
- Chen, X.; Hofland, B.; Altomare, C.; Suzuki, T.; Uijttewaal, W. Forces on a vertical wall on a dike crest due to overtopping flow. Coast. Eng. 2015, 95, 94–104. [Google Scholar] [CrossRef]
- Chen, X.; Hofland, B.; Uijttewaal, W. Maximum overtopping forces on a dike-mounted wall with a shallow foreshore. Coast. Eng. 2016, 116, 89–102. [Google Scholar] [CrossRef]
- FEMA P-55. Coastal Construction Manual: Principles and Practices of Planning, Siting, Designing, Constructing, and Maintaining Residential Buildings in Coastal Areas (FEMA P-55), 4th ed.; FEMA (Federal Emergency Management Agency): Washington, DC, USA, 2011. [Google Scholar]
- Chen, X.; Hofland, B.; Altomare, C.; Suzuki, T.; Uijttewaal, W. Experimental study on overtopping flow loads. In Proceedings of the 34th International Conference on Coastal Engineering (ICCE 2014), Seoul, Korea, 15–20 June 2014. [Google Scholar]
- Oumeraci, H.; Kortenhaus, A.; Allsop, W.; de Groot, M.; Crouch, R.; Vrijling, H.; Voortman, H. Probabilistic Design Tools for Vertical Breakwaters; CRC Press: Boca Raton, FL, USA, 2001. [Google Scholar]
- Chen, X. Impacts of Overtopping Waves on Buildings on Coastal Dikes; Gildeprint: Enschede, The Netherlands, 2016. [Google Scholar]
- Kelman, I. Physical Flood Vulnerability of Residential Properties in Coastal, Eastern England; University of Cambridge: Cambridge, UK, 2002. [Google Scholar]
- British Standards. BS EN 1996: Eurocode 6- Design of Masonry Structures; British Standard Institution: London, UK, 1996. [Google Scholar]
- Moore, J. Manual for the Design of Plain Masonry in Building Structures to Eurocode 6; Institution of Structural Engineers: London, UK, 2008. [Google Scholar]
- Steenbergen, R.; Vrouwenvelder, A. Safety philosophy for existing structures and partial factors for traffic loads on bridges. Heron 2010, 55, 123–140. [Google Scholar]
- Altomare, C.; Suzuki, T.; Spiesschaert, T.; Verwaest, T.; Mostaert, F. SUSCOD Pilot 1: Wenduine Wave Overtopping Scale Model: Final Report; WL Rapporten, 00-025; Flanders Hydraulics Research: Antwerp, België, 2014. [Google Scholar]
- De Roo, S.; Trouw, K.; Ruiz Parrado, I.; Willems, P.; Suzuki, T.; Verwaest, T.; Mostaert, F. Het Hydraulisch Randvoorwaardenboek 2014: Achtergrondrapport, Versie 4.0; WL Rapporten, 14-014-3; Waterbouwkundig Laboratorium: Antwerp, België, 2016. [Google Scholar]
- Robert, J.; Brooker, O. How to Design Masonry Structures to Eurocode 6: Lateral Resistance; MPA The Concrete Centre: London, UK, 2007. [Google Scholar]
- Verwaest, T.; Vanpoucke, P.; Vanderkimpen, P.; Van der Biest, K.; Reyns, J.; Peeters, P.; Kellens, W.; Vanneuville, W.; Mostaert, F. Overstromingsrisico’s aan de Vlaamse kust. Evaluatie van de zeewering: Deel 1. Methodologie; Waterbouwkundig Laboratorium: Antwerp, België, 2008. [Google Scholar]
- Suzuki, T.; Altomare, C.; Verwaest, T.; Trouw, K.; Zijlema, M. Two-dimensional wave overtopping calculation over a dike in shallow foreshore by swash. In Proceedings of the 34th International Conference on Coastal Engineering, Seoul, Korea, 15–20 June 2014; Volume 1, p. 3. [Google Scholar]
- Van Gent, M.R.A. Wave Runup on Dikes with Shallow Foreshores. J. Waterw. Port Coast. Ocean Eng. 2001, 127, 254–262. [Google Scholar] [CrossRef]
- Vrouwenvelder, A. Eurocode 1, Part 1.7 Accidental Actions, Background Document. In Proceedings of the Ninth International Conference on Structural Safety and Reliability Icossar 05, Rotterdam, The Netherlands, 19–23 June 2005; pp. 3311–3317. [Google Scholar]
Figure 1.
An example of a typical coastal dike with buildings on top in Belgium. The whole process of overtopping wave impacting on the building: ① Wind generates waves far away from shoreline. ② Offshore waves coming into the shallow foreshore area, increasing wave height. Finally, most waves are broken, and the wave energy is dissipated in the form of turbulent bore. ③ Turbulent bore (broken wave) running up on the seaward slope of a dike and overtopping the crest of the dike. ④ Part of the overtopping flow continues propagating along the dike crest and the other part flowing back seaward. ⑤ Overtopping wave impacting on the building eventually (adapted from Chen et al. [7]).

Figure 2.
(a) Horizontal hydro-static load and vertical buoyancy on the building; (b) hydrodynamic load on buildings; (c) horizontal breaking wave impact load on the external wall (adapted from FEMA 2011 [9]).
Figure 2.
(a) Horizontal hydro-static load and vertical buoyancy on the building; (b) hydrodynamic load on buildings; (c) horizontal breaking wave impact load on the external wall (adapted from FEMA 2011 [9]).

Figure 3.
(a) Schematic sketch of overtopping wave impact process; (b) schematic sketch of the time series of the overtopping wave impact load.
Figure 3.
(a) Schematic sketch of overtopping wave impact process; (b) schematic sketch of the time series of the overtopping wave impact load.

Figure 4.
A simple fault tree of the collapse of buildings on a coastal dike.
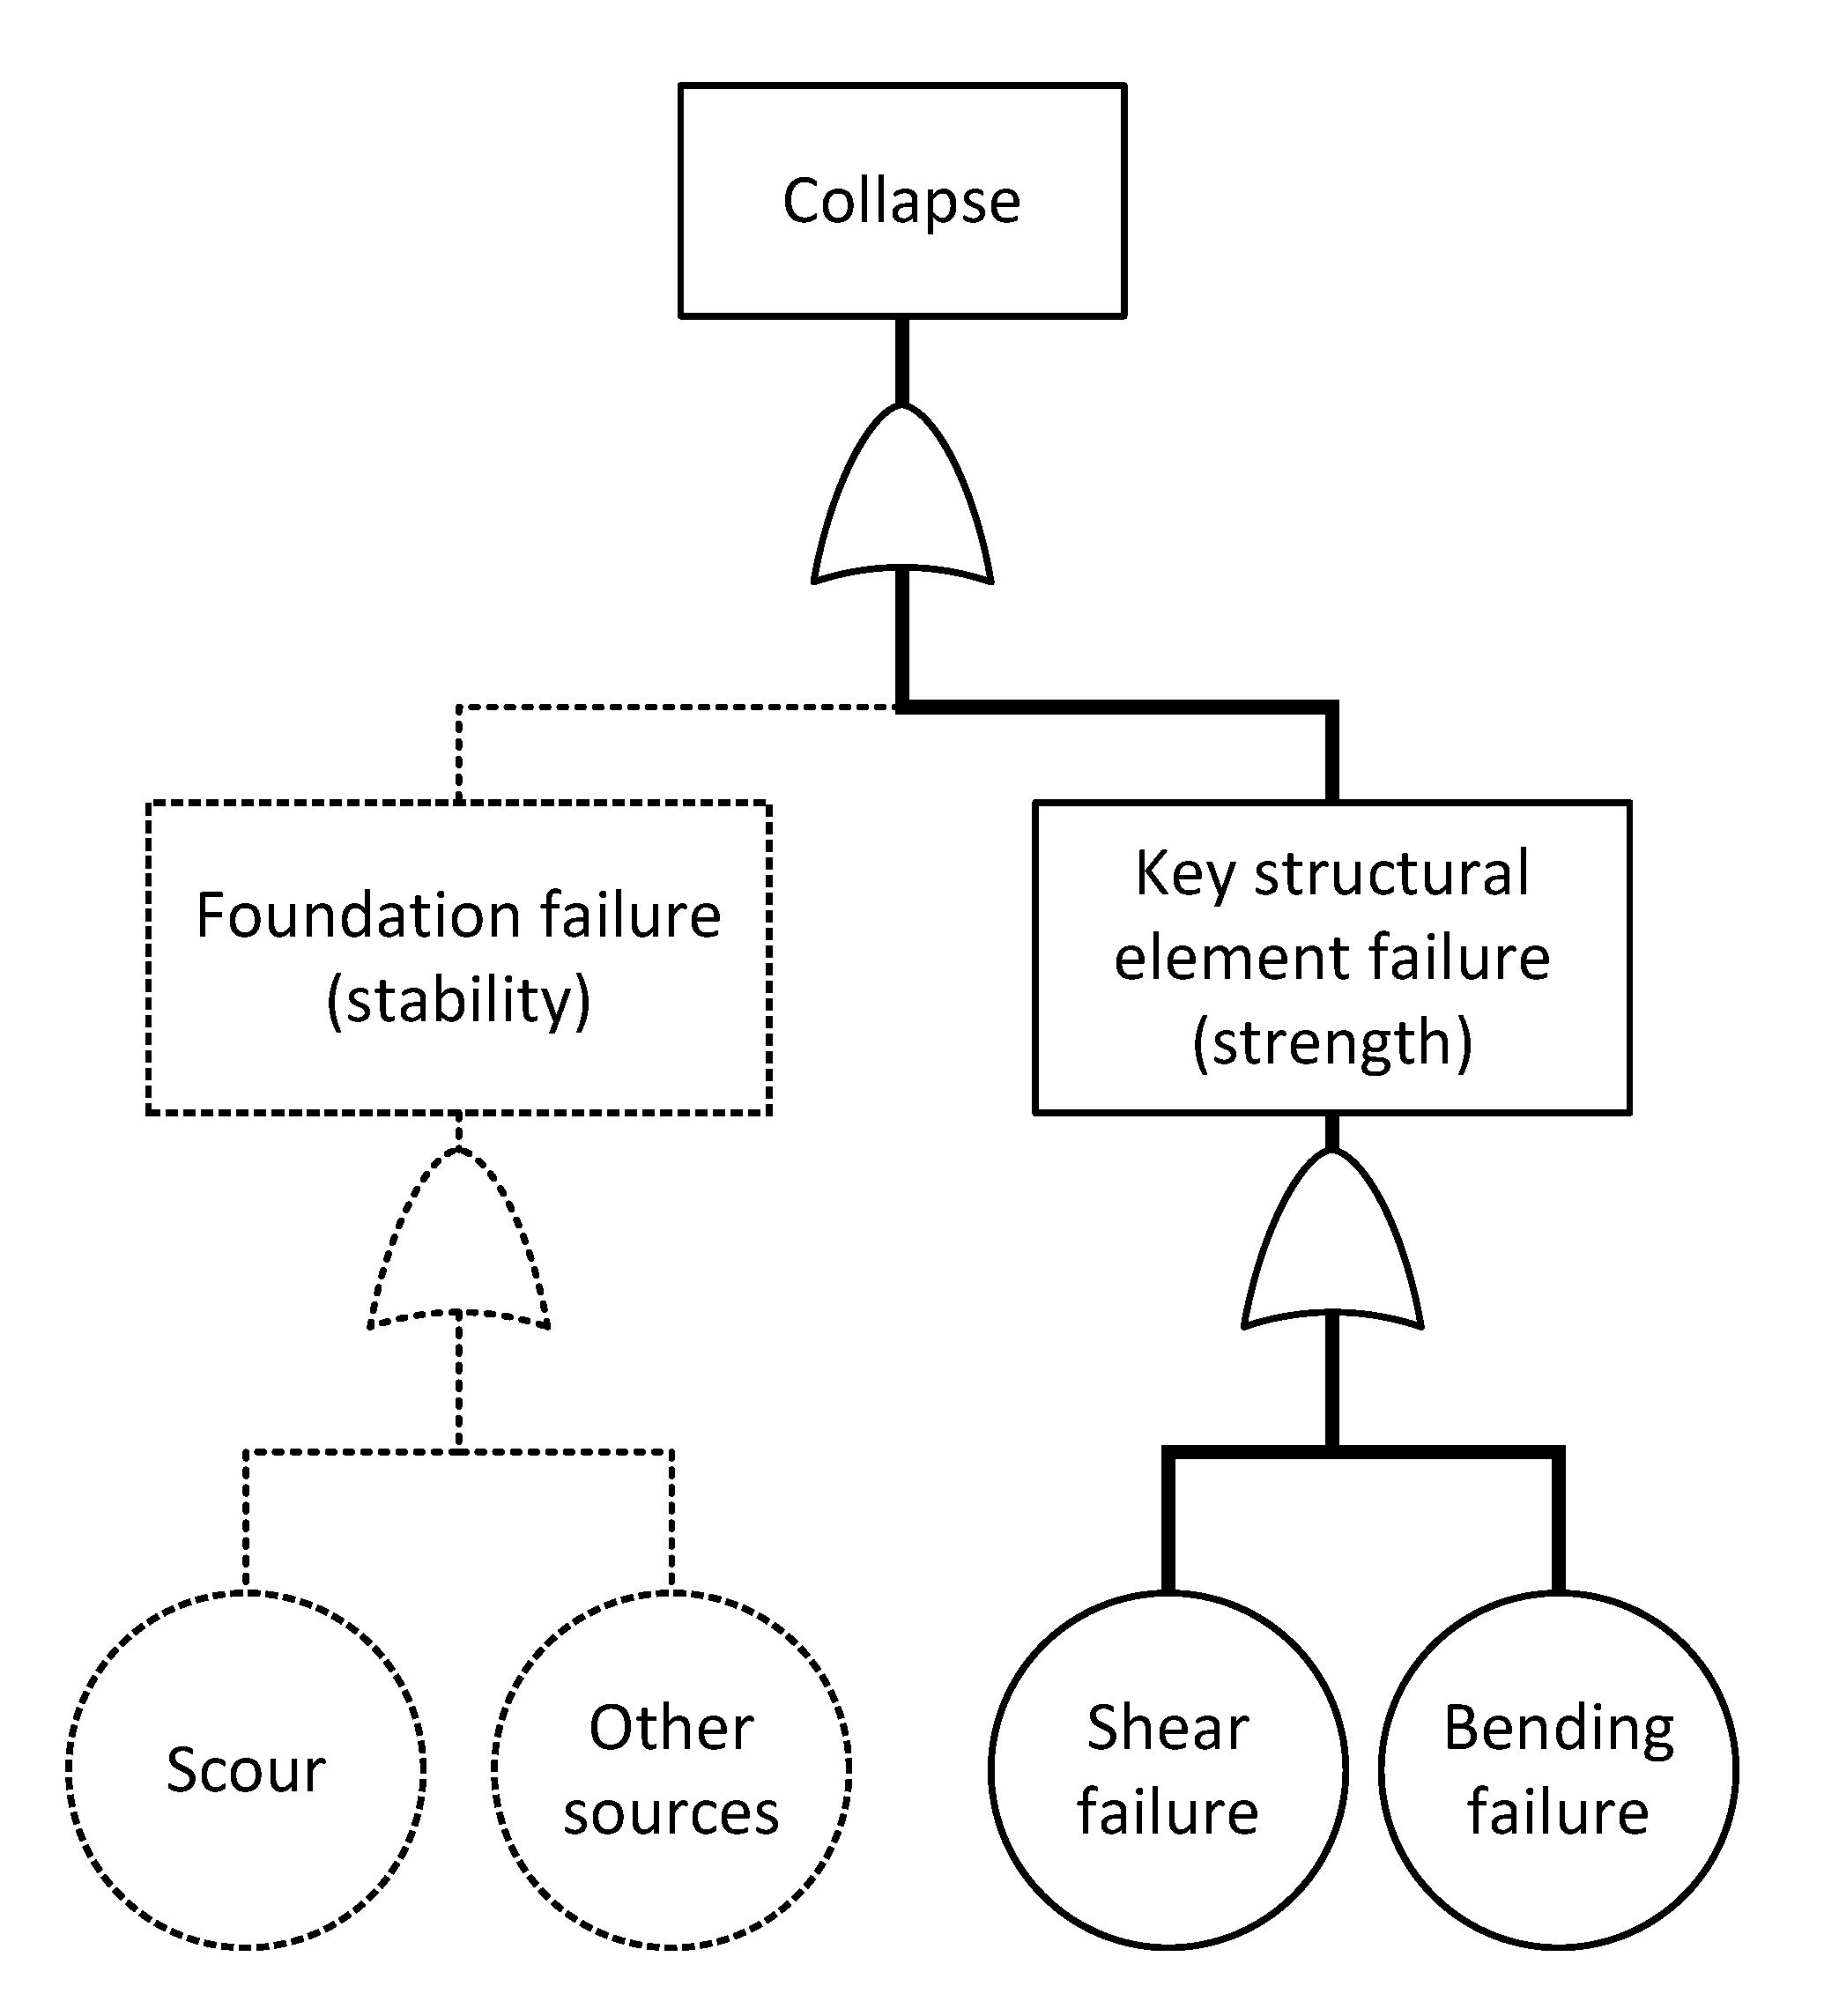
Figure 5.
(a) Uniform distributed characteristic lateral load; (b) linearly-distributed hydrostatic load over the wall when ; (c) linearly-distributed hydrostatic load when .
Figure 5.
(a) Uniform distributed characteristic lateral load; (b) linearly-distributed hydrostatic load over the wall when ; (c) linearly-distributed hydrostatic load when .

Figure 6.
Support conditions of a plain masonry wall. (a) Front view of a plain wall with horizontal and vertical supports; (b) side view of a plain wall with horizontal and vertical supports; (c) examples of different edge conditions (adapted from Moore [15]): (c-1) a wall built up to, but not pinned to the structure above with a free edge: no restraint; (c-2) a case of metal ties to columns with simple support: direct force restraint limited to the strength of ties; (c-3) a case of bonded return walls with fully-continuous restrained support: direct force and moment restraint limited by flexural strength of masonry.

Figure 7.
(a) Uniform distributed characteristic lateral load on windows; (b) linearly-distributed hydrostatic load over the window when ; (c) linearly-distributed hydro-static load when .
Figure 7.
(a) Uniform distributed characteristic lateral load on windows; (b) linearly-distributed hydrostatic load over the window when ; (c) linearly-distributed hydro-static load when .
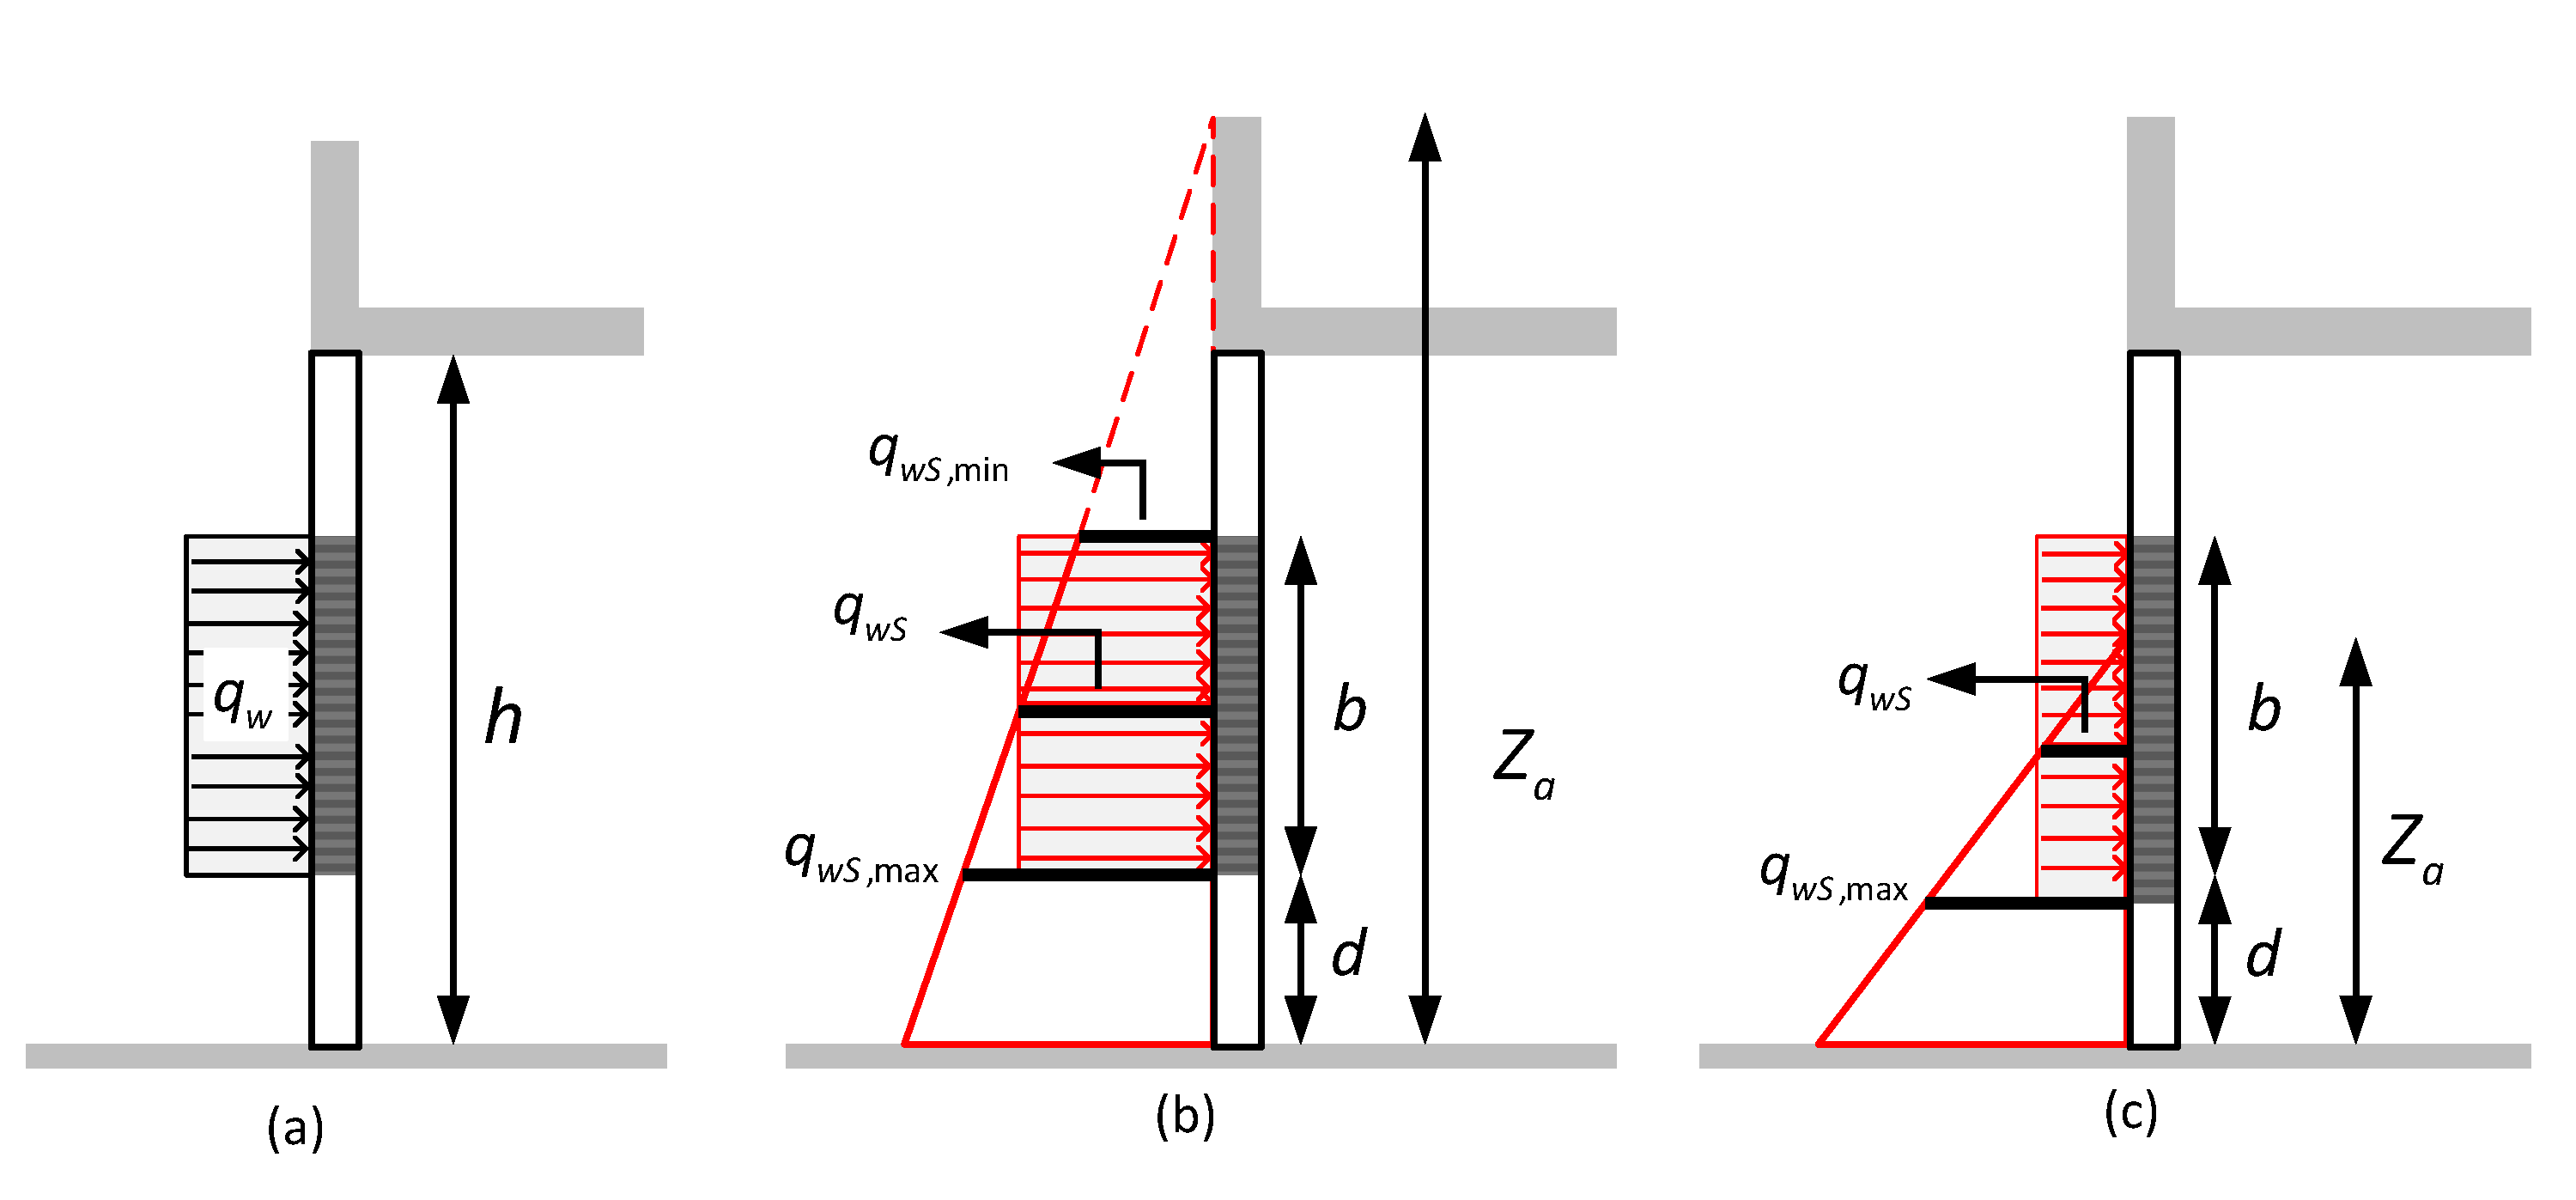
Figure 8.
Empirical of a thin plate with four edges simply supported based on thin plate theory.
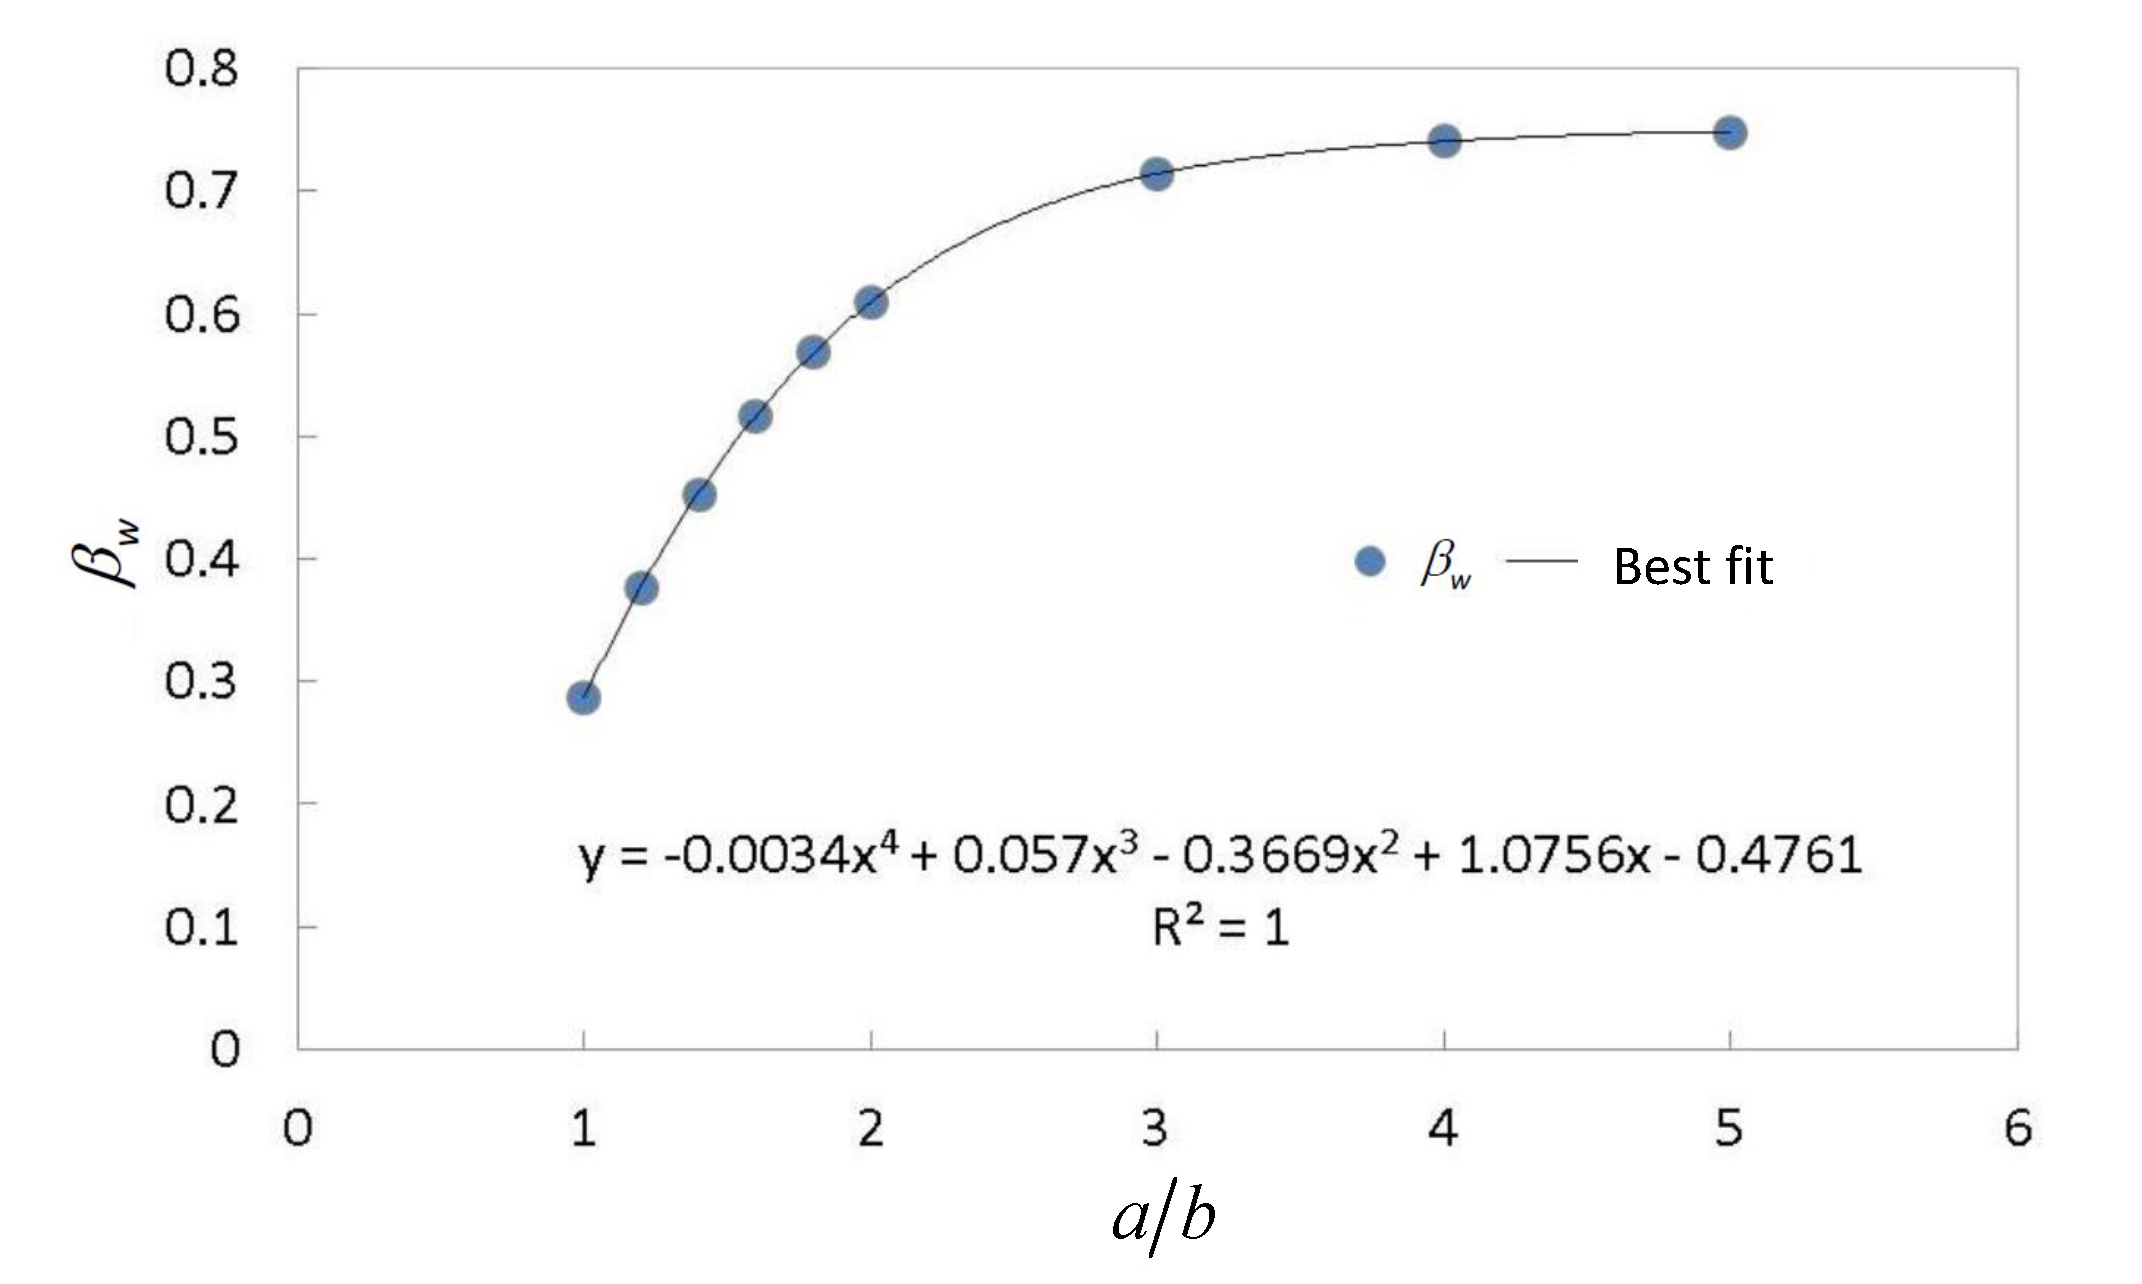
Figure 9.
Flowchart for the evaluation of the building damage due to overtopping wave (ow) load.
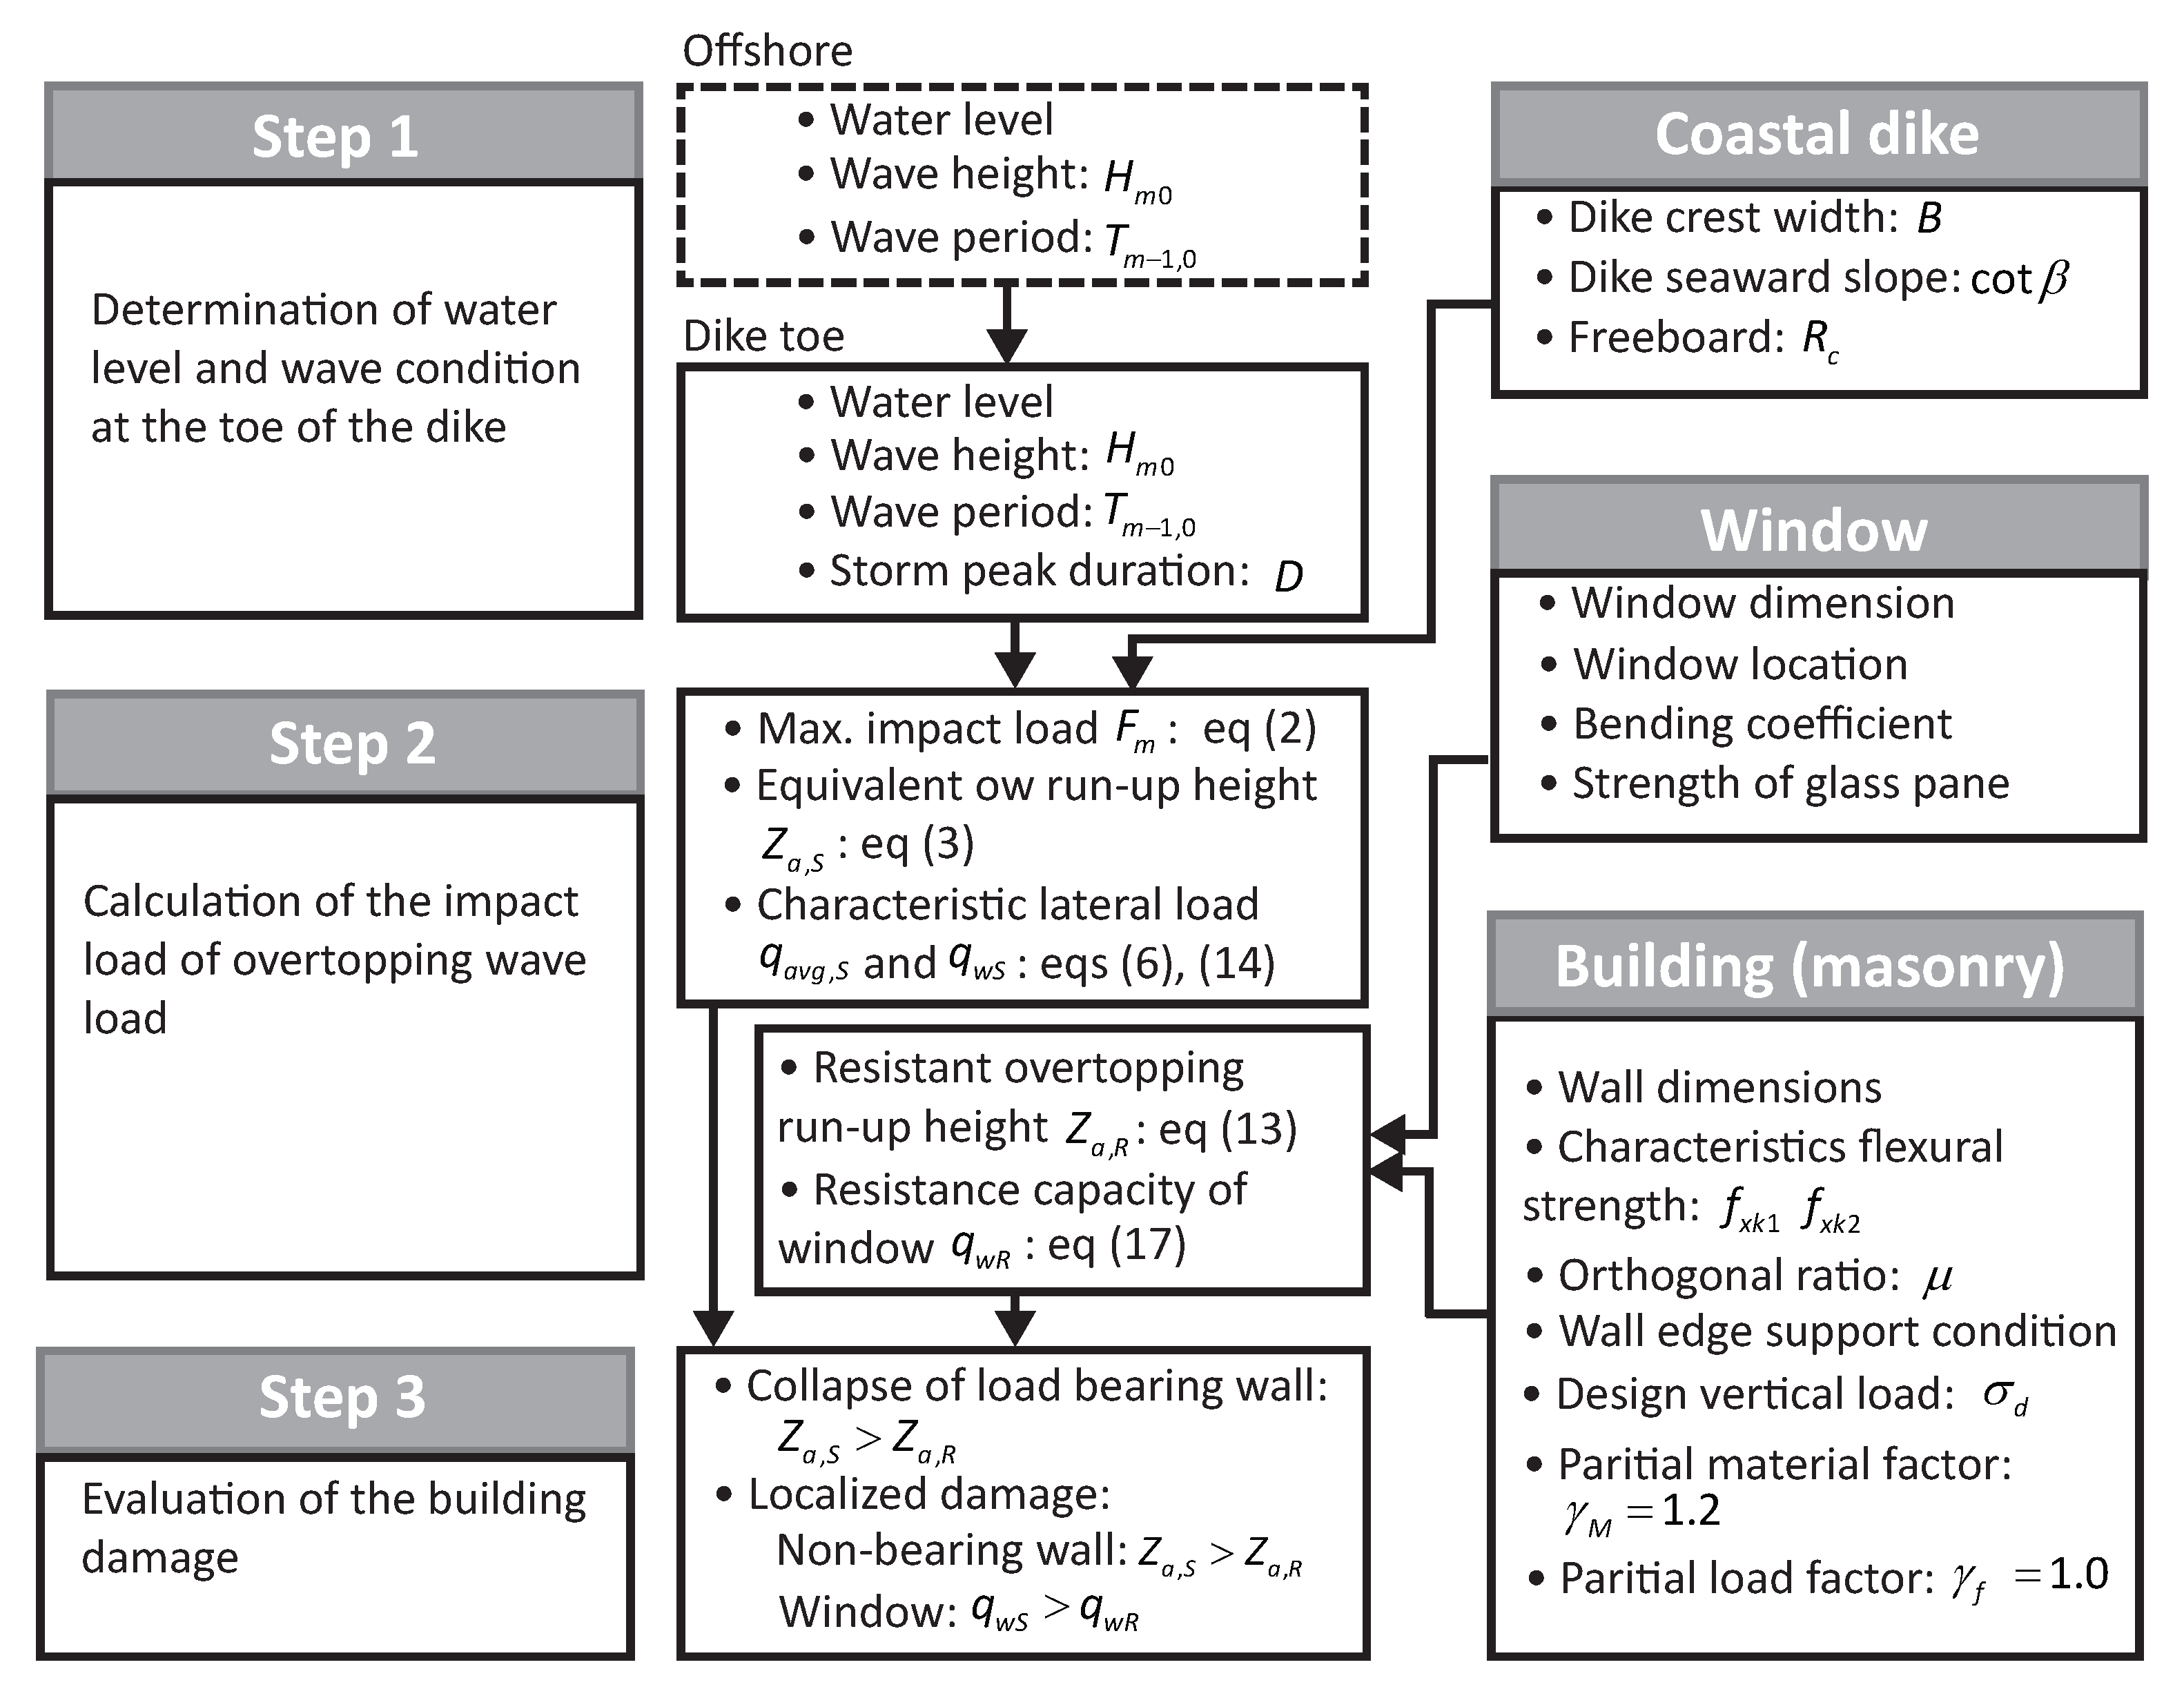
Figure 10.
Typical old apartment buildings on the Belgian coastal dikes. (a) Front view of appartment buildings (buit in 1913); (b) stairs to the ground floor; (c) entrances of the basements closing by shutters.
Figure 10.
Typical old apartment buildings on the Belgian coastal dikes. (a) Front view of appartment buildings (buit in 1913); (b) stairs to the ground floor; (c) entrances of the basements closing by shutters.
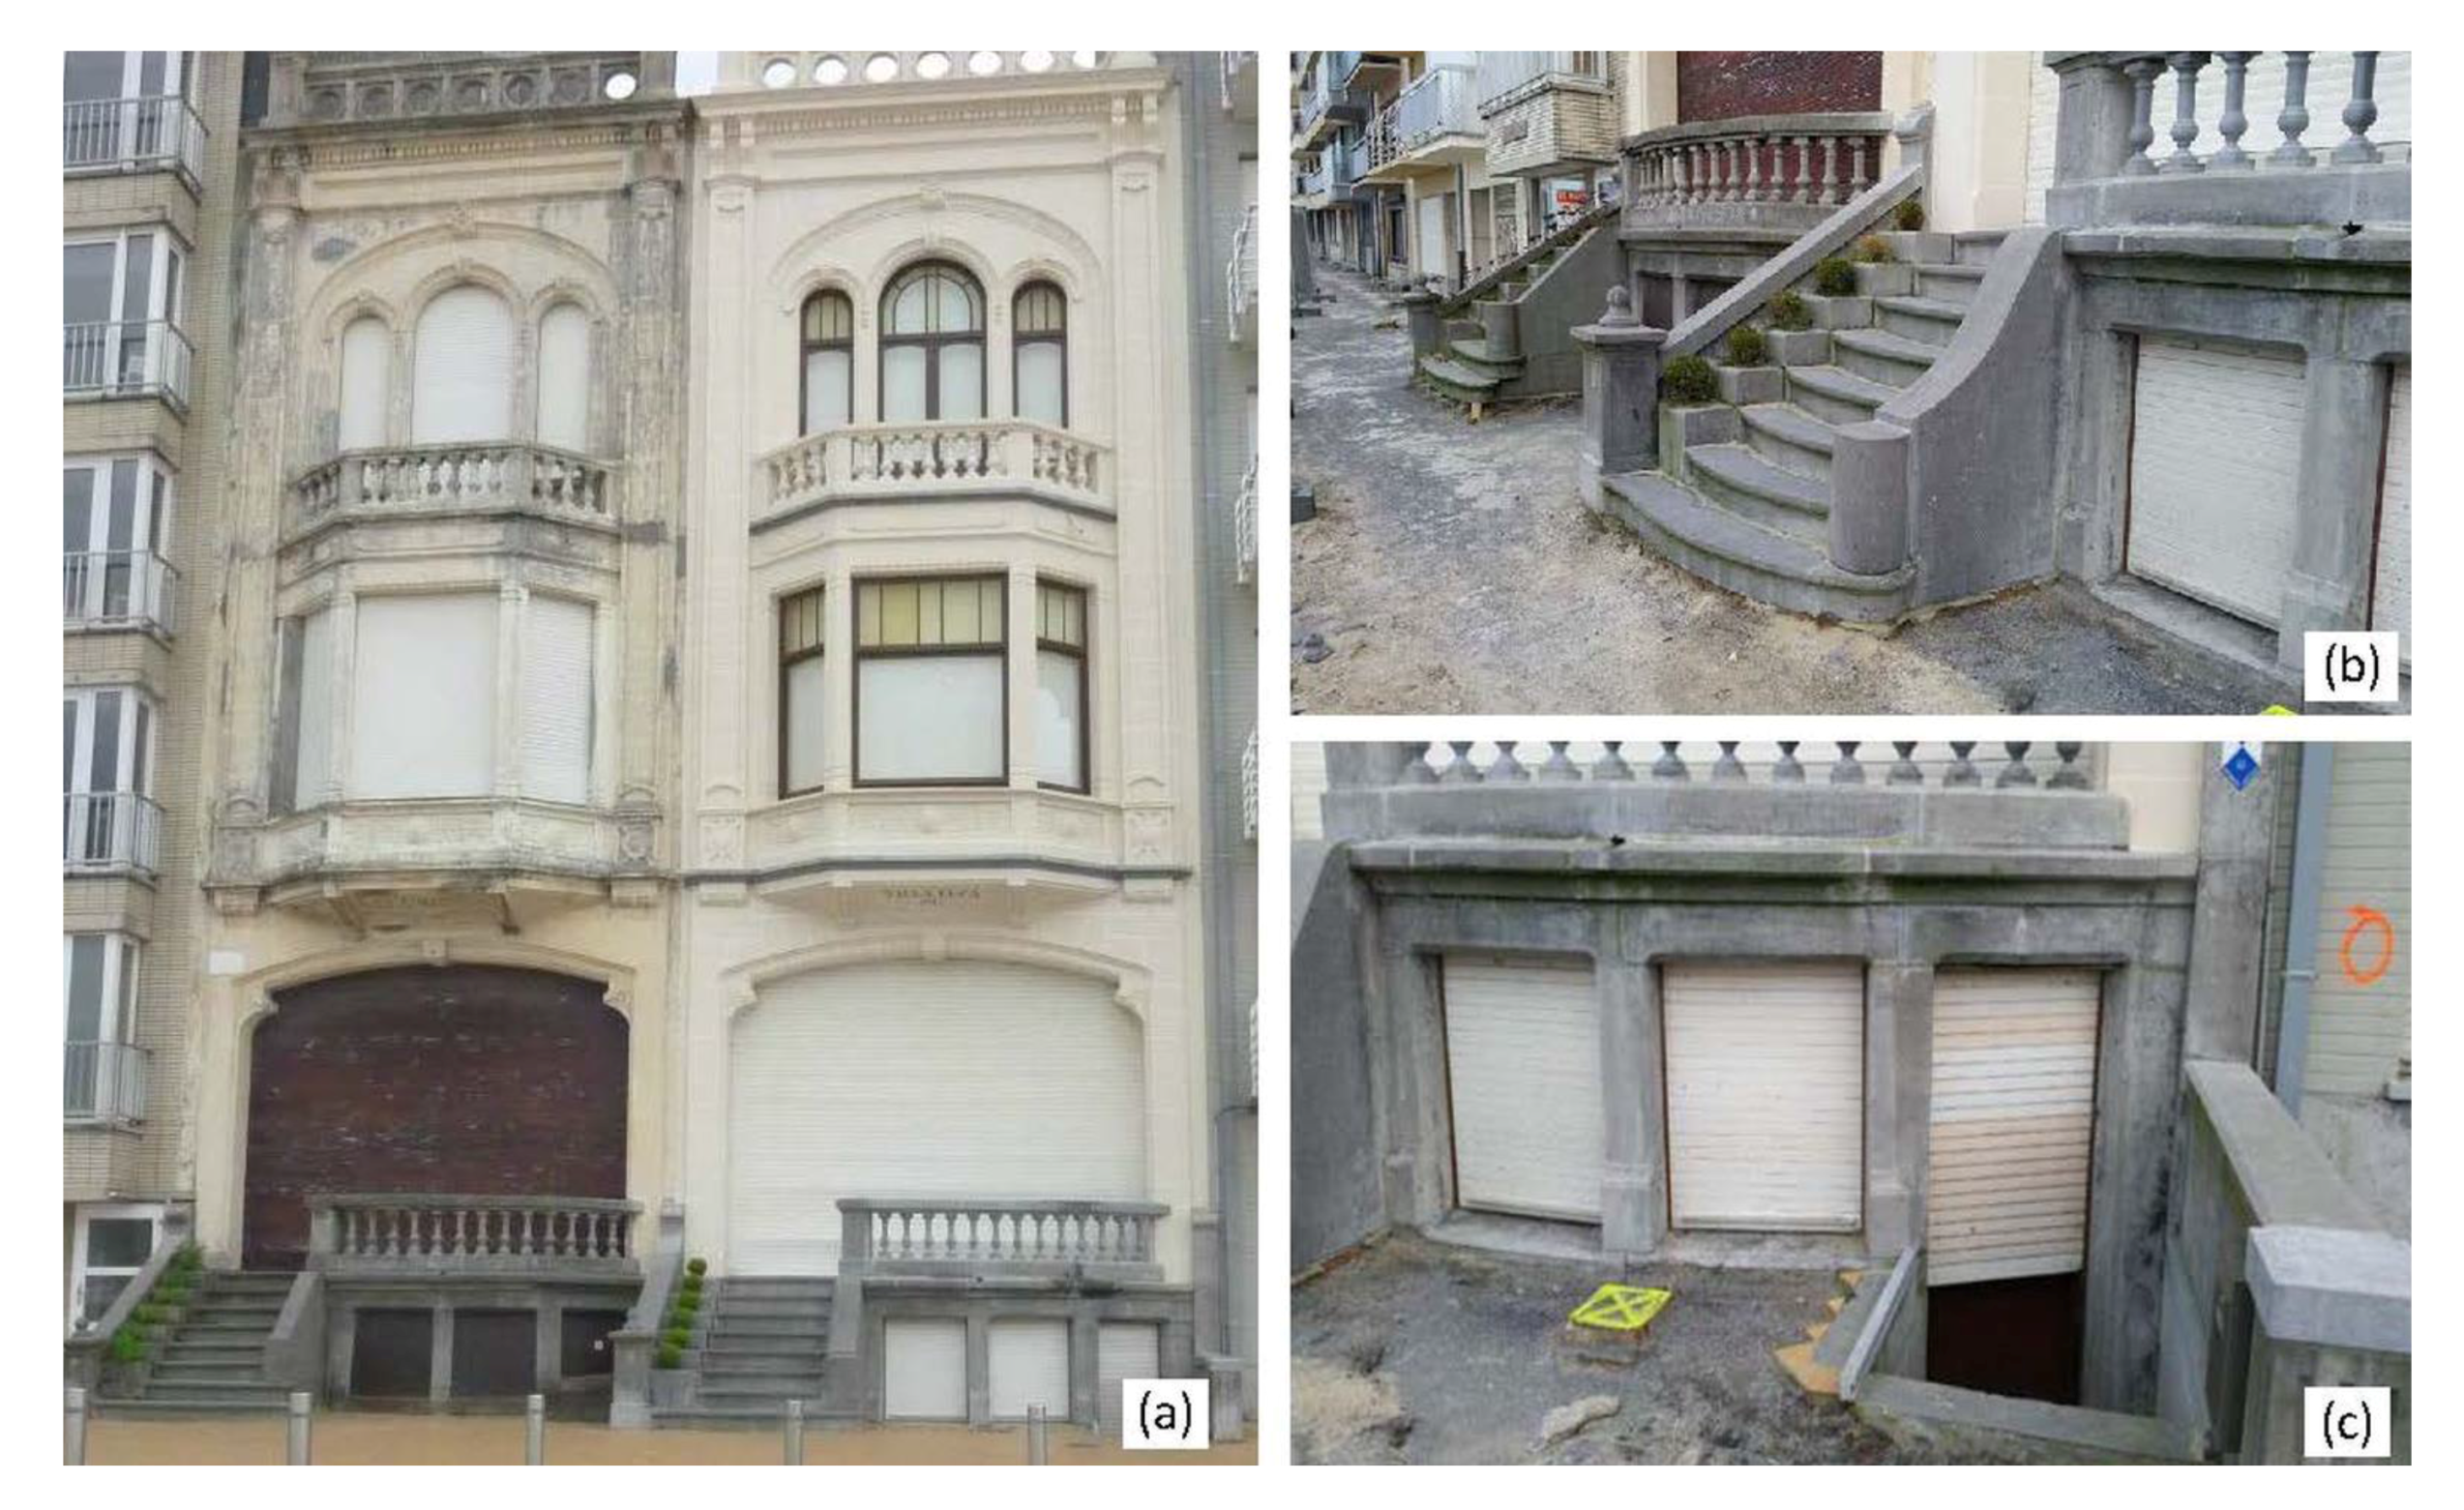
Figure 11.
Schematic sketch of the building on the top of a coastal dike with different storm surges.
Figure 11.
Schematic sketch of the building on the top of a coastal dike with different storm surges.

Figure 12.
Wall panels for the case studies. The name of the support condition of each wall panel is kept the same as that from Eurocode 6. (a) Support Condition A with one free edge and three simply supported edges; (b) support Condition E with four simply supported edges; (c) support Condition G with two simply supported edges and two fully restrained continues edges; (d) support Condition I with four fully restrained continues edges.
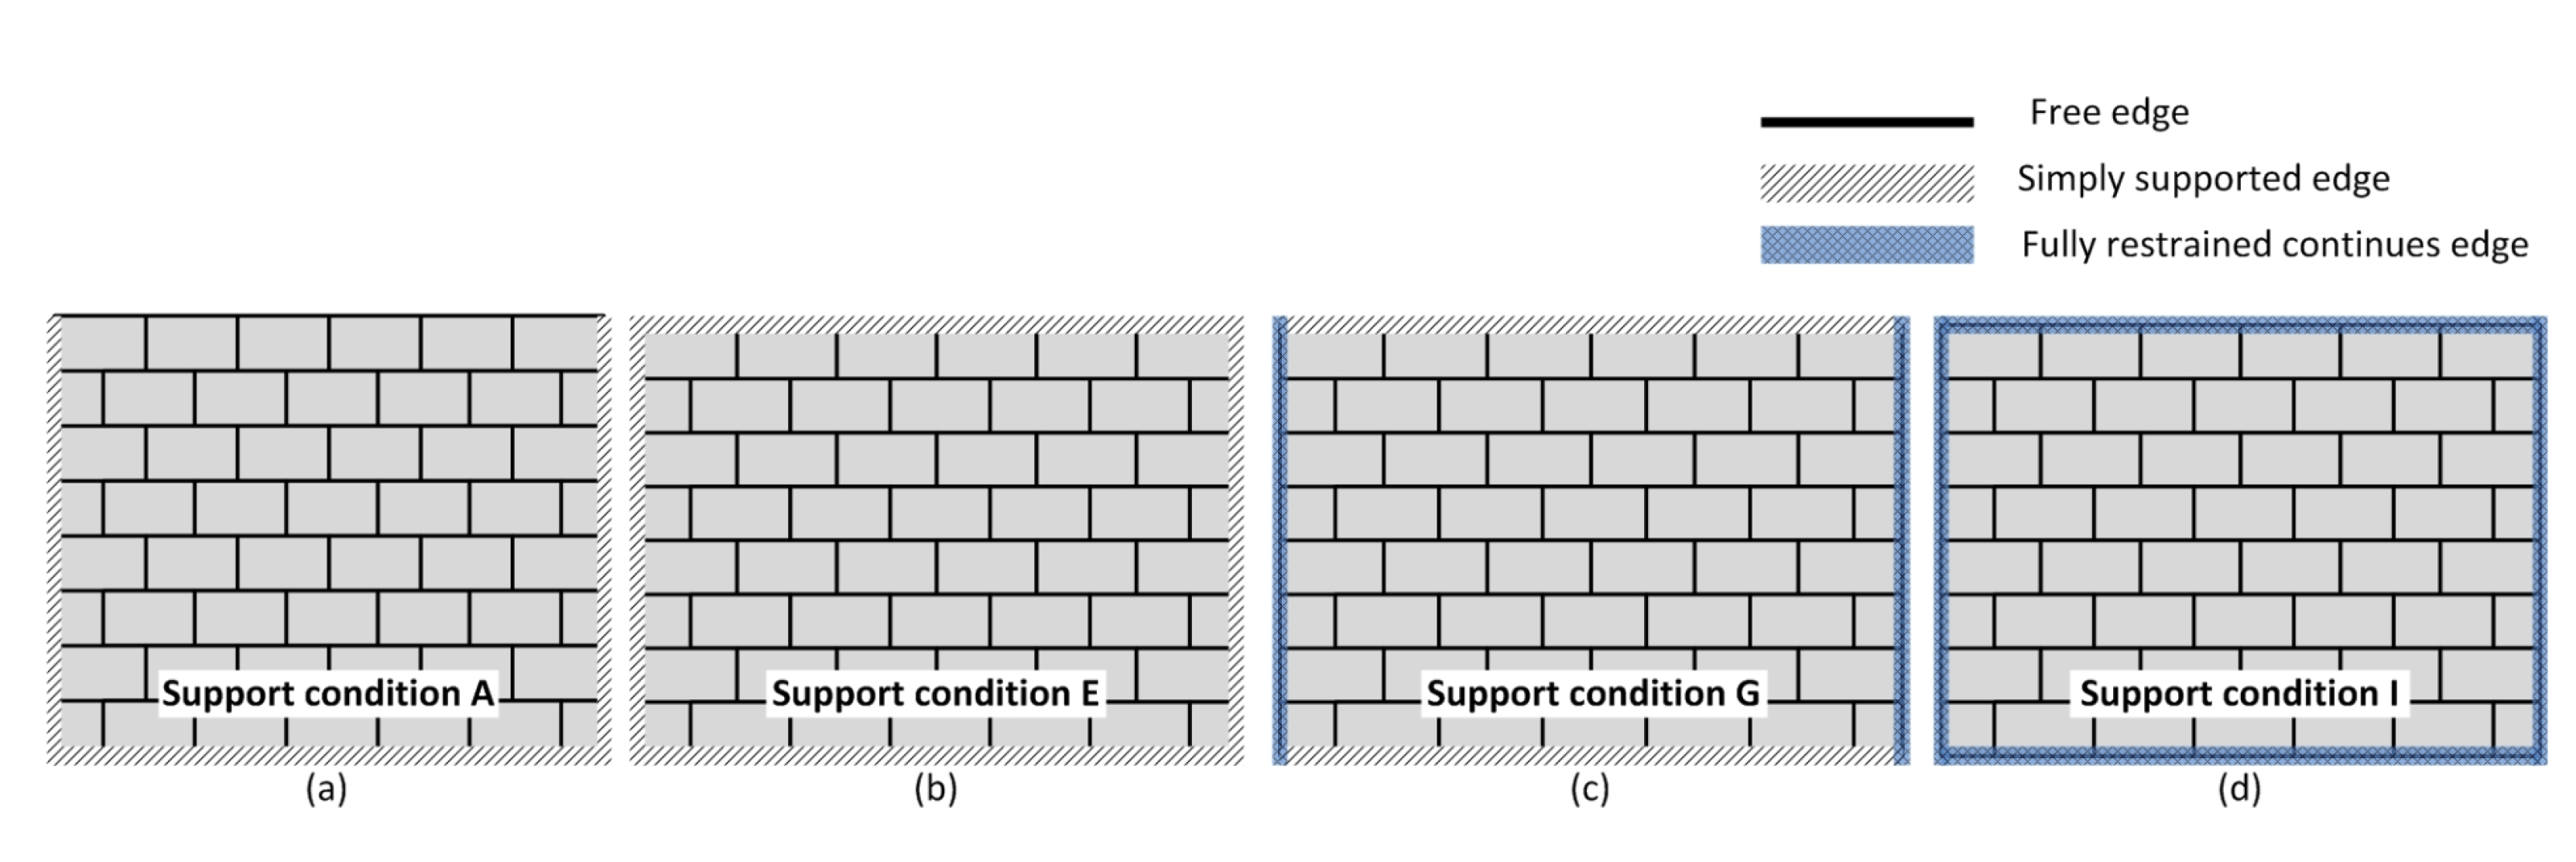
Figure 13.
Damage curve for four plain masonry walls located at m with varying wave heights.
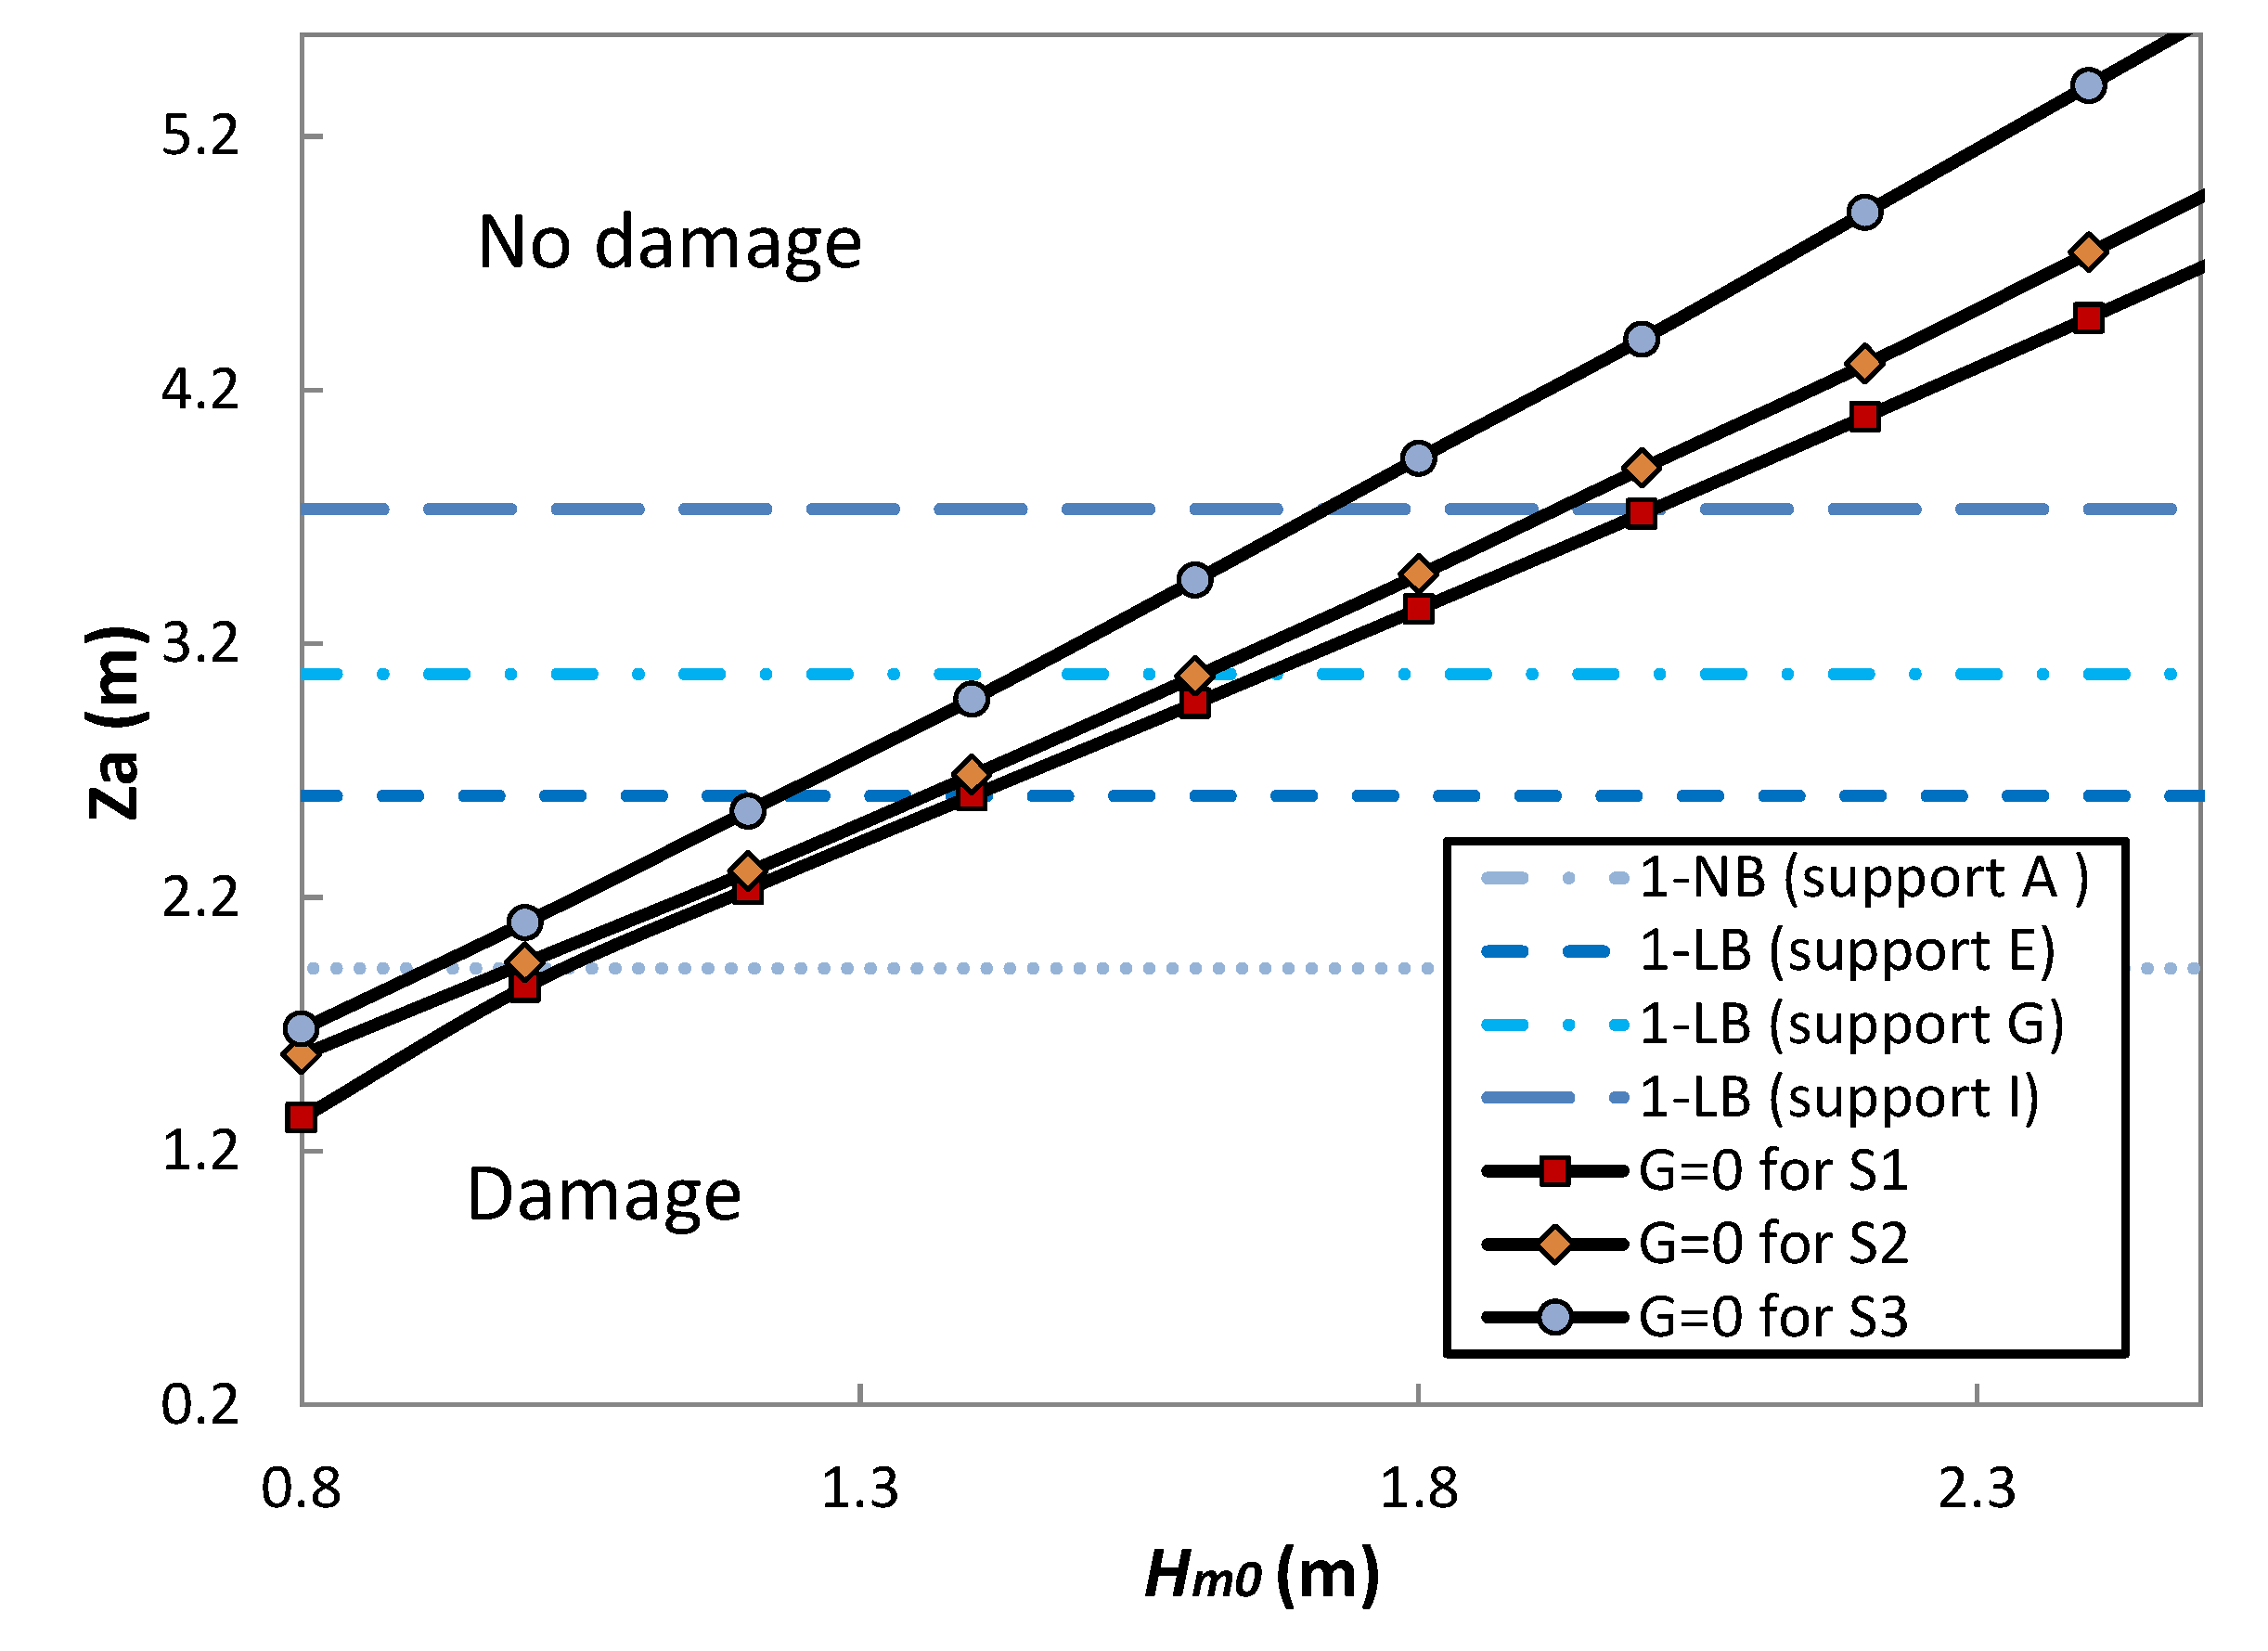
Figure 14.
Damage curve for the four plain masonry walls with varying B.

Figure 15.
The influence of the size of the wall panel on the lateral resistance of the wall.

Figure 16.
The influence of the wall panel thickness on the lateral resistance of the wall.

Figure 17.
Dimensions and location of windows.
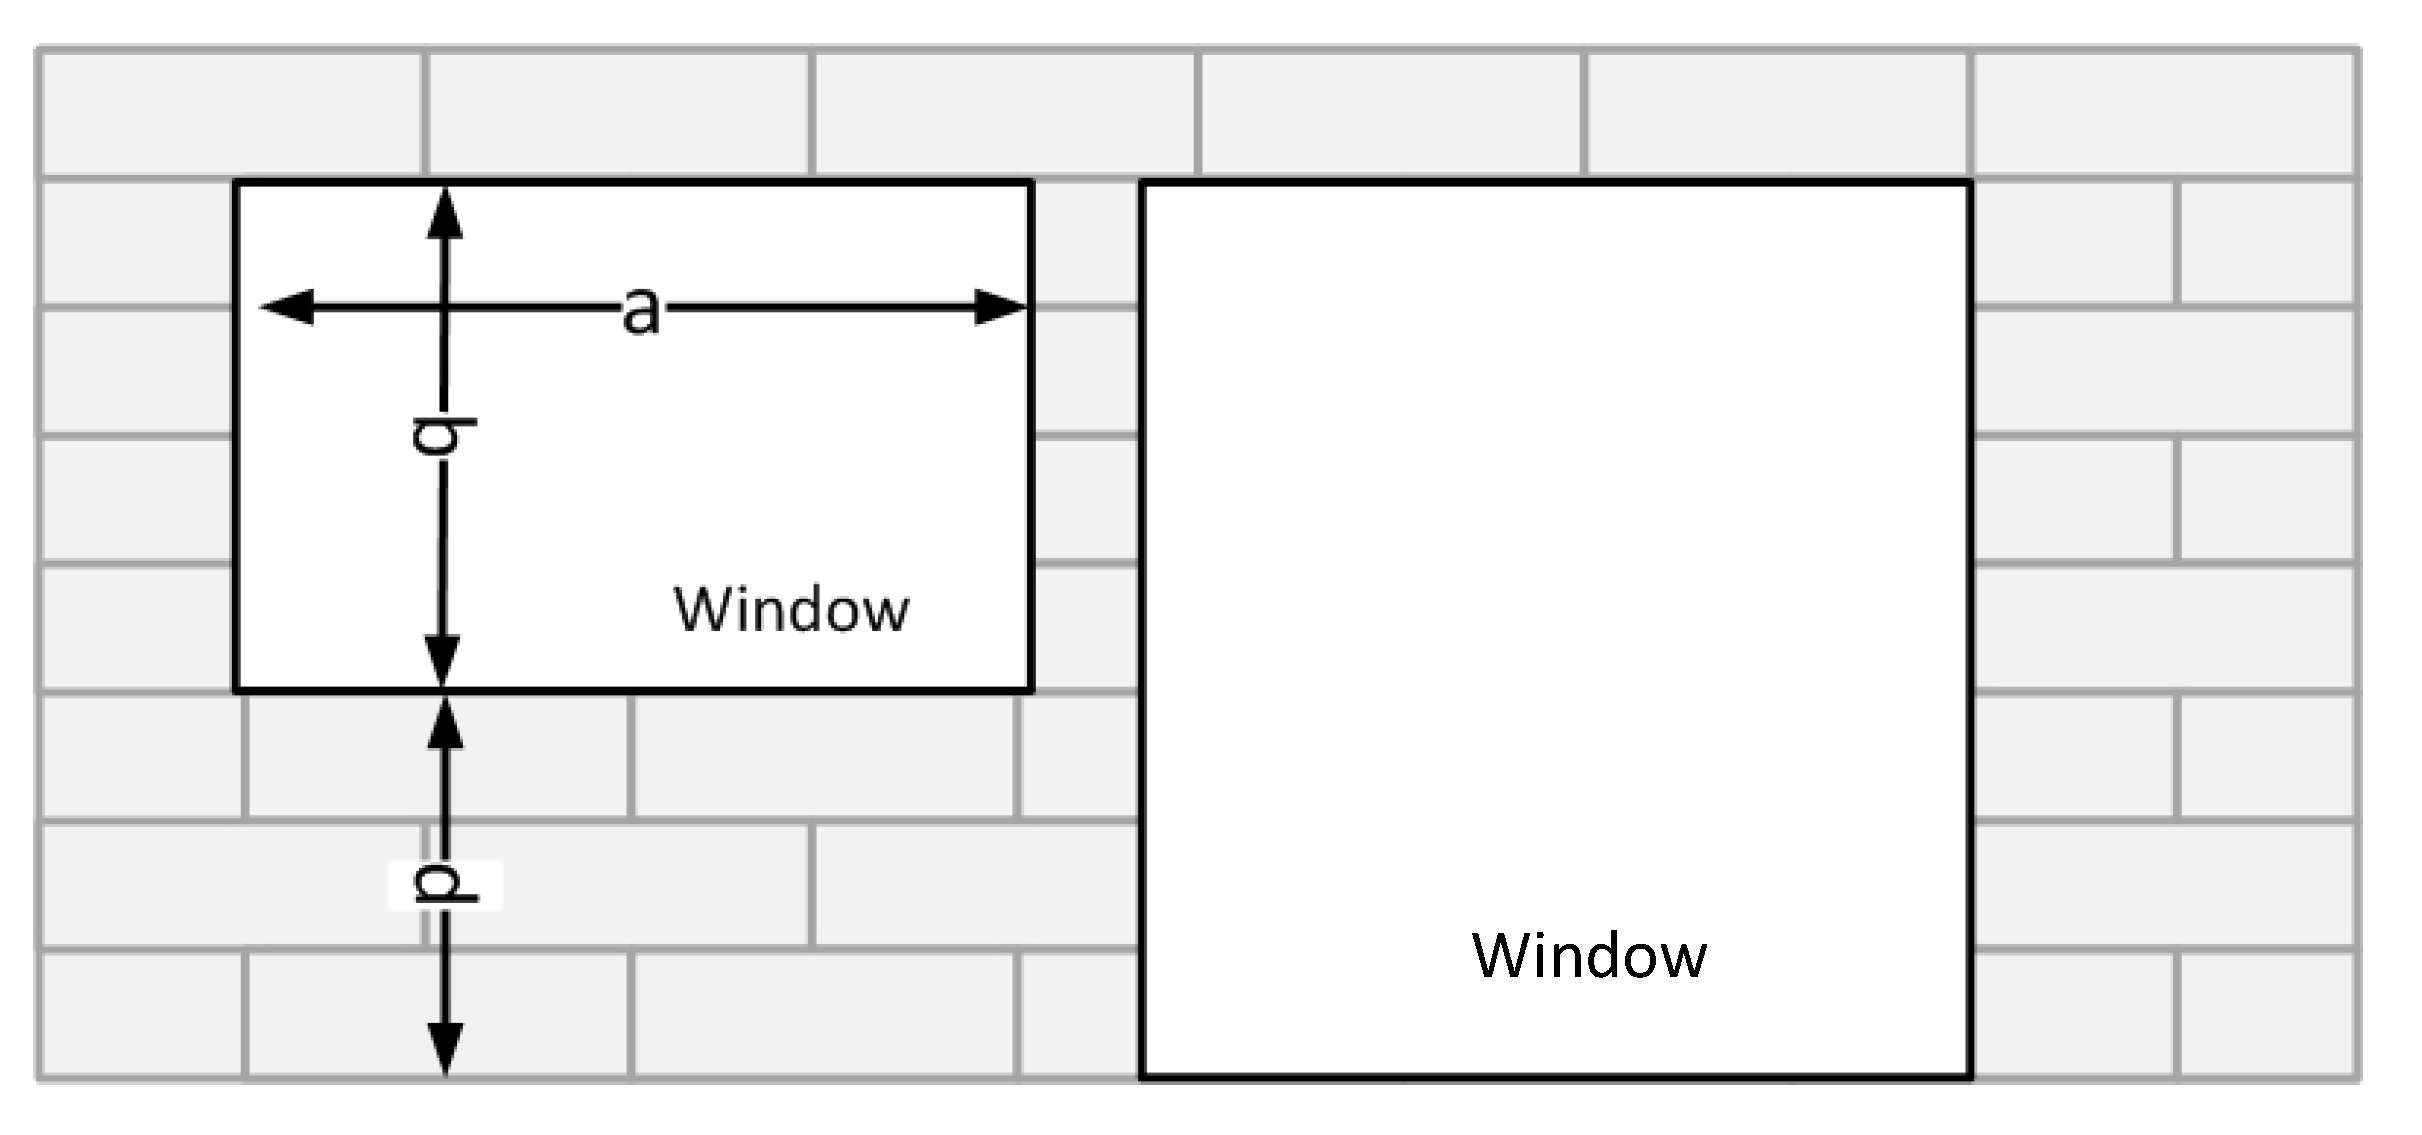
Figure 18.
Failure of three windows located at B = 10 m for the storm condition of S1 with varying wave height.
Figure 18.
Failure of three windows located at B = 10 m for the storm condition of S1 with varying wave height.

Table 1.
Storms under different scenarios. TAW, Tweede Algemene Waterpassing.
| Return Per.(Year) | Dur.(h) | Surge(m + TAW) | Beach(m + TAW) | (m) | (m) | (s) | (m) | (m) | |
|---|---|---|---|---|---|---|---|---|---|
| S1 | 1000 | 1 | 7.22 | 6.5 | 0.72 | 0.82 | 30.7 | 1.28 | 1.4 |
| S2 | 10,000 | 1 | 7.65 | 6.5 | 1.15 | 1.03 | 33.3 | 0.85 | 2 |
| S3 | 10,000 | 1 | 7.65 | 4 | 3.65 | 2.13 | 14.8 | 0.85 | 4.4 |
Table 2.
Reference cases of the four sections of the plain Wall 1 with support Conditions A, E, G and I. NB, Non-load-bearing; LB, Load-Bearing.
Table 2.
Reference cases of the four sections of the plain Wall 1 with support Conditions A, E, G and I. NB, Non-load-bearing; LB, Load-Bearing.
| Plain Wall | (mm) | h (m) | l (m) | Area (m) | Support | KN/m | (m) | |
|---|---|---|---|---|---|---|---|---|
| 1-NB | 220 | 2.9 | 5.8 | 16.82 | 0.5 | A | 6.24 | 1.92 |
| 1-LB | 220 | 2.9 | 5.8 | 16.82 | 0.5 | E | 11.42 | 2.6 |
| 1-LB | 220 | 2.9 | 5.8 | 16.82 | 0.5 | G | 15.98 | 3.07 |
| 1-LB | 220 | 2.9 | 5.8 | 16.82 | 0.5 | I | 23.51 | 3.73 |
Table 3.
Dimensions of windows.
| Window Unit | d (m) | (mm) | a (m) | b (m) | R (m) | (m) | (m) |
|---|---|---|---|---|---|---|---|
| WD-1 | 0 | 8 | 3 | 2 | 6 | 1.5 | 0.487 |
| WD-2 | 0 | 8 | 2 | 2 | 4 | 1 | 0.286 |
| WD-3 | 1 | 8 | 3 | 1 | 3 | 3 | 0.712 |
| WD-4 | 1 | 8 | 1 | 0.5 | 0.5 | 2 | 0.609 |
© 2017 by the authors. Licensee MDPI, Basel, Switzerland. This article is an open access article distributed under the terms and conditions of the Creative Commons Attribution (CC BY) license (http://creativecommons.org/licenses/by/4.0/).
Share and Cite
MDPI and ACS Style
Chen, X.; Jonkman, S.N.; Pasterkamp, S.; Suzuki, T.; Altomare, C. Vulnerability of Buildings on Coastal Dikes due to Wave Overtopping. Water 2017, 9, 394. https://doi.org/10.3390/w9060394
AMA Style
Chen X, Jonkman SN, Pasterkamp S, Suzuki T, Altomare C. Vulnerability of Buildings on Coastal Dikes due to Wave Overtopping. Water. 2017; 9(6):394. https://doi.org/10.3390/w9060394
Chicago/Turabian StyleChen, Xuexue, Sebastiaan N. Jonkman, Sander Pasterkamp, Tomohiro Suzuki, and Corrado Altomare. 2017. "Vulnerability of Buildings on Coastal Dikes due to Wave Overtopping" Water 9, no. 6: 394. https://doi.org/10.3390/w9060394
Note that from the first issue of 2016, this journal uses article numbers instead of page numbers. See further details here.