
An Analysis of Terrestrial and Aquatic Environmental Controls of Riverine Dissolved Organic Carbon in the Conterminous United States

1
Joint Global Change Research Institute, Pacific Northwest National Laboratory, College Park, MA 20740, USA
2
Great Lakes Bioenergy Research Center, Michigan State University, East Lansing, MI 48824, USA
3
Department of Hydraulic Engineering, Tsinghua University, Beijing 100084, China
*
Author to whom correspondence should be addressed.
Water 2017, 9(6), 383; https://doi.org/10.3390/w9060383
Submission received: 20 February 2017
/
Revised: 25 May 2017
/
Accepted: 25 May 2017
/
Published: 29 May 2017
Abstract
:Analyses of environmental controls on riverine carbon fluxes are critical for improved understanding of the mechanisms regulating carbon cycling along the terrestrial-aquatic continuum. Here, we compile and analyze riverine dissolved organic carbon (DOC) concentration data from 1402 United States Geological Survey (USGS) gauge stations to examine the spatial variability and environmental controls of DOC concentrations in the United States (U.S.) surface waters. DOC concentrations exhibit high spatial variability in the U.S., with an average of 6.42 ± 6.47 mg C/L (Mean ± Standard Deviation). High DOC concentrations occur in the Upper Mississippi River basin and the southeastern U.S., while low concentrations are mainly distributed in the western U.S. Soil properties such as soil organic matter, soil water content, and soil sand content mainly show positive correlations with DOC concentrations; forest and shrub land have positive correlations with DOC concentrations, but urban area and cropland demonstrate negative impacts; and total instream phosphorus and dam density correlate positively with DOC concentrations. Notably, the relative importance of these environmental controls varies substantially across major U.S. water resource regions. In addition, DOC concentrations and environmental controls also show significant variability from small streams to large rivers. In sum, our results reveal that general multi-linear regression of twenty environmental factors can partially explain (56%) the DOC concentration variability. This study also highlights the complexity of the interactions among these environmental factors in determining DOC concentrations, thus calls for processes-based, non-linear methodologies to constrain uncertainties in riverine DOC cycling.
1. Introduction
Riverine carbon cycling is an important but insufficiently investigated component of the global carbon cycle [1,2,3,4]. Global carbon export from land to rivers ranges from 1.9 to 2.7 Pg C/year [1,4], which is comparable with the net carbon uptake by terrestrial ecosystems [5]. The inclusion of riverine carbon in regional carbon monitoring and assessment is necessary and critical, as highlighted in the Fifth Assessment Report of the International Panel on Climate Change (IPCC) [6]. However, our incomplete understanding of the variability and environmental controls of riverine carbon limits our confidence in integrating this component into regional carbon budgeting [2,7].
Dissolved organic carbon (DOC) plays a critical role in linking terrestrial and aquatic ecosystems. At the global scale, DOC accounts for more than 50% of the total organic carbon export from land to oceans [1,8]. In the United States (U.S.), about 66% of the total riverine organic carbon is DOC [9]. In addition to the large magnitude, DOC is actively involved in multiple biogeochemical processes along the terrestrial-aquatic continuum. For example, DOC is a source of substrate for microorganisms and thus impacts soil microbial activities [10]. The leaching of DOC from soils not only provides energy inputs for heterotrophic bacteria in surface waters [11,12], but also partially contributes to the carbon exchange between waters and the atmosphere [13,14]. The removal of riverine DOC through microbial degradation and photochemical oxidation results in a significant carbon efflux from coastal waters to the atmosphere [15,16,17]. As a result, exploring DOC variability will not only benefit an assessment of the coupled terrestrial-aquatic carbon cycling but will also inform a series of investigations associated with carbon transport and transformations in soils, fresh waters, and coastal waters.
Riverine DOC cycling is regulated by multiple processes during DOC production and transport. Litter and soil organic matter are two major sources of DOC [17,18]. The release of DOC from the two carbon pools is sensitive to changes in temperature [16]. Warming temperatures stimulate microbial activities in organic matter decomposition and thus enhance DOC production [19,20]. The warming climate has been identified as a possible cause of the elevated DOC concentrations in peat soil solution [21]. Other studies have implied that changes in hydrological processes also play important roles in organic carbon export [22,23,24]. For instance, DOC concentrations positively respond to heavy rainfall events [25], suggesting that riverine DOC may be primarily limited by transport-related processes rather than by carbon supply at the watershed scales.
DOC concentrations vary with land cover, soil properties, and human disturbances [26,27,28]. Organic carbon loads vary significantly over different land cover due to differences in soil respiration, soil carbon storage, and adsorption capacity [29,30,31]. Land use change and associated human activities have profound and long-lasting impacts on DOC concentration [27]. Vegetation either directly control DOC production via residue input to soils or indirectly affect DOC transport through hydrological processes [26]. Wetlands have higher DOC concentrations than other land cover types, mainly because of high organic carbon storage in [32]. With a high adsorption capacity of fine particles, clay-textured soils tend to hold large amounts of DOC leachate and have lower DOC loads than other soil types [33]. The variability of DOC among different soil types is also related to soil pH and/or soil moisture [17,34]. Land management practices such as liming, tillage, fertilizer use, and irrigation may regulate riverine DOC by affecting organic matter decomposition [17]. These previous scientific findings clearly indicate that riverine DOC is controlled by multiple environmental factors.
Analysis of environmental controls on riverine DOC is critical for improving our understanding of the mechanisms regulating carbon processing and storage along the terrestrial-aquatic continuum, thereby establishing a solid scientific foundation for mechanistically representing these factors in process-based numerical models, as well as to support robust carbon monitoring. In this study, we compile and analyze DOC concentration observations from 1402 United States Geological Survey (USGS) gauges and perform statistical analyses to explore the impacts of climate factors, topographical conditions, and anthropogenic activities on the variability of DOC concentrations. The research objectives are to: (1) depict the spatial patterns of DOC concentrations in the U.S.; (2) identify the key factors controlling riverine DOC concentrations at different spatial scales; (3) analyze the underlying mechanisms regulating DOC concentrations.
2. Methods
Data Compilation and Statistical Analysis
We compiled 57,373 observed DOC concentration (USGS water quality parameter code: 00680) data from 1402 USGS gauge stations (Figure 1). The DOC concentration, total nitrogen, and total phosphorus of each gauge were downloaded from the USGS National Water Information System (NWIS): http://qwwebservices.usgs.gov/. According to the USGS, DOC was measured through UV-promoted persulfate oxidation and infrared spectrometry: https://nwql.usgs.gov/pubs/Method%20holding%20times%205-25-10.pdf. Most of the samples were collected during the 1980s to 2010s. To explore the impacts of autochthonous production on DOC concentrations, we obtained chlorophyll-a (parameter code: 70953) data from USGS (246 stations with valid observations). We obtained total nitrogen (parameter code: 00600) and total phosphorus (parameter code: 00665) observations to examine the impacts of riverine nutrients on DOC.
In this study, we primarily focus on the spatial variability of DOC concentrations. We calculated the average DOC concentrations at each station for the subsequent statistical analysis. Since outliers may have significant impacts on the statistical analyses and interpretation of environmental controls on DOC concentrations, data quality control was performed before the statistical analyses. Specifically, we screened the water quality data to remove observations beyond three standard deviations from the mean [35].
River basin attributes for each gauge station were obtained from the Geospatial Attributes of Gages for Evaluating Streamflow (GAGES-II) database [36]. This database provides geospatial attributes for stations with streamflow records longer than 20 consecutive years: https://water.usgs.gov//GIS/metadata/usgswrd/XML/gagesII_Sept2011.xml#stdorder. These attributes represent the average conditions of the drainage area of each gauge station. The environmental factors considered in this study include climate conditions (temperature and precipitation), hydrological factors (runoff), land cover (cropland, forest, wetlands, urban area, and grassland), soil properties (soil texture, soil organic matter, soil water content, and soil bulk density), topographic factors (river basin slope and river order), nutrient availability (total nitrogen and total phosphorus), and anthropogenic impacts (dam density). These variables are closely related to either the carbon cycle or the water cycle, thus may affect DOC concentrations in surface waters directly or indirectly. The unites of the selected variables can be found in the Supplementary Material (S1). To reduce the impacts of non-normal distribution on the outcome of statistical analyses, we used log transformation to convert highly skewed variables to approach symmetric distributions [25,37]. The variables that were transformed are listed in Table 1, and the results of the logarithmic transformations can be found in the Supplementary Material (S2).
We divided the 1402 stations into 18 groups based on the delineation of the major U.S. water resource regions. This allows us to examine the regional variations in DOC concentrations and associated environmental controls. We also investigated the impact of the environmental factors on DOC concentrations by river orders through grouping all the stations based on their Strahler river order numbers. In this study, headwaters refer to first- through third-order streams, whereas large rivers are those of the sixth and higher-order streams.
We employed linear regression analyses to quantify the impacts of environmental factors on DOC concentrations [38]. First, we conducted bivariate regression analyses across all the 1402 stations to evaluate whether the linear correlation between each of the selected factors and DOC concentrations is statistically significant. Next, general linear models (GLMs) were employed to combine all environmental factors and quantify the collective influences of the selected factors on DOC concentrations. The GLM analyses were performed at two spatial levels; over the entire U.S. and in each water resource region. In addition, we grouped DOC data by four river orders to understand how the hierarchy of river networks can influence DOC concentrations. Factors with high collinearity were removed from these GLM analyses. The variance inflation factor (VIF, ranges from 1 to infinity) is an index quantifying collinearity among multiple independent factors; this index increases with the degree of collinearity. We checked the VIF values of all selected factors in each GLM simulation. The factor with the highest VIF value was removed from the GLM simulations repeatedly until the VIF of each factor was less than 10. Details of the GLM models and the statistical analyses can be found in the Supplementary Material (S3, S4, and S5). The average DOC of the available observations at each station was used as the dependent variable for the GLM simulations. All statistical analyses were conducted using the R statistical software (http://www.R-project.org). A confidence level of 95% (or p value < 0.05) was used to detect statistically significant correlations between an environmental factor and DOC concentrations.
3. Results
3.1. Spatial Variability of DOC Concentrations in the U.S.
The average DOC concentration of all 1402 stations is 6.42 ± 6.47 mg C/L (Mean ± Standard deviation), with low DOC concentrations (<2 mg C/L) mainly located in the Piedmont area of the eastern U.S. and in the northwestern U.S. (Figure 1). High DOC concentrations (>15 mg C/L) occur in the Upper Mississippi River basin and Florida. The stations in the coastal plains in the eastern U.S. and the Lower Mississippi River Basin also have high DOC concentrations (>10 mg C/L).
Regional analyses indicate that the Souris-Red-Rainy region (region 4) and the South Atlantic-Gulf region (region 15) have higher DOC concentrations than the other regions (Figure 2). The average DOC concentrations in these two regions reached 14.45 and 10.48 mg C/L, respectively. The areas adjacent to these two regions, such as Missouri (region 2), Great Lakes (region 5), Lower Mississippi (region 17), the Texas-Gulf (region 18), also have high DOC concentrations. On the contrary, in the western and northeastern regions such as California (region 8), Great Basin region (region 9), Upper Colorado (region 10), Mid-Atlantic (region 7), and Ohio (region 11), the DOC concentrations are generally less than 5 mg C/L. With an average of 2.65 mg C/L, Pacific Northwest (region 1) has the lowest average DOC concentration among all 18 regions. More statistics of DOC concentrations of the U.S. and the 18 water resource regions can be found in the Supplementary Material (S6). The substantial variance in DOC concentrations and physiographic conditions across the water resource regions in the U.S. provide an ideal testbed for analyzing the environmental controls of riverine DOC.
3.2. Bivariate Analyses of Impacts of Environmental Factors on DOC Concentrations
Most of the selected variables exert statistically significant impacts on DOC concentrations at the national scale (Table 1). In general, DOC concentrations increase with the drainage area of the corresponding gauge stations. Temperature and precipitation show contrasting impacts; temperature has positive impact on DOC concentrations, while precipitation has negative impact. As precipitation is the major driver of runoff, it is not surprising to see the negative impact of runoff on DOC concentrations. Both soil water content and soil bulk density are positively correlated with DOC concentration. All of the land use types examined here, including urban area, cropland, and forest, significantly correlate with DOC concentration. Riverine nutrients (nitrogen and phosphorus) have positive correlations with DOC concentration. The percentage of first order streams is negatively correlated with DOC concentration.
Notably, although most of the selected variables have significant correlations with DOC concentrations, each single factor only explains a small portion of the DOC spatial variability (Table 1). Only six factors, including percentage of first order streams, total nitrogen, total phosphorus, wetlands, river basin slope, and forest cover, could each explain more than 10% of the DOC variability.
3.3. Multivariate Analyses of Environmental Impacts on DOC Concentrations
The results of the general regression simulations suggest that DOC concentrations are affected collectively by multiple variables (Table 2). At the national level, temperature, soil organic matter, soil sand content, soil water content, and soil bulk density demonstrate positive impacts. Among the examined land cover types, forest, shrub land, and wetlands have positive impacts, but urban area and cropland show negative influences on DOC concentrations. Slope of landscapes shows negative impacts on DOC concentrations. Levels of instream total phosphorus concentrations and dam density positively correlate with DOC concentrations. At the national level, the GLM explains ca. 56% of the variability in DOC concentrations by combining all twenty factors.
It is worth noting that the relative contribution of each of the twenty selected variables varies from region to region (Table 2). For Missouri, Lower Colorado, Rio Grande, and Tennessee, the regression model failed to provide statistically significant estimates of DOC concentrations due to insufficient observations. In the Missouri region, other factors such as runoff (negative) and soil clay (positive) also significantly affect riverine DOC. For New England, Great Lakes, Arkansas-White-Red, and Texas-Gulf, no variables show significant impact on DOC at the confidence level of 95%. Soil organic matter content has significant positive impact on DOC in Upper Mississippi, Mid-Atlantic, and South Atlantic-Gulf. Wetlands positively affect DOC in California and South Atlantic-Gulf but exert negative influence in Missouri. In the southeastern U.S. (region 15), precipitation tends to negatively affect DOC concentration. Temperature increases DOC in Mid-Atlantic and Lower Mississippi but decreases DOC in Missouri. In the western U.S. (regions 8 and 10), DOC concentrations decrease with drainage area. Barren area exert negative impact on DOC concentration in Ohio. Shrub land has positive effect in Upper Colorado. Although all selected soil properties (soil water content, sand content, and soil bulk density) significantly affect DOC at the national scale, their influences are significant in only four regions, and soil bulk density has varied influence. For example, soil water content exhibits positive impacts in South Atlantic-Gulf, while soil bulk density has positive impact in Pacific Northwest but shows negative influence in Lower Mississippi. DOC concentration tend to be lower in Ohio and Lower Colorado that have higher percentages of first-order streams. Total nitrogen and total phosphorus concentrations positively affect DOC in Great Basin and South Atlantic-Gulf, respectively. Dam density positively affects DOC in Upper Colorado and Ohio but shows negative impact in Mid-Atlantic.
3.4. DOC Variability and Environmental Controls by River Orders
To investigate the variability of DOC concentrations over the river order hierarchy, we regrouped all stations by their Strahler river orders (Figure 3). The stations on the 2nd order rivers have the highest average DOC concentration of 8.37 mg C/L, and these stations also have the highest standard deviation among all six groups (S7 and S8). The lowest concentrations occur at the 1st order stations, with an average of 5.30 mg C/L. Average DOC concentration increases from 5.65 mg C/L to 6.94 mg C/L from order 3 to order 5 rivers. The average DOC concentration for stations on > 6th order rivers is 6.05 mg C/L. Detailed statistics of DOC concentrations by river groups can be found in the Supplementary Material (S7 and S8).
The relative impacts of the selected factors on DOC concentrations vary with river orders. Since we obtained observations for the 1st and 2nd order stations, we combined stations of order 1 through order 3 to derive valid GLM analyses (Table 3). For this combined group, temperature and runoff show significant correlations with DOC. The DOC concentrations of stations on 4th order rivers have positive correlation with soil sand content, soil water content, dam density, and soil organic matter content but demonstrate negative correlation with urban area and runoff. For the 5th order stations, soil sand content, soil water content, dam density, total phosphorus, forest cover, and shrub land have positive correlations, whereas slope and runoff have negative correlations. For the 6th and above order stations, DOC concentrations are positively correlated with soil sand content, soil water content, dam density, soil organic matter, total phosphorus, forest cover, total nitrogen, and wetland but are negatively correlated with urban area, soil bulk density, slope, and runoff.
4. Discussion
4.1. Spatial Patterns of DOC Concentrations
A better understanding of the environmental controls on riverine DOC production and cycling requires a comprehensive analysis based on observational data over different climatic, geological, and hydrological zones [9,28,39]. The variability of DOC concentrations from head waters to downstream regions suggests the importance of considering the spatial patterns of DOC in analyzing DOC dynamics along the terrestrial-aquatic continuum [28,40].
The spatial distribution of high DOC concentrations from this study is consistent with the previous investigations reporting high DOC concentrations in the Upper Mississippi River basin and the southeastern U.S. [41,42]. Similarly, the DOC concentration distribution matches the higher DOC loads in the southeastern parts than other regions of the U.S. [9]. In addition to regions with a large area of wetlands, the coastal plains along the eastern U.S. and Gulf of Mexico also have high DOC concentrations, as a result of high carbon input from riparian swamps in these low-relief landscapes [43,44]. Identifying regions with high DOC concentrations is useful for detecting critical zones where land-to-river transport of DOC may significantly affect the net carbon budgets of terrestrial ecosystems [45].
We did not find consistent patterns of DOC variations and environmental controls across different climatic or hydrological zones. This result corroborates that riverine DOC is regulated by a series of complex and interactively connected processes [17]. Climatic and hydrological factors mainly affect temporal variability rather than spatial distribution of riverine DOC [46,47]. By contrast, for long-term average DOC concentrations, as depicted in our correlation analysis of land cover types, soil properties, and topographic factors, may have more significant impacts than climate factors over large spatial scales [48].
Changes in DOC concentrations by river order reflect the sources of carbon inputs and varied removal rates from headwaters to large rivers [49]. Due to dense riparian plant canopy, litter fall provides the majority of organic carbon loads to headwaters, which is characterized by high bioavailability and decomposition rates. The high litter inputs combined with high decomposition rates favor the generation of DOC and explain the relatively high average DOC concentrations in the 2nd order rivers (Figure 3). For large rivers, terrestrial sources tend to be outweighed by instream processes due to differences in water depth, land cover types, and nutrient conditions, as compared with small streams [49]. The standard deviation for stations on 6th and higher order rivers is smaller than that for low order (order < 5) rivers, which may be caused by the relatively balanced DOC input and removal in downstream regions [50].
4.2. Environmental Controls on DOC Concentrations
Comprehensive statistical analyses of DOC concentrations and environmental controls are necessary and critical for identifying key processes that are regulating aquatic DOC cycling [51,52]. Previous investigations showed large uncertainties or even contrasting results in explaining riverine DOC using climate variables, soil properties, land cover types, and hydrological conditions [17,46,53]. Our analyses, based on the extensive USGS observational dataset, provide a systematic examination of DOC variability and the associated environmental controls at regional and national scales. We observed substantial changes in the role of different environmental factors for explaining variations in DOC concentrations across different water resource regions in the U.S., which testifies to the complexity of coupled-terrestrial aquatic carbon cycling [49,54]. Significant spatial variability in environmental factors resulted in region-specific environmental controls on DOC concentrations [53]. Analyses by river orders indicated that the numbers of factors demonstrating significant controls on DOC increased from headwaters to large basins. This pattern may reflect the increasing complexity and heterogeneity in factors controlling DOC such as land use, human activities, and geographical setting [55,56].
In line with previous site-level investigations [57,58], our analyses highlight the important role of soil properties in determining DOC concentrations. For example, soil organic matter has significant impacts on DOC concentrations [59,60] at the national scale and in major three water resource regions (Table 2). All soil property indicators (i.e., soil sand content, soil water content, and soil bulk density) have significant positive correlations with DOC concentrations at the national-scale, highlighting the important role of soil DOC leachate production and movement for controlling riverine DOC concentrations. DOC adsorption/desorption in soils determines the DOC partition between soil colloids and soil water [61]. Due to the lower adsorption capacity of sandy soils relative to other soil types, saturation of adsorption sites in sandy soils may result in elevated DOC export [62], which may be the reason for the positive impact of soil sand content on DOC concentrations at the national scale. Positive impacts of soil water content on DOC concentrations at the national scale and in the South Atlantic-Gulf region suggest that soil water availability is likely to be a limiting factor in DOC transport from soils to rivers [63].
The results of this study indicate that temperature plays a more important role in affecting DOC spatial variability than hydrological factors (precipitation and runoff), at the national scale. The positive correlation between temperature and DOC concentration is attributable to the fact that the decomposition of litter and soil organic matter is regulated by microbial activities that are sensitive to temperature changes [64]. The findings of this study are also in line with watershed-scale investigation, which demonstrated the significant influence of temperature on DOC [46]. Although the reasons for increased DOC discharge from peat land in recent decades are still under debate [21,51,65], the positive correlation between temperature and DOC concentrations from this study indicate that the potential impact of a warmer climate may enhance soil organic matter loss through DOC export.
Our results also show the important role of wetlands in DOC cycling, as reported previously [66]. Due to the low decomposition rate under anaerobic conditions, wetlands accumulate large amounts of organic carbon and act as important sources of riverine DOC [48]. Forest and shrub land have positive impact, while cropland demonstrates negative influence on DOC concentrations. This may be caused by higher soil organic matter and litter inputs in natural ecosystems than in managed lands, because fresh litter decomposition is an important source of riverine DOC [67]. Additionally, intensive management activities in cropland such as tillage and irrigation may enhance soil organic matter decomposition and reduce DOC leaching from arable soils [68]. The negative influence off urban sprawl may be caused by the reduced water infiltration and associated DOC transport from land surface to deeper soil layers [56]. Our findings highlight the importance of considering the interactions among multiple land use types in explaining the variability of DOC concentrations.
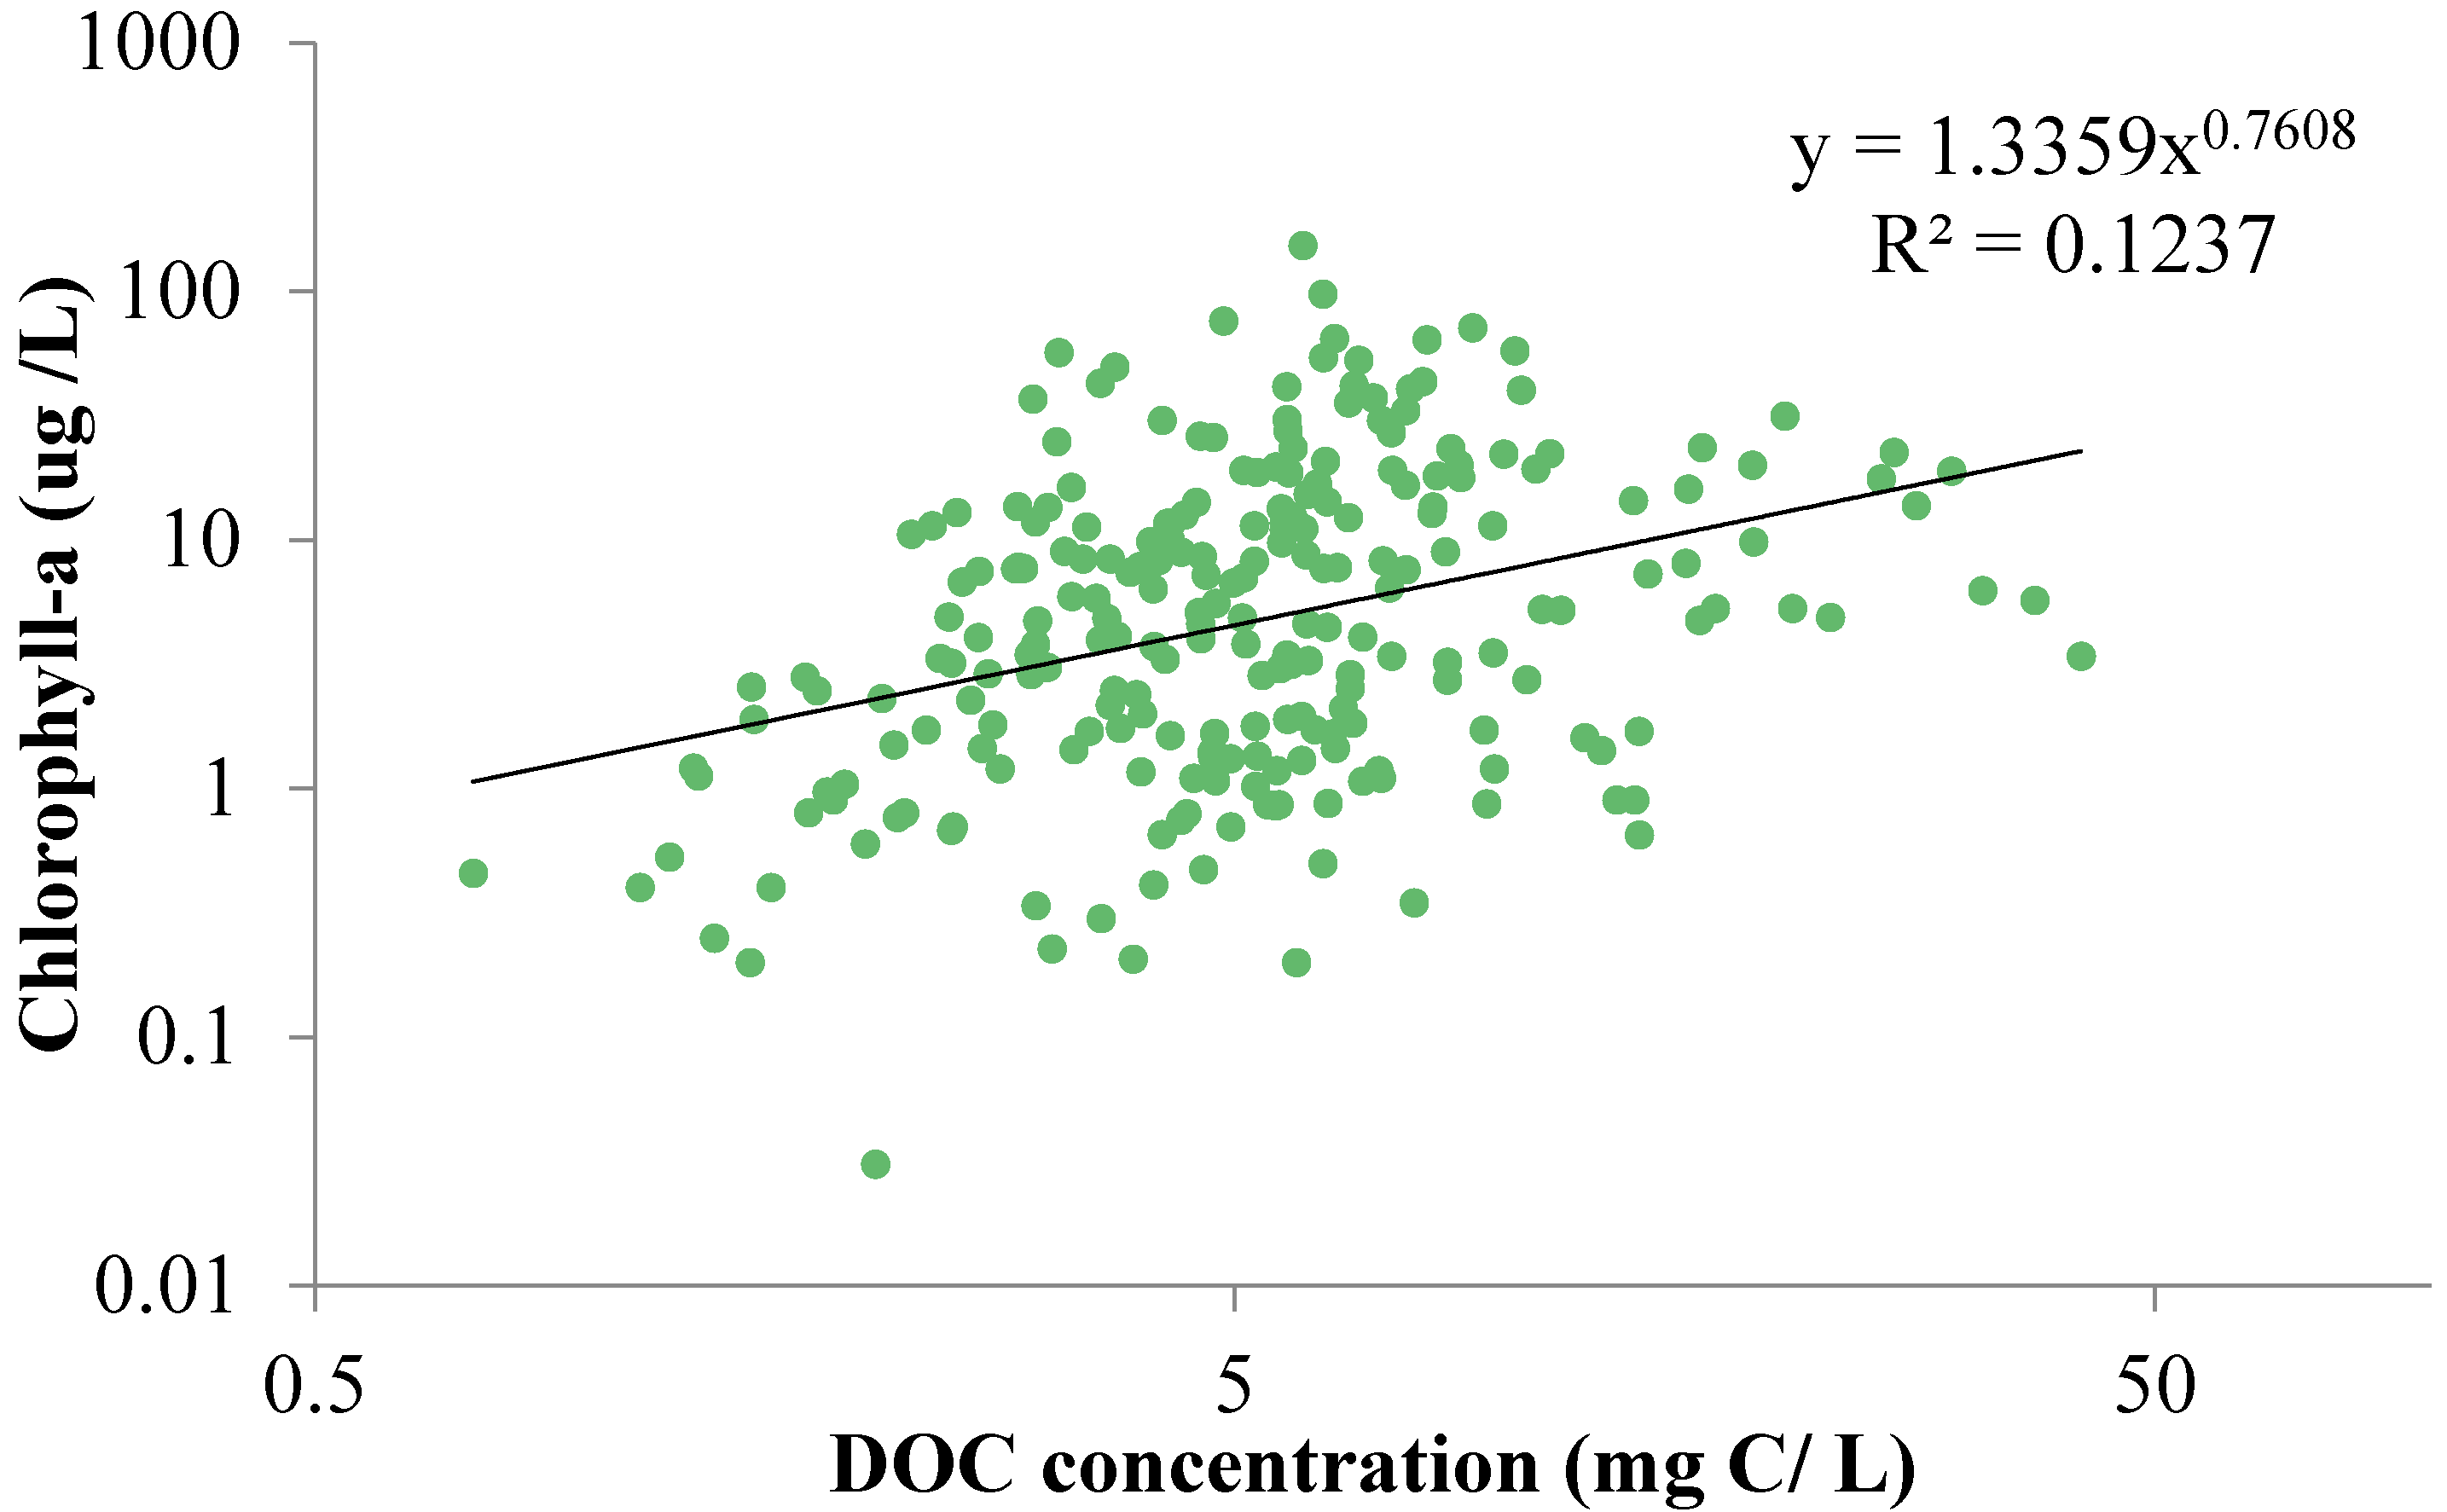
Our analyses also suggest that anthropogenic activities have noticeable impact on riverine DOC concentrations. At the national scale, total phosphorus is an important factor shaping the spatial patterns of DOC concentrations. Positive correlations suggest that instream primary production may have more important impact on DOC flux than previously assumed [1]. In contrast with [46], which reported insignificant impact of in-stream production on DOC, the significant correlation between DOC and chlorophyll-a in this study indicates the important contribution of instream primaryproduction to riverine DOC in the U.S. (Figure 4). The difference between results and those reported earlier [46] may be caused by the higher phosphorus concentrations in U.S. rivers, which enhances in-stream primary production. Our findings are consistent with the conclusions of [68,69] that algae growth can be an important source of riverine organic carbon. Our results also suggest that chemical fertilizer use may alter carbon cycling across the terrestrial-aquatic interface by enhancing algae growth in aquatic ecosystems.
We found that phosphorus, rather than nitrogen, has significant impact on DOC production. This result is in accordance with previous findings that the primary production of aquatic ecosystems is more limited by phosphorus than by nitrogen [70]. The impact of dams should also be taken into consideration in explaining DOC spatial variability [71]. Positive correlations between dam density and DOC concentration may be attributed to the elevated algae growth following the construction of dams [72].
4.3. Interplays among Multiple Processes in Determining DOC Concentrations
DOC concentration in riverine systems reflect the combined impacts of multiple processes during DOC leachate production, transport, and transformation. Factors showing significant correlation with DOC concentrations in the bivariate analyses (Table 1) do not necessarily have significant impact in the multiple-variable regression analysis (Table 2) since some processes may be counteractive and cancel out each other’s influences. The difference between the single- and multi-factor analyses, as demonstrated in Table 1 and Table 2, implies the complex interplays of environmental factors in affecting DOC concentrations. Identifying these interactions helps to elucidate the variability in DOC concentrations across multiple spatial scales.
Temperature either enhances or reduces DOC, and the net effects depend on the balance between its influences on litter and organic carbon decomposition in soils and DOC removal in in riverine systems. The production of DOC leachate during decomposition is sensitive to temperature increase, which leads to the positive correlation between DOC concentrations and temperature [73]. Meanwhile, the removal of DOC from surface waters also increases under warming temperatures [53], and this may be the reason for the negative correlation between temperature and DOC concentrations in the Missouri region (Table 2). The varying role of temperature found in this study corroborates results from seven Swiss rivers with long-term DOC observations [46].
Although wetlands can provide large amounts of organic carbon to downstream waters, we find that wetlands have negative impact on DOC concentrations in the Missouri region. High water tables may change wetlands from DOC sources to sinks as a result of the high DOC retention rates [22]. Admittedly, these assumptions need to be further tested to avoid non-causative correlations.
Dam density has positive influence on DOC at the national level but reduces its concentrations in Mid-Atlantic. Although attenuated flow velocity and prolonged residence time of streamflow following dam construction may favor algae growth, enhanced DOC removal with prolonged residence time in reservoirs may offset this effect and eventually reduce the DOC concentrations [74,75].
4.4. Uncertainties and Future Work
In this study, we analyzed the impacts of terrestrial and aquatic factors on DOC concentrations in riverine systems using statistical models. The GLM models provided valuable insights into understanding the spatial patterns of DOC and the associated physical processes regulating riverine carbon. However, the uncertainties associated with the data and statistical methods should be considered in interpreting the findings of this work. First, additional environmental controls should be included to explain DOC variability. The environmental factors selected for our statistical analyses were primarily from the GAGES–II database. However, other factors such as soil pH, land management activities, nitrogen deposition [76], acid deposition [27], soil iron content [77], duration of the main growing season [78], riparian area, and anthropogenic organic carbon [46] also demonstrated significant impacts on DOC [18]. Therefore, the inclusion of additional factors may contribute to explaining more DOC variability. In addition, only a few stations have long-term DOC observations, and thus hinder the analysis of temporal patterns of DOC in the U.S. Additional field data and experiments are needed to further constrain uncertainties in the statistical analyses.
Second, although the GLM models identify possible aquatic and terrestrial controls of riverine DOC, these impacts need to be further evaluated by fieldwork due to the inherent limitations in statistical models. For example, sample size affects the stability of the correlation coefficient [79]. However, due to the availability of DOC observations, GLM analyses by water resource regions or river orders used different sample sizes, which may have introduced uncertainties into our analyses. We also note that high correlations do not necessarily indicate causal relationships between environmental factors and DOC concentrations. Whether the correlations identified in this study hold in other regions or scales also needs further investigation.
Third, process-based methodologies need to be developed to better understand DOC variability. Although the selected variables and GLM models could explain up to 56% of the DOC variability, there is a large portion of variability left unexplained by the GLM models. Statistical analyses, however, confirm the complex interactions of the terrestrial and aquatic processes that affect riverine DOC at different spatial and temporal scales [46]. As a result, the development of process-rich modeling frameworks will be needed to constrain uncertainties in DOC modeling and to improve our understanding of DOC dynamics in the context of environmental changes.
5. Conclusions
We investigated the spatial variability of riverine DOC concentrations and associated environmental controls using data from over 1402 USGS stations in conterminous U.S. In general, DOC concentrations exhibit high spatial variability at the national level, with an average of 6.42 ± 6.47 mg C/L (Mean ± Standard Deviation). Statistical analyses suggest that the variability of DOC could be partially explained (56% at the national level; 29–78% across the 18 water resources regions) by combining soil properties, temperature, land cover, total phosphorus concentration, and dam density into general multi-linear models. Our findings agree with previous investigations, which emphasized the impacts of soil characteristics, climate, and human activities on riverine organic carbon fluxes. In addition to terrestrial factors, our examination of riverine chlorophyll-a indicates that autochthonous production should not be neglected in understanding DOC dynamics along the terrestrial-aquatic continuum.
Notably, the relative importance of different environmental factors in controlling DOC concentration varies substantially across regions and by river order. We did not identify any single factor that can exert statistically significant impact on DOC concentrations across all eighteen water resource regions in the U.S. and all river orders.
Overall, the high variability of DOC concentration, changes in significant environmental controls across different spatial scales, and remaining unexplained variance in DOC variation point to the complexity of interactions between a series of terrestrial and aquatic processes in regulating riverine DOC. These results highlight the need for process-based, non-linear methodologies that consider both autochthonous and allochthonous carbon sources, transport pathways, and processing of DOC along the terrestrial-aquatic continuum in order to effectively incorporate this important carbon cycling component into regional carbon budgeting.
Supplementary Materials
The following are available online at https://www.mdpi.com/2073-4441/9/6/383/s1. S1: Units of the variables selected for the statistical analyses; S2: Variables transformed for statistical analyses; S3: General linear regression models for the national and regional analyses; S4: Summary of GLM models for the U.S. and 18 water resource regions; S5: Summary of GLM models for the four river order groups; S6: Detailed statistics of DOC concentration observations in the U.S. and 18 water resource regions; S7: Detailed statistics of DOC concentration observations of six river order groups; S8: P values for ANOVA analysis among the six river groups.
Acknowledgments
We sincerely appreciate the valuable comments provided by the anonymous reviewers, which greatly improved the quality of the manuscript. This work was funded by the NASA New Investigator Award (NNH13ZDA001N), the Inter-Agency Carbon Cycle Program (NASA-NNX17AE66G and USDA-2017-67003-26485), the DOE Great Lakes Bioenergy Research Center (DOE BER Office of Science DE-FC02-07ER64494, DOE BER Office of Science KP1601050, DOE EERE OBP 20469-19145), and the NSF INFEWS (1639327).
Author Contributions
This manuscript was prepared through the collaboration of all the coauthors including Q. Yang, X. Zhang, X. Xu, and G. Asrar. Q. Yang and X. Zhang designed this work. Q. Yang, X. Zhang, and X. Xu collected the data. Q. Yang and X. Xu performed data analysis. All coauthors contributed to the analysis and interpretation of data. Q. Yang wrote the first draft of the manuscript. X. Zhang and G. Asrar edited the manuscript.
Conflicts of Interest
The authors declare no conflict of interest.
References
- Cole, J.J.; Prairie, Y.T.; Caraco, N.F.; McDowell, W.H.; Tranvik, L.J.; Striegl, R.G.; Duarte, C.M.; Kortelainen, P.; Downing, J.A.; Middelburg, J.J.; et al. Plumbing the Global Carbon Cycle: Integrating Inland Waters into the Terrestrial Carbon Budget. Ecosystems 2007, 10, 172–185. [Google Scholar] [CrossRef]
- Butman, D.; Raymond, P. Significant efflux of carbon dioxide from streams and rivers in the US_supplementary. Nat. Geosci. 2011, 4, 839–842. [Google Scholar] [CrossRef]
- Raymond, P.A.; Oh, N.-H.; Turner, R.E.; Broussard, W. Anthropogenically enhanced fluxes of water and carbon from the Mississippi River. Nature 2008, 451, 449–452. [Google Scholar] [CrossRef] [PubMed]
- Battin, T.J.; Luyssaert, S.; Kaplan, L.A.; Aufdenkampe, A.K.; Richter, A.; Tranvik, L.J. The boundless carbon cycle. Nat. Geosci. 2009, 2, 598–600. [Google Scholar] [CrossRef]
- Pan, Y.; Birdsey, R.A.; Fang, J.; Houghton, R.; Kauppi, P.E.; Kurz, W.A.; Phillips, O.L.; Shvidenko, A.; Lewis, S.L.; Canadell, J.G.; et al. A large and persistent carbon sink in the world’s forests. Science 2011, 333, 988–993. [Google Scholar] [CrossRef] [PubMed]
- Ciais, P.; Sabine, C.; Bala, G.; Bopp, L.; Brovkin, V.; Canadell, J.; Chhabra, A.; DeFries, R.; Galloway, J.; Heimann, M.; et al. Carbon and Other Biogeochemical Cycles. In Climate Change 2013; Cambridge University Press: Cambridge, UK, 2013; pp. 465–570. [Google Scholar]
- Regnier, P.; Friedlingstein, P.; Ciais, P.; Mackenzie, F.T.; Gruber, N.; Janssens, I.A.; Laruelle, G.G.; Lauerwald, R.; Luyssaert, S.; Andersson, A.J.; et al. Anthropogenic perturbation of the carbon fluxes from land to ocean. Nat. Geosci. 2013, 6, 597–607. [Google Scholar] [CrossRef]
- Mayorga, E.; Seitzinger, S.P.; Harrison, J.A.; Dumont, E.; Beusen, A.H.W.; Bouwman, A.F.; Fekete, B.M.; Kroeze, C.; Van Drecht, G. Global Nutrient Export from WaterSheds 2 (NEWS 2): Model development and implementation. Environ. Model. Softw. 2010, 25, 837–853. [Google Scholar] [CrossRef]
- Stets, E.G.; Striegl, R.G. Carbon export by rivers draining the conterminous United States. Inland Waters 2012, 2, 177–184. [Google Scholar] [CrossRef]
- Marschner, B.; Kalbitz, K. Controls of bioavailability and biodegradability of dissolved organic matter in soils. Geoderma 2003, 113, 211–235. [Google Scholar] [CrossRef]
- Tranvik, L.J. Allochthonous dissolved organic matter as an energy source for pelagic bacteria and the concept of the microbial loop. Hydrobiologia 1992, 229, 107–114. [Google Scholar] [CrossRef]
- Freeman, C.; Lock, M.A. The biofilm polysaccharide matrix: A buffer against changing organic substrate supply? Limnol Oceanogr. 1995, 40, 273–278. [Google Scholar] [CrossRef]
- Dillon, P.J.; Molot, L.A. Dissolved organic and inorganic carbon mass balances in central Ontario lakes. Biogeochemistry 1997, 36, 29–42. [Google Scholar] [CrossRef]
- Scharnweber, K.; Vanni, M.J.; Hilt, S.; Syväranta, J.; Mehner, T. Boomerang ecosystem fluxes: Organic carbon inputs from land to lakes are returned to terrestrial food webs via aquatic insects. Oikos 2014, 123, 1439–1448. [Google Scholar] [CrossRef]
- Cai, W.-J. Estuarine and Coastal Ocean Carbon Paradox: CO2 Sinks or Sites of Terrestrial Carbon Incineration? Ann. Rev. Mar. Sci. 2011, 3, 123–145. [Google Scholar] [CrossRef] [PubMed]
- Bauer, J.E.; Cai, W.-J.; Raymond, P.A.; Bianchi, T.S.; Hopkinson, C.S.; Regnier, P.A.G. The changing carbon cycle of the coastal ocean. Nature 2013, 504, 61–70. [Google Scholar] [CrossRef] [PubMed]
- Jones, T.G.; Evans, C.D.; Jones, D.L.; Hill, P.W.; Freeman, C. Transformations in DOC along a source to sea continuum: Impacts of photo-degradation, biological processes and mixing. Aquat Sci. 2016, 78, 433–446. [Google Scholar] [CrossRef]
- Kalbitz, K.; Solinger, S.; Park, J.-H.; Michalzik, B.; Matzner, E. Controls on the dynamics of dissolved organic matter in soils: A review. Soil Sci. 2000, 165, 277–304. [Google Scholar] [CrossRef]
- Cox, P.M.; Betts, R.A.; Jones, C.D.; Spall, S.A.; Totterdell, I.J. Acceleration of global warming due to carbon-cycle feedbacks in a coupled climate model. Nature 2000, 408, 184–187. [Google Scholar] [CrossRef] [PubMed]
- Gielen, B.; Neirynck, J.; Luyssaert, S.; Janssens, I.A. The importance of dissolved organic carbon fluxes for the carbon balance of a temperate Scots pine forest. Agric. For. Meteorol. 2011, 151, 270–278. [Google Scholar] [CrossRef]
- Freeman, C.; Evans, C.D.; Monteith, D.T.; Reynolds, B.; Fenner, N. Export of organic carbon from peat soils. Nature 2001, 412, 785. [Google Scholar] [CrossRef] [PubMed]
- Pastor, J.; Solin, J.; Bridgham, S.D.; Updegraff, K.; Harth, C.; Weishampel, P. Global warming and the export of dissolved organic carbon from boreal peatlands. Oikos 2003, 100, 380–386. [Google Scholar] [CrossRef]
- Wallin, M.; Buffam, I.; Öquist, M.; Laudon, H.; Bishop, K. Temporal and spatial variability of dissolved inorganic carbon in a boreal stream network: Concentrations and downstream fluxes. J. Geophys. Res. 2010, 115, 1–12. [Google Scholar] [CrossRef]
- Delpla, I.; Jones, T.G.; Monteith, D.T.; Hughesb, D.D.; Baurèsa, E.; Junga, A.; Thomasa, O.; Freeman, C. Heavy Rainfall Impacts on Trihalomethane Formation in Contrasting Northwestern European Potable Waters. J. Environ. Qual. 2015, 44, 1241–1251. [Google Scholar] [CrossRef] [PubMed]
- Raymond, P.; Oh, N.-H. An empirical study of climatic controls on riverine C export from three major U.S. watersheds. Glob. Biogeochem. Cycles 2007, 21. [Google Scholar] [CrossRef]
- Raymond, P.A.; Saiers, J.E. Event controlled DOC export from forested watersheds. Biogeochemistry 2010, 100, 197–209. [Google Scholar] [CrossRef]
- Sawicka, K.; Monteith, D.T.; Vanguelova, E.I.; Wade, A.J.; Clark, J.M. Fine-scale temporal characterization of trends in soil water dissolved organic carbon and potential drivers. Ecol. Indic. 2016, 68, 36–51. [Google Scholar] [CrossRef]
- Meyer-Jacob, C.; Tolu, J.; Bigler, C.; Yang, H.; Bindler, R. Early land use and centennial scale changes in lake-water organic carbon prior to contemporary monitoring. Proc. Natl. Acad. Sci. USA 2015, 112, 6579–6584. [Google Scholar] [CrossRef] [PubMed]
- Monteith, D.T.; Henrys, P.A.; Evans, C.D.; Malcolm, I.; Shilland, E.M.; Pereira, M.G. Spatial controls on dissolved organic carbon in upland waters inferred from a simple statistical model. Biogeochemistry 2015, 123, 363–377. [Google Scholar] [CrossRef]
- Hope, D.; Billett, M.F.; Cresser, M.S. A review of the Export of Carbon in River Water:Fluxes and Processes. Environ. Pollut. 1994, 84, 301–324. [Google Scholar] [CrossRef]
- Kindler, R.; Siemens, J.; Kaiser, K.; Walmsley, D.C.; Bernhofer, C.; Buchmann, N.; Cellier, P.; Eugster, W.; Gleixner, G.; Grũnwald, T.; et al. Dissolved carbon leaching from soil is a crucial component of the net ecosystem carbon balance. Glob. Chang. Biol. 2011, 17, 1167–1185. [Google Scholar] [CrossRef]
- Laudon, H.; Buttle, J.; Carey, S.K.; McDonnell, J.; McGuire, K.; Seibert, J.; Shanley, J.; Soulsby, C.; Tetzlaff, D. Cross-regional prediction of long-term trajectory of stream water DOC response to climate change. Geophys. Res. Lett. 2012, 39, L18404. [Google Scholar] [CrossRef]
- Don, A.; Schulze, E.D. Controls on fluxes and export of dissolved organic carbon in grasslands with contrasting soil types. Biogeochemistry 2008, 91, 117–131. [Google Scholar] [CrossRef]
- Camino-Serrano, M.; Gielen, B.; Luyssaert, S.; Ciais, P.; Vicca, S.; Guenet, B.; De Vos, B.; Cools, N.; Ahrens, B.; Altaf Arain, M.; et al. Linking variability in soil solution dissolved organic carbon to climate, soil type, and vegetation type. Glob. Biogeochem. Cycles 2014, 28, 497–509. [Google Scholar] [CrossRef]
- Gotway, C.A.; Helsel, D.R.; Hirsch, R.M. Statistical Methods in Water Resources. Technometrics 1994, 36, 323. [Google Scholar] [CrossRef]
- Falcone, J.A. GAGES–II, Geospatial Attributes of Gages for Evaluating Streamflow; USGS: Semaj Christon, CV, USA, 2011.
- Yang, Q.; Zhang, X.; Xu, X.; Asrar, G.R.; Smith, R.A.; Shih, J.-S.; Duan, S. Spatial patterns and environmental controls of particulate organic carbon in surface waters in the conterminous United States. Sci. Total Environ. 2016, 554–555, 266–275. [Google Scholar] [CrossRef] [PubMed]
- Helsel, D.R.; Hirsch, R.M. Chapter A3, Statistical Methods in Water Resources. In Techniques of Water Resources Investigations, Book 4; U.S. Geological Survey: Reston, VA, USA, 2002. [Google Scholar]
- Tian, H.; Yang, Q.; Najjar, R.; Ren, W.; Friedrichs, M.A.M.; Hopkinson, C.S.; Pan, S. Anthropogenic and climatic influences on carbon fluxes from eastern North America to the Atlantic Ocean: A process-based modeling study. J. Geophys. Res. Biogeosci. 2015, 120, 757–772. [Google Scholar] [CrossRef]
- Argerich, A.; Haggerty, R.; Johnson, S.L.; Wondzell, S.M.; Dosch, N.; Corson-Rikert, H.; Ashkenas, L.R.; Pennington, R.; Thomas, C.K. Comprehensive multi-year carbon budget of a temperate headwater stream. J. Geophys. Res. Biogeosci. 2016, 121, 1306–1315. [Google Scholar] [CrossRef]
- Grubaugh, J.W.; Anderson, R.V. Upper Mississippi River: Seasonal and floodplain forest influences on organic matter transport. Hydrobiologia 1989, 174, 235–244. [Google Scholar] [CrossRef]
- Spencer, R.G.M.; Butler, K.D.; Aiken, G.R. Dissolved organic carbon and chromophoric dissolved organic matter properties of rivers in the USA. J. Geophys. Res. 2012, 117, G03001. [Google Scholar] [CrossRef]
- Tank, J.; Rosi-Marshall, E.; Griffiths, N.A.; Entrekin, S.A.; Stephen, M.L. A review of allochthonous organic matter dynamics and metabolism in streams. J. North. Am. Benthol. Soc. 2010, 29, 118–146. [Google Scholar] [CrossRef]
- Pan, S.; Li, G.; Yang, Q.; Ouyang, Z.; Lockaby, G.; Tian, H. Monitoring Land-Use and Land-Cover Change in the Eastern Gulf Coastal Plain 3 using Multi-temporal Landsat imagery. J. Geophys. Remote Sens. 2013, 2, 1–7. [Google Scholar]
- Ciais, P.; Borges, A.V.; Abril, G.; Meybeck, M.; Folberth, G.; Hauglustaine, D.; Janssens, I.A. The impact of lateral carbon fluxes on the European carbon balance. Biogeosciences 2008, 5, 1259–1271. [Google Scholar] [CrossRef]
- Räike, A.; Kortelainen, P.; Mattsson, T.; Thomas, D.N. 36 year trends in dissolved organic carbon export from Finnish rivers to the Baltic Sea. Sci. Total Environ. 2012, 435–436, 188–201. [Google Scholar] [CrossRef] [PubMed]
- Rodríguez-Murillo, J.C.; Zobrist, J.; Felella, M. Temporal trends in organic carbon content in the main Swiss rivers, 1974–2010. Sci. Total Environ. 2015, 502, 206–217. [Google Scholar] [CrossRef] [PubMed]
- Laudon, H.; Berggren, M.; Ågren, A.; Buffam, I.; Bishop, K.; Grabs, T.; Jansson, M.; Köhler, S. Patterns and Dynamics of Dissolved Organic Carbon (DOC) in Boreal Streams: The Role of Processes, Connectivity, and Scaling. Ecosystems 2011, 14, 880–893. [Google Scholar] [CrossRef]
- Creed, I.F.; Mcknight, D.M.; Pellerin, B.A.; Green, M.B.; Bergamaschi, B.A.; Aiken, G.R.; Burns, D.A.; Findlay, S.E.G.; Shanley, J.B.; Striegl, R.G.; et al. The river as a chemostat: Fresh perspectives on dissolved organic matter flowing down the river continuum. Can. J. Fish. Aquat. Sci. 2015, 14, 1–14. [Google Scholar] [CrossRef]
- Webster, J.R. Spiraling down the river continuum: Stream ecology and the U-shaped curve. J. North. Am. Benthol. Soc. 2007, 26, 375–389. [Google Scholar] [CrossRef]
- Webster, J.R.; Meyer, J.L.; Wallace, J.B.; Benfield, E.F. Organic matter dynamics in Hugh White Creak, Coweeta Hydrologica Laboratory, North Carolina, USA. J. North Am. Benthol. Soc. 1997, 16, 74–78. [Google Scholar] [CrossRef]
- Sobek, S.; Tranvik, L.J.; Prairie, Y.T.; Kortelainen, P.; Cole, J.J. Patterns and regulation of dissolved organic carbon: An analysis of 7500 widely distributed lakes. Limnol. Oceanogr. 2007, 52, 1208–1219. [Google Scholar] [CrossRef]
- Larsen, S.; Andersen, T.; Hessen, D.O. Climate change predicted to cause severe increase of organic carbon in lakes. Glob. Chang. Biol. 2011, 17, 1186–1192. [Google Scholar] [CrossRef]
- Tranvik, L.J.; Jansson, M. Terrestrial expport of organic carbon. Nature 2002, 415, 861–862. [Google Scholar] [CrossRef]
- Hanson, P.C.; Pace, M.L.; Carpenter, S.R.; Cole, J.J.; Stanley, E.H. Integrating Landscape Carbon Cycling: Research Needs for Resolving Organic Carbon Budgets of Lakes. Ecosystems 2014, 363–375. [Google Scholar] [CrossRef]
- Poff, N.L.; Bledsoe, B.P.; Cuhaciyan, C.O. Hydrologic variation with land use across the contiguous United States: Geomorphic and ecological consequences for stream ecosystems. Geomorphology 2006, 79, 264–285. [Google Scholar] [CrossRef]
- Lumsdon, D.G.; Stutter, M.I.; Cooper, R.J.; Manson, J.R. Model assessment of biogeochemical controls on dissolved organic carbon partitioning in an acid organic soil. Environ. Sci. Technol. 2005, 39, 8057–8063. [Google Scholar] [CrossRef] [PubMed]
- Park, J.; Kalbitz, K.; Matzner, E. Resource control on the production of dissolved organic carbon and nitrogen in a deciduous forest floor. Soil Biol. Biochem. 2002, 34, 813–822. [Google Scholar] [CrossRef]
- Jutras, M.F.; Nasr, M.; Castonguay, M.; Pit, C.; Pomeroy, J.H.; Smith, T.P.; Zhang, C.F.; Ritchie, C.D.; Meng, F.R.; Clair, T.A.; et al. Dissolved organic carbon concentrations and fluxes in forest catchments and streams: DOC-3 model. Ecol. Model. 2011, 222, 2291–2313. [Google Scholar] [CrossRef]
- Kaiser, K.; Guggenberger, G.; Haumaier, L.; Zech, W. The composition of dissolved organic matter in forest soil solutions: Changes induced by seasons and passage through the mineral soil. Org. Geochem. 2002, 33, 307–318. [Google Scholar] [CrossRef]
- Kothawala, D.N.; Moore, T.R.; Hendershot, W.H. Adsorption of dissolved organic carbon to mineral soils: A comparison of four isotherm approaches. Geoderma 2008, 148, 43–50. [Google Scholar] [CrossRef]
- McCarthy, J.F.; Gu, B.; Liang, L.; Mas-Pla, J.; Williams, T.M.; Yeh, T.C. Field tracer tests on the mobility of natural organic matter in a sandy aquifer. Water Resour. Res. 1996, 32, 1223–1238. [Google Scholar] [CrossRef]
- Royer, T.V.; David, M.B. Export of dissolved organic carbon from agricultural streams in Illinois, USA. Aquat. Sci. 2005, 67, 465–471. [Google Scholar] [CrossRef]
- Kätterer, T.; Reichstein, M.; Andren, O.; Lomander, A. Temperature dependence of organic matter decomposition: A critical review using literature data analyzed with different models. Biol. Fertil. Soils 1998, 27, 258–262. [Google Scholar] [CrossRef]
- Hruska, J.; Krám, P.; McDowell, W.H.; Oulehle, F. Increased dissolved organic carbon (DOC) in Central European streams is driven by reductions in ionic strength rather than climate change or decreasing acidity. Environ. Sci. Technol. 2009, 43, 4320–4326. [Google Scholar] [CrossRef] [PubMed]
- Mulholland, P.J. Dissolved organic matter concentration and flux in streams. J. North. Am. Benthol. Soc. 1997, 16, 131–141. [Google Scholar] [CrossRef]
- Alvarez-Cobelas, M.; Angeler, D.G.; Sánchez-Carrillo, S.; Almendros, G. A worldwide view of organic carbon export from catchments. Biogeochemistry 2010, 107, 275–293. [Google Scholar] [CrossRef]
- Toosi, E.R.; Schmidt, J.P.; Castellano, M.J. Land use and hydrologic flowpaths interact to affect dissolved organic matter and nitrate dynamics. Biogeochemistry 2014, 120, 89–104. [Google Scholar] [CrossRef]
- Shih, B.J.; Alexander, R.B.; Smith, R.A.; Boyer, E.W.; Schwarz, G.E.; Chung, S. An Initial SPARROW Model of Land Use and In-Stream Controls on Total Organic Carbon in Streams of the Conterminous United States; USGS: Semaj Christon, CV, USA, 2010.
- Elser, J.J.; Bracken, M.E.S.; Cleland, E.E.; Gruner, D.S.; Harpole, W.S.; Hillebrand, H.; Ngai, J.T.; Seabloom, E.W.; Shurin, J.B.; Smith, J.E. Global analysis of nitrogen and phosphorus limitation of primary producers in freshwater, marine and terrestrial ecosystems. Ecol. Lett. 2007, 10, 1135–1142. [Google Scholar] [CrossRef] [PubMed]
- Li, G.; Wang, X.T.; Yang, Z.; Mao, C.; West, A.J.; Ji, J. Dam-triggered organic carbon sequestration makes the Changjiang (Yangtze) river basin (China) a significant carbon sink. 2015, 120, 39–53. [Google Scholar] [CrossRef]
- Elhatip, H.; Kömür, M.A. Evaluation of water quality parameters for the Mamasin dam in Aksaray City in the central Anatolian part of Turkey by means of artificial neural networks. Environ. Geol. 2008, 53, 1157–1164. [Google Scholar] [CrossRef]
- Wilson, H.F.; Saiers, J.E.; Raymond, P.A.; Sobczak, W.V. Hydrologic Drivers and Seasonality of Dissolved Organic Carbon Concentration, Nitrogen Content, Bioavailability, and Export in a Forested New England Stream. Ecosystems 2013, 16, 604–616. [Google Scholar] [CrossRef]
- Friedl, G.; Wüest, A. Disrupting biogeochemical cycles—Consequences of damming. Aquat. Sci. 2002, 64, 55–65. [Google Scholar] [CrossRef]
- Duan, S.; Bianchi, T.S.; Sampere, T.P. Temporal variability in the composition and abundance of terrestrially-derived dissolved organic matter in the lower Mississippi and Pearl Rivers. Mar. Chem. 2007, 103, 172–184. [Google Scholar] [CrossRef]
- Findlay, S.E.G. Increased carbon transport in the Hudson River: Unexpected consequence of nitrogen deposition? Front. Ecol. Environ. 2005, 3, 133–137. [Google Scholar] [CrossRef]
- Nieminen, M.; Koskinen, M.; Sarkkola, S.; Laurén, A.; Kaila, A.; Kiikkilä, O.; Nieminen, T.M.; Ukonmaanaho, L. Dissolved organic carbon export from harvested peatland forests with differing site characteristics. Water. Air. Soil Pollut. 2015, 226, 181. [Google Scholar] [CrossRef]
- Weyhenmeyer, G.A.; Karlsson, J. Nonlinear response of dissolved organic carbon concentrations in boreal lakes to increasing temperatures. Limnol. Oceanogr. 2009, 54, 2513–2519. [Google Scholar] [CrossRef]
- Altman, N.; Krzywinski, M. Points of Significance: Association, correlation and causation. Nature Methods. 2015, 12, 899–900. [Google Scholar] [CrossRef] [PubMed]
Figure 1.
Dissolved organic carbon (DOC) concentrations across selected United States Geological Survey (USGS) gauges.
Figure 1.
Dissolved organic carbon (DOC) concentrations across selected United States Geological Survey (USGS) gauges.
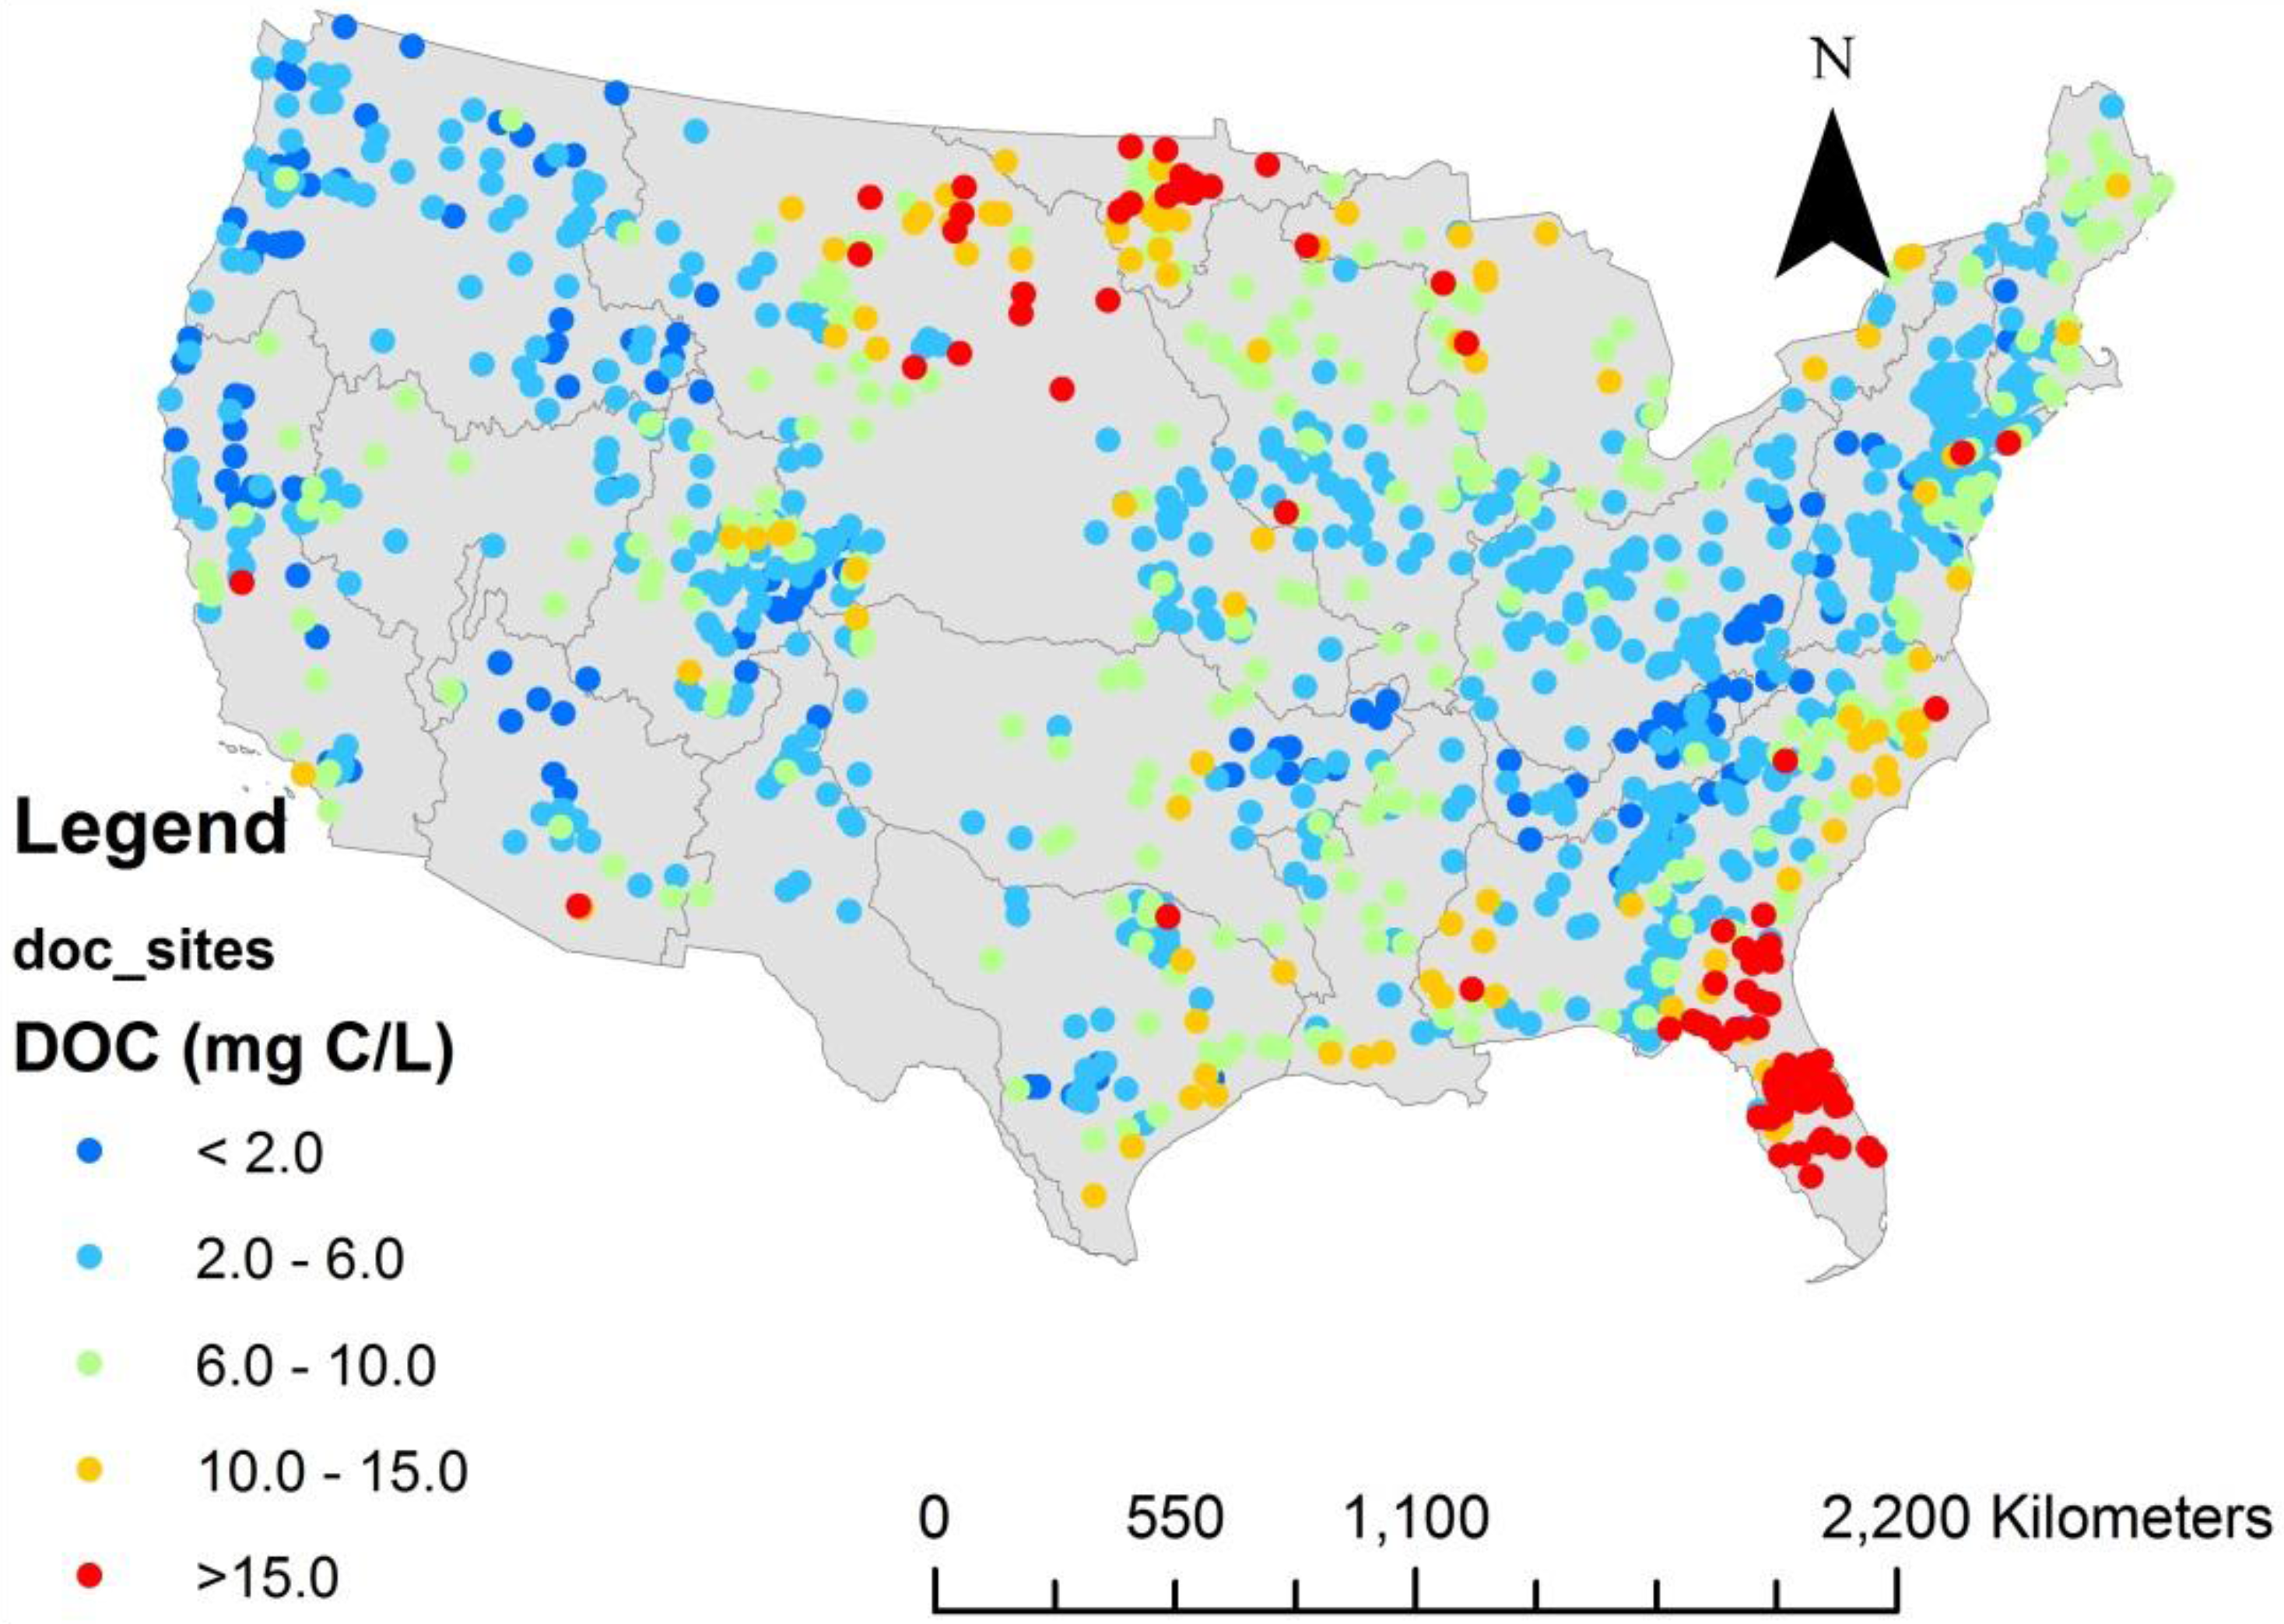
Figure 2.
DOC concentrations across water resource regions in the U.S. (Region 1: Pacific Northwest; Region 2: Missouri; Region 3: New England; Region 4: Souris-Red-Rainy; Region 5: Great Lakes; Region 6: Upper Mississippi; Region 7: Mid-Atlantic; Region 8: California; Region 9: Great Basin; Region 10: Upper Colorado; Region 11: Ohio; Region 12: Lower Colorado; Region 13: Arkansas-White-Red; Region 14: Rio Grande; Region 15: South Atlantic-Gulf; Region 16: Tennessee; Region 17: Lower Mississippi; Region 18: Texas-Gulf). Error bars indicate the standard deviation.
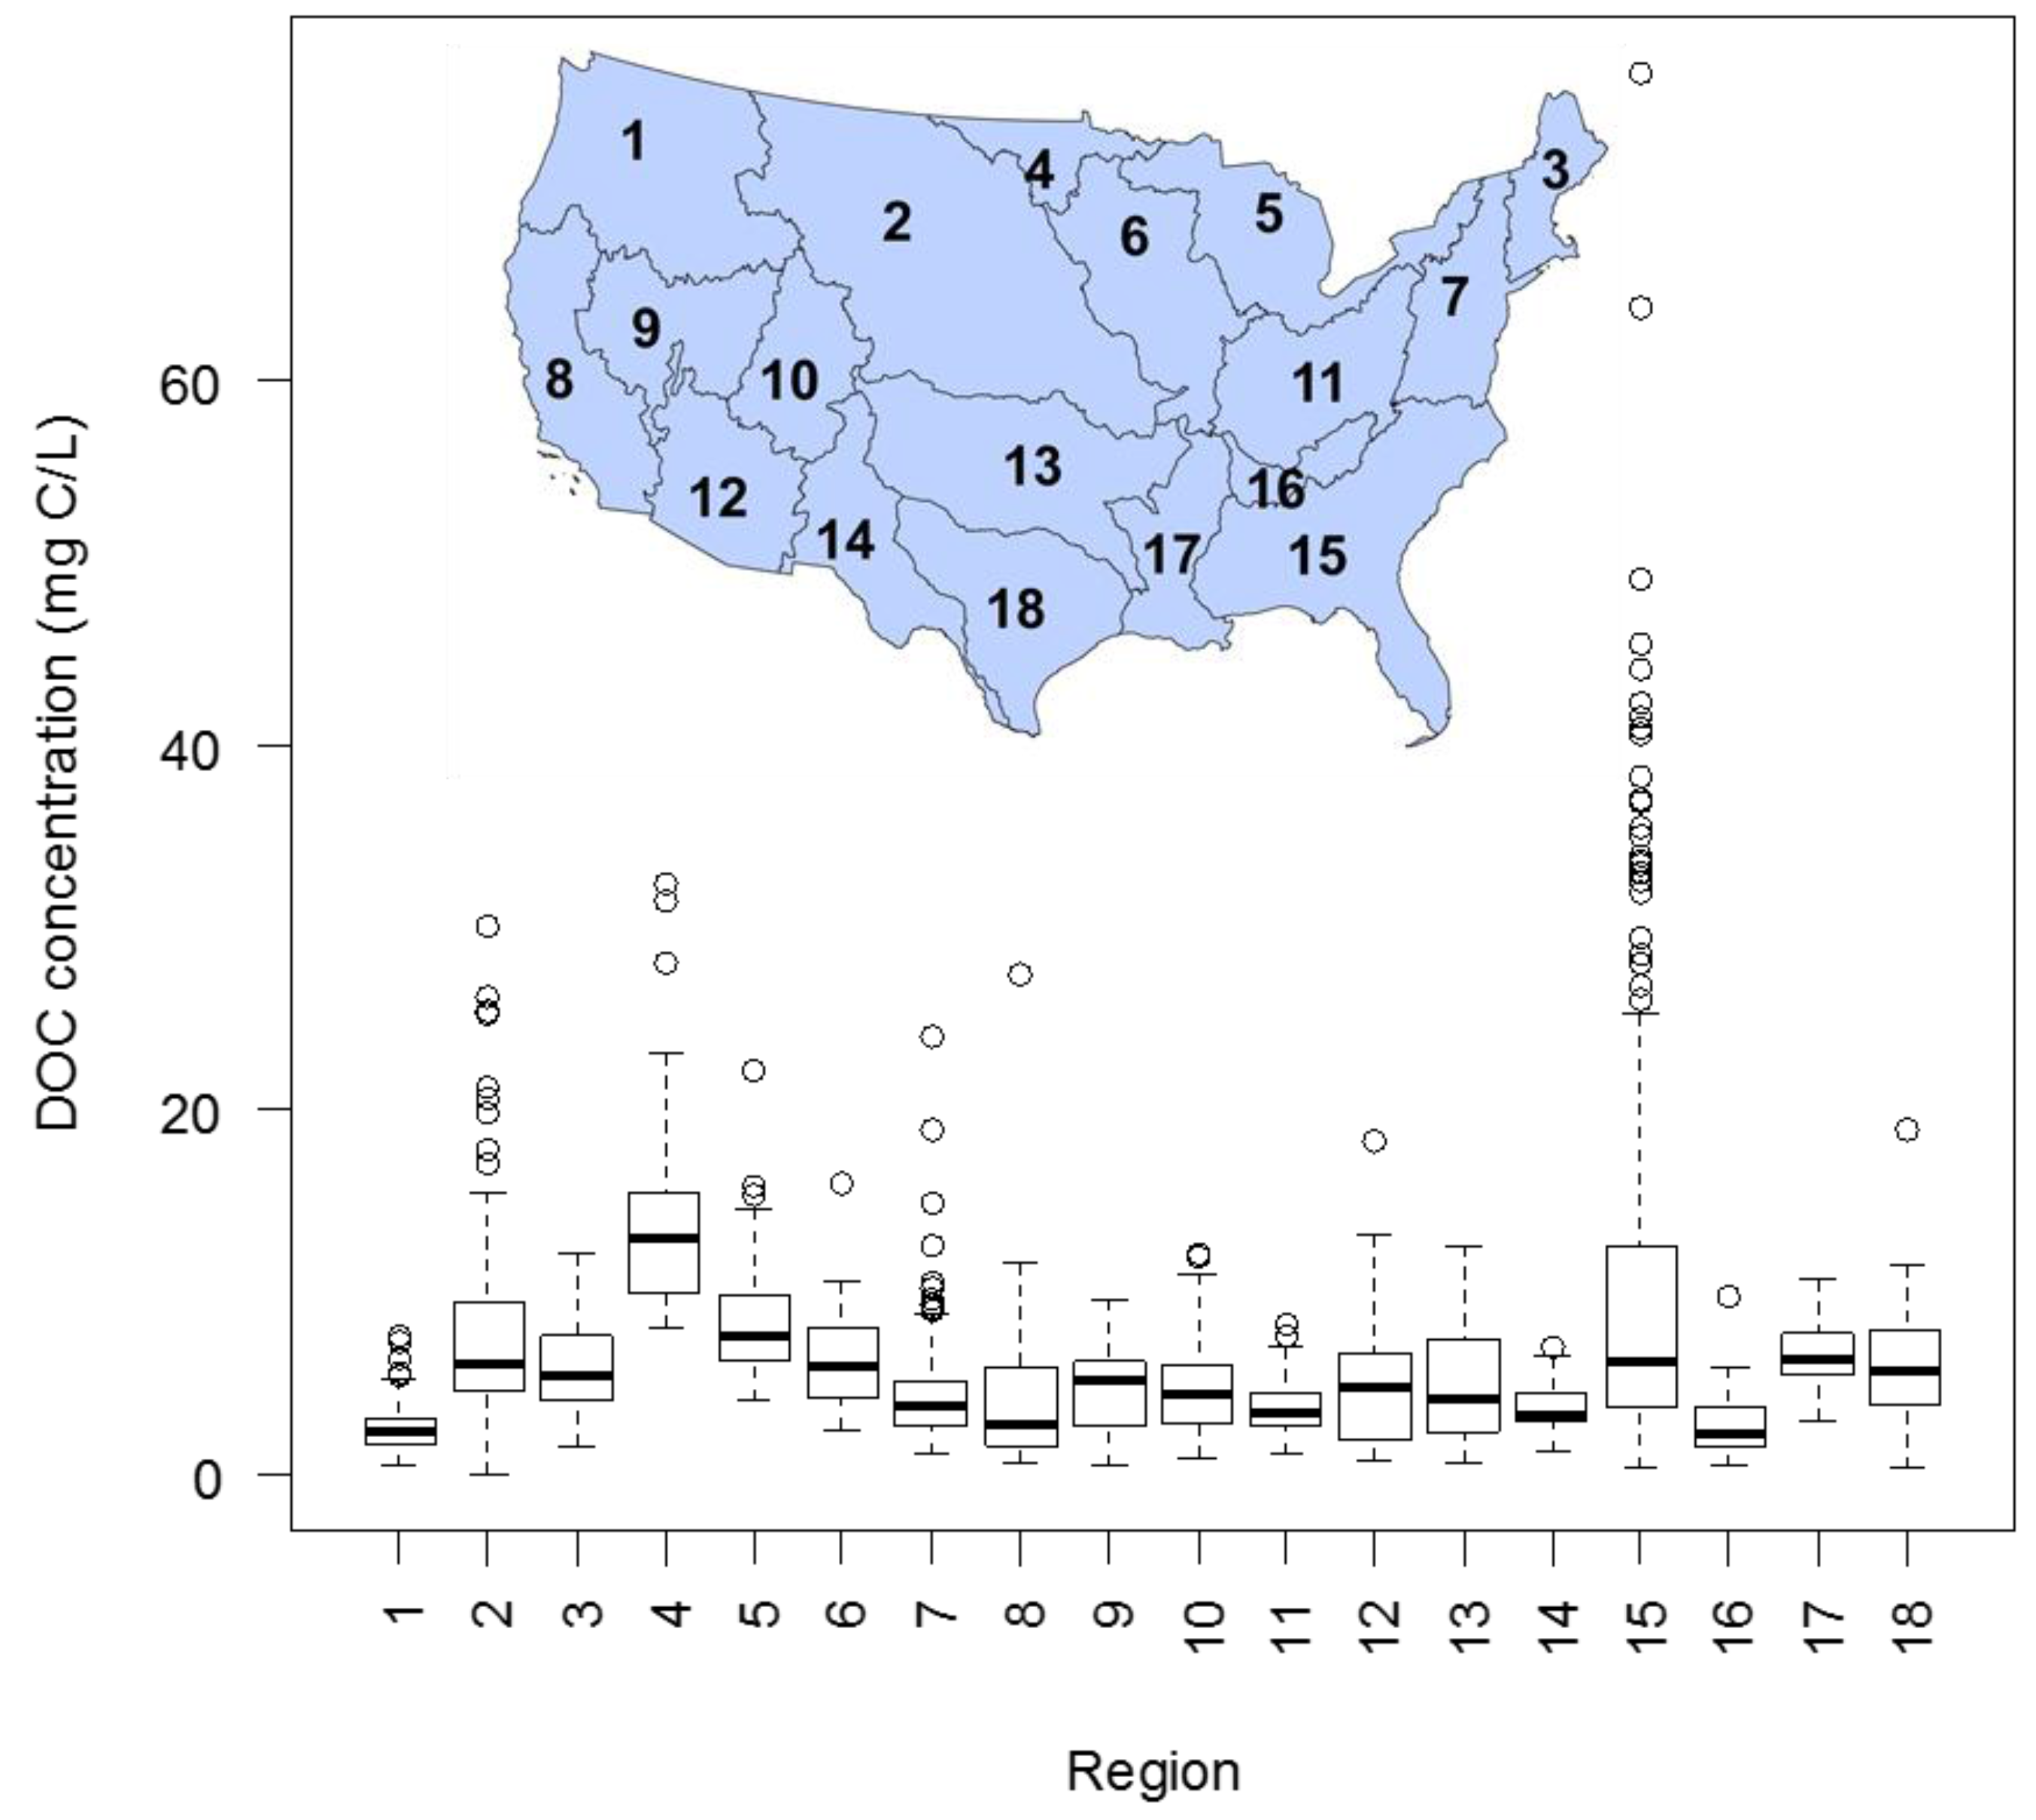
Figure 3.
Variation in DOC concentrations by river orders (Order 1: 40 stations; Order 2: 119 stations; Order 3: 202 stations; Order 4: 303 stations; Order 5: 321 stations; Order 6: 417 stations).
Figure 3.
Variation in DOC concentrations by river orders (Order 1: 40 stations; Order 2: 119 stations; Order 3: 202 stations; Order 4: 303 stations; Order 5: 321 stations; Order 6: 417 stations).
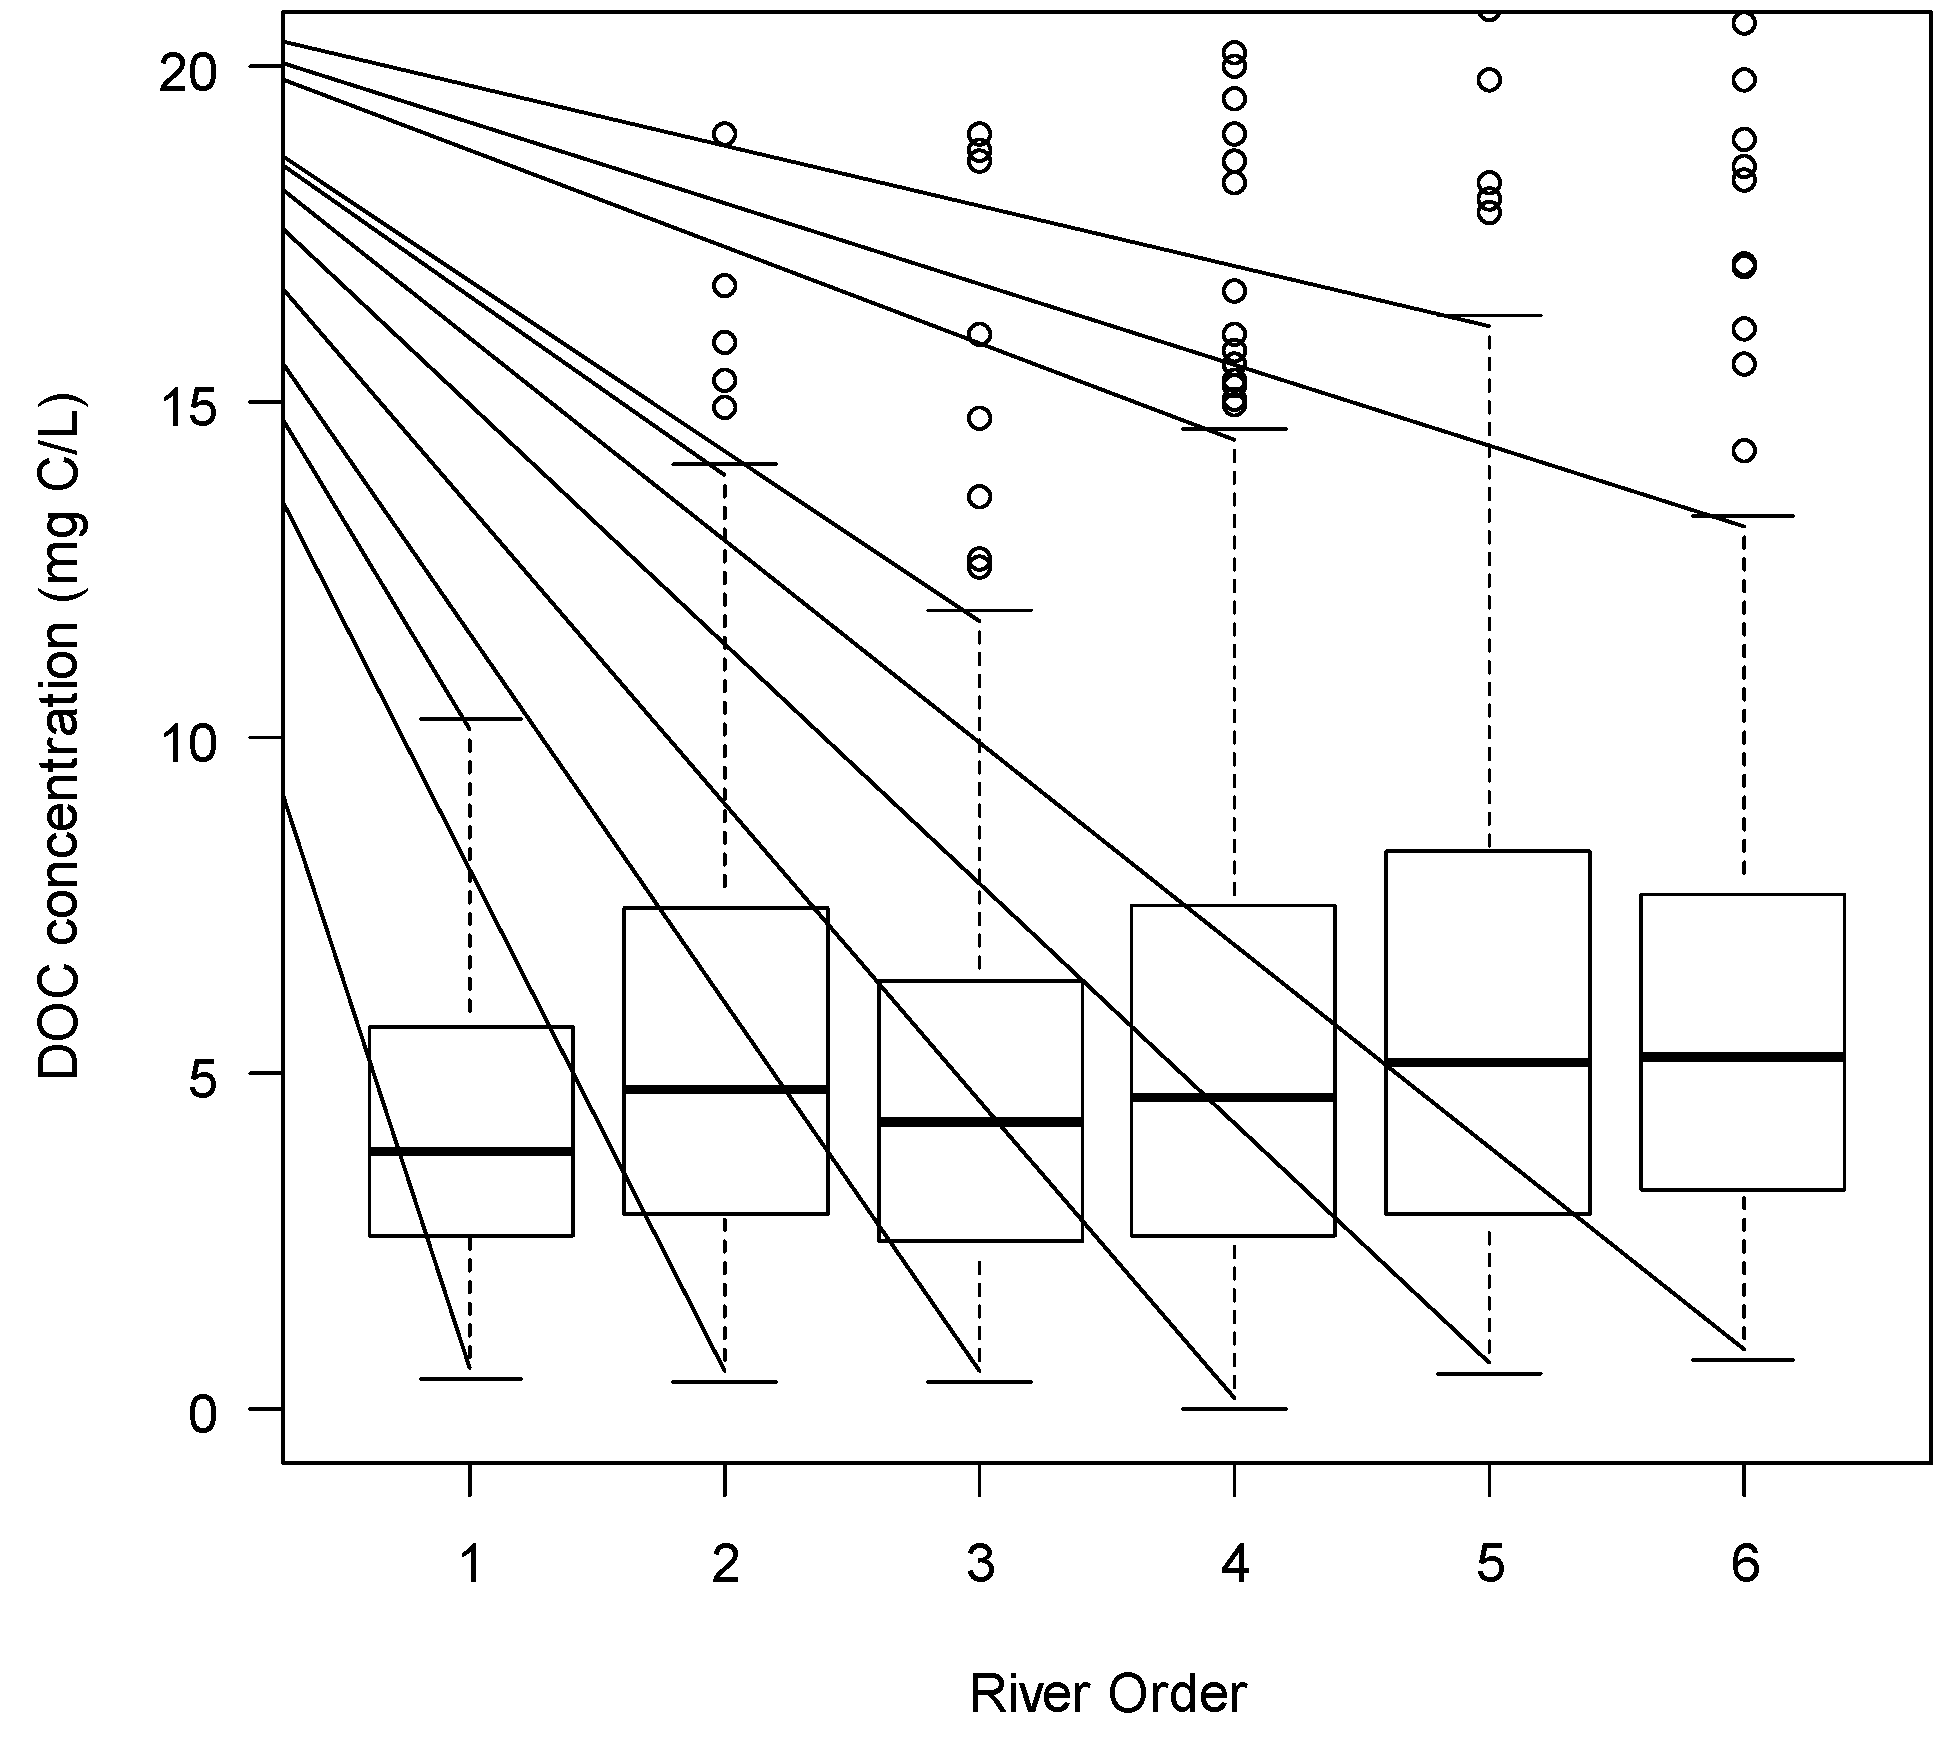
Figure 4.
Scatter plot and linear regression between DOC concentration and chlorophyll-a.


Table 1.
Bivariate analyses of environmental controls on DOC concentrations at the national scale (1402 stations).
Table 1.
Bivariate analyses of environmental controls on DOC concentrations at the national scale (1402 stations).
| Variables | F-Value | Slope | p-Value | Ad-R2 | Y-Intercept |
|---|---|---|---|---|---|
| DOC T versus slope T | 754.4 | −0.295 | <0.001 | 0.35 | 0.864 |
| DOC T versus wetlands T | 406.2 | 0.18 | <0.001 | 0.23 | 0.65 |
| DOC T versus forest | 318 | −0.005 | <0.001 | 0.185 | 0.87 |
| DOC T versus total phosphorus T | 178.8 | 0.22 | <0.001 | 0.12 | 0.90 |
| DOC T versus % of 1st order river | 153.5 | −0.887 | <0.001 | 0.10 | 2.23 |
| DOC T versus total nitrogen T | 143.6 | 0.20 | <0.001 | 0.10 | 0.68 |
| DOC T versus soil organic matter T | 125.3 | 0.24 | <0.001 | 0.08 | 0.67 |
| DOC T versus cropland T | 90.6 | 0.072 | <0.001 | 0.07 | 0.69 |
| DOC T versus soil sand | 100.1 | 0.00047 | <0.001 | 0.07 | 0.503 |
| DOC T versus soil water | 64.47 | 0.66 | <0.001 | 0.04 | 1.27 |
| DOC T versus soil bulk density | 59.24 | 2.3 | <0.001 | 0.04 | 0.33 |
| DOC T versus barren surface T | 54.18 | −0.08 | <0.001 | 0.04 | 0.62 |
| DOC T versus Temperature | 54.53 | 0.22 | <0.001 | 0.036 | 0.47 |
| DOC T versus precipitation T | 53.36 | −0.34 | <0.001 | 0.036 | 1.36 |
| DOC T versus drainage area T | 21.21 | 0.04 | <0.001 | 0.014 | 0.57 |
| DOC T versus runoff T | 234.4 | −0.30 | <0.001 | 0.014 | 1.41 |
| DOC T versus urban area T | 15.7 | 0.040 | <0.001 | 0.01 | 0.68 |
| DOC T versus dam density T | 0.01 | 0.002 | 0.91 | −0.0009 | 0.68 |
| DOC T versus soil clay | 10.15 | −0.002 | 0.0015 | 0.0006 | 0.74 |
| DOC T versus shrub land T | 0.72 | −0.0069 | 0.40 | −0.0002 | 0.68 |
T indicates that variables are log-transformed; Ad-R2: adjusted coefficient of determination.
Table 2.
General linear regression between environmental factors and DOC concentrations at the national and regional levels.
Table 2.
General linear regression between environmental factors and DOC concentrations at the national and regional levels.
| Geographic Region | Om | Sd | Damd | T | Wet | Tp | Shrb | Sw | Fost | Sand | Tn | Clay | R1st | Area | Ppt | R | Barr | Crop | Urbn | Slop | Ad-R2 | Stations |
|---|---|---|---|---|---|---|---|---|---|---|---|---|---|---|---|---|---|---|---|---|---|---|
| The U.S. | P ** | P * | P * | P ** | P * | P ** | P ** | P ** | P ** | P ** | N * | N ** | N * | 0.56 | 1402 | |||||||
| Region 1 | P * | 0.47 | 111 | |||||||||||||||||||
| Region 2 | P * | N ** | N * | P * | N * | 0.54 | 128 | |||||||||||||||
| Region 3 | 0.48 | 61 | ||||||||||||||||||||
| Region 4 | NA | 28 | ||||||||||||||||||||
| Region 5 | 0.47 | 64 | ||||||||||||||||||||
| Region 6 | P * | 0.29 | 72 | |||||||||||||||||||
| Region 7 | P * | N * | P * | 0.44 | 174 | |||||||||||||||||
| Region 8 | P * | N * | 0.54 | 58 | ||||||||||||||||||
| Region 9 | P * | 0.49 | 43 | |||||||||||||||||||
| Region 10 | P * | P ** | N * | N * | 0.70 | 88 | ||||||||||||||||
| Region 11 | P * | N * | N * | 0.58 | 84 | |||||||||||||||||
| Region 12 | NA | 24 | ||||||||||||||||||||
| Region 13 | 0.78 | 55 | ||||||||||||||||||||
| Region 14 | NA | 17 | ||||||||||||||||||||
| Region 15 | P * | P * | P * | P * | N * | 0.67 | 269 | |||||||||||||||
| Region 16 | NA | 25 | ||||||||||||||||||||
| Region 17 | N * | P * | 0.64 | 41 | ||||||||||||||||||
| Region 18 | 0.34 | 60 |
Ppt: precipitation; Om: soil organic matter; Wet: wetland area; T: temperature; R: runoff; Area: drainage area for each station; Fost: percentage of forest cover; Barr: percentage of barren land; Urbn: percentage of urban area; Shrb: percentage of shrub area; Crop: percentage of cropland; Sand: percentage of soil sand; Clay: percentage of soil clay; Sw: soil water content; Sd: soil bulk density; Slop: average slope of the drainage area; R1st: percentage of first order watersheds; Tn total nitrogen in water; Tp: total phosphorus in water; Damd: dam density. N: negative correlation; P: positive correlation; Ad-R2: adjusted coefficient of determination; *: p < 0.05; **: p < 0.01.
Table 3.
Environmental controls on DOC concentrations by river orders.
| River Order Groups | Sand | Sw | Damd | Om | Tp | Fost | Tn | T | Wet | Shrb | Urbn | Sd | Slop | R | Ad-R2 | Station |
|---|---|---|---|---|---|---|---|---|---|---|---|---|---|---|---|---|
| Order 1–3 | P * | N ** | 0.40 | 361 | ||||||||||||
| Order 4 | P * | P * | P ** | P * | N ** | N ** | 0.52 | 302 | ||||||||
| Order 5 | P * | P ** | P * | P ** | P ** | P ** | N ** | N ** | 0.65 | 321 | ||||||
| Order 6 and higher orders | P * | P * | P * | P * | P * | P * | P * | P * | N ** | N ** | N ** | N ** | 0.59 | 418 |
Om: soil organic matter; Wet: wetland area; T: temperature; Fost: percentage of forest cover; Shrb: percentage of shrub area; Urbn: percentage of urban area; R: runoff; Sand: percentage of soil sand; Sw: soil water content; Sd: soil bulk density; Slop: average slope of the drainage area; Tn: total nitrogen in water; Tp: total phosphorus in water; Damd: dam density. N: negative correlation; P: positive correlation; Ad-R2: adjusted coefficient of determination for the general linear models; *: p < 0.05; **: p < 0.01.
© 2017 by the authors. Licensee MDPI, Basel, Switzerland. This article is an open access article distributed under the terms and conditions of the Creative Commons Attribution (CC BY) license (http://creativecommons.org/licenses/by/4.0/).
Share and Cite
MDPI and ACS Style
Yang, Q.; Zhang, X.; Xu, X.; Asrar, G.R. An Analysis of Terrestrial and Aquatic Environmental Controls of Riverine Dissolved Organic Carbon in the Conterminous United States. Water 2017, 9, 383. https://doi.org/10.3390/w9060383
AMA Style
Yang Q, Zhang X, Xu X, Asrar GR. An Analysis of Terrestrial and Aquatic Environmental Controls of Riverine Dissolved Organic Carbon in the Conterminous United States. Water. 2017; 9(6):383. https://doi.org/10.3390/w9060383
Chicago/Turabian StyleYang, Qichun, Xuesong Zhang, Xingya Xu, and Ghassem R. Asrar. 2017. "An Analysis of Terrestrial and Aquatic Environmental Controls of Riverine Dissolved Organic Carbon in the Conterminous United States" Water 9, no. 6: 383. https://doi.org/10.3390/w9060383
Note that from the first issue of 2016, this journal uses article numbers instead of page numbers. See further details here.