
Effects of Dredging and Lanthanum-Modified Clay on Water Quality Variables in an Enclosure Study in a Hypertrophic Pond


1
Aquatic Ecology & Water Quality Management Group, Department of Environmental Sciences, Wageningen University, P.O. Box 47, 6700 AA Wageningen, The Netherlands
2
Water Authority Brabantse Delta, P.O. Box 5520, 4801 DZ Breda, The Netherlands
3
Water Authority Aa & Maas, P.O. Box 5049, 5201 GA ‘s-Hertogenbosch, The Netherlands
*
Author to whom correspondence should be addressed.
Water 2017, 9(6), 380; https://doi.org/10.3390/w9060380
Submission received: 21 March 2017
/
Revised: 19 May 2017
/
Accepted: 19 May 2017
/
Published: 27 May 2017
(This article belongs to the Special Issue Water Quality Monitoring and Modeling in Lakes)
Abstract
:An enclosure experiment was conducted between July and September 2009 to compare the effectiveness of a phosphate fixative, the lanthanum-modified bentonite clay Phoslock® (LMB), dredging, and their combination in controlling eutrophication in a hypertrophic urban pond in Heesch, The Netherlands. In total, 25 water quality variables were monitored. Multivariate analysis revealed that the combination LMB-treated and dredged enclosures deviated most from the pond (reference) and the controls, and showed the strongest eutrophication reduction. Overall, dredging significantly increased transparency, lowered turbidity, and improved the oxygen conditions in the enclosures compared to non-dredged ones. Nonetheless, one dredged enclosure deviated dramatically from the others, which might reflect methodological issues with dredging. The LMB treatment appeared to be less effective at mitigating eutrophication than dredging, and phosphate concentrations even increased during the experiment in the LMB-treated enclosures. Chemical equilibrium modeling suggested that humic substances could have formed complexes with lanthanum (La) from the LMB, rendering it unavailable for intercepting P over the course of the enclosure experiment. Residual lanthanum concentrations in combination dredging and LMB treatments exceeded the Dutch standard 10-fold. Total zooplankton abundance, and particularly Cladocera, increased in all enclosures over the course of the experiment. The limited effect of LMB in the enclosure experiment and the violation of the Dutch La standard when combined with dredging disqualify LMB as an intervention agent in the restoration of the pond.
1. Introduction
Urban ponds are of great importance to society in providing recreational services to citizens [1,2]. In the Netherlands the vast majority of such ponds are manmade and exposed to strong human influences, of which excessive nutrient loading, often leading to dense cyanobacterial blooms and floating scums, presents one of the most prominent impacts [3]. Their close vicinity to urban areas means that citizens usually have easy access to those ponds [4], but also that they are confronted with eutrophication-related nuisances and hazards, such as turbid water, fish kills, bad smell, and toxic cyanobacterial blooms. Hence, the need for safe and aesthetically acceptable water in a modern society [5] makes eutrophication control a key challenge for authorities.
Eutrophication control requires both input control from point and nonpoint sources as well as internal loadings from sediments [6,7,8]. In the Netherlands, standard maintenance of urban ponds involves dredging, but mostly for hydrology reasons. Such sediment dredging can also be an effective remedy to reduce the adverse effects of eutrophication [8,9,10,11], but it is relatively expensive, with costs often varying between €25 and €60 m−3 in situ sediment. Therefore, authorities are searching for measures that will reduce the frequency of dredging needed. Here, the novel lanthanum-modified bentonite clay technology (LMB, Phoslock®, U.S. Patent 6350383; [12]) developed by CSIRO (Canberra, Australia) might provide an alternative, as phosphorus (P) fixation could reduce strongly the P available to nuisance algae [13,14,15,16].
The lanthanum-modified bentonite (LMB) has been applied to numerous water bodies [16,17] and in general improved water quality [16,18]. The response variables reported are, however, mostly limited to water transparency, P-, chlorophyll-a- and lanthanum concentrations following application, on sediment P binding, phytoplankton community composition, and macrophyte establishment [13,17,18,19,20,21,22]. Information on the response of other water quality variables in in situ applications of LMB might reveal potential unintentional impacts [17], and may play a key role in water quality managers’ and authorities’ decision-making.
To compare the effectiveness of LMB to standard dredging, we conducted an enclosure experiment in 2009 in a highly eutrophic urban pond in the Netherlands. The prime hypothesis tested was that a combination of dredging and adding LMB would be more effective at reducing eutrophication and cyanobacterial nuisance than either dredging or a LMB application, which, in themselves, would already improve the water quality to a great extent by reduction of P and subsequent diminishment of cyanobacterial biomass. Contrary to our expectations, LMB did not perform well at controlling P, cyanobacteria, and microcystins [23]. Besides these water quality variables, median values for dissolved inorganic nitrogen (DIN) and total nitrogen have also already been presented in Lürling and Faassen [23]. In this manuscript we further elaborate on these data and particularly include Secchi depth, turbidity, temperature, conductivity, pH, oxygen concentration, filterable aluminum (Al), iron (Fe), lanthanum (La), sulfur (S), total Al, Fe, La, and S, and the abundance of Cladocera, copepods, and rotifers, which were all determined in the enclosure experiment. Given the enormous underrepresentation of those water quality variables in studies on LMB (and other lake restoration interventions), we report here on the effect of the different treatments (dredging, adding LMB, and their combination) on all these water quality variables. We expected no change in metals and S, except that we expected La to gradually decrease after the application of LMB. We expected no treatment-related effects on temperature, pH, oxygen, and conductivity, but an increase in transparency in treatments and a reduction in turbidity. Because of the expected reduced cyanobacteria biomass in treatments—and the absence of fish in the enclosures—we expected a higher abundance of large-bodied cladocerans (Daphnia) in treatments than in controls, where we expected more of the rotifers and copepods that are common in cyanobacteria-rich environments [24]. We included multivariate analysis with the pond as a reference in our analysis. In addition, we included chemical equilibrium modeling to explore the potential for humic substances to have formed complexes with lanthanum, rendering it unavailable for intercepting phosphate [18,25,26,27] as a possible explanation for the previously reported impaired P control by the LMB [23].
2. Materials and Methods
2.1. Site Description
The small urban pond De Ploeg (Heesch, The Netherlands, 51°42′ N, 5°32′ E; Figure 1) has a surface area of 1600 m2 and a large area of shallow water (c. 1 m). During and prior to the experiment, the pond had hard edges of timbered revetments, except for one small bare bank area with concrete enforcement of the soil. The pond lacked submerged macrophytes, had turbid water, and suffered from heavy cyanobacterial blooms each year. In the period March–November 2009, chlorophyll-a concentrations were on average 250 (±100) μg L−1, transparency was low with a Secchi depth of 21 (±8) cm, pH was 7.7 (±0.6), conductivity 312 (±10) μS cm−1, total phosphorus (TP) was 443 (±434) μg P L−1, and total nitrogen (TN) was 2.95 (±0.95) mg N L−1. The pond contained 1444 kg of fish per hectare, of which 1000 kg per hectare were carp; together with a few dozen ducks, they form a local wildlife attraction. Feeding ducks and angling were popular activities. The close vicinity of a playground also attracted many children to the shores of the pond. After the experiment, the pond underwent a thorough reconstruction, of which the post-monitoring details will be described elsewhere.
2.2. Enclosure Experiment
From 28 July 2009 until 23 September 2009, an enclosure experiment was performed in the pond De Ploeg [23]. Twelve Perspex cylinders with a diameter of 1.05 m and a height of 1.3 m were pushed in the sediment to allow exchange between the enclosed water (≈850 L) and the sediment. The enclosures did not contain fish as fish stock reduction in itself was considered an absolute necessity to give the pond a chance to reach a clear water state; the carp would keep the water turbid in terms of sediment resuspension. Three enclosures underwent no further treatment and served as controls; three enclosures were dredged; three enclosures received the LMB as P-fixative; while three others were dredged first and then treated with the LMB. Dredging was done with an excavator that removed mechanically ≈30 cm of sediment, which was moved aside to the eastern part of the pond. The non-dredged enclosures were placed to the west about 15 m away from the dredged area to avoid interference from the translocated sediments (Figure 1b).
The dosage of the LMB was based on the average water column TP concentration just before the enclosures were placed (0.68 mg L−1) and the mobile pool of P in the top 5 cm as an average of three replicate sediment cores taken on 23rd March 2009 with a Uwitech Core sampler. The sediment had a sandy structure (ρ = 1.909 kg L−1) with leaf litter on top of it. The top 5 cm of each sediment core was homogenized where after a subsample was subjected to sequential P extraction using H2O, bicarbonate/dithionite (BD, 0.11 M), NaOH (1 M), HCl (0.5 M) and persulfate (K2S208) as subsequent extractants [28,29]. After filtration through a 0.45-μm membrane filter (Whatman, NC45, Whatman International Ltd., Maidstone, UK), in each fraction soluble reactive P (SRP) and total P (TP) were determined using a SAN++ continuous flow analyzer (Skalar Analytical BV, Breda, The Netherlands) following the Dutch standard [30] with the UV/persulfate destruction integrated in the system. Nonreactive P was calculated as the difference between SRP and TP. The mobile P pool was estimated from the content of the H2O-P, BD-P, and NaOH-NRP fractions [31] and was on average 0.03 mg P g−1 sediment dry weight. Each non-dredged enclosure therefore contained approximately 2470 mg P in the sediment and 580 mg P in the water column. The lanthanum mass fraction in the LMB was 43.8 g kg−1 as determined by ICP-MS in the Chemical–Biological Soil Laboratory of the Department of Soil Sciences (Wageningen University). To immobilize 3050 mg P in each enclosure—using a molar ratio of 1:1 (H2PO4− + La(OH)2+ → LaPO4 + 2H2O), which corresponds to a 4.485:1 La:P ratio on weight basis—would require 312.5 g LMB (mass fraction of 4.38% La in LMB). To each LMB-treated enclosure this amount was added as slurry made with water from the corresponding enclosure. The slurry was made by mixing the LMB with 5 L of enclosure water in a bucket and then spraying it over the surface, after which the bucket was rinsed twice with enclosure water. The same amount was added to the combination-treated enclosures.
2.3. Water Quality Variables
In each enclosure and the pond dissolved oxygen concentration and saturation (OxyGuard Handy Polaris, OxyGuard International A/S, Farum, Denmark), conductivity (WTW-Cond 330i, WTW GmbH & Co. KG, Weilheim, Germany), pH (WTW-pH320), water temperature, and Secchi depth were measured. Two-liter water samples were taken from the enclosures and the pond with a sampling tube initially (day 0) and after one, six, 14, 23, 30, 38, 44, and 58 days. Water samples were brought to the laboratory, where total and cyanobacterial chlorophyll-a concentrations were measured using a PHYTO-PAM phytoplankton analyzer (Heinz Walz GmbH, Effeltrich, Germany). Turbidity was measured with a Hach 2100P Turbidity meter (Hach Nederland, Tiel, The Netherlands). Chloride concentrations were measured using a Thermo Orion 720A+ meter (Thermo Orion Europe, Witchford, Cambridgeshire, UK) equipped with ion selective electrodes (Orion 9617BNWP ionplus Sure-Flow Chloride).
Unfiltered samples were analyzed for total phosphorus (TP) and total nitrogen (TN) concentrations using a Skalar SAN++ segmented flow analyzer following the Dutch standard protocols (NNI, 1986, 1990). Samples were also analyzed for the metals aluminum (Al), iron (Fe), and lanthanum (La) using an ICP-MS, and for P (ICP-MS) and sulfur (S) concentrations using an ICP-AES (Varian) at the Chemical–Biological Soil Laboratory of the Department of Soil Sciences (Wageningen University, Wageningen, The Netherlands). Glass-fiber-filtered (Whatman GF/C) samples were analyzed for dissolved inorganic nitrogen (DIN, i.e., ammonium and nitrate plus nitrite) and phosphate concentrations (Skalar SAN+ segmented flow analyzer, [30,32,33]), for filterable Al, Fe, La, and P concentrations (ICP-MS), and for filterable S concentrations (ICP-AES). Additional GF/C filters were extracted and analyzed on microcystins (described in [23]).
Zooplankton was collected from samples taken initially (day 0), and after six, 14, 30, 38, and 58 days by filtering around 1.2 L of the water through a 55-μm net. Zooplankton samples were preserved with Lugol’s fixative and kept refrigerated and in the dark. Zooplankton was determined in major groups as Cladocera, Copepoda, Rotifera, and nauplii larvae under a dissecting microscope at 15–50× magnification.
2.4. Data Analysis
Secchi depth, turbidity, temperature, conductivity, pH, oxygen concentration, filterable Al, Fe, La, and S, total Al, Fe, La, and S, and abundances of Cladocera, Copepoda, and Rotifera were statistically analyzed by running repeated measures ANOVA (rmANOVA) in the tool pack IBM SPSS Statistics version 19.0.0.1 (IBM Corporation, Armonk, NY, USA) with treatment (control, dredging, LMB addition, and combined measures) as the fixed factor. The zooplankton data were ln(10x + 1) transformed to oppress high abundances and yield an approximation of a normal distribution [34]. In case Mauchly’s test indicated that the assumption of sphericity had been violated, the degrees of freedom were corrected using Greenhouse–Geisser estimates of sphericity if epsilon < 0.75 or the Huynh–Feldt correction if epsilon > 0.75.
The water quality variables total and cyanobacterial chlorophyll-a, SRP, DIN, TP, TN, and microcystins have been analyzed and described elsewhere [23]. However, they were included in an overall evaluation of the response of all the water quality variables (except La, which is directly related to LMB addition) in the enclosures to the different treatments using the multivariate statistical analysis of principle response curves (PRCs). The PRC method yields a diagram showing the deviations in time of the treatments compared to the reference [35]. Here, the pond was taken as the reference to which the other treatments were compared, with time as the horizontal axis of the diagram. All data were log-transformed prior to analysis. The multivariate analysis was performed using the CANOCO software package (version 4.5, Wageningen University, Wageningen, The Netherlands) [36].
2.5. Chemical Equilibrium Modeling
The distribution of La and P species in the LMB treatment was evaluated by chemical equilibrium modeling using the program CHEAQS Pro P2013.1 (http://www.cheaqs.eu/index.html) [37]. The evaluation was performed without and with organic complexation. In the latter case, the models V/WHAM-W [38,39] Humic Ion-Binding Model VI [40] and Humic Ion-Binding Model VII [41] allow for the calculation of equilibrium chemical speciation for waters in which natural organic matter plays a significant role [42]. Hence, the models allow an evaluation of whether humic substance in the enclosures could have formed complexes with the lanthanum from the LMB, thereby lowering the La available for binding P. The input in the model was the mean pH at the start of the experiment (pH = 7.57), a phosphate concentration of 173.5 μg L−1, and a mean total La concentration (as measured during the first two days of the experiment) of 2846.5 μg L−1. One series also included carbonate (50 mg L−1) as, in the pH range of this study, a significant portion of La could be complexed with carbonates [42,43]. The input concentration of humic substances was determined to be 5.05 mg DOC L−1, which was the mean of the three LMD-treated enclosures. These DOC concentrations were estimated from absorbance measurements at 254 nm (A254) of enclosure water. Absorbance was measured using a Beckman Coulter Du730 Life Sciences UV/VIS spectrophotometer (Beckman Coulter, Inc., Fullerton, CA, USA). The DOC concentration of artificial Aldrich humic substance (humic acid sodium salt, technical grade, CAS: 68131-04-4, Sigma-Aldrich Chemie GmbH, Steinheim, Germany) was determined by a Shimadzu TOC analyzer at the Chemical Biological Soil Laboratory of the Department of Soil Sciences (Wageningen University, The Netherlands). This yielded the following relationship: DOC = 12.80764 × A254 (r2 = 0.999). In the chemical equilibrium modeling the humic acid–fulvic acid ratio was evaluated at 100–0%, 50–50%, and 0–100%.
3. Results
3.1. Chlorophyll-a, Phosphorus, and Nitrogen Concentrations
The main results on chlorophyll-a, phosphorus, and nitrogen concentrations have already been reported in full elsewhere [23] and will only be addressed briefly here. The chlorophyll-a concentration in the enclosures tended to be lower than in the pond (Appendix A). In the controls and LMB they tended to be higher than in the solely dredged and combination-treated enclosures. The same tendency was observed for total P and N concentrations and for DIN. SRP concentrations in one of the dredged enclosures deviated strongly from the other two replicates.
3.2. Transparency, pH, Conductivity, Oxygen, and Temperature
The transparency of the water in the enclosures was higher than in the pond, except at the start of the experiment, when dredging activities and also LMB additions negatively affected the water transparency (Figure 2A,B). Water clarity improved substantially, however, over the first two weeks, after which clear differences between treatments appeared (Figure 2A,B). The repeated measure ANOVA for Secchi depth (Sd) revealed significant differences over time and between treatments, and also a significant interaction (Table 1). For the first 14 days the course of the Sd was similar in all treatments; afterwards they started to deviate, with higher Sd in dredged and combination-treated enclosures and lower Sd in controls and LMB-treated enclosures (Figure 2A). Tukey’s test revealed that Sd in dredged and combination-treated enclosures was significantly higher than Sd in controls and LMB-treated enclosures.
Similarly, turbidity, which was initially highest in the dredged enclosures, dropped sharply over the first few days, when particulate matter settled out (Figure 2B). The rmANOVA revealed significant differences over time and a significant interaction, but no differences between treatments (Table 1). However, when the analysis was executed from day 14 until the end of the experiment, rmANOVA indicated a significant difference between treatments (F3,8 = 5.90; p = 0.020), while Tukey’s test disclosed that the turbidity in the controls was significantly higher than turbidity in dredged and combination-treated enclosures (Figure 2B).
In the first 14 days, the pH in LMB-treated enclosures and in the combination-treated enclosures increased to on average 8.4 and 8.6 respectively, while the pH in controls (7.2) and solely dredged enclosures (7.7) remained lower (Figure 2C). This effect disappeared over the course of the experiment (Figure 2C). Overall, a significant treatment effect resulted (Table 1) and Tukey’s test showed that the pH in the controls (mean: 7.09) was significantly lower than in the combination-treated enclosures with a mean of 7.57 (Figure 2C).
The Electrical Conductivity (EC) showed an increase over time, especially in the combination-treated enclosures (Figure 2D). Tukey’s test revealed that the EC in these enclosures differed significantly from EC in the controls and EC in the solely dredged enclosures.
The oxygen concentrations decreased substantially over time in the controls and the LMB-treated enclosures, reaching low values of ~1.5 mg L−1, while two of the dredged and all combination-treated enclosures remained oxygenated with oxygen concentrations >5 mg L−1 (Figure 2E). Consequently, oxygen concentrations were significantly different over time, but there was no significant treatment effect (Table 1). One of the “solely dredged” enclosures deviated considerably from the other two. In fact, oxygen concentrations in this enclosure strongly resembled those in the non-dredged enclosures (Figure 2E). Omitting this deviating enclosure from the analysis yielded a significant treatment effect on oxygen concentrations (F3,7 = 9.438; p = 0.007). Tukey’s test revealed three homogeneous groups: (1) controls and LMB-treated enclosures, (2) LMB-treated enclosures and solely dredged enclosures, and (3) solely dredged enclosures and combination-treated enclosures.
The water temperature decreased gradually over the course of the experiment, from an average 22.6 °C at the start to 16.3 °C at the end of the experiment (Figure 2F), leading to a significant time effect (Table 1). Dredged enclosures were on average 0.2 °C cooler than non-dredged ones, but this small difference was not significant (Table 1; Figure 2F).
3.3. Metals, Sulfur, Chloride
Filterable Al concentrations were elevated in dredged enclosures at the beginning of the experiments and declined gradually to the concentrations found in the other enclosures and the pond (Figure 3A). The rmANOVA indicated a significant time effect and interaction, but no differences among treatments (Table 2). Total Al concentrations in the enclosures dropped fast to concentrations below those in the pond (Figure 3B). The rmANOVA indicated a significant time and interaction effect, but no treatment effect (Table 2). The course of total Al resembled that of turbidity (Figure 2B) and when the analysis was executed from day 14 until the end of the experiment, rmANOVA indicated a significant difference between treatments (F3,8 = 13.1; p = 0.002). Tukey’s test disclosed that total Al in the controls was significantly higher than total Al in dredged and combination-treated enclosures (Figure 3B).
There were no major differences in filterable Fe concentrations between the enclosures and the pond towards the end of the experiment (Figure 3C). In contrast, total Fe concentrations became lower in the enclosures than in the pond and showed a pattern similar to that of total Al (Figure 3D). A significant treatment effect on total Fe concentrations was found (Table 2), and Tukey’s test revealed that total Fe concentrations in the combination-treated enclosures were significantly lower than in the controls (Figure 3D). When the analysis was performed using total Fe data from day 14 until the end of the experiment, the significant difference between treatments (F3,8 = 8.22; p = 0.008) remained. However, now Tukey’s test disclosed that total Fe in both the controls and the LMB-treated enclosures were significantly higher than the total Fe in the combination-treated enclosures (Figure 3D).
In the controls and solely dredged enclosures, filterable La concentrations remained far below 1 µg L−1, but in all LMB-treated enclosures filterable La concentrations were significantly elevated (Figure 3E; Table 2). In the solely LMB-treated enclosures, the filterable La concentrations dropped gradually to values below 10 μg L−1 after four weeks. However, in combination dredged and LMB-treated enclosures filterable La concentrations never dropped below the Dutch standard of 10.1 μg L−1, but remained as high as 100 μg L−1 (Figure 3E). Consequently, the rmANOVA showed a significant time and treatment effect as well as a significant interaction between both (Table 2). Tukey’s test indicated that filterable La concentrations in the control and solely dredged enclosures were significantly lower than in the LMB-treated and combination dredged and LMB-treated enclosures.
Similarly, total La concentrations were significantly lower in the controls and solely dredged enclosures than they were in the solely LMB-treated enclosures and in combination with dredging (Table 2; Figure 3F). In the solely LMB-treated enclosures, total La dropped from >4000 μg L−1 just after application to ~10 μg L−1 after one month. Although in the combination-treated enclosures total La also declined after the application, residual concentrations leveled off around 140 μg L−1 (Figure 3F).
Filterable and total S concentrations in controls and solely LMB-treated enclosures followed the same pattern as the S concentrations in the pond, while filterable and total S in the solely dredged enclosures and the combination-treated enclosures clearly deviated, with lower concentrations than the pond and the other enclosures (Figure 3F; Table 2). Tukey’s test for both filterable and total S concentrations revealed two homogeneous groups: (1) controls and solely LMB-treated enclosures, and (2) the solely dredged enclosures and the combination-treated enclosures.
The chloride concentrations were significantly different among treatments (F3,7 = 8.87; p = 0.009) and Tukey’s test revealed two homogenous groups: (1) control, LMB, and solely dredged enclosures and (2) solely dredged and combination-treated enclosures. There was not much difference over the course of the chloride concentrations and the ANOVA was likely significant because of small within-group variability (Appendix B). Chloride concentrations over the entire period were on average 53.3 (±2.7) mg L−1 in controls, 53.8 (±3.5) mg L−1 in LMB-treated enclosures, 54.7 (±2.6) mg L−1 in solely dredged enclosures, and 56.6 (±2.3) mg L−1 in combination-treated ones.
3.4. Zooplankton
Rotifer abundance remained similar in dredged and combination-treated enclosures, while an increase was observed in the first few weeks in the controls and LMB-treated enclosures (Figure 4A). The rmANOVA revealed a significant time effect (F5,40 = 2.48; p = 0.048), a significant treatment effect (F3,80 = 6.26; p = 0.017), and a significant interaction (F15,40 = 2.37; p = 0.015). Tukey’s test showed that rotifer abundance in the controls was significantly higher than that in the combination-treated enclosures. A lower abundance of rotifers after one month (Figure 4A) coincided with the highest abundance of cladocera (Figure 4B).
The abundance of Cladocera—mainly Daphnia sp., but also Bosmina, Ceriodaphnia, and Chydorus sp.—increased gradually to a maximum after one month and although the abundances seemed to be lower in combination-treated enclosures, they were not significantly different (Tukey’s test: p = 0.063) from the controls and the other treatments (Figure 4B). Copepod abundance remained similar in controls and solely dredged enclosures over the course of the experiment and showed a short increase in the first weeks of the experiment in the LMB-treated and combination-treated enclosures (Figure 4C). The copepods’ abundances were different among treatments (F3,8 = 8.49; p = 0.007), and Tukey’s test showed that copepod abundance in the solely LMB-treated enclosures was significantly higher than in the solely dredged enclosures and the combination-treated enclosures (Figure 4C). Rotifer abundance in the combination-treated enclosures was significantly lower than in the controls (Figure 4C). Nauplii abundances (Figure 4D) differed significantly over time (F5,40 = 8.78; p < 0.001), but not among treatments (F3,80 = 0.46; p = 0.720), and there was no interaction (F15,40 = 1.73; p = 0.084). Over the sampling period 18 Chaoborus larvae were also found scattered over all enclosures.
Total zooplankton abundances were highest in controls (on average 2143 L−1) and solely LMB-treated enclosures (2702 L−1), lower in solely dredged enclosures (on average 1492 L−1) and lowest in combination-treated enclosures (on average 824 L−1). Total abundances increased in all enclosures over the course of the experiment. In controls zooplankton abundance was on average 2.8 times higher than at the start, in solely LMB-treated enclosures on average 6.2 times higher than at the start of the experiment, in dredged enclosures 2.0 times higher, and in combination-treated enclosures 2.9 times higher than at the start. The strongest increase occurred in the first month of the experiment with 3.3 times, 8.1 times, 3.4 times, and 2.1 times more zooplankton than at the start of the experiment in controls, solely LMB-treated, dredged, and combination-treated enclosures, respectively. Also, the relative abundances showed some differences (Appendix C). In general, the relative contribution of Cladocera tended to increase during the first month of the experiment, followed by a decline. Copepods only comprised a minor part of the zooplankton community, with rotifers being another important group, which, particularly in combination-treated enclosures, increased considerably towards the end of the experiment (Appendix C).
3.5. Multivariate Analysis
The multivariate analysis of all the water quality variables (except La, because it is directly related to the LMB addition), while taking the pond as the reference to which the enclosures with different treatments were compared, clearly revealed treatment-related effects on the water quality variables (Figure 5). The PRC analysis disclosed that 36.1% of the total variance in the water quality dataset could be explained by time, which is on the horizontal axis in the diagram. Controls and solely LMB-treated enclosures did not differ much from each other and also remained close to the pond, whereas dredged enclosures moved further away from the pond and the combination-treated ones deviated the most (Figure 5). Total S, total P, total chlorophyll-a, cyanobacteria chlorophyll-a, and turbidity had a high positive weight (bk), with the diagram indicating a decrease with treatments (Figure 5). Secchi depth and oxygen had a negative weight, meaning a treatment-related increase.
3.6. Chemical Equilibrium Modeling
The modeling revealed that, in the absence of humic substances (model input as DOC), the majority of the La precipitated as La(OH)3 (~66%) and LaPO4 (~27%) (Figure 6A). Adding DOC (5.05 mg L−1) shifted a large portion of the La to the organic matrix; depending on the ratio between humic acids (HA) and fulvic acids (FA), 59% (HA:FA = 1:0), 74% (HA:FA = 1:1) or 88% (HA:FA = 0:1) of La was modeled to complex with this dissolved organic matter (Figure 6A). The portion of La that was calculated to precipitate with PO4 declined from ~27% to ~12%. Consequently, phosphate ions were kept in solution, but only when FA was present; ~6% in the scenario of HA:FA = 1:1 and 57% in the scenario of HA:FA = 0:1 (Figure 6B).
When 50 mg L−1 carbonate was included in the modeling, no positively-charged La ions were found in the absence of DOC, while the majority of La precipitated with carbonate as La2(CO3)3 (~73%) and the rest of the La with phosphate as LaPO4 (~27%) (Figure 6C). Adding DOC (5.05 mg L−1) shifted a large portion of the La to the organic matrix. When all DOC was assumed to be HA, 69% of the La was modeled to complex with DOC; in a HA:FA = 1:1 scenario this was 89%, while all La complexed with FA (Figure 6C). In the absence of DOC or when all DOC was present as HA, 100% of the P was bound with La; this was reduced to 40% when HA:FA = 1:1, or to nothing (0%) when DOC was assumed to be FA (Figure 6D). Consequently, phosphate ions made up 0%, 60%, and 100% of the P under HA:FA = 1:0, HA:FA = 1:1, and HA:FA = 0:1, respectively (Figure 6D).
4. Discussion
Our study yielded solid support that dredging improved water clarity and quality when combined with the addition of LMB. Sole dredging was equally effective in two of the three enclosures, but one replicate clearly reacted differently. In general, Secchi depth strongly increased in dredged enclosures, turbidity and chlorophyll-a dropped, oxygen concentrations were improved, and total Al, Fe, S, P, and N concentrations were reduced, while such responses were not achieved, or to a far lesser extent, in the controls and the LMB-treated enclosures. The accumulation of oxygen-demanding, nutrient-rich organic materials on the sediment in the pond is the main cause for the observed low oxygen in the undredged enclosures. The close vicinity of the one clearly deviating dredged enclosure to the site where the removed sediment was deposited suggests that some of this material might have been included. Alternatively, the method of dredging may also have left behind organic and nutrient-rich sediment. Clearly, dredging may not always remove all planned sediment, leaving substantial undredged areas behind that, on a whole lake scale, could diminish the effectiveness of nutrient removal [44]. The deviating enclosure resembled the controls more closely than the two other dredged ones and likewise developed anoxia. Since the low oxygen levels exert adverse effects on biota, the accumulation of nutrient-rich organic materials on the sediment can be considered polluting [45]. Removal of organic and nutrient-rich sediments is a standard maintenance and restoration strategy in the Netherlands [3,46], but it is also relatively expensive [3]. Dredging could affect the benthic fauna [47], which was not studied in the present study; however, based on the observed strongly improved oxygen, a more diverse benthic community is likely to develop in a properly dredged environment with sufficient organic-rich material removed. Methodological issues with dredging leaving undredged sediment [44] could, however, impair such an improvement on the whole pond or water body scale.
Dredging may cause sediment disturbance and mobilization of contaminants [48]. Just after dredging high concentrations of total Al, Fe, and S were observed; however, these rapidly declined to concentrations lower than in undredged enclosures. This was a consequence of the wet dredging employed, which may also result in considerable amounts of fine sediment particles being suspended temporarily in the water column, which could potentially exert adverse effects on the aquatic ecosystem [49]. The sediment resuspension was clearly evidenced in the high turbidity in dredged enclosures, yet turbidity dropped to values less than in undredged enclosures within about 10 days. Since Al, Fe, and S also declined in a similar pattern, it is highly likely that these were suspended matter bound.
The main reason for including dredging as a treatment in the enclosure experiment was to explore its efficacy in reducing the adverse effects of eutrophication, because Heesch pond was suffering from nuisance cyanobacterial blooms, regularly accumulating at the water surface in thick scums with huge toxin concentrations posing a high risk to citizens, pets, and wildlife [3]. That sediment dredging can be an effective remedy to reduce the adverse effects of eutrophication has been well documented [8,9,10,11]; however, see [44] for a dissenting view. Likewise, total P, chlorophyll-a, and cyanobacteria concentrations had strongly declined in the effectively dredged enclosures compared to the non-dredged ones as reported before, except in one solely dredged enclosure [23]. The strongly reduced phytoplankton biomass led to the high water transparency, a response that has also been found in other dredging interventions [50].
Zooplankton abundance increased during the first month in all enclosures. At first rotifers particularly increased, followed by Cladocera, which can be attributed to the absence of fish in the enclosures eliminating a strong top-down control [51]. At peak abundances of Cladocera the rotifer numbers were clearly suppressed. Given that there was still quite some chlorophyll-a present, the suppressive effect of cladocerans on rotifers is probably via direct mechanical interference rather than exploitative competition [52]. Cladocera subsequently declined strongly, particularly in controls and solely LMB-treated enclosures, which was paralleled by a strong increase in cyanobacterial chlorophyll-a, demonstrating the well-reported negative effect of cyanobacteria on Cladocera [24,51]. Since Cladocera and other groups increased again in abundance towards the end of the experiment, while oxygen conditions had not clearly changed, the negative effects of low oxygen do not seem to be the most probable cause of their decline in controls and solely LMB-treated enclosures.
Zooplankton abundances were lower in the dredged enclosures than in undredged ones, which seems to be explained by lower food availability. Reduced rotifer abundance has also been found following a dredging event in Lake Yuehu, China, which was attributed to less eutrophic conditions and less chlorophyll-a [53]. Inasmuch as the enclosures were devoid of fish, enhanced predation on zooplankton by visually hunting predators seems unlikely. The lower zooplankton and Cladocera abundances in the combination-treated enclosures compared to the solely dredged enclosures is unlikely to be explained by food availability as chlorophyll-a concentrations were similar in those treatments (Appendix A, [23]). Zooplankton and Cladocera abundances in the combination-treated enclosures were 50% and 29% of those in the solely dredged enclosures. At first sight, an effect related to the LMB seems unlikely given that in LMB-treated enclosures cladocerans (Bosmina, Ceriodaphnia, Daphnia) were as abundant as in the controls and that a laboratory study on the effects of lanthanum and LMB on Daphnia showed no toxicity [54]. On the other hand, only in the combination-treated enclosures did filterable and total La remain much higher than in solely LMB-treated enclosures. In the solely LMB-treated enclosures at the end of the experiment, filterable La concentrations had increased as well (see Figure 3E), exceeding the Dutch standard in one of the replicates (12.5 μg L−1) and coming close to it in a second replicate (9.3 μg L−1).
The persistently high filterable La concentration of 100 μg L−1 in the combination-treated enclosures implied that the maximum permissible concentration of lanthanum in Dutch surface water (10.1 μg L−1; [55]) was exceeded. The mechanism causing the higher filterable La concentrations in only this treatment and not the sole LMB treatment is not clear. A possibility might be related to the distinct oxygen concentrations in both treatments, where migrating zooplankton and bioturbating benthic fauna enable upward transport in the oxic enclosures, while this might have been hampered in the hypoxic/anoxic LMB enclosures. Since large-bodied Cladocera may express vertical migratory behavior, they could transport compounds that have been ingested in the deeper water layers to the upper water layers, where these compounds are defecated. Such translocation has been demonstrated for phosphorus [56]. Likewise, higher concentrations of clay near the sediment could be transported upwards. Under oxygen depletion, however, such migration is strongly hampered [57]. Access to and consumption of introduced LMB could also have contributed to fewer cladocera, because higher clay concentrations could reduce survival and growth in juvenile Daphnia [58].
In the combination-treated enclosures EC, which reflects the amount of ions in the water, was also significantly higher than in the controls and the solely dredged enclosures. Besides La, chloride was also significantly higher in these combination-treated enclosures, but filterable S (sulfate) along with phosphate and dissolved nitrogen concentrations [23] were lower. What exactly caused the higher EC in the combination-treated enclosures cannot be deciphered from the data collected as some important ions such as carbonate and calcium have not been determined. LMB could cause elevated EC, but in laboratory experiments this was observed only at high doses of several g LMB L−1 [15]; also, in the solely LMB-treated enclosure EC was not different from the control.
The increase in pH in the LMB- and combination-treated enclosures to mean values of 8.4 and 8.6 (while the pH was 7.2 and 7.7 in controls and solely dredged enclosures, respectively) seems to be related to the addition of LMB. This modified clay, however, will hardly affect pH and, if it does, it will cause slightly lower pH, as evidenced in laboratory experiments [15,59] and field experiments [60]. Interestingly, oxygen measurements revealed oversaturation in this period in LMB- and combination-treated enclosures, with on average 137% and 128%, respectively. Therefore, primary production is a more probable explanation for the observed increase in pH in these treatments. This is unexpected as sufficient reduction of SRP by LMB can strongly hamper algal growth, as evidenced in laboratory experiments [15] and whole-lake applications [19,61], yet there are also reports that algal growth was not inhibited after LMB application [62]. Both an insufficient reduction in SRP and potential luxury consumption of P by the cyanobacteria are possible explanations for continued primary production. It should also be noted that rare earth metals are applied as micro fertilizers to increase the content of chlorophyll and stimulate the growth of crops [63,64]. Hence, more research is required to determine if growth stimulation in phytoplankton can be evoked by exposure to lanthanum or LMB.
An effect of treatment on phytoplankton and cyanobacteria was expected as the anticipated strong decline in nutrient availability was predicted to hamper further growth of cyanobacteria, causing their gradually waning. A laboratory experiment showed a strong decline in cyanobacterial blooming within 18 days [15]. The expected results were observed only in dredged and combination-treated enclosure, but not in solely LMB-treated ones. This result contrasts with some studies that showed a rapid decline in phytoplankton abundance, yet they combined a coagulant with LMB as ballast, effectively clearing the water column [20,65]. Other studies used only LMB and also reported a decline or control of cyanobacteria [61], or a short-lived positive effect [19], but no information on the speed of the response, while in another study a clear lag period of several months was observed [66]. In our study, the increase in cyanobacteria in controls and sole LMB treatments after one month does not seem to be caused by recruitment of settled cyanobacteria as a similar phenomenon should have then occurred in the dredged enclosures. The lower chlorophyll-a concentrations towards the end of the experiment, while nutrients increased, seem mainly caused by the climatic conditions being less favorable for phytoplankton growth (strongly reduced temperatures and less solar irradiation).
The multivariate analysis obviously showed that the combination of dredging and LMB addition improved the water quality in the enclosures the most. Overall, biomass-related components were reduced the most (total and cyanobacterial chlorophyll-a, turbidity, total P, total N, total Fe, total Al, and total S), while physicochemical variables were enhanced (transparency and oxygen). The multivariate analysis also revealed that control enclosures, which could are fish exclosures and to a lesser extent reduce wind influence, deviated positively from the pond. Hence, in restoring the pond, fish stock reduction could be considered, as fish stock reduction in general has been shown to improve water quality significantly for at least several years [67]. Another difference was that water quality in solely dredged enclosures was better than that in solely LMB-treated enclosures, which resembled controls the most. Both treatments aimed at reducing the internal P pool; LMB by means of P immobilization and dredging by physical removal of the organic and P-rich sediment. Evidently, dredging was more successful than LMB addition [23]. One of the dredged enclosures, however, clearly deviated from the other two in getting much lower oxygen (see Figure 2E) and also got higher phosphate concentrations over time (Appendix A, [23]). The higher phosphate concentrations in this enclosure only occurred under anoxia and were paralleled by an increase in filterable Fe (Appendix D), pointing to release of reductive labile-bound P. Since this enclosure was near the place where the removed sediment was deposited, some inclusion or leftovers of organic-rich sediment [44] cannot be excluded. Consequently, given the small size of the water body, pond drawdown followed by bulldozer and scraper sediment removal might be the most straightforward sediment removal technique [8], which will avoid leaving areas undredged [44].
The observed phosphate reduction (35–48%; [23]) just after LMB treatment was much lower than the >99% that was expected based on the LMB dose. In fact, even after 24 hours total La concentrations in the water column were high enough (1250 μg La L−1) to theoretically bind all the available phosphate in the water. The subsequent increase in phosphate in the LMB-treated enclosures (Appendix A, [23]) clearly points to inefficient P interception. In fact, when these enclosures developed anoxia both an increase in filterable Fe and phosphate could be observed (Appendix D), while the P efflux from the sediment should have been reduced strongly [68]. A relatively low phosphate reduction of 35–40% has also been observed when lake water with an algal bloom was treated with LMB, where the authors pointed out that humic substance could have played a role [14]. Interference of humic substance with the phosphate-binding capacity of LMB has been confirmed experimentally [24,25,69]. The interference is kinetic; a humic substance forms a complex with La and hinders the contact between phosphate and La, thereby reducing the binding kinetics [25,26,69]. The chemical equilibrium modeling revealed that in the presence of humic substance a considerable part of the La got complexed with the humic substance. This is fully in line with several studies that have shown humic substance to be a strong complexing agent for lanthanides [42,70,71]. The modeling indicated that in the presence of humic acids La was complexed and otherwise would have precipitated with either hydroxyls or carbonate. With fulvic acids, more La was complexed, leading to less or no LaPO4 precipitation and consequently phosphate remaining in solution. This is due to a stronger competitive effect of fulvic acids with phosphate at adsorption surfaces [72]. Since dredging removed the organic-rich sediment, it also reduced the complexing capacity. Thus, the observed higher La concentrations in the combination-treated enclosures compared to the solely LMB-treated ones could have resulted from far less humic substance complexation in the combination-treated enclosures and higher colloidal fractions in the water column. The modeling also indicated that LaPO4 precipitation was similar in the presence or absence of carbonate. This will undoubtedly be the result over a longer time period, but interference of carbonate with LaPO4 precipitation can be expected immediately after LMB application [27]. Positively charged and potentially toxic La species were not predicted in a scenario with carbonate or fulvic acids present. Since both are present in natural waters, the risk associated with trivalent La ions seems negligible, which is supported by a huge array of experiments and field observations [16].
As outlined above, there is ample evidence that humic substances interfere with the La-phosphate precipitation by forming La-humic substance complexes; however, given enough time this interference will be overcome and phosphate will eventually be bound to the La and precipitate as rhabdophane and monazite [26]. The interference is manifested most clearly in the first 100 days of the interaction [26]. Hence, if we ran the enclosure experiment for 358 days instead of 58 days, the outcome of the LMB-treated enclosures could have been different. The best time for treating water with LMB is winter in temperate regions, because most water column P will be present as phosphate and not inside cells and pH is generally lower [16]. In our enclosure experiment, the water was already suffering from a cyanobacteria bloom and under such conditions inclusion of a coagulant to precipitate the cells is highly recommended [20]. The added LMB and the resuspended sediment, while settling, also removed a part of the standing cyanobacteria stock. Data presented by Lürling and Faassen [23] showed that within one day total chlorophyll-a was reduced by about 30% in the LMB-treated and dredged enclosures, whereas this was only 7% in the controls. Whereas in the dredged enclosures cyanobacterial biomass and total chlorophyll-a were further reduced, oxygen conditions improved, and nutrients declined, this did not happen in controls and LMB-treated enclosures (Appendix A, [23]). Hence, the effective interception of sediment-released nutrients seems to be crucial to mitigate cyanobacterial nuisance in the pond.
The strongest eutrophication-mitigating effect was achieved by the combination of dredging and LMB addition. Only this treatment created P-limiting conditions based on DIN:SRP and TN:TP ratios (Appendix A). Adding LMB after the nutrient-rich sediment has been removed implies that a reactive reservoir could intercept diffuse influx P for a prolonged period of time and thus delay the return of cyanobacteria. This combination, however, cannot be recommended as a remedial measure in restoring the hypertrophic pond De Ploeg, because of the violation of the Dutch La standard. Therefore, dredging—or, better, drawdown and bulldozer or scraper removal of sediment—Seems to be the most promising intervention to tackle internal loading in this pond. It is also advisable to include the neighborhood in reducing duck feeding and fish stocking [73]. Hence, for the restoration of De Ploeg pond dredging combined with fish stock reduction and dialogue with neighbors can be recommended.
5. Conclusions
An enclosure experiment was conducted to compare the effectiveness of dredging, LMB addition, and their combination in mitigating eutrophication in a hypertrophic urban pond, as well as getting insight into various water quality variables following an application. From the results presented here it can be concluded that:
- The combination of dredging and LMB addition improved the water quality in the enclosures the most.
- The combination of dredging and LMB treatment had a serious drawback: a persistently high filterable La concentration of 100 μg L−1, which exceeds by 10-fold the maximum permissible concentration of lanthanum in Dutch surface water.
- Dredging was more effective in mitigating eutrophication than LMB application, but one dredged enclosure showed no improved water quality, suggesting methodological issues with the employed wet dredging.
- LMB application did not bring SRP to limiting concentrations and did not hamper sediment SRP efflux under anoxia.
- The effectiveness of LMB is most probably negatively influenced by humic substances.
- For rehabilitation of the pond, drawdown followed by bulldozer and scraper removal of sediment, drastic fish stock reduction, and dialogue with neighbors is recommended.
Acknowledgments
This study was sponsored by a Water Framework Directive Innovation Grant of AgentschapNL of the Ministry of Economic Affairs and by a subsidy of the Province of Noord-Brabant. The municipality of Heesch, the Regional Water Authority Aa & Maas, and the local fish association De Bleeken are thanked cordially for their cooperation. Dennis Waasdorp, Fred Bransen, Bastiaan van Zuidam, and John Beijer are thanked for their assistance in placing, sampling, and removal of the enclosures. Wendy Beekman is thanked for assistance in analyzing the samples. Els Faassen is thanked for discussions related to microcystins.
Author Contributions
M.L., G.W., B.E. and F.v.O. conceived and designed the experiments; M.L., B.E. and F.v.O. performed the experiments; M.L. and F.v.O. analyzed the data; B.E. contributed legal permit and tools for dredging and placing enclosures; M.L., G.W., B.E. and F.v.O. wrote the paper.
Conflicts of Interest
The authors declare no conflict of interest. The founding sponsors had no role in the design of the study; in the collection, analyses, or interpretation of data; in the writing of the manuscript, and in the decision to publish the results.
Appendix A
The cyanobacterial and total chlorophyll-a concentrations, and total P, N, SRP, and DIN concentrations have already been described in full elsewhere [23]. The change in water quality over time in the different enclosures is presented (Figure A1). Ratios of DIN:SRP and TN:TP, as indications of non-, P-, and N-limitation [74], are also given (Figure A2).
Figure A1.
The course of the total chlorophyll-a concentrations (μg L−1; Panel A), cyanobacterial chlorophyll-a concentrations (μg L−1; Panel B), total P concentration (mg L−1; Panel C), total N concentration (mg L−1; Panel D), SRP concentration (μg L−1; Panel E), and DIN concentration (mg L−1; Panel F) in control enclosures, Phoslock®-treated enclosures, dredged enclosures, combination Phoslock®-treated and dredged enclosures, and the pond over the 58-d experimental period in 2009. Error bars indicate one standard deviation (n = 3). In Panel E the dredged enclosures are depicted individually.
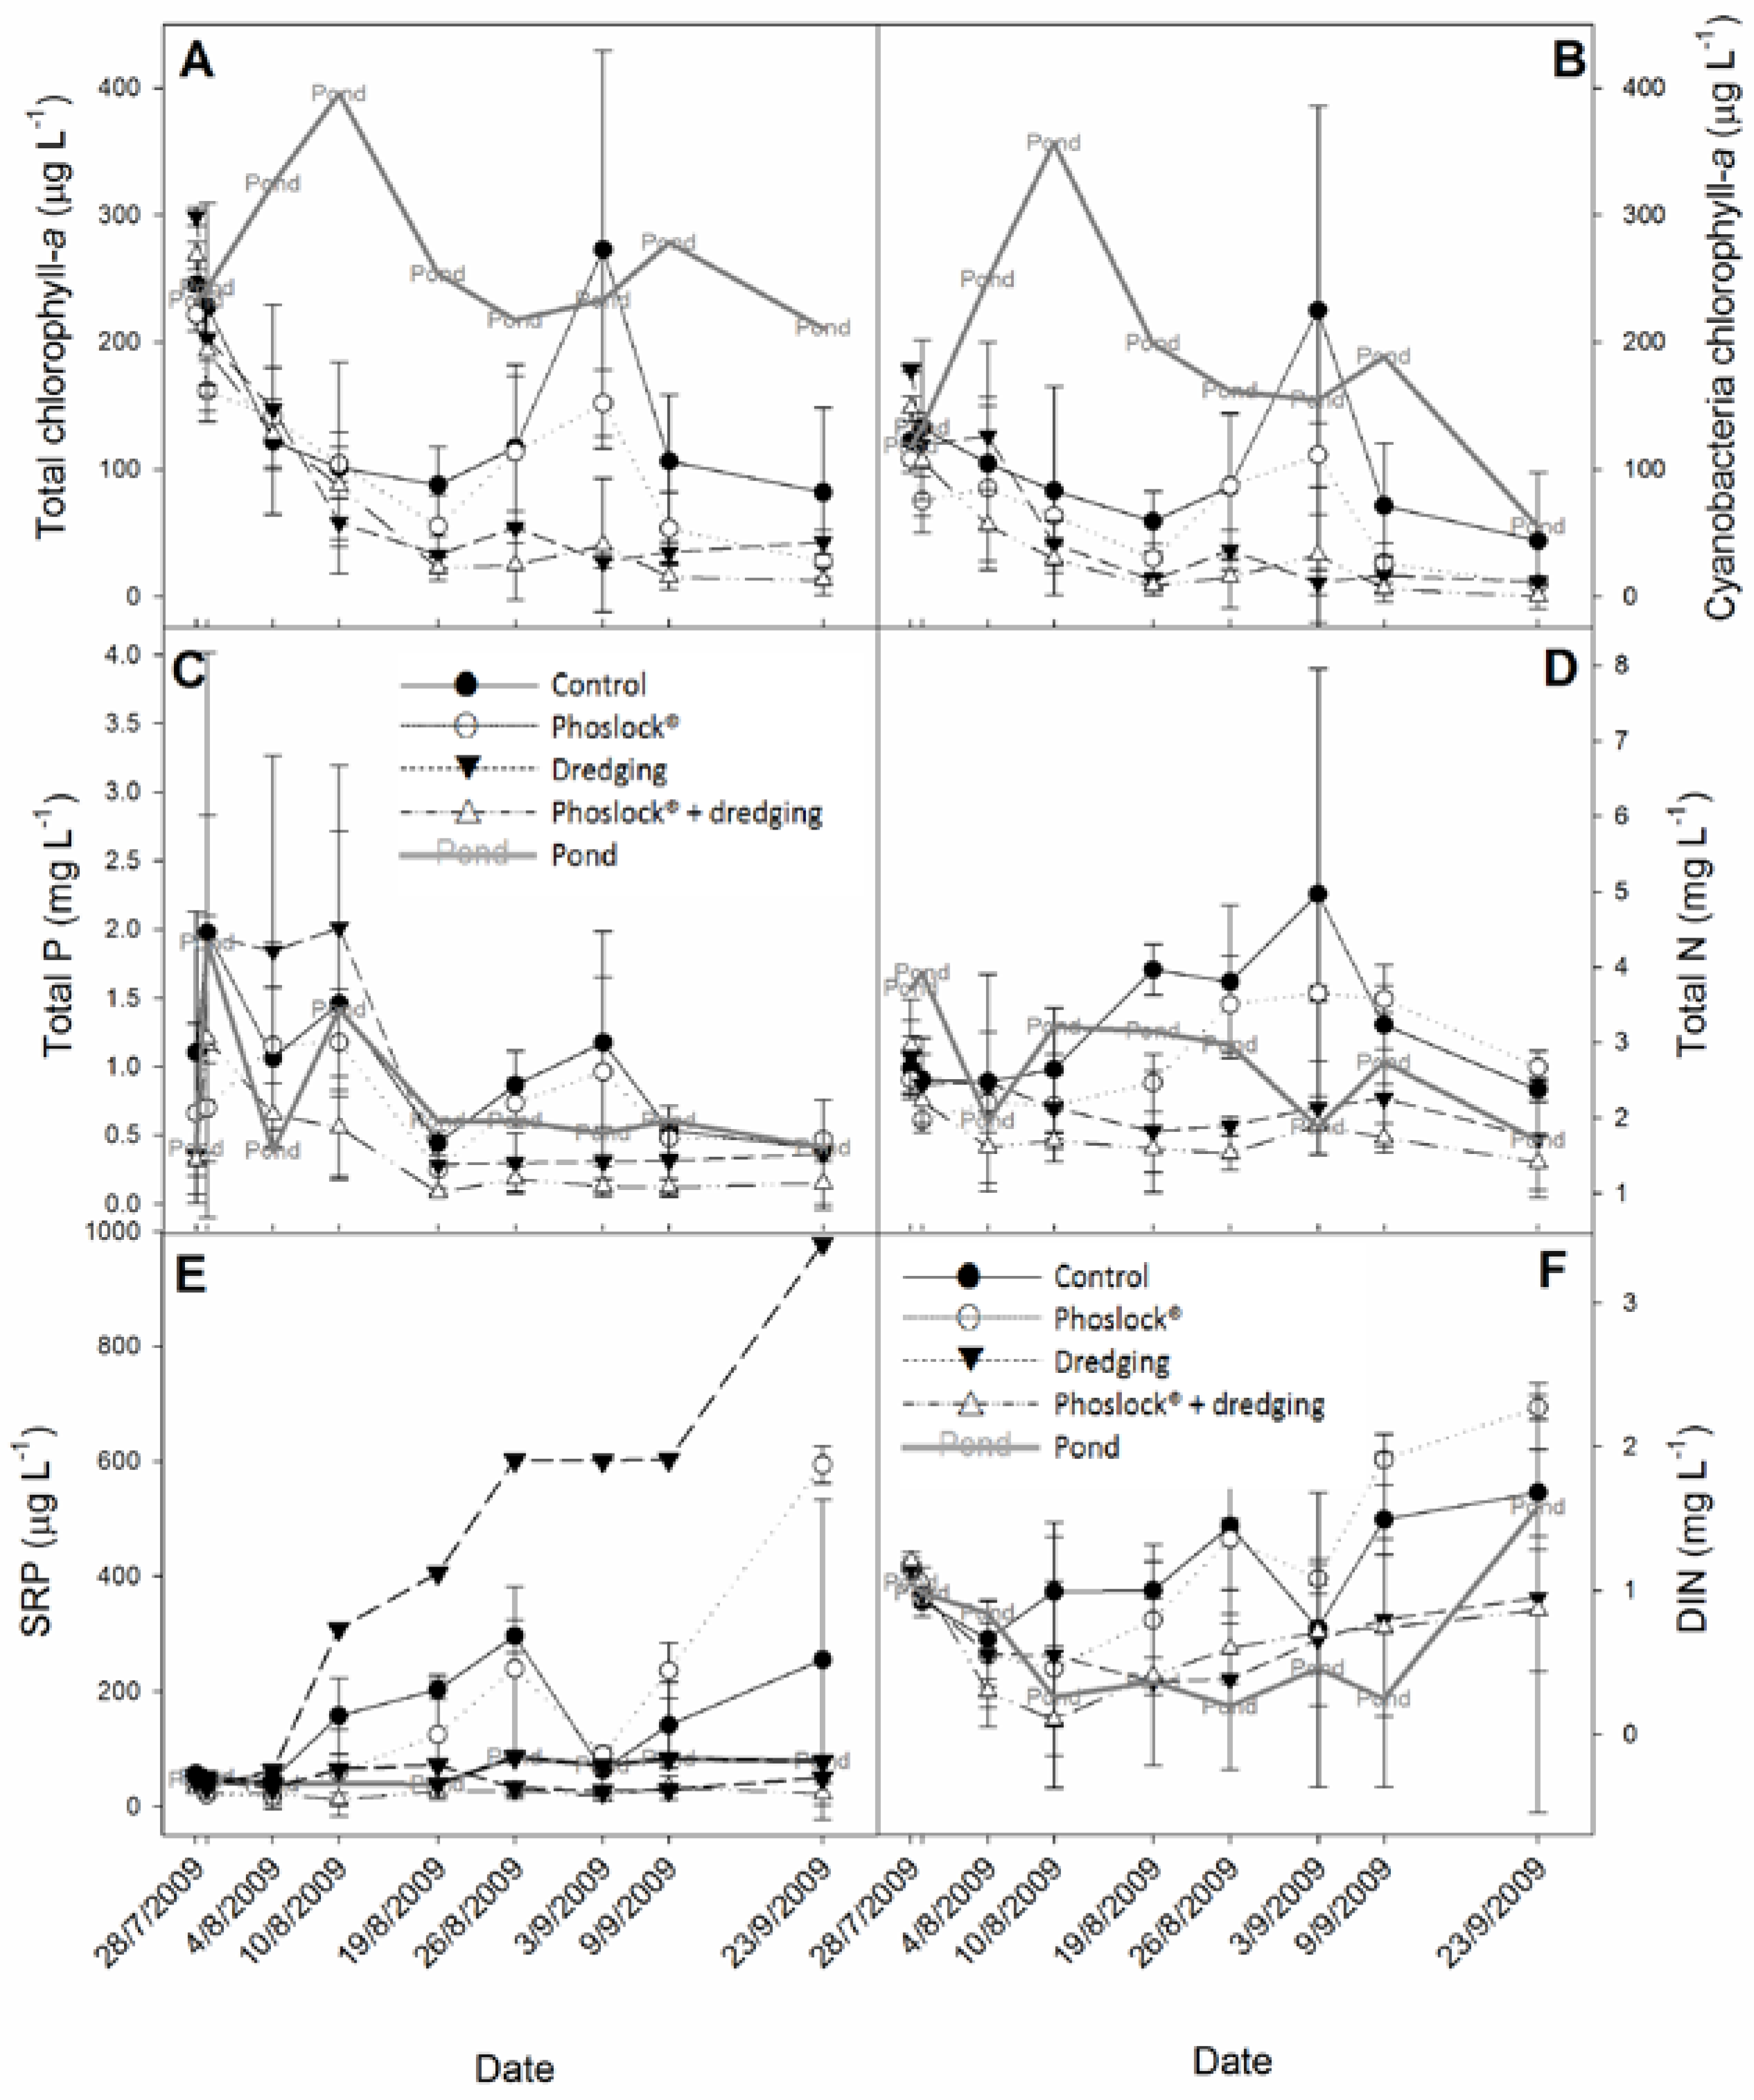
Figure A2.
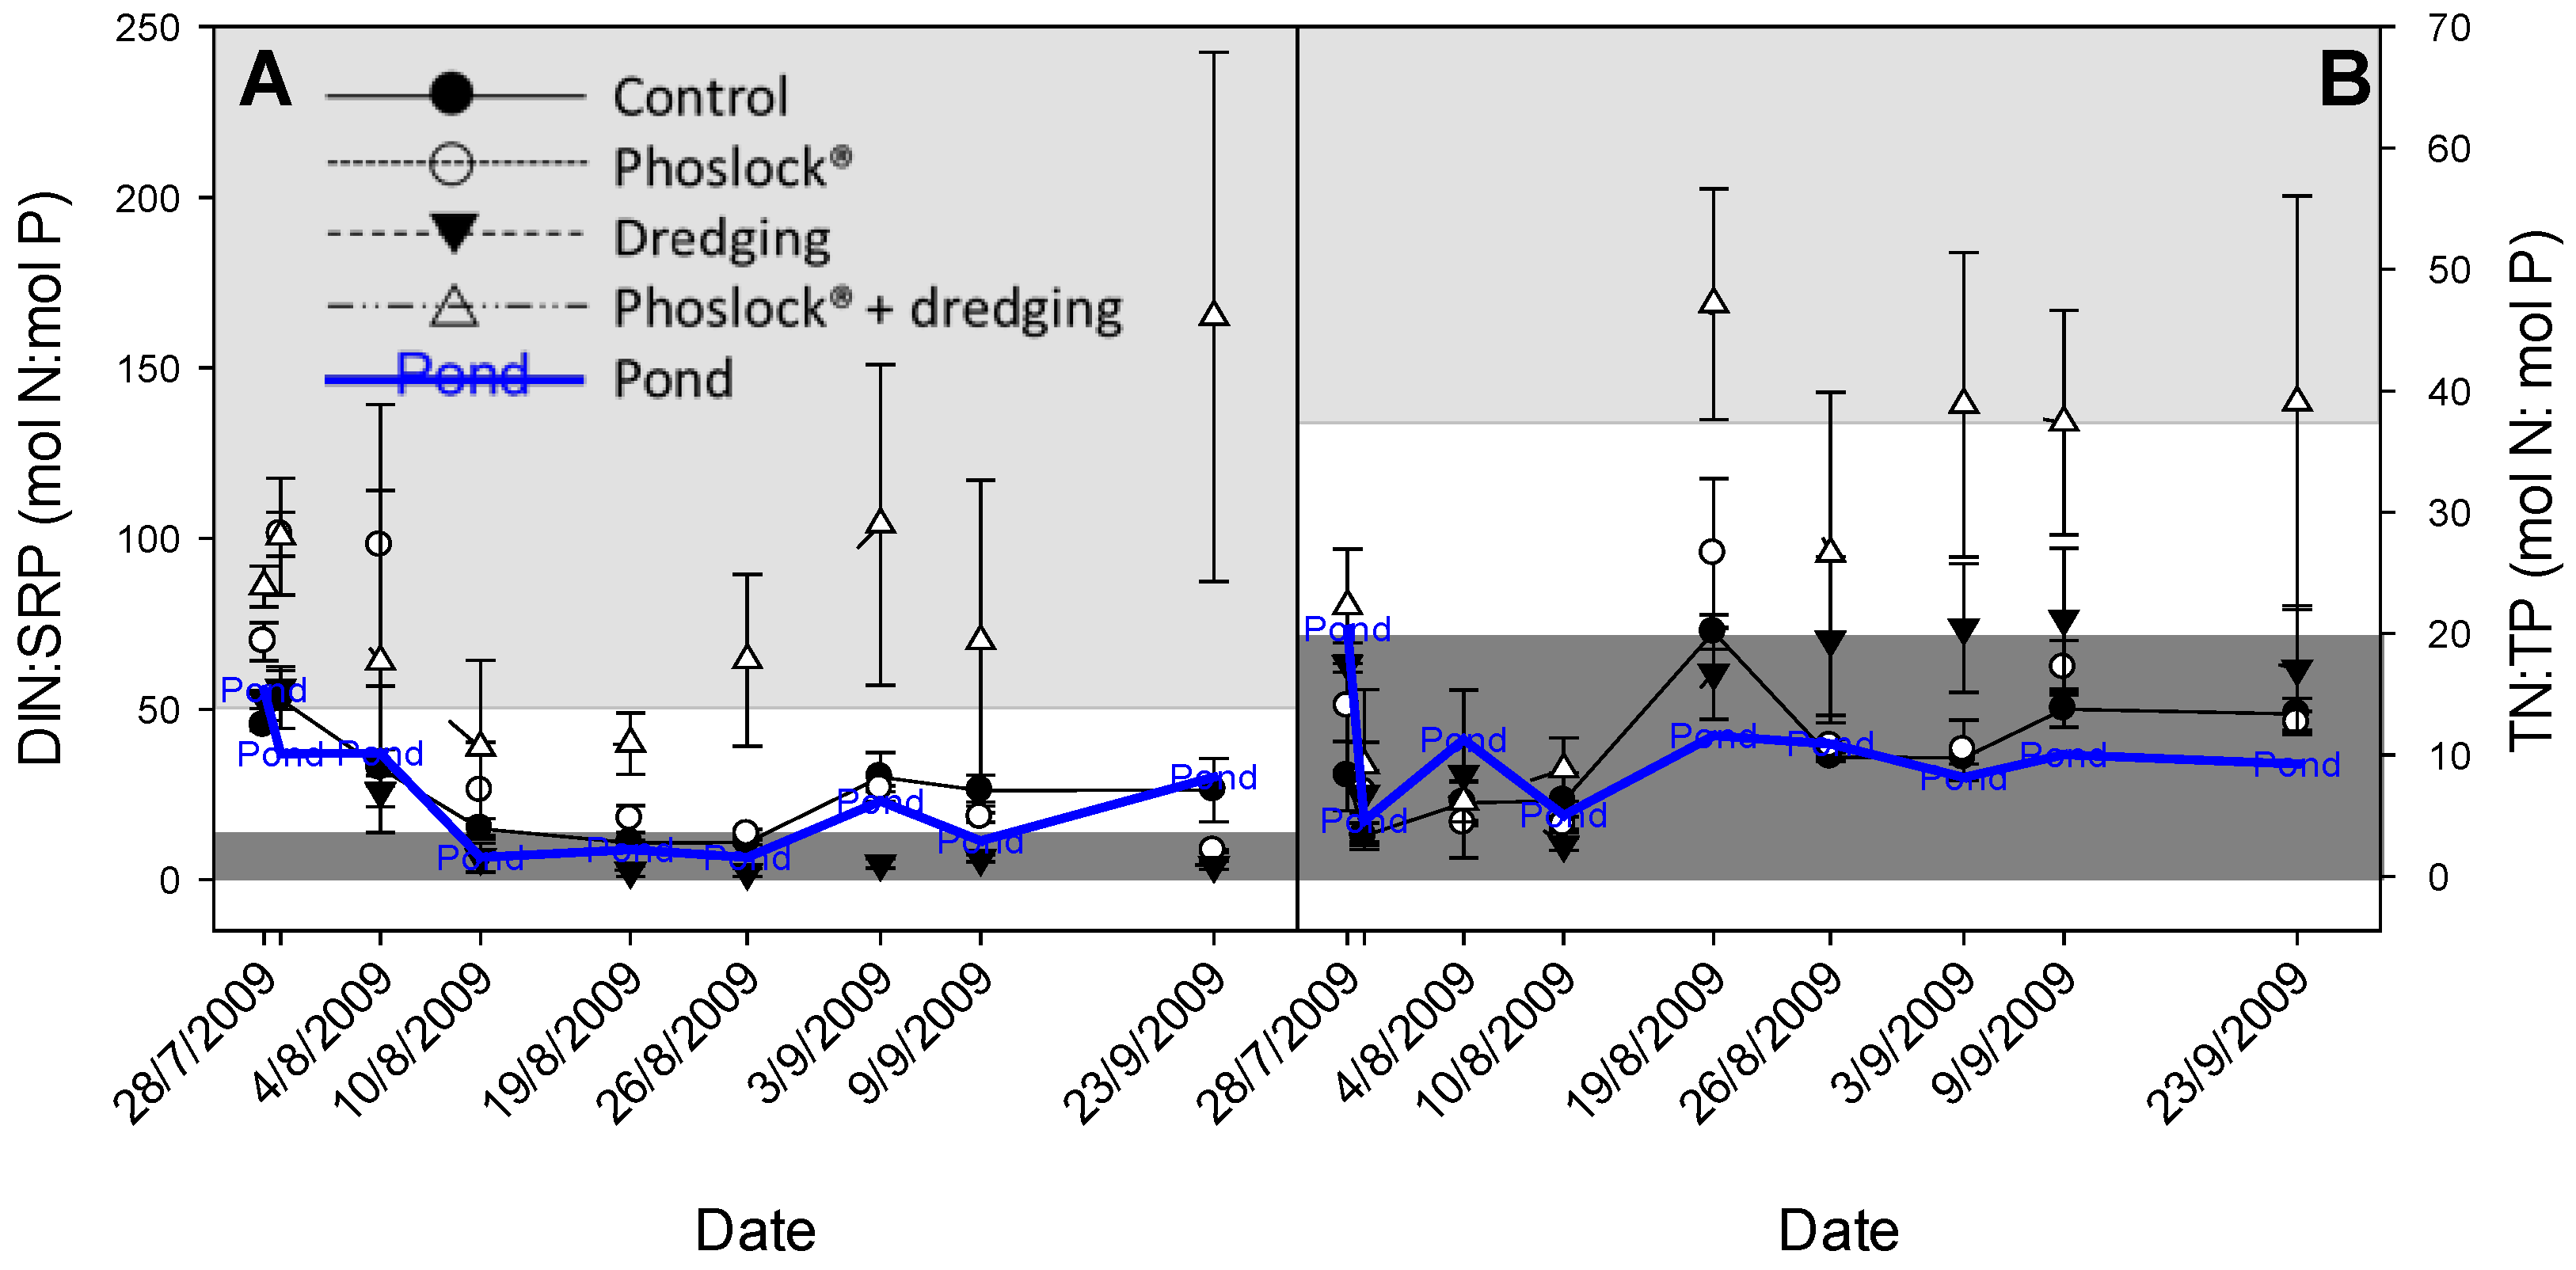
The course of the molar DIN:SRP (Panel A) and TN:TP ratio (Panel B) in control enclosures, Phoslock®-treated enclosures, dredged enclosures, combination Phoslock®-treated and dredged enclosures, and the pond over the 58-d experimental period in 2009. Error bars indicate one standard deviation (n = 3). The dark gray background plane indicates the area of N limitation (DIN:SRP < 13; TN:TP < 20), the light gray area indicates P limitation (DIN:SRP > 50; TN:TP > 38), while the white areas indicate no limitation (cf. [74]).
Figure A2.
The course of the molar DIN:SRP (Panel A) and TN:TP ratio (Panel B) in control enclosures, Phoslock®-treated enclosures, dredged enclosures, combination Phoslock®-treated and dredged enclosures, and the pond over the 58-d experimental period in 2009. Error bars indicate one standard deviation (n = 3). The dark gray background plane indicates the area of N limitation (DIN:SRP < 13; TN:TP < 20), the light gray area indicates P limitation (DIN:SRP > 50; TN:TP > 38), while the white areas indicate no limitation (cf. [74]).
Appendix B
Chloride concentrations in water from the pond and enclosures were measured with ion selective electrodes (Figure B1).
Figure B1.
The course of the chloride concentrations (mg L−1) in control enclosures, Phoslock®-treated enclosures, dredged enclosures, combination Phoslock®-treated and dredged enclosures, and the pond over the 58-d experimental period in 2009. Error bars indicate one standard deviation (n = 3).
Figure B1.
The course of the chloride concentrations (mg L−1) in control enclosures, Phoslock®-treated enclosures, dredged enclosures, combination Phoslock®-treated and dredged enclosures, and the pond over the 58-d experimental period in 2009. Error bars indicate one standard deviation (n = 3).

Appendix C
Relative contributions based on counted specimens of major zooplankton groups to the overall zooplankton abundances showed differences among controls and treatments (Figure C1).
Figure C1.
The relative abundances of major zooplankton groups (Cladocera, copepods, and their nauplli, rotifers) in control enclosures, Phoslock®-treated enclosures, dredged enclosures, combination Phoslock®-treated and dredged enclosures, and the pond over the 58-d experimental period in 2009.
Figure C1.
The relative abundances of major zooplankton groups (Cladocera, copepods, and their nauplli, rotifers) in control enclosures, Phoslock®-treated enclosures, dredged enclosures, combination Phoslock®-treated and dredged enclosures, and the pond over the 58-d experimental period in 2009.

Appendix D
The filterable Fe and SRP concentrations in the deviating dredged enclosure as well as in LMB-treated enclosures were clearly strongly increased at low oxygen concentrations (Figure D1), illustrating the release of reductively labile bound P.
Figure D1.
Measured filterable Fe concentrations as a function of the measured oxygen concentrations in solely dredged enclosures (Panel A) and solely LMB-treated enclosures (Panel B) and measured SRP concentrations as a function of the measured oxygen concentrations in solely dredged enclosures (Panel C) and solely LMB-treated enclosures (Panel D). For the dredged enclosures, the deviating one is indicated with black symbols, whereas the other two are indicated with open symbols.

References
- Brönmark, C.; Hansson, L.-A. Environmental issues in lakes and ponds: Current state and perspectives. Environ. Conserv. 2002, 29, 290–306. [Google Scholar] [CrossRef]
- Gledhill, D.G.; James, P.; Davies, D.H. Pond density as a determinant of aquatic species richness in an urban landscape. Landsc. Ecol. 2008, 23, 1219–1230. [Google Scholar] [CrossRef]
- Waajen, G.W.A.M.; Faassen, E.J.; Lürling, M. Eutrophic urban ponds suffer from cyanobacterial blooms: Dutch examples. Environ. Sci. Pollut. Res. 2014, 21, 9983–9994. [Google Scholar] [CrossRef] [PubMed]
- Birch, S.; McCaskie, J. Shallow urban lakes: A challenge for lake management. Hydrobiologia 1999, 395–396, 365–377. [Google Scholar] [CrossRef]
- Steffensen, D.A. Economic cost of cyanobacterial blooms. Adv. Exp. Med. Biol. 2008, 619, 855–865. [Google Scholar] [PubMed]
- Carpenter, S.R.; Caraco, N.F.; Correll, D.L.; Howarth, R.W.; Sharpley, A.N.; Smith, V.H. Nonpoint pollution of surface waters with phosphorus and nitrogen. Ecol. Appl. 1998, 8, 559–568. [Google Scholar] [CrossRef]
- Søndergaard, M.; Jensen, A.; Jeppesen, E. Role of sediment and internal loading of phosphorus in shallow lakes. Hydrobiologia 2003, 506, 135–145. [Google Scholar] [CrossRef]
- Cooke, G.D.; Welch, E.B.; Peterson, S.A.; Nichols, S.A. Restoration and Management of Lakes and Reservoirs; CRC Press, Taylor & Francis Group: Boca Raton, FL, USA, 2005. [Google Scholar]
- Moss, B.; Balls, H.; Irvine, K.; Stansfield, J. Restoration of two lowland lakes by isolation from nutrient-rich water sources with and without removal of sediment. J. Appl. Ecol. 1986, 23, 391–414. [Google Scholar] [CrossRef]
- Moss, B.; Stansfield, J.; Irivine, K.; Perrow, M.; Phillips, G. Progressive restoration of a shallow lake: A 12-year experiment in isolation, sediment removal and biomanipulation. J. Appl. Ecol. 1996, 33, 71–86. [Google Scholar] [CrossRef]
- Muhammetoğlu, A.; Muhammetoğlu, H.; Soyupak, S. Evaluation of efficiencies of diffuse allochtonous and autochtonous nutrient input in restoration of a highly eutrophic lake. Water Sci. Technol. 2002, 45, 195–203. [Google Scholar] [PubMed]
- Douglas, G.B. Remediation Material and Remediation Process for Sediments. U.S. Patent 6350383, 26 February 2002. [Google Scholar]
- Robb, M.; Greenop, B.; Goss, Z.; Douglas, G.; Adeney, J. Application of PhoslockTM, an innovative phosphorus binding clay, to two Western Australian waterways: Preliminary findings. Hydrobiologia 2003, 494, 237–243. [Google Scholar] [CrossRef]
- Ross, G.; Haghseresht, F.; Cloete, T.M. The effect of pH and anoxia on the performance of Phoslock®, a phosphorus binding clay. Harmful Algae 2008, 7, 545–550. [Google Scholar] [CrossRef]
- Van Oosterhout, F.; Lürling, M. The effect of phosphorus binding clay (Phoslock®) in mitigating cyanobacterial nuisance: A laboratory study on the effects on water quality variables and plankton. Hydrobiologia 2013, 710, 265–277. [Google Scholar] [CrossRef]
- Copetti, D.; Finsterle, K.; Marziali, L.; Stefani, F.; Tartari, G.; Douglas, G.; Reitzel, K.; Spears, B.M.; Winfield, I.J.; Crosa, G.; et al. Eutrophication management in surface waters using a lanthanum modified bentonite: A review. Water Res. 2016, 97, 162–174. [Google Scholar] [CrossRef] [PubMed]
- Spears, B.M.; Lurling, M.; Yasseri, S.; Castro-Castellon, A.T.; Gibbs, M.; Meis, S.; McDonald, C.; McIntosh, J.; Sleep, D.; Van Oosterhout, F. Lake responses following lanthanum-modified bentonite clay (Phoslock®) application: An analysis of water column lanthanum data from 16 case study lakes. Water Res. 2013, 47, 5930–5942. [Google Scholar] [CrossRef] [PubMed]
- Spears, B.M.; Mackay, E.B.; Yasseri, S.; Gunn, I.D.M.; Waters, K.E.; Andrews, C.; Cole, S.; de Ville, M.; Kelly, A.; Meis, S.; et al. Lake responses following lanthanum-modified bentonite (Phoslock®) application: A meta-analysis of water quality and aquatic macrophyte responses across 18 lakes. Water Res. 2016, 97, 111–121. [Google Scholar] [CrossRef] [PubMed]
- Lang, P.; Meis, S.; Prochazkova, L.; Carvalho, L.; Mackay, E.B.; Woods, H.J.; Pottie, J.; Milne, I.; Taylor, C.; Maberly, S.C.; et al. Phytoplankton community responses in a shallow lake following lanthanum-bentonite application. Water Res. 2016, 97, 55–68. [Google Scholar] [CrossRef] [PubMed]
- Lürling, M.; van Oosterhout, F. Controlling eutrophication by combined bloom precipitation and sediment phosphorus inactivation. Water Res. 2013, 47, 6527–6537. [Google Scholar] [CrossRef] [PubMed]
- Meis, S.; Spears, B.M.; Maberly, S.C.; O’Malley, M.B.; Perkins, R.G. Sediment amendment with Phoslock in Clatto Reservoir (Dundee, UK): Investigating changes in sediment elemental composition and phosphorus fractionation. J. Environ. Manag. 2012, 93, 185–193. [Google Scholar] [CrossRef] [PubMed]
- Meis, S.; Spears, B.M.; Maberly, S.C.; O’Malley, M.B.; Perkins, R.G. Assessing the mode of action of Phoslock® in the control of phosphorus release from the bed sediments in a shallow lake (Loch Flemington, UK). Water Res. 2013, 47, 4460–4473. [Google Scholar] [CrossRef] [PubMed]
- Lürling, M.; Faassen, E.J. Controlling toxic cyanobacteria: Effects of dredging and phosphorus-binding clay on cyanobacteria and microcystins. Water Res. 2012, 46, 1447–1459. [Google Scholar]
- Ger, K.A.; Urrutia-Cordero, P.; Frost, P.C.; Hansson, L.-A.; Sarnelle, O.; Wilson, A.E.; Lürling, M. The interaction between cyanobacteria and zooplankton in a more eutrophic world. Harmful Algae 2016, 54, 128–144. [Google Scholar] [CrossRef] [PubMed]
- Lürling, M.; Waajen, G.; Van Oosterhout, F. Humic substances interfere with phosphate removal by lanthanum modified clay in controlling eutrophication. Water Res. 2014, 54, 78–88. [Google Scholar] [CrossRef] [PubMed]
- Dithmer, L.; Nielsen, U.G.; Lundberg, D.; Reitzel, K. Influence of dissolved organic carbon on the efficiency of P sequestration by a lanthanum modified clay. Water Res. 2016, 97, 39–46. [Google Scholar] [CrossRef] [PubMed]
- Reitzel, K.; Andersen, F.O.; Egemose, S.; Jensen, H.S. Phosphate adsorption by lanthanum modified bentonite clay in fresh and brackish water. Water Res. 2013, 47, 2787–2796. [Google Scholar] [CrossRef] [PubMed]
- Psenner, R.; Pucsko, R.; Sager, M. Fractionation of organic and inorganic phosphorus compounds in lake sediments. Arch. Hydrobiol. Suppl. 1984, 70, 111–155. [Google Scholar]
- Hupfer, M.; Gächter, R.; Giovanoli, R. Transformation of phosphorus species in settling seston and during early sediment diagenesis. Aquat. Sci. 1995, 57, 305–324. [Google Scholar] [CrossRef]
- Netherlands Normalization Institute (NEN). Water: Photometric Determination of the Content of Dissolved Orthophosphate and the Total Content of Phosphorous Compounds by Continuous Flow Analysis; NEN 6663; Netherlands Normalization Institute: Delft, The Netherlands, 1986. [Google Scholar]
- Schauser, I.; Chorus, I.; Lewandowski, J. Effects of nitrate on phosphorus release: Comparison of two Berlin lakes. Acta Hydroch. Hydrob. 2006, 34, 325–332. [Google Scholar] [CrossRef]
- Netherlands Normalization Institute (NEN). Water: Photometric Determination of the Content of Ammonium Nitrogen and the Sum of the Contents of Ammoniacal and Organically Bound Nitrogen according to Kjeldahl by Continuous Flow Analysis; NEN 6646; Netherlands Normalization Institute: Delft, The Netherlands, 1990. [Google Scholar]
- Netherlands Normalization Institute (NEN). Bepaling van het Stikstofgehalte in de Vorm van Nitriet en in de Vorm van Nitraat en de som van Beide Met Doorstroomanalyse (CFA en FIA) en Spectrometrische Detectie; NEN-EN-ISO 13395; Netherlands Normalization Institute: Delft, The Netherlands, 1997. [Google Scholar]
- Van den Brink, P.J.; van Donk, E.; Gylstra, R.; Crum, S.J.H.; Brock, T.C.M. Effects of chronic low concentrations of the pesticides chlorpyrifos and atrazine in indoor fresh-water microcosms. Chemosphere 1995, 31, 3181–3200. [Google Scholar] [CrossRef]
- Van den Brink, P.J.; Ter Braak, C.J.F. Principal response curves: Analysis of time-dependent multivariate responses of biological community to stress. Environ. Toxicol. Chem. 1999, 18, 138–148. [Google Scholar] [CrossRef]
- Ter Braak, C.J.F.; Smilauer, P. CANOCO Reference Manual and CanoDraw for Windows User’s Guide: Software for Canonical Community Ordination, version 4.5; Microcomputer Power: Ithaca, NY, USA, 2002. [Google Scholar]
- Verweij, W. CHEAQS, a Program for Calculating CHemical Equilibria in AQuatic Systems, PRO version (2010.3); 2010. Available online: http://www.cheaqs.eu/history.html. (accessed on 27 December 2010).
- Tipping, E. WHAM—A chemical equilibrium model and computer code for waters, sediments and soils incorporating a discrete site/electrostatic model of ion-binding by humic substances. Comput. Geosci. 1994, 20, 973–1023. [Google Scholar] [CrossRef]
- Tipping, E.; Hurley, M.A. A unifying model of cation binding by humic substances. Geochim. Cosmochim. Acta 1992, 56, 3627–3641. [Google Scholar] [CrossRef]
- Tipping, E. Humic ion-binding model VI: An improved description of the interactions of protons and metal ions with humic substances. Aquat. Geochem. 1998, 4, 3–48. [Google Scholar] [CrossRef]
- Tipping, E.; Lofts, S.; Sonke, J.E. Humic Ion-Binding Model VII: A revised parameterisation of cation-binding by humic substances. Environ. Chem. 2011, 8, 225–235. [Google Scholar] [CrossRef]
- Tang, J.; Johannesson, K.H. Speciation of rare earth elements in natural terrestrial waters: Assessing the role of dissolved organic matter from the modeling approach. Geochim. Cosmochim. Acta 2003, 67, 2321–2339. [Google Scholar] [CrossRef]
- Pourret, O.; Davranche, M.; Gruau, G.; Dia, A. Competition between humic acid and carbonates for rare earth elements complexation. J. Colloid Interface Sci. 2007, 305, 25–31. [Google Scholar] [CrossRef] [PubMed]
- Moore, B.C.; Funk, W.H.; Lafer, J. Long-term effects of dredging on phosphorus availability from Liberty Lake sediments. Lake Reserv. Manag. 1988, 4, 293–301. [Google Scholar] [CrossRef]
- Burton, G.A., Jr. Sediment quality criteria in use around the world. Limnology 2002, 3, 65–75. [Google Scholar] [CrossRef]
- Brouwer, E.; Roelofs, J.G. M. Degraded softwater lakes: Possibilities for restoration. Restor. Ecol. 2001, 9, 155–166. [Google Scholar] [CrossRef]
- Peterson, S.A. Lake restoration by sediment removal. Water Resour. Bull. 1982, 18, 423–435. [Google Scholar] [CrossRef]
- Eggleton, J.; Thomas, K.V. A review of factors affecting the release and bioavailability of contaminants during sediment disturbance events. Environ. Int. 2004, 30, 973–980. [Google Scholar] [CrossRef] [PubMed]
- Newcombe, C.P.; Macdonald, D.D. Effects of suspended sediments on aquatic ecosystems. N. Am. J. Fish. Manag. 1991, 11, 72–82. [Google Scholar] [CrossRef]
- Poor, N.D. Effect of lake management efforts on the trophic state of a subtropical shallow lake in Lakeland, Florida, USA. Water Air Soil Pollut. 2010, 207, 333–347. [Google Scholar] [CrossRef]
- Sommer, U.; Adrian, R.; De Senerpont Domis, L.; Elser, J.J.; Gaedke, U.; Ibelings, B.; Jeppesen, E.; Lürling, M.; Molinero, J.C.; Mooij, W.M.; et al. Beyond the plankton ecology group (PEG) model: Mechanisms driving plankton succession. Annu. Rev. Ecol. Evol. Syst. 2012, 43, 429–448. [Google Scholar] [CrossRef]
- Wickham, S.A.; Gilbert, J.J. Relative vulnerabilities of natural rotifer and ciliate communities to cladocerans: Laboratory and field experiments. Freshw. Biol. 1991, 26, 77–86. [Google Scholar] [CrossRef]
- Zhang, S.; Zhou, Q.; Xu, D.; Lin, J.; Cheng, S.; Wu, Z. Effects of sediment dredging on water quality and zooplankton community structure in a shallow of eutrophic lake. J. Environ. Sci. 2010, 22, 218–224. [Google Scholar] [CrossRef]
- Lürling, M.; Tolman, Y. Effects of lanthanum and lanthanum-modified clay on growth, survival and reproduction of Daphnia magna. Water Res. 2010, 44, 309–319. [Google Scholar] [CrossRef] [PubMed]
- Sneller, F.E.C.; Kalf, D.F.; Weltje, L.; van Wezel, A.P. Maximum Permissible Concentrations and Negligible Concentrations for Rare Earth Elements (REEs); Report 601501011; RIVM: Bilthoven, The Nederlands, 5 July 2000. [Google Scholar]
- Haupt, F.; Stockenreiter, M.; Reichwaldt, E.S.; Baumgartner, M.; Lampert, W.; Boersma, M.; Stibor, H. Upward phosphorus transport by Daphnia diel vertical migration. Limnol. Oceanogr. 2010, 55, 529–534. [Google Scholar] [CrossRef]
- Santos-Magalhaes, I.; Lürling, M.; Roijackers, R.M.M. Vertical distribution of Daphnia in Lake Berendonck (The Netherlands) during progressive hypolimnion oxygen depletion. Verh. Int. Ver. Theor. Angew. Limnol. 2005, 29, 273–278. [Google Scholar]
- Kirk, K.L.; Gilbert, J.J. Suspended clay and the population dynamics of planktonic rotifers and cladocerans. Ecology 1990, 71, 1741–1755. [Google Scholar] [CrossRef]
- Su, Y.; Zhang, C.; Liu, J.; Weng, Y.; Li, H.; Zhang, D. Assessing the impacts of phosphorus inactive clay on phosphorus release control and phytoplankton community structure in eutrophic lakes. Environ. Pollut. 2016, 219, 620–630. [Google Scholar] [CrossRef] [PubMed]
- Van Oosterhout, J.F.X.; Lürling, M. ffects of the novel ‘Flock & Lock’ lake restoration technique on Daphnia in Lake Rauwbraken (The Netherlands). J. Plankton Res. 2011, 33, 255–263. [Google Scholar]
- Epe, T.S.; Finsterle, K.; Yasseri, S. Nine Years of Phosphorus Management with Lanthanum Modified Bentonite (Phoslock) in a Eutrophic, Shallow Swimming Lake in Germany. Lake Reserv. Manag. 2017. [Google Scholar] [CrossRef]
- Stauber, J.L.; Binet, M.T. Canning River Phoslock Field Trial—Ecotoxicity Testing Final Report; Report No.: ET317R; Centre for Advanced Analytical Chemistry Energy Technology, CSIRO: Bangor, Australia, 2000; p. 52. [Google Scholar]
- Hu, X.; Ding, Z.; Wang, X.; Chen, Y.; Dai, L. Effects of lanthanum and cerium on the vegetable growth of wheat (Triticum aestivum L.) seedlings. Bull. Environ. Contam. Toxicol. 2002, 69, 727–733. [Google Scholar] [CrossRef] [PubMed]
- Tyler, G. Rare earth elements in soil and plant systems—A review. Plant Soil 2004, 267, 191–206. [Google Scholar] [CrossRef]
- Waajen, G.; van Oosterhout, F.; Douglas, G.; Lürling, M. Management of eutrophication in Lake De Kuil (The Netherlands) using combined flocculant—Lanthanum modified bentonite treatment. Water Res. 2016, 97, 83–95. [Google Scholar] [CrossRef] [PubMed]
- Waajen, G.; van Oosterhout, F.; Douglas, G.; Lürling, M. Geo-engineering experiments in two urban ponds to control eutrophication. Water Res. 2016, 97, 69–82. [Google Scholar] [CrossRef] [PubMed]
- Søndergaard, M.; Jeppesen, E.; Lauridsen, T.L.; Skov, C.; Van Nes, E.H.; Roijackers, R.; Lammens, E.; Portielje, R. Lake restoration: Successes, failures and long-term effects. J. Appl. Ecol. 2007, 44, 1095–1105. [Google Scholar] [CrossRef]
- Gibbs, M.M.; Hickey, C.W.; Özkundakci, D. Sustainability assessment and comparison of efficacy of four P-inactivation agents for managing internal phosphorus loads in lakes: Sediment incubations. Hydrobiologia 2011, 658, 253–275. [Google Scholar] [CrossRef]
- Dithmer, L.; Lipton, A.S.; Reitzel, K.; Warner, T.E.; Lundberg, D.; Nielsen, U.G. Characterization of phosphate sequestration by a lanthanum modified bentonite clay: A solid-state NMR, EXAFS and PXRD study. Environ. Sci. Technol. 2015, 49, 4559–4566. [Google Scholar] [CrossRef] [PubMed]
- Sonke, J.E.; Salters, V.J.M. Lanthanide–humic substances complexation. I. Experimental evidence for a lanthanide contraction effect. Geochim. Cosmochim. Acta 2006, 70, 1495–1506. [Google Scholar] [CrossRef]
- Tang, J.; Johannesson, K.H. Ligand extraction of rare earth elements from aquifer sediments: Implications for rare earth element complexation with organic matter in natural waters. Geochim. Cosmochim. Acta 2010, 74, 6690–6705. [Google Scholar] [CrossRef]
- Weng, L.; van Riemsdijk, W.H.; Hiemstra, T. Humic nanoparticles at the oxide-water interface: Interactions with phosphate ion adsorption. Environ. Sci. Technol. 2008, 42, 8747–8752. [Google Scholar] [CrossRef] [PubMed]
- Dance, K.W. The role of the neighbourhood in rehabilitation of an urban aquatic ecosystem. Water Qual. Res. J. Can. 1997, 32, 245–256. [Google Scholar]
- Kosten, S.; Huszar, V.L.M.; Mazzeo, N.; Scheffer, M.; Sternberg, L.D.S.L.; Jeppesen, E. Lake and watershed characteristics rather than climate influence nutrient limitation in shallow lakes. Ecol. Appl. 2009, 19, 1791–1804. [Google Scholar] [CrossRef] [PubMed]
Figure 1.
Location of Heesch Pond in the province of North Brabant (a); a more detailed schematic overview of the pond including the location of the enclosures in the pond (b).
Figure 1.
Location of Heesch Pond in the province of North Brabant (a); a more detailed schematic overview of the pond including the location of the enclosures in the pond (b).

Figure 2.
The course of the mean Secchi depth (cm; Panel A), turbidity (NTU; Panel B), pH (Panel C), conductivity (EC, μS cm−1; Panel D), dissolved oxygen concentration (mg L−1; Panel E) and temperature (°C; Panel F) in control enclosures, Phoslock®-treated enclosures, dredged enclosures, combination Phoslock®-treated and dredged enclosures, and the pond over the 58-d experimental period in 2009. Error bars indicate one standard error (n = 3). In Panel E the dredged enclosures are depicted individually.

Figure 3.
The course of filterable (Panel A) and total aluminum concentrations (μg Al L−1; Panel B), filterable (Panel C) and total iron concentrations (μg Fe L−1; Panel D), filterable- (Panel E) and total lanthanum concentrations (μg La L−1; Panel F), and filterable- (Panel G) and total sulfur concentrations (mg S L−1; Panel H) in control enclosures, LMB-treated enclosures, dredged enclosures, combination LMB-treated and dredged enclosures, and the pond over the 58-d experimental period in 2009. Error bars indicate one standard error (n = 3).
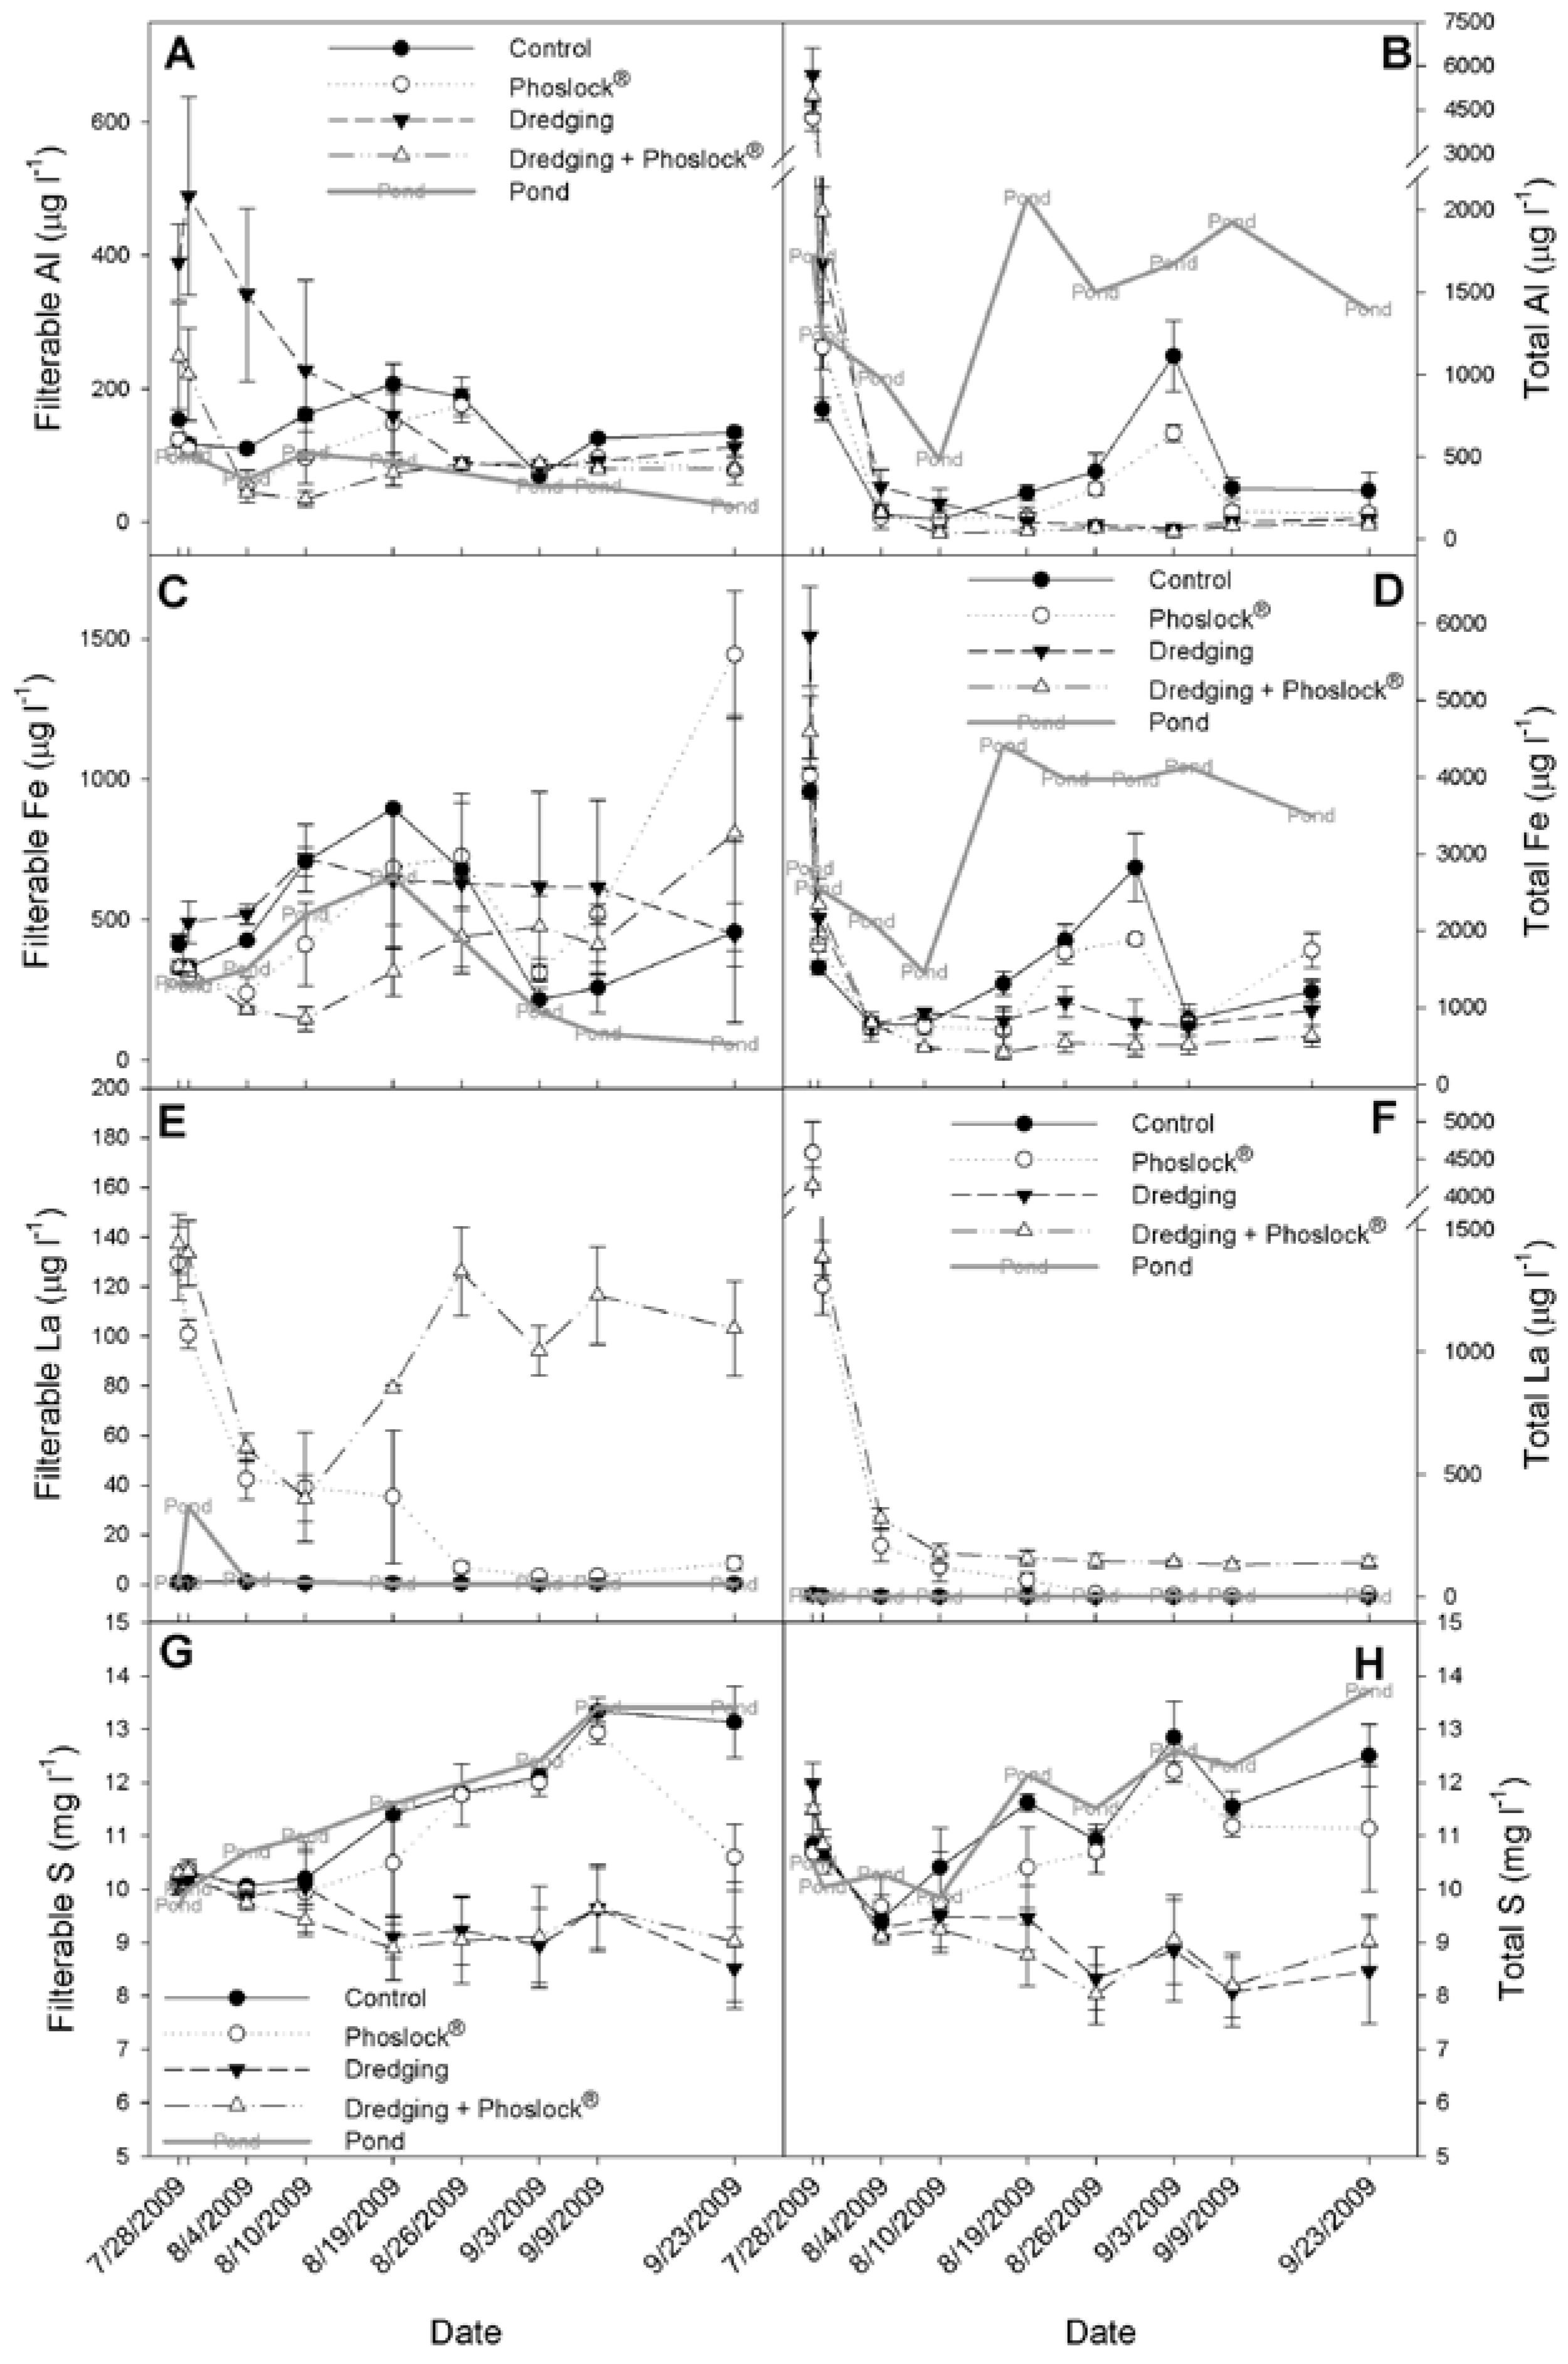
Figure 4.
The course of abundances (# L−1) of Cladocera (Panel A), copepods (Panel B), rotifers (Panel C), and bauplii (Panel D)in control enclosures, LMB-treated enclosures, dredged enclosures, and combination LMB-treated and dredged enclosures over the 58-d experimental period in 2009. Error bars indicate one standard error (n = 3).

Figure 5.
Principal response curves for all water quality variables (except lanthanum), where differences between treatments (enclosures) and the reference (the pond) are given as the regression coefficients (Cdt) of the PRC model. The variable’s weight (bk) in the right vertical diagram indicates the position of the variable on the first PRC axis, in which a negative value indicates a treatment-related increase and a positive value a treatment-related decrease.
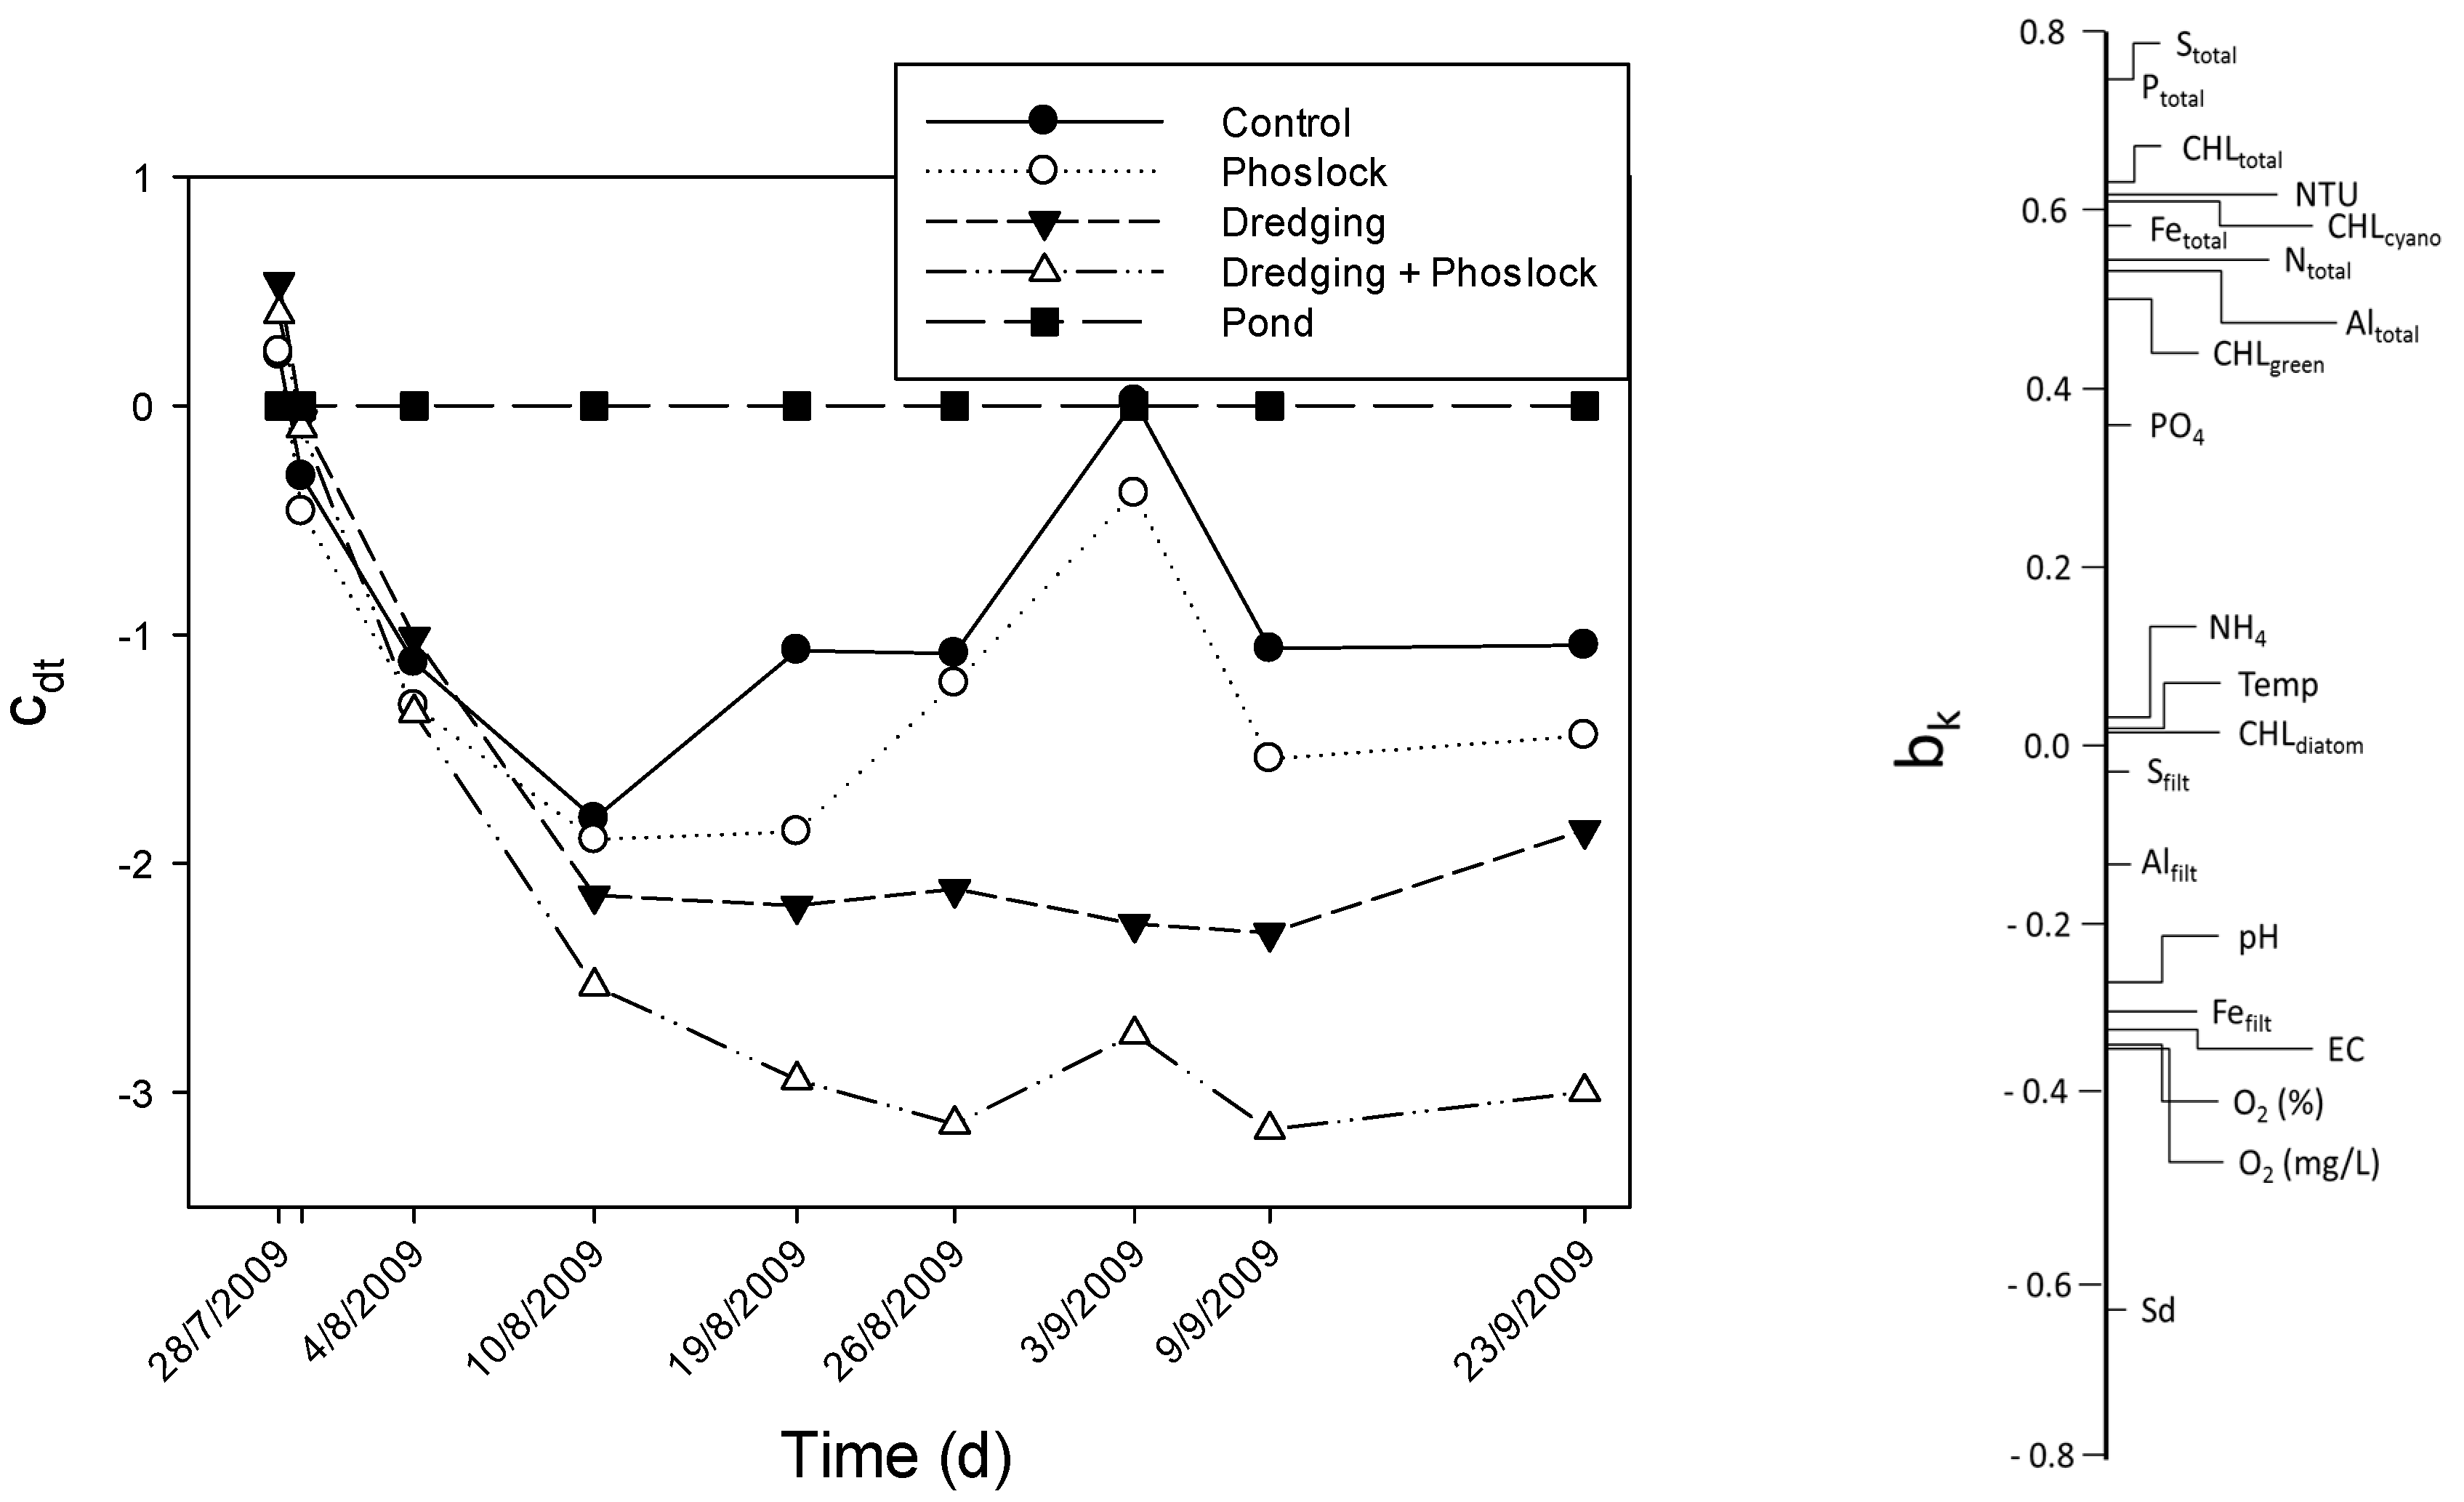
Figure 6.
Results of chemical equilibrium modeling using the program CHEAQS Pro (version 2010.3), giving the distributions of La (Panel A) and P (Panel B) at no DOC or 5.05 mg L−1 DOC as 100% humic acid (HA:FA 1:0), 50% humic acid and 50% fulvic acid (HA:FA 1:1), or 100% fulvic acid (HA:FA 0:1), whereas the same evaluations for La (Panel C) and P (Panel D) are given in the presence of 50 mg L−1 carbonate. Simulations were run at pH = 7.57, La = 2846.5 μg L−1, and phosphate = 173.5 μg L−1, corresponding to the conditions in the treated enclosures.


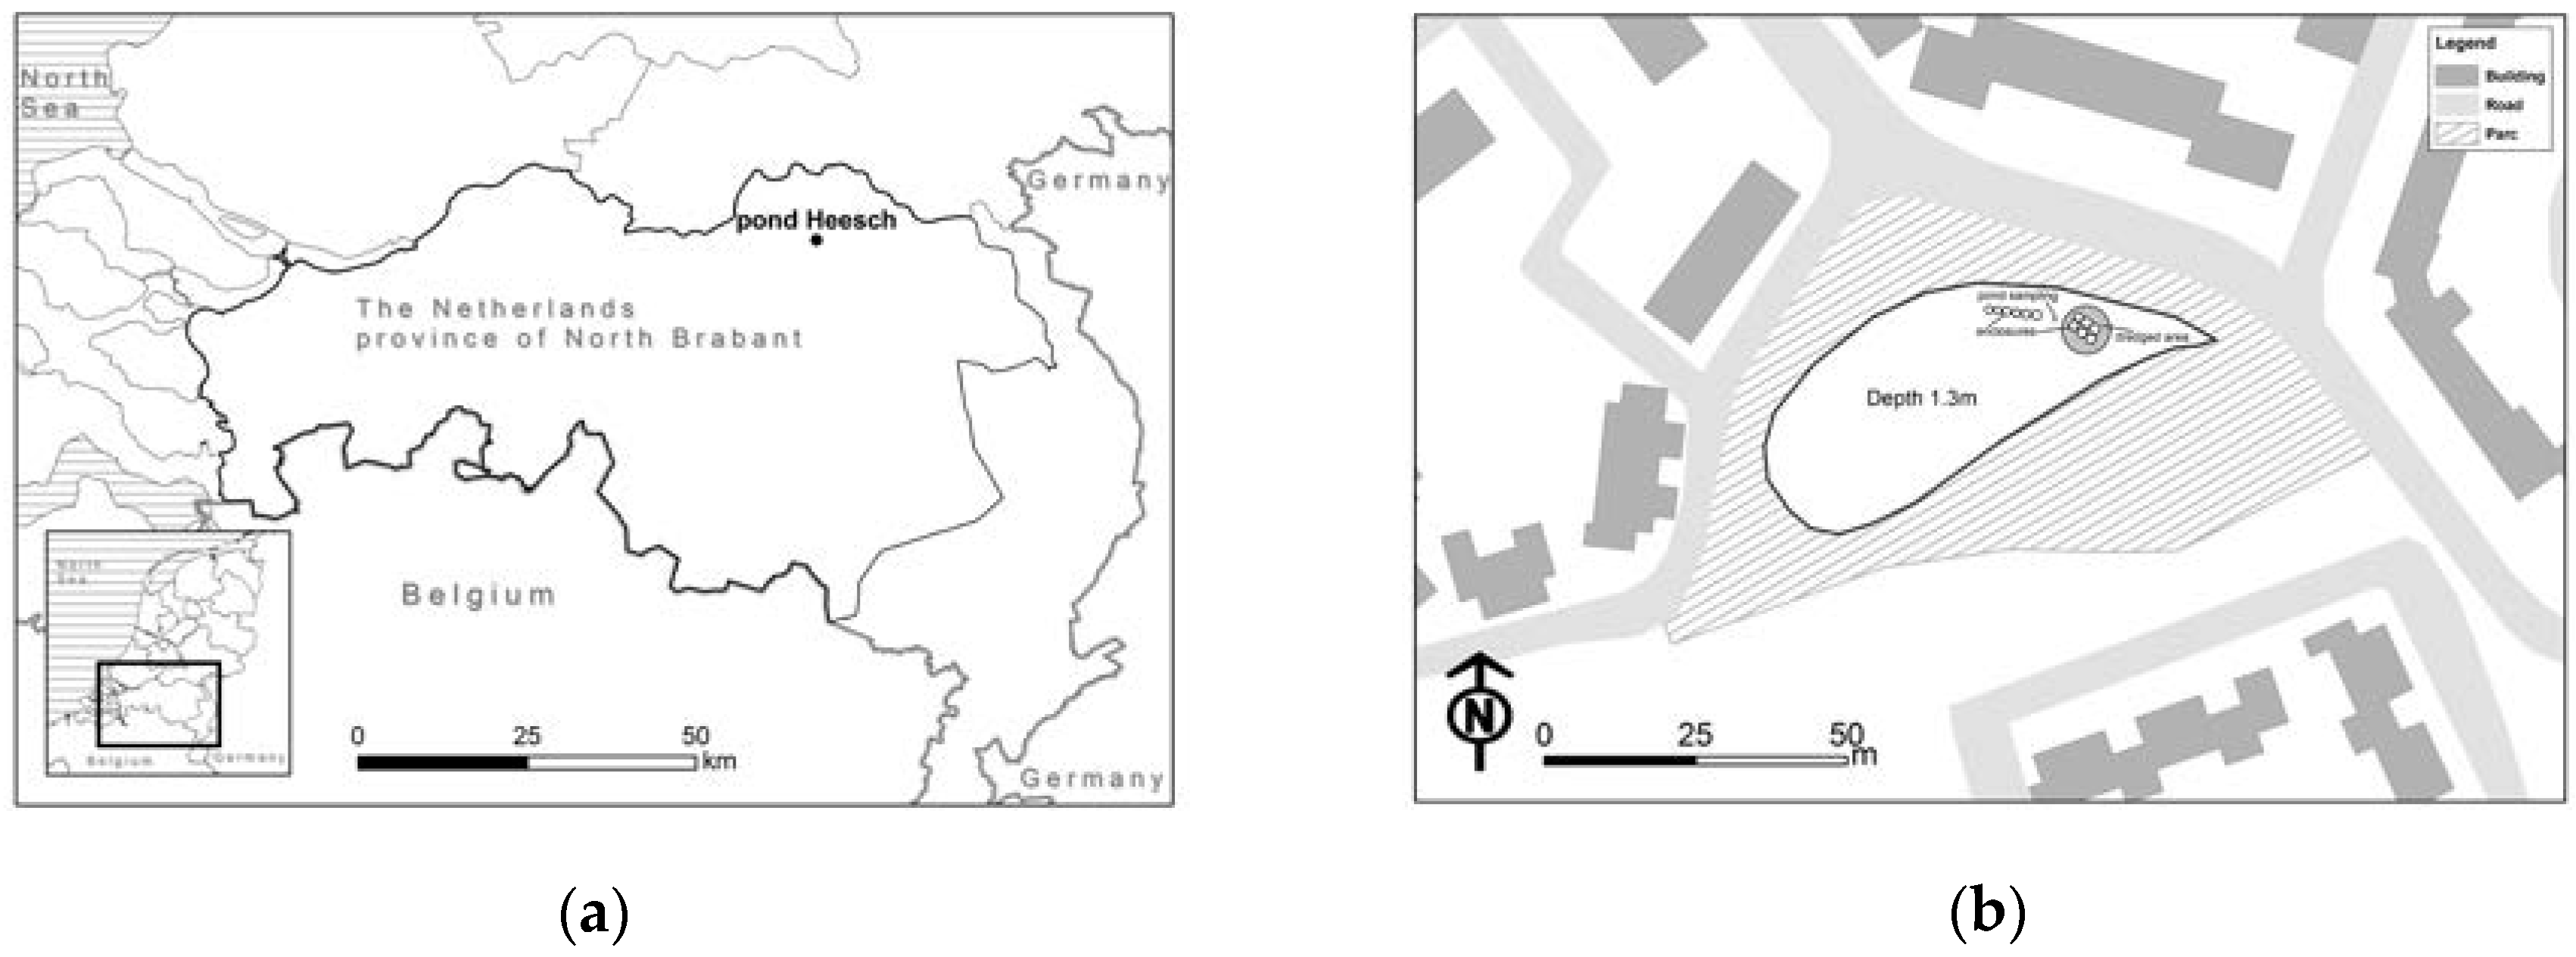
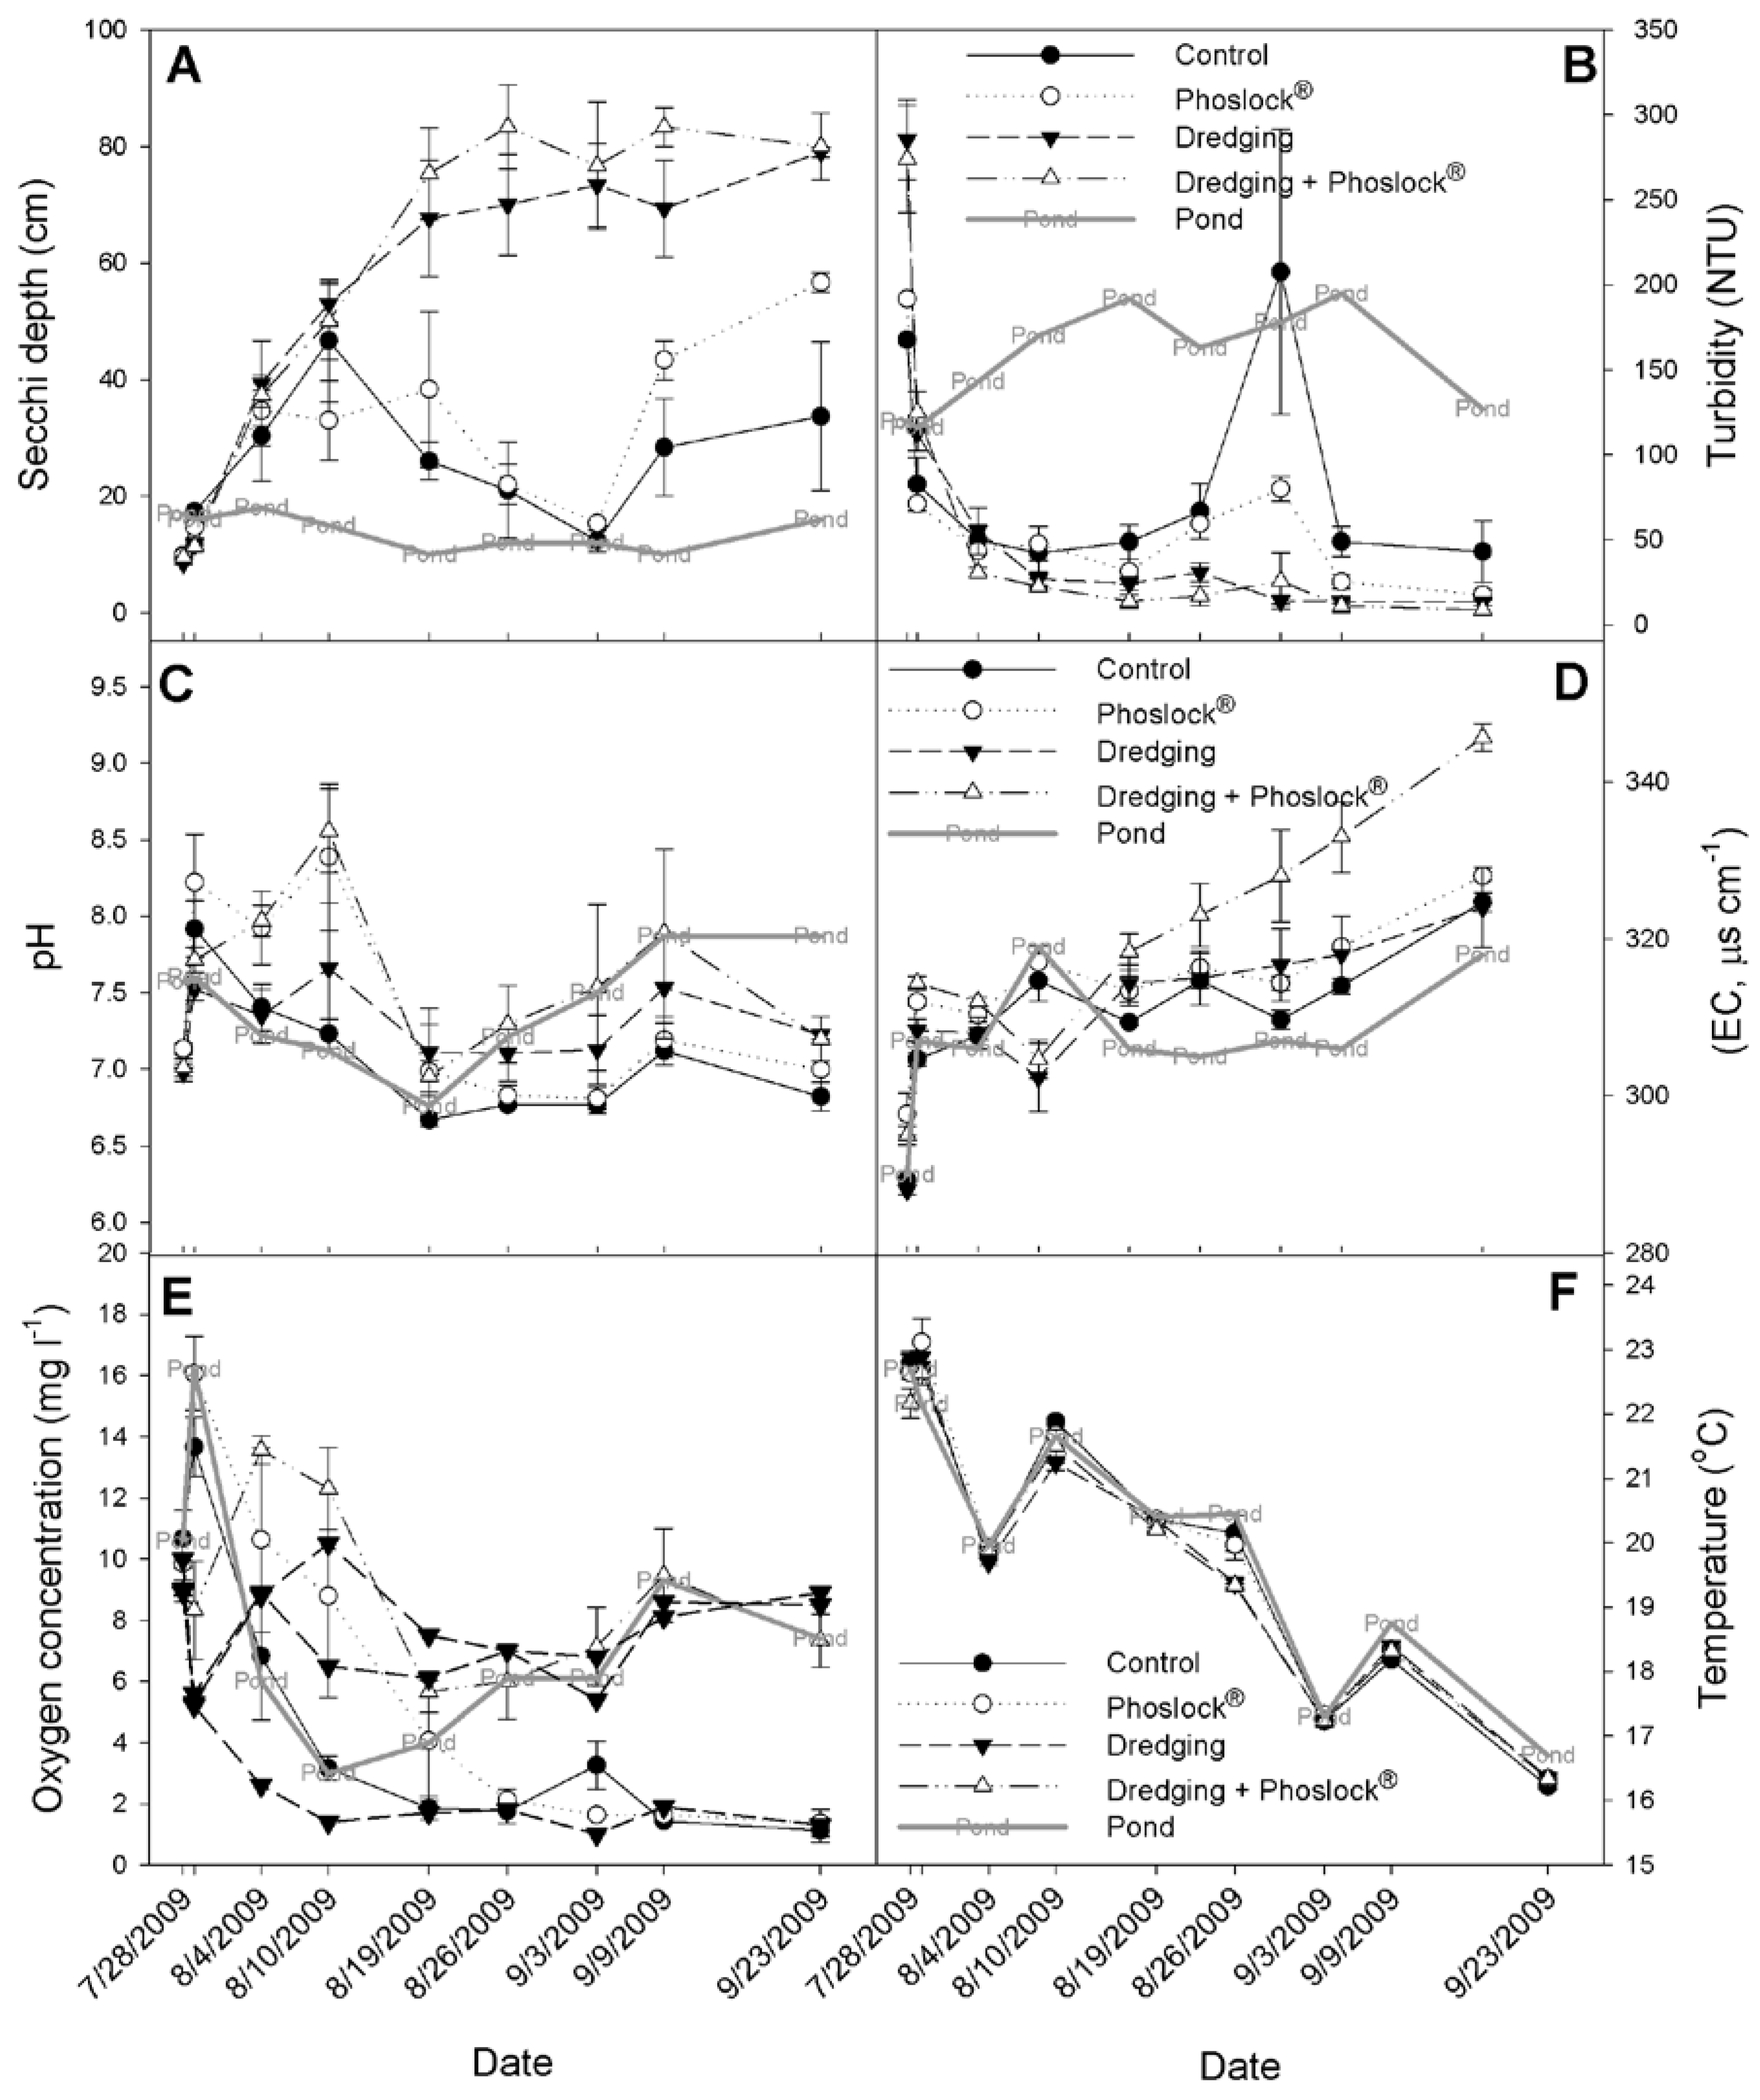
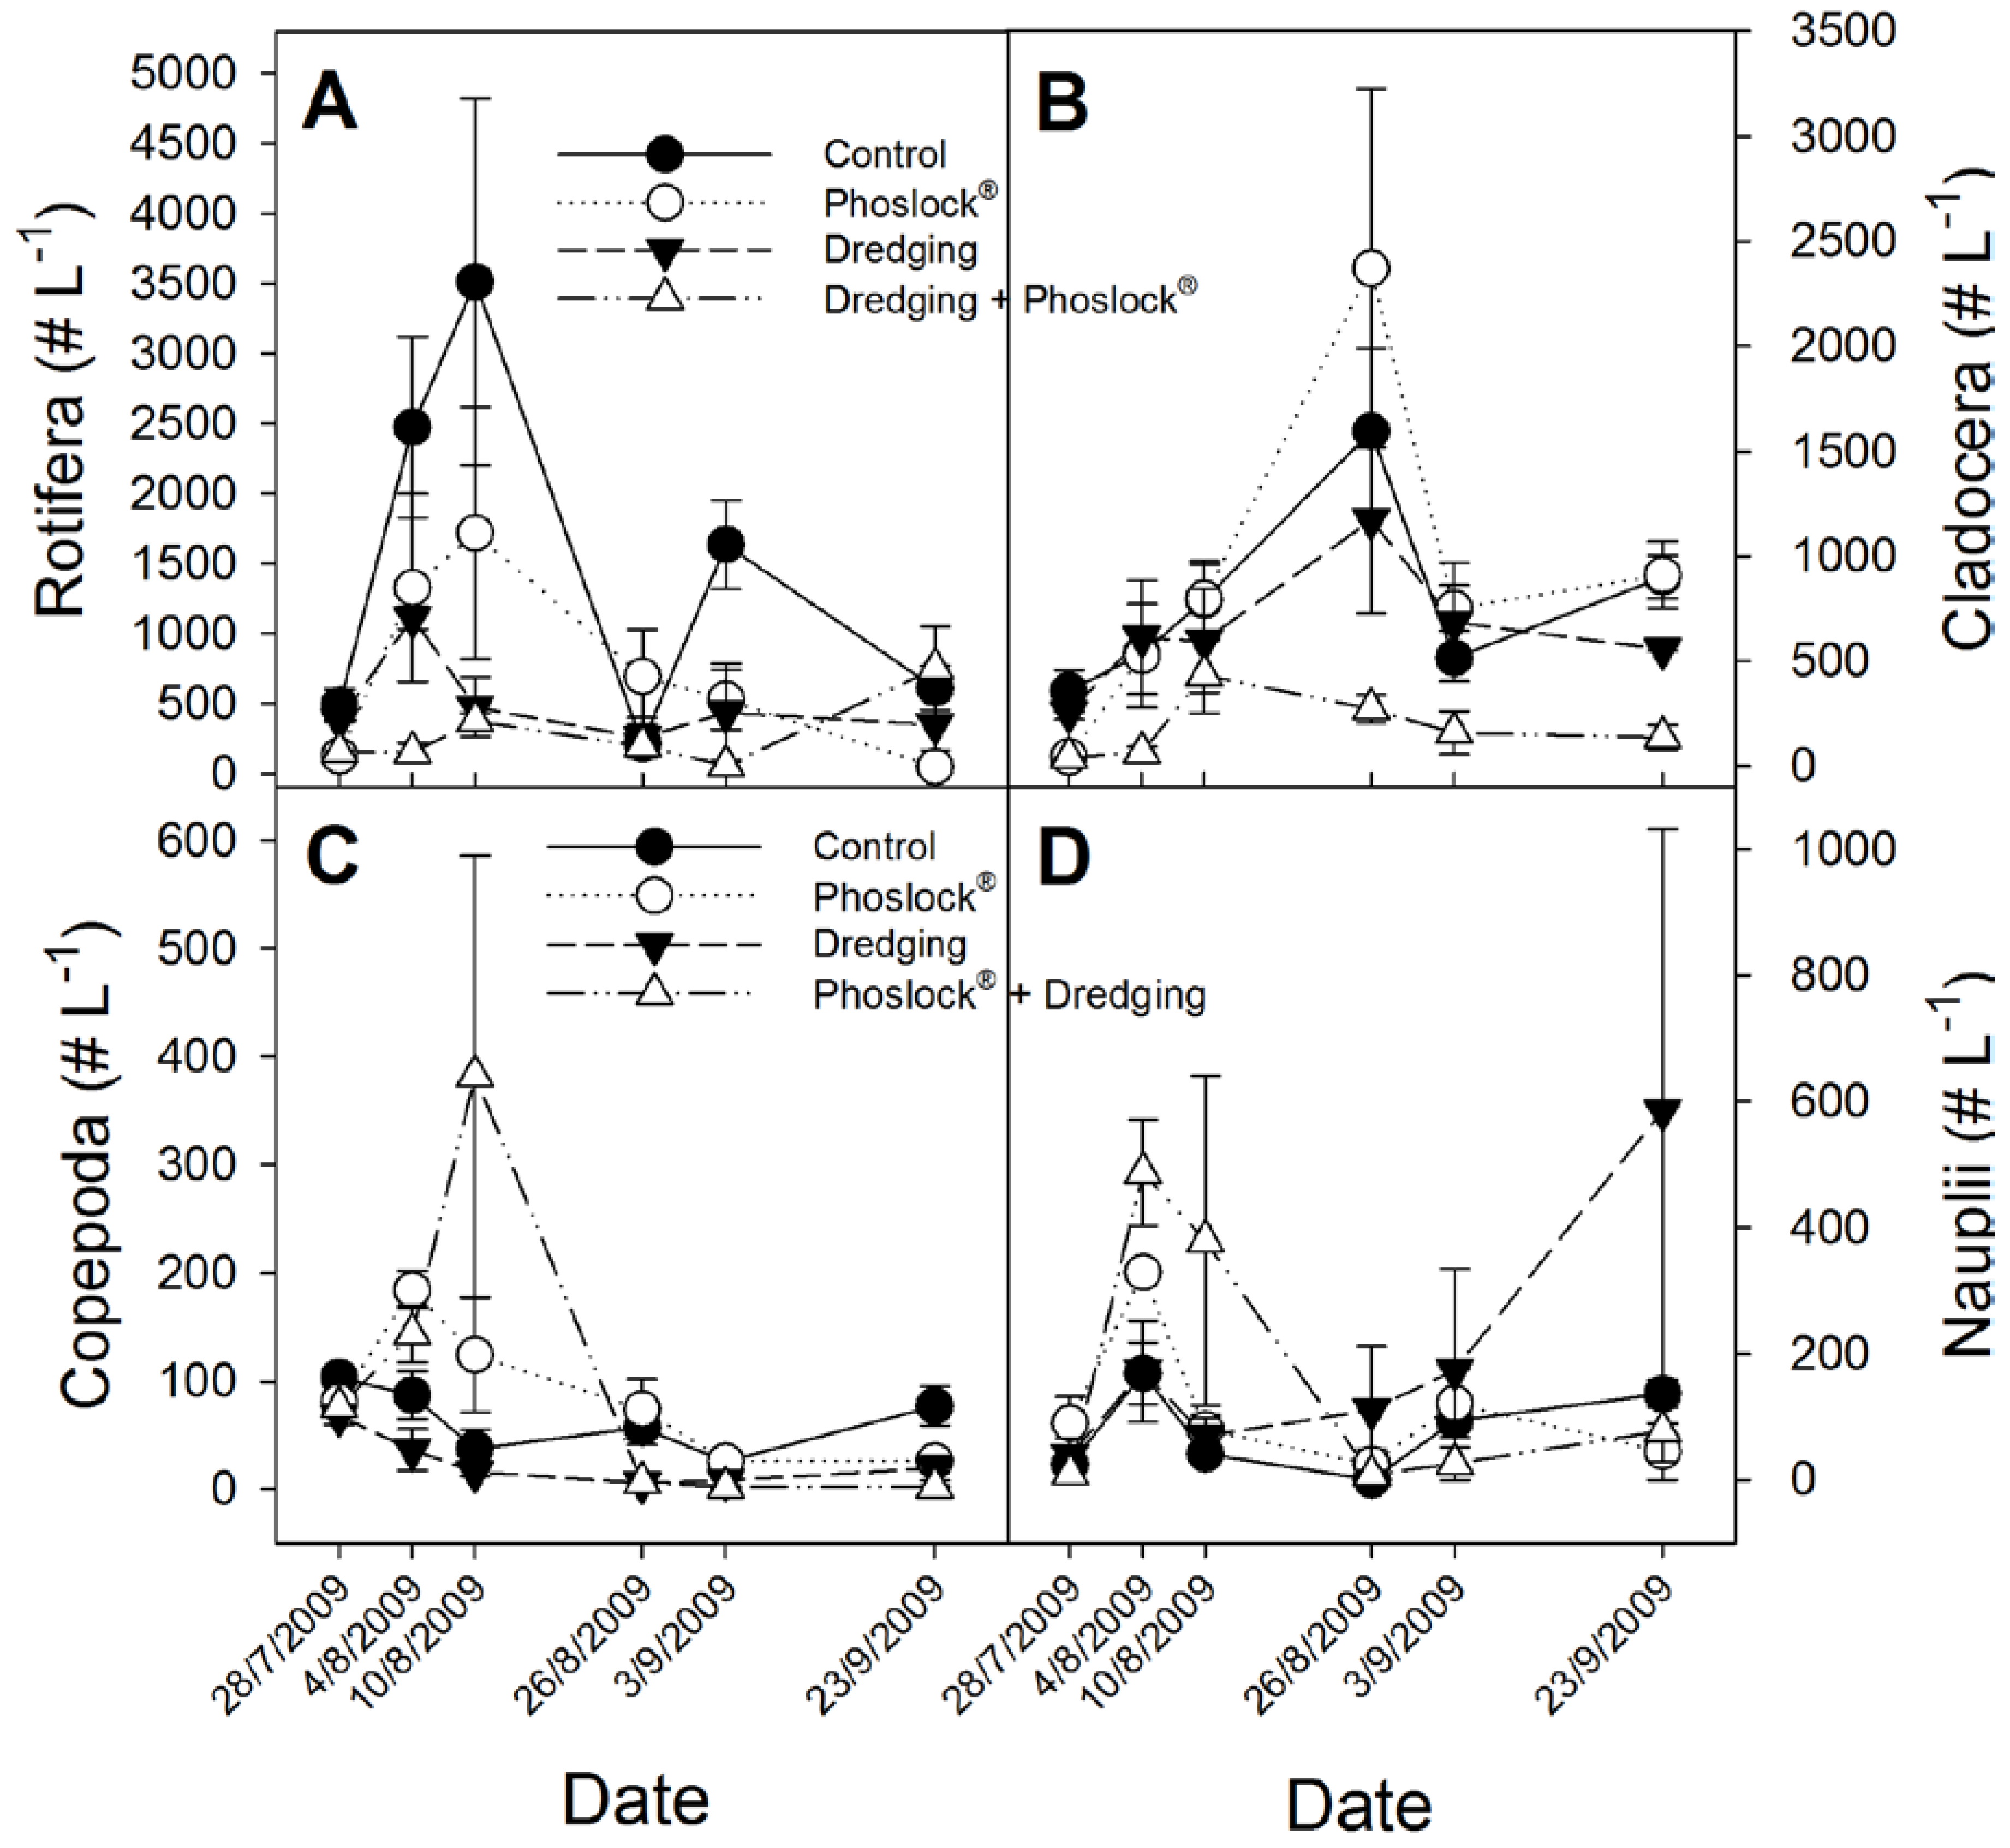
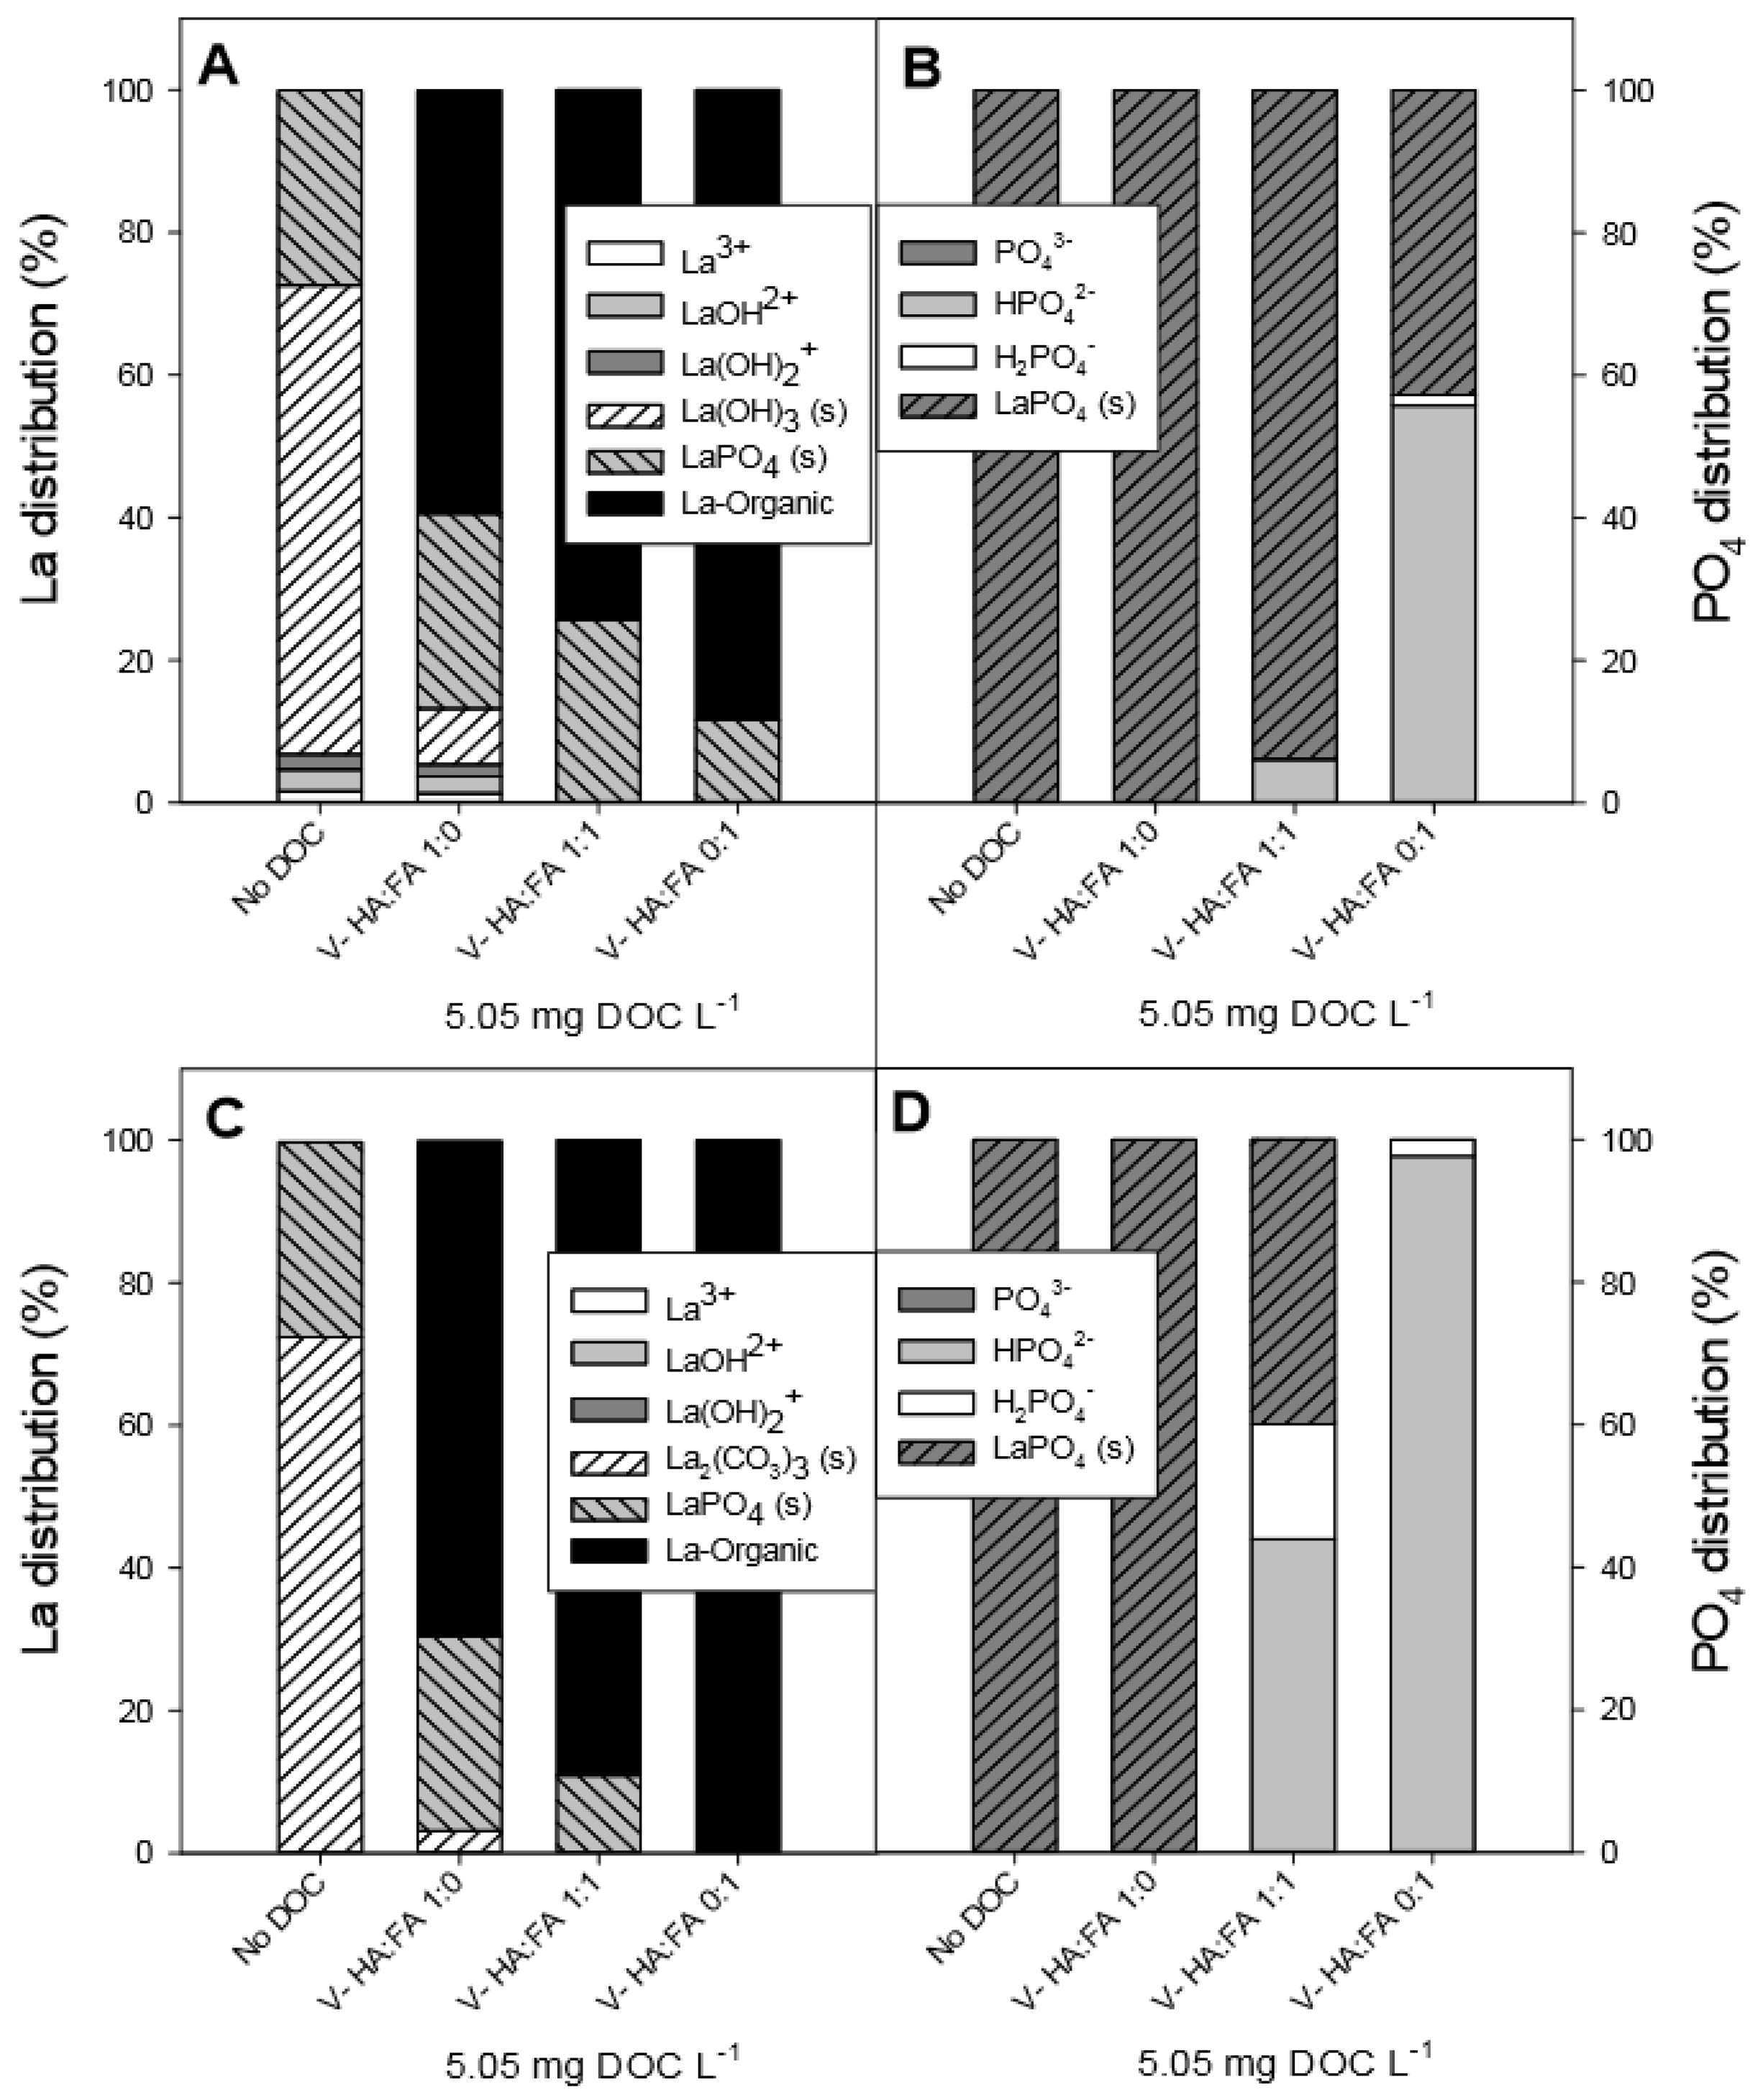
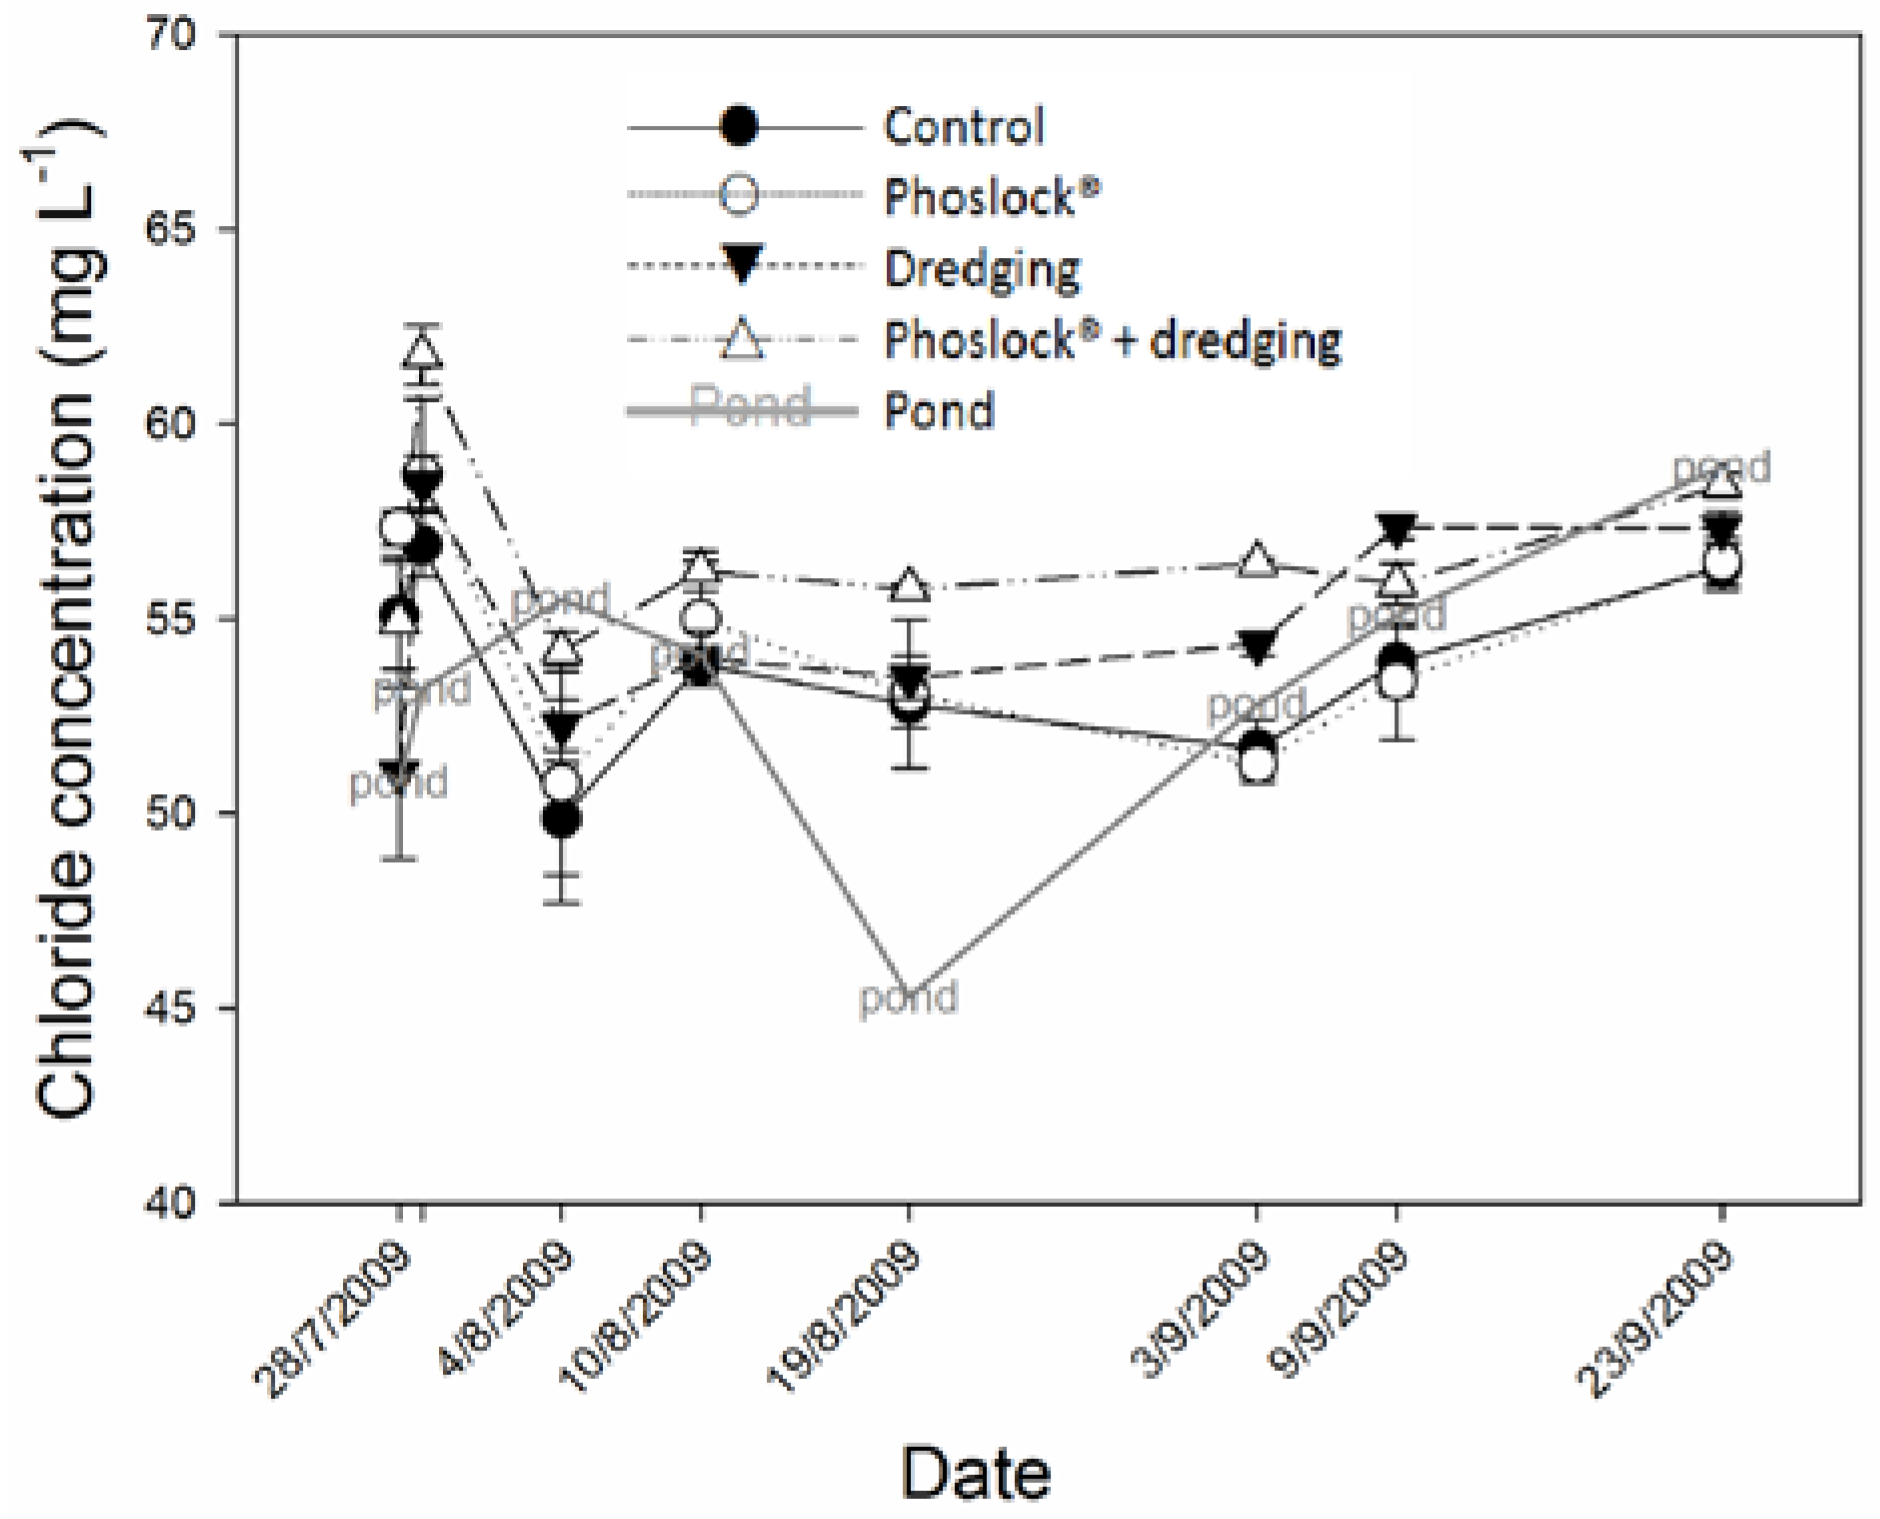
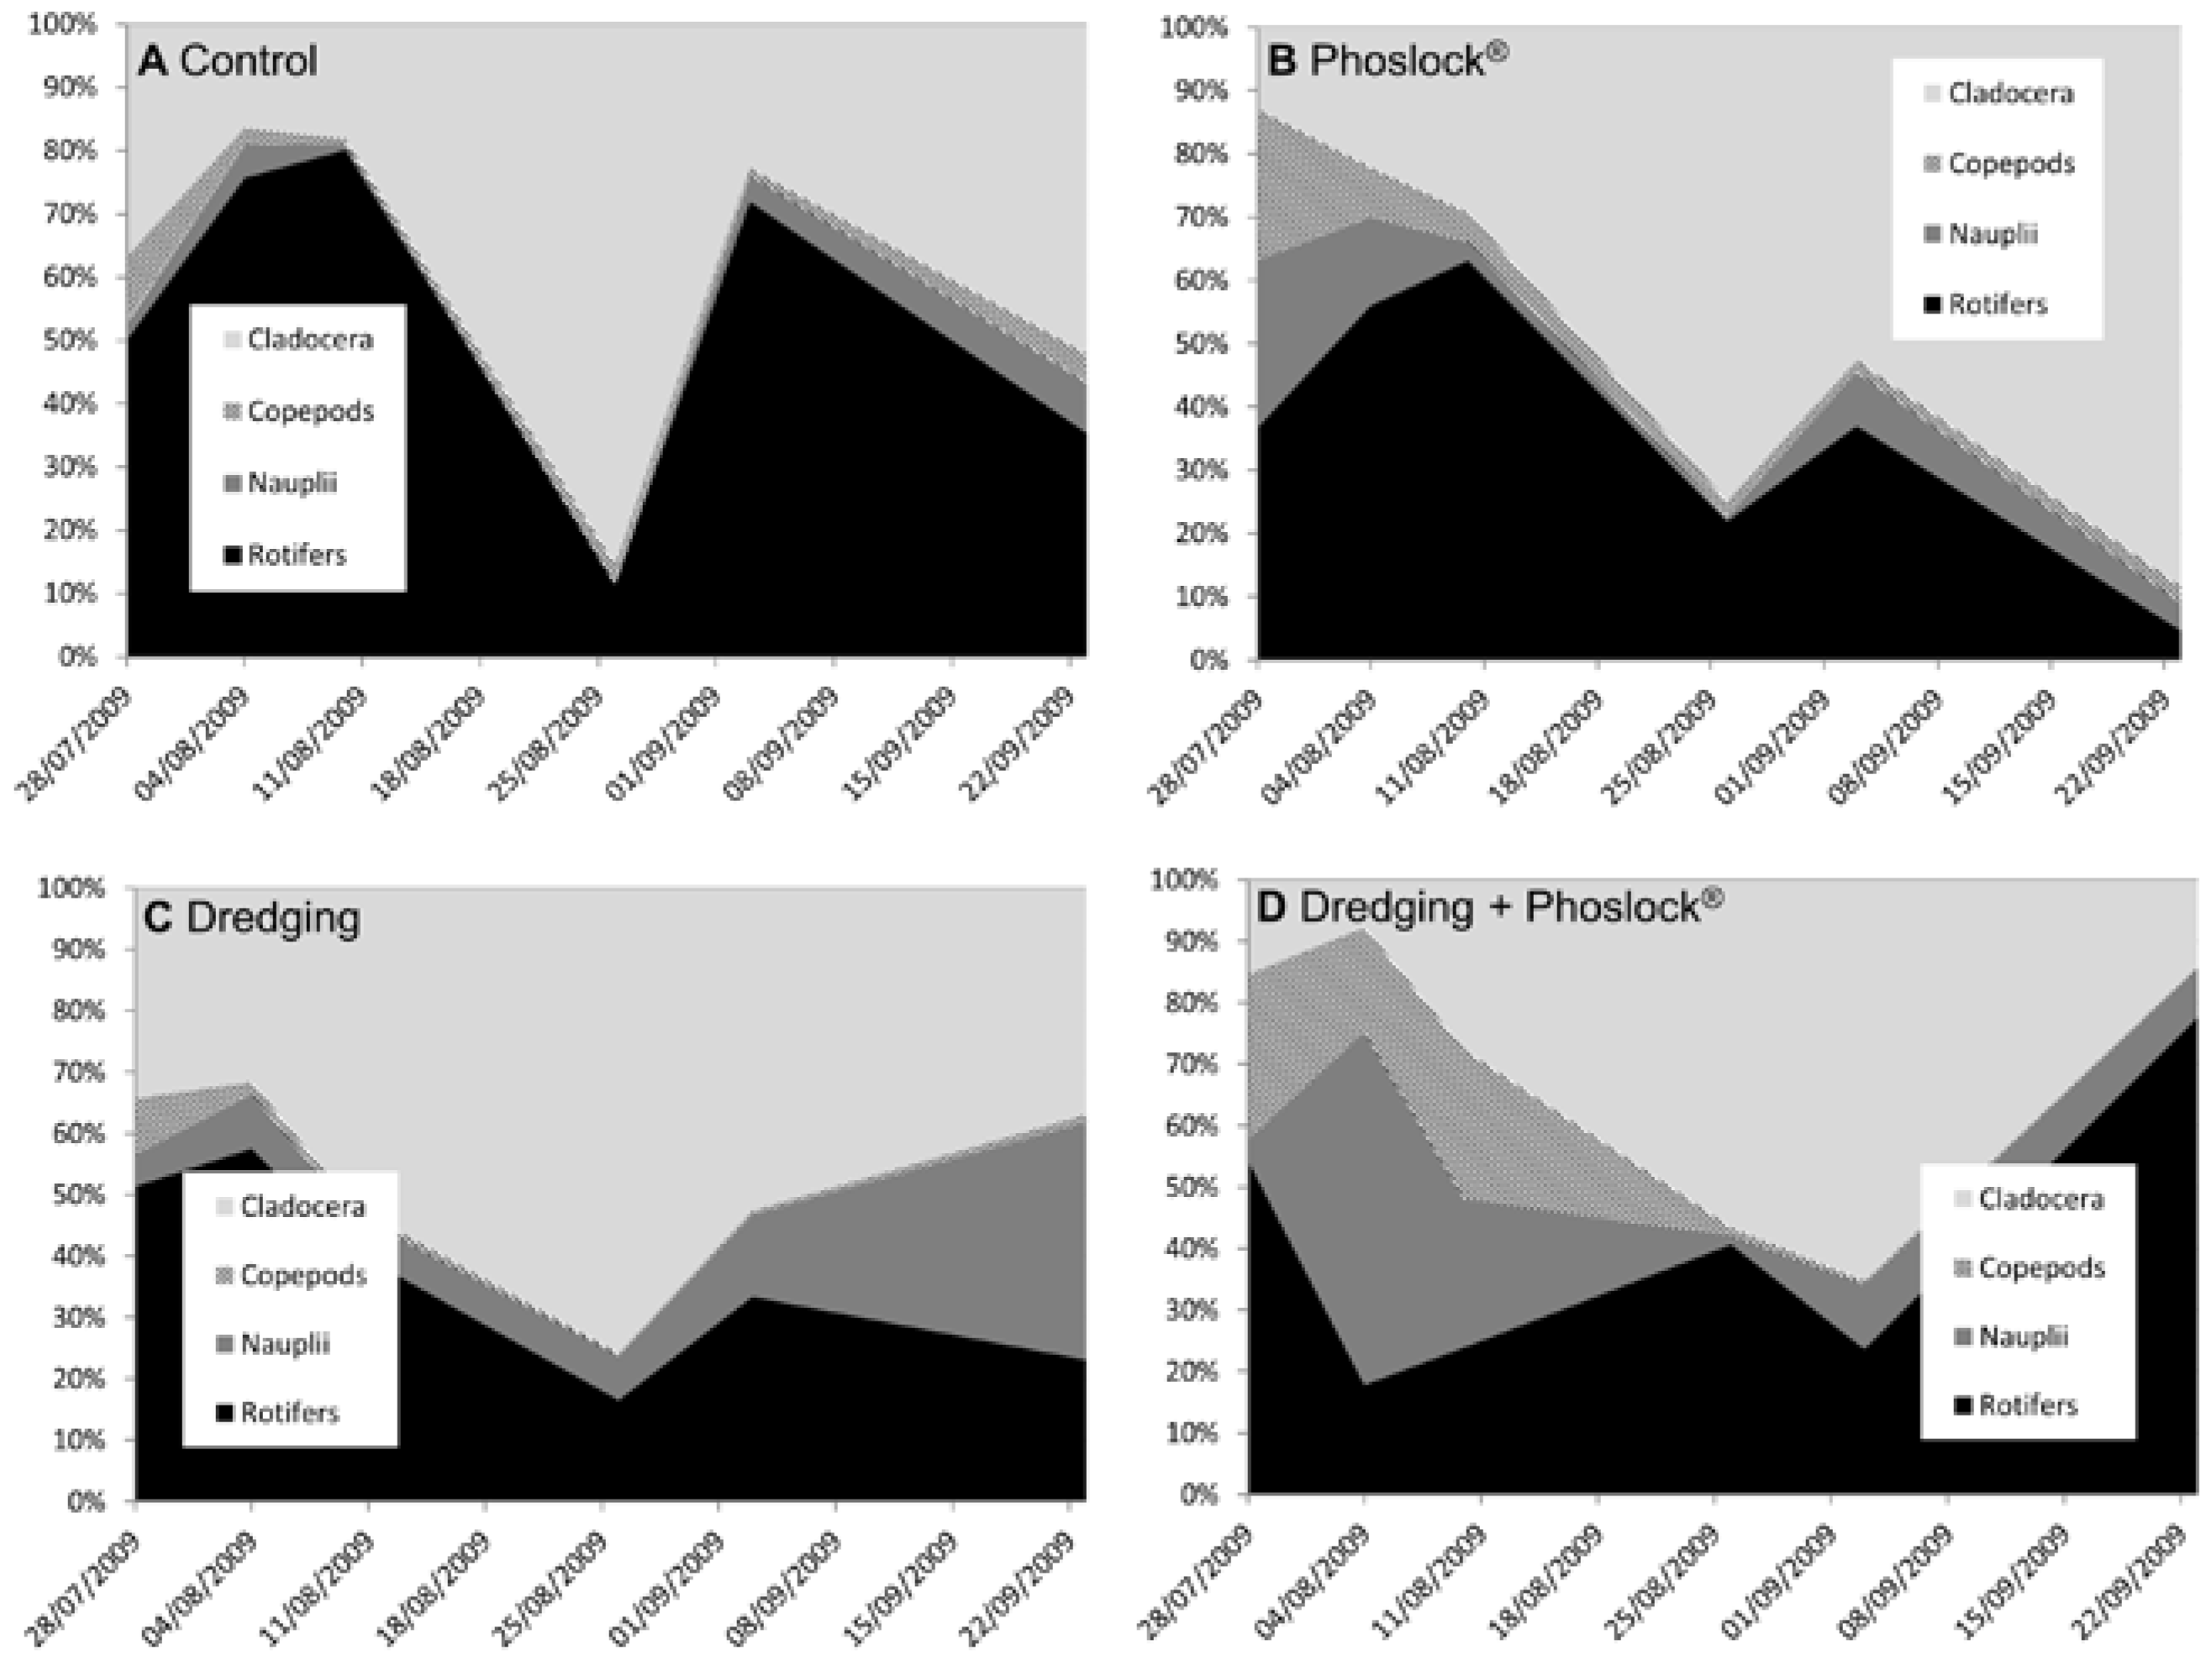
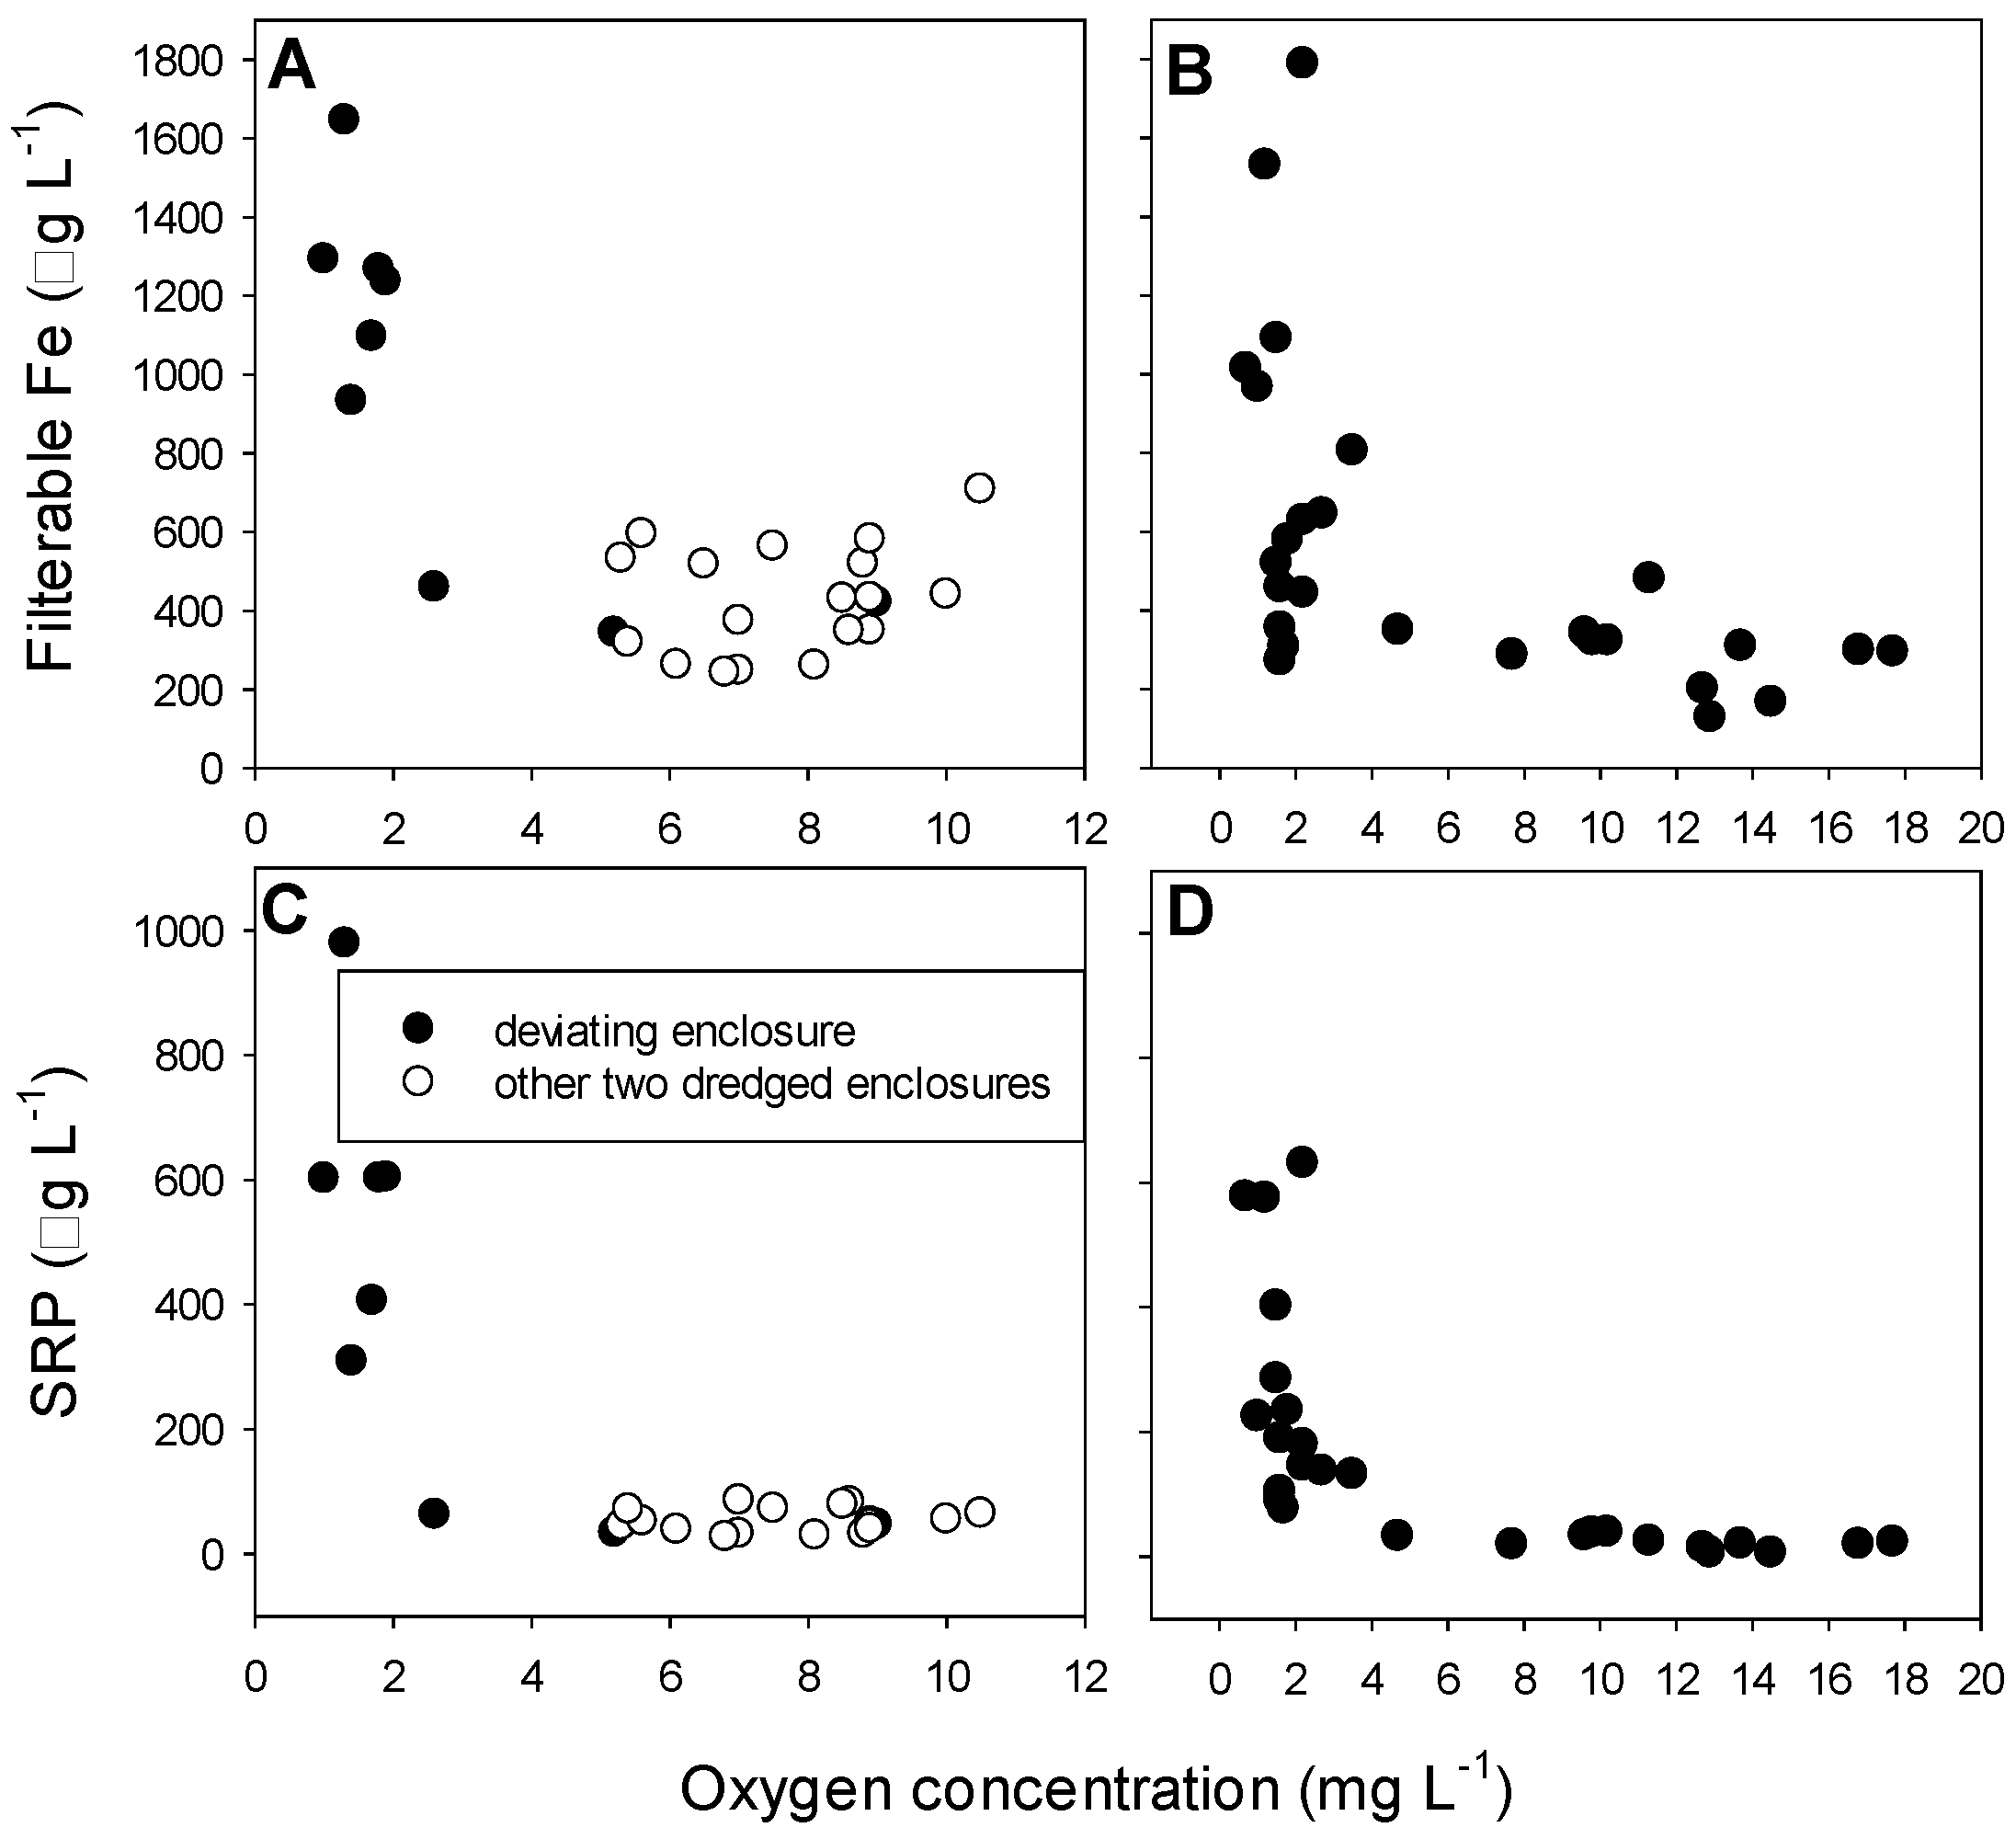
Table 1.
Summary of repeated measures ANOVAs for water quality variables Secchi depth, turbidity (NTU), pH, Electrical Conductivity (EC, µS cm−1), oxygen concentration (mg L−1), and temperature (°C), with treatments (dredging, LMB addition, and their combination) as the fixed factor. All data, except pH, were log-transformed prior to analysis to fulfill the variance homogeneity requirements 1. Significant differences (p < 0.05) are indicated in bold.
| Secchi-Depth | Turbidity | |||||
| Tests of within-subjects effects | ||||||
| Source | df | F | p | df | F | p |
| Time | 8.0 | 81.017 | <0.001 | 8 | 57.819 | <0.001 |
| Time × treatments | 24.0 | 9.211 | <0.001 | 24 | 5.351 | <0.001 |
| Error | 64.0 | 64 | ||||
| Tests of between-subjects effects | ||||||
| Source | df | F | p | df | F | p |
| Treatments | 3 | 26.6 | <0.001 | 3 | 5.165 | 0.028 |
| Error | 8 | 8 | ||||
| pH | Conductivity | |||||
| Tests of within-subjects effects | ||||||
| Source | df | F | p | df | F | p |
| Time | 2.66 | 12.942 | <0.001 | 2.72 | 128.126 | <0.001 |
| Time × treatments | 7.98 | 1.576 | 0.191 | 8.19 | 6.576 | <0.001 |
| Error | 21.3 | 53.8 | ||||
| Tests of between-subjects effects | ||||||
| Source | df | F | p | df | F | p |
| Treatments | 3 | 4.284 | 0.044 | 3 | 5.395 | 0.025 |
| Error | 8 | 8 | ||||
| Oxygen Concentration | Temperature | |||||
| Tests of within-subjects effects | ||||||
| Source | df | F | p | df | F | p |
| Time | 2.49 | 22.606 | <0.001 | 6.46 | 1794.29 | <0.001 |
| Time × treatments | 7.46 | 4.533 | 0.003 | 19.4 | 3.130 | 0.001 |
| Error | 19.89 | 64 | ||||
| Tests of between-subjects effects | ||||||
| Source | df | F | p | df | F | p |
| Treatments | 3 | 2.465 | 0.137 | 3 | 3.706 | 0.061 |
| Error | 8 | 8 | ||||
1 In case Mauchly’s test indicated that the assumption of sphericity had been violated, the degrees of freedom were corrected using Greenhouse–Geisser estimates of sphericity if epsilon < 0.75 or the Huynh–Feldt correction if epsilon > 0.75.
Table 2.
Summary of repeated ANOVA measures for filterable and total metal concentrations (aluminum, iron, and lanthanum in µg L−1) and sulfur concentrations (mg L−1) with treatments (dredging, LMB addition, and their combination) as the fixed factor. All data were log-transformed prior to analysis to fulfill the variance homogeneity requirements 1. Significant differences (p < 0.05) are indicated in bold.
| Filterable Aluminium (Al) | Total Aluminium | |||||
| Tests of within-subjects effects | ||||||
| Source | df | F | p | df | F | p |
| Time | 2.35 | 8.956 | 0.001 | 8 | 99.516 | <0.001 |
| Time × treatments | 7.05 | 4.674 | 0.003 | 24 | 6.958 | <0.001 |
| Error | 18.8 | 64 | ||||
| Tests of between-subjects effects | ||||||
| Source | df | F | p | df | F | p |
| Treatments | 3 | 3.291 | 0.079 | 3 | 5.914 | 0.020 |
| Error | 8 | 8 | ||||
| Filterable Iron (Fe) | Total Iron | |||||
| Tests of within-subjects effects | ||||||
| Source | df | F | p | df | F | p |
| Time | 2.71 | 3.941 | 0.025 | 6.48 | 62.694 | <0.001 |
| Time × treatments | 8.12 | 3.578 | 0.008 | 19.4 | 5.511 | <0.001 |
| Error | 21.7 | 51.8 | ||||
| Tests of between-subjects effects | ||||||
| Source | df | F | p | df | F | p |
| Treatments | 3 | 1.616 | 0.261 | 3 | 5.367 | 0.026 |
| Error | 8 | 8 | ||||
| Filterable Lanthanum (La) | Total Lanthanum | |||||
| Tests of within-subjects effects | ||||||
| Source | df | F | p | df | F | p |
| Time | 2.08 | 17.203 | <0.001 | 2.53 | 86.011 | <0.001 |
| Time × treatments | 6.23 | 6.129 | 0.001 | 7.60 | 6.703 | <0.001 |
| Error | 16.6 | 20.3 | ||||
| Tests of between-subjects effects | ||||||
| Source | df | F | p | df | F | p |
| Treatments | 3 | 407.8 | <0.001 | 3 | 337.9 | <0.001 |
| Error | 8 | 8 | ||||
| Filterable sulfur (S) | Total sulfur | |||||
| Tests of within-subjects effects | ||||||
| Source | df | F | p | df | F | p |
| Time | 7.06 | 8.492 | <0.001 | 2.70 | 20.148 | <0.001 |
| Time × treatments | 21.2 | 10.044 | <0.001 | 8.11 | 12.463 | <0.001 |
| Error | 56.5 | 21.6 | ||||
| Tests of between-subjects effects | ||||||
| Source | df | F | p | df | F | p |
| Treatments | 3 | 22.358 | <0.001 | 3 | 22.239 | <0.001 |
| Error | 8 | 8 | ||||
1 In case Mauchly’s test indicated that the assumption of sphericity had been violated, the degrees of freedom were corrected using Greenhouse–Geisser estimates of sphericity if epsilon < 0.75 or the Huynh–Feldt correction if epsilon > 0.75.
© 2017 by the authors. Licensee MDPI, Basel, Switzerland. This article is an open access article distributed under the terms and conditions of the Creative Commons Attribution (CC BY) license (http://creativecommons.org/licenses/by/4.0/).
Share and Cite
MDPI and ACS Style
Waajen, M.L.G.; Engels, B.; Oosterhout, F.V. Effects of Dredging and Lanthanum-Modified Clay on Water Quality Variables in an Enclosure Study in a Hypertrophic Pond. Water 2017, 9, 380. https://doi.org/10.3390/w9060380
AMA Style
Waajen MLG, Engels B, Oosterhout FV. Effects of Dredging and Lanthanum-Modified Clay on Water Quality Variables in an Enclosure Study in a Hypertrophic Pond. Water. 2017; 9(6):380. https://doi.org/10.3390/w9060380
Chicago/Turabian StyleWaajen, Miquel Lürling Guido, Bart Engels, and Frank Van Oosterhout. 2017. "Effects of Dredging and Lanthanum-Modified Clay on Water Quality Variables in an Enclosure Study in a Hypertrophic Pond" Water 9, no. 6: 380. https://doi.org/10.3390/w9060380
Note that from the first issue of 2016, this journal uses article numbers instead of page numbers. See further details here.