
Spatiotemporal Distribution of Droughts in the Xijiang River Basin, China and Its Responses to Global Climatic Events


1
Guangzhou Institute of Geochemistry, Chinese Academy of Sciences, Guangzhou 510640, China
2
University of Chinese Academy of Sciences, Beijing 100049, China
*
Author to whom correspondence should be addressed.
Water 2017, 9(4), 265; https://doi.org/10.3390/w9040265
Submission received: 20 December 2016
/
Revised: 30 March 2017
/
Accepted: 7 April 2017
/
Published: 9 April 2017
Abstract
:The Xijiang River is a main branch of the Pearl River, the largest river in South China. Droughts in this area have seriously influenced local water resource utilization, and socio-economic development. The spatiotemporal distribution of droughts and its responses to global climatic events are of critical significance for the assessment and early warning of drought disasters. In this paper, the spatiotemporal patterns of droughts characterized by Rotated Empirical Orthogonal Function/Rotated Principal Components (REOF/RPC) in the Xijiang River Basin, China were evaluated using the Self-calibrated Palmer Drought Severity Index (Sc-PDSI). The drought responses to El Niño/Southern Oscillation (ENSO), Pacific Decadal Oscillation (PDO), India Ocean Dipole (IOD), and North Atlantic Oscillation (NAO) were analysed by Pearson correlation and multiple stepwise regression. The results showed that one year earlier NAO was the dominant factor impacting the droughts in the Xijiang Basin. Its contribution for the RPC2s of the annual, the first and second half years, winter, summer, autumn, and February were −0.556, −0.419, 0.597, −0.447, 0.542, 0.600, and −0.327, respectively. Besides the two adjacent Pacific and India oceans, the droughts seem be influenced by distant Atlantic climatic events. These results offer new reference insights into the early warning of droughts as well as the planning and management of water resources in the study area.
1. Introduction
As a long-term cumulative effect of lower precipitation, drought disasters can occur in most climatic divisions. In China, where water resources are lower per capita and sub-optimally distributed in space and time, the spatiotemporal distribution characteristics of drought should be carefully considered in water resource planning and management. In addition, the problem of drought can occur at the regional or global scale. Being influenced by global climatic events containing ENSO (El Niño/Southern Oscillation) [1,2,3,4,5], PDO (Pacific Decadal Oscillation) [6,7,8,9,10,11], IOD (Indian Ocean Dipole) [12,13,14,15], and NAO (North Atlantic Oscillation) [16,17,18,19,20], drought can be quite complicated. Hence, the research on its spatiotemporal distribution and its responses to global climatic events are of critical significance for the assessment and early warning of drought disasters, as well as rational utilization of regional water resources.
Currently, research on Chinese drought is mainly concentrated in Northern China [21,22,23,24,25], the Northwestern arid region [26,27,28], and the Southwestern region [29,30,31]. Moreover, some attention has been paid to drought problems in Southern China [32,33,34,35], especially in the Xijiang River Basin [36,37]. However, few preliminary studies focused on the relationship between droughts and global climatic events. Since the Xijiang River Basin occupies most of Southern China, droughts in this area have seriously influenced local water resource utilization, and social and economic development. A variety of frequent global climatic events will affect the behaviour of water resources management in the Xijiang River Basin.
In this paper, meteorological data from 32 national meteorological stations in the Xijiang River Basin from December 1960 to November 2015 and local soil data were used to calculate the Sc-PDSI (Self-calibrated Palmer Drought Severity Index). EOF (Empirical Orthogonal Function) and REOF (Rotated Empirical Orthogonal Function) were then used to decompose the Sc-PDSI variable field that represented the dry/wet condition. Based on the proposed method, the drought spatiotemporal distribution feature and evolution trend at the annual, semi-annual, seasonal, and representative month’s scales in the past 55 years were acquired. In addition, via the methods of teleconnection analysis, the droughts’ response to four global climatic events (ENSO, PDO, IOD, and NAO) was obtained. This paper provides a theoretical basis for understanding, evaluating, and predicting the occurrence and cause of droughts in the Xijiang River Basin, which then offers novel and useful insights for the planning and management of local water resources and agricultural production.
2. Study Area, Data, and Methods
2.1. Study Area
Xijiang River is a main branch of the Pearl River, the largest river in South China. Its basin (Figure 1) (21°31′14″–27°00′40″N, 102°14′27″–112°47′48″E) at 3.6×10⁵ km2, accounting for about 79.4% of the Pearl River Basin, is located in the Yunnan, Guizhou, Guangxi, and Guangdong Provinces in China and the small north-eastern part of Vietnam. For simplicity, based on the borders of the sub-basins, the Xijiang River Basin is divided into four zones: Panjiang (I), Guibei (II), Guizhong (III), and Yuegui (IV) (Figure 1), which are located in the western, central, southern, and eastern basin, respectively. The topography is higher in the northwest and lower in the southeast. The elevation is from 3792 m in the Yunnan-Guizhou Plateau and affiliated slope areas to 0 m, in the low mountains and hilly basins in the lower area. The study area belongs to a subtropical monsoon region. The two main soil types in this area are Red earths and Latosols red earths of Ferralosols. The annual average precipitation is approximately 1370 mm across the basin, and the annual average temperature is 14–22 °C. Since the spatiotemporal distributions of precipitation and temperature are unbalanced, droughts can occur easily in the Xijiang River Basin.
2.2. Data
In this study, the calculation of the Sc-PDSI was based on precipitation and temperature data which were derived from the following website of China Meteorological Administration [38]. The data were acquired from 32 meteorological stations in the Xijiang River Basin (Figure 1), during the time period from December 1960 to November 2015. The latitude and longitude coordinates of the sites were also provided by the website. In the absence of meteorological data in some months that account for about 0.2% of the total data, mean values from the data acquired with the same stations in the same months were utilized. The available water capacity (AWC) of the soil was also needed for the calculation of the Sc-PDSI. These soil data were obtained from Harmonized World Soil Database [39].
There are four climatic/meteorological observational networks with varied station densities in China. They are the Global Climate Observation System (GCOS) Surface Network (GSN), the national Reference Climate Network (RCN), the national Basic Meteorological Network (BMN), and the national Ordinary Meteorological Network (OMN) [40]. Usually, RCN and BMN are merged to a network R&B (RCN and BMN) that has been widely adopted in some studies. For example, Li et al. [41] calculated the four precipitation-based drought indices in Xinjiang, China (data density: 1 station for 3.03 × 10⁴ km2). Xiao et al. [42] investigated teleconnections between globe climatic events and seasonal precipitation regimes over the Yangtze River Basin (data density: 1 station for 1.33 × 10⁴ km2). The data density was 1 station for 1.01×10⁴ km2 when Kong et al. [43] studied the prolonged dry episodes over Northeast China. Compared to that, the data density is similar in that there is 1 station for 1.13×10⁴ km2 in this paper.
ENSO refers to two opposite events regarding sea surface temperature (SST) in the central and eastern equatorial Pacific. The warm event is El Niño (positive phase) and the cold event is La Niña (negative phase), respectively. The ENSO index data were provided by National Climate Centre, China Meteorological Administration [44]. The judgment criterion [45] is the sea surface temperature anomalies (SSTAs) index for the NINO Z zone (160°E–90°W, 5°N–5°S and 90°W–80°W, 0°–10°S) (i.e., NINO 1 + 2 + 3 + 4 zones).
PDO is a decadal climatic variable signal in the central and eastern parts of the North Pacific to the south of Alaska. If the PDO phase is positive, positive SSTAs occur in the Central and Eastern equatorial Pacific and the west coast of North America, while negative SSTAs occur in the central North Pacific. Conversely, it is the PDO negative phase. The PDO index data in this study were provided by University of Washington [46]. Herein, the PDO is defined as the leading EOF of the mean November through March SST anomalies for the Pacific Ocean to the north of the 20°N latitude [47].
IOD [48,49] are instances of SST anomalies in the Indian Ocean. In the IOD positive phase, the distribution of abnormal cases are positive SST in the Western and negative SST in the Eastern Indian Ocean. Conversely, it is the IOD negative phase. The IOD index data were provided by National Climate Centre, China Meteorological Administration [50]. Herein, the IOD is defined as SSTAs for the Western (50°E–70°E, 10°S–10°N) and South-eastern (90°E–110°E, 10°S–0°) tropical Indian Ocean.
NAO is a continuous reversed-phase vibration from sea level pressure in the North Atlantic, mainly associated with the Icelandic Low and Azores High. In the NAO positive phase, both Icelandic Low and Azores High are unusually strong, while in the NAO negative phase, both are weaker [51]. Details regarding the NAO index, including definitions and methods, are available at the website of National Climate Centre, China Meteorological Administration [52].
2.3. Methods
2.3.1. Sc-PDSI
The Palmer Drought Severity Index (PDSI) [53] is proposed based on the soil water balance theory. As it comprehensively considers a variety of factors, such as precipitation, evaporation, runoff, soil moisture, etc., it is a competitive index in measuring the zonal dry/wet condition. In addition, the PDSI is normalized and dimensionless, and thus it can be compared at different spatiotemporal scales. However, the normalization process of the original PDSI was based on a limited range of data acquired from the Central United States. To better adapt the index to the study area, Wells et al. [54] proposed the Sc-PDSI, which closely fits the local actual condition. Additional details, including the calculation steps of the PDSI and Sc-PDSI, can be found in the Chinese National Climate Center [55]. The classifications (Table 1) show that Sc-PDSI ≤ −1.0 indicates drought, while Sc-PDSI ≥ 1.0 indicates wetness.
2.3.2. EOF and REOF
The Empirical Orthogonal Function (EOF) was proposed by Pearson [56], and was then introduced to climate research by Lorenz [57]. Its goal is to decompose a variable field X with spatiotemporal information into spatial eigenvectors (denoted by EOFs in this paper) and associated principal components (PCs) (i.e., time coefficients) (Equation (1)). In addition, the EOF extracts the main information from X on the lower eigenvectors to facilitate analysis and processing. The concentrate ratios are presented by the variance contribution (R) and cumulative contribution (S) of the eigenvectors, respectively. Xm×n, Rk, and Sk are obtained as follows:
where Rk is the variance contribution of the kth eigenvector; Sk is the cumulative contribution of the top k eigenvectors; and λk and λi are the eigenvalues corresponding to the kth and ith eigenvectors, respectively.
The top EOFs present the spatial pattern of the variable field X in the whole study area to a large extent. Meanwhile, the corresponding PCs constitute the temporal pattern derived from X in the same area. However, the spatial orthogonality and temporal uncorrelation of EOFs and PCs, respectively, impose limits on the physical interpretability of EOF patterns. This is because physical processes are not independent, and therefore physical modes are expected, in general, to be non-orthogonal [58]. Rotated EOF (REOF) overcomes these limitations, as it performs further rotation on the basis of EOF. This further rotation can make the patterns more obvious. The spatial patterns derived from REOF are loading vectors. The rotation in REOF is categorized into two families: (1) oblique; and (2) orthogonal. Orthogonal rotation is more computationally efficient than oblique rotation, due to matrix inversion in the latter [58]. In this paper, the VARIMAX (Variance with the Maximum loading) criterion in the orthogonal family has been used. Detailed information about EOF and REOF can be found in Wei [59] and Huang [60].
The high loadings derived from the VARIMAX rotation only exist in a certain region while the other regions are close to zero. As a result, the loading vectors can better present the spatial anomaly characteristics of dry/wet changes [61]. In this paper, REOFs and RPCs (Rotated Principal Components) denote spatial and temporal patterns derived from REOF, respectively.
2.3.3. Response of Droughts to Global Climatic Events
The teleconnections between the four global climatic events shown in Section 2.2 and droughts in the Xijiang River Basin were analysed using the Pearson correlation coefficients between the climate indices and the RPCs. The calculated correlations were tested for statistical validity at the 95% significance level.
Multiple stepwise regressions [62,63,64,65] were used in the research on the contributions of the climatic indices to the droughts in the Xijiang River Basin. The method introduces the indices to the regression equations one by one according to the importance of the independent variables. Some previous variables will be eliminated from the equation if they are no longer important because new variables are introduced. Therefore, the regression equations include only the most important variables. The droughts in the Xijiang River Basin are influenced by various global climatic events. The relationship can be expressed by Equation (4):
where regression coefficients α, β, ⋯, γ denote the contributions of the important climatic indices, respectively. The influences derived by the units of independent and dependent variables have been eliminated. Thus, they are converted into standardized coefficients, which can be used to compare relative contributions among the independent variables. The correlations and the multiple stepwise regression were conducted in SPSS software (R23, IBM, Endicott, NY, USA).
3. Results and Analysis
3.1. Time Scales Analysis
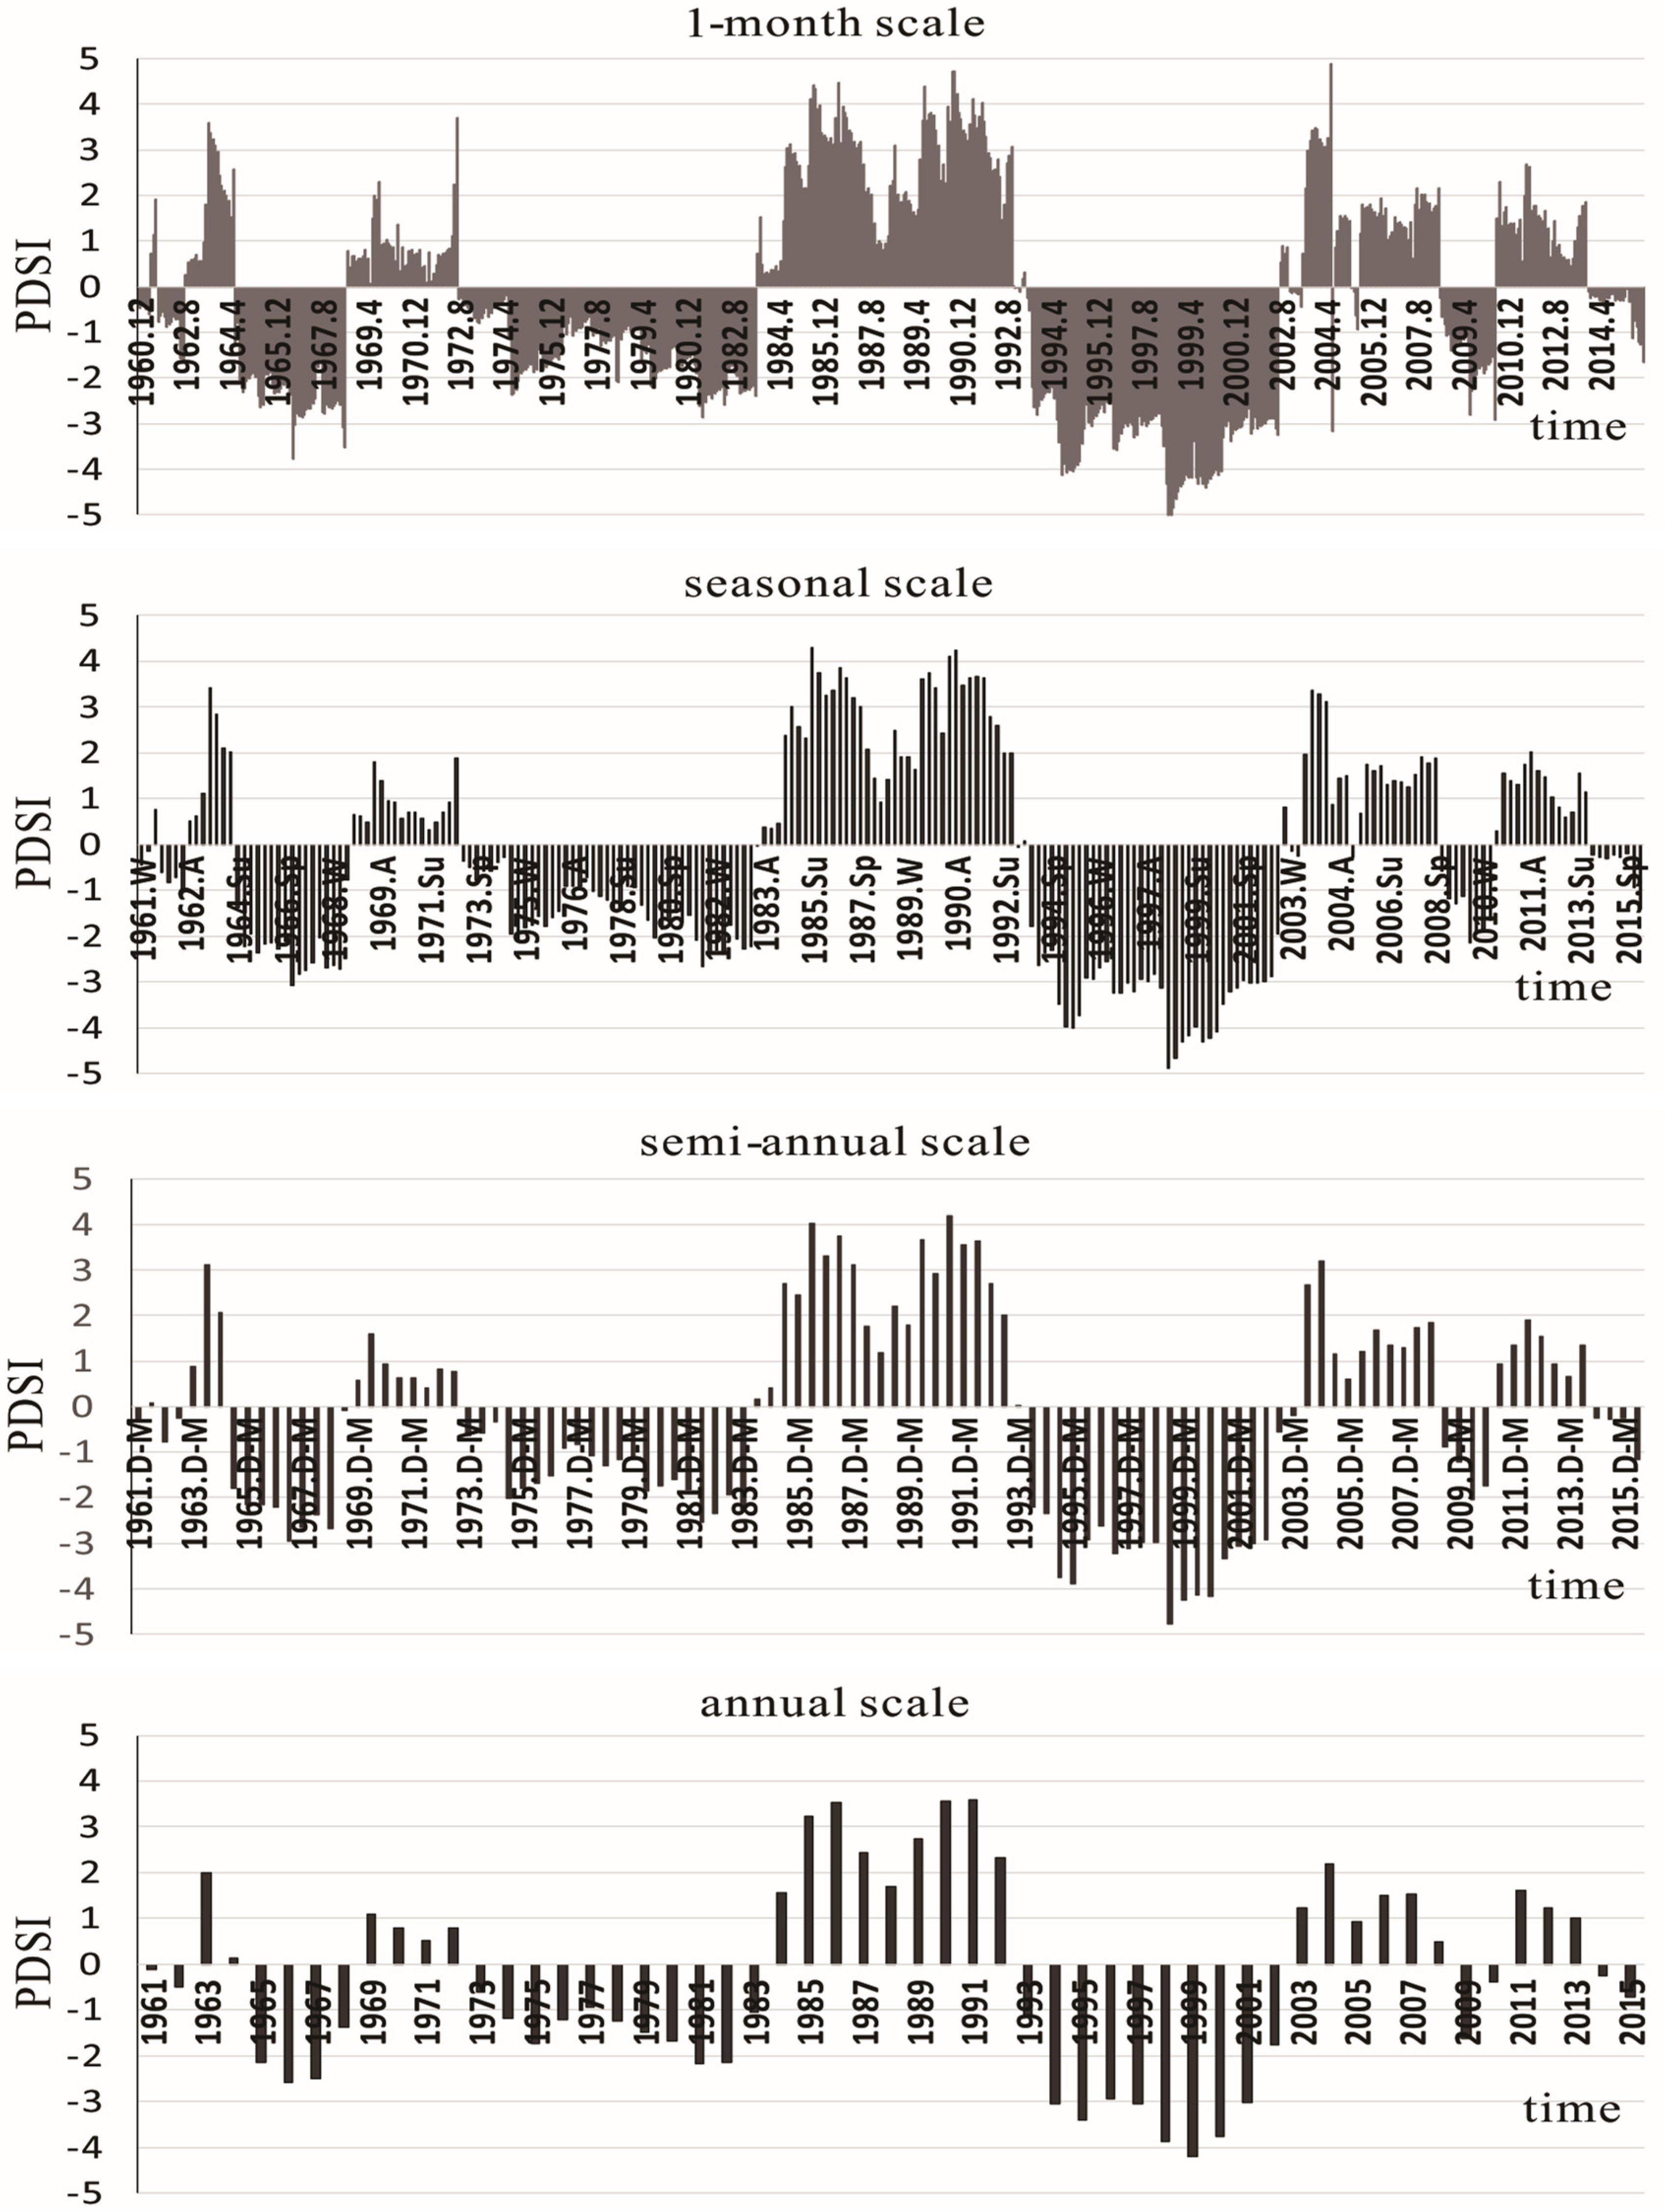
Scale is a basic sciencific problem in geoscience which was studied by Robinson [66] and Mccarty et al. [67] in earlier years. The surface of the Earth is a complex giant system. The principles or laws that are obtained at a certain scale may be effective, similar, or need to be revised at other scales, which isgenerally called scale dependency.Taking Duan Station (the red circle in Figure 1) as an example, Figure 2 shows the changes of the PDSI at different time scales from December 1960 to November 2015. At all four scales, drought events were recognized in the years 1962, 1964–1968, 1974–1983, 1993–2002, 2008–2010, and 2015. These episodes are clearly identified at the month scaleto annual ones (1–12 months). This example shows the shorter time scales, the higher frequency of drought, and the longer duration. In contrast, at the longer time scales, the droughts are shownin coarser resolution, lower frequency, and longer duration.However, the drought patterns are very similar at the different time scales. Considering the time and computing efficiency for resolving the spatiotemporal patterns and its relationships with global climate events, this paper adopted four time scales of annual, semi-annual, seasonal, and representive months (February, May, August, and November) for drought calculationsand characterization.
3.2. The Selection of EOF Modes for REOF
The top EOFs concentrated the information about the dry/wet distributions. The variance and cumulative variance distributions of the top 10 EOFs of the annual(ANN), semi-annual, seasonal and several representative months’ PDSI fields in the Xijiang River Basin, including the first half year (D–M: from December to next May), second half year (J–N: from June to November), winter (DJF: from December to next February), spring (MAM: from March to May), summer (JJA: from June to August), Autumn (SON: from September to November), and four typical months in each season (February, May, August, and November) are shown in Figure 3. It can be seen that the cumulative variance distributions of the top 10 EOFs from the annual to seasonal scales are 86.0%, 82.9%, 84.0%, 82.6%, 82.7%, 83.2%, 82.8%, 82.29%, 81.23%, 83.20%, and 82.25%, respectively. Values greater than 80% mean that the top 10 EOFs can present more than 80% of the dry/wet information at the corresponding time scales. In order to more accurately characterize the dry/wet distributions in the Xijiang River Basin, they were selected for further VARIMAX rotations in this study.
One critical question for the method of processing different series of PDSI by principal components into a series of eigenvectors is whether it can maintain the properties of the drought. For illustrating this process, we give a detailed description by integrating the method and the results. Firstly, we constructed an original PDSI field that represented the dry-wet conditions in the study area, where the direction of the column in the matrix represents the spatial dry-wet changes while that of the row represents temporal changes. The PDSI field was decomposed into spatial patterns (denoted by REOFs) and associated temporal patterns (denoted by RPCs), because drought or wetness is an extreme event in the dry-wet condition, and the extreme points of the RPC curves are generally considered when drought or wetness occurred in corresponding years. Table 1 indicates the PDSI is negative when drought occurs. Based on the associated spatial pattern (Figure 4a), we deduce that droughts occurred in the Eastern Basin with high positive values in the years (1995 and 1997) with a high negative value (Figure 5). Similarly, we deduce that droughts occurred in the Western and Southern Basin with high negative values (Figure 4a) in the years (1963, 1985–1986, and 1991) with high positive values (Figure 5). Then, the correlation analyses were conducted between the results and climatic indices to determine the connections between the climatic events and the droughts that occurred in the study areas in specific time ranges. The results show that the proposed method can reflect the properties of drought especially in spatiotemporal ranges, which were also used in the arid region of China by Wang et al. [68].
3.3. Spatiotemporal Patterns and Drought Evolutions by REOF
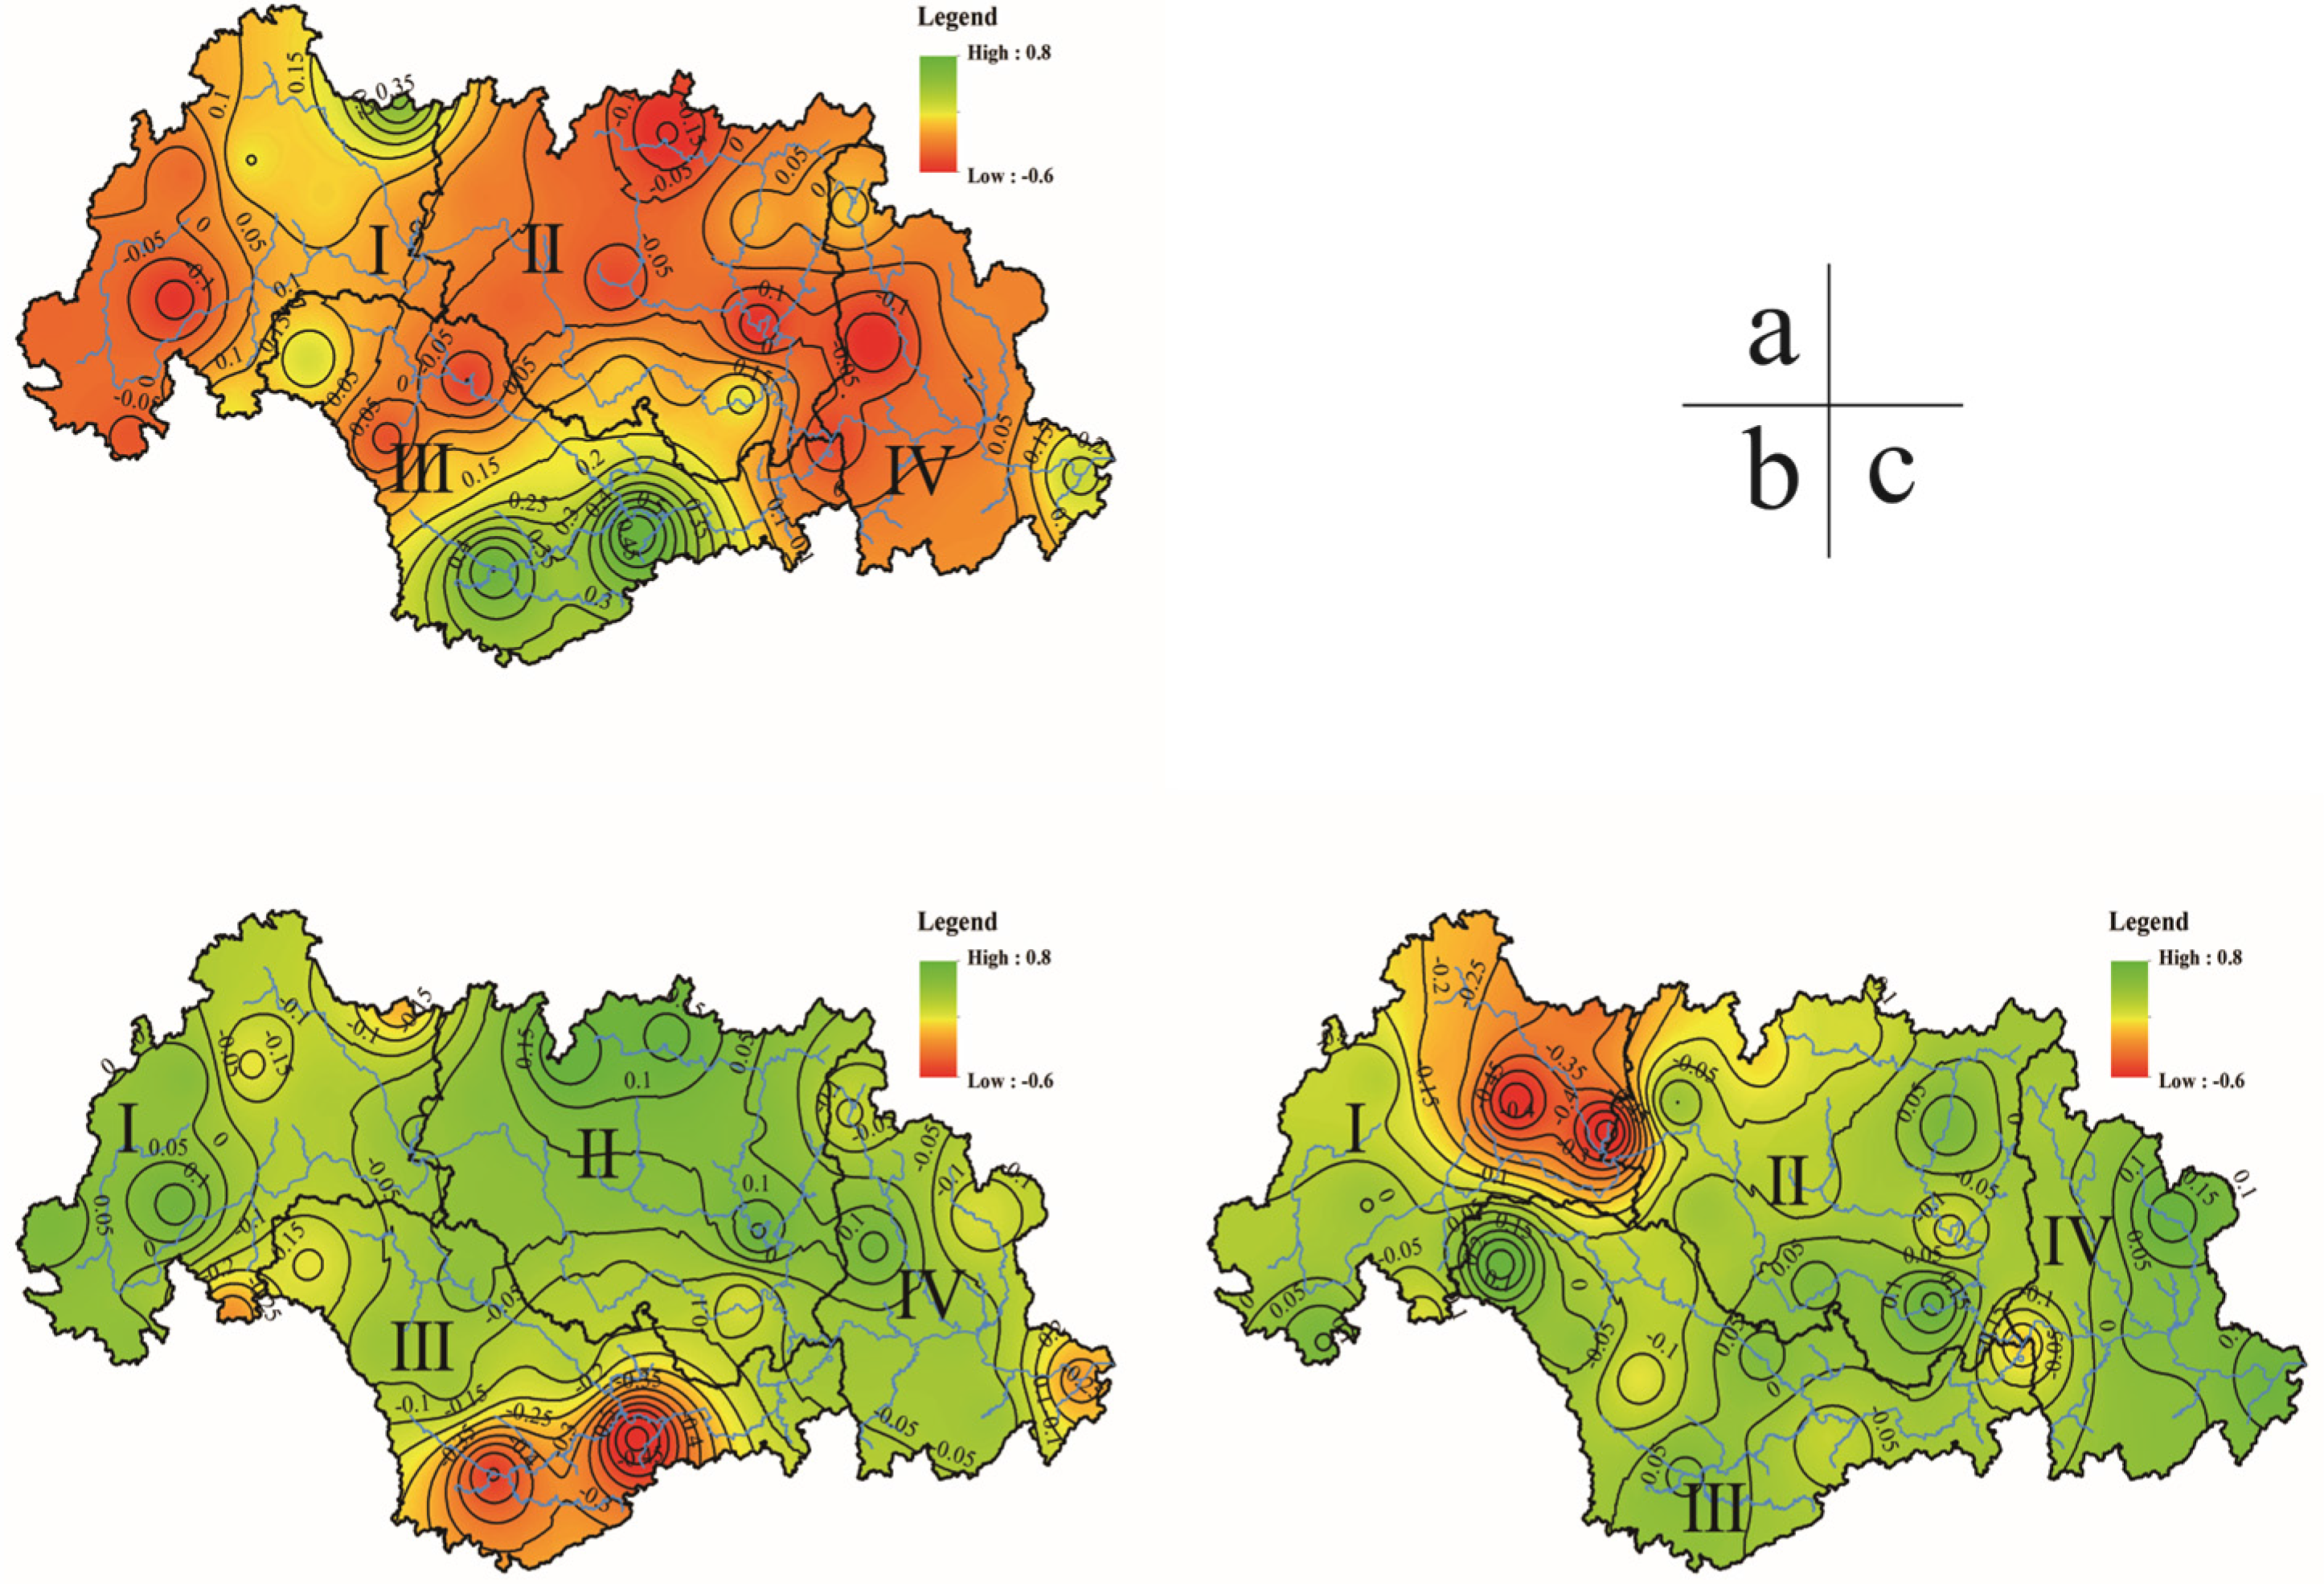
For annual PDSI, the Eastern Basin had high positive values in the REOF1 (Figure 4a) field (spatial pattern of component 1), while the Western and Southern Basin had high negative values. The peaks of the curve of RPC1 (temporal pattern of component 1) show that droughts occurred in the Western and Southern Basins in 1963, 1985–1986, and 1991. The valleys show that droughts occurred in the Eastern Basin in 1995 and 1997. Moreover, according to the RPC1 trend line (Figure 5), the drought intensity in the above areas exhibited a slight uptrend in the past 55 years. Southern Guizhong had high positive values in the REOF2 (Figure 4b) field (spatial pattern of component 2); Guibei, Yuegui, and Southern Panjiang had high negative values. The peaks of the curve of RPC2 (temporal pattern of component 2) show that droughts occurred in Guibei, Yuegui, and Southern Panjiang in 1963, 1990, 2007, and 2011. The valleys show that droughts occurred in Southern Guizhong in 1974, 1979, and 1987. Moreover, according to the RPC2 trend line (Figure 5), it can be seen that the drought intensity in the above areas exhibited a strong downtrend trend in the past 55 years.
Generally speaking, the ANN REOF1 (Annual REOF1) (Figure 4a) mainly shows the negative and positive difference corresponding to the Western and Eastern Basins. That is subject to the differences of the relevant underlying surface, topography, atmospheric circulation, and so on. According to the anti-phase distributions of ANN REOF1 and combined with the curve of ANN RPC1 (Figure 5), the annual drought in the Western Basin was dominated by a wet trend (1963–1982 and 1991–1995) and dry trend (1961–1962, 1983–1990, and 1996–2015). Conversely, the annual drought in the Eastern Basin had different periods dominated by a dry trend (1963–1982 and 1991–1995) and wet trend (1961–1962, 1983–1990, and 1996–2015).
Meanwhile, the ANN REOF2 (Figure 4b) represents anti-phase distributions corresponding to the Northern and Southern Basins. Therein, the Northern part is bigger than the Southern one. The annual drought in the Northern Basin had two periods which was dominated by a wet trend (1963–1987 and 1990–1995) and dry trend (1961–1962, 1988–1989, and 1996–2015). In the Southern Basin, the periods were dominated by a dry trend (1963–1987 and 1990–1995) and wet trend (1961–1962, 1988–1989, and 1996–2015).
The correlation coefficients (Figure 6) indicate that the spatiotemporal distributions of some semi-annual, seasonal, and representative month’s REOFs/RPCs had similar patterns to the corresponding annual REOF/RPC, such as the MAM (March, April, May) REOF1/RPC1, JJA REOF1/PRC1, D–M REOF2/RPC2, DJF REOF2/RPC2, and Feb REOF2/RPC2. The coefficient between JJA and ANN REOF1/RPC1 was as high as 0.98/0.96, while the other three coefficients were both greater than 0.8. In addition, the directions of their drought evolution were consistent. Meanwhile, J–N, JJA, and SON REOF2/PRC2 had strong correlations with ANN REOF2/PRC2. Specifically, the corresponding coefficients were −0.98/−0.93, −0.86/−0.90, and −0.96/−0.89, respectively, which indicated that the three spatiotemporal distributions had patterns that were opposed to the corresponding ANN REOF/RPC. The directions of drought evolution were also opposed.
3.4. Responses of Droughts to Global Climatic Change Events
3.4.1. Teleconnection
Pearson correlation coefficients were used to determine the teleconnection between RPCs and climate indices in this study. Considering that lag times may exist between the Xijiang River Basin droughts and global climatic events, the correlation coefficients between eight climatic indices, including 1- or 0-year ahead and the top five RPCs, were calculated together.
Table 2 summarizes the Pearson correlation coefficient between RPCs and climate indices at different scales.
It can be seen from Table 2 that for annual droughts, the droughts in the Xijiang River Basin were influenced significantly by NAO one year earlier, and PDO and NAO in the same year. Herein, RPC2 was negatively correlated with the above three climatic indices. This denotes that the negative mode of the above three climatic indices tend to decrease drought intensity on an annual scale in the Southern Panjiang, Eastern, and Southern Basin (Figure 4b).
For first half year, the droughts in the Basin were influenced significantly by three global climatic events which are the same as the annual scale. Because D–M REOF2/RPC2 had strong correlations with ANN REOF2/RPC2, the above three climatic indices tend to decrease drought intensity in the same area (Figure 7a) as the annual scale.
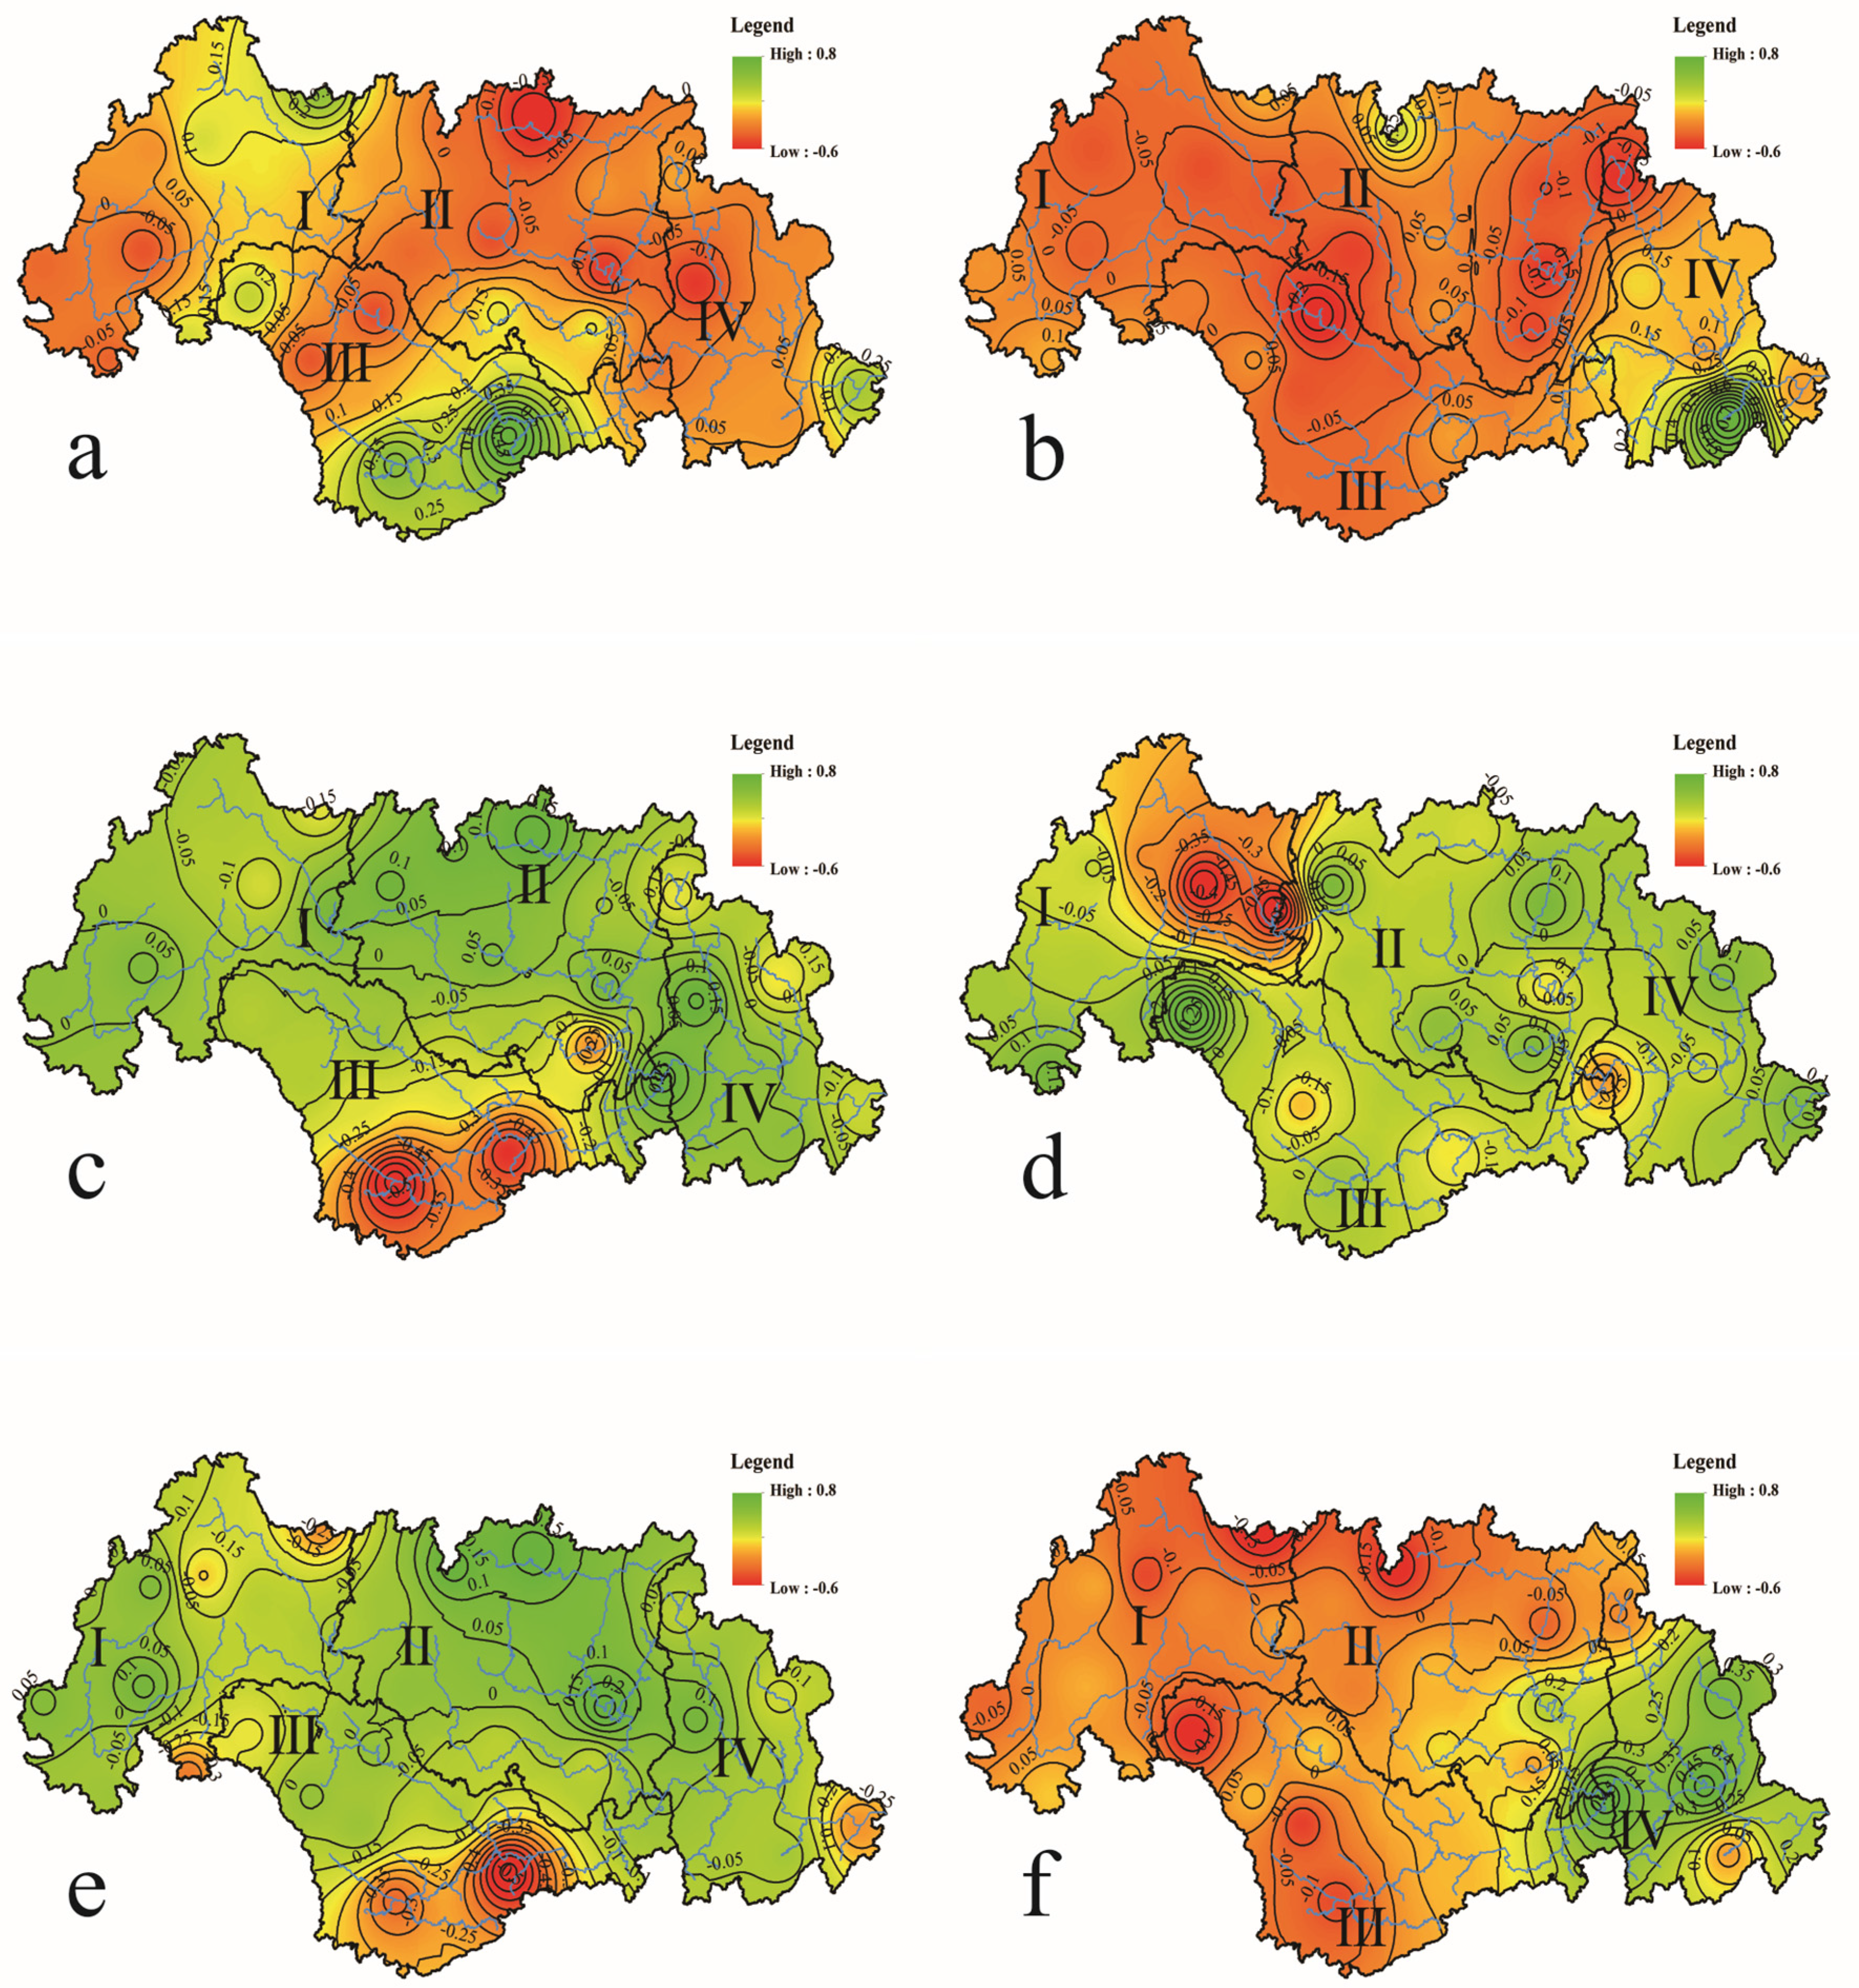
For second half year, the droughts were influenced significantly by PDO and NAO one year earlier and in the same year (Table 2). Herein, RPC2 was positively correlated with PDO in the same year, and NAO one year earlier and in the same year. Combined with Figure 6b,d, it can be known that the above events influenced the same areas within the first half year, but the trend was opposite (Figure 7b). In addition, RPC3 was positively correlated with PDO one year earlier and at the same time. This denotes that the positive mode of PDO one year earlier and in the same year tend to decrease drought intensity in second half year in the Northwestern Basin, Yuegui, and Eastern Guibei (Figure 7c).
For winter, the droughts were influenced significantly by NAO one year earlier and in the same year (Table 2). Herein, RPC2 was negatively correlated with NAO one year earlier and in the same year. This denotes that the negative modes of NAO one year earlier and in the same year tend to decrease drought intensity in winter in Southern Panjiang, Eastern, and Southern Basins (Figure 8a).
For spring, the droughts were influenced significantly by IOD in the same year (Table 2). Herein, RPC5 was positively correlated with IOD in the same year. This denotes that the positive mode of IOD in the same year tends to decrease the drought intensity in spring in the Central and Southeastern Basins (Figure 8b).
For summer, the droughts were influenced significantly by PDO and NAO one year earlier and in the same year (Table 2). Herein, RPC2 was positively correlated with NAO one year earlier and in the same year. This denotes that the positive mode of NAO one year earlier and in the same year tend to decrease the drought intensity in summer in Southern Panjiang, Eastern, and Southern Basins (Figure 8c). In addition, RPC3 was positively correlated with PDO one year earlier and at the same time. This denotes that the positive mode of PDO one year earlier and in the same year tend to decrease the drought intensity in summer in the Northwestern Basin, Yuegui, and Eastern Guibei (Figure 8d).
For autumn, the droughts were influenced significantly by PDO in the same year, NAO one year earlier and in the same year, and IOD in the same year (Table 2). Herein, RPC2 was positively correlated with three climatic indices, including PDO_0, NAO_0, and NAO_1. This denotes that the positive modes of PDO in the same year, and NAO one year earlier and in the same year tend to decrease drought intensity in autumn in Southern Panjiang, Eastern, and Southern Basins (Figure 8e). In addition, RPC4 was only negatively correlated with IOD in the same year. This denotes that the negative mode of IOD in the same year tends to decrease the drought intensity in autumn in Yuegui, Western Guizhong, and Northern Basins (Figure 8f).
For February, the droughts were influenced significantly by NAO one year earlier and in the same year (Table 2). Herein, RPC2 was negatively correlated to NAO one year earlier and in the same year. Figure 6 shows the two NAO events tend to influence the spatiotemporal pattern (Figure 9a) which is similar to ANN, D–M, or DJF REOF2/RPC2.
For May, the droughts were influenced significantly by NAO in the same year (Table 2). Herein, RPC3 was negatively correlated to NAO in the same year. This denotes that the negative mode of NAO in the same year tends to decrease the drought intensity in May in Western Panjiang and the Central Basin (Figure 9b).
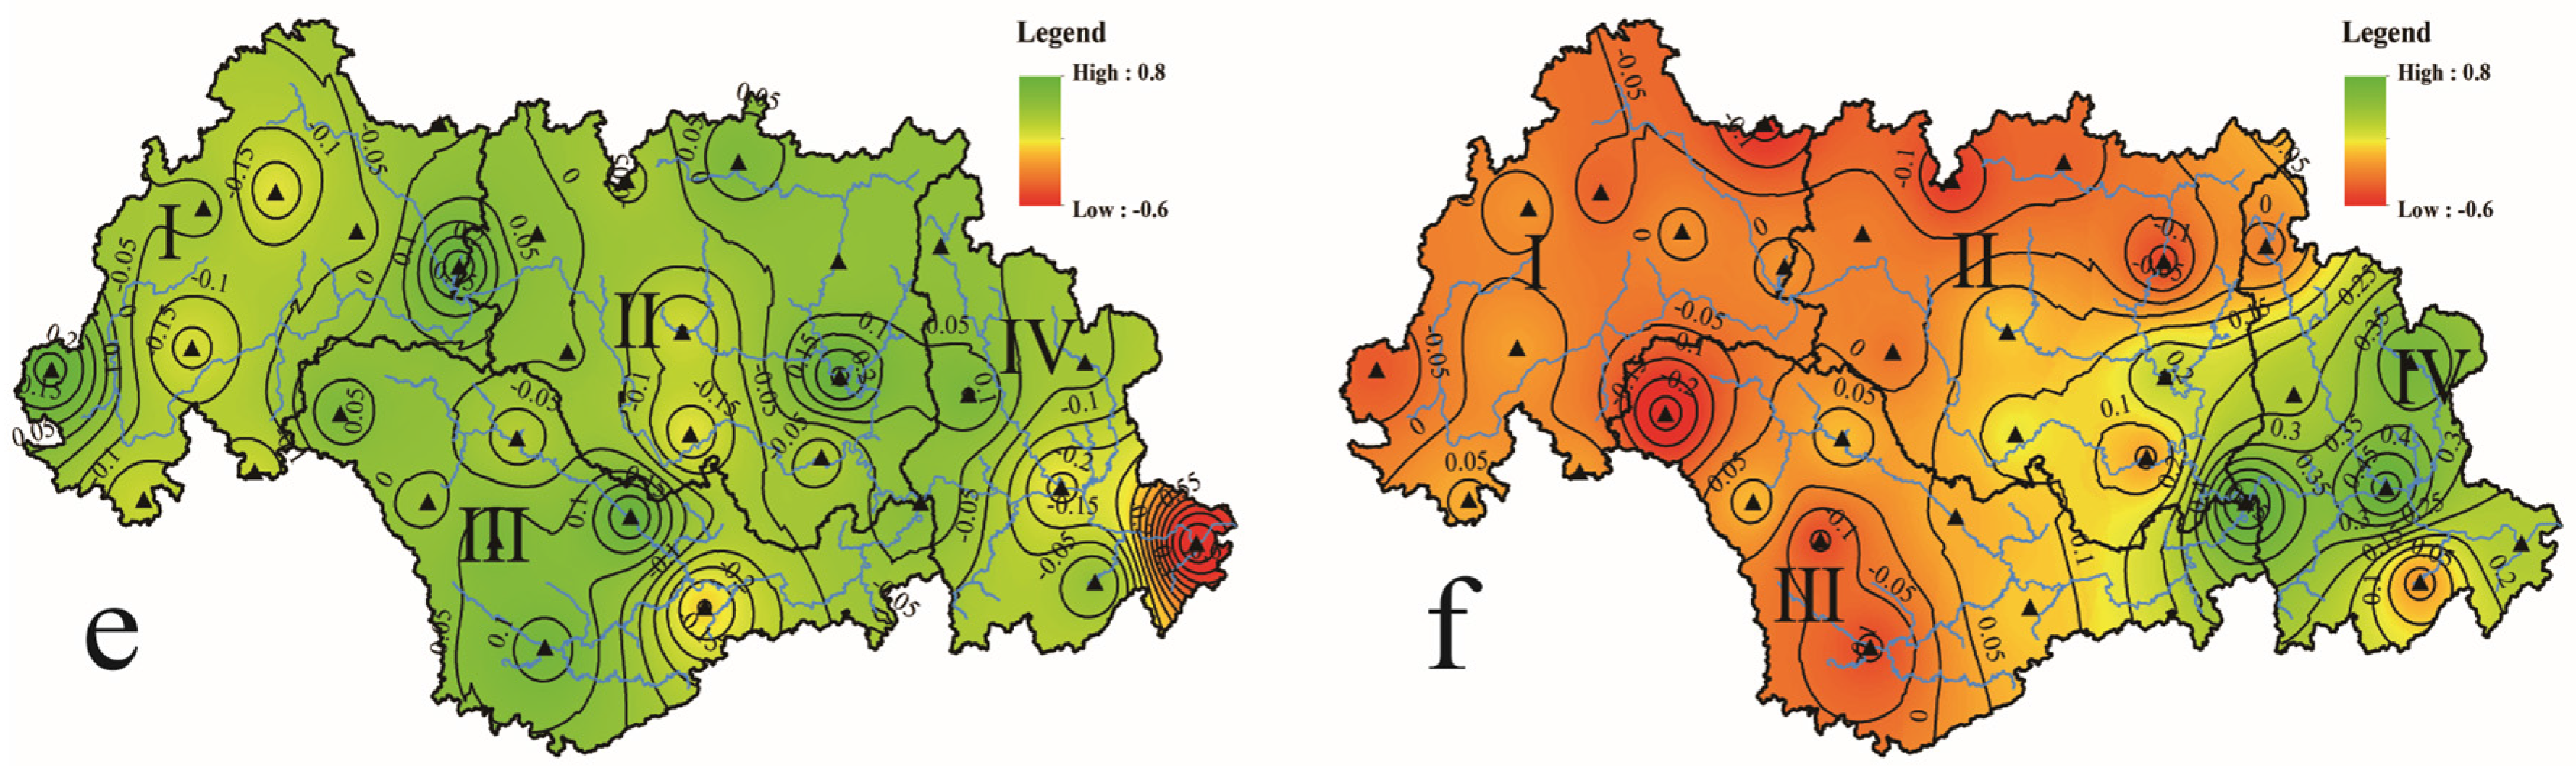
For August, the droughts were influenced significantly by NAO one year earlier and in the same year (Table 2). Herein, RPC2 was negatively correlated to NAO in the same year. This denotes that the negative mode of NAO in the same year tends to decrease the drought intensity in August in Southern Panjiang and the Central Basin (Figure 9c). RPC3 was negatively correlated to NAO one year earlier and in the same year. This denotes that the negative mode of NAO one year earlier and in the same year tends to decrease the drought intensity in August in Northern Guibei and Southern Guizhong (Figure 9d). In addition, RPC4 was positively correlated to NAO one year earlier and in the same year. This denotes that the positive modes of NAO one year earlier and in the same year tend to decrease the drought intensity in August in the Central and Eastern Basins (Figure 9e).
For November, the droughts were only influenced significantly by IOD in the same year (Table 2). Herein, RPC5 was only negatively correlated to IOD in the same year. This denotes that the negative mode of IOD in the same year tends to decrease drought intensity in November in Guizhong and the Eastern Basin (Figure 9f).
3.4.2. Contribution
The above eight global climatic indices were selected as independent variables and RPCs as dependent variables. The results of multiple stepwise regression are shown in Table 3. It can be seen that NAO one year earlier is the dominant mode that drives drought occurrence and evolution with various time scales in the Xijiang River Basin. For example, its contributions are as high as about 0.6 for J–N RPC2 (corresponding spatial pattern in Figure 7b) and SON RPC2 (corresponding spatial pattern in Figure 8e). There is also a negative contribution for ANN RPC2 (corresponding spatial pattern in Figure 4b), but the value is as high as −0.556. Meanwhile, D–M RPC2 (corresponding spatial pattern in Figure 7a), DJF RPC2 (corresponding spatial pattern in Figure 8a), JJA RPC2 (corresponding spatial pattern in Figure 8c), Feb RPC2 (corresponding spatial pattern in Figure 9a), Aug RPC3 (corresponding spatial pattern in Figure 9d), and Aug RPC4 (corresponding spatial pattern in Figure 9e) were influenced by NAO one year earlier, and the contribution was −0.419, −0.447, 0.542, −0.327, −0.43, and 0.385, respectively. It should be pointed out that the results of the seasonal scale and the representative month’s scale for the four seasons are different for spring, summer, and autumn, which implies that the analysis in these seasons show the influences from the time scale. However, the result of winter is identical for the two analysis methods, which implies that the analysis of winter shows little influence from the time scales.
The other two events, IOD and PDO in the same year, could influence some regions in the Basin. The IOD in the same year had contributions to MAM PRC5 (corresponding spatial pattern in Figure 8b), SON RPC4 (corresponding spatial pattern in Figure 8f), and Nov RPC5 (corresponding spatial pattern in Figure 9f), and the values were 0.312, −0.289, and −0.336, respectively. In addition, the PDO in the same year influenced J–N RPC3 (corresponding spatial pattern in Figure 7c) with a contribution of 0.356 and JJA RPC3 (corresponding spatial pattern in Figure 8d) with a contribution of 0.388.
4. Discussion and Conclusions
The main purpose of this paper is to elucidate drought spatiotemporal distributions in the Xijiang River Basin and their responses to global climatic events. Based on the methods of EOF and REOF, the Sc-PDSI variable fields at the annual, semi-annual, seasonal, and representative months’ scales were decomposed into spatial and the associated temporal patterns. On this basis, the teleconnections between four global climatic events ENSO, PDO, IOD, and NAO and the droughts were analysed. Meanwhile, the contributions of ENSO, PDO, IOD, and NAO were calculated, respectively, in order to discern the dominant climatic driving factors. According to the results and analysis in Section 3, it was found that:
- The cumulative variance distributions of the top 10 EOFs of the annual, semi-annual, seasonal, and representative months’ Sc-PDSI variable field in the Xijiang River Basin from December 1960 to November 2015 were all greater than 80%. This indicates that they could be used for REOF’s VARIMAX rotation and could derive more accurate dry/wet conditions.
- At an annual scale, the drought intensity in the Eastern, Western, and Southern Basins exhibited a slight uptrend trend in the past 55 years. Guibei, Yuegui, Southern Guizhong, and Panjiang showed a strong downtrend trend in the past 55 years, which were significantly influenced by the three climatic events, NAO one year earlier, and PDO and NAO in the same year. Herein, the contribution of NAO one year earlier was −0.556.
- The evolution of drought intensity of the first and second half year is similar to that of the annual scale. They were both significantly influenced by NAO one year earlier, but the contributions were−0.419 and 0.597, respectively. Moreover, the droughts in the Northwestern Basin, Yuegui, and Eastern Guibei in the second half year were significantly influenced by PDO in the same year, and its contribution was 0.356.
- The winter drought intensity in Southern Panjiang, and the Eastern and Southern Basins exhibited a downtrend trend in the past 55 years, which were significantly influenced by NAO one year earlier, and the contribution was −0.447.
- The spring drought intensity in the Central and Southeastern Basins were significantly influenced by IOD in the same year, and the contribution was 0.312.
- The summer drought intensity in the Western and Eastern Basins exhibited a slight uptrend trend in the past 55 years. Southern Panjiang, and the Eastern and Southern Basins showed an uptrend trend in the past 55 years, which were significantly influenced by NAO one year earlier, and the contribution was 0.542. The Northwestern Basin, Yuegui, and Eastern Guibei were significantly influenced by PDO in the same year, and the contribution was 0.388.
- The autumn drought intensity in Southern Panjiang, and the Eastern and Southern Basins showed a downtrend trend in the past 55 years, which were significantly influenced by NAO one year earlier, and the contribution was 0.6. The drought in Yuegui, Western Guizhong, and the Northern Basin was significantly influenced by IOD in the same year, and the contribution was −0.289.
- At the representative month’s scale, NAO one year earlier influenced the droughts in Southern Panjiang, and the Eastern and Southern Basins in February (contribution: −0.327), and Northern Guibei, and Southern Guizhong (contribution: −0.43) and the Central and Eastern Basins (contribution: 0.385) in August. NAO in the same year influenced the droughts in Western Panjiang and the Central Basin in May (contribution: −0.336), as well as the Southern Panjiang and the Central Basin in August (contribution: −0.302). IOD in the same year influenced the droughts in November in Guizhong and the Eastern Basin in November, and its contribution was −0.336.
- The correlations and multiple stepwise regressions between RPCs and the climatic indices shown here were not simple teleconnections between droughts in the Xijiang River Basin and global climatic events. Generally, NAO one year earlier was the dominant factor. Others, such as IOD and PDO, at the same time influenced some droughts in some regions.
- Generally, station numbers were not sufficient for the study area. However, this problem could not be solved in recent times. In future studies, various methods of data interpolation, such as spatial interpolation, temporal interpolation, and similarity interpolation should be used for constructing the integrity and correctness of the meteorological data.
- The occurrence of droughts is somewhat unique, due to the rich source of water vapor from the oceans near the Basin. In addition, the distribution of droughts in the study area exhibited obvious spatiotemporal differences. In future research, it will also be essential to investigate the influence of local weather, climate, and landforms, such as Karst or hills, on drought occurrence and evolution from a smaller regional scale.
- The relationship between droughts in the Xijiang River Basin and global climatic events is very complex. Due to the close distance between the Basin and the Pacific and the Indian Ocean, the droughts are easily influenced by the climatic events of the two oceans. However, the results in this paper have demonstrated that the influences of distant Atlantic climatic events must be considered. However, since the precise physical mechanisms are not yet thoroughly elucidated, this can constitute a major topic of future work.
Acknowledgments
The China National Key Technology R&D Program (2012BAH32B03), NSFC (41401485) and the China National 863 Program (2006AA06A306) are acknowledged for financial supports. Jake Carpenter of Beverly Hills English is thanked for the comments and corrections. This is contribution No. IS-2374 from GIGCAS.
Author Contributions
J. Qiu and Y. Wang conceived and designed the experiments; J. Qiu performed the experiments; J. Qiu and Y. Wang analysed the data; J. Qiu and J. Xiao wrote the paper and Y. Wang finalized it.
Conflicts of Interest
The authors declare no conflict of interest.
References
- Ionita, M.; Lohmann, G.; Rimbu, N.; Chelcea, S.; Dima, M. Interannual to decadal summer drought variability over Europe and its relationship to global sea surface temperature. Clim. Dyn. 2012, 38, 363–377. [Google Scholar] [CrossRef]
- Pervez, M.S.; Henebry, G.M. Spatial and seasonal responses of precipitation in the Ganges and Brahmaputra river basins to ENSO and Indian Ocean dipole modes: Implications for flooding and drought. Nat. Hazards Earth Syst. Sci. 2015, 15, 147–162. [Google Scholar] [CrossRef]
- Humphries, M.S.; Green, A.N.; Finch, J.M. Evidence of El Nino driven desiccation cycles in a shallow estuarine lake: The evolution and fate of Africa’s largest estuarine system, Lake St Lucia. Glob. Planet. Chang. 2016, 147, 97–105. [Google Scholar] [CrossRef]
- Jimenez-Munoz, J.C.; Mattar, C.; Barichivich, J.; Santamaria-Artigas, A.; Takahashi, K.; Malhi, Y.; Sobrino, J.A.; van der Schrier, G. Record-breaking warming and extreme drought in the Amazon rainforest during the course of El Nino 2015–2016. Sci. Rep. 2016, 6, 7. [Google Scholar] [CrossRef] [PubMed]
- Rasanen, T.A.; Lindgren, V.; Guillaume, J.H.A.; Buckley, B.M.; Kummu, M. On the spatial and temporal variability of ENSO precipitation and drought teleconnection in mainland Southeast Asia. Clim. Past. 2016, 12, 1889–1905. [Google Scholar] [CrossRef]
- Henley, B.J.; Thyer, M.A.; Kuczera, G. Climate driver informed short-term drought risk evaluation. Water Resour. Res. 2013, 49, 2317–2326. [Google Scholar] [CrossRef]
- Wachnicka, A.; Gaiser, E.; Wingard, L.; Briceno, H.; Harlem, P. Impact of late Holocene climate variability and anthropogenic activities on Biscayne Bay (Florida, USA): Evidence from diatoms. Paleogeogr. Paleoclimatol. Paleoecol. 2013, 371, 80–92. [Google Scholar] [CrossRef]
- Tang, C.L.; Chen, D.; Crosby, B.T.; Piechota, T.C.; Wheaton, J.M. Is the PDO or AMO the climate driver of soil moisture in the Salmon River Basin, Idaho? Glob. Planet. Chang. 2014, 120, 16–23. [Google Scholar] [CrossRef]
- Wang, S.S.; Huang, J.P.; He, Y.L.; Guan, Y.P. Combined effects of the Pacific decadal oscillation and El Nino-southern oscillation on global land dry-wet changes. Sci. Rep. 2014, 4, 8. [Google Scholar] [CrossRef] [PubMed]
- Singh, S.; Srivastava, P.; Abebe, A.; Mitra, S. Baseflow response to climate variability induced droughts in the Apalachicola-Chattahoochee-Flint River Basin, USA. J. Hydrol. 2015, 528, 550–561. [Google Scholar] [CrossRef]
- Sun, Q.H.; Miao, C.Y.; AghaKouchak, A.; Duan, Q.Y. Century-scale causal relationships between global dry/wet conditions and the state of the Pacific and Atlantic Oceans. Geophys. Res. Lett. 2016, 43, 6528–6537. [Google Scholar] [CrossRef]
- Ummenhofer, C.C.; Sen Gupta, A.; Briggs, P.R.; England, M.H.; McIntosh, P.C.; Meyers, G.A.; Pook, M.J.; Raupach, M.R.; Risbey, J.S. Indian and Pacific Ocean influences on southeast Australian drought and soil moisture. J. Clim. 2011, 24, 1313–1336. [Google Scholar] [CrossRef]
- Hamada, J.I.; Mori, S.; Kubota, H.; Yamanaka, M.D.; Haryoko, U.; Lestari, S.; Sulistyowati, R.; Syamsudin, F. Interannual rainfall variability over northwestern Jawa and its relation to the Indian Ocean Dipole and El Nino-Southern Oscillation events. Sola 2012, 8, 69–72. [Google Scholar] [CrossRef]
- Bauer-Marschallinger, B.; Dorigo, W.A.; Wagner, W.; van Dijk, A. How oceanic oscillation drives soil moisture variations over mainland Australia: An analysis of 32 years of satellite observations. J. Clim. 2013, 26, 10159–10173. [Google Scholar] [CrossRef]
- Ummenhofer, C.C.; D’Arrigo, R.D.; Anchukaitis, K.J.; Buckley, B.M.; Cook, E.R. Links between Indo-Pacific climate variability and drought in the Monsoon Asia Drought Atlas. Clim. Dyn. 2013, 40, 1319–1334. [Google Scholar] [CrossRef]
- Lopez-Moreno, J.I.; Vicente-Serrano, S.M. Positive and negative phases of the wintertime North Atlantic Oscillation and drought occurrence over Europe: A multitemporal-scale approach. J. Clim. 2008, 21, 1220–1243. [Google Scholar] [CrossRef]
- Zhao, Y.; Qian, Y.F. Relationships between anomalies of land-sea thermal contrast in North Africa and summer flood and drought across the Jianghuai region of China. Acta Meteorol. Sin. 2010, 24, 354–364. [Google Scholar]
- Lee, H.F.; Zhang, D.D. Relationship between NAO and drought disasters in Northwestern China in the last millennium. J. Arid Environ. 2011, 75, 1114–1120. [Google Scholar] [CrossRef]
- Marj, A.F.; Meijerink, A.M.J. Agricultural drought forecasting using satellite images, climate indices and artificial neural network. Int. J. Remote Sens. 2011, 32, 9707–9719. [Google Scholar] [CrossRef]
- Assani, A.A.; Landry, R.; Azouaoui, O.; Massicotte, P.; Gratton, D. Comparison of the characteristics (frequency and timing) of drought and wetness indices of annual mean water levels in the five North American Great Lakes. Water Resour. Manag. 2016, 30, 359–373. [Google Scholar] [CrossRef]
- Wang, X.L.; Hou, X.Y.; Li, Z.; Wang, Y.D. Spatial and temporal characteristics of meteorological drought in Shandong Province, China, from 1961 to 2008. Adv. Meteorol. 2014, 2014, 873593. [Google Scholar] [CrossRef]
- Cai, Q.F.; Liu, Y.; Liu, H.; Ren, J.L. Reconstruction of drought variability in North China and its association with sea surface temperature in the joining area of Asia and Indian-Pacific Ocean. Paleogeogr. Paleoclimatol. Paleoecol. 2015, 417, 554–560. [Google Scholar] [CrossRef]
- Song, X.Y.; Song, S.B.; Sun, W.Y.; Mu, X.M.; Wang, S.Y.; Li, J.Y.; Li, Y. Recent changes in extreme precipitation and drought over the Songhua River Basin, China, during 1960–2013. Atmos. Res. 2015, 157, 137–152. [Google Scholar] [CrossRef]
- Wang, K.Y.; Li, Q.F.; Yang, Y.; Zeng, M.; Li, P.C.; Zhang, J.X. Analysis of spatio-temporal evolution of droughts in Luanhe River Basin using different drought indices. Water Sci. Eng. 2015, 8, 282–290. [Google Scholar] [CrossRef]
- Liu, S.L.; Kang, W.P.; Wang, T. Drought variability in Inner Mongolia of northern China during 1960–2013 based on standardized precipitation evapotranspiration index. Environ. Earth Sci. 2016, 75, 14. [Google Scholar] [CrossRef]
- Huang, S.Z.; Chang, J.X.; Huang, Q.; Chen, Y.T. Spatio-temporal changes and frequency analysis of drought in the Wei River Basin, China. Water Resour. Manag. 2014, 28, 3095–3110. [Google Scholar] [CrossRef]
- Zhang, Q.; Sun, P.; Li, J.F.; Singh, V.P.; Liu, J.Y. Spatiotemporal properties of droughts and related impacts on agriculture in Xinjiang, China. Int. J. Climatol. 2015, 35, 1254–1266. [Google Scholar] [CrossRef]
- Zhang, Q.; Sun, P.; Li, J.F.; Xiao, M.Z.; Singh, V.P. Assessment of drought vulnerability of the Tarim River basin, Xinjiang, China. Theor. Appl. Climatol. 2015, 121, 337–347. [Google Scholar] [CrossRef]
- Wang, X.; Liang, P.Y.; Li, C.H.; Wu, F.F. Analysis of regional temperature variation characteristics in the Lancang River Basin in southwestern China. Quat. Int. 2014, 333, 198–206. [Google Scholar] [CrossRef]
- Han, L.Y.; Zhang, Q.; Ma, P.L.; Jia, J.Y.; Wang, J.S. The spatial distribution characteristics of a comprehensive drought risk index in southwestern China and underlying causes. Theor. Appl. Climatol. 2016, 124, 517–528. [Google Scholar] [CrossRef]
- Liu, B.J.; Li, Y.; Chen, J.F.; Chen, X.H. Long-term change in precipitation structure over the karst area of Southwest China. Int. J. Climatol. 2016, 36, 2417–2434. [Google Scholar] [CrossRef]
- Xin, X.G.; Yu, R.C.; Zhou, T.J.; Wang, B. Drought in late spring of South China in recent decades. J. Clim. 2006, 19, 3197–3206. [Google Scholar] [CrossRef]
- Sun, C.H.; Yang, S. Persistent severe drought in Southern China during winter-spring 2011: Large-scale circulation patterns and possible impacting factors. J. Geophys. Res. Atmos. 2012, 117, 18. [Google Scholar] [CrossRef]
- Wu, C.H.; Huang, G.R. Projection of climate extremes in the Zhujiang River Basin using a regional climate model. Int. J. Climatol. 2016, 36, 1184–1196. [Google Scholar] [CrossRef]
- Yuan, W.P.; Cai, W.W.; Chen, Y.; Liu, S.G.; Dong, W.J.; Zhang, H.C.; Yu, G.R.; Chen, Z.Q.; He, H.L.; Guo, W.D.; et al. Severe summer heatwave and drought strongly reduced carbon uptake in Southern China. Sci. Rep. 2016, 6, 12. [Google Scholar] [CrossRef] [PubMed]
- Fischer, T.; Gemmer, M.; Su, B.; Scholten, T. Hydrological long-term dry and wet periods in the Xijiang River Basin, South China. Hydrol. Earth Syst. Sci. 2013, 17, 135–148. [Google Scholar] [CrossRef]
- Wu, Z.Y.; Lin, Q.X.; Lu, G.H.; He, H.; Qu, J.J. Analysis of hydrological drought frequency for the Xijiang River Basin in South China using observed streamflow data. Nat. Hazards 2015, 77, 1655–1677. [Google Scholar] [CrossRef]
- China Meteorological Administration. Available online: http://data.cma.cn (accessed on 1 December 2015).
- Harmonized World Soil Database. Available online: http://www.fao.org/soils-portal/soil-survey/soil-maps-and-databases/harmonized-world-soil-database-v12/en/ (accessed on 1 December 2015).
- Yuyu, R.; Guoyu, R. Representativeness of four precipitation observational networks of China. Acta Meteorol. Sin. 2012, 26, 454–466. [Google Scholar]
- Li, Y.; Yao, N.; Sahin, S.; Appels, W.M. Spatiotemporal variability of four precipitation-based drought indices in Xinjiang, China. Theor. Appl. Climatol. 2016. [Google Scholar] [CrossRef]
- Xiao, M.; Zhang, Q.; Singh, V.P. Influences of ENSO, NAO, IOD and PDO on seasonal precipitation regimes in the Yangtze River Basin, China. Int. J. Climatol. 2014, 35, 3556–3567. [Google Scholar] [CrossRef]
- Kong, Q.; Ge, Q.; Zheng, J.; Xi, J. Prolonged dry episodes over Northeast China during the period 1961–2012. Theor. Appl. Climatol. 2015, 122, 711–719. [Google Scholar] [CrossRef]
- National Climate Centre, China Meteorological Administration. Available online: http://cmdp.ncc-cma.net/Monitoring/cn_nino_index.php?product=cn_nino_index_nino (accessed on 1 May 2016).
- Xiaoyan, L.; Panmao, Z. On indices and indicators of ENSO episodes. Acta Meteorol. Sin. 2000, 58, 102–109. [Google Scholar]
- University of Washington. Available online: http://research.jisao.washington.edu/pdo/index.html (accessed on 1 May 2016).
- Mantua, N.J.; Hare, S.R.; Zhang, Y.; Wallace, J.M.; Francis, R.C. A Pacific interdecadal climate oscillation with impacts on salmon production. Bull. Am. Meteorol. Soc. 1997, 78, 1069–1079. [Google Scholar] [CrossRef]
- Saji, N.H.; Goswami, B.N.; Vinayachandran, P.N.; Yamagata, T. A dipole mode in the tropical Indian Ocean. Nature 1999, 401, 360–363. [Google Scholar] [CrossRef] [PubMed]
- Webster, P.J.; Moore, A.M.; Loschnigg, J.P.; Leben, R.R. Coupled ocean-atmosphere dynamics in the Indian Ocean during 1997–98. Nature 1999, 401, 356–360. [Google Scholar] [CrossRef] [PubMed]
- National Climate Centre, China Meteorological Administration. Available online: http://cmdp.ncc-cma.net/Monitoring/cn_nino_index.php?product=cn_nino_index_iobw (accessed on 1 May 2016).
- Marshall, J.; Kushnir, Y.; Battisti, D.; Chang, P.; Czaja, A.; Dickson, R.; Hurrell, J.; Mccartney, M.; Saravanan, R.; Visbeck, M. North Atlantic climate variability: Phenomena, impacts and mechanisms. Int. J. Climatol. 2001, 21, 1863–1898. [Google Scholar] [CrossRef]
- National Climate Centre, China Meteorological Administration. Available online: http://cmdp.ncc-cma.net/Monitoring/cn_nino_index.php?product=cn_nino_index_atlantic (accessed on 1 May 2016).
- Palmer, W. Meteorological Drought; Research Paper; U.S. Department of Commerce Weather Bureau: Washington, DC, USA, 1965; Volume 45, p. 58.
- Wells, N.; Goddard, S.; Hayes, M.J. A Self-Calibrating Palmer Drought Severity Index. J. Clim. 2004, 17, 2335–2351. [Google Scholar] [CrossRef]
- China National Climate Center. Classification of Meteorological Drought; Standardization Administration of the People’s Republic of China: Beijing, China, 2006; Volume GB/T 20481-2006.
- Pearson, K. In On lines and planes of closest fit to systems of points in space. Lond. Edinb. Dublin Philos. Mag. J. Sci. 1901, 2, 559–572. [Google Scholar] [CrossRef]
- Lorenz, E.N. Empirical orthogonal functions and statistical weather prediction. Sci. Rep. 1956, 409, 997–999. [Google Scholar]
- Hannachi, A.; Jolliffe, I.T.; Stephenson, D.B. Empirical orthogonal functions and related techniques in atmospheric science: A review. Int. J. Climatol. 2007, 27, 1119–1152. [Google Scholar] [CrossRef]
- Wei, F. Model Climatic Statistical Diagnosis and Prediction Technology; China Meteorological Press: Beijing, China, 1999. [Google Scholar]
- Huang, J. Climatic Statistical Analysis and Forcasting Methods; China Meteorological Press: Beijing, China, 2004. [Google Scholar]
- Li, H. The Analysis of Variation Characteristics and Cause of Drought-Wetness over Tarim River Basin in Recent 50a. Ph.D. Dissertation, Nanjing University of Information Science & Technology, Nanjing, China, 2012. [Google Scholar]
- Maris, F.; Kitikidou, K.; Angelidis, P.; Potouridis, S. Kriging interpolation method for estimation of continuous spatial distribution of precipitation in Cyprus. Br. J. Appl. Sci. Technol. 2013, 3, 1286–1300. [Google Scholar] [CrossRef]
- Paparrizos, S.; Maris, F.; Matzarakis, A. A downscaling technique for climatological data in areas with complex topography and limited data. Int. J. Eng. Res. Dev. 2016, 12, 17–23. [Google Scholar]
- Paparrizos, S.; Maris, F.; Matzarakis, A. Integrated analysis of present and future responses of precipitation over selected Greek areas with different climate conditions. Atmos. Res. 2016, 169, 199–208. [Google Scholar] [CrossRef]
- Paparrizos, S.; Maris, F.; Weiler, M.; Matzarakis, A. Analysis and mapping of present and future drought conditions over Greek areas with different climate conditions. Theor. Appl. Climatol. 2016. [Google Scholar] [CrossRef]
- Robinson, W.S. Ecological correlations and the behavior of individuals. Int. J. Epidemiol. 1950, 15, 337–341. [Google Scholar] [CrossRef]
- Mccarty, H.H.; Hook, J.C.; Knos, D.S. The Measurement of Association in Industrial Geography; Greenwood Press: Westport, CT, USA, 1956. [Google Scholar]
- Wang, H.; Chen, Y.; Pan, Y.; Li, W. Spatial and temporal variability of drought in the arid region of China and its relationships to teleconnection indices. J. Hydrol. 2015, 523, 283–296. [Google Scholar] [CrossRef]
Figure 1.
Topographic map of the Xijiang River Basin with four zones and 32 meteorological stations.
Figure 1.
Topographic map of the Xijiang River Basin with four zones and 32 meteorological stations.
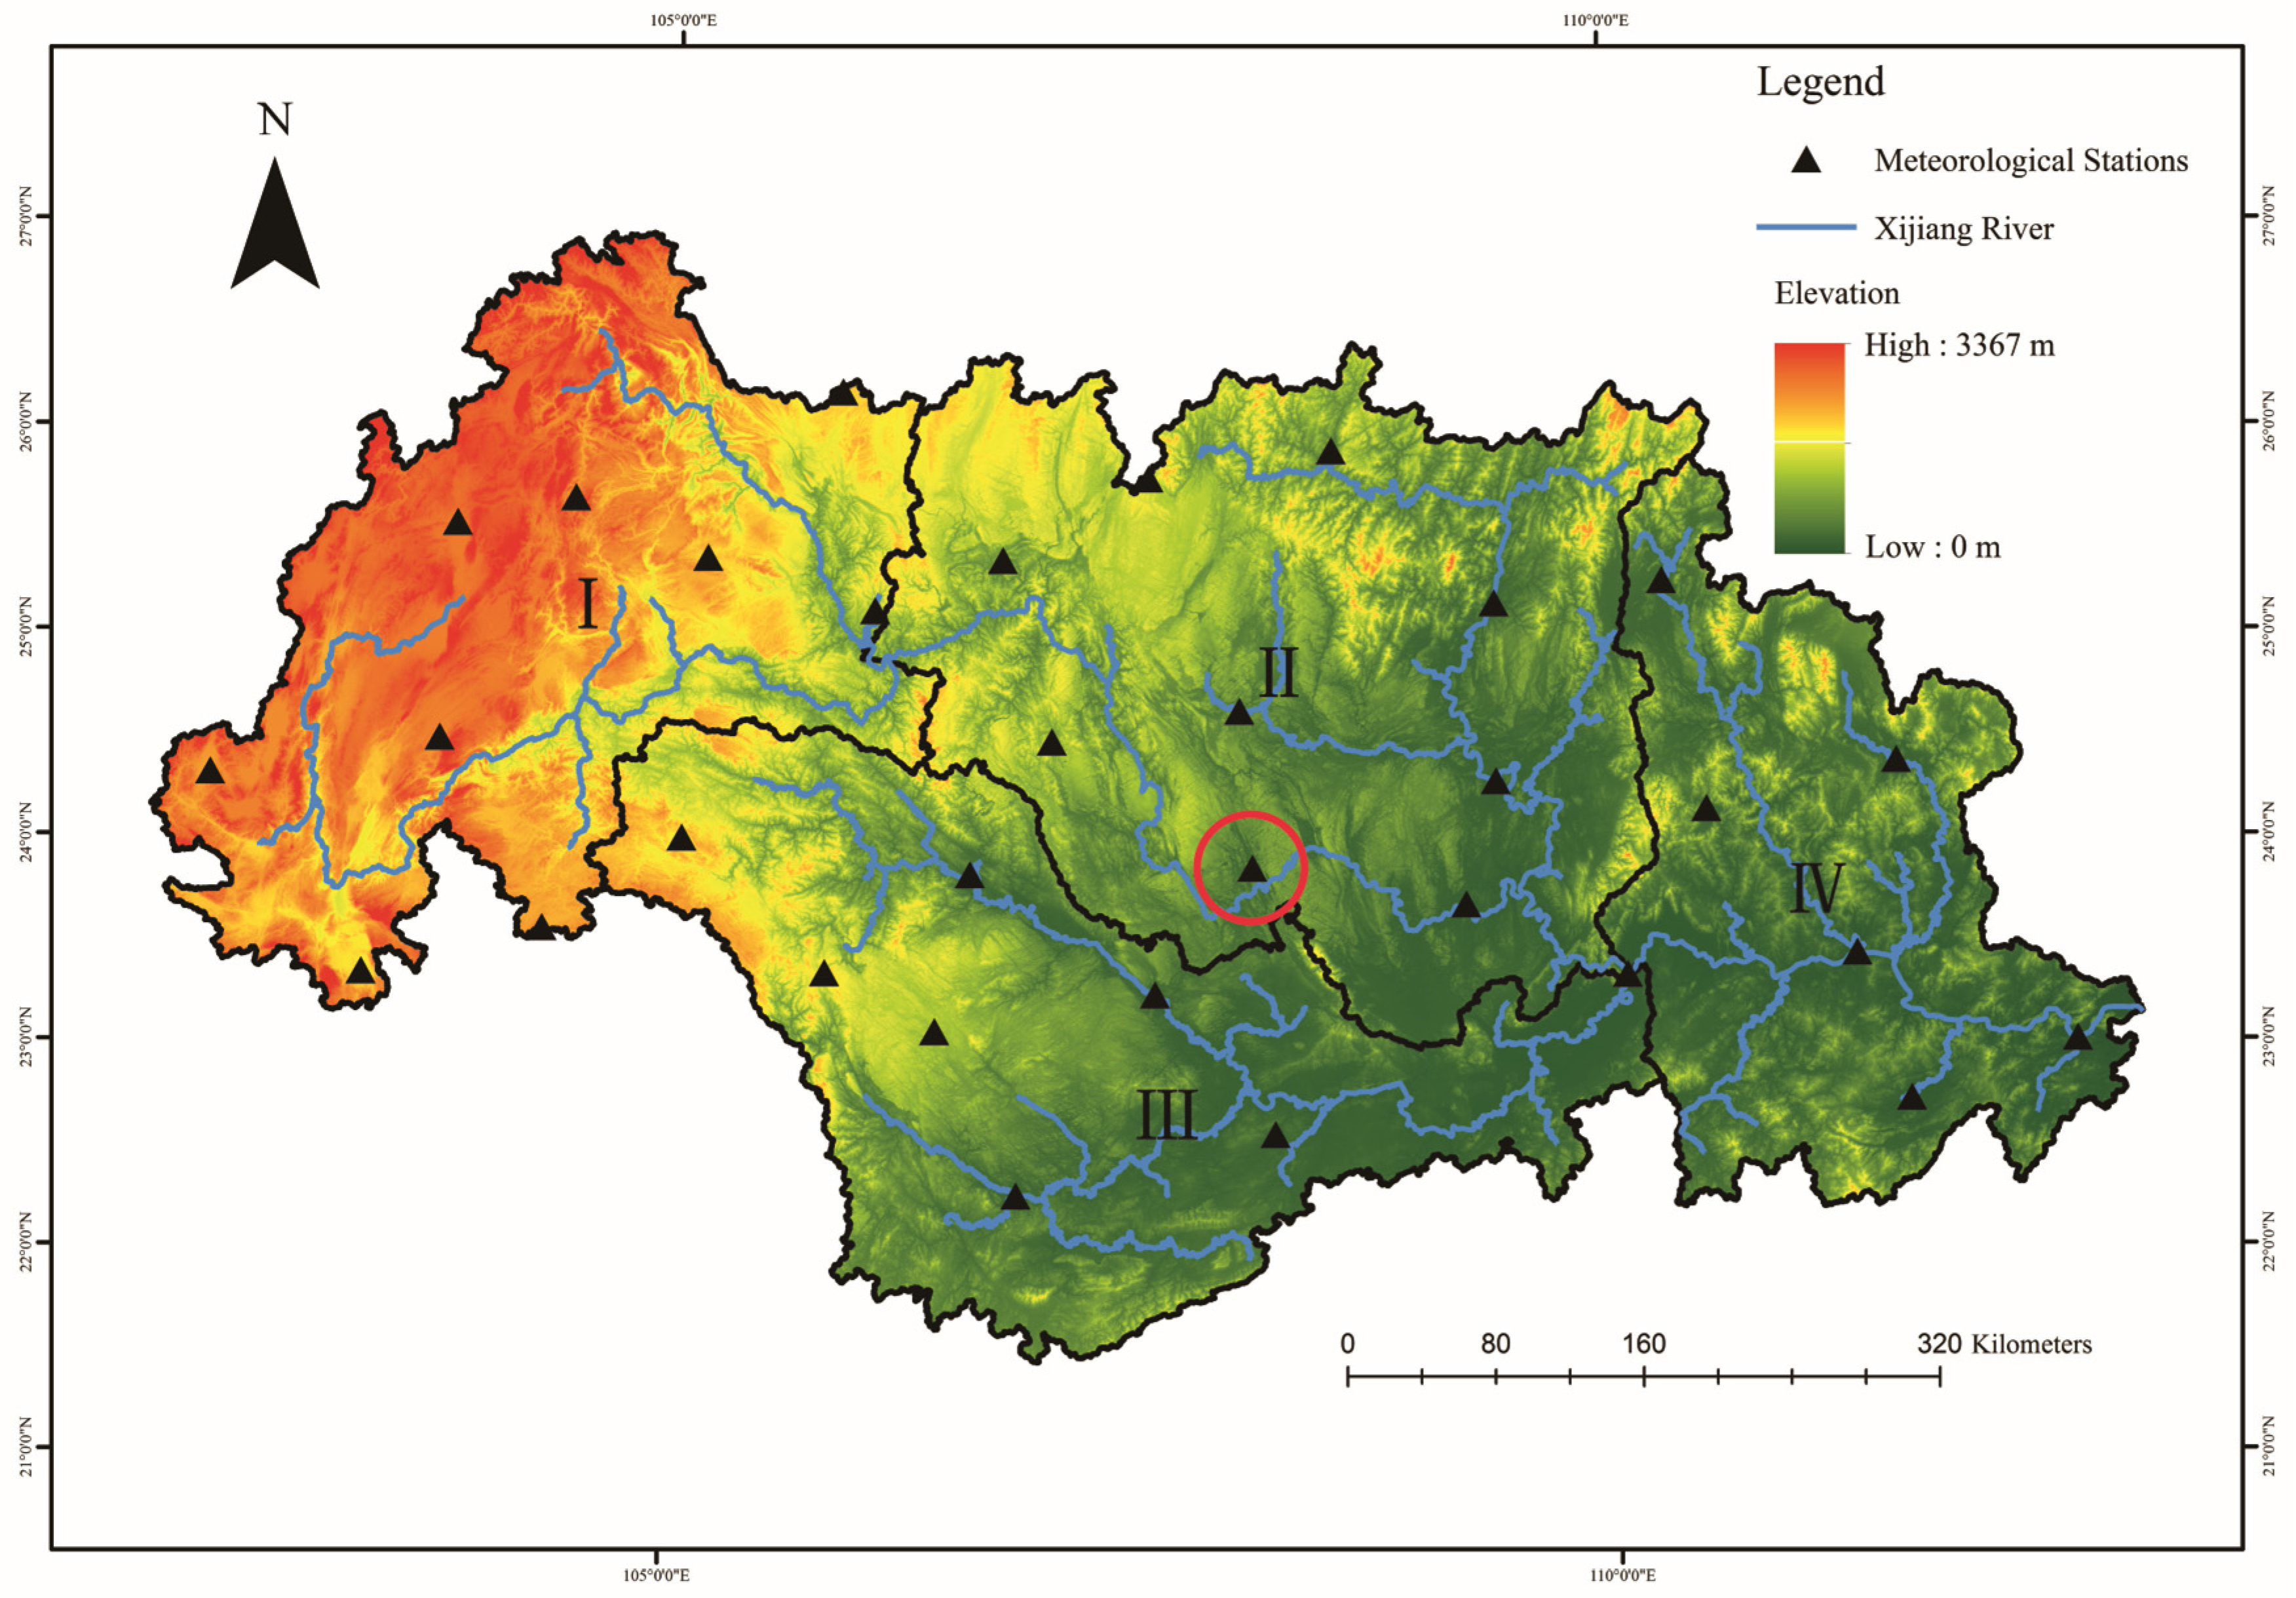
Figure 2.
PDSI time series with different scales in the Duan Station.

Figure 3.
Variances (a) and cumulative variances (b) of the first 10 eigenvectors of the annual, semi-annual, seasonal, and several representative months’ PDSI fields in the Xijiang River Basin from December 1960 to November 2015.
Figure 3.
Variances (a) and cumulative variances (b) of the first 10 eigenvectors of the annual, semi-annual, seasonal, and several representative months’ PDSI fields in the Xijiang River Basin from December 1960 to November 2015.
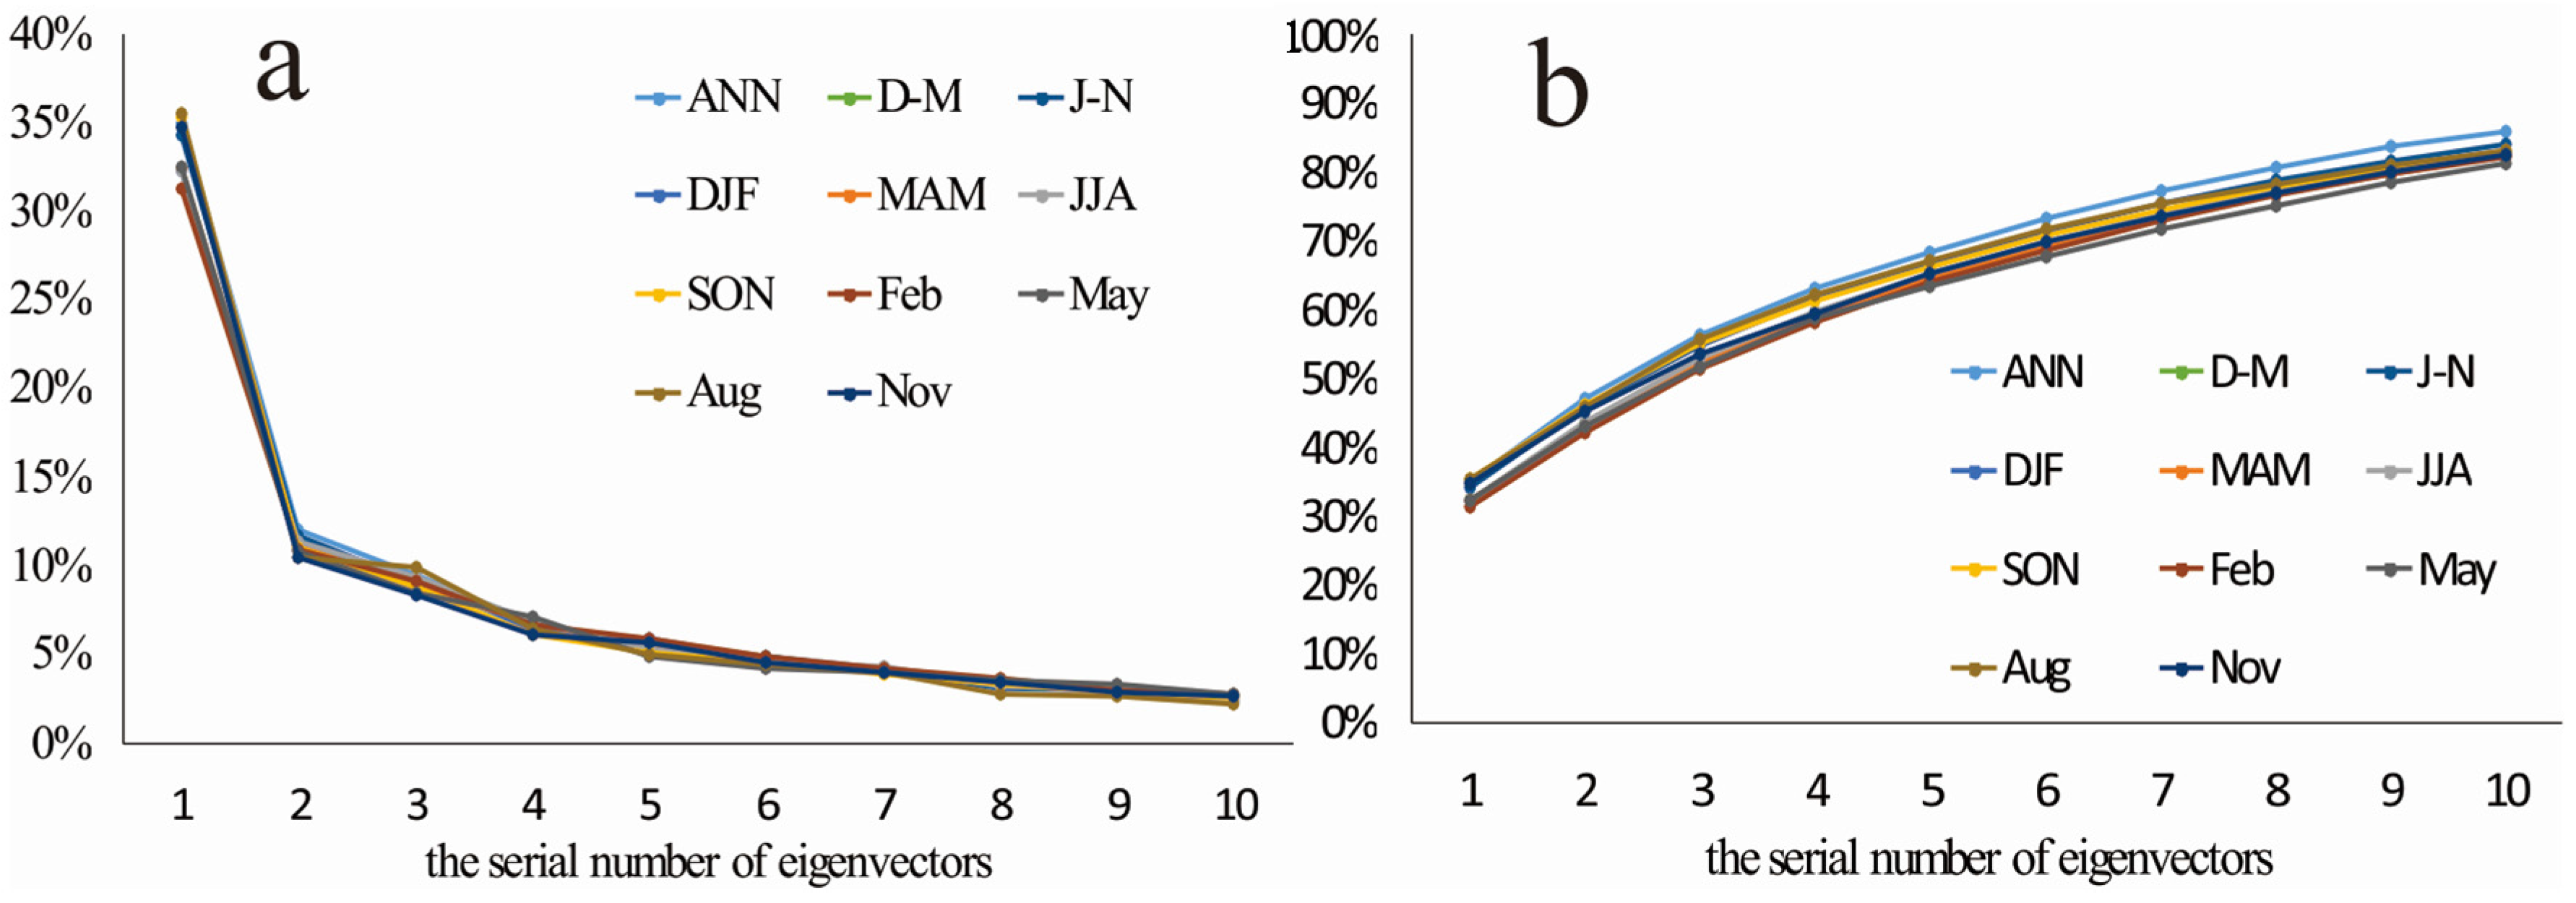
Figure 4.
The first two loading annual vectors of REOFs (Rotated Empirical Orthogonal Functions for spatial patterns). (a) ANN REOF1 (annual REOF1) (b) ANN REOF2 (annual REOF2).
Figure 4.
The first two loading annual vectors of REOFs (Rotated Empirical Orthogonal Functions for spatial patterns). (a) ANN REOF1 (annual REOF1) (b) ANN REOF2 (annual REOF2).
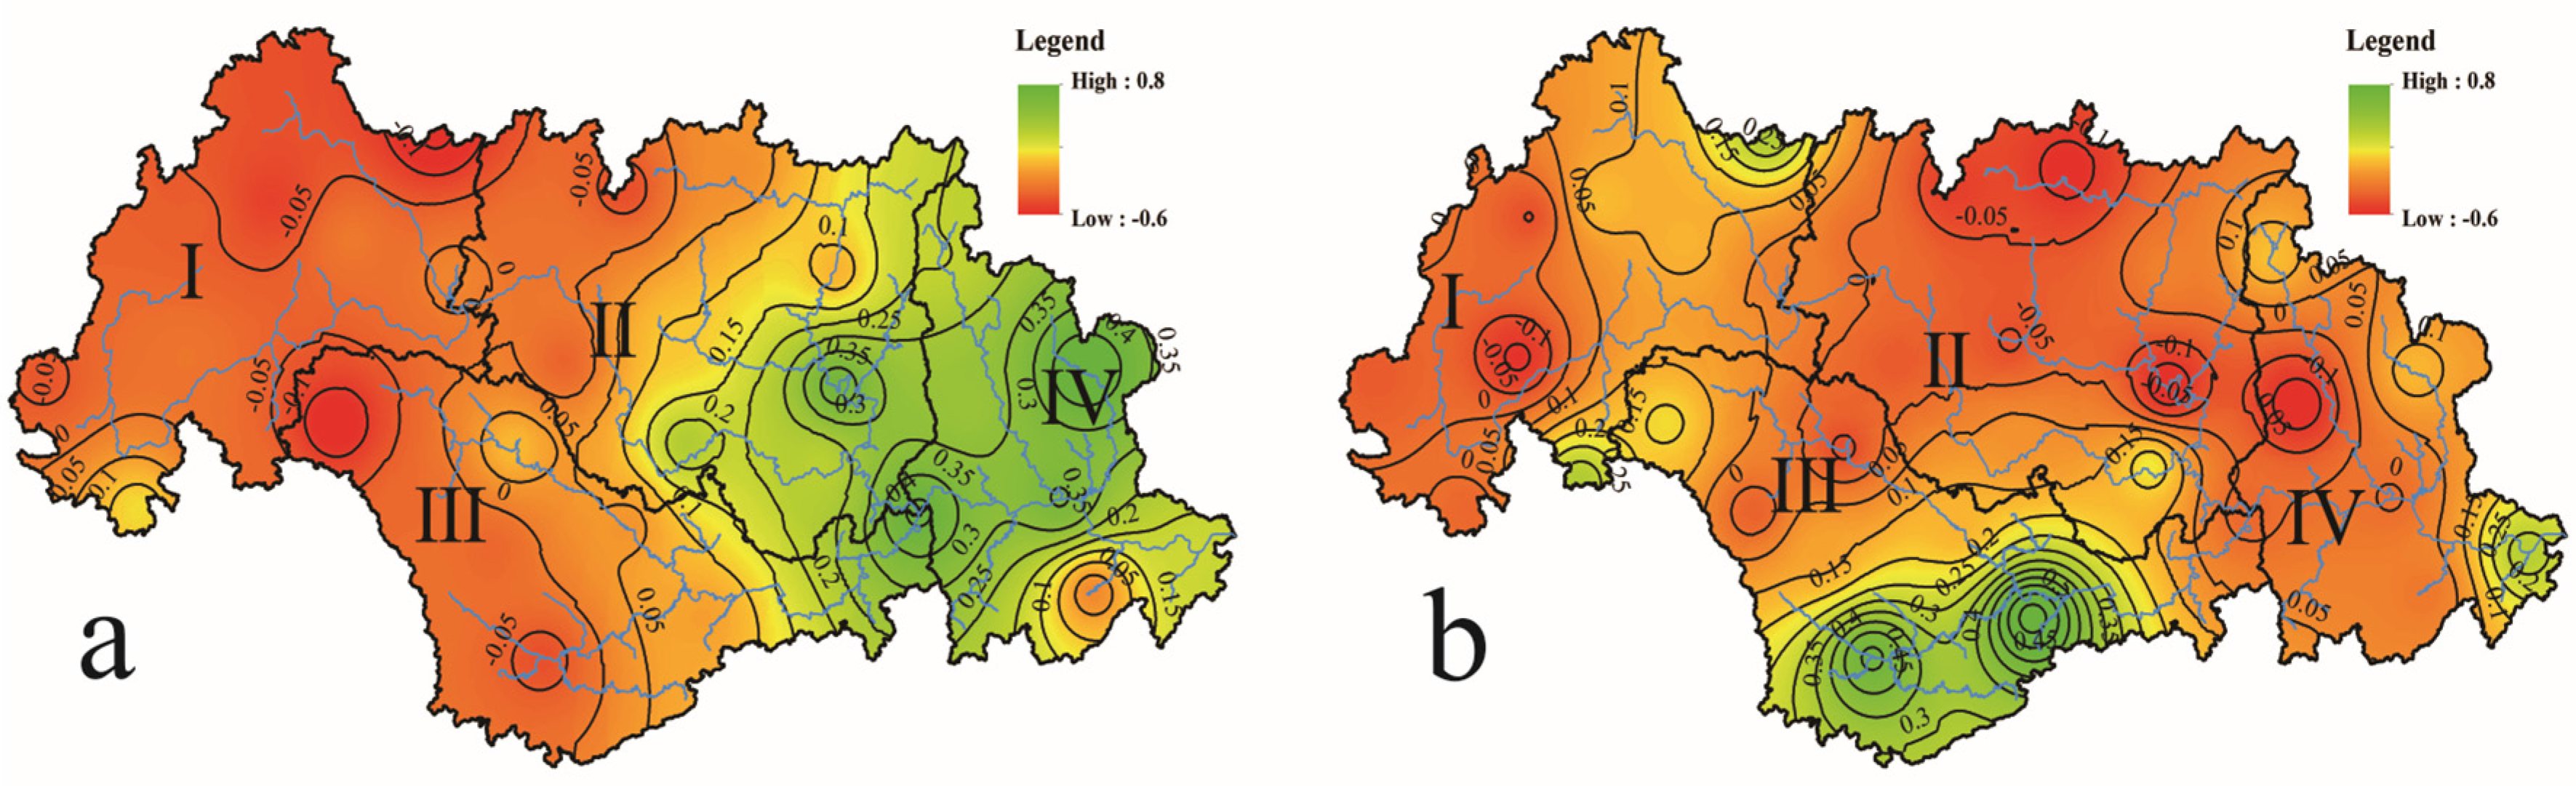
Figure 5.
The first two loading annual vectors of RPCs (Rotated Principal Components for temporal patterns): ANN RPC1 and RPC2 (Annual Rotated Principal Component 1 and 2).
Figure 5.
The first two loading annual vectors of RPCs (Rotated Principal Components for temporal patterns): ANN RPC1 and RPC2 (Annual Rotated Principal Component 1 and 2).

Figure 6.
Correlations between annual and corresponding semi-annual, seasonal, and representative months’ REOFs/RPCs, where the number behind the semi-annual, seasonal, and representative months’ name in the legend is the Pearson correlation coefficient. (a) REOF1; (b) REOF2; (c) RPC1; (d) RPC2.
Figure 6.
Correlations between annual and corresponding semi-annual, seasonal, and representative months’ REOFs/RPCs, where the number behind the semi-annual, seasonal, and representative months’ name in the legend is the Pearson correlation coefficient. (a) REOF1; (b) REOF2; (c) RPC1; (d) RPC2.
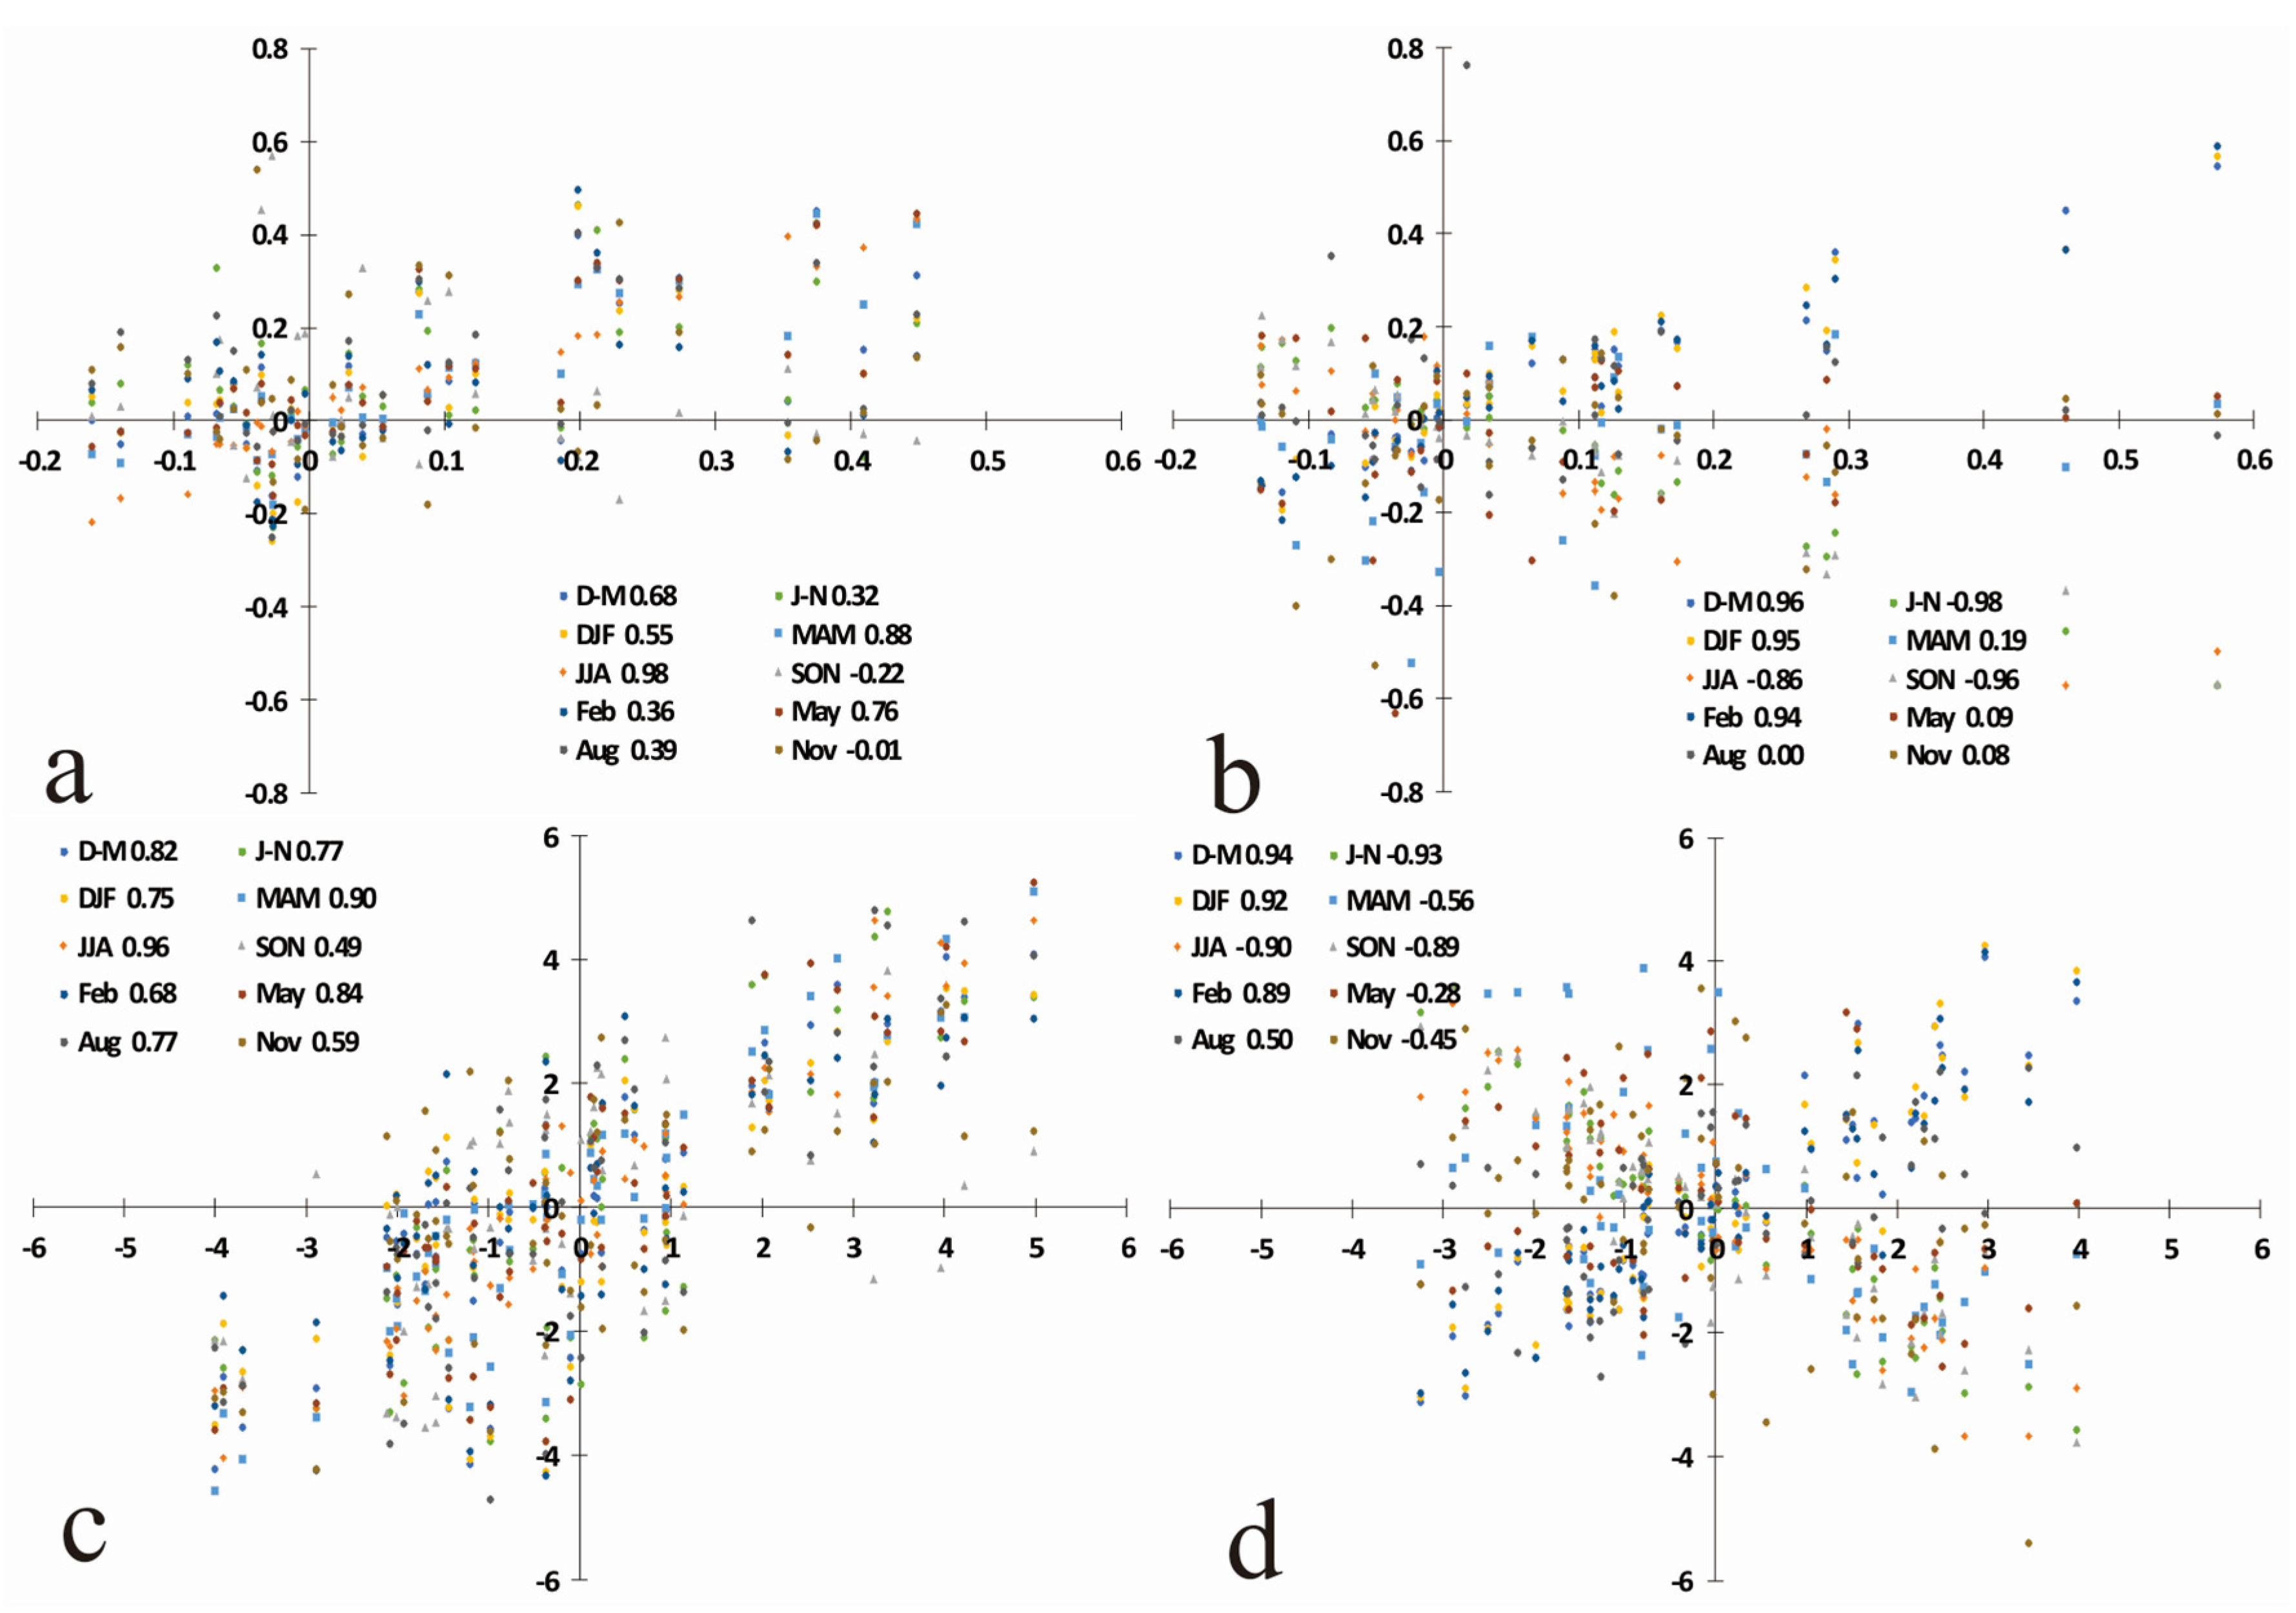
Figure 7.
Some loading semi-annual vectors of REOFs. (a) D–M REOF2; (b) J–N REOF2; (c) J–N REOF3.

Figure 8.
Some loading seasonal vectors of REOFs. (a) DJF REOF2; (b) MAM REOF5; (c) JJA REOF2; (d) JJA REOF3; (e) SON REOF2; (f) SON REOF4.
Figure 8.
Some loading seasonal vectors of REOFs. (a) DJF REOF2; (b) MAM REOF5; (c) JJA REOF2; (d) JJA REOF3; (e) SON REOF2; (f) SON REOF4.

Figure 9.
Some loading seasonal vectors of REOFs. (a) February REOF2; (b) May REOF3; (c) August REOF2; (d) August REOF3; (e) August REOF4; (f) November REOF5.
Figure 9.
Some loading seasonal vectors of REOFs. (a) February REOF2; (b) May REOF3; (c) August REOF2; (d) August REOF3; (e) August REOF4; (f) November REOF5.


Table 1.
Classifications of wetness and drought according to Sc-PDSI (Self-calibrated Palmer Drought Severity Index).
Table 1.
Classifications of wetness and drought according to Sc-PDSI (Self-calibrated Palmer Drought Severity Index).
| Classifications | Index Value |
|---|---|
| Extreme wetness | Sc-PDSI ≥ 4.0 |
| Very wetness | 4.0 > Sc-PDSI ≥ 3.0 |
| Moderate wetness | 3.0 > Sc-PDSI ≥ 2.0 |
| Slight wetness | 2.0 > Sc-PDSI ≥ 1.0 |
| Normal | 1.0 > Sc-PDSI > −1.0 |
| Mild drought | −1.0 ≥ Sc-PDSI > −2.0 |
| Moderate drought | −2.0 ≥ Sc-PDSI > −3.0 |
| Severe drought | −3.0 ≥ Sc-PDSI > −4.0 |
| Extreme drought | −4.0 ≥ Sc-PDSI |
Table 2.
The Pearson correlation coefficient between annual, semi-annual, seasonal, or months’ RPCs and climate indices from December 1960 to November 2015. The number that is significant at the 95% confidence is in bold, and the index with a suffix of “_1” or “_0”denotes the index with 1- or 0-year ahead, respectively. The indices that do not have significant correlation with RPCs are not shown below. PDO (Pacific Decadal Oscillation), IOD (India Ocean Dipole), NAO (North Atlantic Oscillation), D–M (December to May), J–N (June to November), DJF (December, January, February), MAM (March, April, May), JJA (June, July, August), SON (September October, November).
| Time Scales | Indices | RPC1 | RPC2 | RPC3 | RPC4 | RPC5 |
|---|---|---|---|---|---|---|
| ANN | PDO_0 | 0.035 | −0.346 | −0.018 | 0.000 | 0.076 |
| NAO_0 | 0.230 | −0.407 | 0.219 | −0.125 | −0.209 | |
| NAO_1 | 0.109 | −0.558 | 0.212 | −0.073 | −0.094 | |
| D–M | PDO_0 | −0.079 | −0.271 | −0.001 | 0.116 | 0.144 |
| NAO_0 | 0.225 | −0.286 | 0.104 | 0.050 | 0.080 | |
| NAO_1 | 0.078 | −0.419 | 0.129 | 0.041 | 0.051 | |
| J–N | PDO_0 | −0.019 | 0.301 | 0.357 | −0.009 | 0.105 |
| PDO_1 | −0.076 | 0.224 | 0.353 | 0.031 | 0.067 | |
| NAO_0 | 0.013 | 0.411 | 0.038 | 0.093 | 0.245 | |
| NAO_1 | −0.050 | 0.607 | 0.141 | 0.052 | 0.163 | |
| DJF | NAO_0 | 0.176 | −0.301 | −0.015 | −0.138 | 0.086 |
| NAO_1 | 0.090 | −0.447 | −0.019 | −0.036 | 0.072 | |
| MAM | IOD_0 | −0.019 | 0.118 | −0.035 | −0.101 | 0.313 |
| JJA | PDO_0 | 0.018 | 0.146 | 0.389 | 0.028 | −0.087 |
| PDO_1 | −0.015 | 0.113 | 0.345 | −0.050 | −0.178 | |
| NAO_0 | 0.194 | 0.298 | −0.041 | −0.079 | 0.221 | |
| NAO_1 | 0.036 | 0.549 | 0.130 | 0.013 | 0.109 | |
| SON | PDO_0 | −0.085 | 0.358 | 0.230 | 0.130 | −0.131 |
| NAO_0 | −0.255 | 0.502 | −0.014 | 0.194 | −0.002 | |
| NAO_1 | −0.263 | 0.612 | 0.040 | 0.154 | 0.011 | |
| IOD_0 | −0.055 | 0.022 | 0.249 | −0.289 | 0.196 | |
| Feb | NAO_1 | 0.075 | −0.328 | 0.006 | 0.062 | −0.008 |
| May | NAO_0 | 0.155 | −0.032 | −0.337 | 0.143 | 0.105 |
| Aug | NAO_0 | 0.084 | −0.308 | −0.360 | 0.270 | −0.249 |
| NAO_1 | 0.012 | −0.217 | −0.437 | 0.391 | −0.069 | |
| Nov | IOD_0 | −0.052 | 0.142 | −0.101 | −0.170 | −0.336 |
Table 3.
Results of multiple stepwise regressions between RPCs and climate indices, where the index with a suffix of “_1” or “_0” denotes the index with 1- or 0-year ahead, respectively. The RPCs that were not significant are not shown below.
Table 3.
Results of multiple stepwise regressions between RPCs and climate indices, where the index with a suffix of “_1” or “_0” denotes the index with 1- or 0-year ahead, respectively. The RPCs that were not significant are not shown below.
| Time Scales | RPCs | Entered Variables | Standardized Coefficients |
|---|---|---|---|
| ANN | RPC2 | NAO_1 | −0.556 |
| D–M | RPC2 | NAO_1 | −0.419 |
| J–N | RPC2 | NAO_1 | 0.597 |
| J–N | RPC3 | PDO_0 | 0.356 |
| DJF | RPC2 | NAO_1 | −0.447 |
| MAM | RPC5 | IOD_0 | 0.312 |
| JJA | RPC2 | NAO_1 | 0.542 |
| JJA | RPC3 | PDO_0 | 0.388 |
| SON | RPC2 | NAO_1 | 0.6 |
| SON | RPC4 | IOD_0 | −0.289 |
| February | RPC2 | NAO_1 | −0.327 |
| May | RPC3 | NAO_0 | −0.336 |
| August | RPC2 | NAO_0 | −0.302 |
| August | RPC3 | NAO_1 | −0.43 |
| August | RPC4 | NAO_1 | 0.385 |
| November | RPC5 | IOD_0 | −0.336 |
© 2017 by the authors. Licensee MDPI, Basel, Switzerland. This article is an open access article distributed under the terms and conditions of the Creative Commons Attribution (CC BY) license (http://creativecommons.org/licenses/by/4.0/).
Share and Cite
MDPI and ACS Style
Qiu, J.; Wang, Y.; Xiao, J. Spatiotemporal Distribution of Droughts in the Xijiang River Basin, China and Its Responses to Global Climatic Events. Water 2017, 9, 265. https://doi.org/10.3390/w9040265
AMA Style
Qiu J, Wang Y, Xiao J. Spatiotemporal Distribution of Droughts in the Xijiang River Basin, China and Its Responses to Global Climatic Events. Water. 2017; 9(4):265. https://doi.org/10.3390/w9040265
Chicago/Turabian StyleQiu, Jizhong, Yunpeng Wang, and Jie Xiao. 2017. "Spatiotemporal Distribution of Droughts in the Xijiang River Basin, China and Its Responses to Global Climatic Events" Water 9, no. 4: 265. https://doi.org/10.3390/w9040265
Note that from the first issue of 2016, this journal uses article numbers instead of page numbers. See further details here.