1. Introduction
Freshwater systems play the key role in substance transport to the oceans. They are often intensely managed and affected by pollution. At the same time, they are significant for providing ecosystem services. This makes them relevant to human health and well-being. Therefore, both an extensive monitoring of water quality and knowledge about the provenance of water pollution is crucial for protecting freshwater systems.
The Directive 2008/105/EC on Environmental Quality Standards of the European Parliament and the Council of the European Union asks all member states to set an inventory of emissions of priority substances for all river basin districts [
1]. Thus, this directive defines general requirements like management plans and measure programs according to the Water Framework Directive [
2] in order to establish a sustainable management of river basins. In a first step, the current status of all water bodies must be determined and the reasons for deficits must be identified. Thereafter, measures need to be developed in order to meet the set quality standards and to achieve a good ecological state of surface waters. Similarly to the Water Framework Directive, the Marine Strategy Framework Directive asks for an inventory which describes the ecological state of the respective water bodies [
3]. Environmental management goals must be determined and member states of the European Union have to specify cost-effective measure programs for the achievement or maintenance of a good ecological state of the marine zones. To fulfil these obligations and to provide both an inventory of emissions and measure programs, a useful method is the pathway-oriented modeling of emissions into water bodies on a catchment scale.
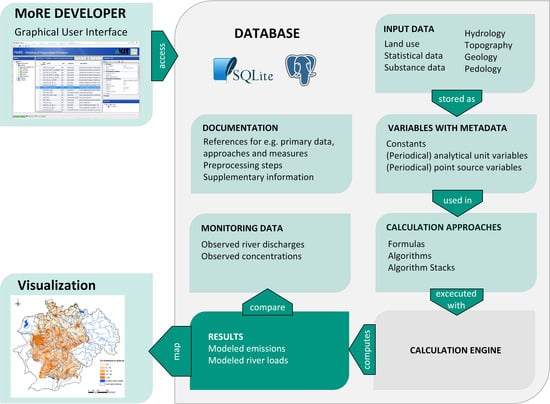
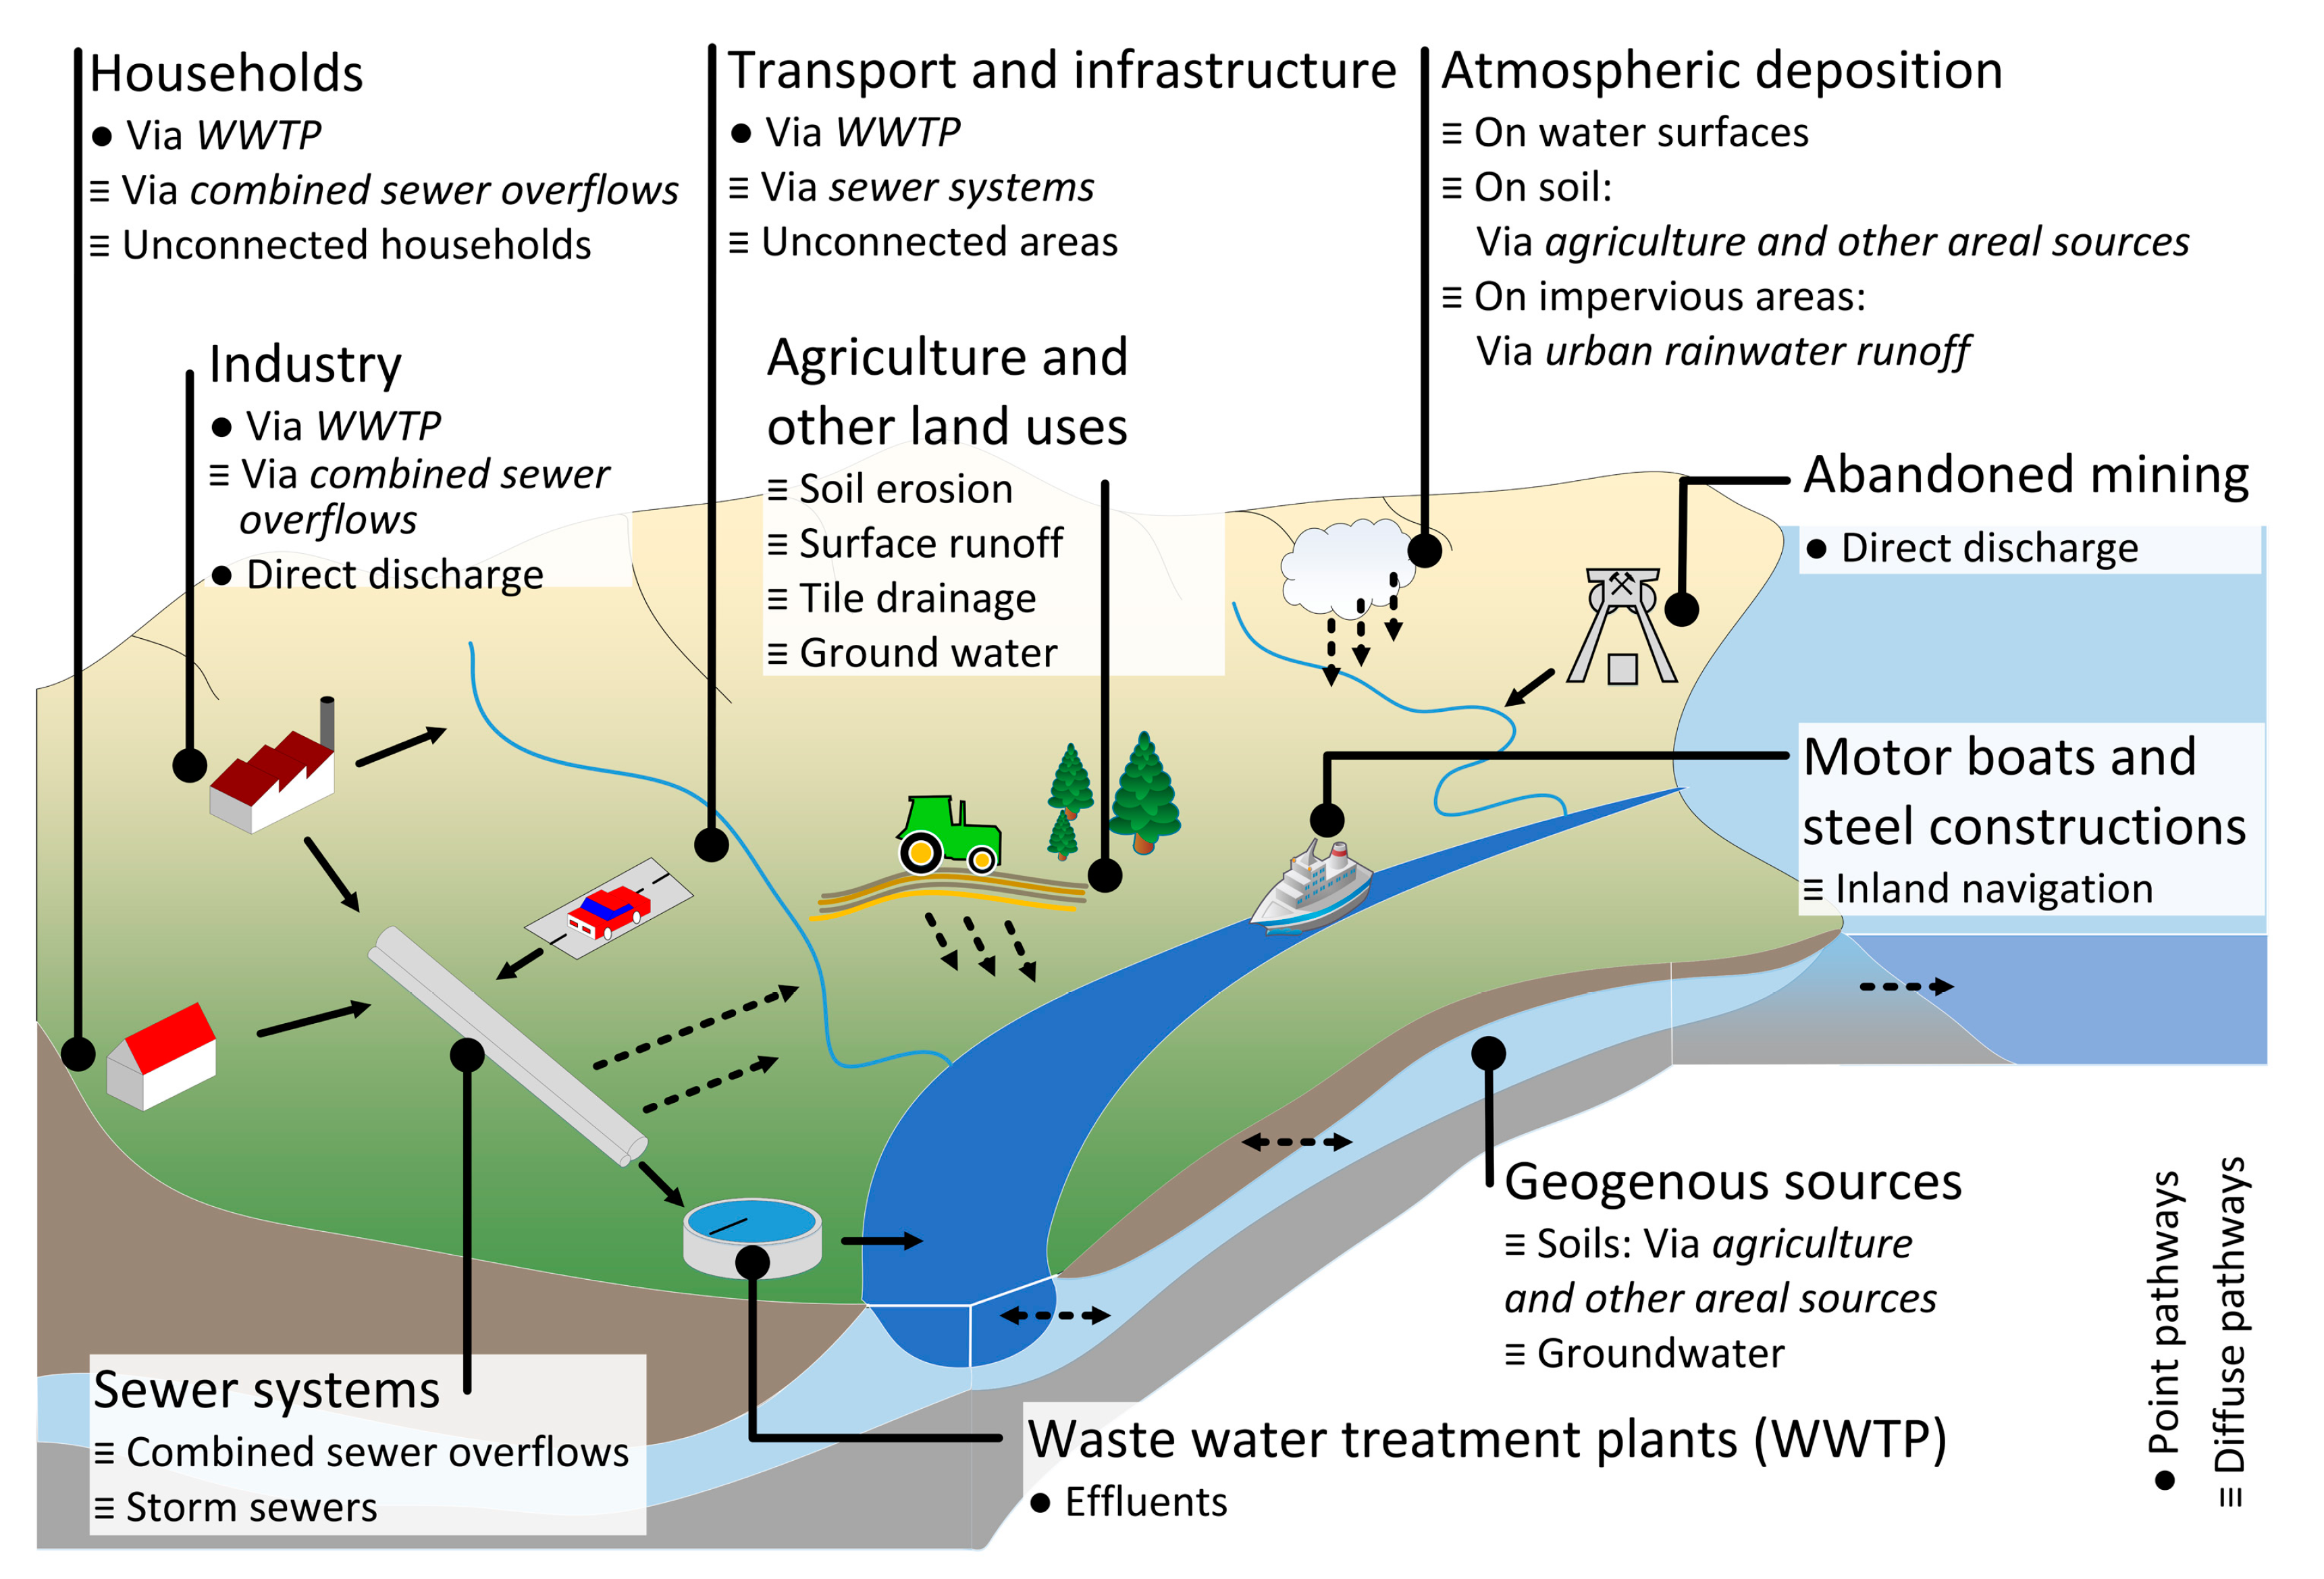
The pathway-oriented, conceptual model MoRE (Modelling of Regionalized Emissions) is used as the accounting and reporting tool for substance emissions in the Federal Republic of Germany for strategic planning purposes. MoRE consists of a database structure and holds empirical and conceptual approaches to evaluate different emission pathways (
Figure 1) as well as measures to reduce these emissions. It is applied on the scale of catchments and sub-catchments, typically referred to as the “meso” scale. MoRE has a database structure and a graphical user interface which are designed to manage data, calculation approaches, and references in a transparent manner.
The empirical calculation approaches used in MoRE largely originate from the model MONERIS 2.01 [
4,
5,
6] (MOdelling Nutrient Emissions in RIver Systems). Therefore, both models are related to one another, although they have been developed independently since 2009. MoRE is used to calculate regionalized emissions considering different pollutant sources and emission pathways. Such approaches are considered a good compromise between detailed, process-based models and the application of simple balancing approaches [
5]. Compared to more physically based models such as SWAT [
7] and AGNPS [
8], they have lower input data demands. Conceptual models can be more easily applied to large river basins and are able to compute results quickly [
5]. One disadvantage is that the empirically derived approaches cannot be transferred to other regions. Next to statistical data and land use data, the output of other models is used as input data. For MoRE applications, the water balance model LARSIM [
9] provides quantities of water per grid cell, land use class, time step, and runoff component (e.g., surface runoff, interflow, and groundwater flow) as fundamental input data.
Current MoRE applications have evolved from long-lasting collaborations between the model developers and environmental agencies. The largest application in terms of spatial coverage and input data is used to model emissions in all German river basins, including the shared watersheds of neighboring countries. Input data and approaches were continuously updated [
10,
11,
12,
13] and additional substances have been embedded [
14,
15]. Currently, annual emissions are modeled for the following substance groups:
nutrients (nitrogen, phosphorus)
heavy metals (cadmium, chromium, copper, mercury, nickel, lead, and zinc)
polycyclic aromatic hydrocarbons (∑ EPA-PAH16)
bis(2-ethylhexyl)phthalate (DEHP)
pharmaceuticals (ibuprofen, diclofenac, iomeprol, sulfamethoxazol)
industrial chemicals (nonylphenol)
biocide: triclosan
herbicide: terbutryn
The modeling approaches, input data, and results for nutrients are described in detail by [
4,
5,
6]. The same information on further pollutants is documented by [
6,
14] and [
15]. Additionally, MoRE is used to model supraregional reduction measures at source and/or end-of-pipe in terms of effectivity and costs [
10]. The modeling approaches used in different MoRE applications are customized to the available input data. Therefore, a more general description of the MoRE system is given here. A detailed description of the modeling approaches is given in [
6,
10,
15,
16].
This paper introduces MoRE as a modeling software. It describes the technical background of MoRE (
Section 2) and the possibilities for modeling substance emissions into surface waters using an example of its application (
Section 3). Finally, an outlook on future developments is given (
Section 4).
2. Technical Background
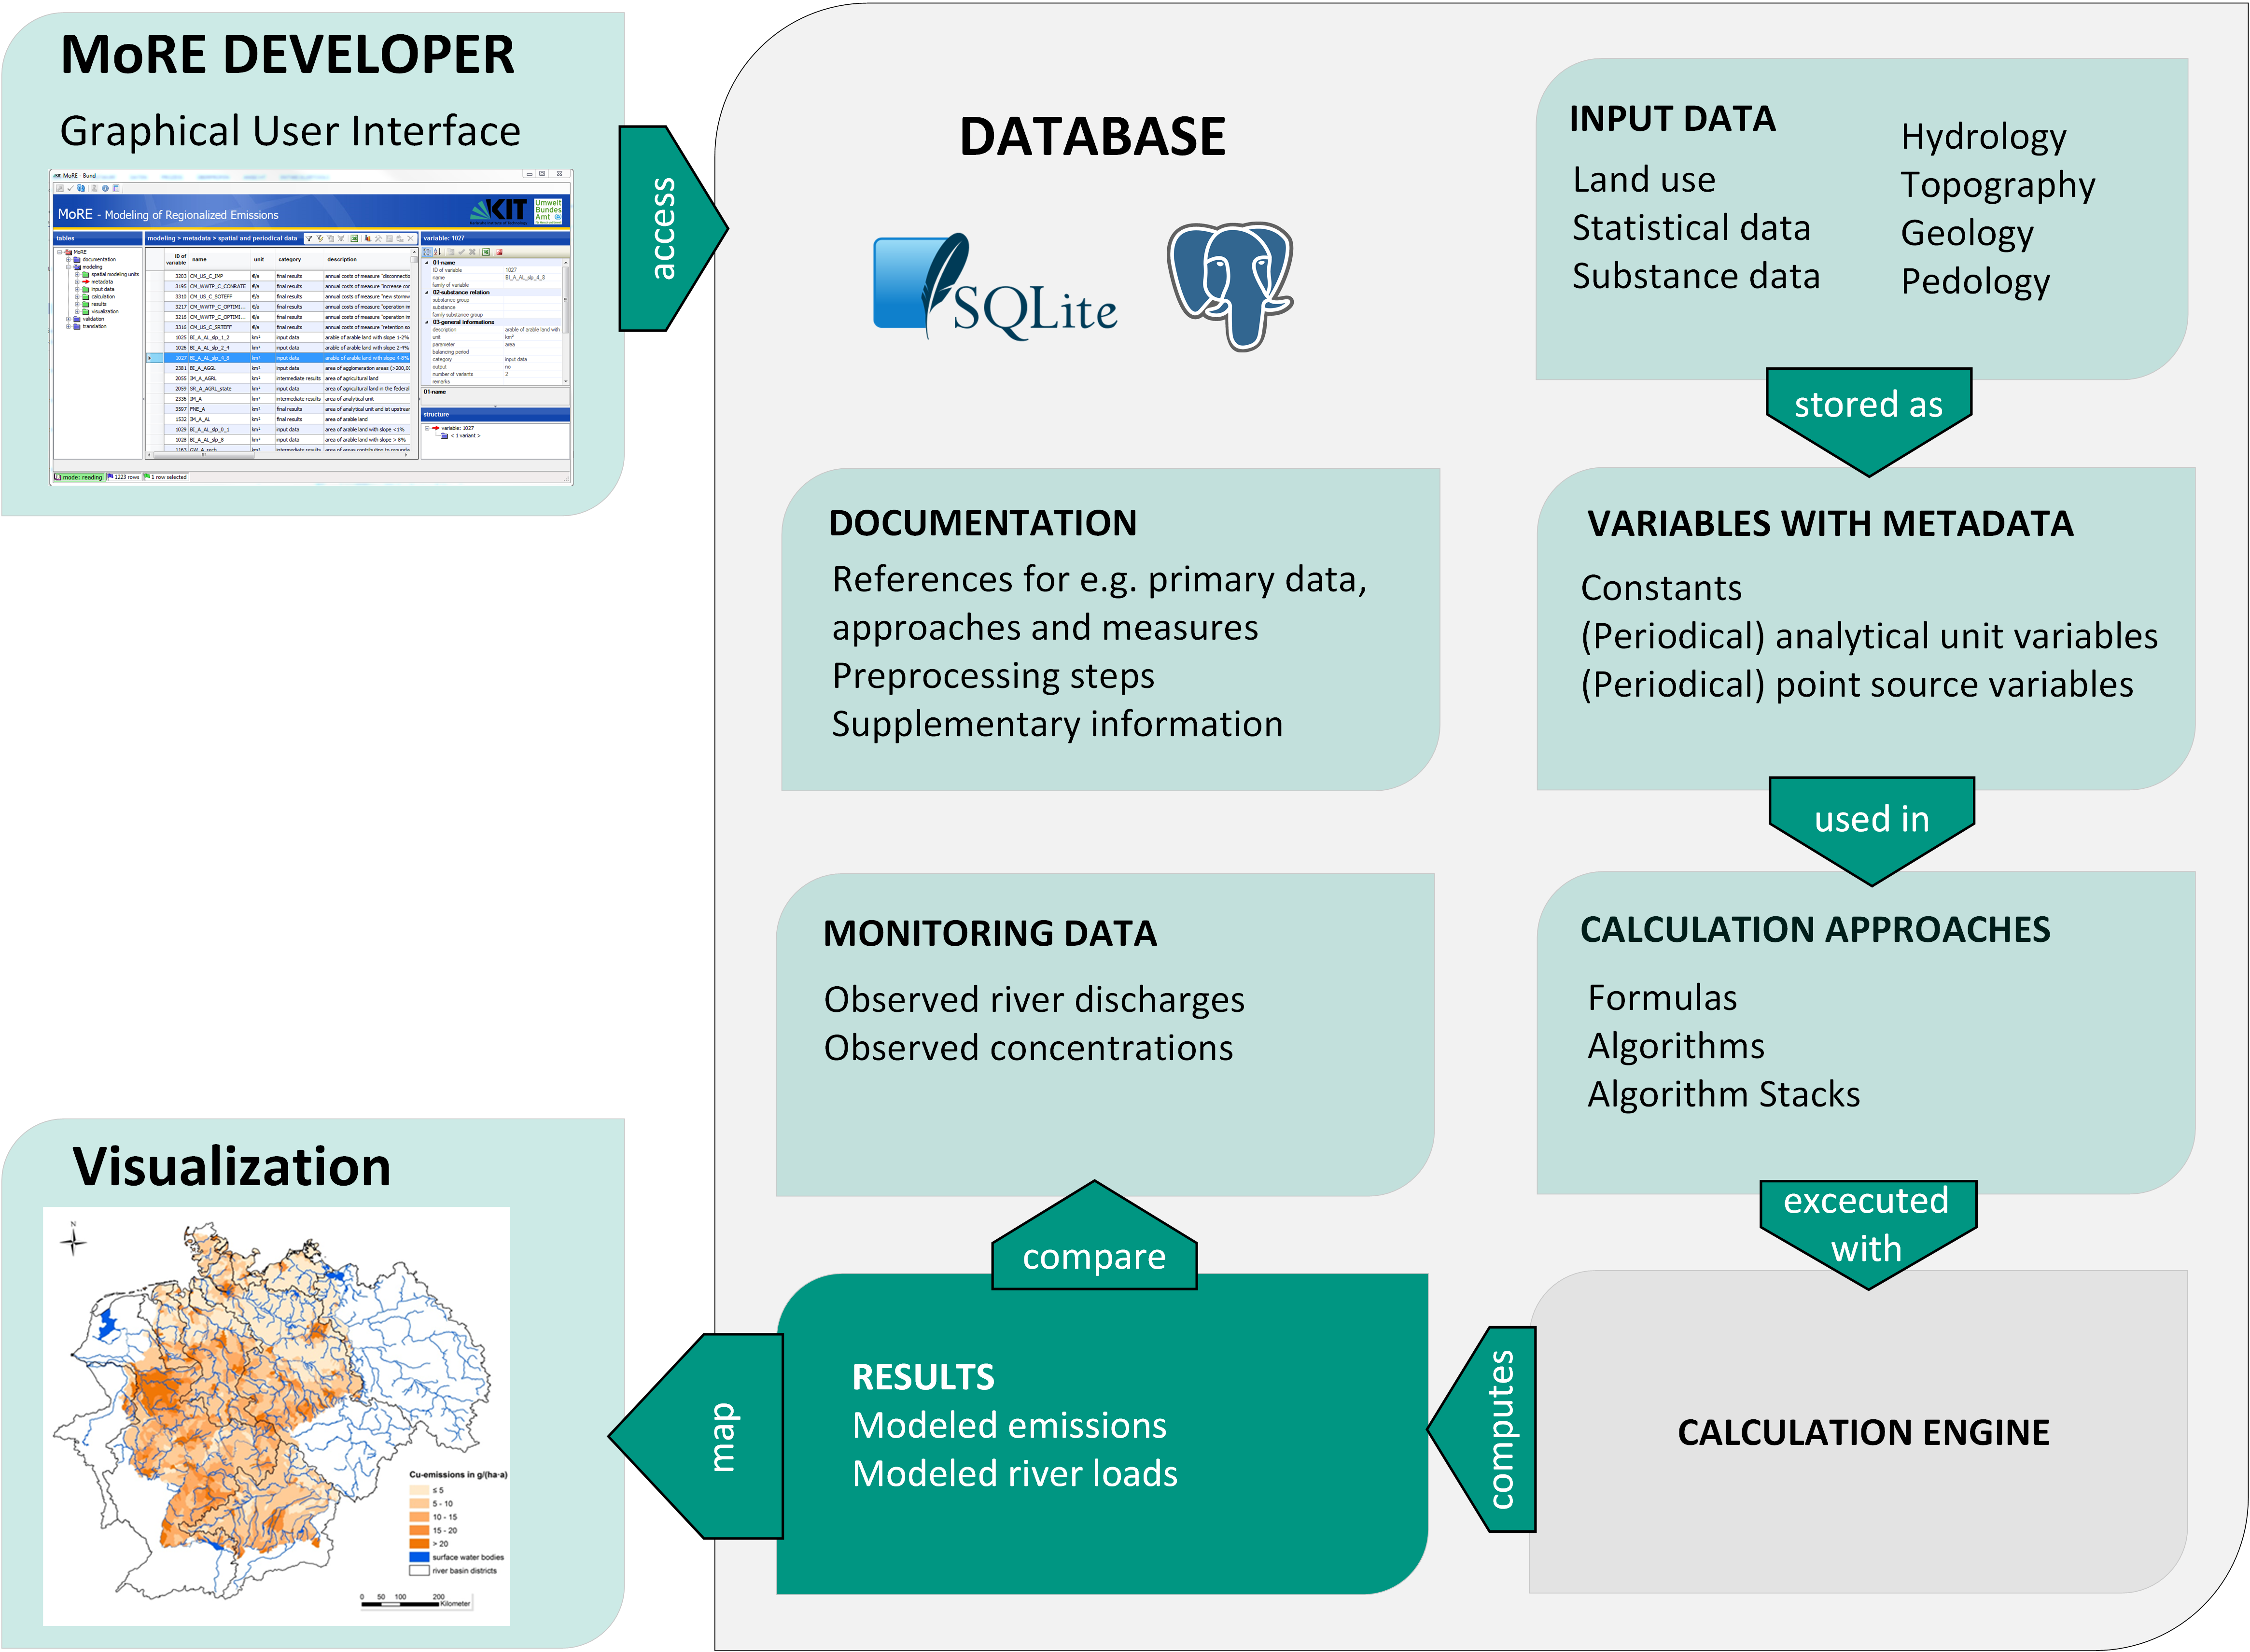
MoRE is built on a PostgreSQL database in order to store the large datasets required for modeling on a meso scale (cf. graphical abstract). The database content can be accessed, edited, and extended via MoRE Developer. Modeling can be launched via a calculation engine which is incorporated in MoRE Developer with a dynamic linkage to the database. The database of MoRE contains all information for modeling emissions and the validation of the modeling results (e.g., the spatial modeling units, all variables, input data, and results with the according metadata). The modeling approaches are written in the database in plain text. All modeling results can be exported in XML files from MoRE Developer.
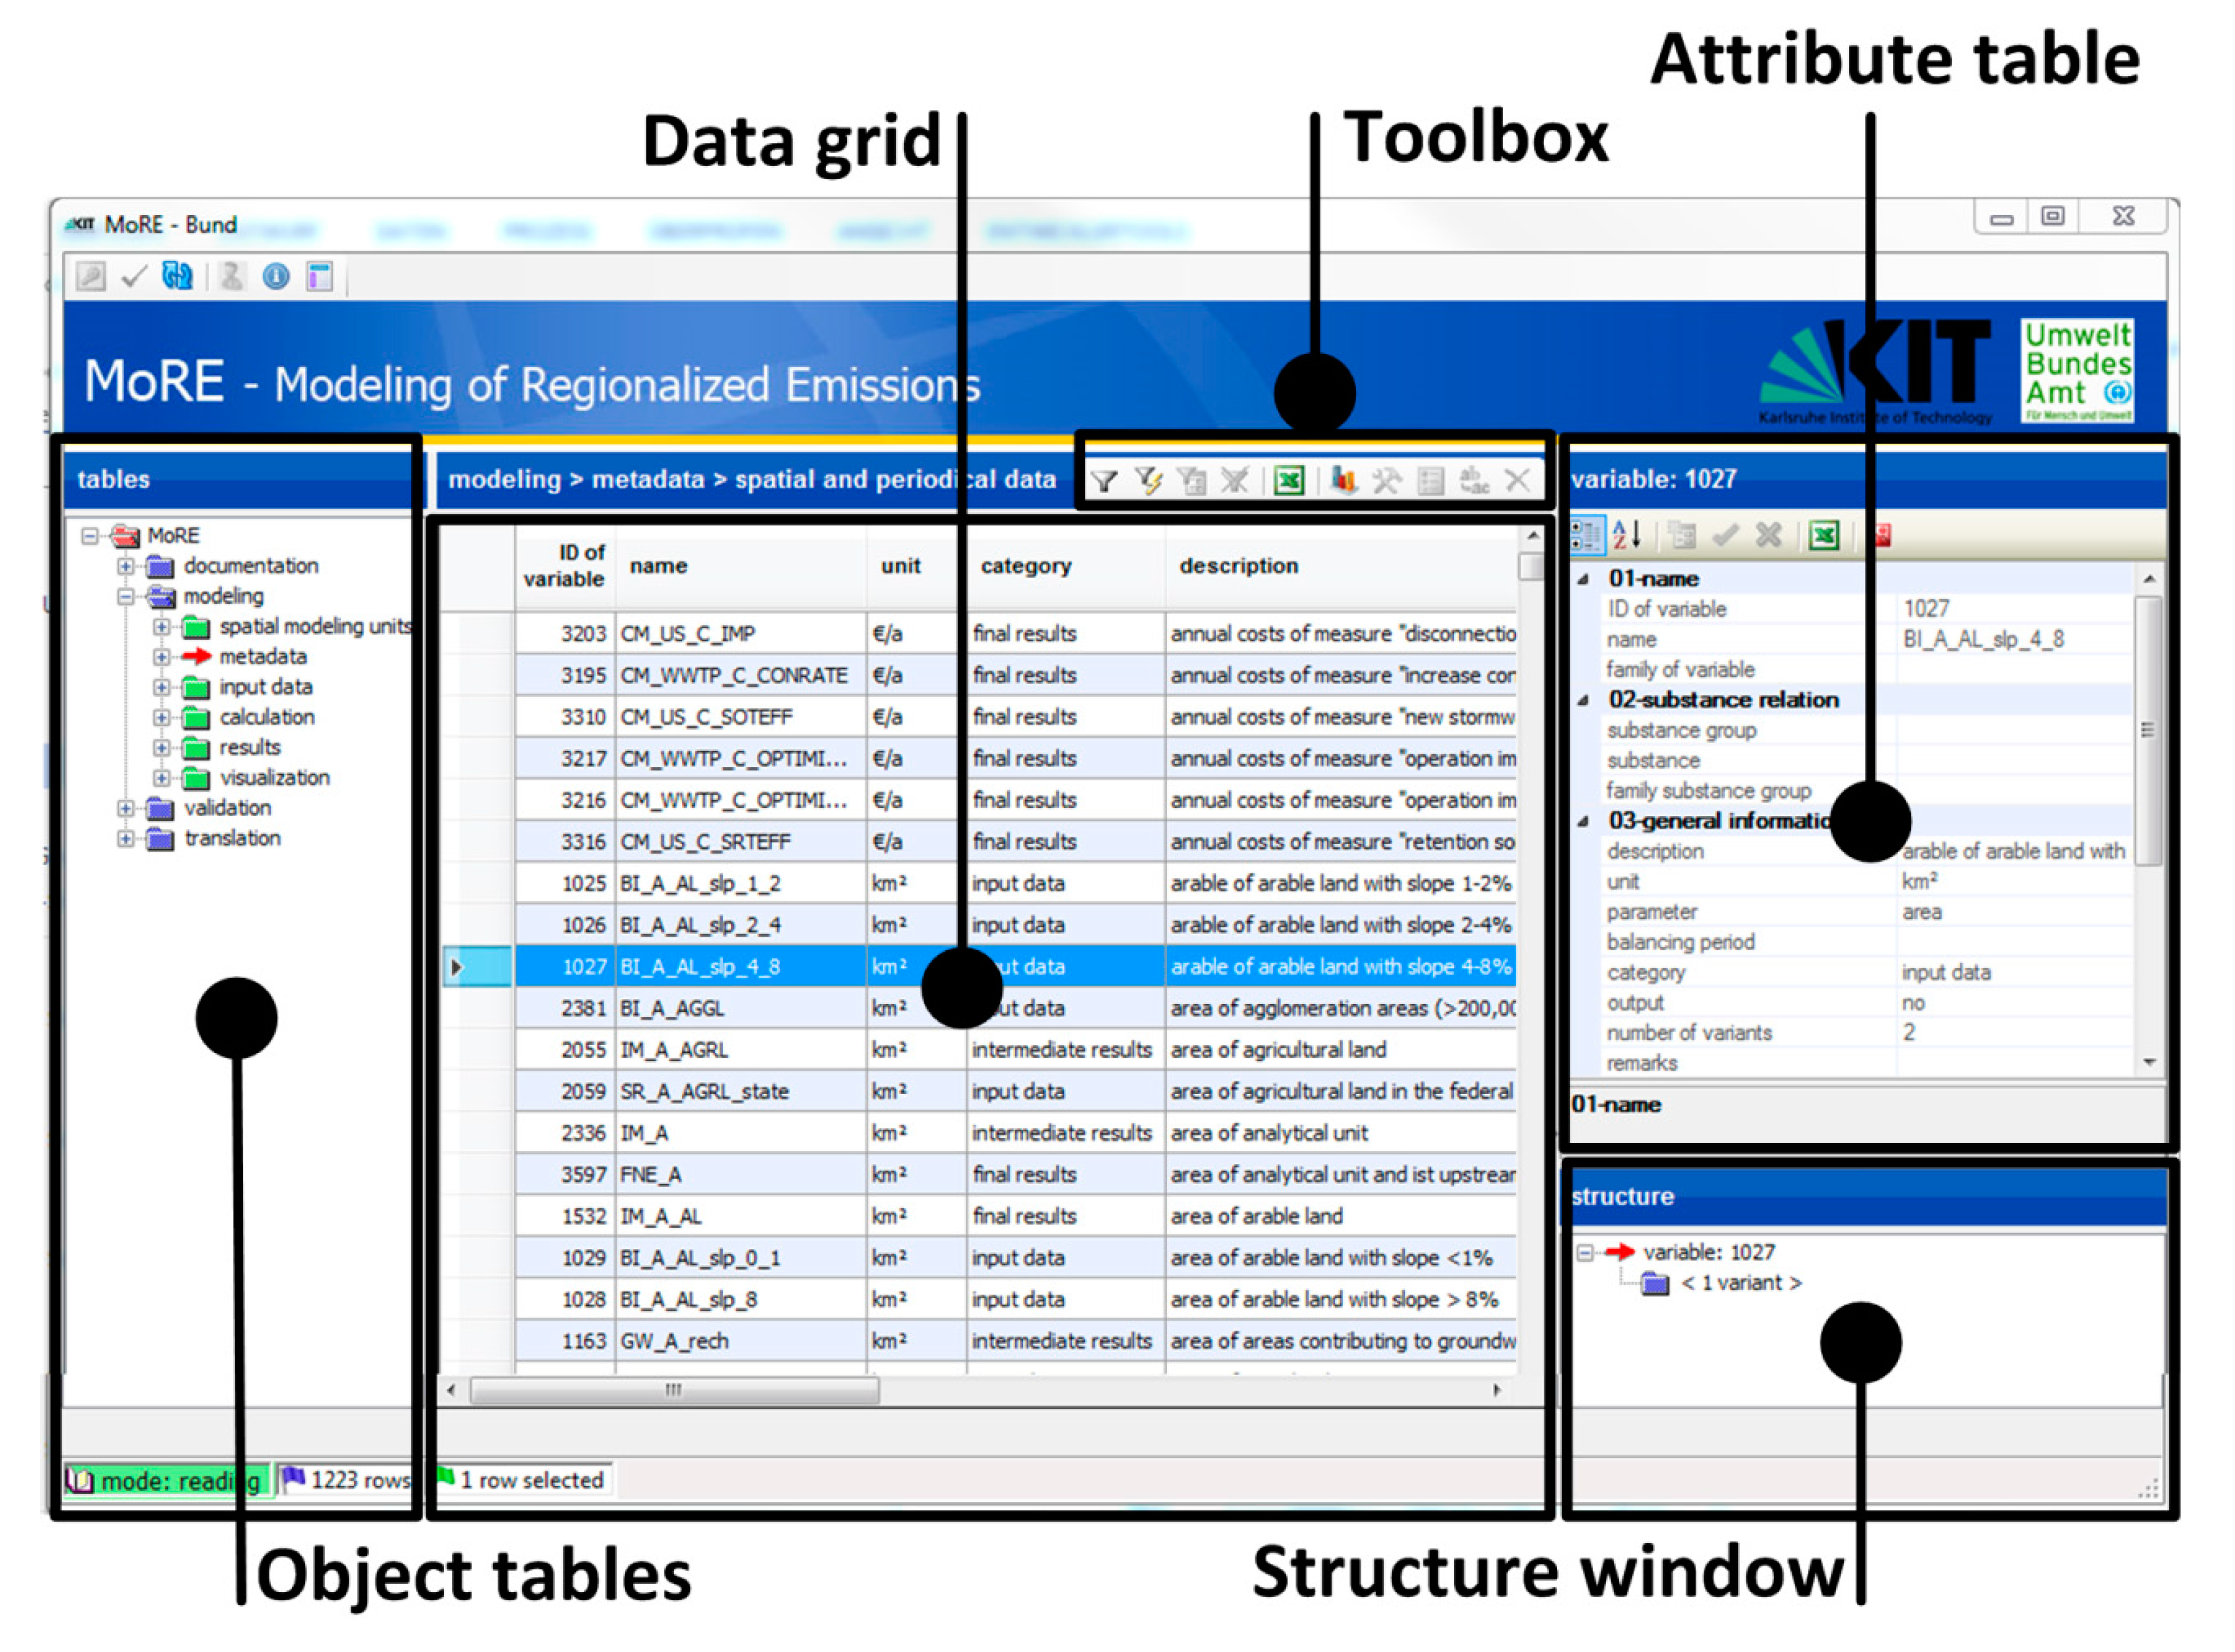
Figure 2 shows the graphical user interface of MoRE Developer. The data from the MoRE database are displayed in object tables, which are grouped in different modules (modeling, validation, and documentation) and arranged in a tree structure (
Figure 2, left). The records from a selected object table are displayed in the data grid (
Figure 2, center). On the right side, an attribute window (top) and a structure window (bottom) are arranged, which show additional information about the record selected in the data grid. This includes access to related documents, for example, with graphical documentation of the calculation approaches (flowcharts) and R scripts for post-processing. The toolbox integrated in the data grid enables the user to execute various tasks, such as filtering data, outputting a table, or launching a model run. The calculation engine is an independent unit of the MoRE system and programed in C# as a generic tool. It determines the logic structure of the database and its tools. Thus, the users can modify the content of the database (i.e., input data, modeling approaches, substances) without having any programing skills.
MoRE can either be operated by multiuser access using a network connection (with a PostgreSQL database) or as a single user application on a PC (with a SQLite database). Detailed information about all components of MoRE are available in the MoRE manual [
17].
3. Emission Modeling with MoRE
Within the scope of research projects funded by the German Environment Agency [
6,
10,
12,
13,
15,
16], the MoRE database has been supplied with the necessary input data and approaches to model substance emissions to all German river basins as well as river basins shared with neighboring countries. In the following sections, the modeling steps are shown using the example of annual copper emissions in Germany for the period of 2012 to 2014. The primary output of MoRE are substance emissions per analytical unit and year.
3.1. Spatial Basis for Modeling and Temporal Resolution
Analytical units represent the smallest areal modeling units in MoRE (i.e., there is one value for each input and output variable and time step per analytical unit). This means each analytical unit is treated as homogenous with respect to these variables, such as land use distribution, population density, and water balance. The number and size of analytical units can be freely selected according to the spatial resolution of the input data available. Analytical units should typically represent hydrological (sub)catchments with a defined outlet such as the junction of two rivers. There may be exceptions when the quality of input data available varies considerably within a natural watershed, which is often the case when they are cut by political or administrative borders.
Selecting the right size for analytical units is a compromise between simplicity and meaningfulness of the model. With a large number of small analytical units, raster based modeling could be approximated, but it is difficult to find suitable input data sets for all emission pathways, which leads to an unnecessary bloating of the model. Raw data needs to be preprocessed (i.e., averaged or interpolated) on the level of analytical units before it can be imported to the database. Consequently, too large analytical units lead to a loss of spatial accuracy, which may undermine a precise emission source assessment.
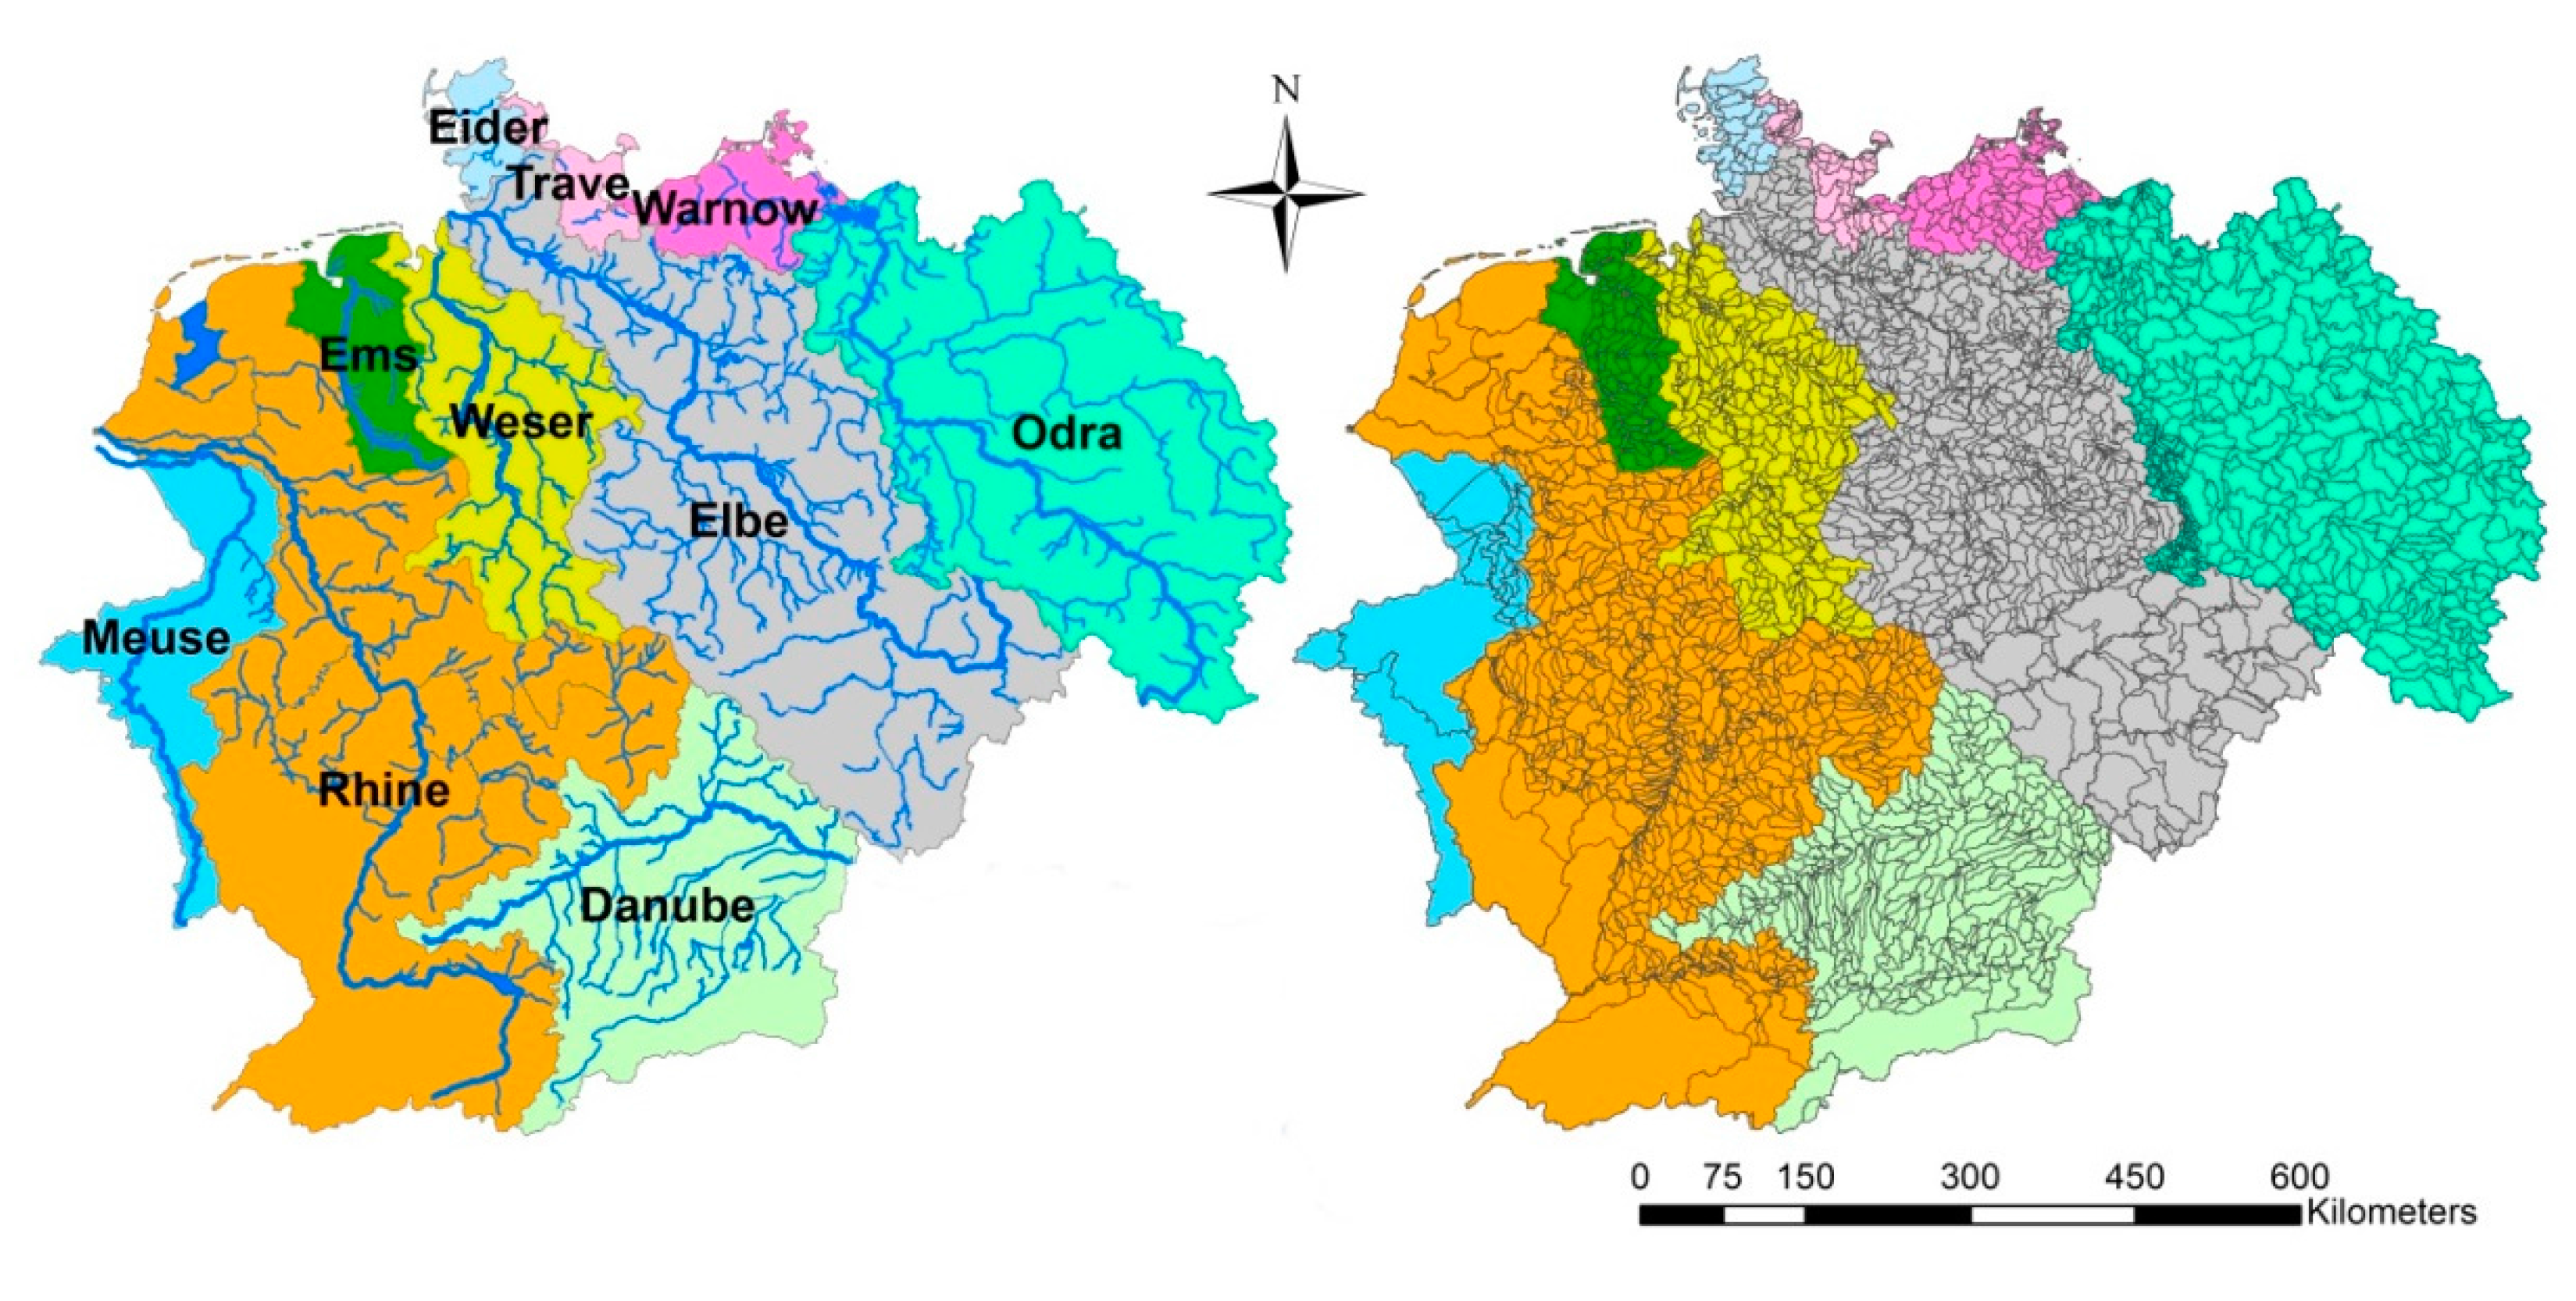
The currently largest application of MoRE covers the river basins of Germany, including the associated catchment areas in other European countries with a total area of about 660,000 km
2 (
Figure 3). Based on the drainage network, the area is divided into about 3500 analytical units which can be aggregated to different administrative levels or subunits of river basins. The average size of an analytical unit is 135 km
2 in Germany and 190 km
2 for the whole area.
The analytical units are implemented in MoRE by supplying an object table with information such as the analytical unit’s unique ID, name, total area, name of the main river, and the ID of the downstream analytical unit. Based on this information, a runoff routing can be generated in MoRE. This routing is used to aggregate results as river loads.
In addition to areal data, MoRE can administer point data such as municipal wastewater treatment plants, industrial direct dischargers, and abandoned mining sites. For any point source, the emission can be calculated individually and specific measures can be implemented. For calculating the total emissions of an analytical unit, the emissions of all point sources within an analytical unit can be aggregated. The temporal resolution for modeling results in current MoRE applications is one year. In this state, the model is used for the evaluation of annual substance emissions of (sub)catchments. Similar to the spatial resolution, the current temporal resolution allows it to provide input data for large modeling areas, to identify relevant emission pathways and “hot spot” regions, and to fulfil the reporting obligations of the EU. Nevertheless, current efforts aim towards an improvement of both temporal and spatial resolutions for the modeled regions. Regarding the temporal scale, monthly time steps are pursued. The spatial resolution will be improved by incorporating a river module into MoRE with the goal of being able to model emissions and (mean) substance concentrations for individual river segments. Again, the realization is mostly controlled by the input data availability.
3.2. Input Data
Input data for MoRE is derived from primary data. Since analytical units or point sources are the spatial reference for modeling, all general and substance-specific input data have to be assembled on this level by means of (geo-) statistical methods prior to import into the MoRE database. Depending on their temporal and spatial variability, five classes of input data can be stored in MoRE:
constant data (constants), e.g., share of the dissolved fraction in inhabitant-specific heavy metal loads
spatially variable data (analytical units variables), e.g., mean slope of an analytical unit
data varying in space and time (periodical analytical units variables), e.g., atmospheric deposition rates
point data (point source variables)
point data varying in time (periodical point source variables), e.g., substance concentrations in the discharge of waste water treatment plants
Emission modeling with MoRE requires basic input data on land use, hydrology, geology, pedology, and statistical data like population density and distribution, and capacity of combined and separate sewer systems. In addition, substance-specific input data like substance concentrations in the topsoil or deposition rates are needed. For the application example of copper, the necessary input data are listed in
Tables S1 and S2 in the Supplementary Material. Detailed information on the calculation approaches for heavy metals are described in [
6,
10,
13].
MoRE is applied for the quantification of emissions within large areas such as river basins, federal states, or states. The acquisition of high quality input data covering such areas is not always possible, either because such data does not exist, or because it is not made available by the responsible agencies in the modeling region. As MoRE can be run with few input data, it can also be used to quantitatively show the data gaps.
3.3. Modeling Approaches
The approaches in MoRE are grouped into emission pathways which are summed up to quantify total emissions.
Table 1 shows the pathways for copper emissions and the most important input data sets needed for the regionalization.
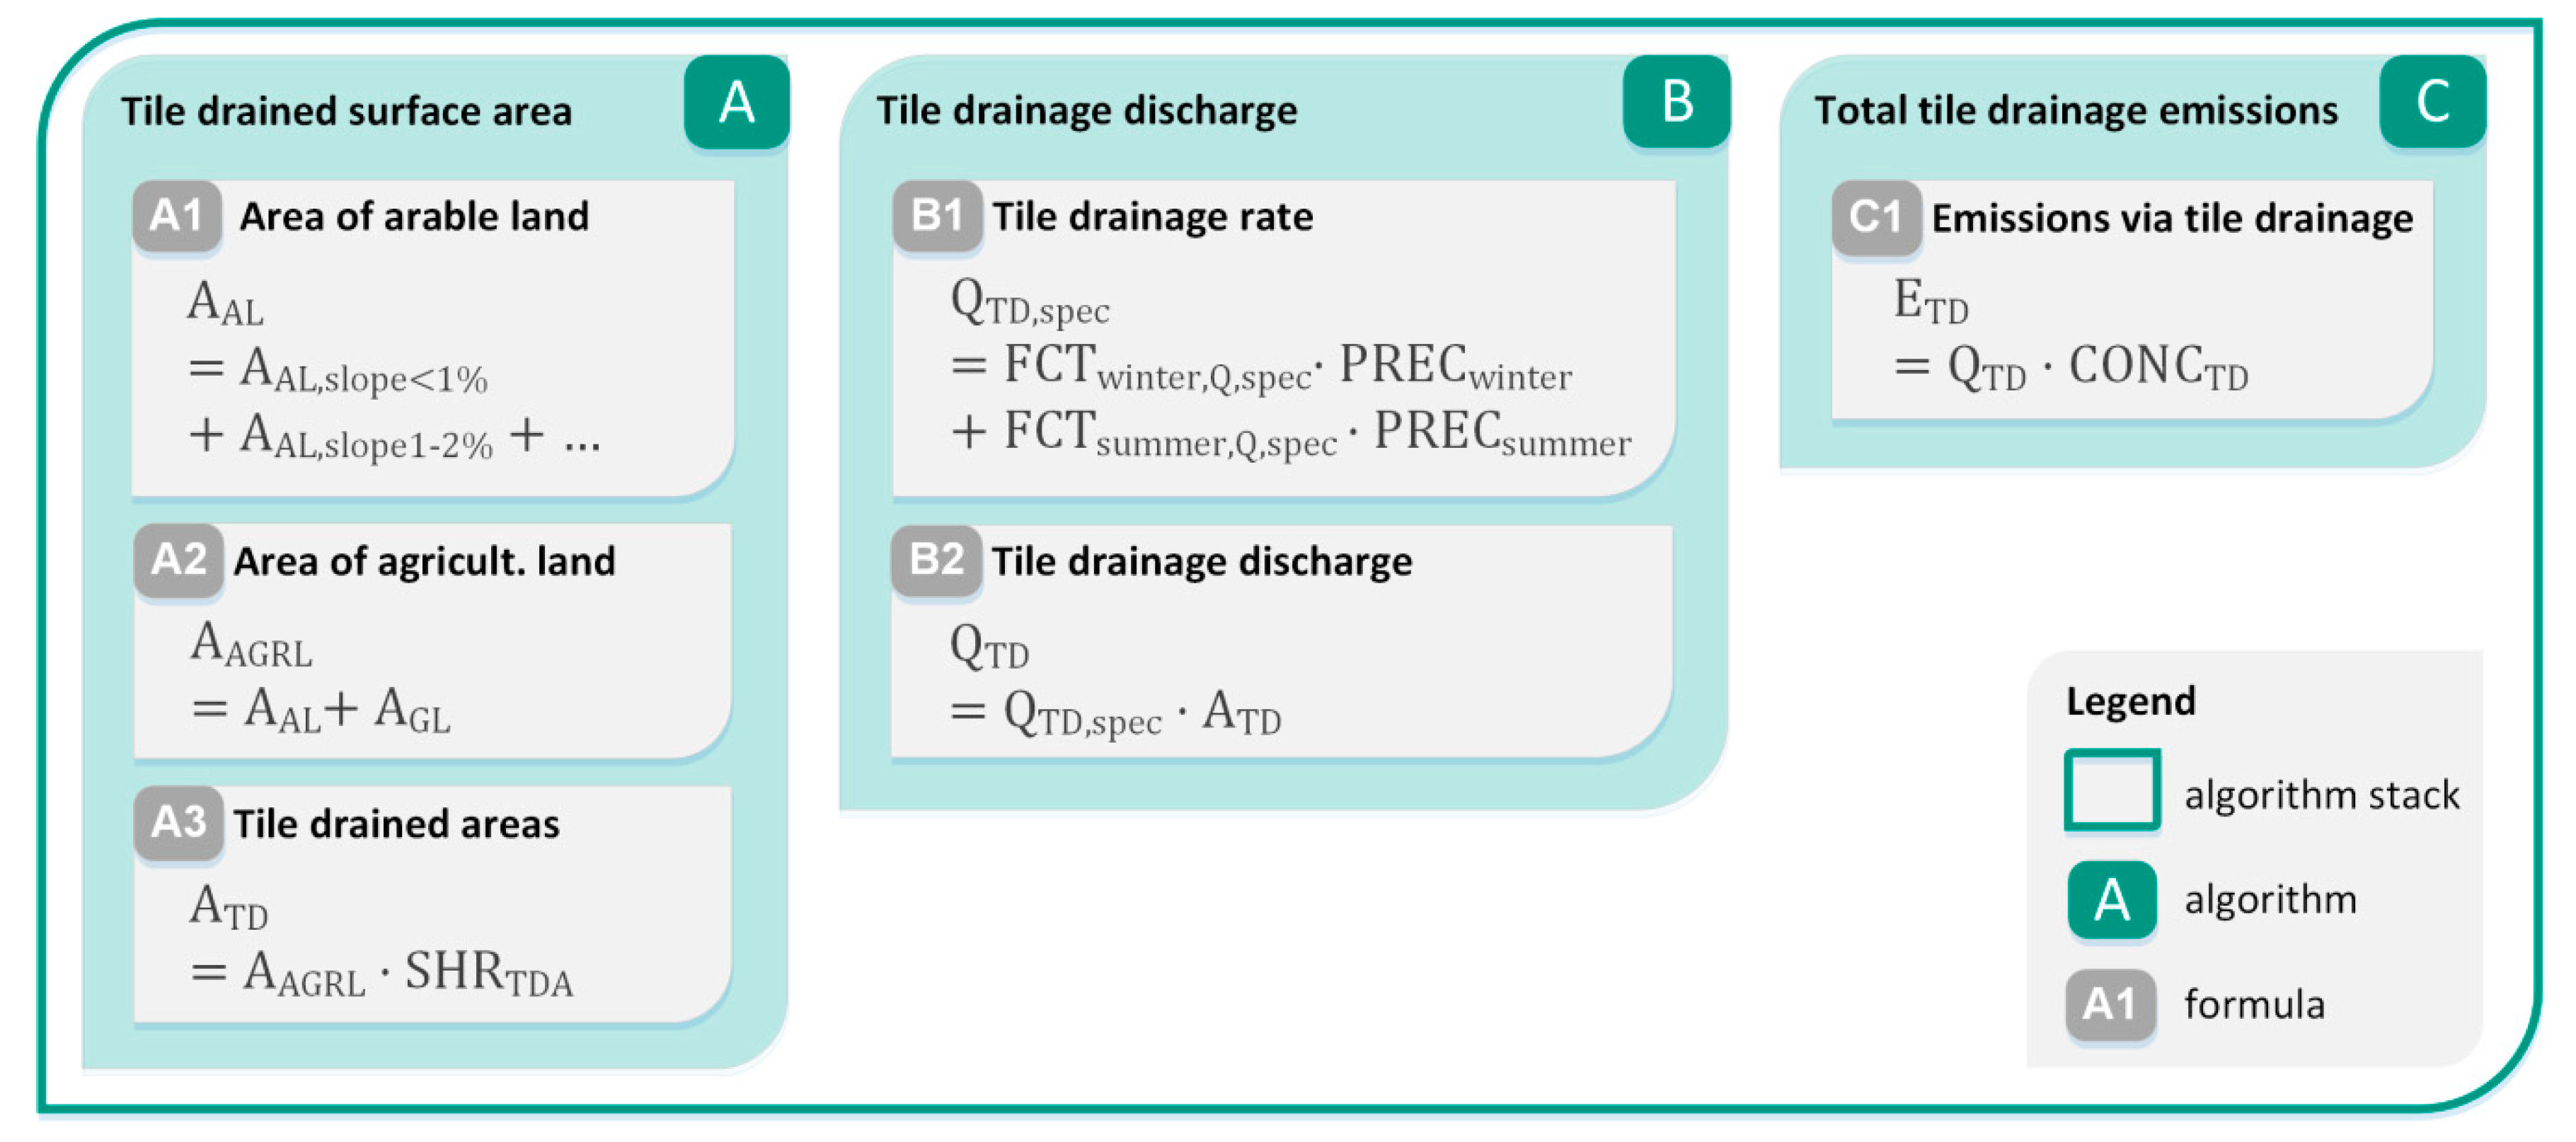
The modeling approaches are arranged in algorithm stacks which represent an emission pathway (cf.
Section 1) and consist of one or more algorithms in a defined order. Analogously, each algorithm consists of one or more formulas in a defined order (
Figure 4, left side). References for approaches can be entered in the documentation module and linked to the corresponding formula.
Figure 4 shows the hierarchic implementation of modeling approaches using the example of emissions via tile drained areas. Emissions via this pathway (algorithm stack) are determined by calculating the tile drained areas, the tile drainage discharge, and the emissions in subsequent algorithms. To assess tile drained areas, formulas for calculation of the area of arable land and agricultural land are used. Tile drainage discharge is based on the calculation of tile drainage rates.
Emissions can either be calculated independently for each analytical unit, or emissions can be summed up along the runoff routing to model river loads. Intermediate and final results are written in the database. The examination of intermediate results is useful to identify sub-pathways that account for high emissions or to evaluate whether input data and algorithms are appropriate. If required, the user may also generate a detailed protocol including all calculated variables and the input data used.
3.4. Results for the Application Example
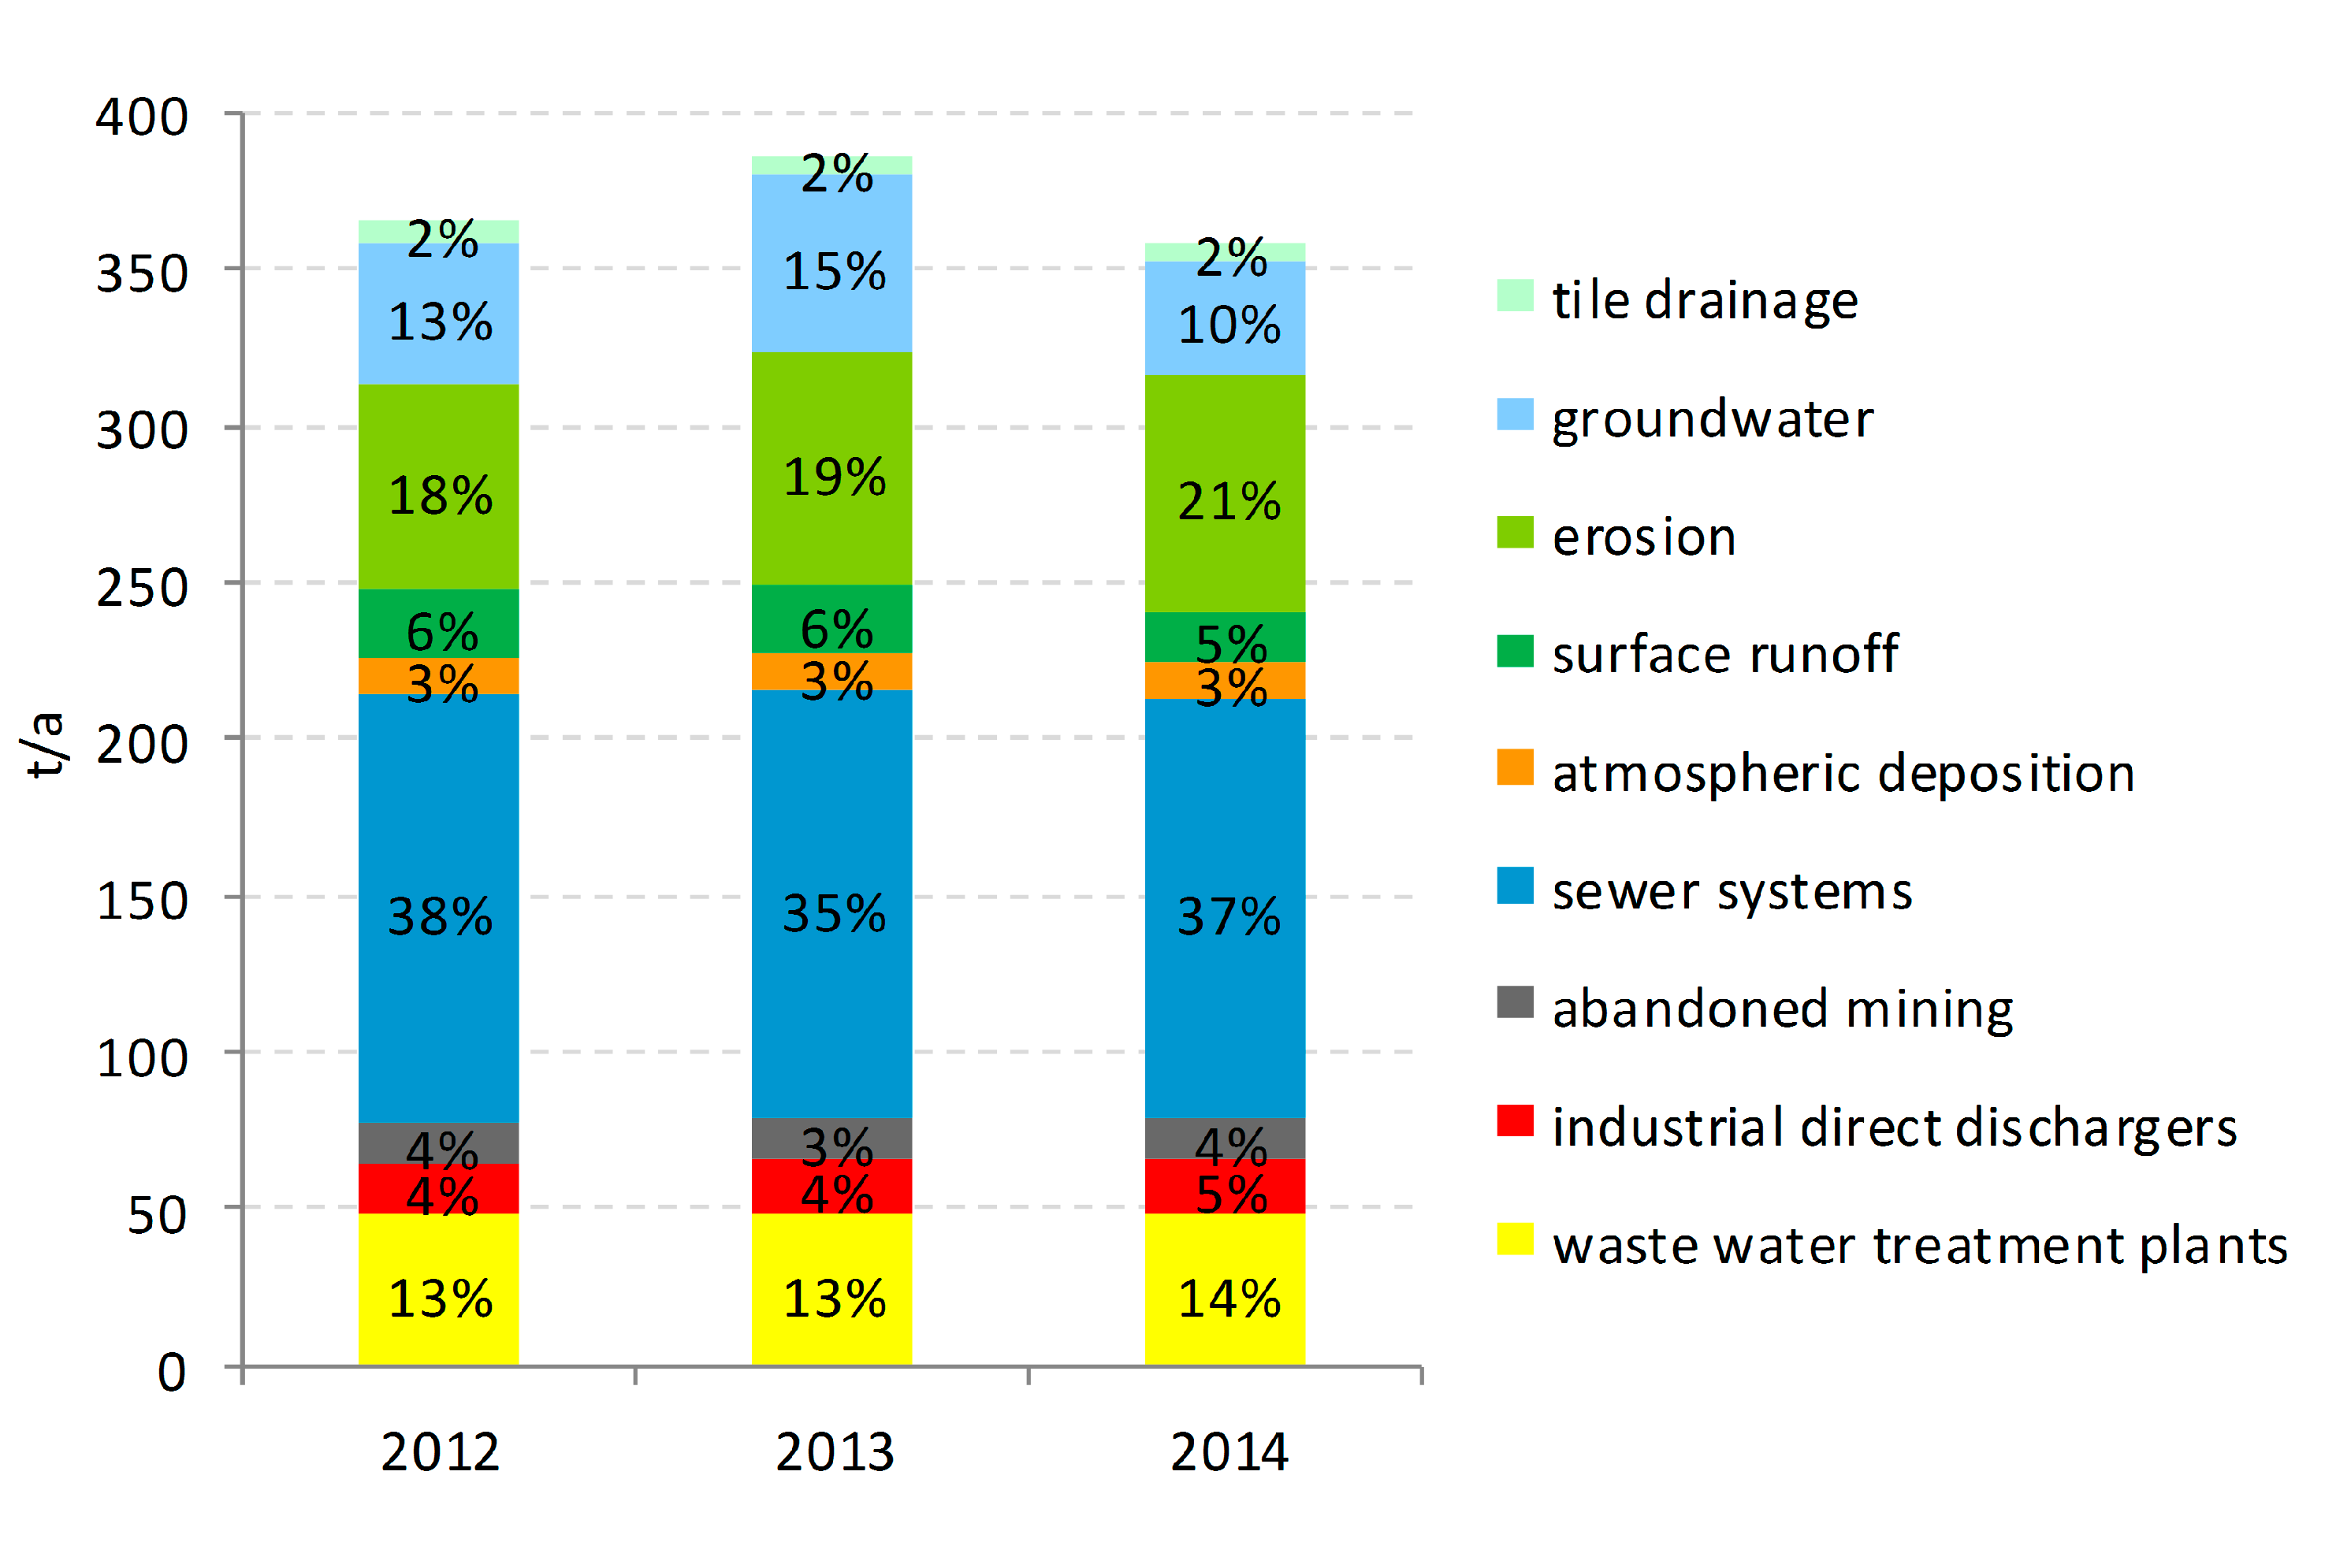
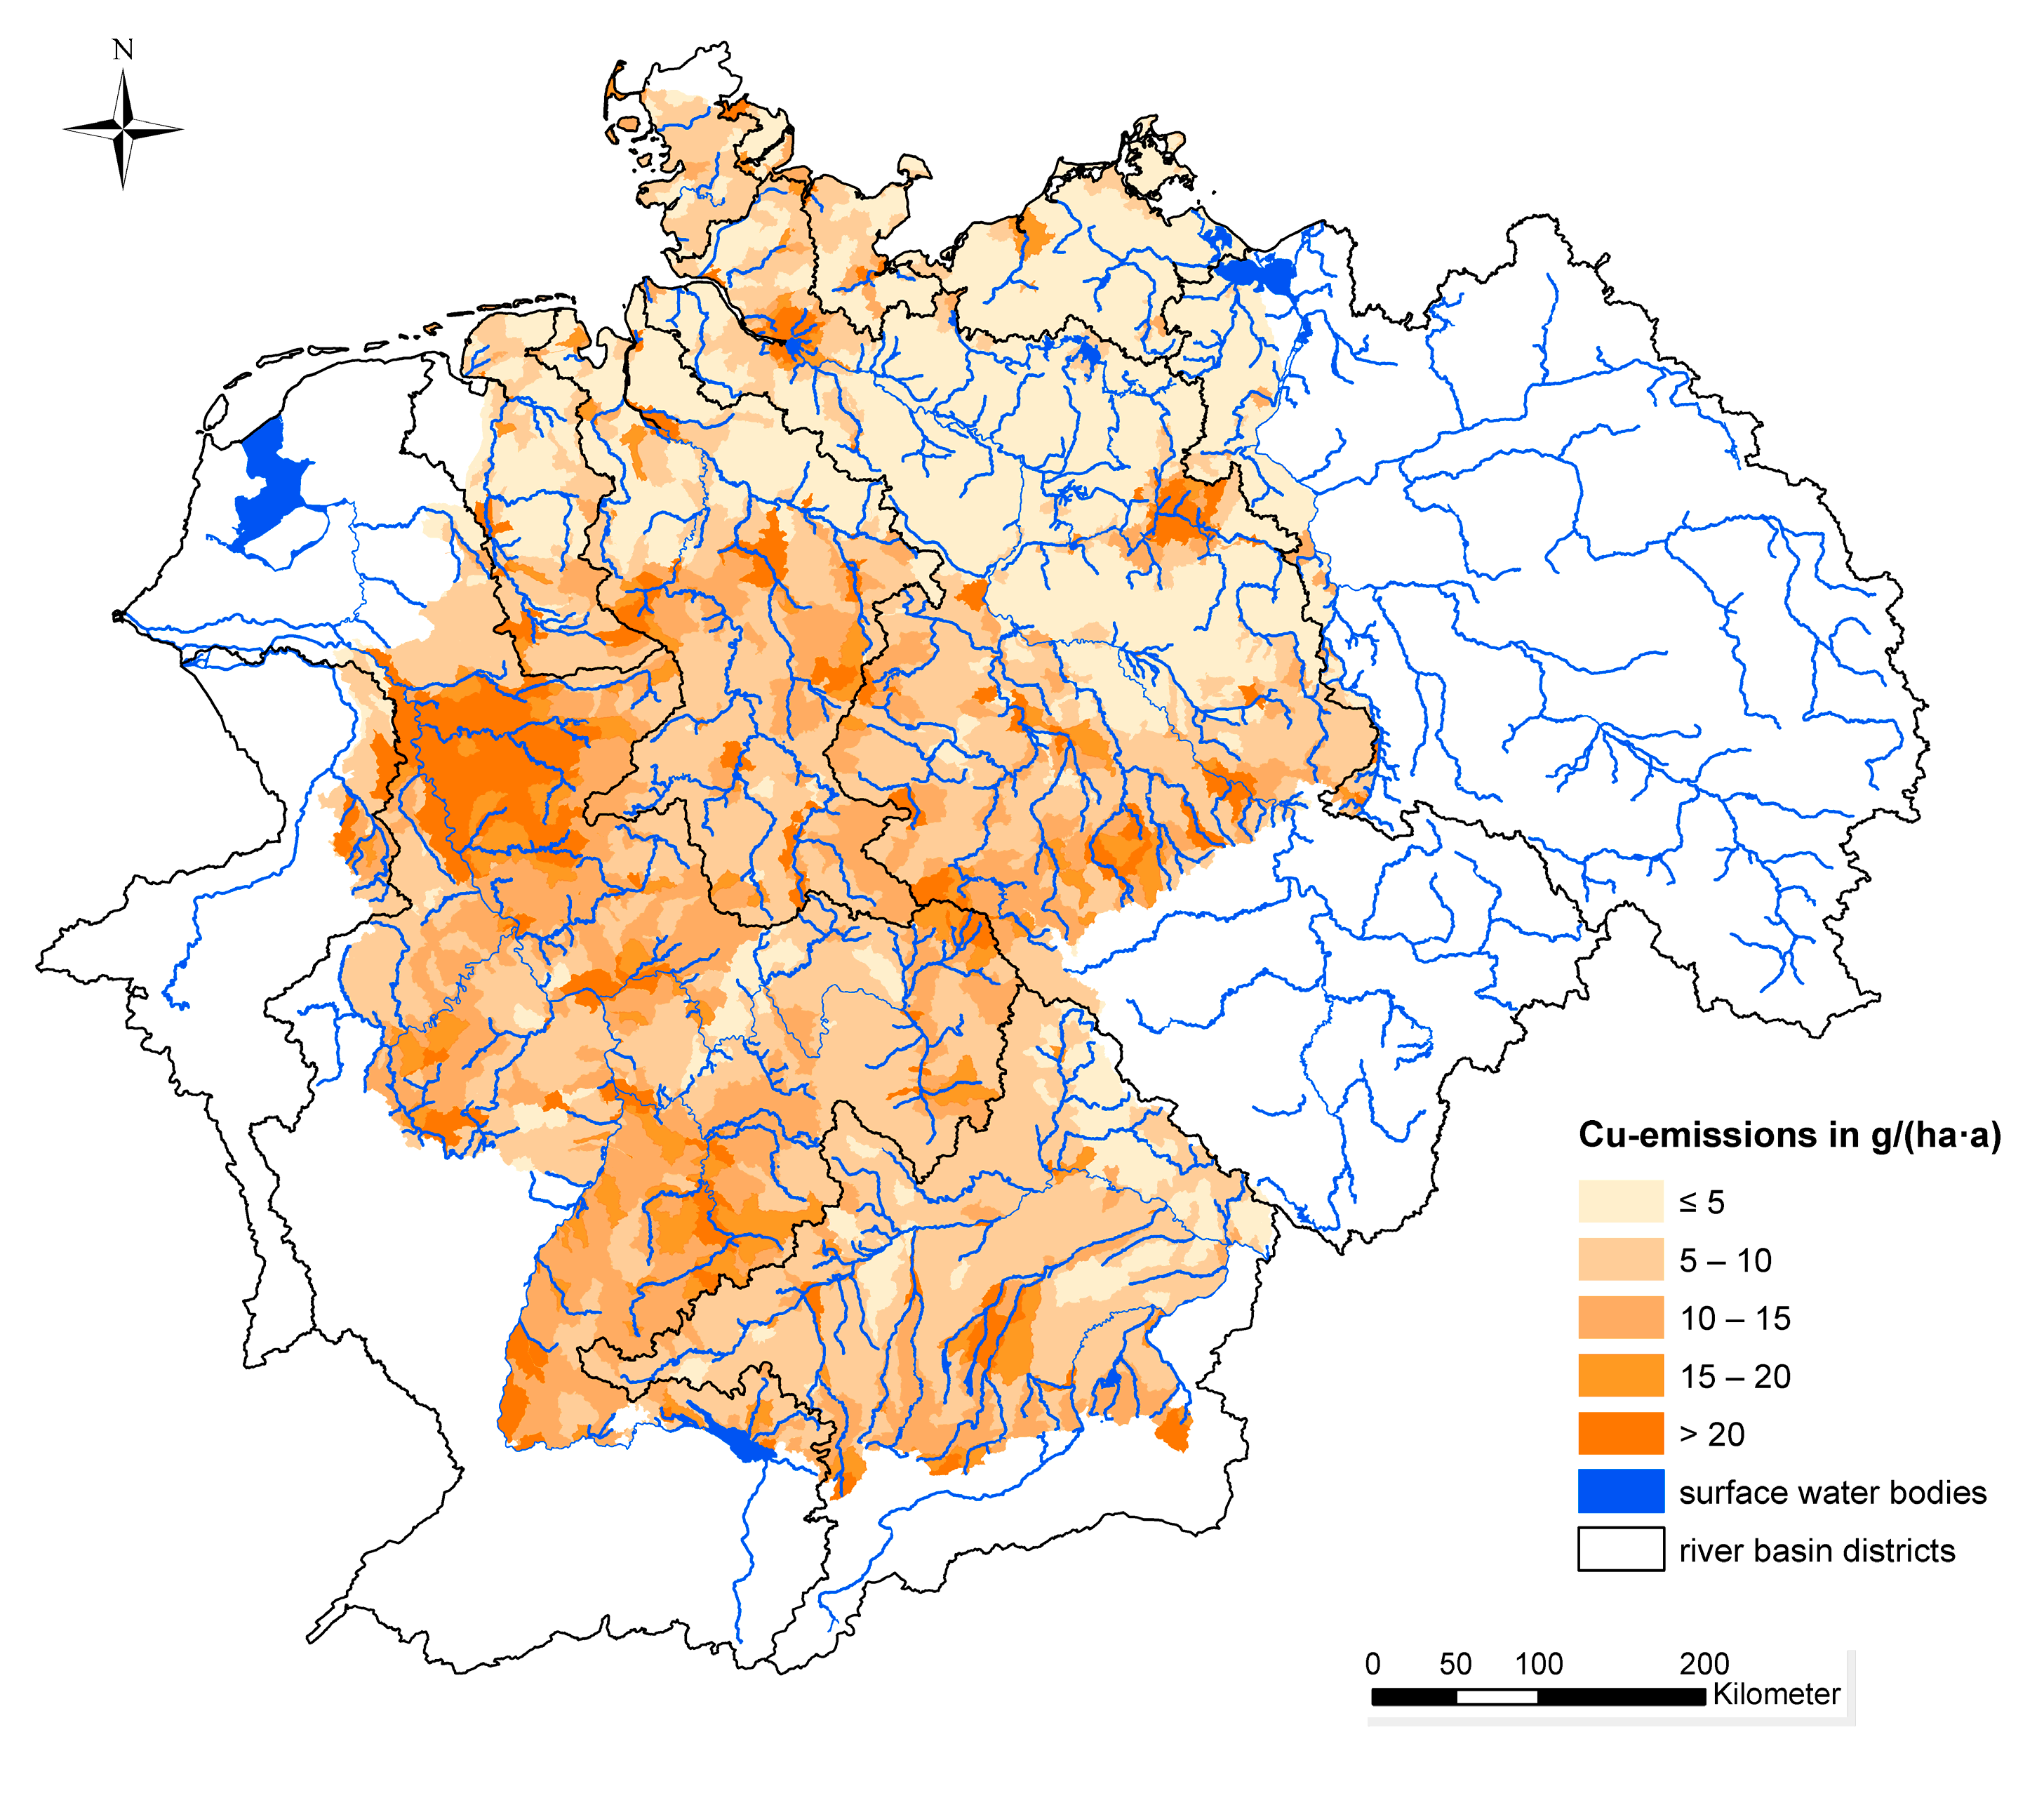
Figure 5 shows the total copper emissions as well as the relative relevance of the different emission pathways into surface waters in Germany for the period 2012–2014. In this period, an annual average of about 370 t of copper was emitted into German surface waters. The copper emissions show a specific distribution pattern resulting from its main sources and environmental behavior: copper is used in large quantities in the urban environment and can be used as an indicator of surface runoff from impervious areas. Consequently, around 37% of the total emissions result from storm water discharges and combined sewer overflows, and another 13% are emitted via the effluent of municipal wastewater treatment plants. That makes urban areas the most relevant emitters. The spatial distribution pattern of area-specific copper emissions for the period 2012–2014 is shown in
Figure 6. According to the relevance of the urban pathways, the large cities like Hamburg Berlin and Munich and agglomeration areas like Ruhr Gebiet are clearly visible.
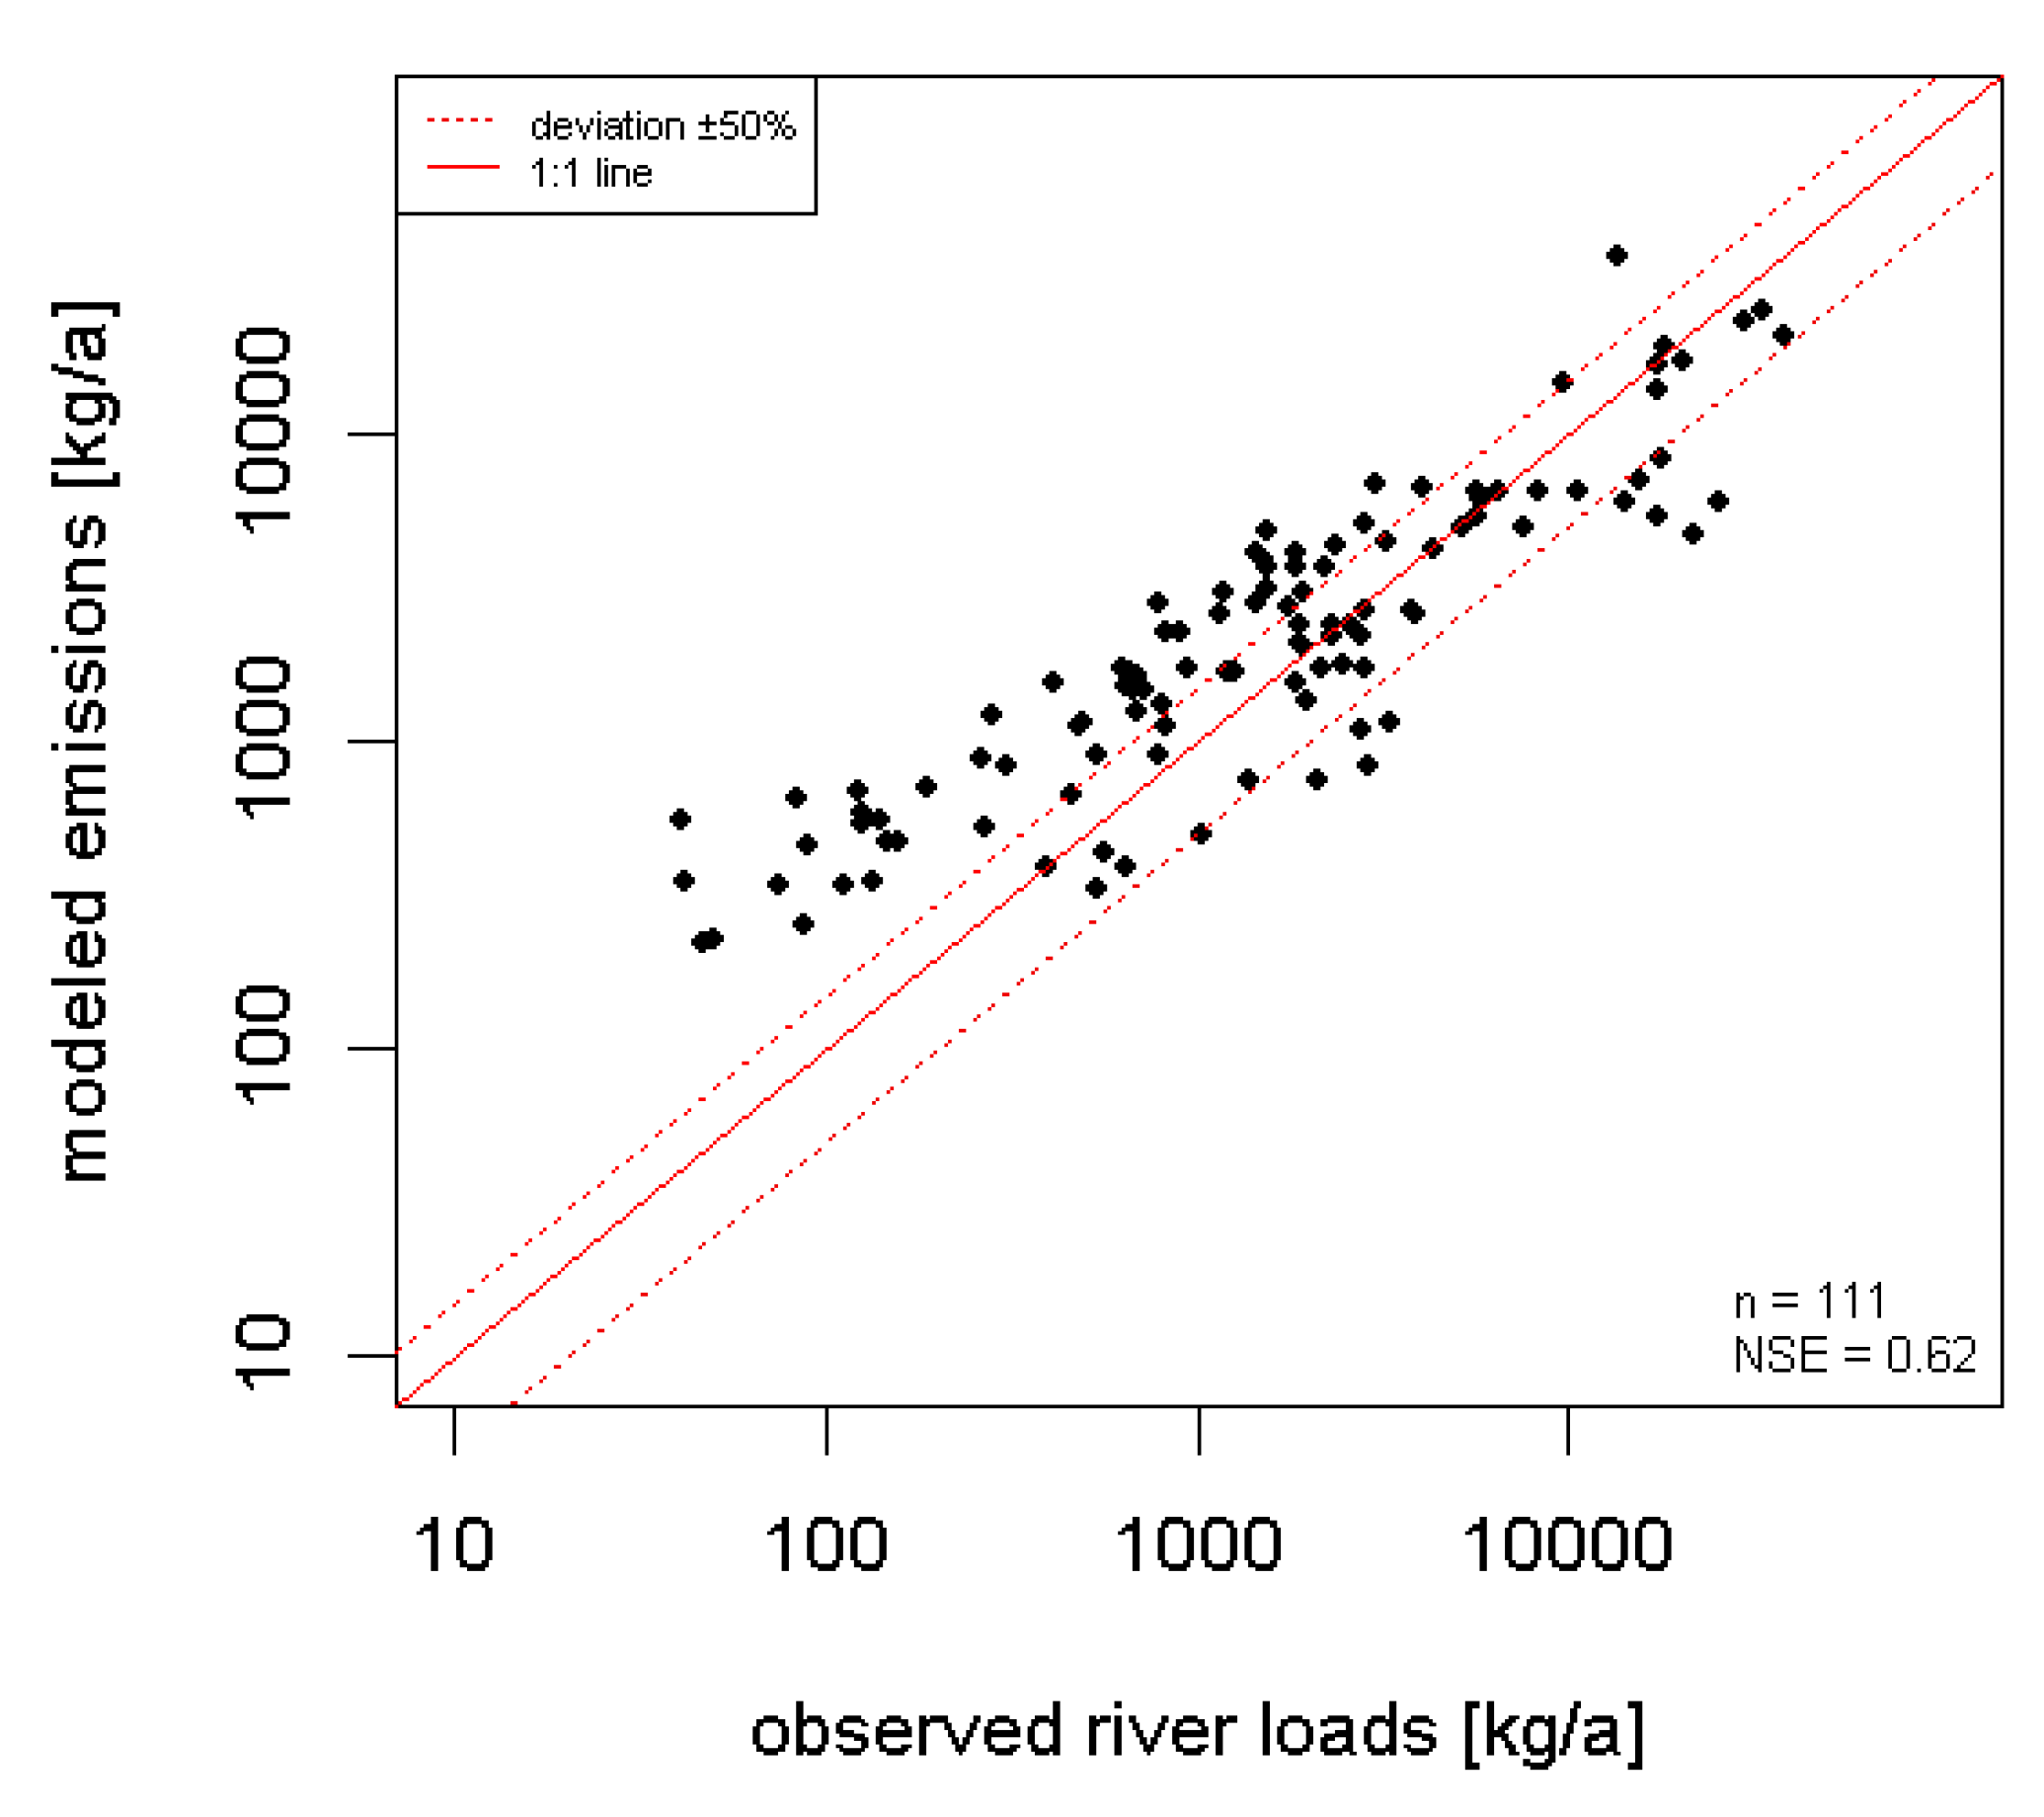
3.5. Comparison of Modeled Emissions and Observed River Loads
Copper emissions from analytical units are summed up along the runoff routing. Observed river loads are calculated from monitoring data on measured discharge and substance concentrations.
Figure 7 shows a graphical comparison of modeled emissions and observed river loads for copper at the outlets of analytical units whose catchments are exclusively located in Germany. Additionally, the Nash Sutcliff Efficiency coefficient is calculated as a measure of model efficiency. The deviation between modeled emissions and observed river loads is larger for quality monitoring stations with smaller catchments. In those cases, the modeled emissions are considerably higher than the observed river loads. Different reasons are likely to be responsible for this effect. Because of the higher flow dynamic of small catchments and the fact that concentration data are generally available as single measurements, it is more likely to miss flood events which causes an underestimation of the observed river loads [
18,
19]. On the other hand, specific infrastructure or land properties may cause mass fluxes that cannot be properly estimated on the basis of averaged input parameters. Taking into account that the quantification of the river loads is accompanied with considerable uncertainties due to the small number of available copper concentrations and that possible retention processes were not accounted for, the results suggest that the approximation of the real emission situation for copper is reliable.
The MoRE model is a bottom-up model whose results totally depend on input data and implemented processes, but not on a calibration. The lack of a calibration is the result of two reasons. Firstly, calibration can only be performed if trustworthy control measurements are available. For diffuse emission pathways, the parameters used for calibration are the in-stream concentrations and fluxes of the modeled substances. However, such measurements are not available in the required resolution for, as an example, all of Germany’s river basins. Even for the streams which are covered in monitoring programs of the respective agencies, the sampling rate is usually too low to provide good mass flux estimates (cf. [
18]). Secondly, observed river loads neither tell us the provenance of emissions nor the relevance of the individual emission pathways. Because of this, MoRE results are simply compared to observed river loads, knowing that there are uncertainties in both approaches.
3.6. Variants and Measures
For certain applications, it is helpful to compare two versions of input datasets of the same variable. This is, for example, the case if the user wants to evaluate the effect of an updated input data set or to assess measures for emission reduction. Using the tools variant manager and measure manager available in MoRE, different variants of input data sets can be stored in the database and can be grouped to combinations of input data sets. Alternative modeling approaches can be created by combining new and existing formulas and algorithms into new algorithm stacks.
In the following example, reduction measures were implemented for sewer systems, the most important emission pathway for copper. The share of citizens in Germany connected to combined sewer systems is 55% [
20]. Nevertheless, the share of combined sewers in the regions with the highest population density stands at more than 70%. Therefore, the improvement of treatment effectiveness in combined sewer systems is assumed to be a measure with a high reduction potential. In the given example the effect of the implementation of storm water filtration plants was tested. The effectiveness of such filter systems is very high and reaches up to 95% for suspended solids [
21]. However, the implementation of these systems is limited due to their high space requirement. Therefore, it is assumed that only 50% of the discharged water can be treated in a filter system.
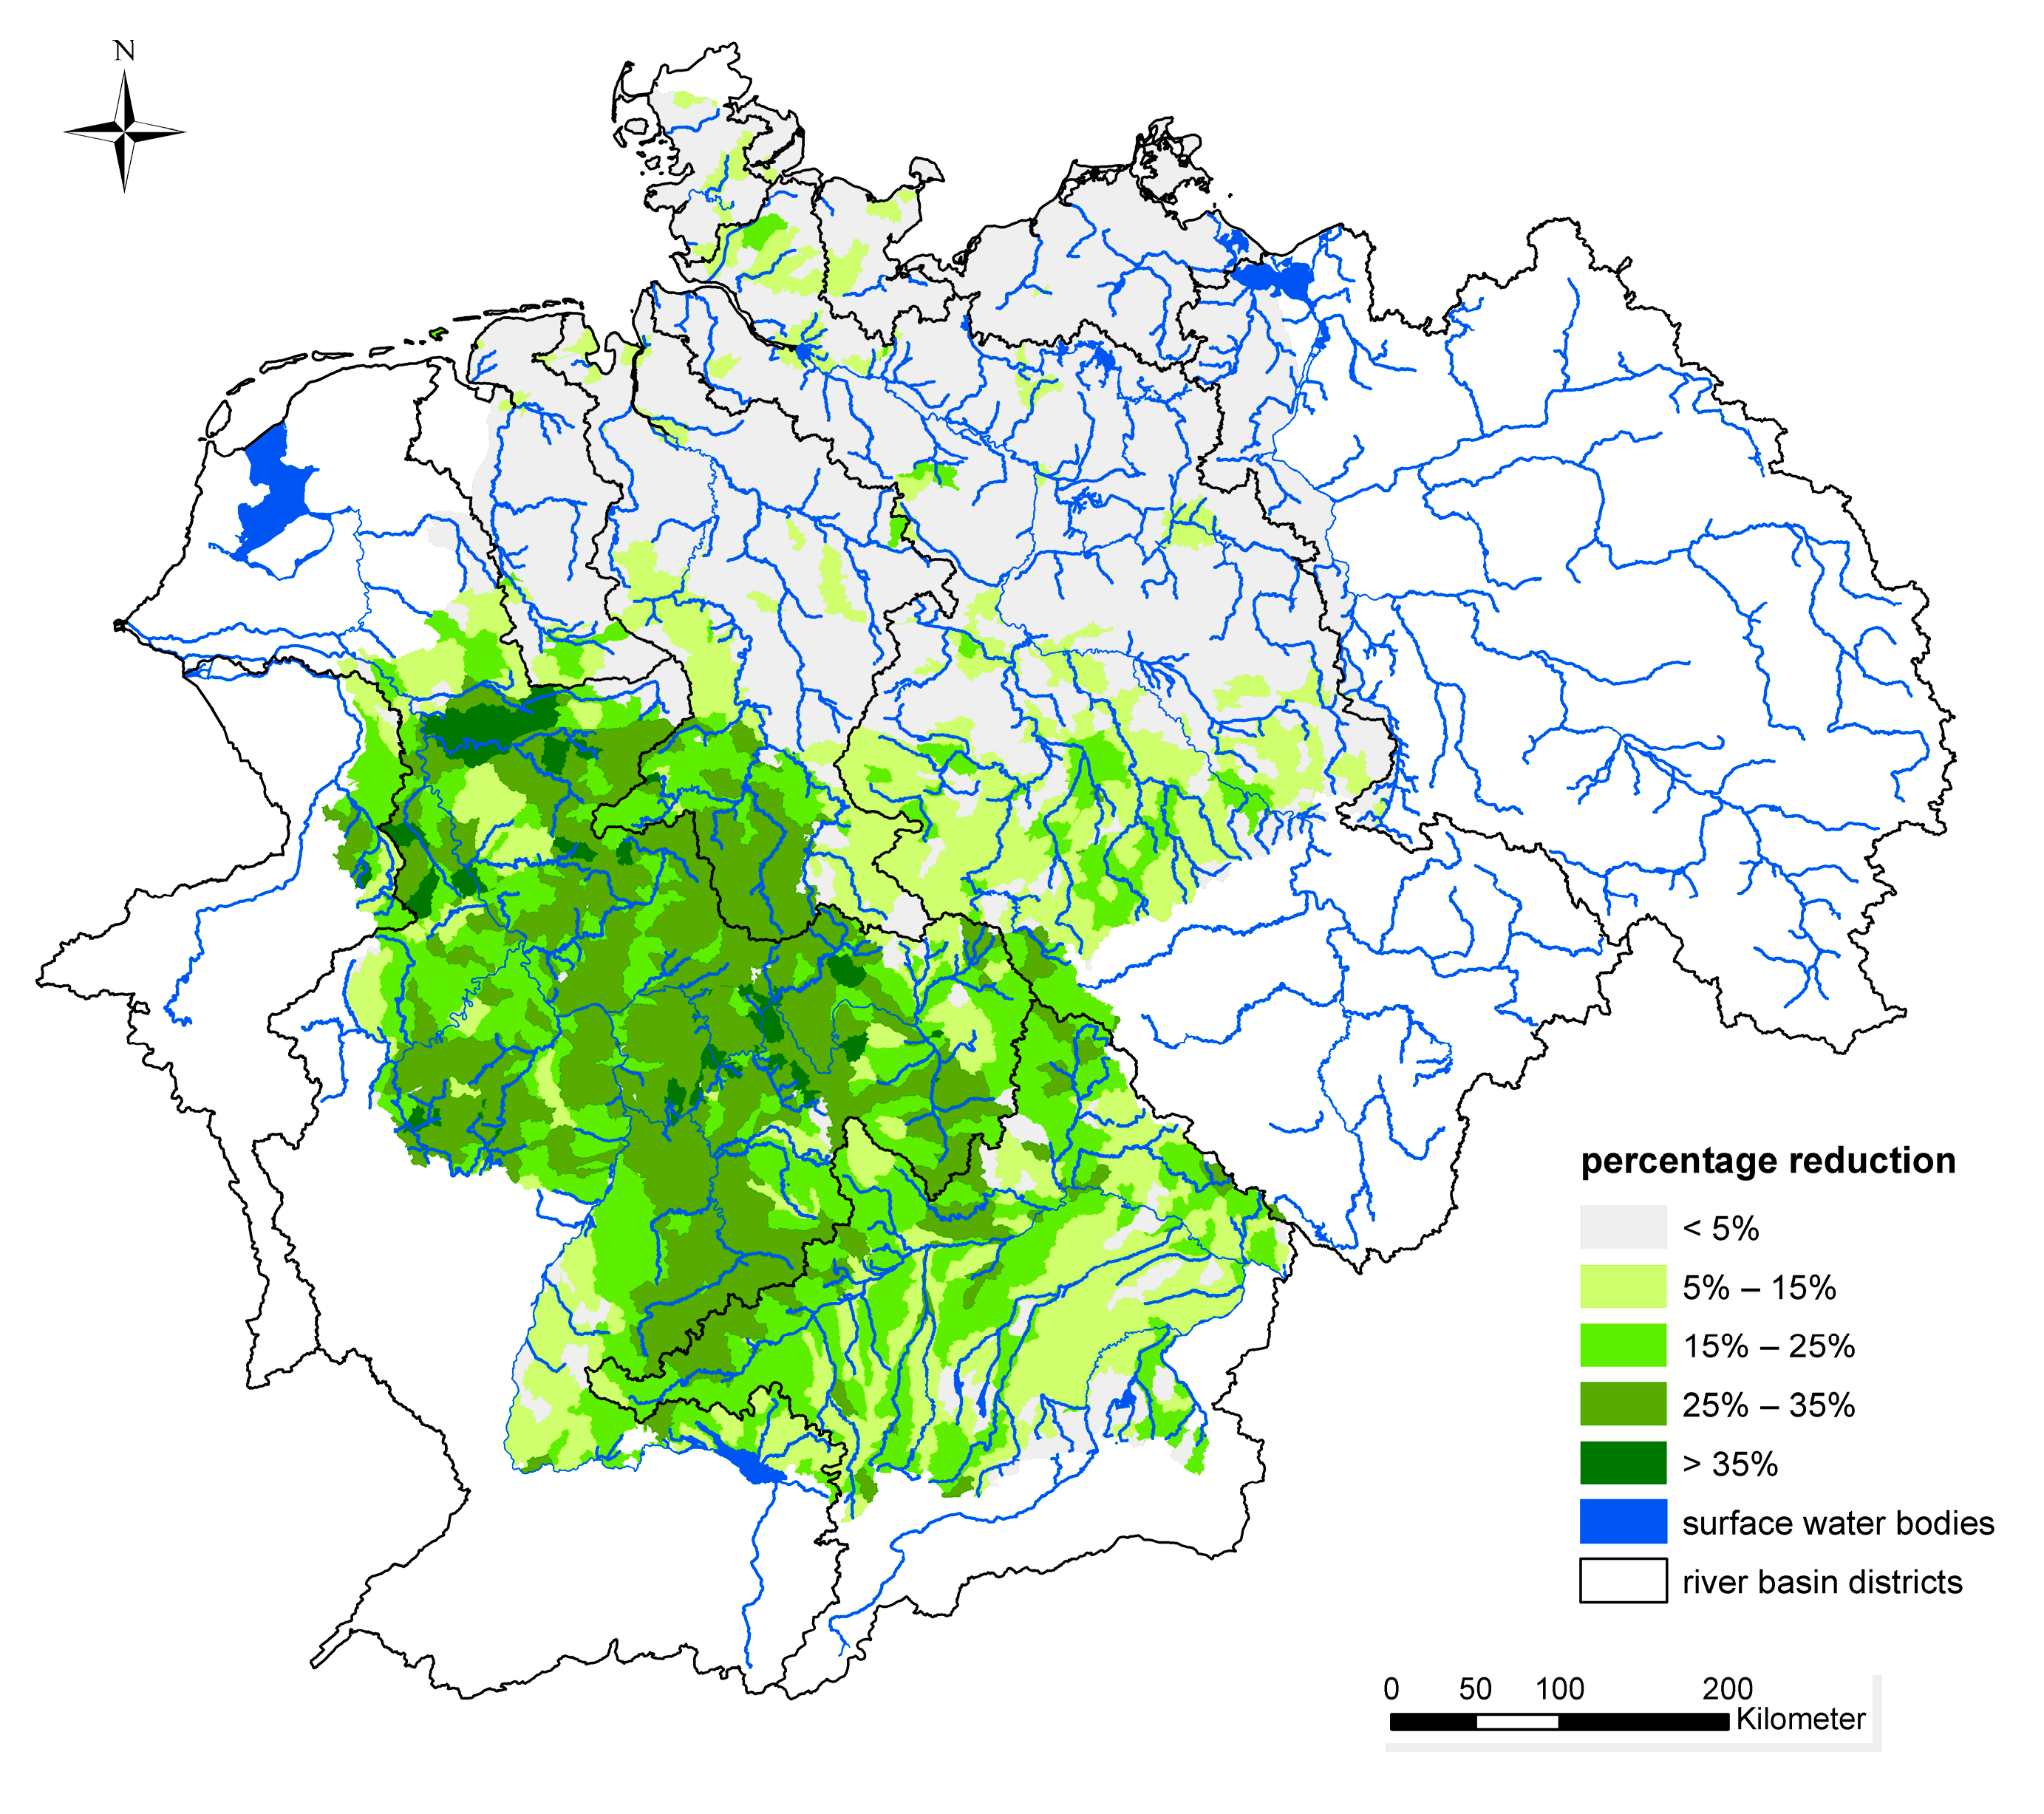
The reduction potential for copper emissions from sewer systems by implementation of storm water filtration is shown in
Figure 8. According to the total copper emissions, the measure in the combined sewer systems for the storm water filtration shows only a low reduction potential of 5%. However, it has to be recognized that the emissions via sewer systems on average were reduced by 14%, and that for some analytical units the reduction rate reaches more than 35%.
4. Summary and Outlook
MoRE is a river basin management system to quantify pathway-specific substance emissions into river systems and the resulting river loads. Its spatial modeling basis uses analytical units and point sources. The temporal resolution of current MoRE applications is one year. Since the MoRE database can be extended at any time as long as the principal architecture of the database system is maintained, it also can be adapted to other river basins, administrative units, and substances.
MoRE provides a PostgreSQL database structure designed for conceptual, pathway-oriented emission modeling. Metadata, input data, formulas, models, and references can be stored, accessed, and edited without programming skills using a graphical user interface. There are built-in features to, for example, simplify the comparison of results generated by different input data sets or modeling approaches. This way, the quality of the input data and modeling approaches can be evaluated, which is of great importance to priority pollutants, as there are no consistent databases and hardly any confirmed modeling approaches for most of the substances. Furthermore, reduction measures can be included in modeling. Within strategic planning processes, this is relevant for the allocation of investments or the implementation of specific measures in order to reduce the overall pollutant emissions into surface water bodies and therefore to meet the requirements of water policy.
Depending on emerging issues, MoRE is continuously developed—both technically and regarding its data input. Currently, an assessment tool is being developed that allows for the representation of river segments as edges; river junctions, monitoring stations, and point sources as nodes. This river module is designed to facilitate the inclusion of substance retention and degradation processes within rivers. With this development, the concentration modeling can be improved as the underlying spatial differentiation can be fully exploited. Lastly, the temporal resolution is being improved to include seasonal variations of substance emissions, which will provide both refined emission balances, as well as improve the quality of outcomes from the river module. Despite this technical improvement, which is relatively easy to implement, a major challenge remains in finding adequate input data at this temporal resolution for most of emergent contaminants.


