Article

Photoautotrophic Microalgae Screening for Tertiary Treatment of Livestock Wastewater and Bioresource Recovery

Department of Environmental Engineering, Chonbuk National University, 567 Baekje-daero, deokjin-gu, Jeonju 54896, Korea
*
Author to whom correspondence should be addressed.
Water 2017, 9(3), 192; https://doi.org/10.3390/w9030192
Submission received: 17 November 2016 / Revised: 22 February 2017 / Accepted: 27 February 2017 / Published: 7 March 2017

Abstract

:
Photoautotrophic microalgae offer high promise for a tertiary treatment of livestock wastewater owing to their rapid growth and nutrient uptake. To screen better microalga for the tertiary treatment, batch photobioreactor tests were conducted using Chlorella emersonii, Chlorella sorokiniana, and Botryococcus braunii. This study evaluated their specific growth rates, CO2 utilization rates, and nutrient removal rates to provide appropriate selection guidelines. Based on statistical comparisons, results indicate that selecting the right microalgae was the key to success in the tertiary treatment since each microalga responded differently, even under the same light, temperature, and nutrient conditions. Among the tested species, Chlorella emersonii was found to present the fastest photoautotrophic growth, total inorganic carbon (TIC) utilization, and nutrient removal for livestock wastewater treatment. Regression results identified that its specific growth and total nitrogen removal rates were as high as 0.51 day−1 and 0.18 day−1, respectively. Estimated TIC utilization over the supplied TIC was much higher (~34%) than those of others (11%–18%). This systemic evaluation of rate-limiting factors provides a quantitative understanding of the kinetic-based selection strategy of microalgae to polish livestock wastewater with better effluent quality.

1. Introduction

Livestock wastewater contains a large amount of nitrogen and phosphorus; thus the efficiencies of primary and secondary treatment are relatively low [1]. Incompletely treated wastewater may easily lead to eutrophication in the receiving water; thus tertiary treatment seems essential to meet the challenges of water quality management [2].
Energy from the non-renewable fossil fuels will be limiting, and continuous use has caused significant environmental consequences such as anthropogenic global warming and climate changes [3]. Reducing the use of fossil fuels would considerably reduce CO2 and other pollutant production; thus developing alternative, renewable, and carbon neutral sources that can replace fossil fuels will form the future technical trend [4].
Although unavoidable emissions are inevitable, keeping CO2 concentration in the atmosphere plateau may be a reasonable strategy. One of the potential alternatives is renewable biodiesel production via microalgae cultivation under controlled conditions [5]. Since microalgae can photosynthetically convert CO2 into lipids rapidly, this natural process can be connected to the carbon-neutral production of biodiesel. Thus, various studies have been demonstrated how to increase biofuel productivity despite the fact that its current status is yet in the research scale [6,7]. These days, combining photoautotrophic microalgal production and livestock wastewater treatment is getting more attention due to its environmental friendliness and sustainability. To provide an efficient and stable nutrient support for microalgal biomass cultivation, livestock wastewater could play a very effective role as a medium solution [8].
Among various microalgae, attempts have been made to test the treatability of livestock wastewater using Chlorella sp. [9], Botoryococcus sp. [10], Scenedesmus sp. [11], Ankistrodesmus sp. [11], etc. The extracted oil contents from those microalgae are from a low of 14% up to 63% [12], and the lipids can be transesterified into fatty acid methyl ester (FAME), the main components of biodiesel [13]. Moreover, the non-lipid biomass fraction consisting of protein, which constitutes approximately 60% of microalgal dry weight (DW), can also be processed to methane via anaerobic digestion and is applicable to aquaculture or agriculture as feedstock. This integration creates an efficient microalgal culture system, coupling mass biomass production and livestock wastewater treatment. When using livestock wastewater as the main nutrient support in an engineering system, however, it is necessary to pay special attention to meeting effluent standards. Although little research has been conducted on the effluent standard together with biomass production, it may reduce the cost of wastewater treatment significantly, providing a sustainable benefit of biodiesel production, despite the possibility that microalgal growth could be limited by the wastewater characteristics [14].
This study, therefore, aims to investigate the feasibility of the application of selected microalga for the tertiary treatment of livestock wastewater. Based on the growth characteristics in batch photobioreactors (PBRs), we suggest how to use the quantitative tools of kinetics to select better microalgae that can overcome given rate-limiting condition.

2. Materials and Methods

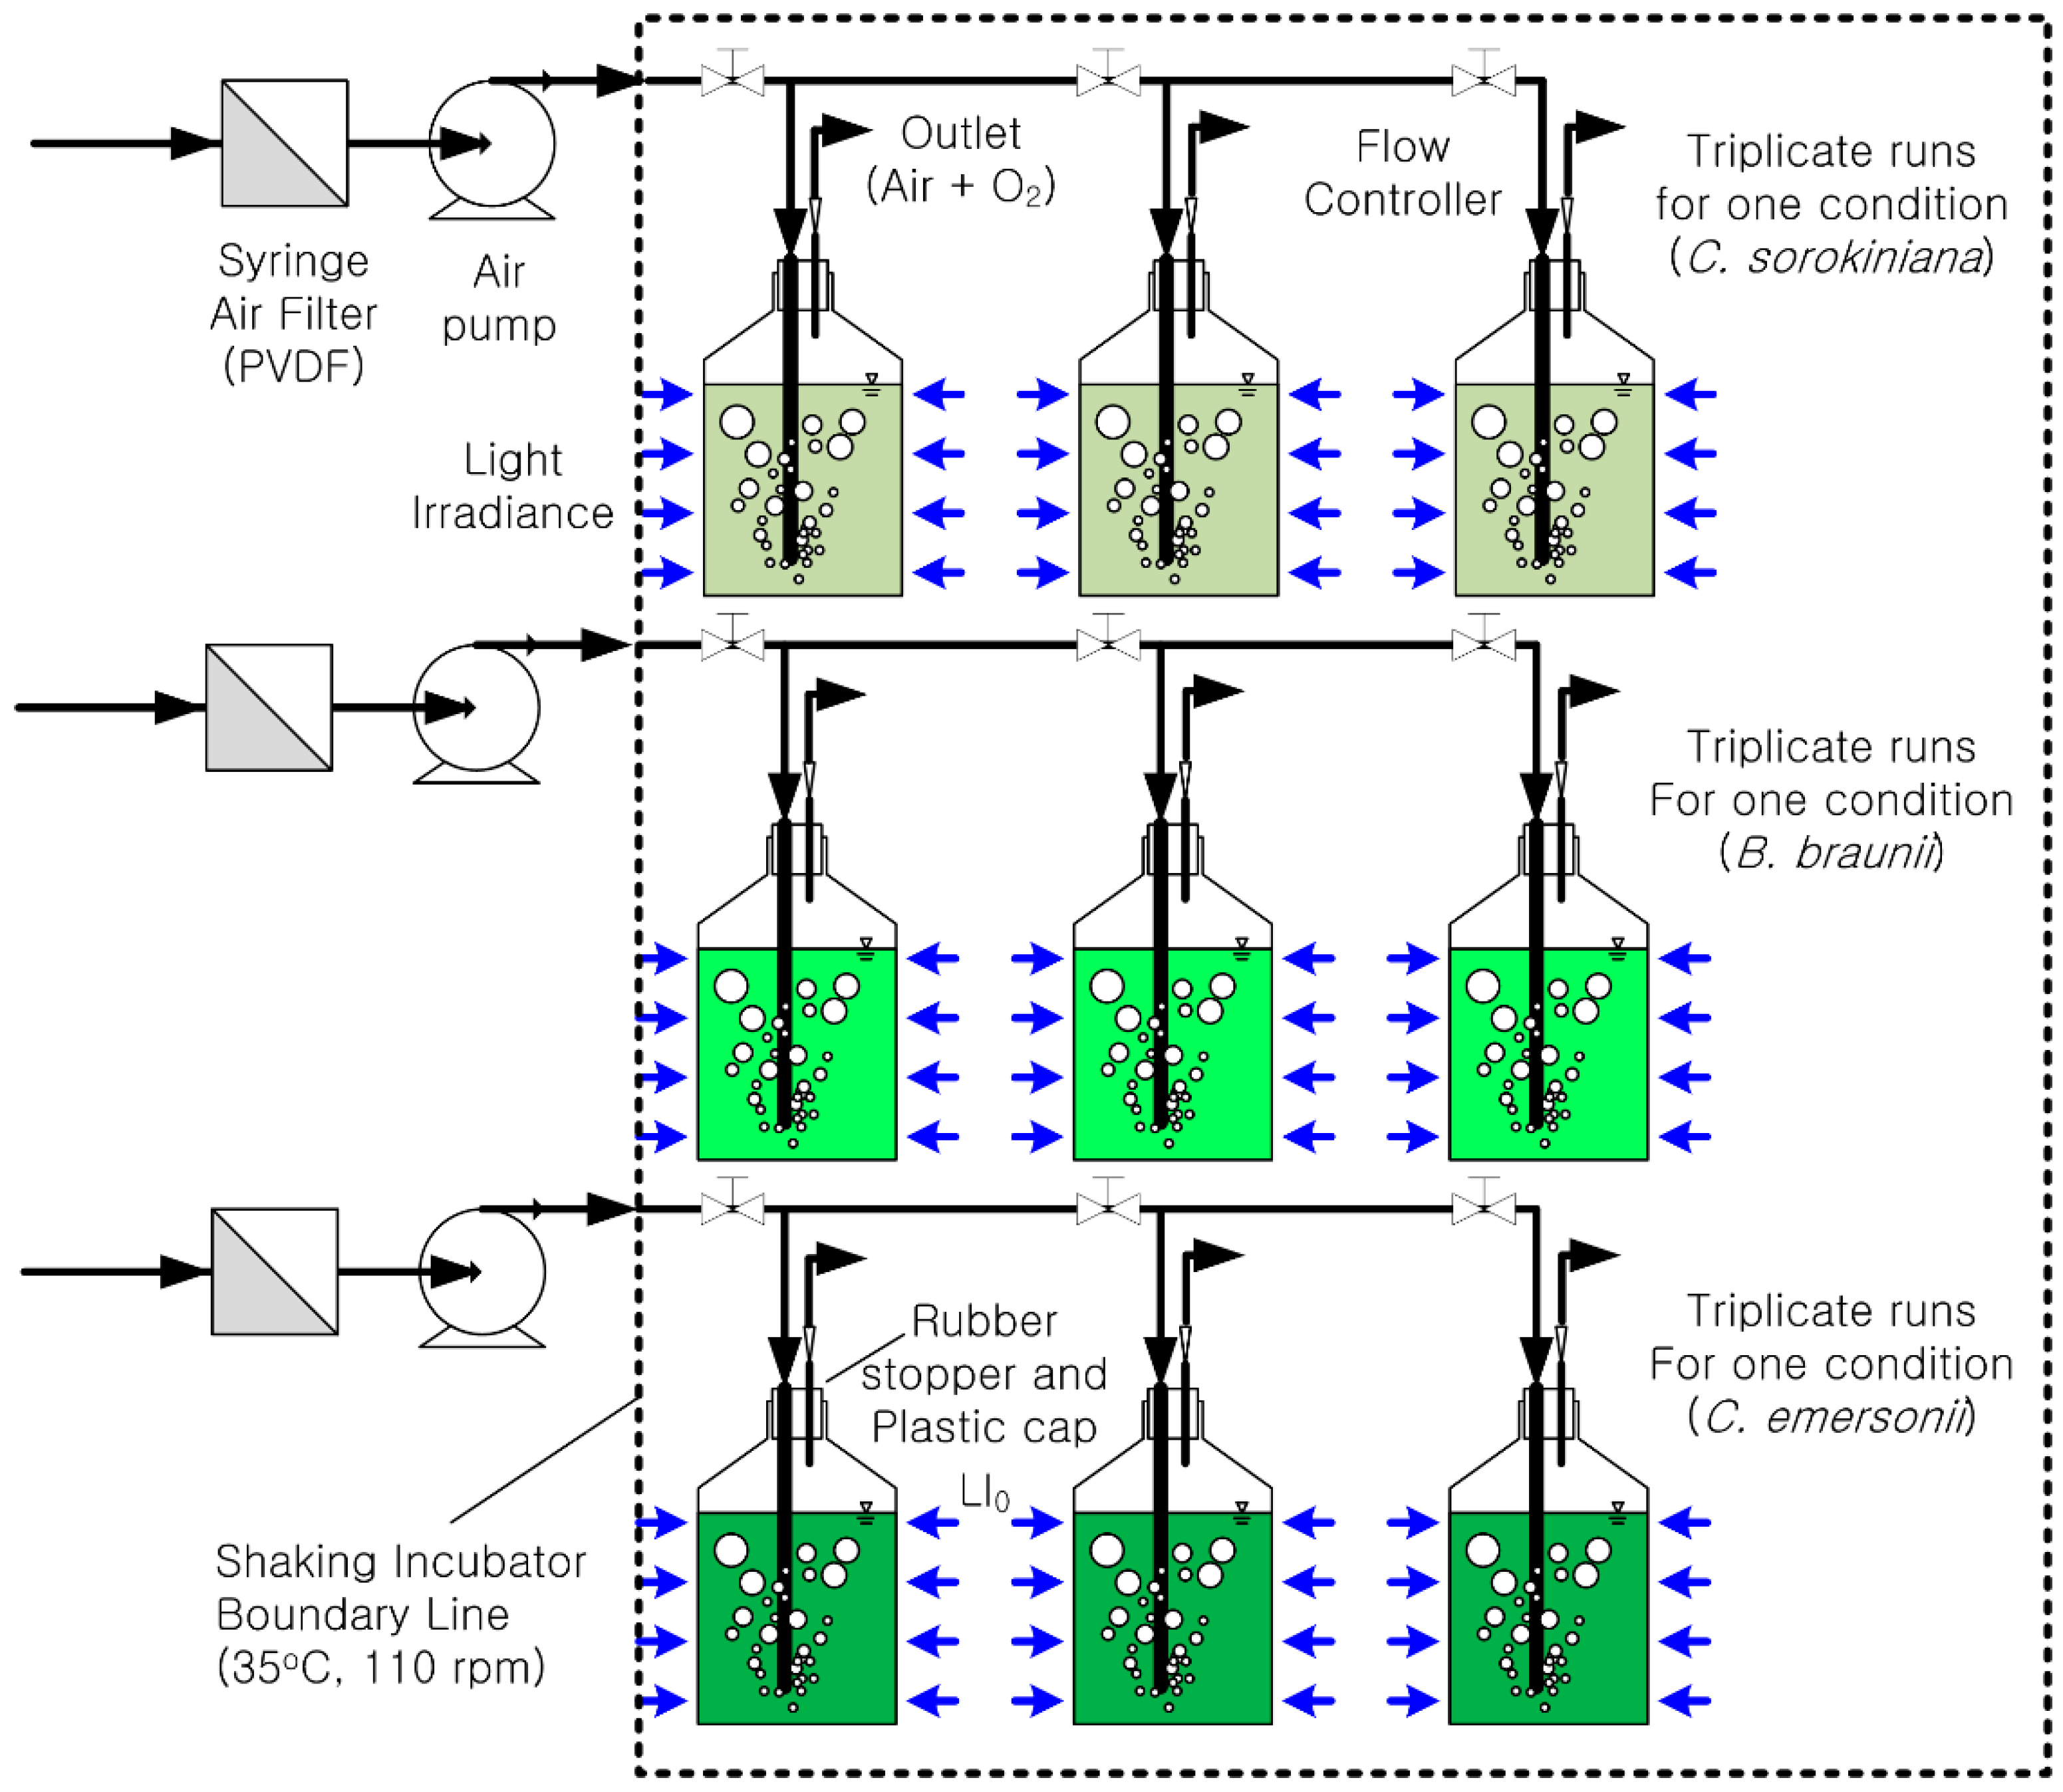
2.1. Experimental Set-up of the PBRs (Photobioreactors)

Figure 1 presents a schematic of a batch PBR (photobioreactor) experiment. We used commercial 600 mL transparent flasks (Corning Inc., Corning, NY, USA) with a working volume of 500 mL as batch PBRs. The total inorganic carbon (TIC) was supplied by aeration (6 L/min) by using a vacuum air pump (HOPAR, Shenzhen, China). We assumed that the air contained approximately 0.04% CO2. The filtered air was aerated to each PBR after filtration by a polyvinylidene fluoride (PVDF) membrane.
Each reactor was sealed with a cap, having two holes fitted for aeration (TIC supply) and gas exchange to prevent both O2 pressure build-up and external contamination. The sole energy source, light, was supplied by a light emitting diode (LED) (Yuyao Lishuai Film & Television Equipment Co., Zhejiang, China) to both sides of the wall. The applied light irradiance was all the same at 1.10 W/m2 (=160 µmol/s·m2), which was determined based on the average measurements at the surfaces of the PBRs. We controlled the temperature and circulation speed of a shaking incubator (DAIHAN scientific, Korea) at 35 °C and 110 rpm, respectively, throughout the experiments.
The concentrations of nitrogen were controlled to 25, 75 and 125 mg·N/L, respectively, by mixing NH4Cl to imitate various secondary effluents of livestock wastewater treatment. Using three different microalgae, we conducted triplicate experiments for each nitrogen condition, of which there were 27 batch runs in total. The phosphorus concentration in the experiments is 0.7 mg·P/L, and phosphorus concentration was not controlled in this experiment due to the small impact of tested PO4−3 concentration [15].

2.2. Inoculum and Culture Media

Batch PBRs were inoculated with selected green alga Chlorella emersonii (CCAP 211/11N), Chlorella sorokiniana (UTEX 1230), and Botryococcus braunii (UTEX 2441), brought from their mother cultures. We inoculated 1mL of mother culture with a DW concentration of approximately 140 mg/L. As a form of pure culture, those microalgae species were obtained from the Korea Research Institute of Bioscience and Biotechnology (KRIBB). We grew them in 1-L glass bottles with filtered air and illumination. The aeration for CO2 was supplied with the same apparatuses. All the cultivations were conducted using modified BG-11 medium [3]. Each liter of the standard BG-11 medium contained 1.5 g NaNO3, 40 mg K2HPO4·3H2O, 75 mg MgSO4·7H2O, 36 mg CaCl2·2H2O, 6 mg citric acid, 6 mg ferric ammonium citrate, 1 mg EDTA disodium salt, 20 mg NaCO3, and 1 mL mixed trace metal solution. Each liter of trace metal solution contained 2.9 g H3BO3, 1.8 g MnCl2·4H2O, 0.22 g ZnSO4·7H2O, 0.39 g NaMoO4·2H2O, 79 mg CuSO4·5H2O, and 49 mg Co(NO3)2·6H2O. We autoclaved all culture media before use [3].
To exclude a carryover effect of BG-11, control experiments data for the tested species were conducted and used to adjust growth data.
Feedstocks for these tests were collected from a livestock wastewater treatment system in a research institute in Jeonju, Korea. After filtration with GF/C (Whatman, Pittsburgh, PA, USA), we autoclaved it to prevent unnecessary microbial contamination. The physicochemical characteristics of the feedstock were determined as shown in Table 1. All the measurements were reported as mean value ± standard deviation.

2.3. Regression and Statistical Analysis

Based on the variation data of biomass concentration according to time, regression analysis for exponential growth was conducted using a computer software (Microsoft Excel, Redmond, WA, USA) with the following Equation (1):
X DW   =   X DW , 0   × e μ t
where XDW (mg·DW/L) is the DW concentration of biomass, XDW,0 (mg·DW/L) is the initial DW concentration of biomass, and µ is a specific growth rate (day−1). The nitrogen removal rate (mg·N/L/day), the biomass production rate (mg·DW/L/day), and the TIC utilization rate (mg·C/L/day) were calculated following the same calculation listed in previous literature [16]. We assumed that the carbon content of microalgae is about 50% of total biomass [17].
The nitrogen utilization with respect to cell yields (YN/XDW) was calculated using Equation (2), which divides the nitrogen consumed during the experiment by the change in biomass DW:
Y N X =   C N     C N ,   0   X DW   X DW , 0
where, CN is the nitrogen concentration at time t and CN,0 is the initial nitrogen concentration. We computed the nitrogen utilization based on the change in nitrogen concentration of the medium. Generation time was computed as t/n, where t (day) is the duration of experiment and n is the generation number during exponential growth [17].

2.4. Sampling and Analytical Methods

We monitored the biomass productivity and nutrient treatability for the tested microalgae by analyzing samples taken from each PBR according to a prescribed sampling plan. We collected one sample per day for five days. All physical, chemical, and biological parameters were determined in triplicate on the same day or the samples were stored at 4 °C before analysis. All the samples were filtered with a 0.45 µm PVDF syringe filter for various analyses except DW measurement. DW was analyzed following standard methods number 2540 [18].
Adapting standard methods for the examination of water and wastewater [18], we determined total nitrogen (TN) concentration with the method number 4500-N, the persulfate digestion method, and total phosphorus (TP) concentration with the method number 4500-P E, the ascorbic acid method. The total organic carbon (TOC) and TIC were analyzed using a TOC analyzer (Shimadzu, Kanagawa, Japan). Light intensity was determined using an LI-250A (LI-COR, Lincoln, NE, USA) light irradiance sensor and a multimeter (FLUKE-287, Everett, WA, USA), which determines photosynthetically active radiation (PAR). The TIC supply rate was computed based on the CO2-C concentration in air, and the nitrogen supply rate was calculated based on the nitrogen content of NH4Cl.

3. Results

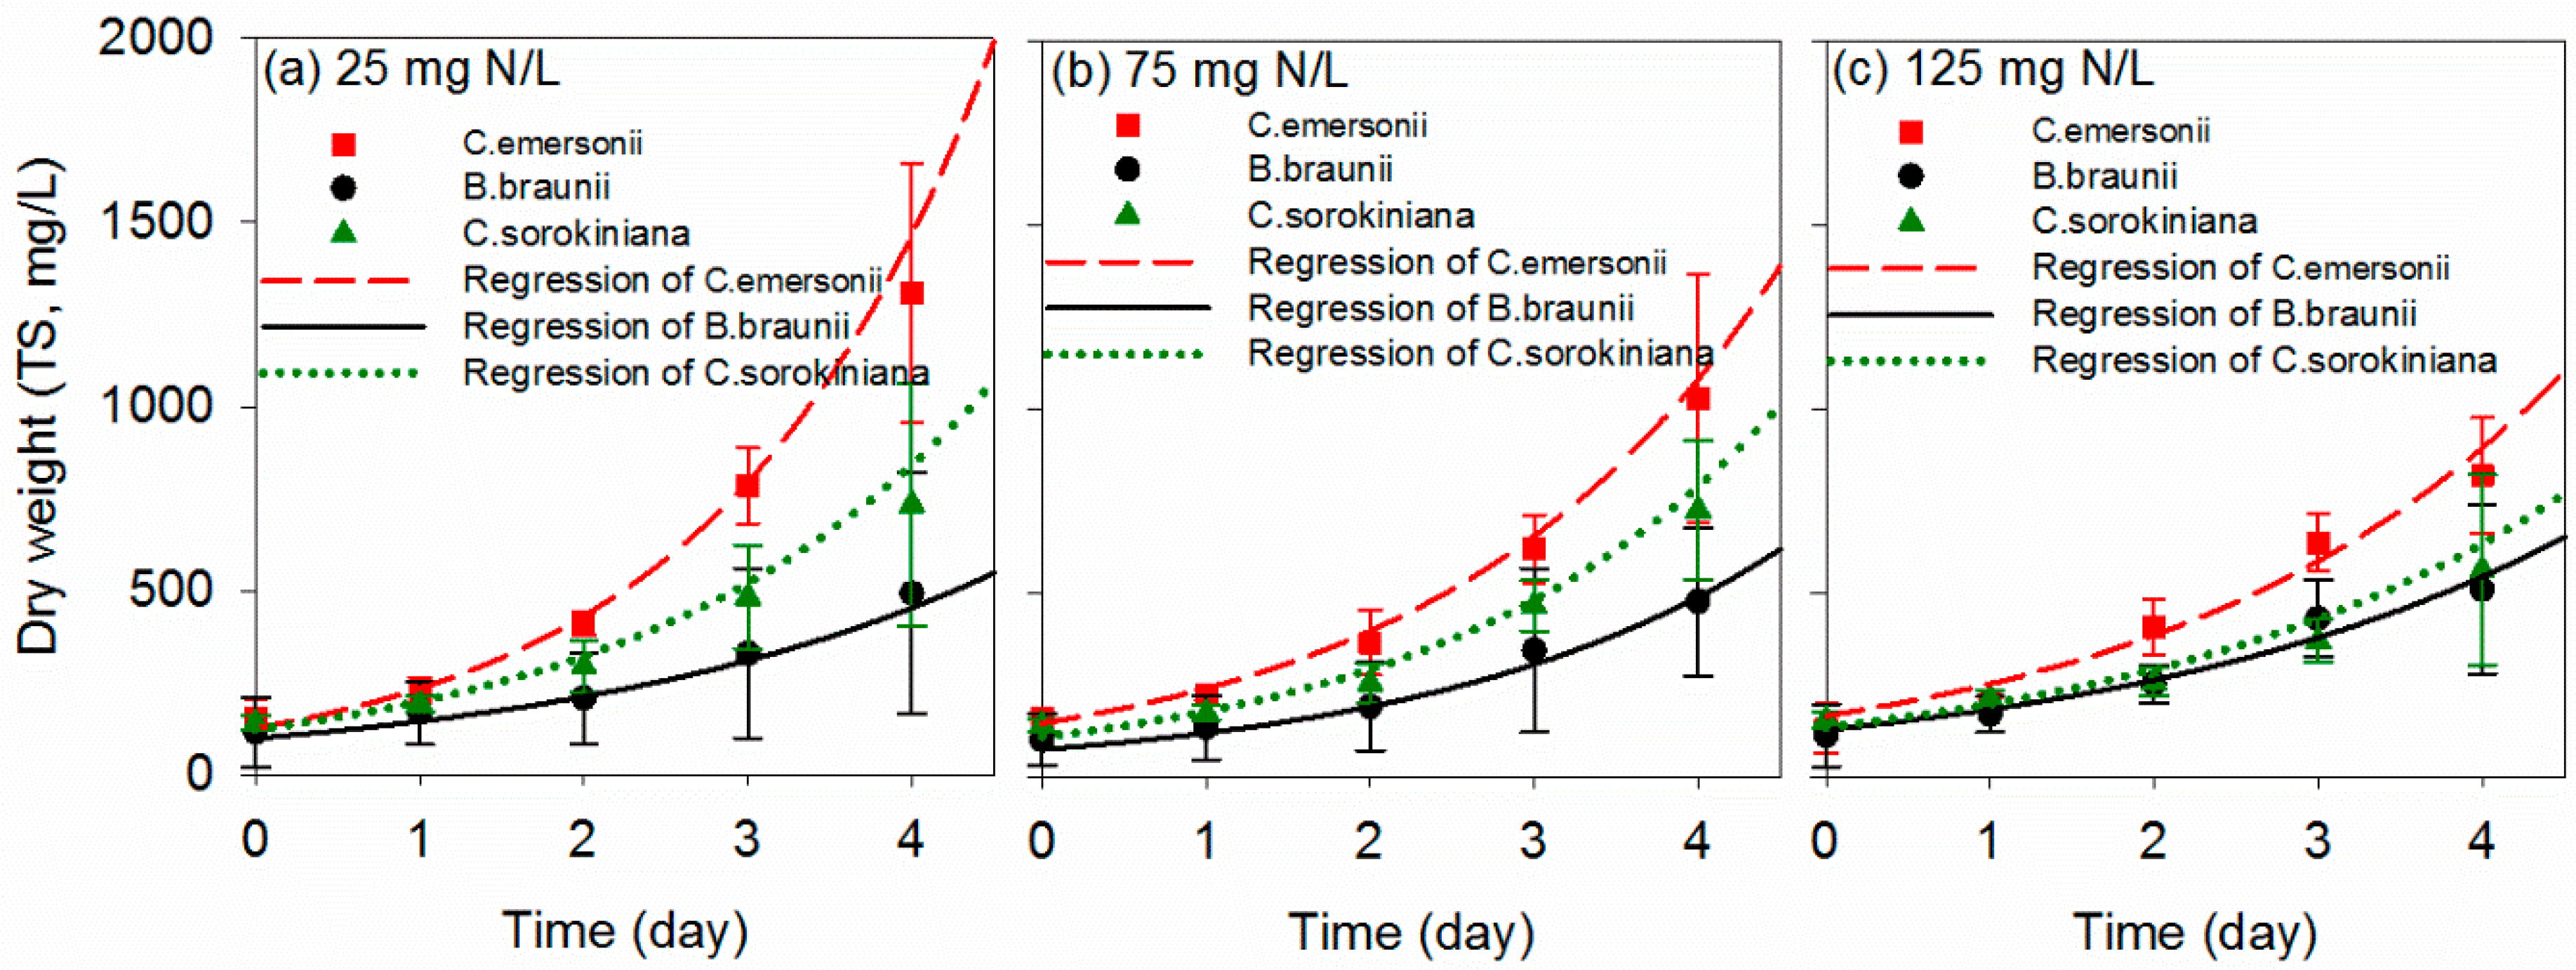
3.1. Photoautotrophic Growth Dynamics of Tested Microalgae

Figure 2 presents the dynamics of biomass DW according to each nitrogen concentration (25 mg/L, 75 mg/L, and 125 mg/L) for the tested microalgae in the batch PBRs over four days, which experience little light attenuation. Samples were taken every day after the batch experiments started. All the reactors showed a consistent exponential growth pattern over 4 days.
When nitrogen concentration was 25 mg/L, shown in Figure 2a, Chlorella emersonii grew faster (153 to 1308 mg/L) than Chlorella sorokiniana (141 to 734 mg/L) and Botryococcus braunii (116 to 492 mg/L). This significant difference reconfirms that biomass productivity could be different between genus and species under the same growth conditions; thus, the selection of optimal microalgae is crucial from a treatment engineering standpoint. At 75 mg·N/L (Figure 2b), even though Chlorella emersonii similarly demonstrated the fastest exponential growth, the biomass concentration of Chlorella emersonii at Day 4 was reduced by about 21% (1029 mg DW/L), while little differences were noticed in the cases of Chlorella sorokiniana (3.3%) and Botryococcus braunii (1.4%).
A further increase of nitrogen concentration to 125 mg·N/L suppresses the growth rate of the Chlorella species. The biomass concentrations of Chlorella emersonii and Chlorella sorokiniana decreased by about 37% (819 mg·DW/L) and 31% (509 mg·DW/L), respectively, as compared to those at 25 mg/L. On the contrary, the biomass concentration of Botryococcus braunii increased by about 14%.
A one-way analysis of variance (ANOVA) was conducted to evaluate the effect of species difference and nitrogen conditions (Supporting information Table S1). The results confirmed that the differences in the mean of biomass DW among species are significantly different (p = 0.001). It means that the different microalgal species present significantly different biomass productivity, and post hoc tests (Supporting information Table S2) as well as Figure 2 further support that Chlorella emersonii’s growth is significantly high compared to Botryococcus braunii (p = 0.001) and Chlorella sorokiniana (p = 0.049) in this study. For the effect of initial nitrogen concentration, however, it was revealed that the difference in the mean biomass DW is not statistically significant (p = 0.668); thus it is hard to say that the mean biomass DWs are significantly different depending on the initial nitrogen concentration.

3.2. Growth Kinetics
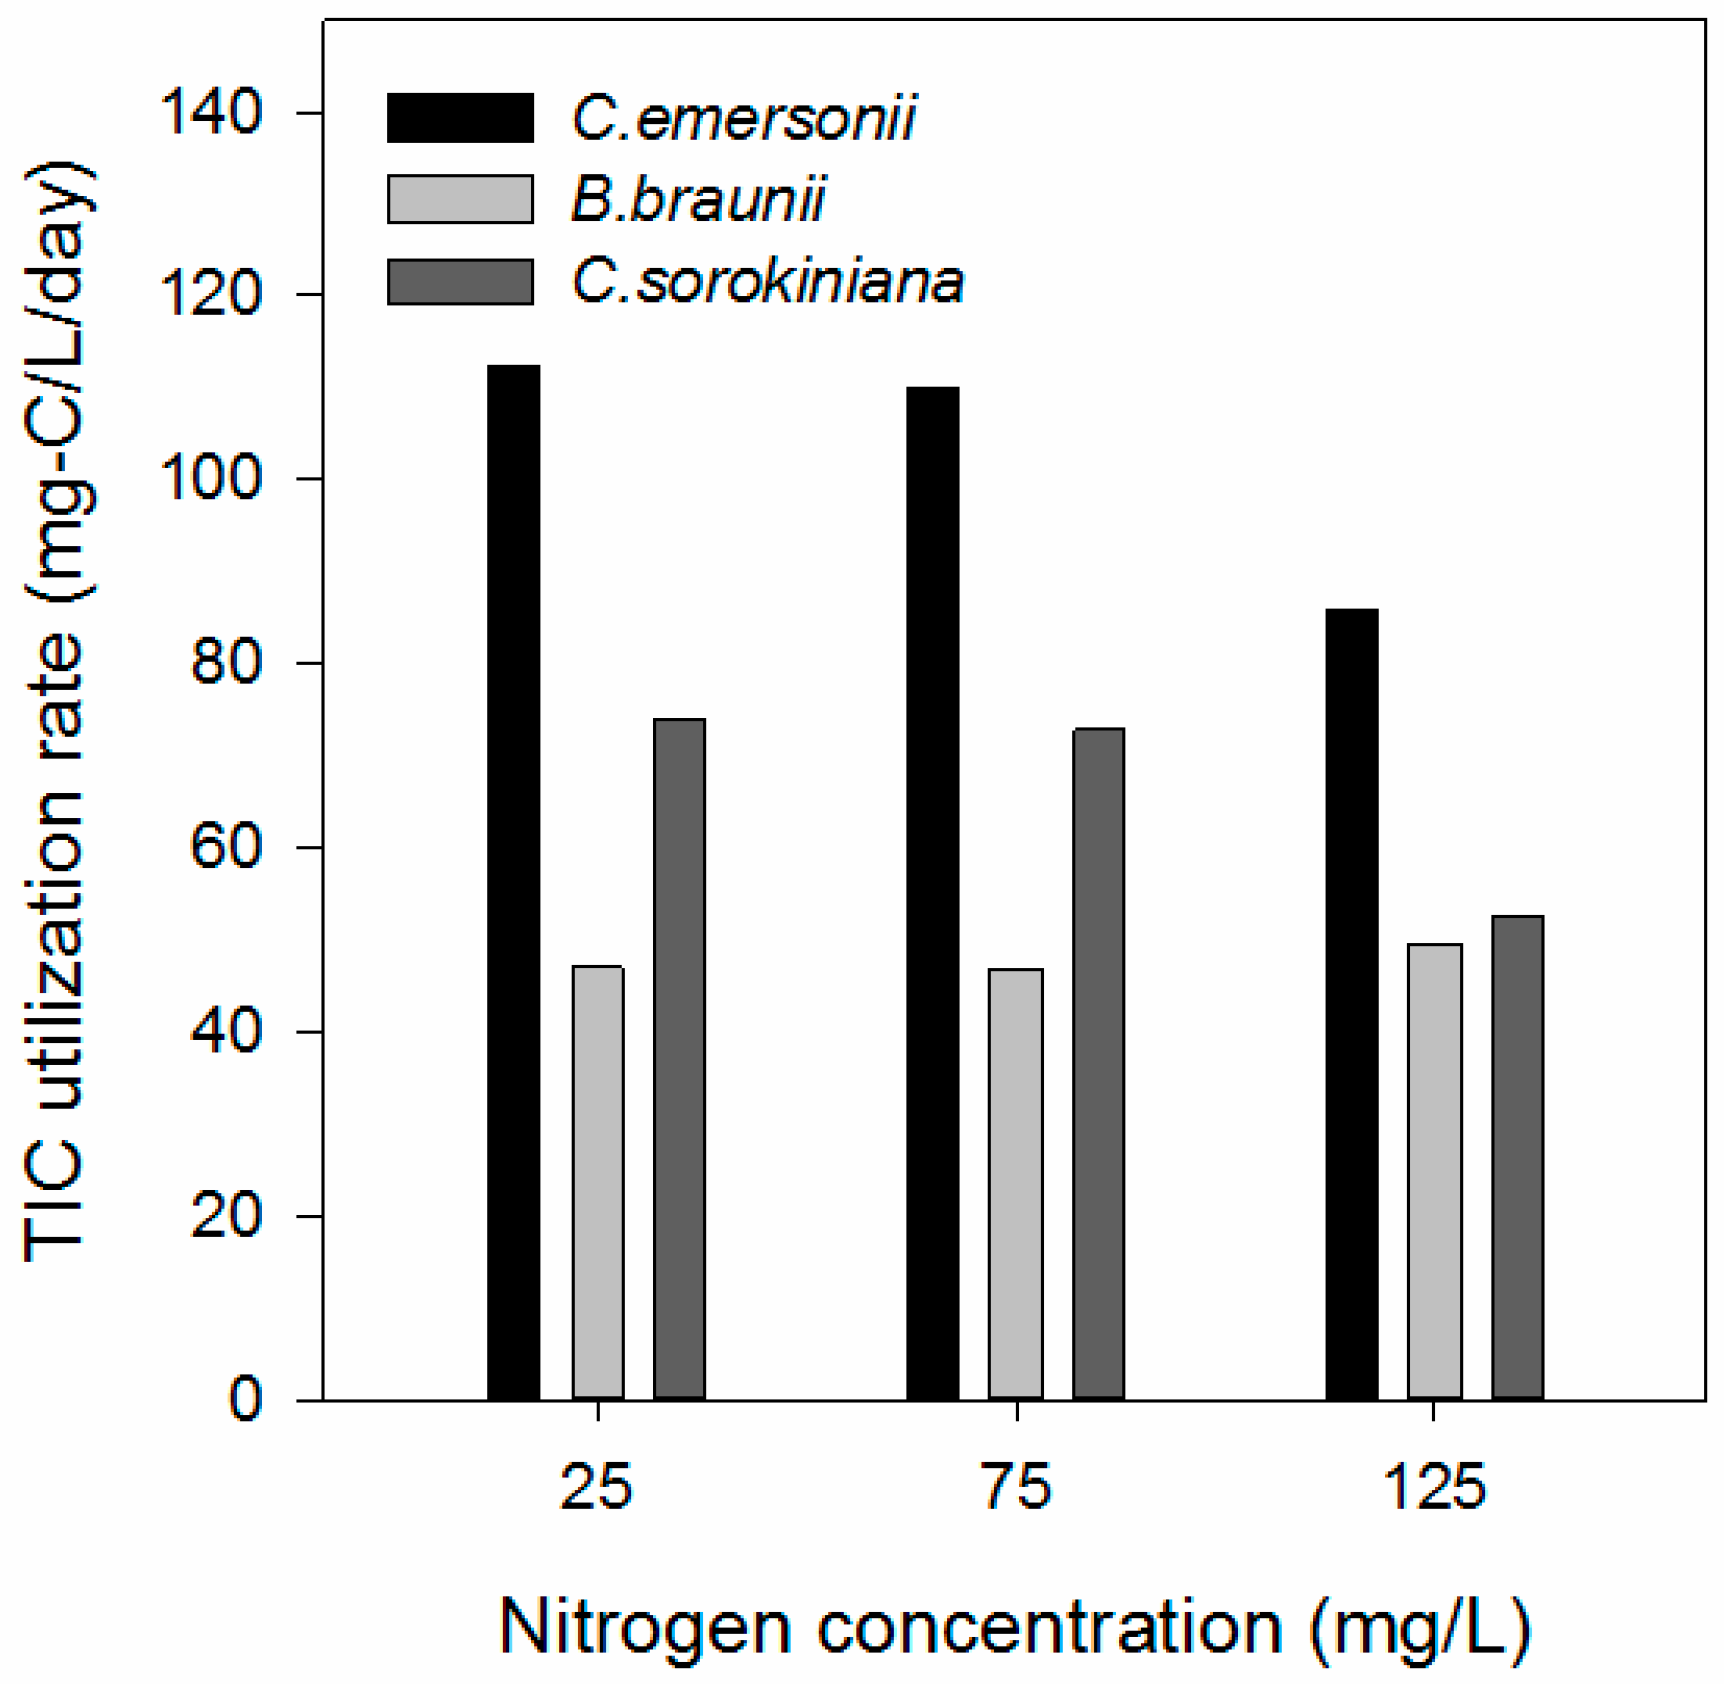
Figure 2 also plots the regression lines against the determined DW. Regression analysis can estimate specific growth rates (µ) based on exponential growth patterns between sampling periods. For Chlorella emersonii, the initial nitrogen concentration did not significantly alter µ, which ranged between 0.51 and 0.61 day−1 for each nitrogen concentration (Table 2). The µ of Chlorella emersonii was the highest at 0.55 day−1, while those of Chlorella sorokiniana and Botoryococcuss braunii were 16%–36% and 18%–44% lower at 0.37 and 0.42 day−1, respectively. The highest biomass production rate per unit volume was recorded as 0.61 g/L/day for Chlorella emersonii in 25 mg·N/L. As the nitrogen concentration increases, the biomass production rate slightly decreased to 0.49 g/L/day at 75 mg·N/L and 0.48 g/L/day at 125 mg·N/L, respectively. For Botryococcus braunii and Chlorella sorokiniana, growth rates were significantly inferior to Chlorella emersonii. The rates remained at 0.41 and 0.43 g/L/day, respectively. It was noticed that the biomass productivity of Botoryococcus braunii improved slightly as nitrogen concentration increased, though it was still lower than that of Chlorella sorokiniana.
Table 2 tabulates the estimated doubling time-based on the theory of binary fission, which means the time in which the amount of biomass grows to twice the initial concentration. The shortest doubling time was obtained from Chlorella emersonii (1.2 days) at 25 mg/L. The doubling times of Botryococcus braunii and Chlorella sorokiniana at 25 mg·N/L were comparably longer at 1.8 days and 1.4 days.

3.3. TIC Removal

Figure 3 present TIC utilization rates according to initial nitrogen concentration during batch experiments. Since photosynthetic microalgal growth was the most dominant reaction in all the reactors, the changes of TIC and nitrogen concentration must have originated from the photosynthesis of each microalga rather than other physicochemical reactions or other microbial reactions. The ctive growth of Chlorella emersonii utilized supplied TIC (424 mg·C/L/day) instantaneously, at which the TIC utilization rate was as high as 144.4 mg·C/L/d at 25 mg·N/L. This 34% utilization over the supplied TIC was at much higher levels than those of Botryococcus braunii (47.1 mg·C/L/day, 11.1%) and Chlorella sorokiniana (74.1 mg·C/L/day, 17.5%).
While Chlorella emersonii demonstrated decreasing TIC utilization as nitrogen concentration increased, Botryococcus braunii showed a slightly increasing TIC utilization rate from 47 to 50 mg·C/L/d. On the other hand, Chlorella sorokiniana well maintained the TIC utilization rate up to 75 mg·N/L, but it sharply decreased from 74 to 53 mg·C/L/day when the nitrogen concentration was increased from 75 to 125 mg·N/L.

3.4. TN Removal

Table 3 tabulates estimated efficiencies of overall TN removal according to initial nitrogen concentration. For Chlorella emersonii, TN utilization efficiencies were well maintained, though they gradually declined from 49.4% to 46.9% and then to 44.4% as the initial nitrogen concentration increased. For Botryococcus braunii, on the contrary, it initially increased from 46.2% to 58.2% but it sharply dropped to 29.9%. In the case of Chlorella sorokiniana, an increase of the TN utilization rate from 37% to 45% returned the utilization efficiency to a similar level (34%). Table 3 also shows that the TN utilization rate of Chlorella emersonii gradually increased from 0.170 to 0.182 day−1. Botryococcus braunii showed a slightly lower rate (0.166 day−1) at 25 mg·N/L than Chlorella emersonii. but it drastically increased to 0.226 day−1 at 75 mg/L. When the initial TN was 125 mgN/L, the rate sharply dropped to 0.11 day−1, possibly due to metabolic inhibition. In the case of Chlorella sorokiniana, it showed the lowest TN utilization rates (0.12–0.15 day−1) under the initial TN of 25–75 mg·N/L compared to Chlorella emersonii and Botryococcus braunii, though the utilization rate was slightly higher (0.13 day−1) than that of Botryococcus braunii (0.11 day−1).
Combining biomass and nitrogen data, it was found that Chlorella emersonii’s nitrogen uptake per unit of biomass was 0.01–0.08 mg·N/mg algae biomass, while Botryococcus braunii’s nitrogen uptake (0.03–0.11 mg·N/mg algae biomass) is like that of Chlorella sorokiniana (0.02–0.12 mg·N/mg algae biomass).

4. Discussion

The results of this study demonstrate that varying nitrogen concentration has little impact on the photoautotrophic growth of tested microalgae. Given that the tested microalgae in this study are famous for livestock wastewater treatment, what is more important seems to be the stress management mechanisms of each microalga, which tend to differ between genus or species [19]. These findings suggest that the sensitivity of microalgae can be used as a selection guideline depending on the purpose and target wastewater characteristics, whether it is either for biofuel or biomass production.
Regression analyses on growth kinetics also revealed that rapid growth in photosynthetic batch reactors is not that strongly associated with nitrogen condition, which was different from the findings of prior works [16,20]. In this study, obtained biomass productivity data evidenced that Chlorella emersonii is one of the promising candidates for the polishing of the secondary effluent of a livestock wastewater treatment plant. Our statistical results also confirm that it can be applicable to wide range of TN concentrations since the growth kinetics do not significantly depend on nitrogen concentration [14,16,21].
The TIC utilization results may support species-specific behavior depending on environmental conditions. Obtained species-specific dynamics of TIC utilization patterns further indicate the importance of species selection and the necessity of optimal operating condition [11]. It is of significance to refer to the effect of TIC on algal growth since it can be another basis for understanding the growth and nutrient removal kinetics.
Evaluation of TN removal was performed in this study. The results indicate that Chlorella emersonii can adjust themselves to a wider range of initial TN concentrations than Botryococcus braunii and Chlorella sorokiniana. Regardless of surrounding nitrogen concentrations, Chlorella emersonii recorded the highest values for the biomass production rate, the TIC utilization rate, and the TN removal efficiency, possibly due to stoichiometric demand via relatively rapid growth kinetics [16,22].
Table 4 summarizes and compares all the parameters obtained in this study with those in the literature. For Chlorella emersonii, the average specific growth rate of 0.51 day−1 was about 33%–510% higher than previous reports, though nitrogen removal efficiency was incomparable. The results of Botryococcus braunii, however, were very inferior to those reported in other literature. Its final biomass concentration and specific growth rate were significantly less than those of Kim et al. [11] and An et al. [25], and the nitrogen removal efficiency was 48% lower than the values in the literature. Chlorella sorokiniana presented a similar performance in biomass production, but its nitrogen removal efficiency was fairly lower (<42%) than in the literature (>75%). These results support that Chlorella emersonii is more appropriate among the microalgae tested in this study for polishing secondary livestock wastewater. For Botryococcus braunii and Chlorella sorokiniana, it seems that various environmental factors associated with their growth inhibit photoautotrophic biomass production.

5. Conclusions

To select better microalga for the tertiary treatment of livestock wastewater, we evaluated biomass productivity, growth kinetics, TIC utilization, and TN removal. A series of batch experiments in this study figured out a reasonable and logical approach to screen the best species applicable among the tested microalgae. The results support that Chlorella emersonii is more appropriate for the polishing of livestock wastewater than other microalgae. For Botoryococcus braunii, it was found that a very narrow range of nitrogen conditions is preferable, and for Chlorella sorokiniana, no distinctive performance in any of the focused parameters in this study was revealed. The comparative study supports that our screening strategy may provide a plausible framework to find suitable species among various microalgal species. Because Chlorella emersonii gains high biomass productivity, enhanced TIC fixation, and rapid nitrogen removal, its application is reasonably expected to meet any effluent standard or guidelines for tertiary treatment.

Supplementary Materials

The following are available online at www.mdpi.com/2073-4441/9/3/192/s1.

Acknowledgments

This work was financially supported by the Research Program for Agriculture Science & Technology Development (Project No. PJ010824), Rural Development Administration, Korea.

Author Contributions

Ji-Yeon Kim and Hyun-Woo Kim conceived and designed the experiments. Ji-Yeon Kim performed the whole experiments. Ji-Yeon Kim and Hyun-Woo Kim analyzed the data and wrote the paper. Hyun-Woo Kim took the leadership of the whole project and the publication of the paper.

Conflicts of Interest

The authors declare no conflict of interest.

References

  1. Lee, S.; Maniquiz-Redillas, M.C.; Choi, J.; Kim, L.-H. Nitrogen mass balance in a constructed wetland treating piggery wastewater effluent. J. Environ. Sci. 2014, 26, 1260–1266. [Google Scholar] [CrossRef]
  2. Posadas, E.; Bochon, S.; Coca, M.; García-González, M.C.; García-Encina, P.A.; Muñoz, R. Microalgae-based agro-industrial wastewater treatment: A preliminary screening of biodegradability. J. Appl. Phycol. 2014, 26, 2335–2345. [Google Scholar] [CrossRef]
  3. Kim, H.W.; Vannela, R.; Zhou, C.; Harto, C.; Rittmann, B.E. Photoautotrophic nutrient utilization and limitation during semi-continuous growth of synechocystis sp pcc6803. Biotechnol. Bioeng. 2010, 106, 553–563. [Google Scholar] [CrossRef] [PubMed]
  4. Singh, A.K.; Singh, M.P. Importance of algae as a potential source of biofuel. Cell. Mol. Biol. 2014, 60, 106–109. [Google Scholar] [PubMed]
  5. Wijffels, R.H.; Barbosa, M.J. An outlook on microalgal biofuels. Science 2010, 329, 796–799. [Google Scholar] [CrossRef] [PubMed]
  6. Tabernero, A.; Martin del Valle, E.M.; Galan, M.A. Evaluating the industrial potential of biodiesel from a microalgae heterotrophic culture: Scale-up and economics. Biochem. Eng. J. 2012, 63, 104–115. [Google Scholar] [CrossRef]
  7. González-Garcinuño, Á.; Tabernero, A.; Sánchez-Álvarez, J.M.; Martin del Valle, E.M.; Galán, M.A. Effect of nitrogen source on growth and lipid accumulation in scenedesmus abundans and chlorella ellipsoidea. Bioresour. Technol. 2014, 173, 334–341. [Google Scholar] [CrossRef] [PubMed]
  8. Ji, M.K.; Kim, H.C.; Sapireddy, V.R.; Yun, H.S.; Abou-Shanab, R.A.I.; Choi, J.; Lee, W.; Timmes, T.C.; Inamuddin; Jeon, B.H. Simultaneous nutrient removal and lipid production from pretreated piggery wastewater by chlorella vulgaris ysw-04. Appl. Microbiol. Biotechnol. 2013, 97, 2701–2710. [Google Scholar] [CrossRef] [PubMed]
  9. Takeshita, T.; Ota, S.; Yamazaki, T.; Hirata, A.; Zachleder, V.; Kawano, S. Starch and lipid accumulation in eight strains of six chlorella species under comparatively high light intensity and aeration culture conditions. Bioresour. Technol. 2014, 158, 127–134. [Google Scholar] [CrossRef] [PubMed]
  10. Shen, Y.; Yuan, W.; Pei, Z.; Mao, E. Culture of microalga botryococcus in livestock wastewater. In Transactions of the ASABE; American Society of Agricultural and Biological Engineers: St. Joseph, MI, USA, 2008; Volume 51, pp. 1395–1400. [Google Scholar]
  11. Kim, H.-C.; Choi, W.J.; Ryu, J.H.; Maeng, S.K.; Kim, H.S.; Lee, B.-C.; Song, K.G. Optimizing cultivation strategies for robust algal growth and consequent removal of inorganic nutrients in pretreated livestock effluent. Appl. Biochem. Biotechnol. 2014, 174, 1668–1682. [Google Scholar] [CrossRef] [PubMed]
  12. Chen, C.L.; Huang, C.C.; Ho, K.C.; Hsiao, P.X.; Wu, M.S.; Chang, J.S. Biodiesel production from wet microalgae feedstock using sequential wet extraction/transesterification and direct transesterification processes. Bioresour. Technol. 2015, 194, 179–186. [Google Scholar] [CrossRef] [PubMed]
  13. Sathish, A.; Marlar, T.; Sims, R.C. Optimization of a wet microalgal lipid extraction procedure for improved lipid recovery for biofuel and bioproduct production. Bioresour. Technol. 2015, 193, 15–24. [Google Scholar] [CrossRef] [PubMed]
  14. Kuo, C.M.; Chen, T.Y.; Lin, T.H.; Kao, C.Y.; Lai, J.T.; Chang, J.S.; Lin, C.S. Cultivation of chlorella sp gd using piggery wastewater for biomass and lipid production. Bioresour. Technol. 2015, 194, 326–333. [Google Scholar] [CrossRef] [PubMed]
  15. Shriwastav, A.; Gupta, S.K.; Ansari, F.A.; Rawat, I.; Bux, F. Adaptability of growth and nutrient uptake potential of chlorella sorokiniana with variable nutrient loading. Bioresour. Technol. 2014, 174, 60–66. [Google Scholar] [CrossRef] [PubMed]
  16. Kim, H.-W.; Park, S.; Rittmann, B.E. Multi-component kinetics for the growth of the Cyanobacterium synechocystis sp. Pcc6803. Environ. Eng. Res. 2015, 20, 347–355. [Google Scholar] [CrossRef]
  17. Madigan, M.T.; Martinko, J.M.; Stahl, D.A.; Clark, D.P.; Brock, T.D. Brock Biology of Microorganisms; Pearson: Upper Saddle River, NJ, USA, 2012. [Google Scholar]
  18. Eaton, A.D.; Clesceri, L.S.; Rice, E.W.; Greenberg, A.E.; Franson, M.A.H. Standard Methods for the Examination of Water and Wastewater, 22nd ed.; American Public Health Association: Washington, DC, USA; American Water Works Association: Denver, CO, USA; Water Environment Federation: Alexandria, VA, USA, 2014. [Google Scholar]
  19. Wang, Y.; Ho, S.-H.; Cheng, C.-L.; Guo, W.-Q.; Nagarajan, D.; Ren, N.-Q.; Lee, D.-J.; Chang, J.-S. Perspectives on the feasibility of using microalgae for industrial wastewater treatment. Bioresour. Technol. 2016, 222, 485–497. [Google Scholar] [CrossRef] [PubMed]
  20. Eustance, E.; Gardner, R.D.; Moll, K.M.; Menicucci, J.; Gerlach, R.; Peyton, B.M. Growth, nitrogen utilization and biodiesel potential for two chlorophytes grown on ammonium, nitrate or urea. J. Appl. Phycol. 2013, 25, 1663–1677. [Google Scholar] [CrossRef]
  21. Zhu, L.; Wang, Z.; Takala, J.; Hiltunen, E.; Qin, L.; Xu, Z.; Qin, X.; Yuan, Z. Scale-up potential of cultivating chlorella zofingiensis in piggery wastewater for biodiesel production. Bioresour. Technol. 2013, 137, 318–325. [Google Scholar] [CrossRef] [PubMed]
  22. Illman, A.M.; Scragg, A.H.; Shales, S.W. Increase in chlorella strains calorific values when grown in low nitrogen medium. Enzym. Microb. Technol. 2000, 27, 631–635. [Google Scholar] [CrossRef]
  23. Borkenstein, C.G.; Knoblechner, J.; Fruehwirth, H.; Schagerl, M. Cultivation of chlorella emersonii with flue gas derived from a cement plant. J. Appl. Phycol. 2011, 23, 131–135. [Google Scholar] [CrossRef]
  24. Scragg, A.H.; Illman, A.M.; Carden, A.; Shales, S.W. Growth of microalgae with increased calorific values in a tubular bioreactor. Biomass Bioenerg 2002, 23, 67–73. [Google Scholar] [CrossRef]
  25. An, J.Y.; Sim, S.J.; Lee, J.S.; Kim, B.W. Hydrocarbon production from secondarily treated piggery wastewater by the green alga botryococcus braunii. J. Appl. Phycol. 2003, 15, 185–191. [Google Scholar] [CrossRef]
  26. Li, T.; Zheng, Y.; Yu, L.; Chen, S. Mixotrophic cultivation of a chlorella sorokiniana strain for enhanced biomass and lipid production. Biomass Bioenergy 2014, 66, 204–213. [Google Scholar] [CrossRef]
Figure 1. A schematic diagram of the batch experiments. Each batch experiment consisted of triplicate runs for three different microalgae species (nine runs in each experiment). Three batch experiments were conducted using different initial nitrogen conditions (27 runs in total).
Water 09 00192 g001
Figure 2. Dynamics of biomass dry weight (DW) for tested microalgae: (a) 25 mg·N/L; (b) 75 mg·N/L; (c) 125 mg·N/L.
Water 09 00192 g002
Figure 3. Variations of total inorganic carbon (TIC) utilization rates according to initial nitrogen concentration.
Water 09 00192 g003
Table 1. The initial concentration of chemical oxygen demand (CODCr), total nitrogen (TN), total ammonia (TNH3), total phosphorus (TP), dissolved organic carbon (DOC), total inorganic carbon (TIC), and pH in livestock wastewater.
CharacteristicsUnitContent
CODCrmg·COD/L111.9 ± 16.7
TNmg·N/L15.4 ± 0.3
TNH3mg·N/L13.4 ± 0.5
TPmg·P/L0.7 ± 0.0
DOCmg·C/L15.6 ± 0.4
TICmg·Ci/L28.3 ± 0.6
pH-9.7 ± 0.1
Table 2. Specific growth rate and doubling time of each microalga under different initial nitrogen concentrations.
Initial Nitrogen
(mg/L)
Specific Growth Rate (Day−1)Doubling Time (Day)
C. emersoniiB. brauniiC. sorokinianaC. emersoniiB. brauniiC. sorokiniana
250.610.390.341.21.81.4
750.530.440.451.41.71.4
1250.510.430.331.71.91.8
Table 3. Overall total nitrogen (TN) removal efficiency of each microalgae under different initial nitrogen concentrations.
Initial Nitrogen (mg/L)TN removal Efficiency (%)TN Removal Rate (Day−1)
C. emersoniiB. brauniiC. sorokinianaC. emersoniiB. brauniiC. sorokiniana
2549.446.236.90.1700.1660.123
7546.958.244.70.1780.2260.151
12544.429.934.00.1820.1100.133
Table 4. Biomass concentration, nitrogen removal efficiency, and specific growth rate of Chlorella emersonii, Botryococcus braunii, Chlorella sorokiniana, and other microalgae according to the varying initial conditions.
ReferenceStrainLight Irradiance (µmol·E/s·m2)Temperature (°C)Nitrogen Concentration (mg/L)Final Biomass Concentration (mg·DW/L)Nitrogen Removal Efficiency (%)Specific Growth Rate (Day−1)
This studyC. emersonii1603525146153.70.55
1603575107145.10.49
1603512585749.10.48
[23]20025N.A2060-0.10
[24]13025203468-0.38
This studyB. braunii160352545346.20.37
160357548660.90.41
1603512550034.40.31
[10]150–1902225-25.0-
150–1902275-46.7-
[11]7525110125090.9-
[25]10025204250090.00.82
This studyC. sorokiniana160352555741.50.42
160357578641.50.43
1603512565735.30.39
[26]10025160680-0.63
10037160270-0.40
[15]80222511775.40.28
[14]Chlorella sp.3002620 >1500-0.47
[11]S. accuminatus7525163--0.57
[21]C. zofingiensis23025148286082.70.34

