Article

Performance of Denitrifying Bioreactors at Reducing Agricultural Nitrogen Pollution in a Humid Subtropical Coastal Plain Climate

by
Timothy Rosen
1,* and
Laura Christianson
2
1
Midshore Riverkeeper Conservancy, Easton, MD 21601, USA
2
Department of Crop Sciences, University of Illinois, Urbana, IL 61801, USA
*
Author to whom correspondence should be addressed.
Water 2017, 9(2), 112; https://doi.org/10.3390/w9020112
Submission received: 21 December 2016 / Accepted: 6 February 2017 / Published: 10 February 2017

Abstract

:
Denitrifying bioreactors are an agricultural best management practice developed in the midwestern United States to treat agricultural drainage water enriched with nitrate-nitrogen (NO3-N). The practice is spreading rapidly to agricultural regions with poor water quality due to nutrient enrichment. This makes it imperative to track bioreactor NO3-N reduction efficiency as this practice gets deployed to new regions. This study evaluated the application and performance of denitrifying bioreactors in the humid subtropical coastal plain environment of the Chesapeake Bay catchment to provide data about regionally specific NO3-N reduction efficiencies. NO3-N samples were taken before and after treatment at three denitrifying bioreactors, in addition to other nutrients (orthophosphate-phosphorus, PO4-P; ammonium-nitrogen, NH4-N; total nitrogen, TN; total phosphorus, TP) and water quality parameters (dissolved oxygen, DO; oxidation reduction potential, ORP; pH; specific conductance, SPC). Total removal ranged drastically between bioreactors from 10 to 133 kg N, with removal efficiencies of 9.0% to 62% and N removal rates of 0.21 to 5.36 g N removed per m3 of bioreactor per day. As the first bioreactor study in the humid subtropical coastal plain, this data provides positive proof of concept that denitrifying bioreactor is another tool for reducing N loads in agricultural tile drainage in this region.

1. Introduction

Denitrifying bioreactors are a new agricultural best management practice (BMP) developed for the treatment of agricultural drainage water over-enriched with nitrate-nitrogen (NO3-N). The practice was pioneered in humid continental climates of the midwestern United States of America [1]. The application of this practice has been adopted by other locations around the world, which have artificial drainage (drainage tile or ditches) and problems associated with nutrient enrichment in receiving waterbodies [1,2]. With the expansion of this innovative practice to new locations and climates, it is imperative that rigorous monitoring and engineering assessment are completed to determine if this agricultural BMP can be applied practically and achieve the desired NO3-N reduction to help reduce impacts from agricultural nitrogen pollution on local waterways.
The Delmarva (DELaware-MARyland-VirginiA) Peninsula in the humid subtropical coastal plain of the mid-Atlantic United States has an extensive history of artificial agricultural drainage dating back to 1789 [3]. Public Drainage Associations (PDAs) in the region provide a vital link in this infrastructure by maintaining thousands of kilometers of local drainage ditches [3,4,5]. However, while agricultural drainage improvements are essential for row-crop farming on the Delmarva Peninsula, widespread, intensive agriculture has come at an environmental cost for this sensitive catchment. Groundwater discharge contributes more than half of the flow to streams and ditches on the Delmarva Peninsula [6], and the solubility and mobility of nitrate (NO3-N), a primary nonpoint-source agricultural pollutant, has led to shallow groundwater NO3-N concentrations exceeding the maximum contaminant level for drinking water (10 mg NO3-N/L) [7,8]. Nitrate contamination has been exacerbated by the use of agricultural ditches and subsurface drainage tile that shorten groundwater flow paths and reduce ecosystem services (natural denitrification). As a response to this and other water quality challenges in the region, the Chesapeake Bay Total Maximum Daily Load (TMDL) was created in 2010, calling for a 24% reduction in nitrogen load by 2025 [9].
Many approved and recommended agricultural conservation practices do not directly address the hydrologic modification of the artificial drainage systems on the Delmarva. For example, interception of shallow groundwater by subsurface tile drainage systems, or groundwater flow paths that are deeper than the root zone, often cause “riparian bypass” [10], in which groundwater bypasses riparian buffers. The most appropriate practice for the many drained areas on the Delmarva is wetland restoration, but this option is not attractive to many agricultural producers because of the amount of land needed to be taken out of production.
Denitrifying bioreactors are particularly suited to intercept and treat agricultural drainage water, while limiting the amount of cropped land taken out of production [1,2]. This “enhanced-denitrification” practice essentially consists of routing drainage water through a buried trench filled with woodchips that reduces nitrate loads in subsurface drainage by providing the right environment for heterotrophic denitrification (e.g., anoxic conditions, a carbon source, a nitrate source, and denitrifying bacteria). While this simple technology has been used for a variety of applications (aquacultural effluents, seasonal municipal wastewater) [11], the most common use is treatment of nitrate in tile drainage systems in the midwestern United States, where bioreactors have provided annual nitrate load reductions between 23% and 98% (averaging approximately 45%) within agricultural tile drainage systems [12,13]. Bioreactors are generally accepted as providing roughly 25%–50% N loss reduction in the Midwest [14,15] at an installation cost of approximately $10,000 to treat 12–33 ha [16]. Sufficient hydraulic retention time and temperature are the two main controls consistently identified as important for N-removal in woodchip bioreactors [16,17,18]. This practice has proven to be “farmer-friendly” in that very little, if any, land needs to be removed from production, and only a few hours per year are required for maintenance over a life of roughly 10 years [1]. The recent rapidly growing interest in and acceptance of denitrifying “woodchip” bioreactors [17] provides an ideal opportunity to trial this technology on drainage systems within the Chesapeake Bay region, where climates (humid subtropical), cropping systems, drainage systems that often utilize surface inlets, and hydrogeology differ from that of the Midwest.
The diffusion of denitrifying bioreactor design and performance information from the midwestern United States created an ideal foundation for this work, the first-ever comprehensive evaluation of bioreactor technology for Delmarva drainage systems. As the first bioreactor performance evaluation under these specific agro-environmental conditions, this work is intended to help policy makers in the region identify a bioreactor’s N loading reduction efficiency and assess if it meets the criteria for inclusion as a Chesapeake Bay region approved practice. The main objective was to evaluate the application and performance of denitrifying bioreactors in the humid subtropical coastal plain environment of the Chesapeake Bay catchment to provide data regarding regionally specific NO3-N reduction efficiencies for this technology.

2. Materials and Methods

Three denitrifying bioreactors were installed in the fall and early winter of 2013 and 2014 in the humid subtropical mid-Atlantic coastal plain of the Eastern Shore of Maryland (Figure 1). All three sites are in the Choptank River catchment that is part of the larger Chesapeake Bay catchment.

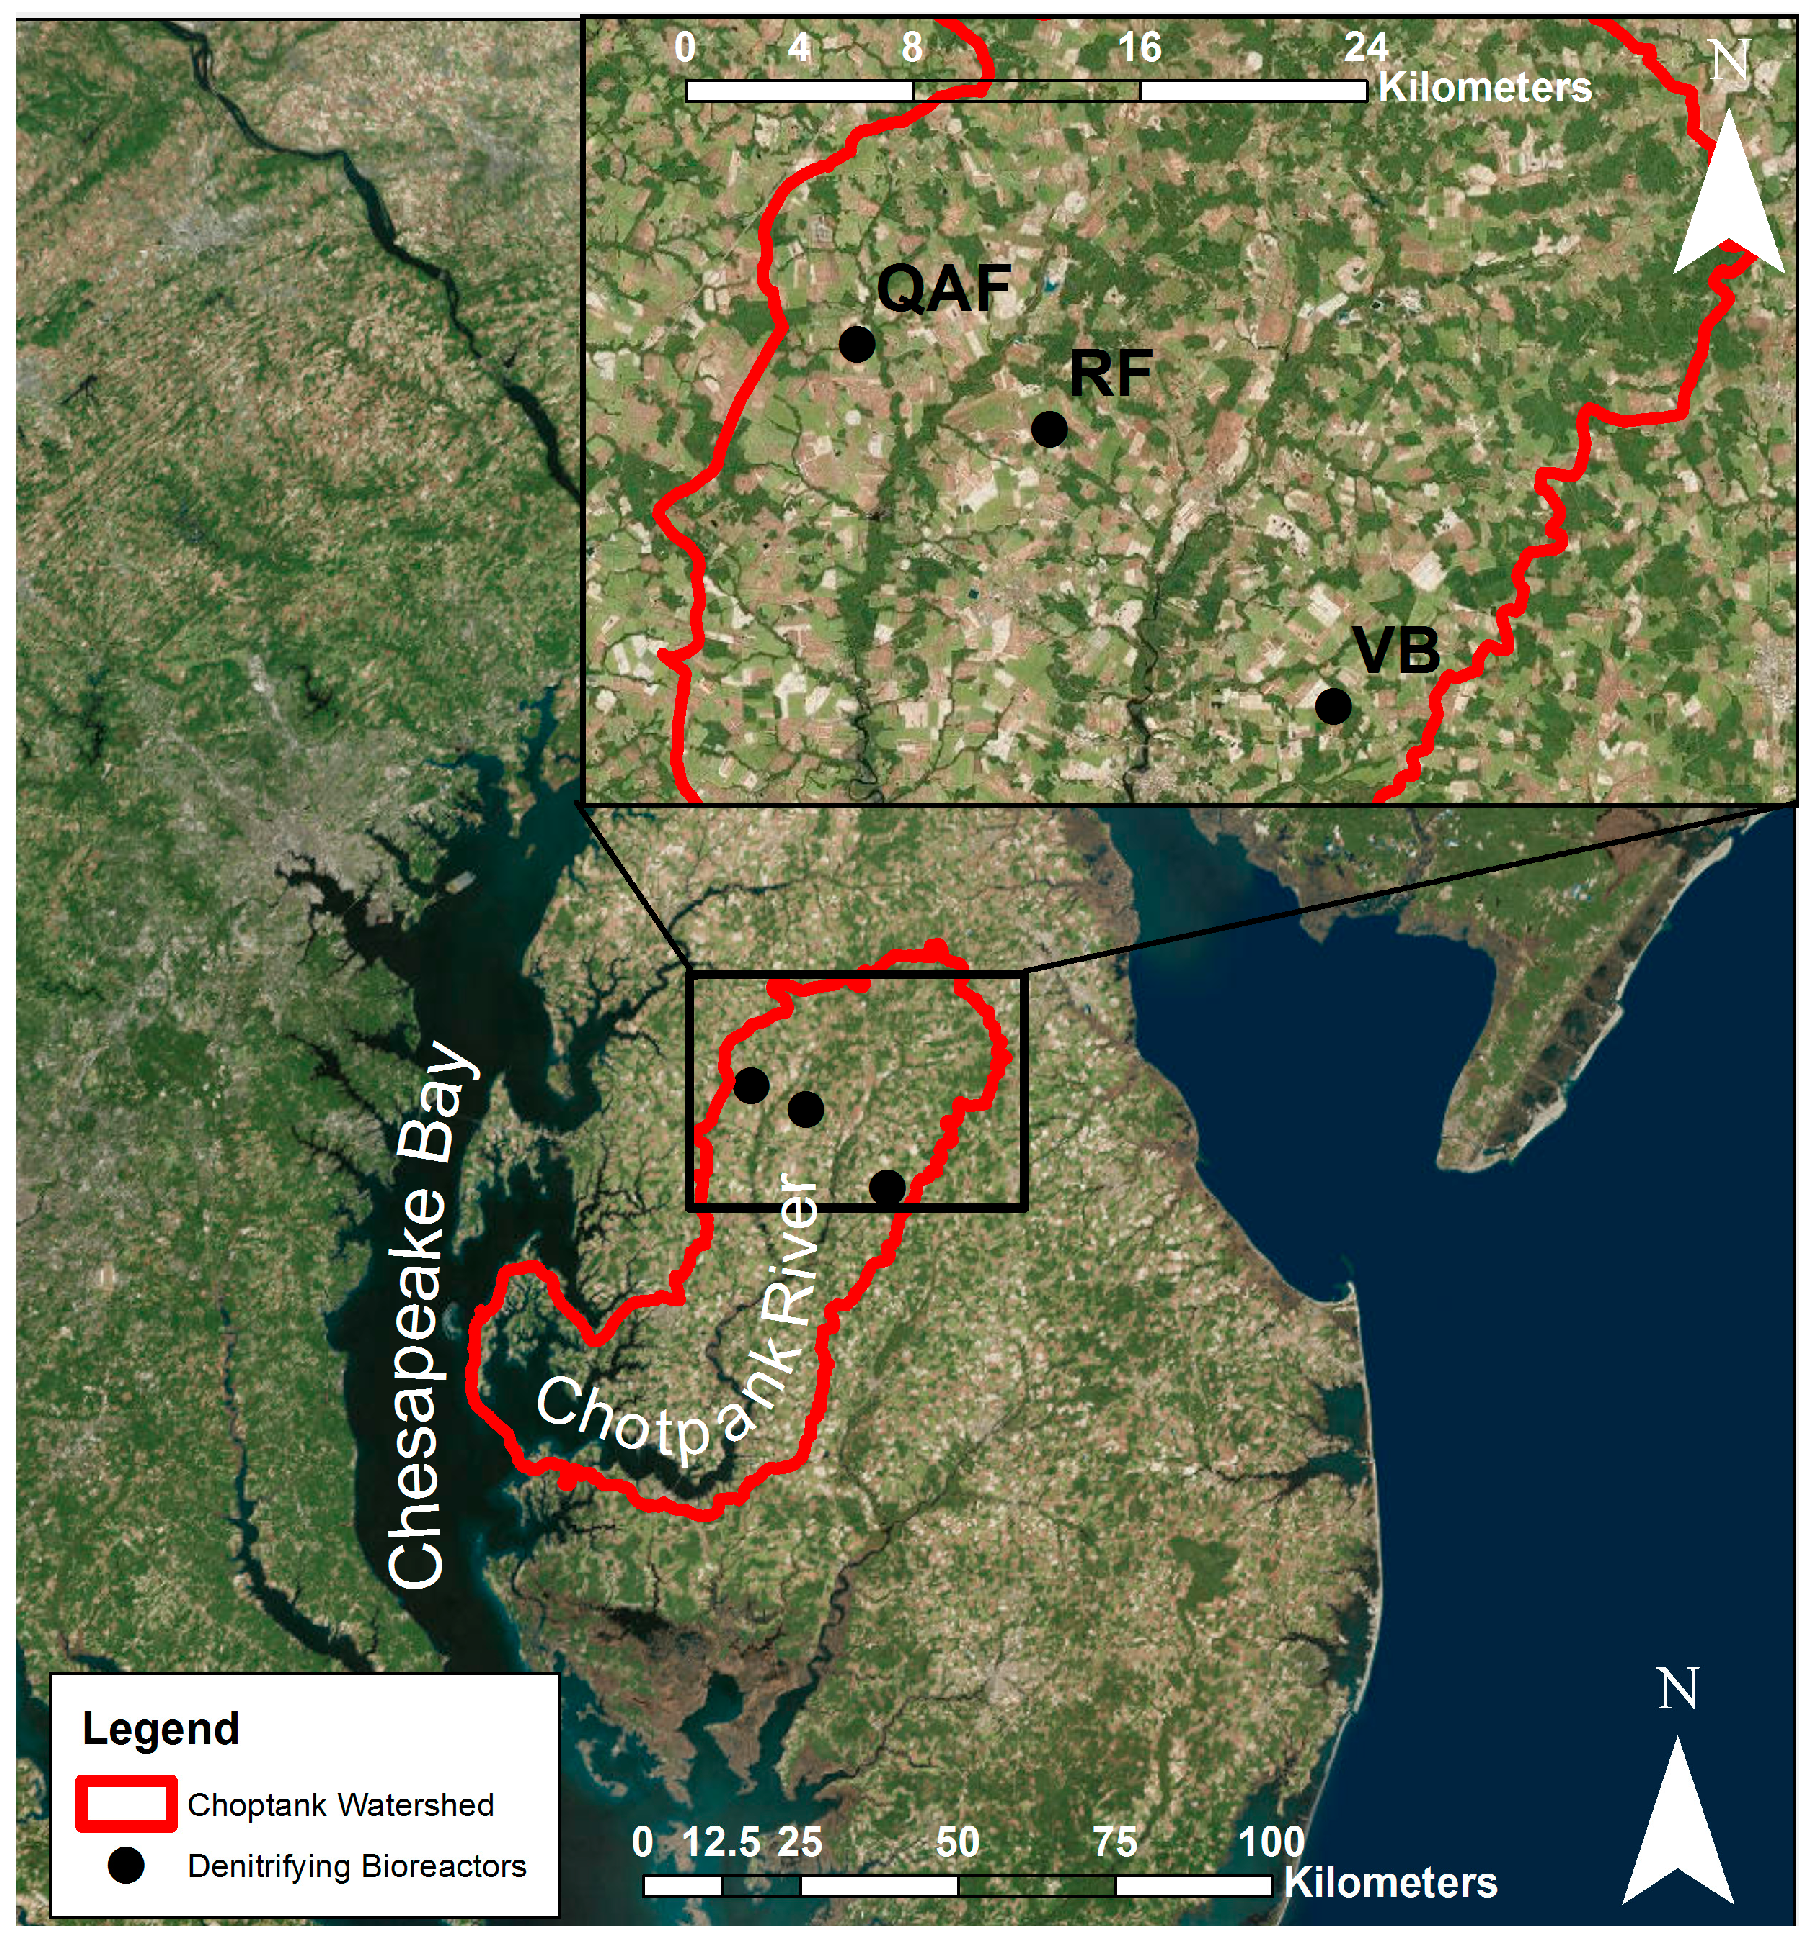
2.1. Ridgely Farm (RF)

A woodchip bioreactor (L × W × D: 30.5 m × 6.1 m × 0.91 m; trench excavated 0.91 m deep) was installed in November 2013 at the Ridgely Farm in northern Caroline County, MD (Figure 1, RF), an approximately 700-head dairy operation that also produces grain for feed (Table 1). The fields surrounding the operation are irrigated with slurry from its waste lagoon through center pivot irrigation and are also periodically fertilized with manure generated by the operation. The denitrifying bioreactor treats surface runoff from a ditch and multiple surface inlets as well as groundwater from drainage tile lines, with an estimated surface catchment treatment area of 34.7 ha. During the first time frame (8 August 2014–6 August 2015), precipitation near this site was 126.5 cm, and during the second period (6 August 2015–5 May 2016), it was 84.07 cm [19]. A 45.7 cm diameter concrete tile main from the field routed drainage water through an inlet control structure (i.e., a “diversion” control structure) and into a 20.3 cm polyethylene pipe that conveyed water to the lined bioreactor (20 mm pond liner; BTL Liners, Prineville, OR, USA). The bioreactor trench volume was designed based on information from Christianson el al. 2012 [1] and personal communication with Dr. Zachary Easton [20]. The woodchips were donated from Queen Anne’s County Department of Parks and Recreation, and composed of chipped municipal yard waste containing both hardwood and softwood and small organics (leaves) with chip size ranging from 1.3 cm × 1.3 cm to 2.5 cm × 2.5 cm. The trench was backfilled with the excavated soil and shaped into a dome to account for eventual woodchip compaction and decomposition.

2.2. Queen Anne Farm (QAF)

A woodchip bioreactor (L × W × D: 26 m × 4.6 m × 0.76 m; trench excavated 0.9 m deep) was installed at an organic grain farm in Queen Anne’s County, MD, in December 2013 (Figure 1, QAF). The fields have organic nutrients applied to them, with chicken manure being the largest source. The field is irrigated with center pivot irrigation (Table 1). The denitrifying bioreactor captures groundwater from 25.4 cm clay drainage tile lines and surface water from five surface inlets connected to the tile line. The estimated drainage area for this bioreactor was 25.2 ha. Precipitation during the first time frame (8 August 2014–6 August 2015) near this site was 126.5 cm, and during the second period (6 August 2015–13 April 2016), it was 74.68 cm [19]. The denitrifying bioreactor diverts water from a 25.4 cm diameter clay drainage tile line, though a diversion control structure, then through a 20.3 cm diameter polyethylene pipe that conveyed water to the lined bioreactor. The bioreactor trench volume was designed based on information from Christianson el al. 2012 [1]. The woodchips were similar to the woodchips used at the Ridgely Farm (RF). In addition to the bioreactor liner (20 mm pond liner; BTL Liners, Prinevlle, OR, USA), the woodchips were covered with a porous geotextile fabric. The trench was backfilled with the excavated soil and shaped into a dome.

2.3. Voorhees Farm

A woodchip bioreactor (L × W × D: 30.5 × 9.1 × 0.91 m; trench excavated 1.21 m deep) was installed at a conventional row crop farm in Caroline County, MD, in December 2014 (Figure 1, VB, Voorhees Farm Bioreactor). The fields have organic and inorganic nutrients applied to them, with chicken manure as the largest source (Table 1). The denitrifying bioreactor captures groundwater from a 25.4 cm diameter clay drainage tile main that has 15.2 cm diameter in field laterals in addition to surface water from two surface inlets connected to the tile line. The estimated drainage area for this bioreactor was 40.1 ha. Precipitation during the period (1 December 2014–31 July 2015) was 93.9 cm [19]. The denitrifying bioreactor diverts water from a 25.4 cm diameter clay drainage tile line, though a diversion control structure, then through a 30.5 cm diameter polyethylene pipe that conveyed water to the lined bioreactor. Engineering of this bioreactor was created using a spreadsheet following information from Christianson et al. 2013 [21], and is similar to the spreadsheet found on the Iowa State Extension website [22]. The woodchips were hardwood chips purchased from a local forestry supplier (Eastern Shore Forest Products, Pocomoke, MD, USA), and were consistent in size from 2.54 cm × 2.54 cm to 2.54 cm × 10.2 cm. In addition to the bioreactor liner (24 mm pond liner; BTL Liners, Prinevlle, OR, USA), the woodchips were covered with a porous geotextile fabric. The trench was backfilled with the excavated soil and shaped into a dome.

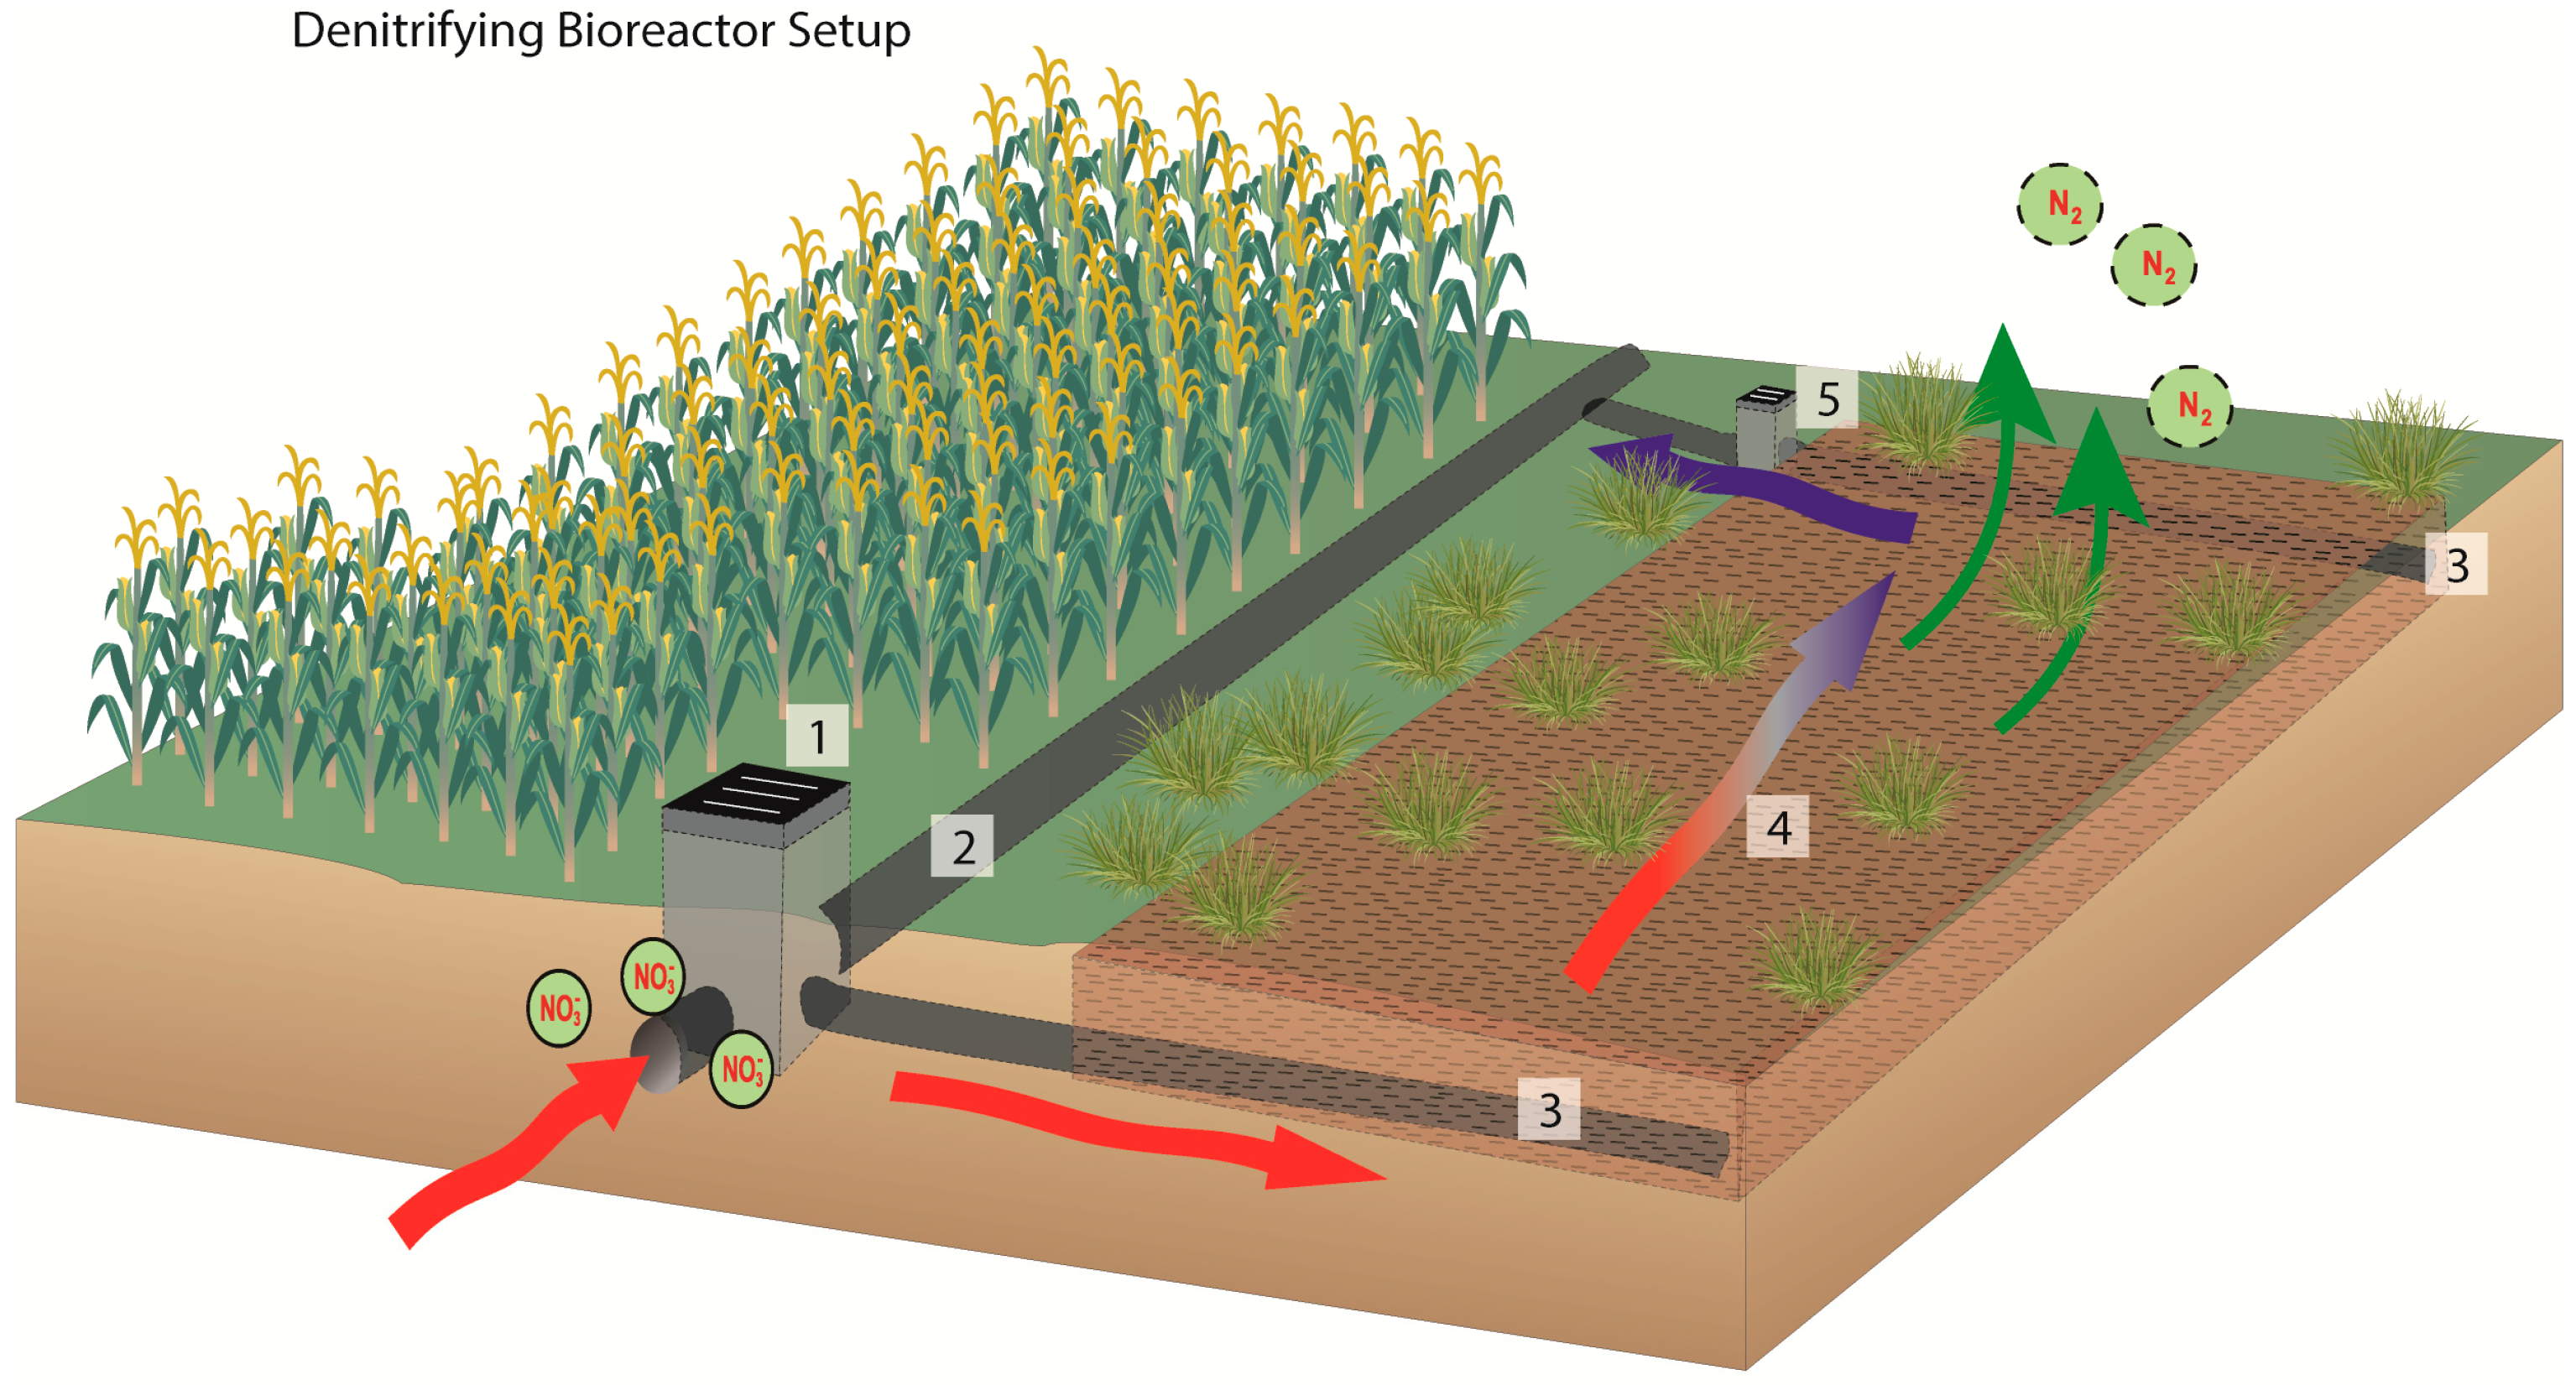
2.4. Bioreactor Sampling and Analysis

Bioreactor inflow and outflow samples were collected from the control structures and analyzed for nitrate-nitrogen (NO3-N) weekly and additional analytes every other week (orthophosphate-phosphorus, PO4-P; ammonium-nitrogen, NH4-N; total nitrogen, TN; total phosphorus, TP) at the University of Maryland Center for Environmental Science Analytical Services Lab-Horn Point Laboratory. Following Wang et al. 2003 [23], the weekly sampling events allowed greater than 90% probability that the calculated nitrate loads were within ±15% of the “true” nitrate load.
Water height in the diversion control structure (bioreactor inflow) and capacity control structure (bioreactor outflow) was continuously logged every 15 min (Solinist Model 3001 Levelogger Junior Edge F15/M5) upstream of a v-notch weir. The recorded data were corrected for both barometric pressure and the offset of control structure stop logs placed below the v-notch weir. The equation used to calculate discharge from the v-notch weirs was [24]:
Q = 1.7406 × (H)1.9531
where Q is the discharge rate in L·min−1 and H is the depth of water above the v-notch (cm). On some occasions, a compound equation was used when flow depth exceeded the height of the v-notch. This was completed by summing Equations (1) and (2), a flat weir equation where H corresponds to the additional water depth above the top of the v-notch, L is board length (cm), and Q is discharge rate in L·s−1 [25]:
Q = 0.02 × (L − 0.74) × (H) 1.48, H ≤ 0.27 L,
Q = 0.021 × (L) × (H) 1.37, H > 0.27 L
The logging transducer placed in the inflow (diversion) control structure allowed estimation of the flow bypassing the bioreactor in the overflow pipe, and the transducer in the outflow (capacity control) control structure allowed total bioreactor flow to be estimated (assuming conservation of water within the lined bioreactors, Figure 2).
During a storm event after 12 November 2015 at the Queen Anne Farm, the pressure transducer located in the diversion structure was lost and could not be located. To estimate bypass flow from the diversion structure, a natural log regression was completed on natural log transformed water height data from the capacity structure and the diversion structure for the period from 17 March 2015 to 12 November 2015. The resulting regression equation used to estimate missing diversion structure water height was:
WHB = ln ( abs ( ( 201.4402 + 81.0765 × WHC ) ) ) r 2 = 0.69 ,   p < 0.0001
where WHB is the natural log of water height in the diversion structure and WHC is the natural log of water height in the capacity structure. Water height estimates generated from this equation were then used in Equations (1) and (2) to estimate bypass discharge for the period from 12 November 2015 to 13 April 2016.
Flow data recorded every 15 min was averaged into a daily flow rate for the monitoring periods, and was used to calculate the nitrate inflow and outflow loads occurring between two water quality sampling dates. Nitrate removal efficiency was calculated as the difference between cumulative inflow and outflow loads for a given monitoring period divided by the cumulative inflow load for that period. Removal efficiency was calculated for (1) only water that was routed into the bioreactor and (2) all flow from the field including flow that bypassed the bioreactor. Volumetric nitrate removal rates (g N removed per m3 bioreactor per d) were calculated based on the entire bioreactor volume and only on days when flow was occurring (i.e., the cumulative mass of nitrate-N removed over a monitoring period divided by the full bioreactor volume divided by the number of days in the monitoring period that flow was occurring). Mean inflow and outflow nutrient concentrations were analyzed for statistically significant differences using the Mann–Whitney Rank Sum Test for non-normally distributed data (α = 0.05) (Sigma Plot 12.5).

3. Results and Discussion

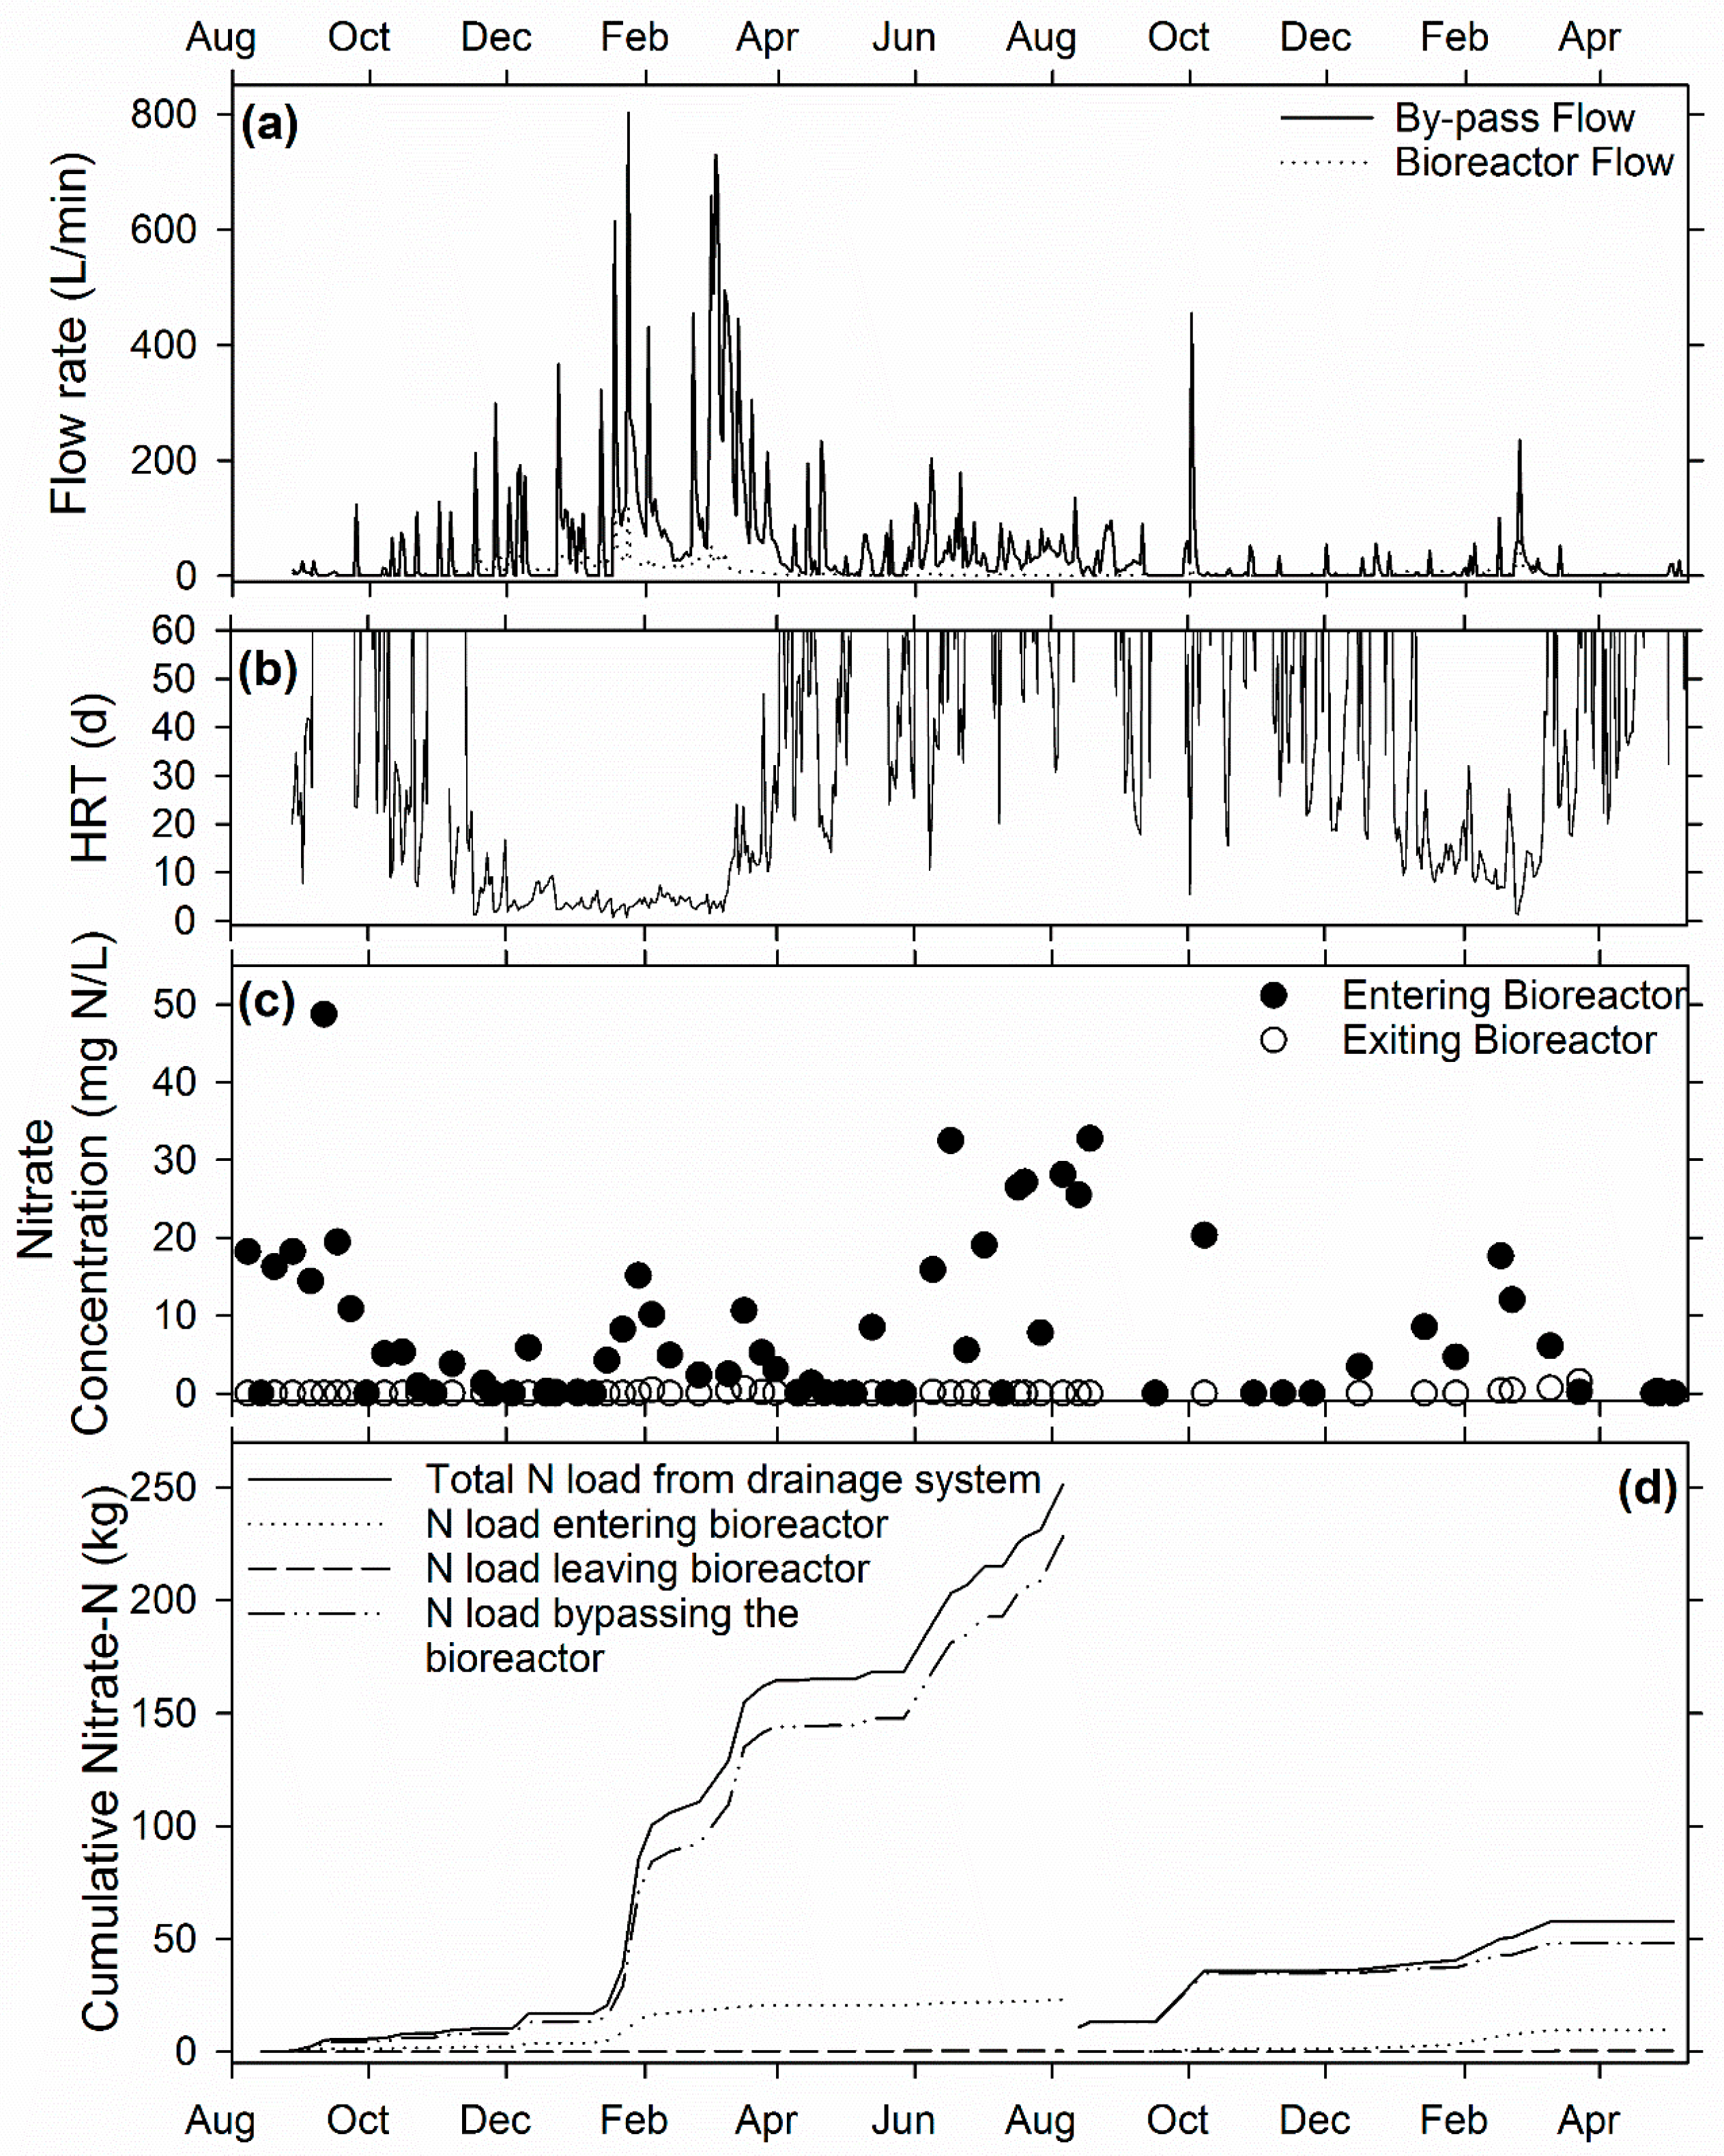
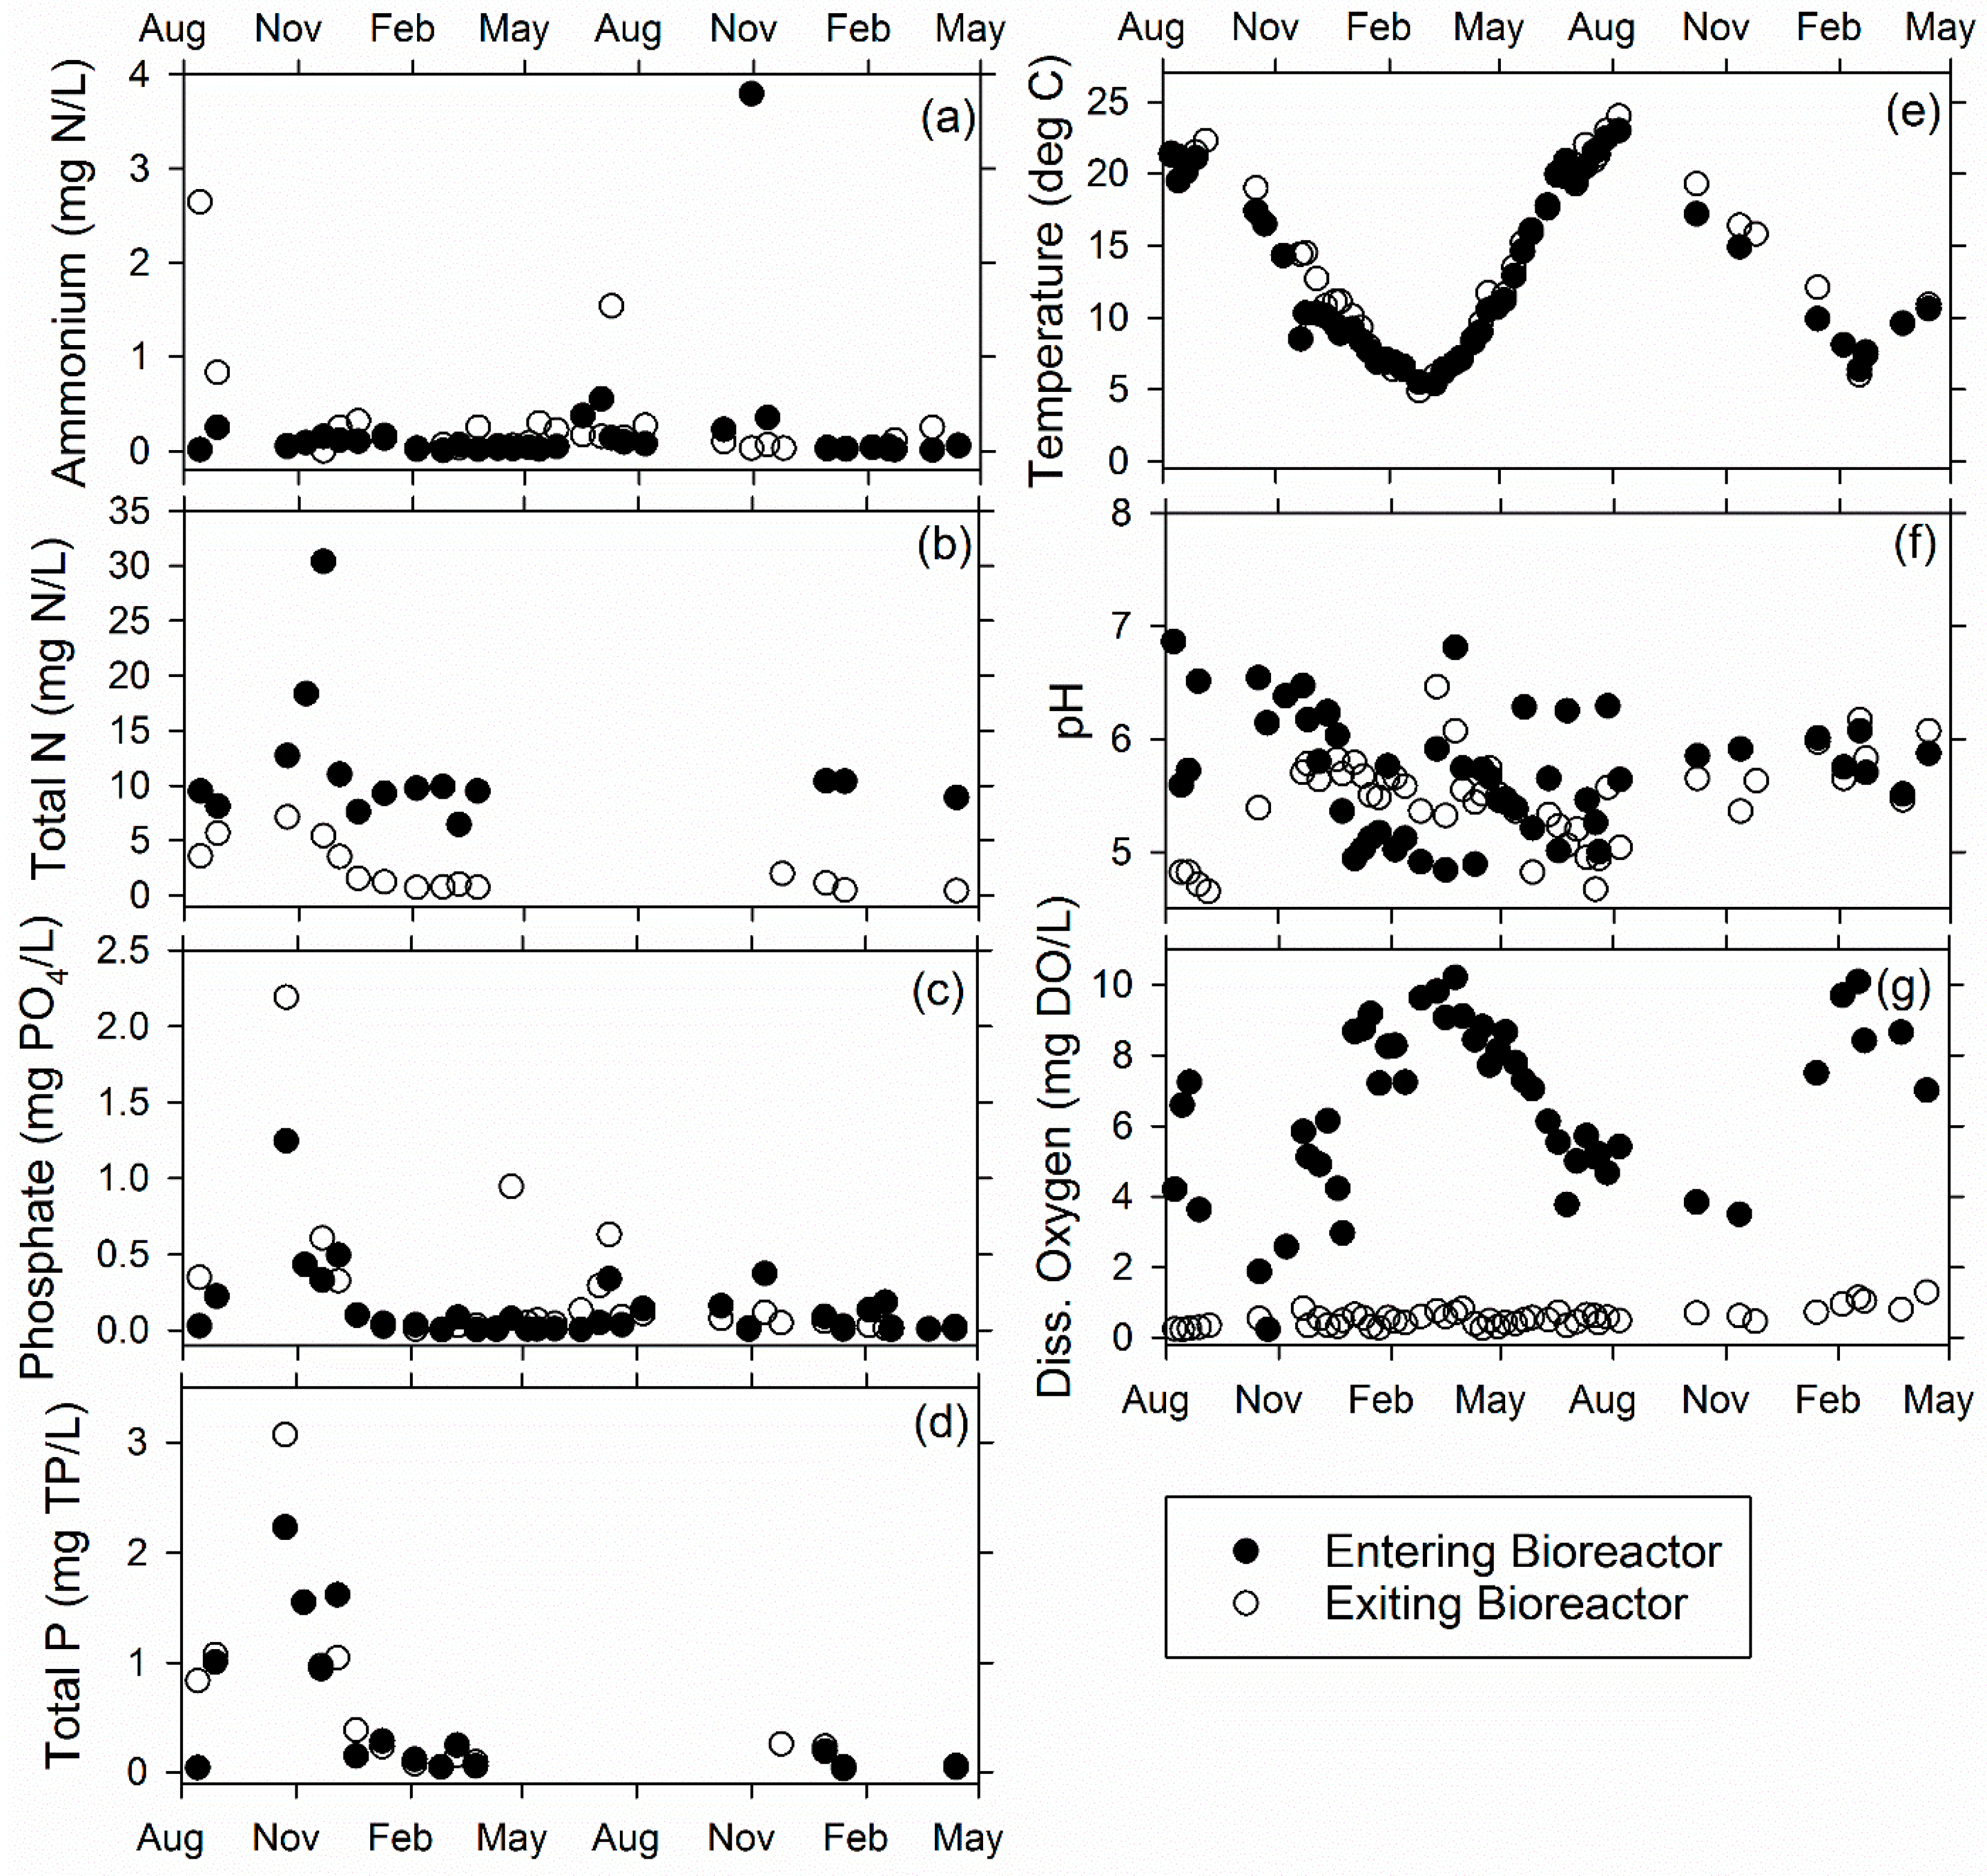
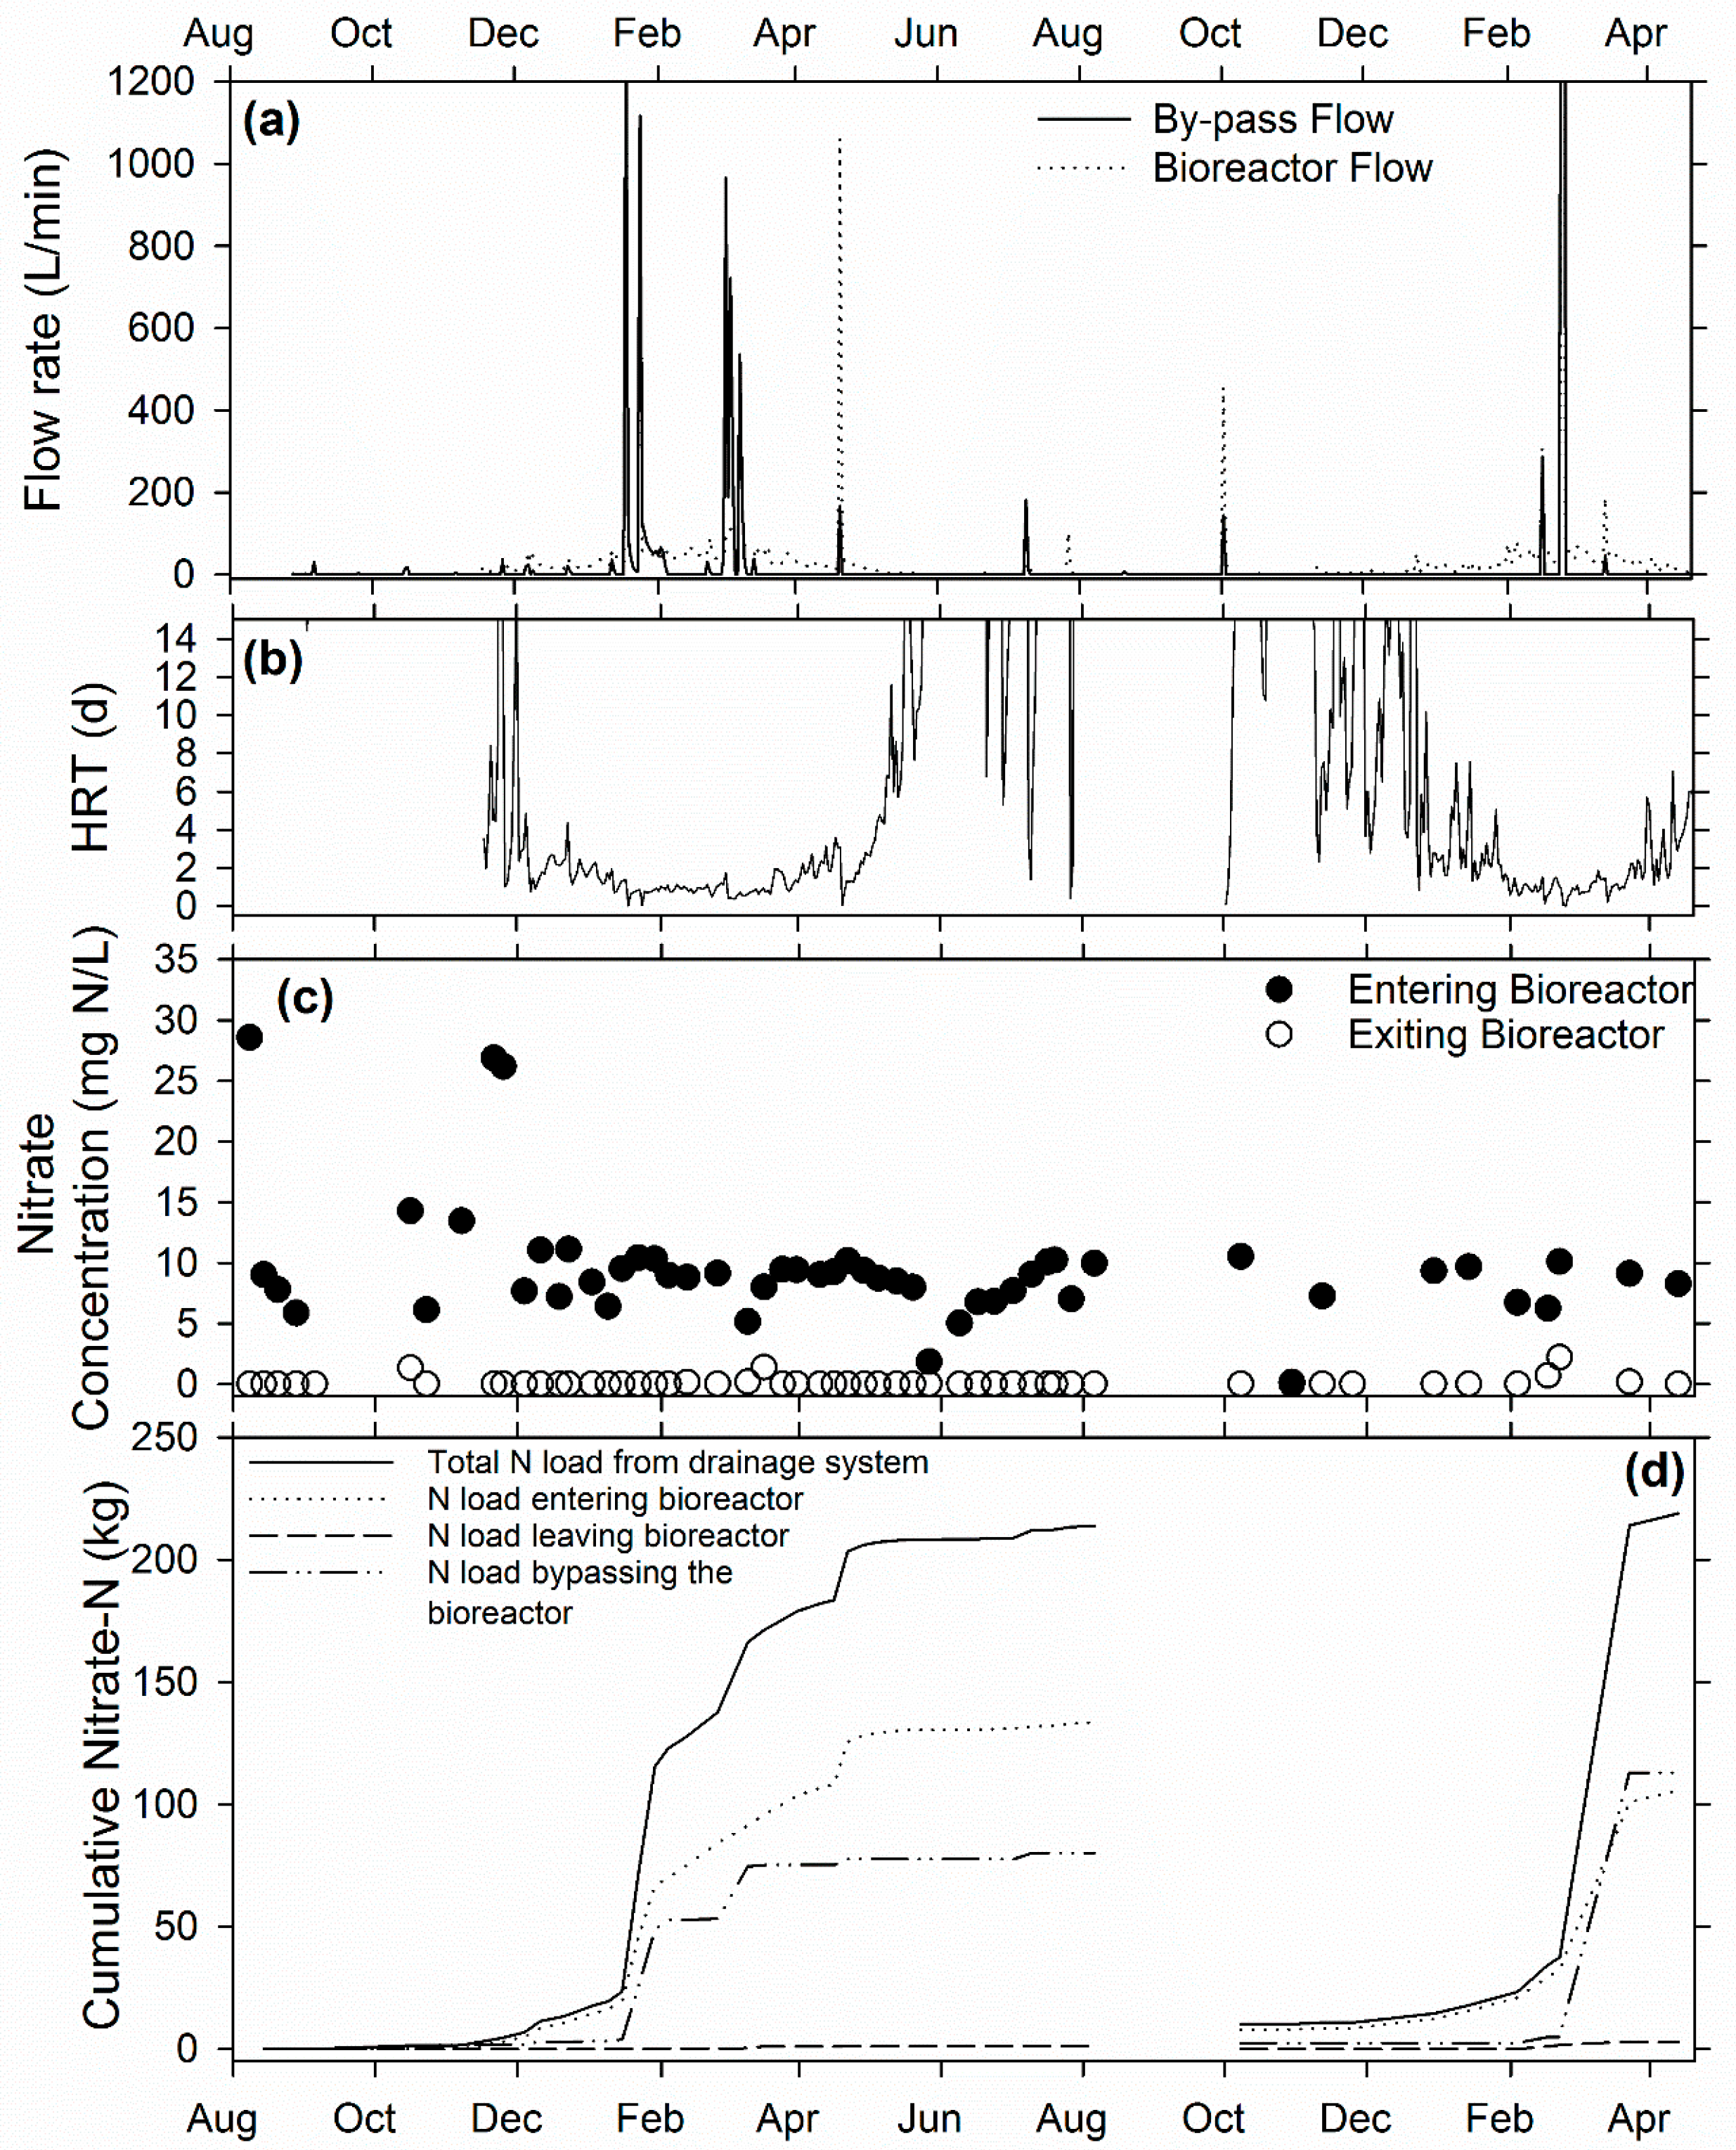
3.1. Ridgely Farm Bioreactor

Nearly complete nitrate removal was consistently achieved for the drainage water that was treated in the Ridgely Farm bioreactor (>96% bioreactor load reduction; Table 2; Figure 3c). However, when untreated bypass water was also considered, the total N load reduction ranged from 9.0% to 16% (Table 2). Only 13% to 21% of the total flow from the drainage system was routed into the bioreactor (Table 2), meaning the overall N removal efficiency of the bioreactor was capped at 13% to 21%. The low volume of flow routed into the bioreactor was most likely due to differences in pipe size between the tile line and bioreactor compounded with poor hydraulic conductivity of the woodchips (small organic material (leaves) mixed in), and small head gradient through the system. Additionally, the bioreactor was undersized for the diameter of the tile line. According to the Natural Resource Conservation Service practice standard, that was developed two years after the installation of this bioreactor, the bioreactor should be able to treat 15% of the peak flow, in this case the Ridgely Farm bioreactor should have been at least 14 m wide (>2× wider) to achieve this capacity [22].
Bioreactor hydraulic retention times were generally much greater than 10 days, except for high flow periods between mid-November 2014 and mid-March 2015, and between January and February 2016 (Figure 3b; retention time calculated assuming 70% woodchip porosity and bioreactor LWD: 30.5 m × 6.1 m × 0.91 m). These overly long retention times resulted in the majority of bioreactor outflow nitrate concentrations being below 0.5 mg NO3-N/L, which meant that the bioreactor was operating under N-limited conditions. This N-limitation led to relatively low nitrate removal rates of 0.40 and 0.21 g·N·m−3·day−1 (removal rates calculated based on the entire bioreactor volume and only on days when flow was occurring). Christianson et al. 2012 [1] reported that N removal rates at four bioreactors in Iowa ranged from 0.38 to 7.76 g·N·m−3·day−1 and David et al. 2016 [18] reported removal rates of 1.2 to 11 g·N·m−3·day−1 for a bioreactor in Illinois. A recent bioreactor meta-analysis found the 5th and 95th percentiles for reported nitrate removal rates were 2.9 and 7.3 g·N·m−3·day−1, respectively [17]. The flow-weighted inflow nitrate concentrations for each monitoring period were 4.65 and 7.64 mg NO3-N/L (Table 2) because the majority of flow occurred in the winter and early spring when nitrate concentrations were relatively lower (Figure 3a,c). However, the bioreactor was very effective at providing complete reduction of relatively high inflow nitrate concentrations of greater than 20 mg NO3-N/L (June–October 2015).
Bioreactor outflow ammonium concentrations were elevated particularly from June through September 2015 (>40 mg NH4-N/L; Figure 4a). This may have been due to potential drift or runoff of onsite dairy wastewater applications into the bioreactor, as these high concentrations have not been observed at other bioreactors. The potential impact of the irrigated dairy wastewater at this site may also have caused the very high concentrations of total N in the bioreactor inflow between September 2014–January 2015 and in early spring 2016 (40–70 mg TN/L; Figure 4b). Looking across the N balance during this period, summing the nitrate (which included nitrite) and ammonium concentrations and subtracting that sum from the total N concentration leaves a balance of >20 mg N/L unaccounted for during several winter 2014–2015 sample events. This unaccounted-for N was plausibly due to organic N, of which the wastewater was the likely source. Nevertheless, there was a statistically significant difference between inflow and outflow total N concentrations when assessed over the entire monitoring period, indicating that the bioreactor had a positive overall water quality impact for total N (Table 3; TN p < 0.001; NO3-N p < 0.001; NH4-N p = 0.846).
High-temporal frequency data collected during a storm event in March 2015 corroborated that surface runoff, and potentially surface runoff of applied wastewater, contributed to bioreactor inflow (Figure 5). The temperature of water entering the bioreactor markedly increased consistent with the inflow hydrograph (solid lines in Figure 5a,b). The temperature of the outflow water remained consistently 4.5 ± 0.08 °C over this period (mean ± standard deviation (SD); Figure 5b). This storm hydrograph also coincided with dilution of the bioreactor inflow nitrate concentrations and spiking of the inflow ammonium and phosphate concentrations (between 15:00 and 17:00 on March 10; Figure 5c–e).
Phosphorus concentrations in both the Ridgely Farm bioreactor inflow and outflow were nearly always higher than concentrations known to impair freshwater (0.03 mg TP/L; Figure 4c,d) [26]. Flushing of phosphorous has been observed during start-up at other bioreactors [18,27], but concentrations as high as seen here are likely related to the farm characteristics (see above). Nevertheless, there was a statistically significant difference between bioreactor inflow and outflow phosphate concentrations, but no overall significant impact on total phosphorus concentrations when assessed over the entire monitoring period (Table 3; PO4 p = 0.004; TP p = 0.097).
Anaerobic conditions were consistently achieved in the Ridgely Farm bioreactor with outflow concentrations averaging 0.54 ± 0.28 mg DO/L (mean ± SD; Figure 4g; Table 4). There were large seasonal fluctuations in temperature ranging from >20 °C in late summer to <5 °C in early spring (Figure 4e). While temperature is known to be a strong influencer of denitrifying bioreactor N removal performance [1,18], the small amount of flow here outweighed the impact of temperature, and N removal inside the bioreactor was near complete throughout the monitoring period. The outflow water temperature tended to be slightly greater than the inflow water temperature, particularly in the cooler months. The bioreactor also provided some buffering of pH with the highly variable inflow pH (4.9 to 7.8) stabilized to a pH that averaged 6.0 (Table 4). Analyzed over the entire dataset, there were statistically significant differences between bioreactor inflow and outflow water temperature (warmer outflow) and pH (p = 0.024 and <0.001, respectively), but there were no such differences between inflow and outflow for DO, SPC, and ORP values likely due to the variability of inflow (p = 0.051, 0.101 and 0.283, respectively; Table 4).

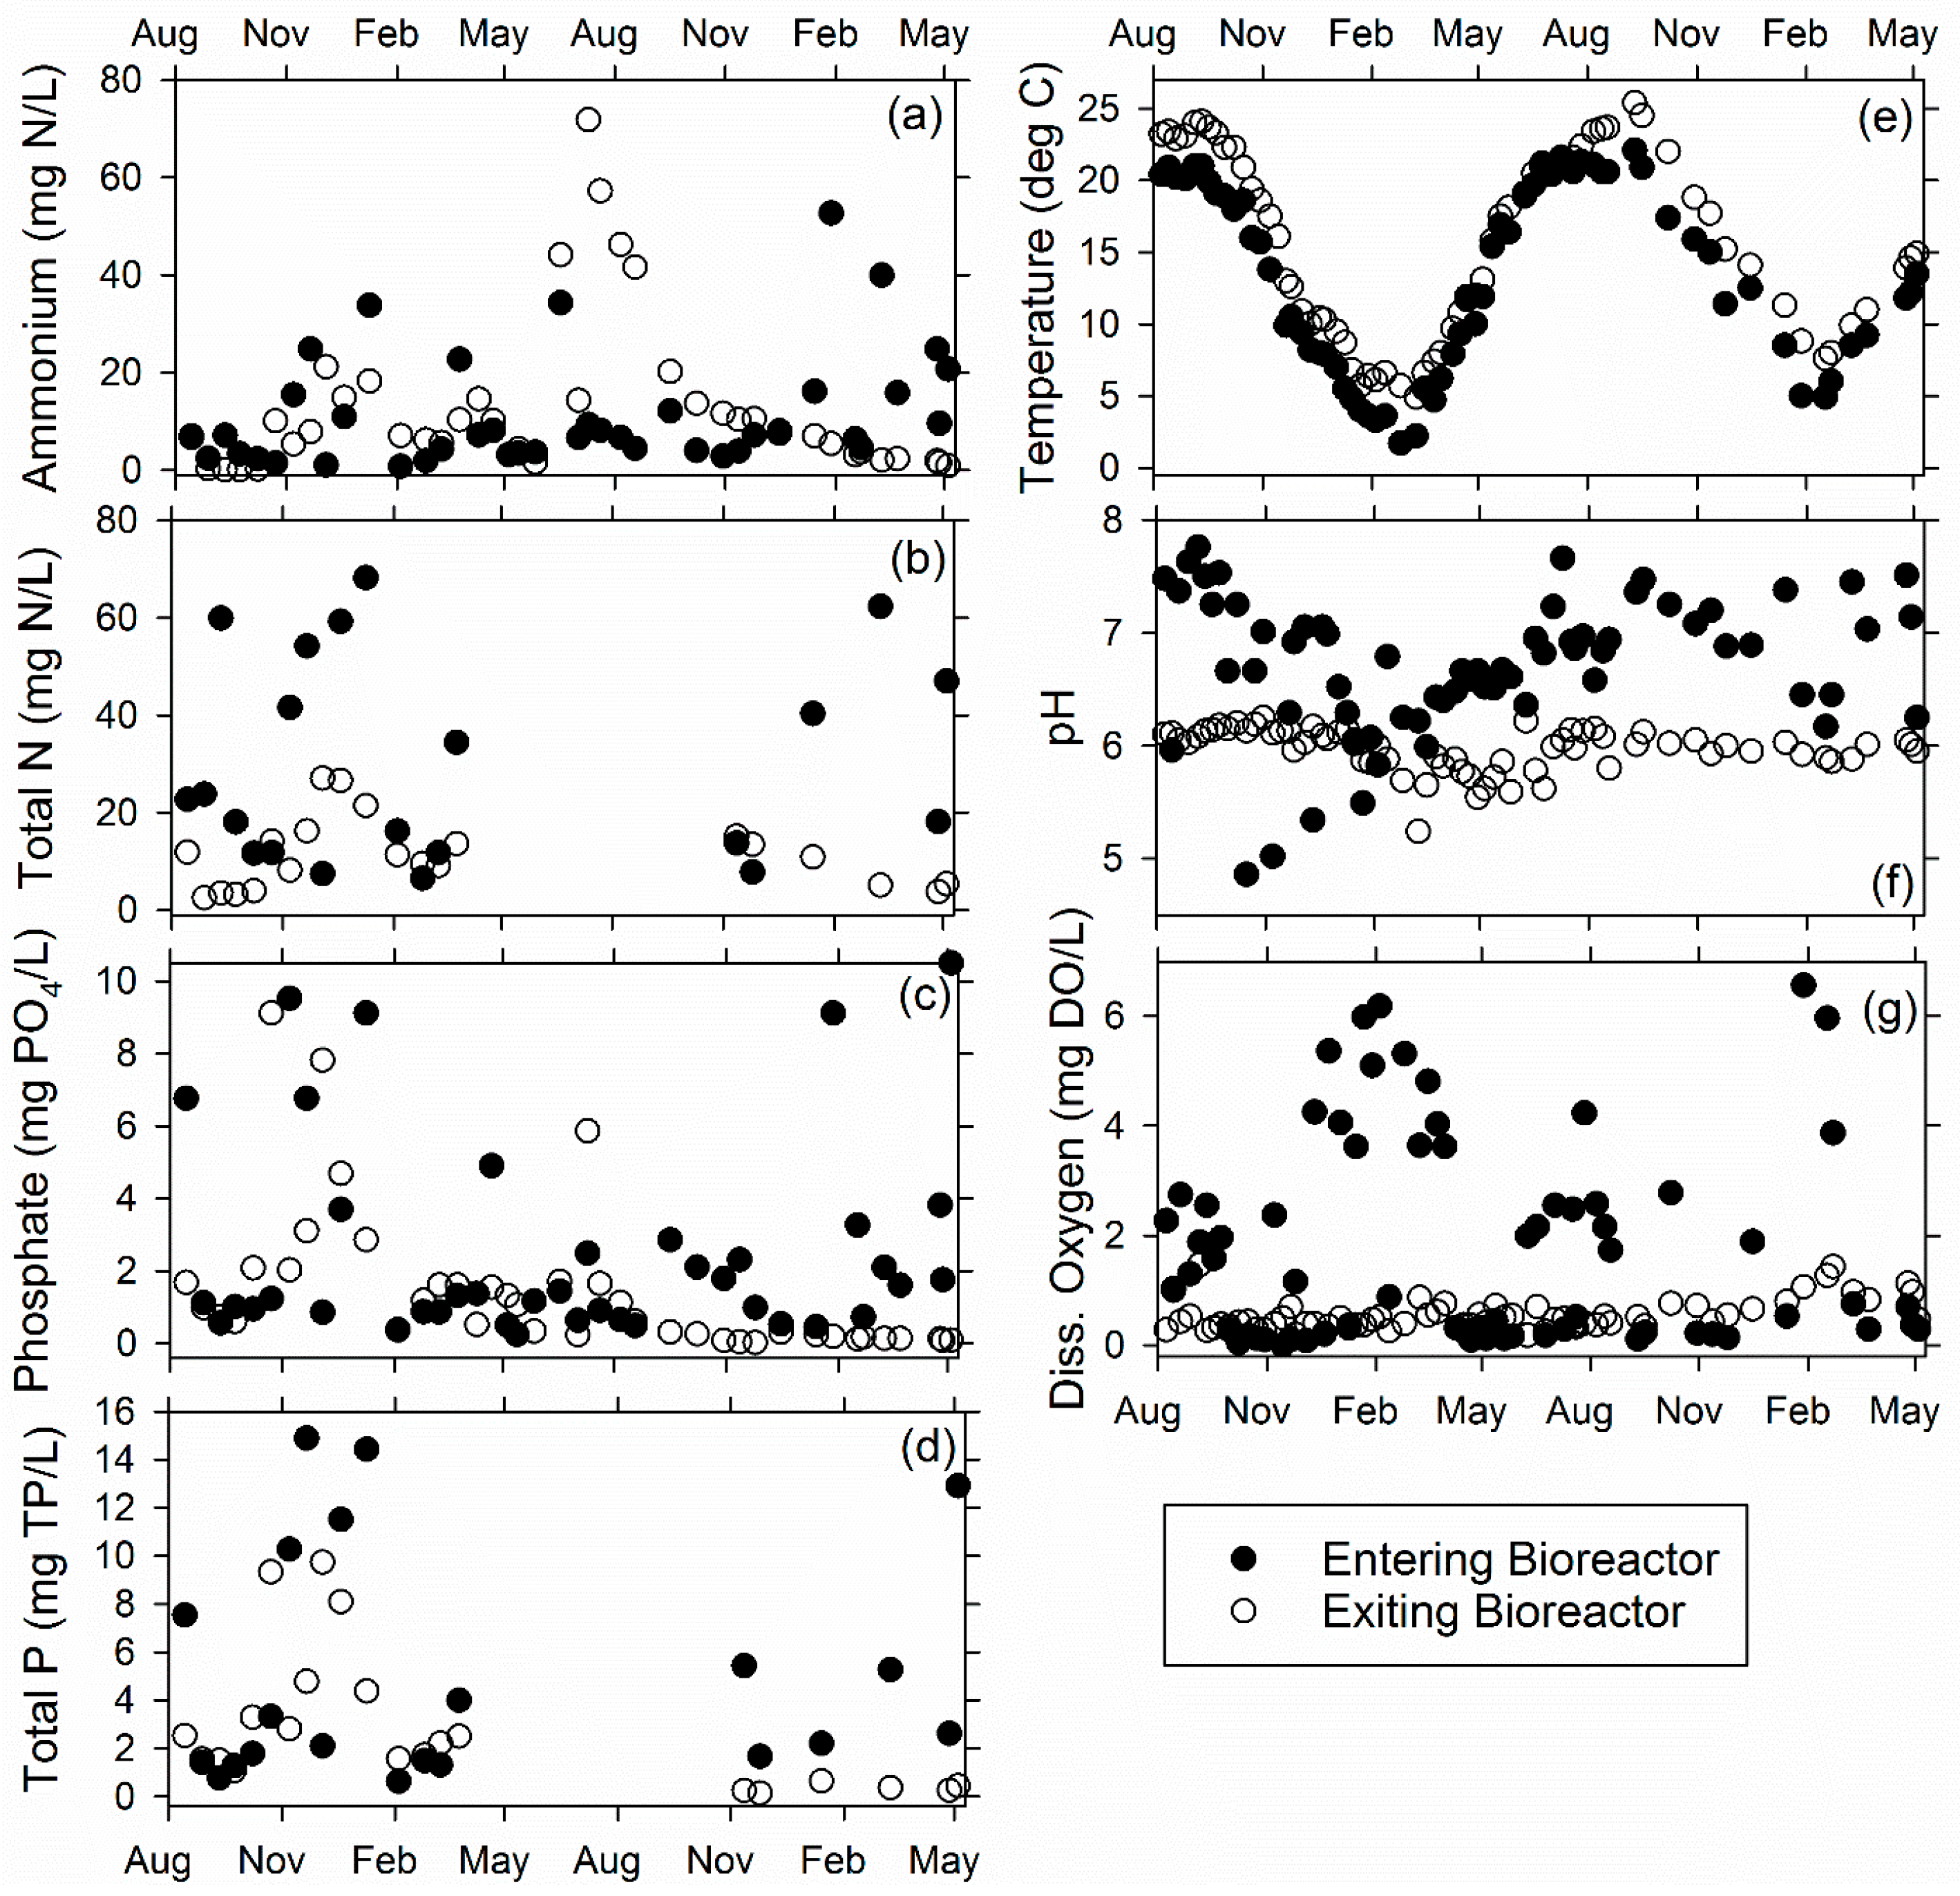
3.2. Queen Anne Farm Bioreactor

Nitrate removal in the Queen Anne Farm bioreactor was achieved to a similar extent as at the Ridgely Farm bioreactor (>97% bioreactor load reduction; Table 2; Figure 6c). The Queen Anne Farm bioreactor was more appropriately sized when compared to the Ridgely Farm bioreactor, achieving better flow dynamics (% of total water volume treated) and a greater overall N load reduction was achieved when bypass flow was considered (47%–62%; Table 2). The Queen Anne Farm bioreactor treated at least half of the flow during both monitoring periods (59% and 50%), and although there was less total flow at this site than the Ridgely Farm site (24,400 vs. 37,000 m3; Table 2), the Queen Anne bioreactor actually treated a greater flow volume than the Ridgely Farm bioreactor (24,400 × 59% = 14,400 m3 treated is greater than 37,000 × 13% = 4800 m3 treated).
Similar to the Ridgely Farm bioreactor, the Queen Anne Farm bioreactor retention times were generally much greater than a week, except during periods of storm flow (December 2014–April 2015 and December 2015 onward; Figure 6b) (Retention time was calculated assuming 70% woodchip porosity and bioreactor LWD: 26 m× 4.6 m × 0.76 m). Resulting flow-weighted bioreactor outflow nitrate concentrations were not more than 0.30 mg NO3-N/L (Table 2), which indicated N-limited conditions. Even during two major bypass events (mid-January and early March 2015; Figure 6b), when the flow rate in the bioreactor increased and the bioreactor retention times dropped below 1 day, nitrate removal was not negatively impacted as evidenced by continued near-complete nitrate removal (Figure 6c). Nevertheless, the Queen Anne Farm bioreactor had much higher N removal rates (5.36 and 5.12 g·N·m−3·day−1; Table 2) than the Ridgely site; these rates were more aligned with previous research for tile drainage bioreactors [1,18].
Drainage at the Queen Anne Farm site was consistent with the majority of the total N load being in the nitrate form as expected for shallow groundwater and tile drainage (Figure 7a,b). Similar to the Ridgely site, when assessed over the entire monitoring period, only nitrate-N and total N inflow values were statistically significantly different from the outflow (Table 4; NO3-N p < 0.001; NH4-N p = 0.304; TN p < 0.001; PO4-P p = 0.807; TP p = 0.836). Phosphorus levels were much lower in the inflow and outflow than at the Ridgely bioreactor, and there was no consistent trend for removal or contribution of phosphorus by the bioreactor (Figure 7c,d). Comparing across the Queen Anne bioreactor dataset showed that bioreactor inflow DO, pH, and ORP values were statistically significantly greater than outflow values (p = <0.001, 0.025, and <0.001, respectively), but there were no such differences between inflow and outflow for water temperature and SPC (p = 0.441 and 0.997, respectively) (Figure 7e–g; Table 4).

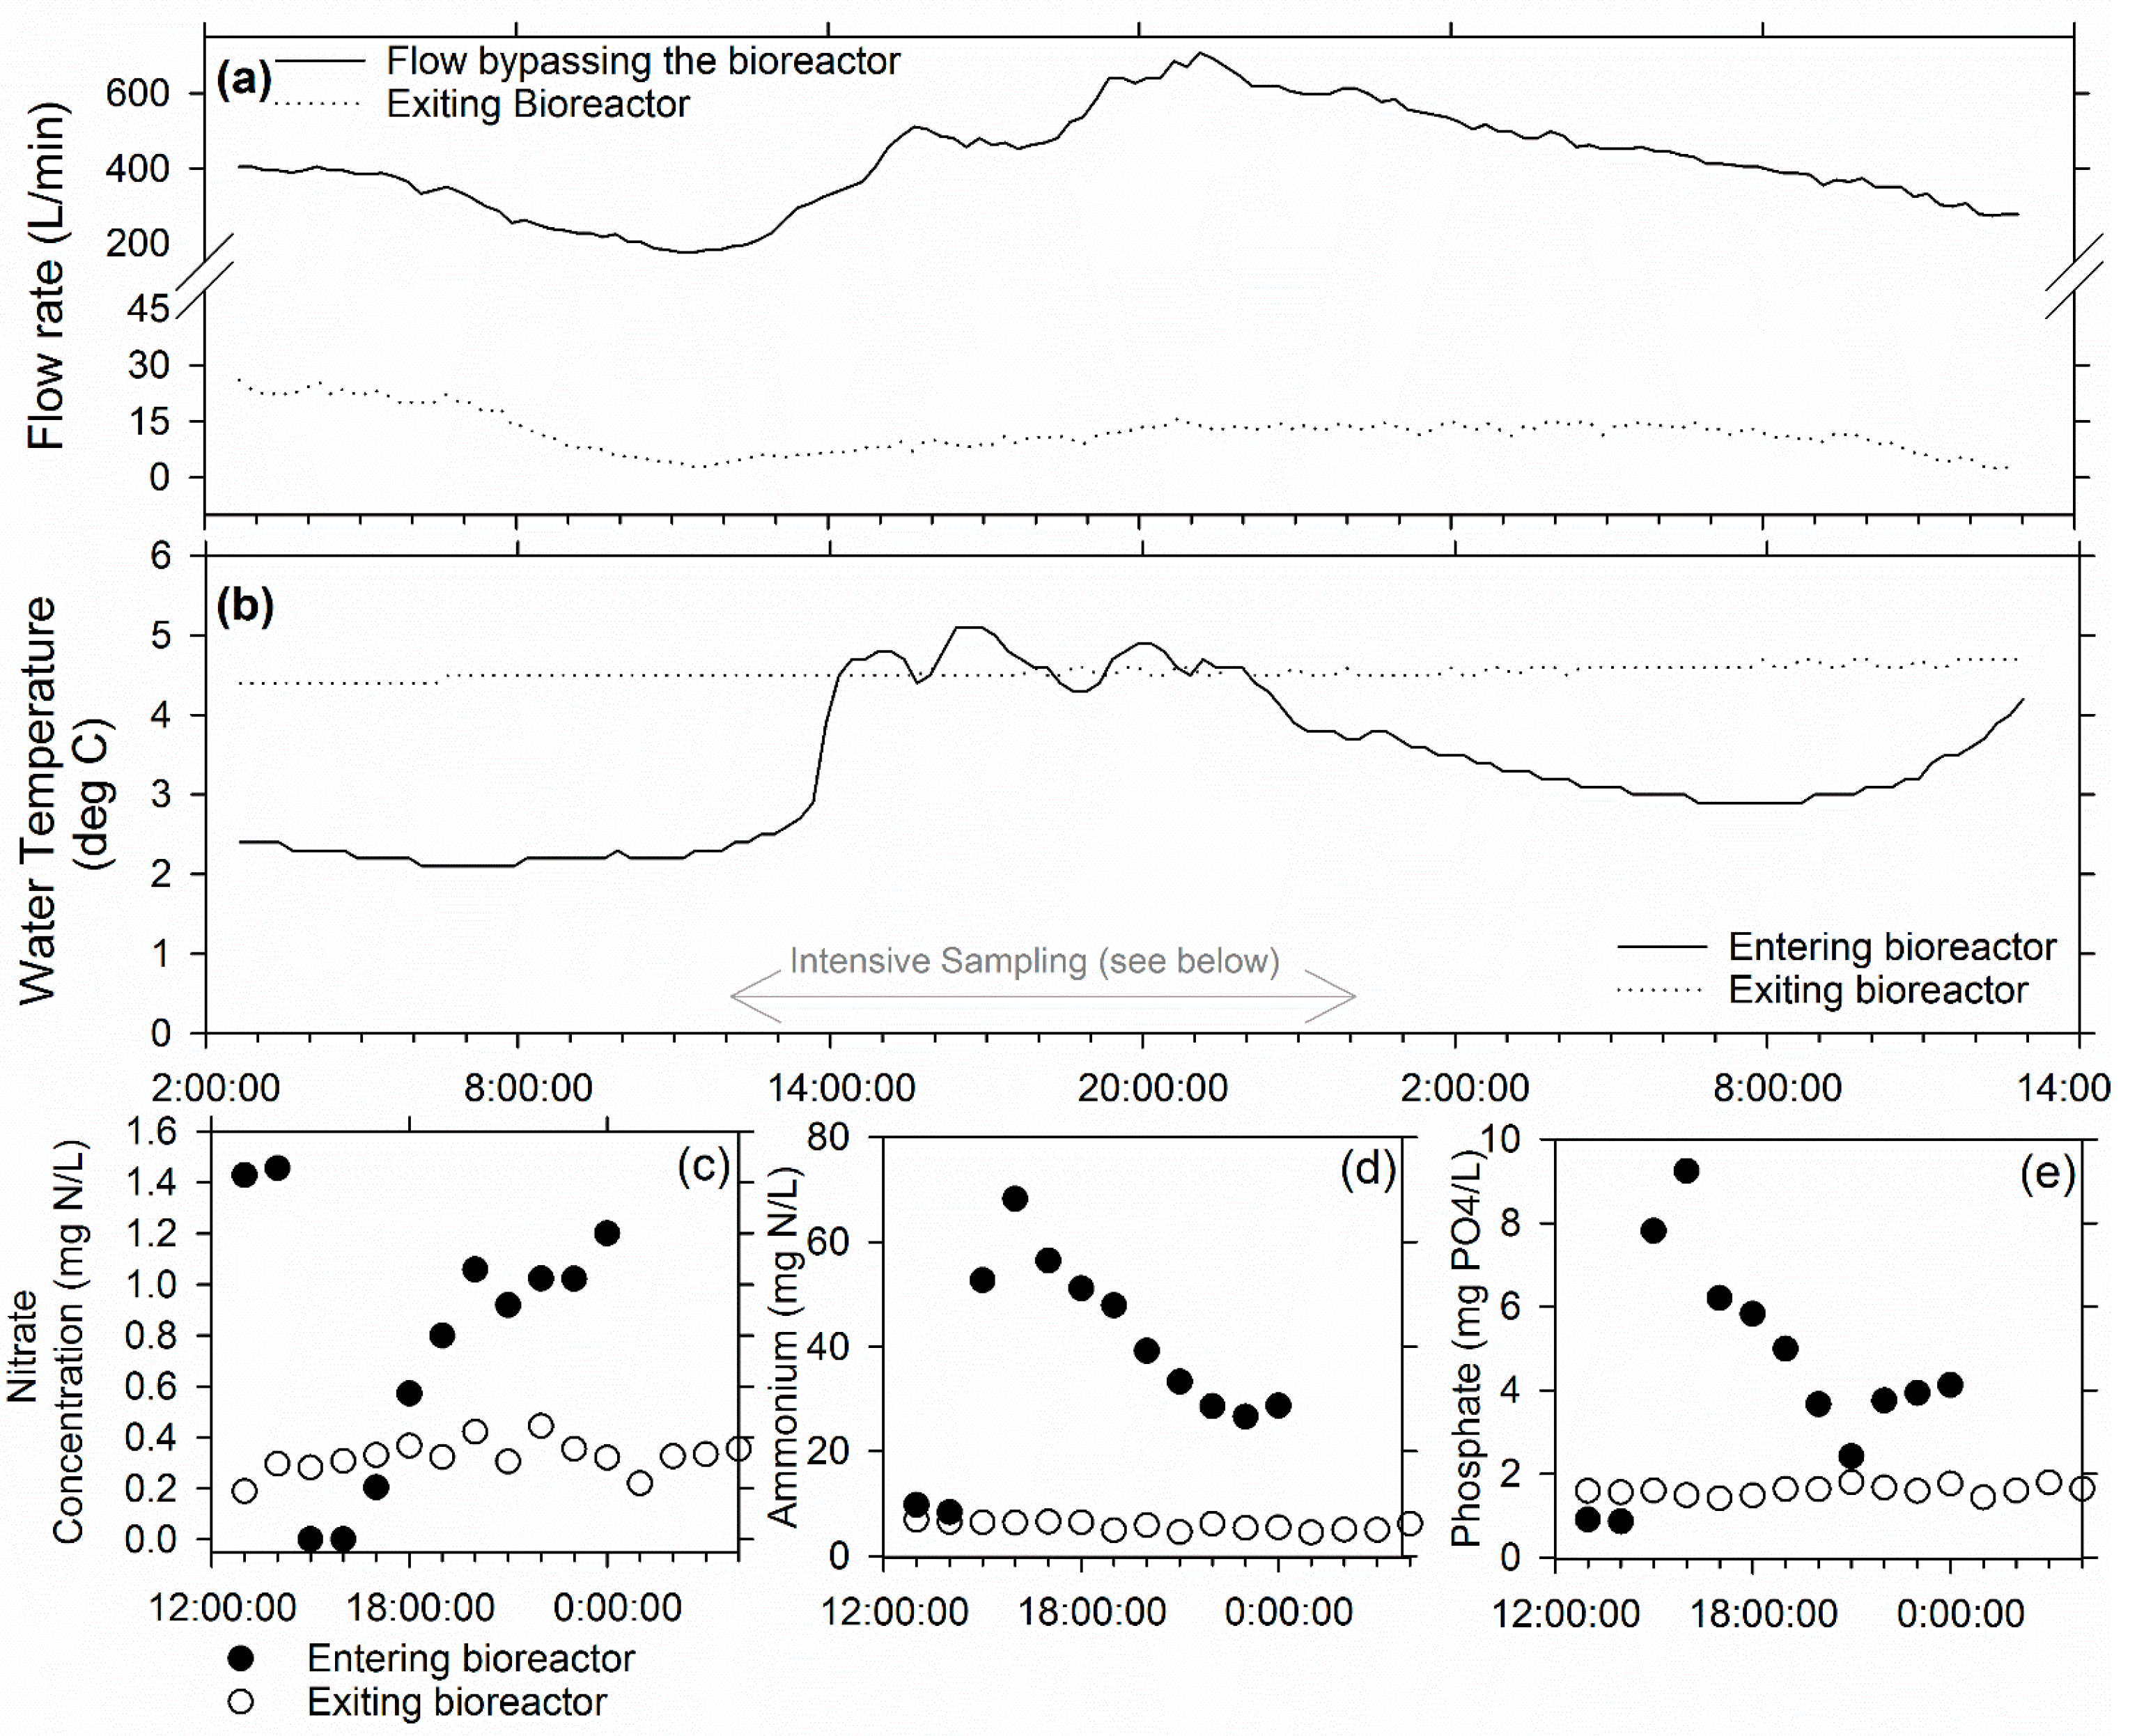
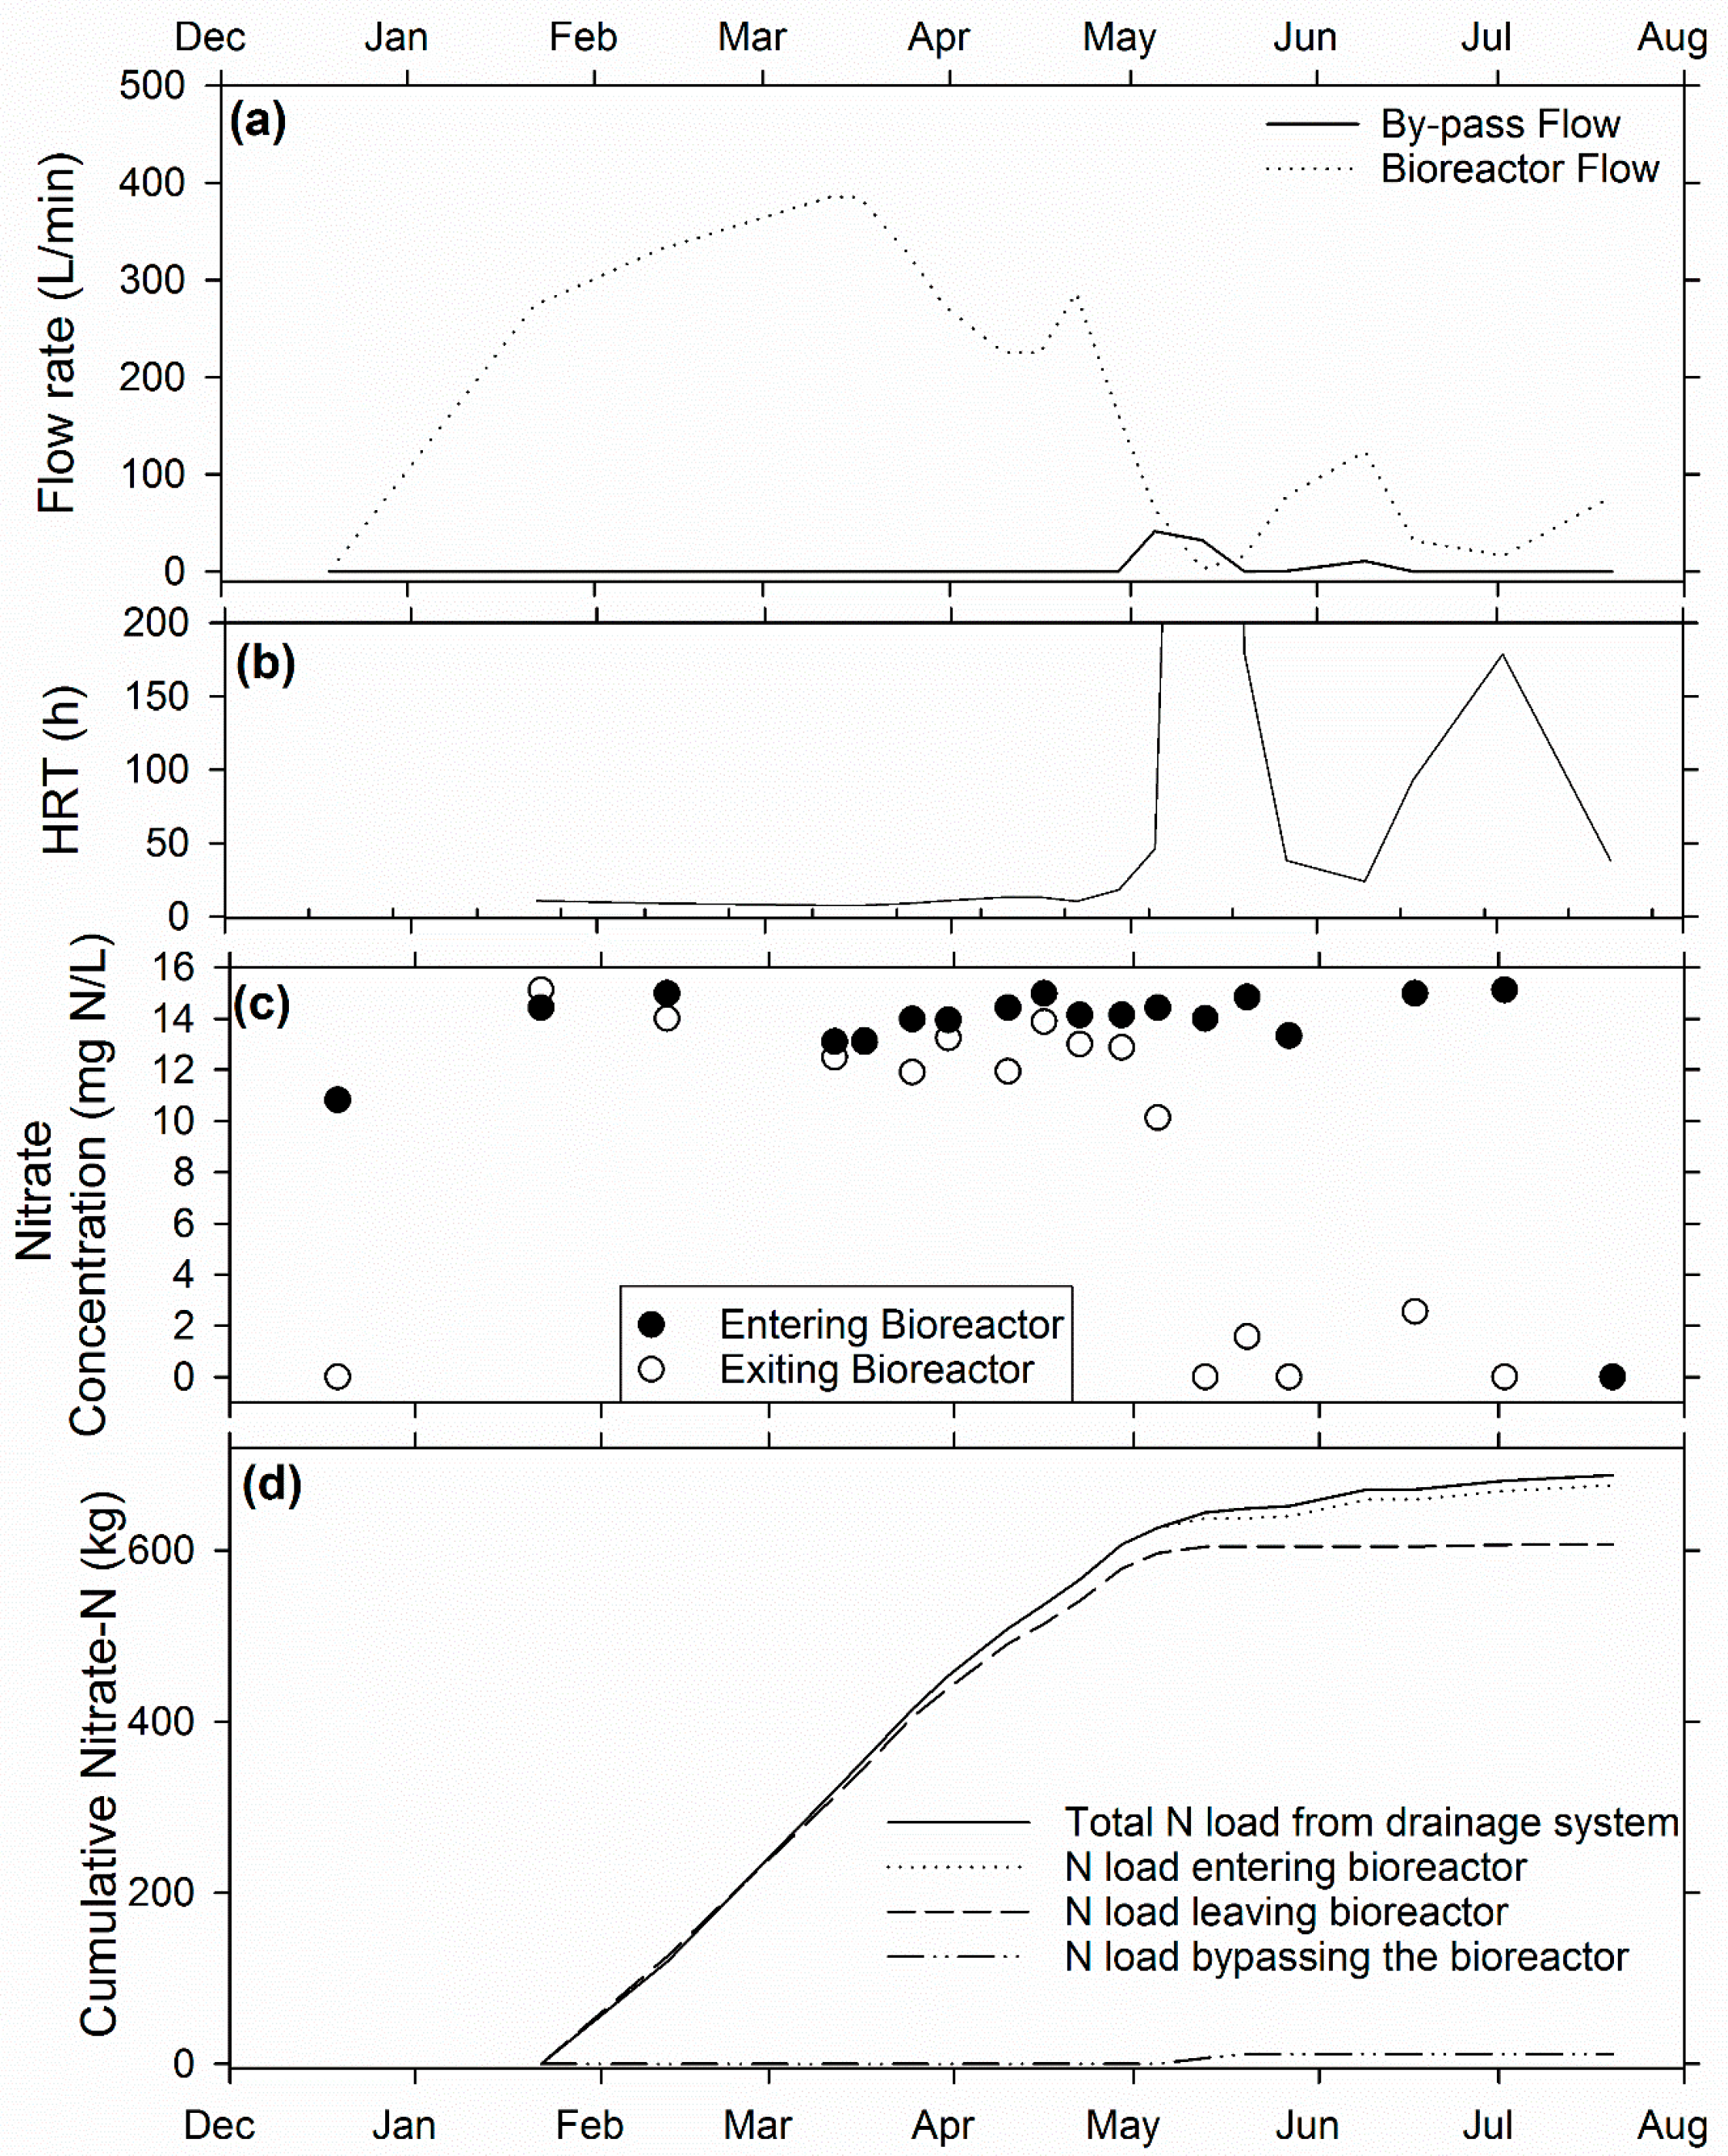
3.3. Voorhees Farm Bioreactor (VB)

The Voorhees bioreactor was installed later than the Ridgely Farm or Queen Anne Farm bioreactors, but these data were nevertheless included to provide additional insight into bioreactor N load reduction contributions in Maryland. Monitoring only spanned December 2014–July 2015, but this site provided a contrast in that, while nearly all the drainage flow was routed into the bioreactor (98%), the bioreactor only removed 10% of the treated water’s nitrate load (Table 2). While this 10% removal efficiency seemingly was not very high, the 70 kg N removed by the Voorhees bioreactor during this period resulted in a moderate N removal rate (1.53 g·N·m−3·day−1) compared especially with the Ridgley site (0.21 to 0.40 g·N·m−3·day−1, Table 2). This site is a good example of optimizing the percentage of drainage water treated in the bioreactor, and could benefit from a longer retention time. Omitting one outlier (13 May 2015), the average retention time was 42 ± 56 h (Figure 8). This is in contrast to the other two bioreactors, where the overly long retention times precipitated a 99% removal efficiency for N in the treated water, but where the overall N reduction was limited by the relatively low percentage of water treated (the Ridgely site, especially).

3.4. Overall Bioreactor Performance and Comparison

Nitrate-nitrogen removal was achieved at all bioreactors in all monitoring periods. Total removal ranged from 10 to 133 kg N with removal efficiencies of 9.0% to 62% and N removal rates of 0.21 to 5.36 g N removed per m3 of bioreactor per day. Based on N load weighting across all sites and monitoring periods, the total removal efficiency of these bioreactors was 24% (summation of Table 2’s “Total nitrate load IN” minus the sum of “Total nitrate load OUT,” the quantity of which was divided by the sum of “Total nitrate load IN”: (1430 − 1092)/1430 = 24%). However, flow and bioreactor performance varied greatly across this dataset, and the poor performance of the Ridgely Farm bioreactor skewed these summary results toward the low end.
It is not unusual for bioreactors to experience different nitrate removal efficiencies and rates even under similar climatic conditions and if designed using similar procedures. For example, Christianson et al. [16] studied four bioreactors in Iowa and found that N removal efficiency ranged from 12% to 76%, and removal rates ranged from 0.42 to 7.8 g·N·m−3·day−1. Bioreactors in Illinois have ranged from 3% to 98% N removal efficiency [13,18]. In a recent meta-analysis, Addy et al. [17] reported that bioreactor N removal rates ranged broadly from 2.9 to 7.3 g·N·m−3·day−1 (5th to 95th percentiles based on a review). Variability of N removal performance between bioreactor sites and years can be due to differences in local site hydrology, water temperature, and bioreactor stop log management and to the newness of this technology resulting in a lack of consistent and proven design procedures. Differences in carbon media may also play a role, but given the variety of media that have been used successfully in denitrifying bioreactor studies (i.e., carbon to nitrogen ratios of <50 to >300 [1]; this factor is likely outweighed by flow (i.e., hydraulic retention time (HRT)) and temperature in situ. The one major importance of media across the literature relates to media age; it is well established that bioreactor N removal in the first year is higher than and generally not representative of long-term bioreactor N removal performance due to readily degradable fines that easily wash from the woodchips during the start-up period [2,18].
In this case, N removal performance variability between sites was likely due to differences in flow due to local site conditions and constraints. The Ridgely and Queen Anne Farm bioreactors operated consistently under N-limited conditions, and it is likely that the mass of N removed from the Ridgely site could have been improved by increasing the flow capacity of the bioreactor. This recommendation may be challenging to achieve, however, as this site was complicated by hydraulics because of extremely flat head gradient, intrusion of surface runoff into the tile drainage system and bioreactor, and onsite application of dairy wastewater which altered the N dynamics in the bioreactor. The Queen Anne Farm bioreactor performed near ideally with a high percentage of flow treated and excellent removal of nitrate from that water. The relatively shorter monitoring record at the Voorhees bioreactor provided a contrast to the other sites as this bioreactor was not N-limited, and treated most nearly all of the water from the tile drainage system. N removal at this bioreactor could be improved by balancing the high flow capacity with increased bioreactor hydraulic retention time.

4. Conclusions

Nitrate-nitrogen removal was achieved at all bioreactors in all monitoring periods, with an overall average removal efficiency of 24%. As the first bioreactor study in the humid subtropical coastal plain of Maryland, this work provides evidence that denitrifying bioreactors are another tool for reducing N loads in agricultural tile drainage in this region. Long-term monitoring of these, as well as additional bioreactor sites in the mid-Atlantic, should include at a minimum flow monitoring and water quality sampling; assessment of additional parameters such as temperature, DO, ORP and pH and conservative tracer testing would help further quantify N removal and hydraulic performance of these systems. While there are certainly advancements to be made in bioreactor design and management, this work establishes a positive proof of concept for this practice in the Chesapeake Bay region.

Acknowledgments

The authors would like to thank the Chesapeake Bay Trust Pioneer Grant (Grant #13543) for funding this research. The authors would also like to thank Dick Edwards, Scott Youse, Bill Mason, and Steve Kraszewski for allowing the research to be completed on their farms. Thanks are also given to Christine Burns, Patrick Angleton, Elizabeth Brown, Brittany Haas, and Kenneth Evans.

Author Contributions

Timothy Rosen and Laura Christianson conceived and designed the experiments; Timothy Rosen performed the experiments; Laura Christianson and Timothy Rosen analyzed the data; Laura Christianson and Timothy Rosen wrote the paper.

Conflicts of Interest

The authors declare no conflict of interest. The founding sponsors had no role in the design of the study; in the collection, analyses, or interpretation of data; in the writing of the manuscript, and in the decision to publish the results.

References

  1. Christianson, L.E.; Bhandari, A.; Helmers, M.J. A practice-oriented review of woodchip bioreactors for subsurface agricultural drainage. Appl. Eng. Agric. 2012, 28, 861–874. [Google Scholar] [CrossRef]
  2. Schipper, L.A.; Robertson, W.D.; Gold, A.J.; Jaynes, D.B.; Cameron, S.C. Denitrifying bioreactors: An approach for reducing nitrate loads to receiving waters. Ecol. Eng. 2010, 36, 1532–1543. [Google Scholar] [CrossRef]
  3. Bell, W.H.; Favero, P. Moving Water a Report to the Chesapeake Bay Cabinet. Public Drainage Task Force, 2000. Available online: http://www.dnr.state.md.us/irc/docs/00003588.pdf (accessed on 26 January 2015).
  4. Cahill, B. Tax Ditches and Their Role in the Development Process. Drainage Program, Sussex County March 2006. Available online: http://www.dnrec.state.de.us/dnrec2000/Divisions/Soil/stormwater/CCRCourse/05-Tax%20Ditches%20and%20construction_BPC.pdf (accessed on 7 December 2016).
  5. Keppler, J. Agricultural Ditch Management on Maryland’s Eastern Shore. Roadside Ditch Management Workshop; Chesapeake Bay Program Scientific and Technical Advisory Committee Workshop: Easton, MD, USA, 2014; Available online: http://www.chesapeake.org/stac/presentations/235_Keppler%20Ditch%20Workshop.pdf (accessed on 6 July 2015).
  6. Cushing, E.M.; Kantrowitz, I.H.; Taylor, K.R. Water resources of the Delmarva Peninsula. U.S Geological Survey Professional Paper 822; 1973; pp. 1–58. Available online: https://pubs.usgs.gov/pp/0822/report.pdf (accessed on 25 November 2016). [Google Scholar]
  7. Denver, J.M.; Ator, S.W.; Debrewer, L.M.; Ferrari, M.J.; Barbaro, J.R.; Hancock, T.C.; Brayton, M.J.; Nardi, M.R. Water Quality in the Delmarva Peninsula, Delaware, Maryland, and Virginia, 1999–2001; U.S. Geological Survey Circular 1228; U.S. Geological Survey: Reston, VA, USA, 2004; pp. 1–26.
  8. Follett, J.R.; Follett, R.F. Utilization and metabolism of nitrogen by humans. In Nitrogen in the Environment: Sources, Problems and Management; Follett, R., Hatfield, J.L., Eds.; Elsevier Science: New York, NY, USA, 2001; pp. 65–92. [Google Scholar]
  9. Maryland Department of the Environment (MDE). Maryland’s Phase II Watershed Implementation Plan for the Chesapeake Bay TMDL. Document Version; 26 October 2012. Available online: http://www.mde.state.md.us/programs/Water/TMDL/TMDLImplementation/Documents/FINAL_PhaseII_Report_Docs/Final_Documents_PhaseII/Final_Phase_II_WIP_MAIN_REPORT_102612.pdf (accessed on 11 November 2016). [Google Scholar]
  10. Flewelling, S.A.; Herman, J.S.; Hornberger, G.M.; Mills, A.L. Travel time controls the magnitude of nitrate discharge in groundwater bypassing the riparian zone to a stream on Virginia’s coastal plain. Hydrol. Process. 2011, 26, 1242–1253. [Google Scholar] [CrossRef]
  11. Christianson, L.E.; Schipper, L.A. Moving denitrifying bioreactors beyond proof of concept: Introduction to the special section. J. Environ. Qual. 2016, 45, 757–761. [Google Scholar] [CrossRef] [PubMed]
  12. Verma, S.; Bhattarai, R.; Goodwin, G.; Cooke, R.; Chun, J.A. Evaluation of Conservation Drainage Systems in Illinois: Bioreactors; ASABE Paper No. 10098942010; ASABE: St. Joseph, MI, USA, 2010. [Google Scholar]
  13. Woli, K.P.; David, M.B.; Cooke, R.A.; McIssac, G.F.; Mitchell, C.A. Nitrogen balance in and export from agricultural fields associated with controlled drainage systems and denitrifying bioreactors. Ecol. Eng. 2010, 36, 1558–1566. [Google Scholar] [CrossRef]
  14. Iowa Department of Agriculture and Land Stewardship (IDALS). Iowa Nutrient Reduction Strategy: A Science and Technology-Based Framework to Assess and Reduce Nutrients to Iowa Waters and the Gulf of Mexico; Iowa Department of Agriculture and Land Stewardship, Iowa Department of Natural Resources, and Iowa State University: Des Moines, IA, USA, 2014.
  15. IDOA. Illinois Nutrient Loss Reduction Strategy. Illinois Department of Agriculture and Illinois Environmental Protection Agency: Springfield, IL, USA, 2015. Available online: http://www.epa.illinois.gov/Assets/iepa/water-quality/watershed-management/nlrs/nlrs-final-revised-083115.pdf (accessed on 18 January 2017). [Google Scholar]
  16. Christianson, L.; Bhandari, A.; Helmers, M.; Kult, K.; Sutphin, T.; Wolf, R. Performance evaluation of four field-scale agricultural drainage denitrification bioreactors in Iowa. Trans. ASABE 2012, 55, 2163–2174. [Google Scholar] [CrossRef]
  17. Addy, K.; Gold, A.J.; Christianson, L.E.; David, M.B.; Schipper, L.A.; Ratigan, N.A. Denitrifying Bioreactors for Nitrate Removal: A Meta-Analysis. J. Environ. Qual. 2016, 45, 873–881. [Google Scholar] [CrossRef] [PubMed]
  18. David, M.B.; Gentry, L.E.; Cooke, R.A.; Herbstritt, S.M. Temperature and Substrate Control Woodchip Bioreactor Performance in Reducing Tile Nitrate Loads in East-Central Illinois. J. Environ. Qual. 2016, 45, 822–829. [Google Scholar] [CrossRef] [PubMed]
  19. Community Collaborative Rain, Hail, and Snow Network (CoCoRaHS). Available online: http://www.cocorahs.org/state.aspx?state=md (accessed on 12 November 2016).
  20. Easton, Z.M.; (Virginia Tech University). Personal communication, 2013.
  21. Christianson, L.; Christianson, R.; Helmers, M.; Pederson, C.; Bhandari, A. Modeling and Calibration of Drainage Denitrification Bioreactor Design Criteria. J. Irrig. Drain. Eng. 2013, 139, 699–709. [Google Scholar] [CrossRef]
  22. Iowa United States Department of Agriculture Natural Resource Conservation Service (NRCS). IADentrifyingBioreactor.xlsx v1.0. Amiable online: https://www.nrcs.usda.gov/wps/portal/nrcs/detail/ia/technical/engineering/?cid=nrcs142p2_008213 (accessed on 15 November 2015).
  23. Wang, X.; Frankenberger, J.R.; Kladivko, E.J. Estimating nitrate-N losses from subsurface drains using variable water sampling frequencies. Trans. ASABE 2003, 464, 1033–1040. [Google Scholar] [CrossRef]
  24. Partheban, C. Demonstrating the Effectiveness of Nitrate-Nitrogen Removal of Denitrifying Bioreactors in South Dakota for Improved Drainage Water Management. Master’s Thesis, South Dakota State University, Brookings, SD, USA, 2014. [Google Scholar]
  25. Chun, J.A.; Cooke, R.A. Calibrating AgriDrain Water Level Control Structures Using Generalized Weir and Orifice Equations. Appl. Eng. Agric. 2008, 24, 595–602. [Google Scholar] [CrossRef]
  26. United States Environmental Protection Agency (EPA). Ambient Water Quality Criteria Recommendations Information Supporting the Development of State and Tribal Nutrient Criteria Rivers and Streams in Nutrient Ecoregion XIV. EPA 822-B-00-022; 2000; pp. 1–84. Available online: https://www.epa.gov/sites/production/files/documents/rivers14.pdf (accessed on 7 December 2016). [Google Scholar]
  27. Sharrer, K.; Christianson, L.E.; Lepine, C.; Summerfelt, S.T. Modeling and mitigation of denitrification ‘woodchip’ bioreactor phosphorus releases during treatment of aquaculture wastewater. Ecol. Eng. 2016, 93, 135–143. [Google Scholar] [CrossRef]
Figure 1. Location of bioreactor sites: QAF (Queen Anne Farm); RF (Ridgely Farm); VB (Voorhees Farm bioreactor).
Water 09 00112 g001
Figure 2. Baseflow in the drainage tile line is diverted into the bioreactor using flashboards in the diversion control structure (1), storm flows can bypass down the original tile line (2). Perforated pipes (3) at either end of the woodchip trench (4) allow water to enter and exit the bioreactor. The capacity control structure (5) contains a set of flashboards that allow for manipulation of the hydraulic gradient through the bioreactor.
Water 09 00112 g002
Figure 3. Ridgley Farm bioreactor and (a) bypass flow rate; (b) hydraulic retention time (HRT); (c) inflow and outflow nitrate concentrations; and (d) nitrate loadings from August 2014 to May 2016. Loadings reflect the annual periods from the start of monitoring.
Water 09 00112 g003
Figure 4. Ridgley Farm bioreactor ammonium (NH4-N) (a); total nitrogen (TN) (b); phosphate (PO4-P) (c); total phosphorus (TP) (d); water temperature (e); water pH (f); and dissolved oxygen (DO) (g) concentrations of inflow and outflow for August 2014 to May 2016.
Water 09 00112 g004
Figure 5. Ridgely Farm bioreactor drainage event 10–11 March 2015 flow rate (a); water temperature (b); and nitrate (c); ammonium (d); and phosphate (e) concentrations.
Water 09 00112 g005
Figure 6. Queen Anne Farm bioreactor and (a) bypass flow rate; (b) hydraulic retention time, inflow; and (c) outflow nitrate concentrations; and (d) nitrate loadings from August 2014 to mid-April 2016. Loadings reflect the annual period from the beginning of monitoring to August 2015.
Water 09 00112 g006
Figure 7. Queen Anne Farm bioreactor (a) ammonium; (b) total nitrogen; (c) phosphate; (d) total phosphorus; (e) water temperature; (f) water pH; and (g) dissolved oxygen concentrations of inflow and outflow for August 2014 to May 2016.
Water 09 00112 g007
Figure 8. Voorhees Farm bioreactor and (a) bypass flow rate; (b) hydraulic retention time; (c) inflow and outflow nitrate concentrations; (d) and nitrate loadings from December 2014 to July 2015.
Water 09 00112 g008
Table 1. Description of three agricultural drainage denitrifying bioreactors in Maryland studied in this investigation.
BioreactorLocationInstallation DateFarm DetailsSoil Types (% of Catchment) †Drainage Treatment Area (ha)Length × Width × Depth (m)
Ridgely Farm (RF)Caroline Co., MDNovember 2013700 head dairy; triticale (×Triticosecale) and feed corn (Zea mays)Sassafras sandy loam (47.2), Fallsington loam (27.5), Hambrook loam (16.9), Woodstown sandy loam (4.4), Lenni Loam (4.0)34.7 ha30.5 × 6.1 × 0.91
Queen Anne Farm (QAF)Queen Anne’s Co., MDDecember 2013Organic rotation of corn (Zea mays), winter wheat (Triticum aestivum) or barley (Hordeum vulgare), and soybeans (Glycine max)Ingleside sandy loam (29.5), Unicorn-Sassafras loam (24.6), Carmichael loam (9.8), Hammonton sandy loam (9.8), Whitemarsh silt loam (8.2), Fallsington loam (6.6), Pineyneck silt loam (6.5), Mattapex-Betterton silt loam (4.9)25.2 ha26 × 4.6 × 0.76
Voorhees FarmCaroline Co., MDNovember 2014Rotation of corn (Zea mays), winter wheat (Triticum aestivum) and soybeans (Glycine max)Sassafras sandy loam (32.1), Hambrook sandy loam (23.1), Fallsington sandy loam (19.8), Woodstown sandy loam (15.9), Ingleside sandy loam (3.6), Ingleside loamy sand (3.6), Woodstown loam (2.0)40.1 ha30.5 × 9.1 × 0.91
Notes: † Soil Survey Staff (SURGO). Natural Resources Conservation Service, United States Department of Agriculture. Web Soil Survey. Available online at http://websoilsurvey.nrcs.usda.gov/. Accessed 03/12/15.reativecommons.org/licenses/by/4.0/).
Table 2. Summary of flow treated and nitrate removal within the bioreactor and considering bypass flow (“Total”) for three bioreactors in Maryland.
FlowBioreactorTotal (Including Bypass Flow)
Total Volume from FieldPercent Treated in BioreactorFlow-Weighted Concentration: INFlow-Weighted Concentration: OUTNitrate Load: INNitrate Load: OUTNitrate Removal EfficiencyNitrate Removal Rate †Nitrate Load: INNitrate Load: OUTNitrate Removal Efficiency
m3%mg NO3-N/Lkg N%g N Removed per m3 Bioreactor per daykg N%
Ridgely Farm
8 August 2014–6 August 201537,00013%4.650.06230.399%0.402512299.0%
6 August 2015–4 May 2016 ‡586021%7.640.309.60.496%0.21584816%
Queen Anne Farm
8 August 2014–6 August 201524,40059%9.220.081341.199%5.362148162%
6 August 2015–13 April 2015 ‡24,80050%8.600.231062.997%5.12219.0115.9247%
Voorhees Farm
19 December 2104–20 July 2015 ‡49,70098%13.4611.5767760710%1.5368861810%
Notes: † Removal rate based only on dates when flow was occurring and calculated using the entire bioreactor volume (L × W × D); ‡ Not annual periods due to the grant timeline.
Table 3. Nutrient concentration arithmetic mean ± SD (sample count) for Ridgely and Queen Anne bioreactor inflow and outflow.
Nitrate-NAmmoniumTotal NitrogenOrthophosphateTotal Phosphorus
mg N/Lmg P/L
InflowOutflowInflowOutflowInflowOutflowInflowOutflowInflowOutflow
Ridgely Farm8.17 ± 10.5 (66) †0.07 ± 0.2 (66) †11.25 ± 11.8 (41)12.78 ± 16.3 (41)30.3 ± 20.9 (21) †11.2 ± 7.2 (21) †2.52 ± 2.8 (41) †1.43 ± 2.1 (41) †5.08 ± 4.8 (21)2.81 ± 2.9 (21)
Queen Anne Farm9.49 ± 5.0 (52) †0.12 ± 0.4 (53) †0.22 ± 0.7 (32)0.26 ± 0.5 (32)11.5 ± 5.9 (15) †2.33 ± 2.2 (15) †0.15 ± 0.2 (32)0.21 ± 0.4 (32)0.57 ± 0.7 (15)0.57 ± 0.8 (15)
Notes: † Statistically significant difference between inflow and outflow based on the Mann–Whitney Rank Sum Test for non-normally distributed data (α = 0.05).
Table 4. Water chemistry mean ± SD for Ridgely (n = 67 samples) and Queen Anne bioreactor (n = 50 samples) inflow and outflow.
TemperatureDissolved OxygenSpecific ConductancepHOxidation Reduction Potential
°Cmg DO/Lμs/cm mV
InflowOutflowInflowOutflowInflowOutflowInflowOutflowInflowOutflow
Ridgely Farm13.3 ± 6.4 †15.6 ± 6.3 †1.8 ± 1.90.5 ± 0.3655 ± 386697 ± 2396.7 ± 0.6 †6.0 ± 0.2 †−8.3 ± 95−15 ± 36
Queen Anne Farm12.7 ± 5.613.5 ± 5.86.6 ± 2.4 †0.5 ± 0.2 †223 ± 121219 ± 875.6 ± 1.0 †5.4 ± 0.5 †126 ± 76 †−11 ± 60 †
Notes: † Statistically significant difference between inflow and outflow based on the Mann–Whitney Rank Sum Test for non-normally distributed data (α = 0.05).

