Effect of Biological Contact Filters (BCFs) on Membrane Fouling in Drinking Water Treatment Systems

 and
and 
Abstract
:1. Introduction
2. Materials and Methods
2.1. Water Sample
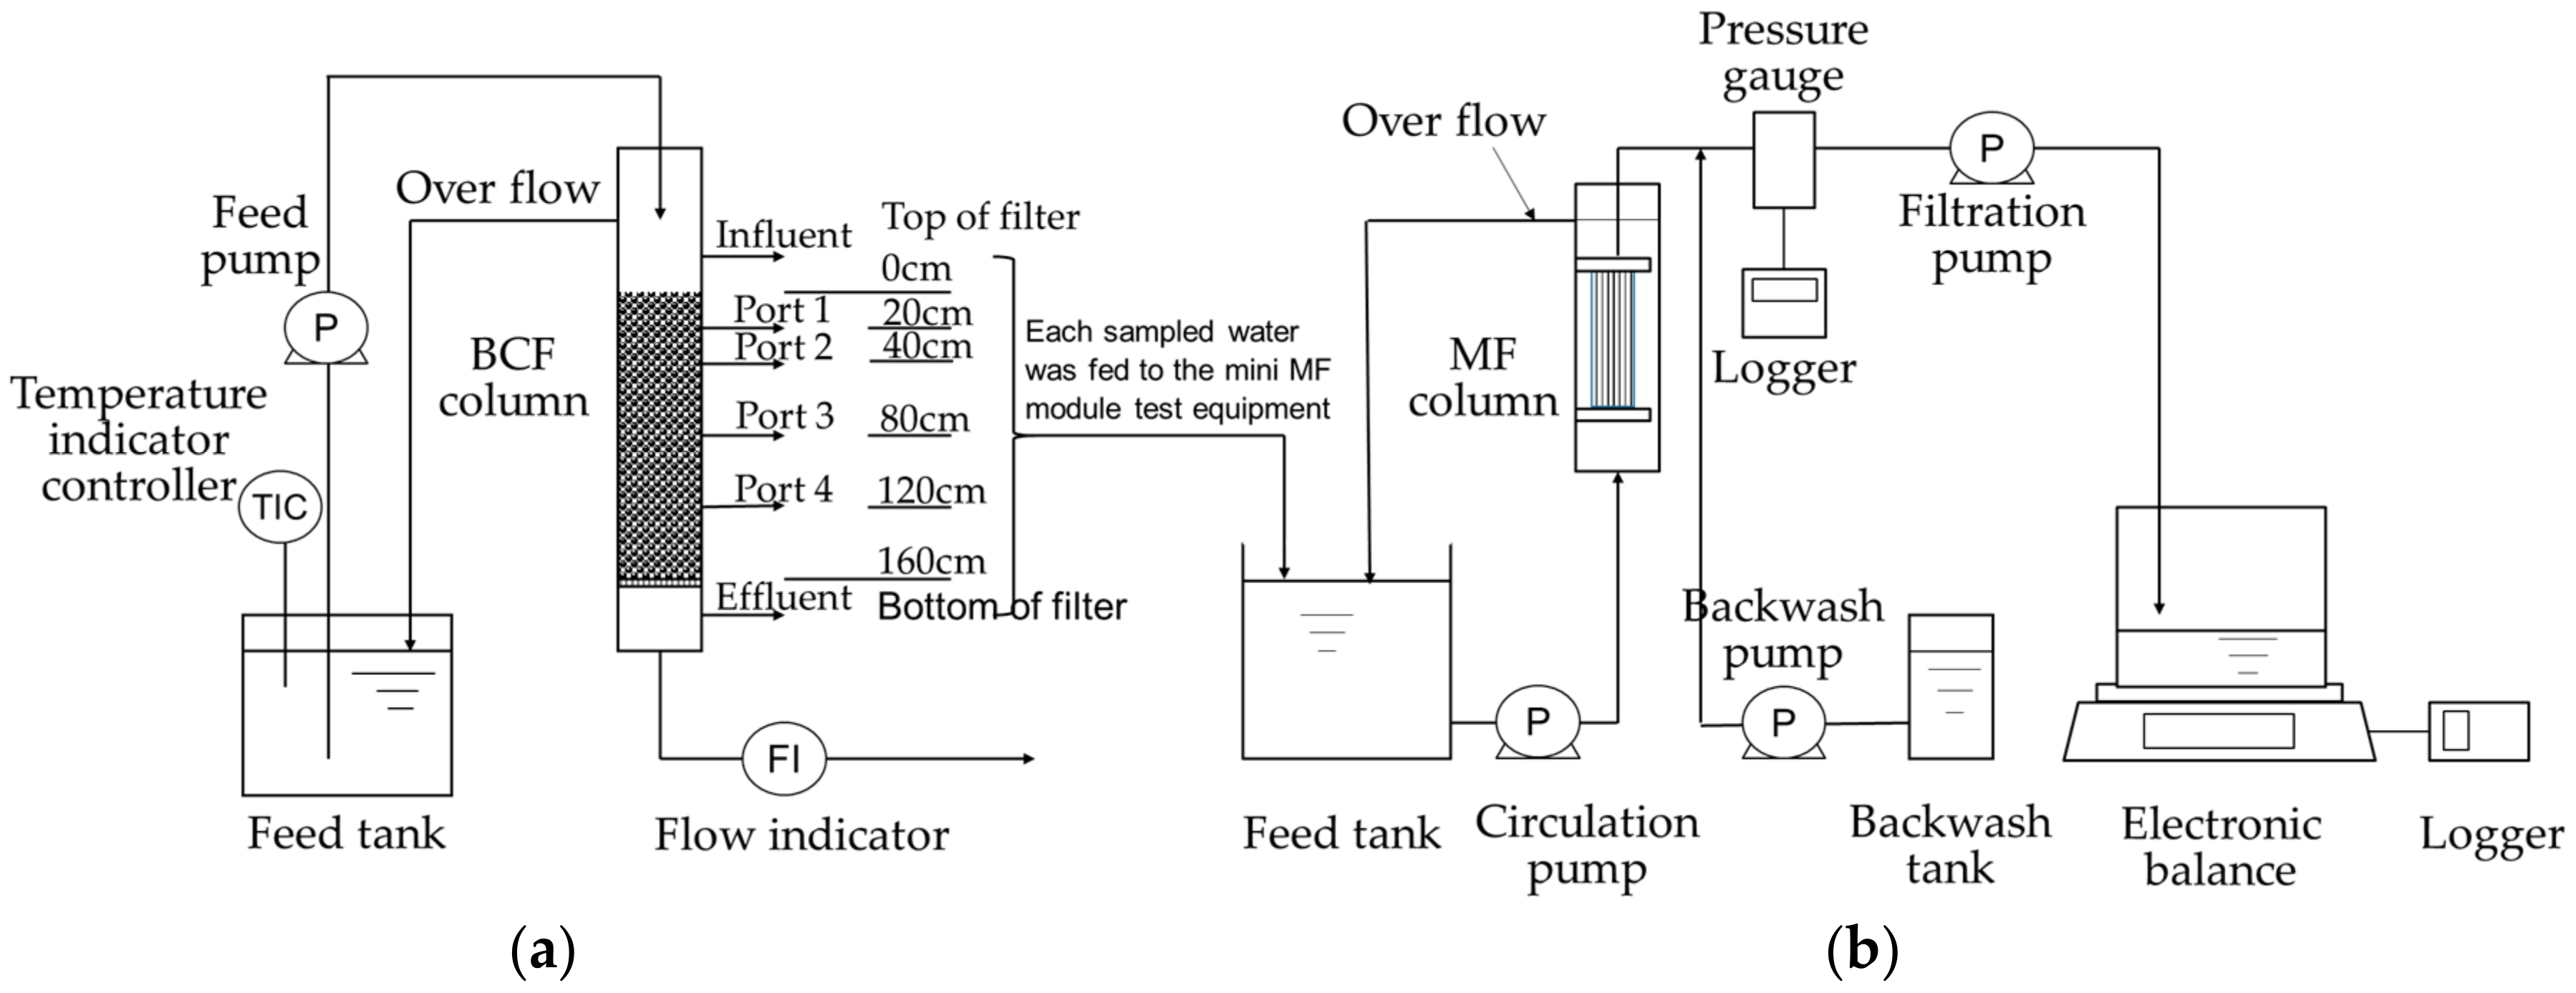
2.2. Test Equipment
2.3. Experimental Methods
2.3.1. Mini Biological Contact Filter (BCF) Column Test
2.3.2. Filtration Test of Sampled Water
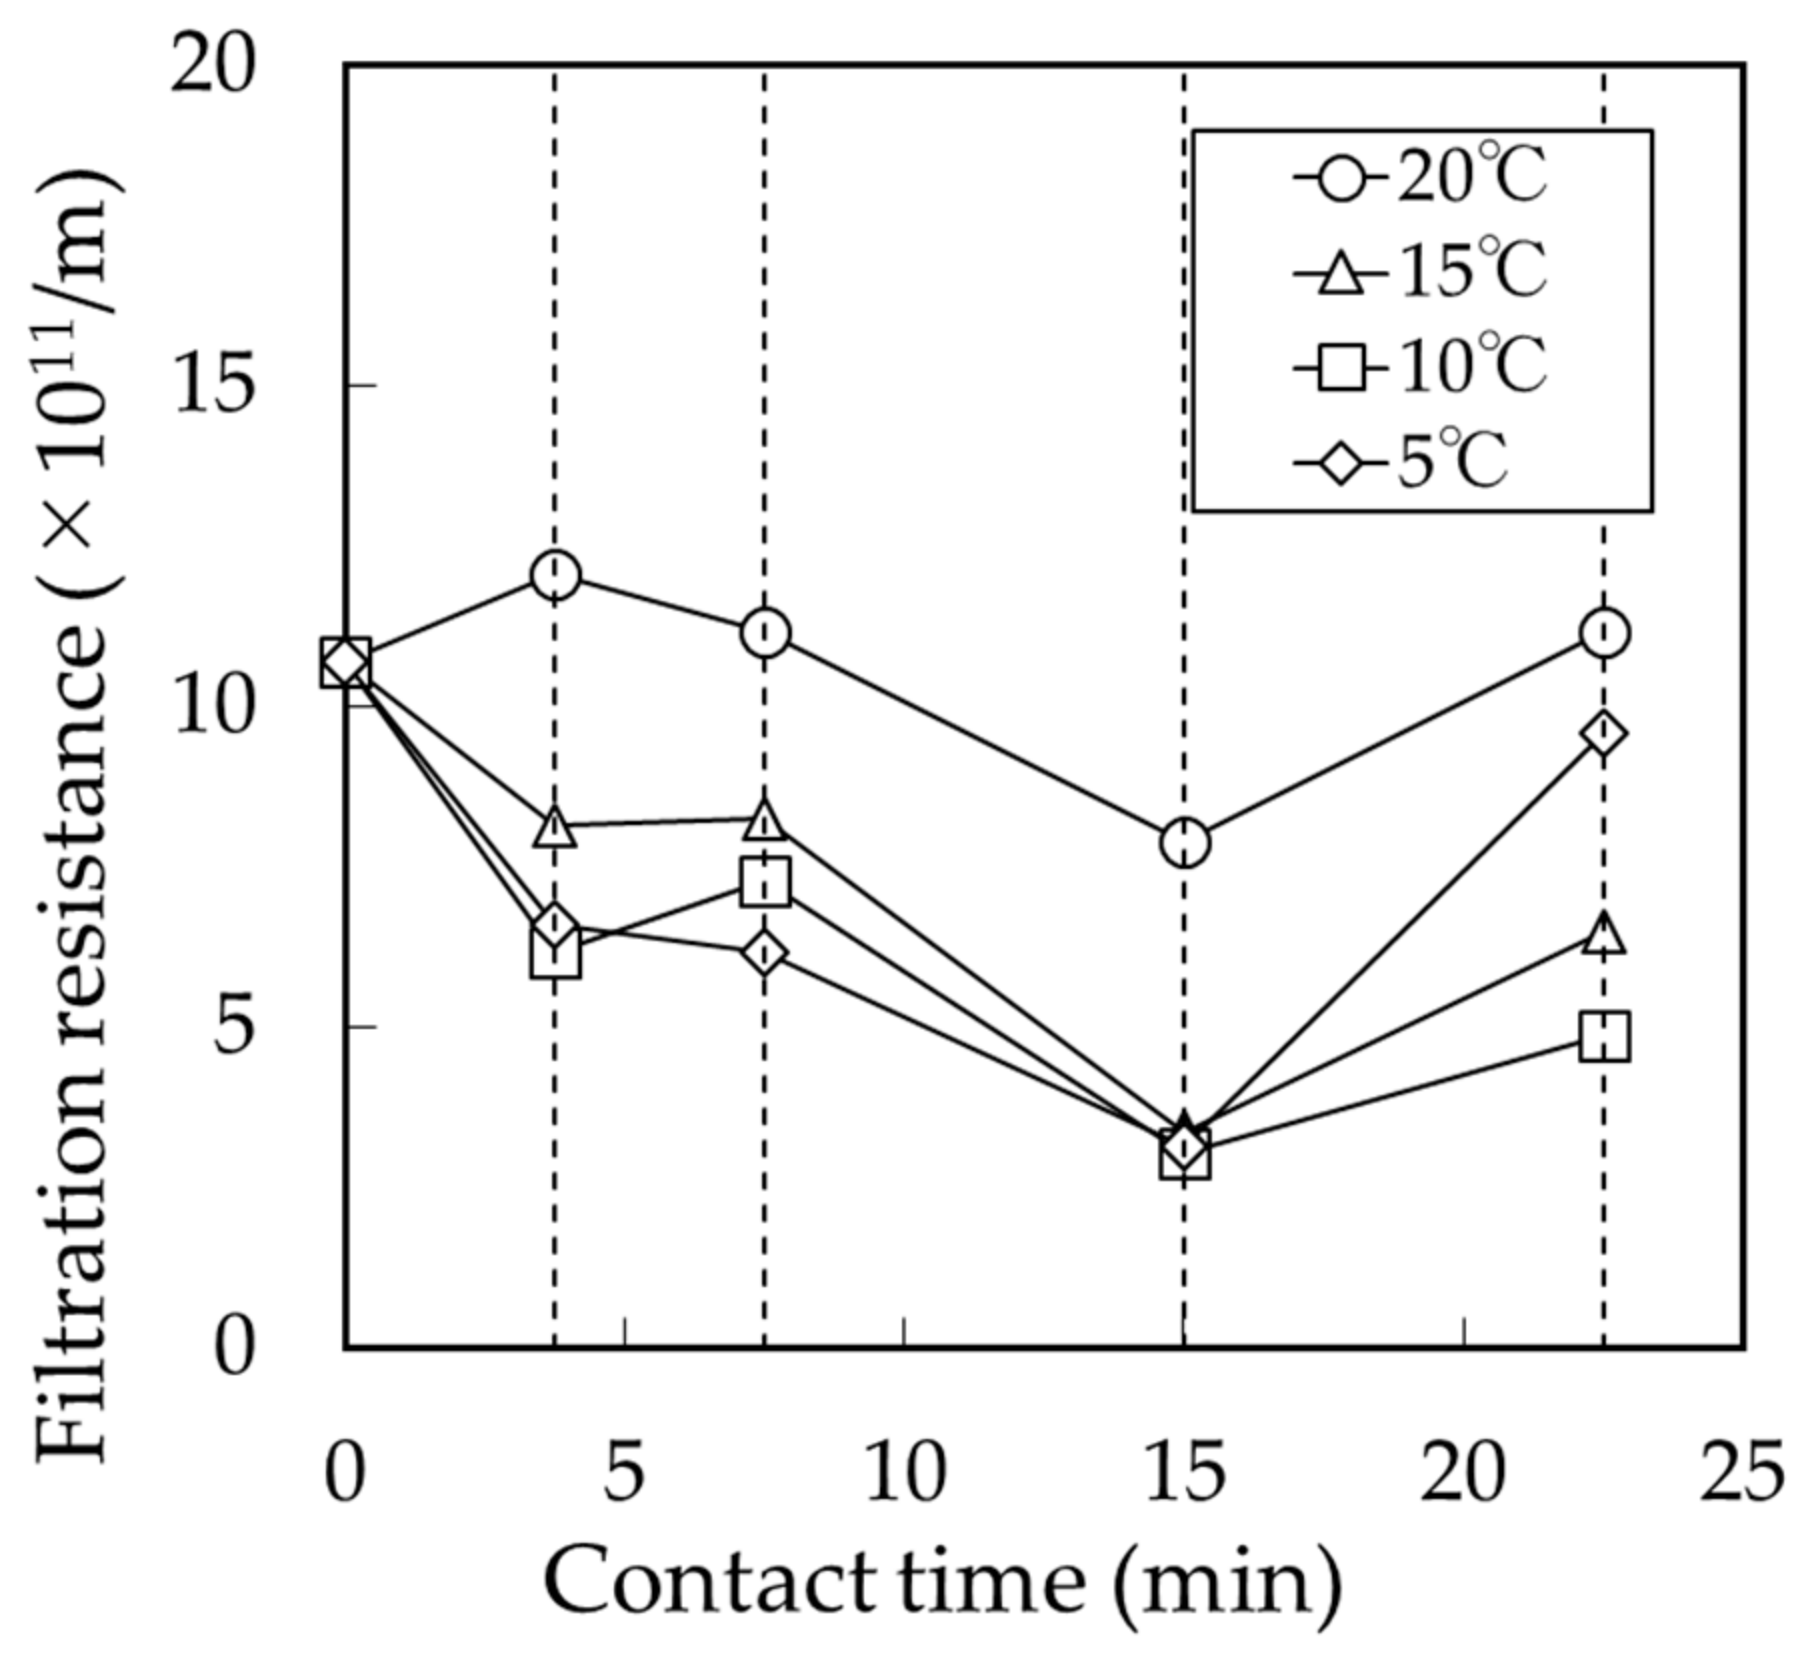
2.3.3. Foulant Extraction Method
2.4. Analytical Method
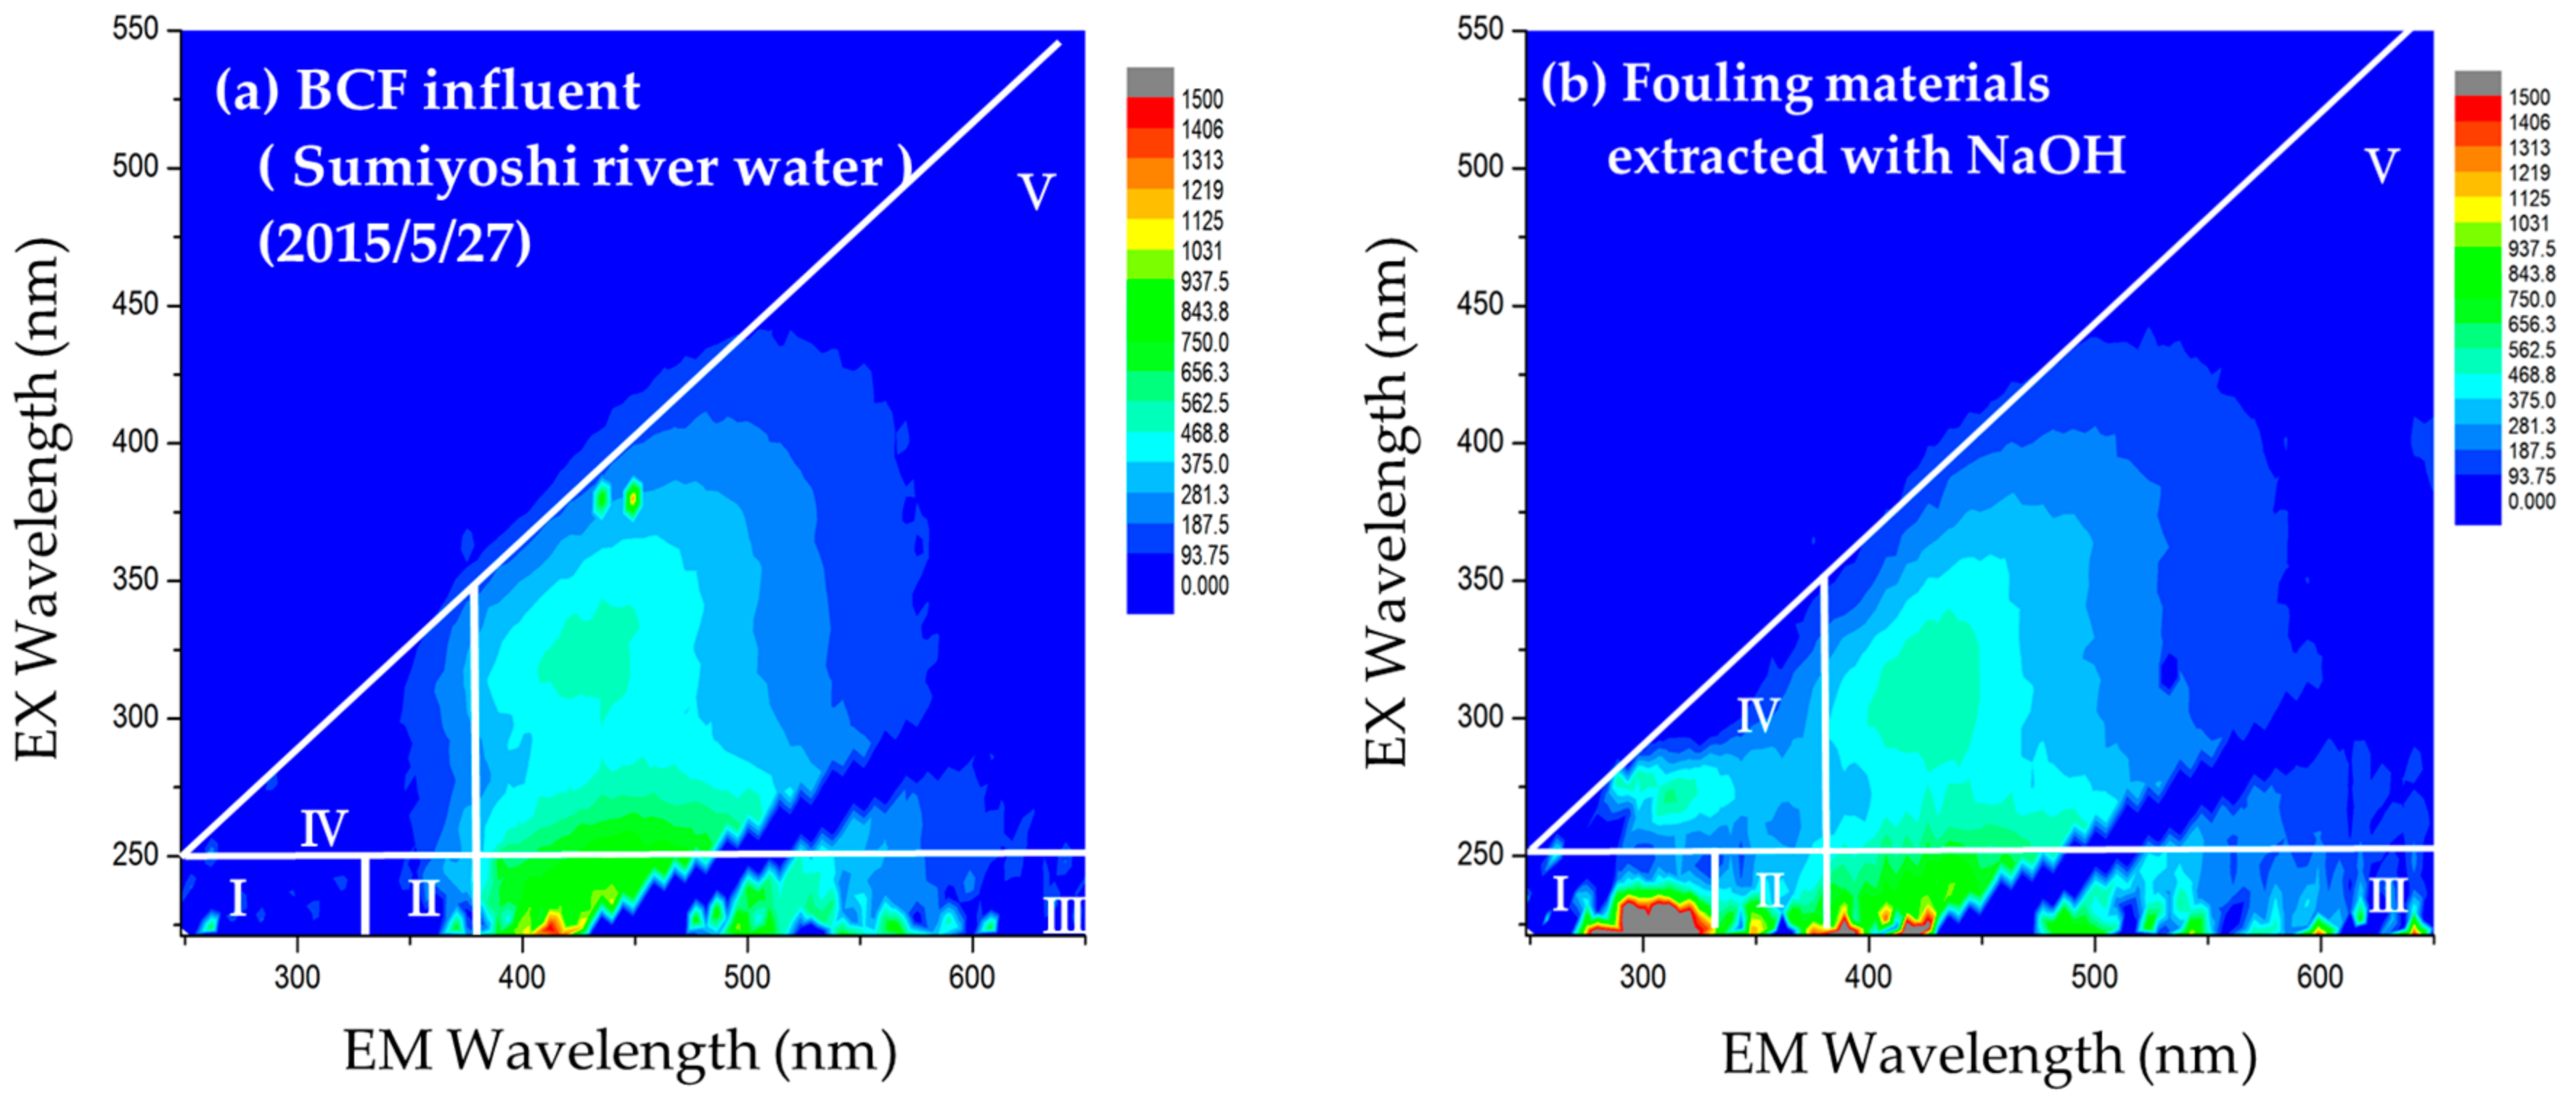
2.4.1. Excitation Emission Matrix (EEM) Fluorescence Spectroscopy
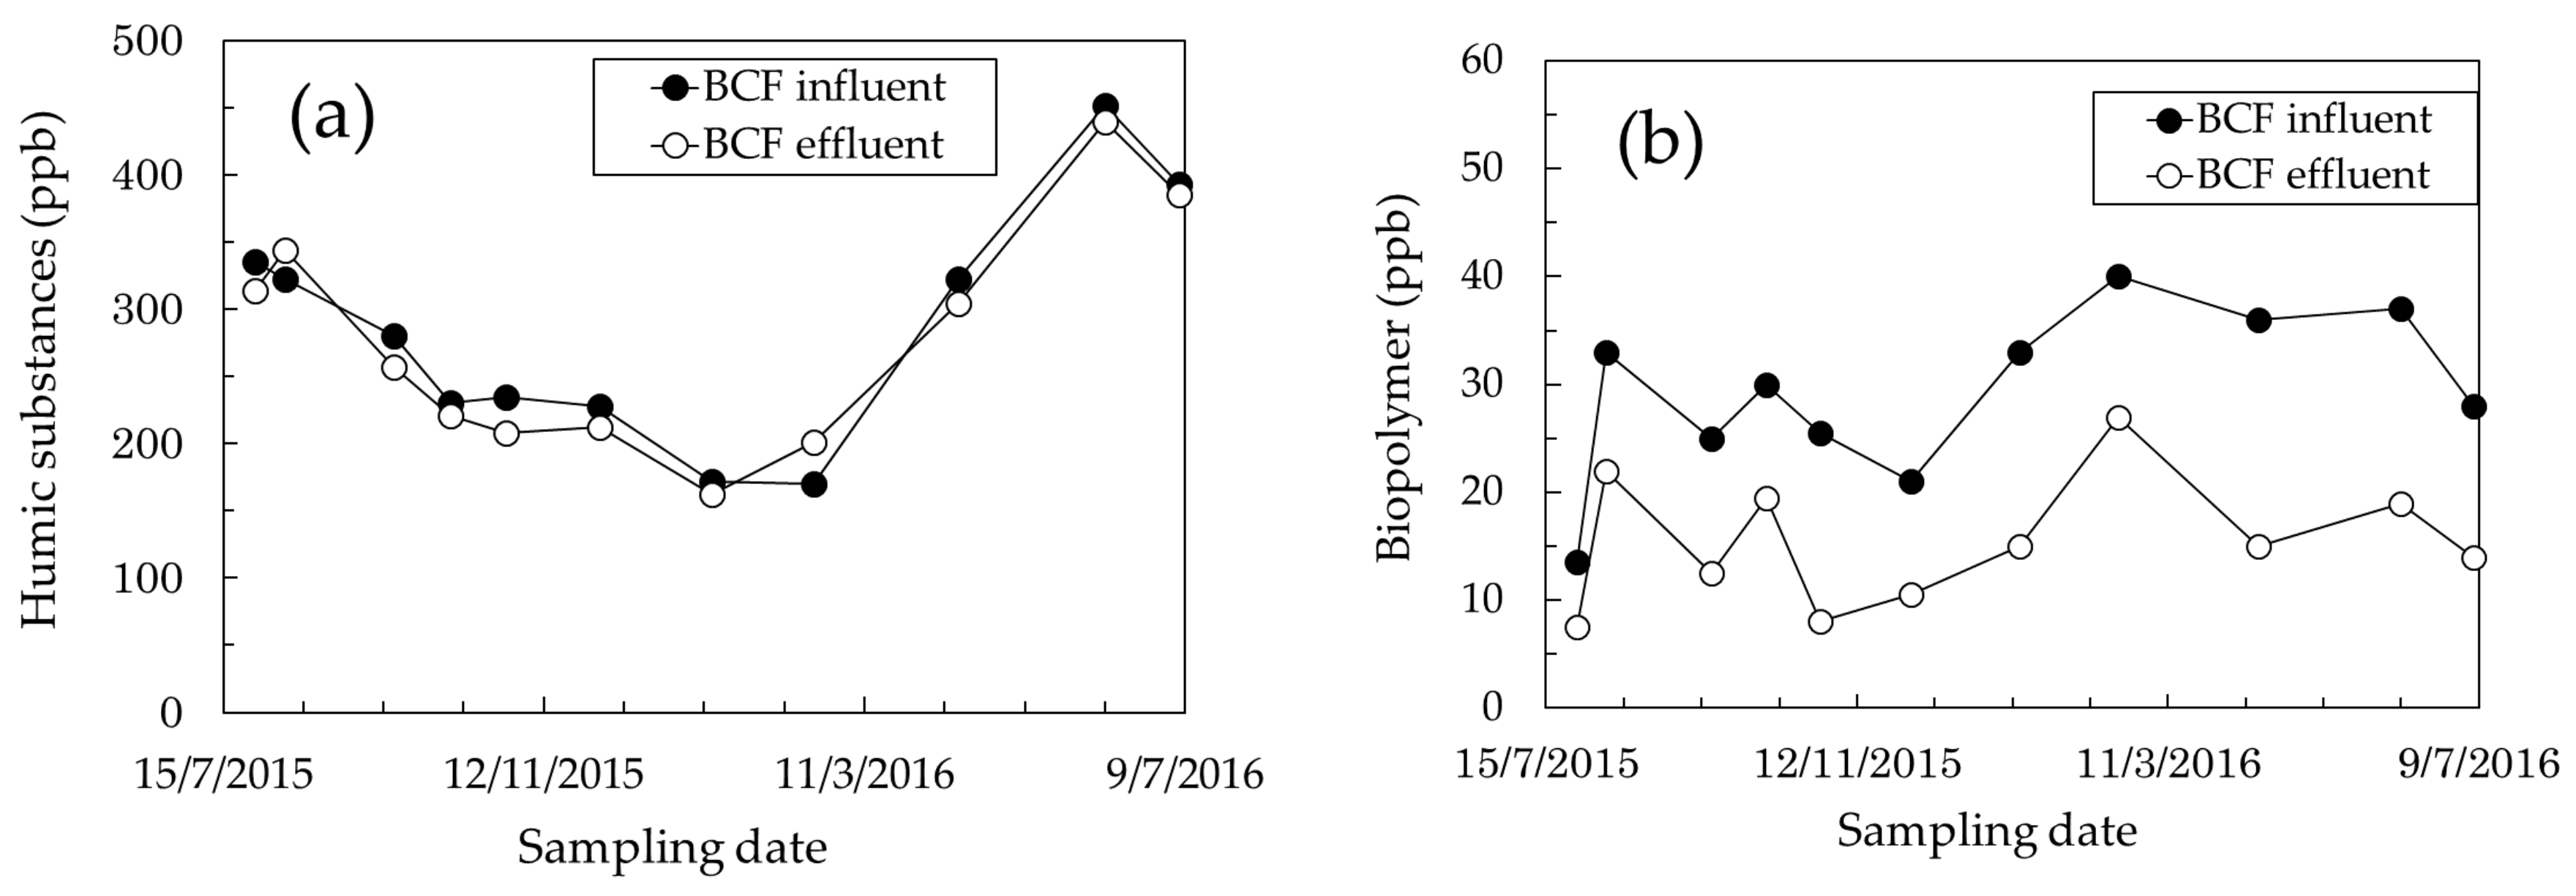
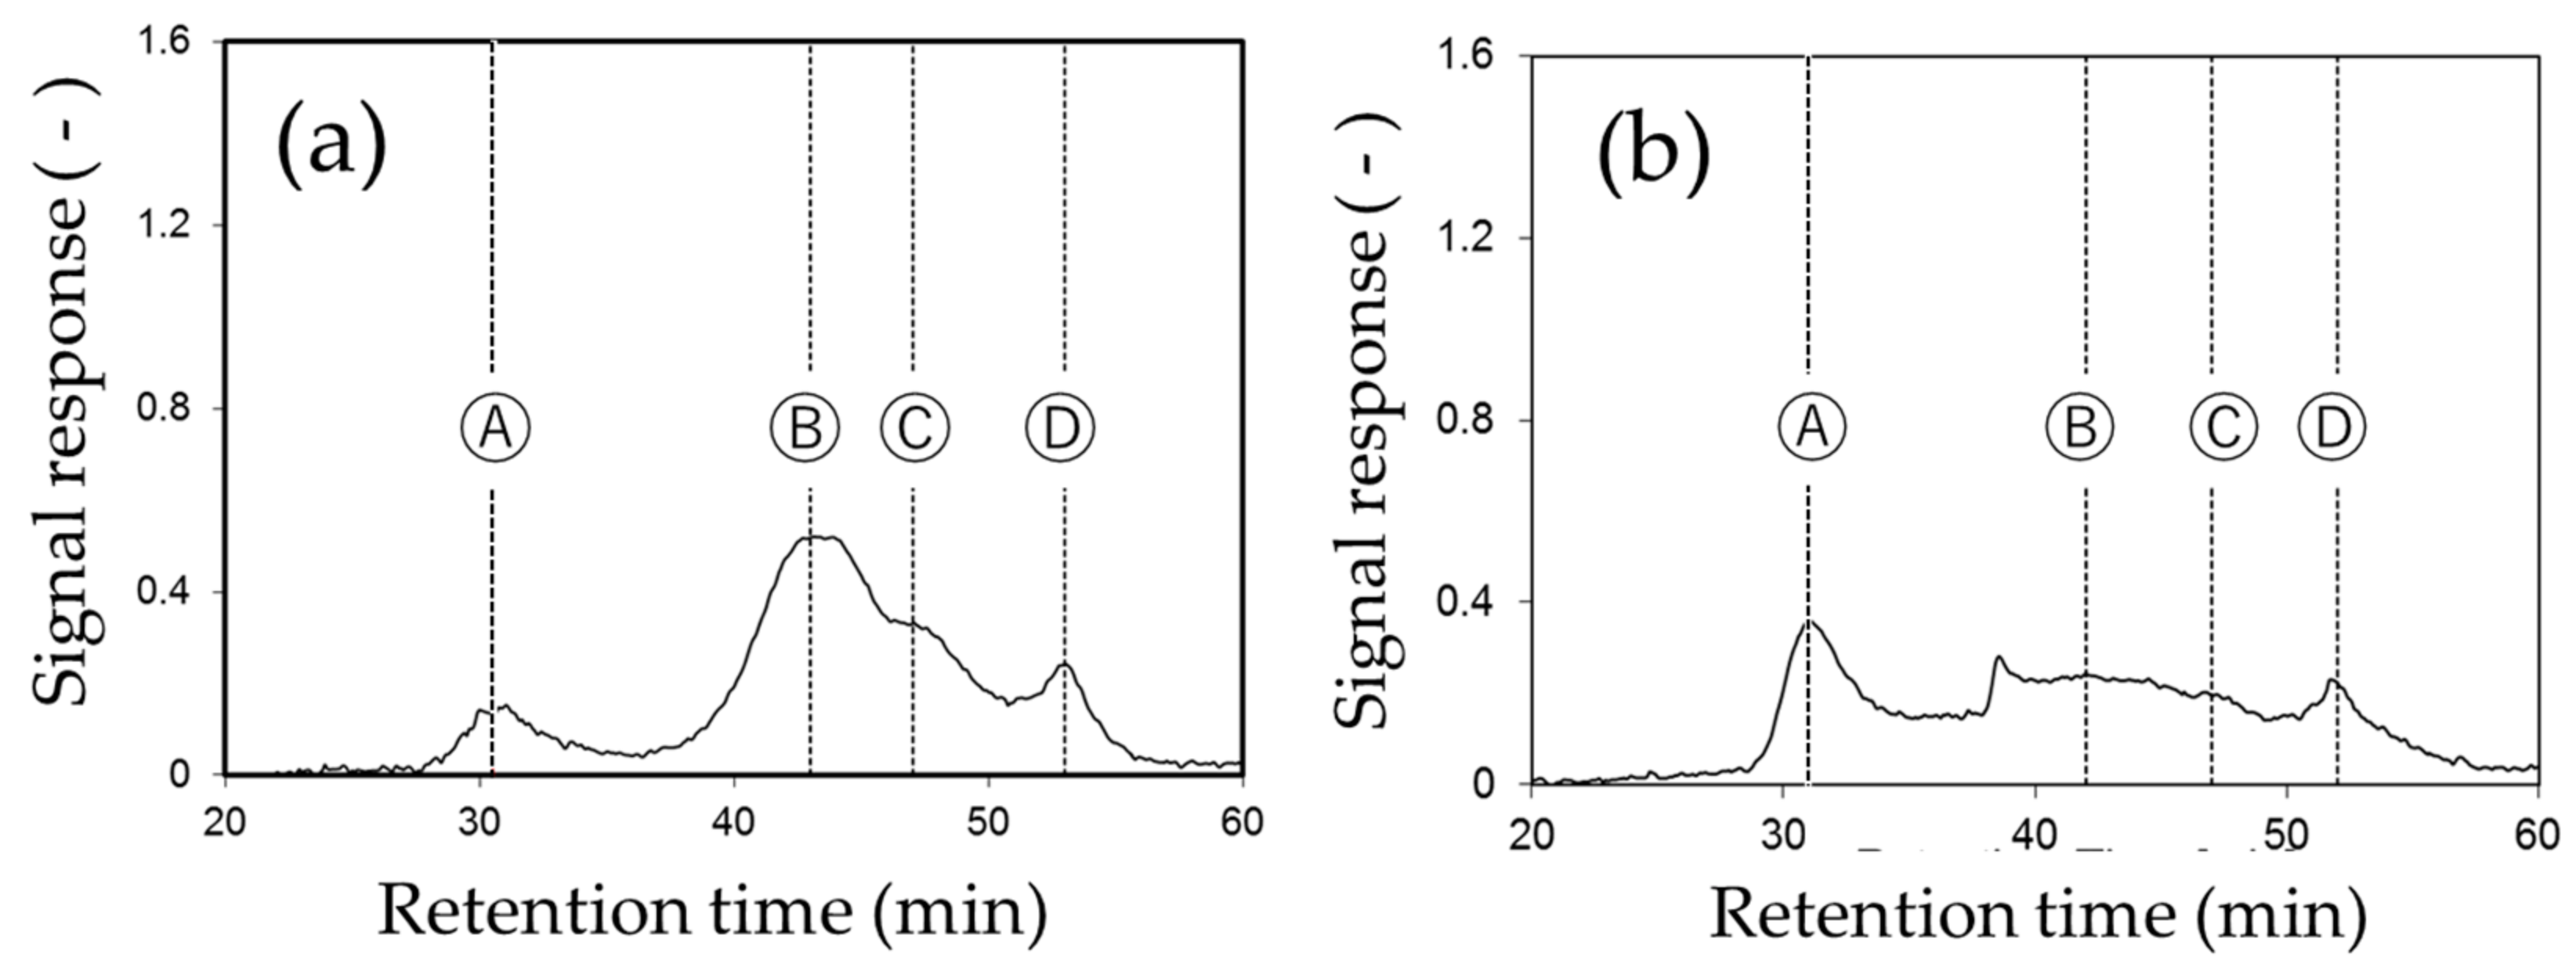
2.4.2. Liquid Chromatograph Organic Carbon Detector (LC-OCD)
3. Results and Discussion
3.1. Identification of Foulants
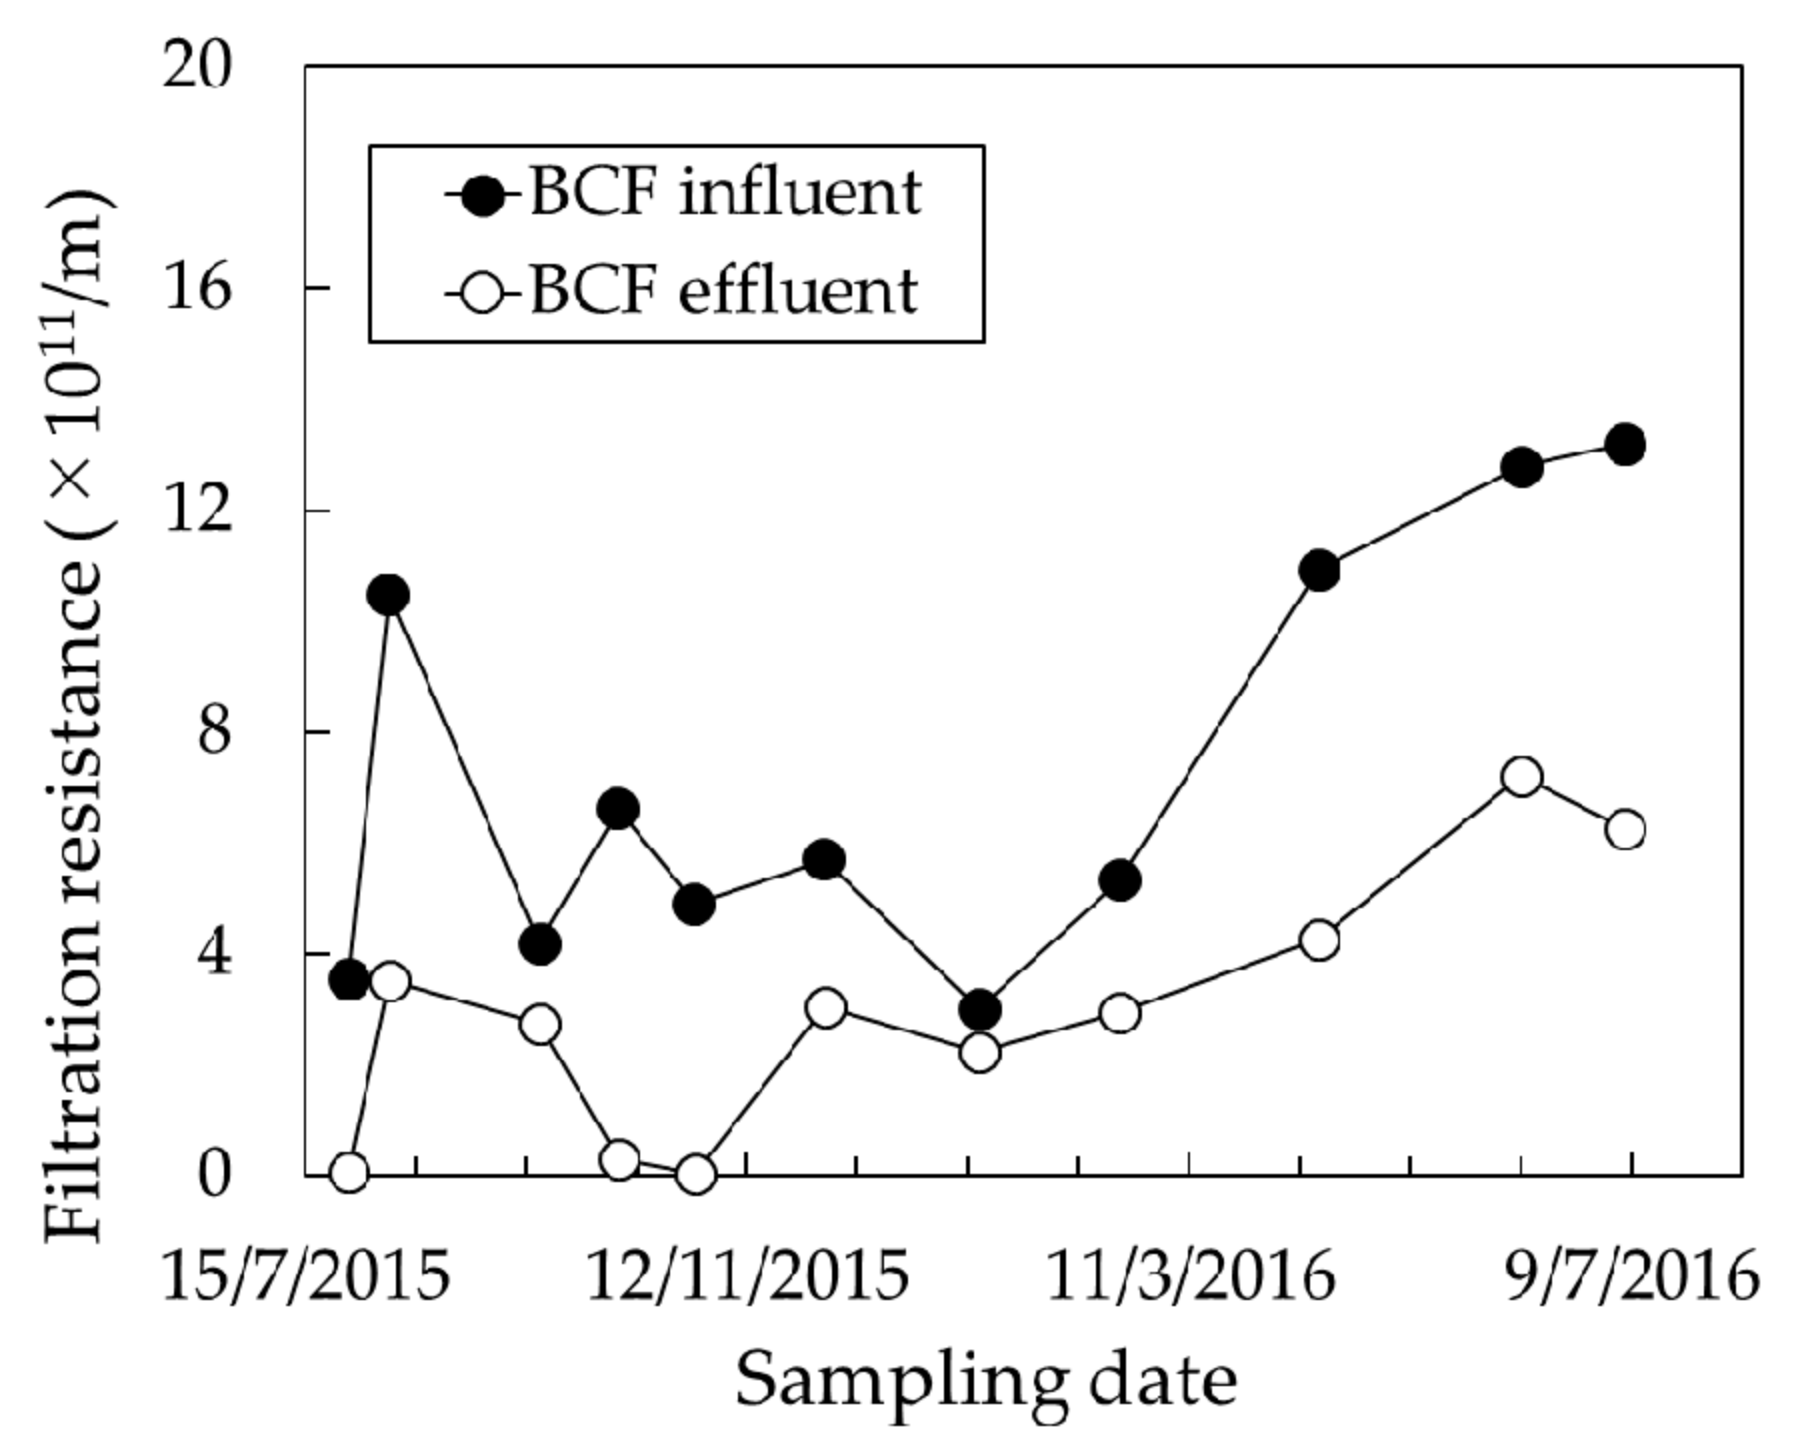
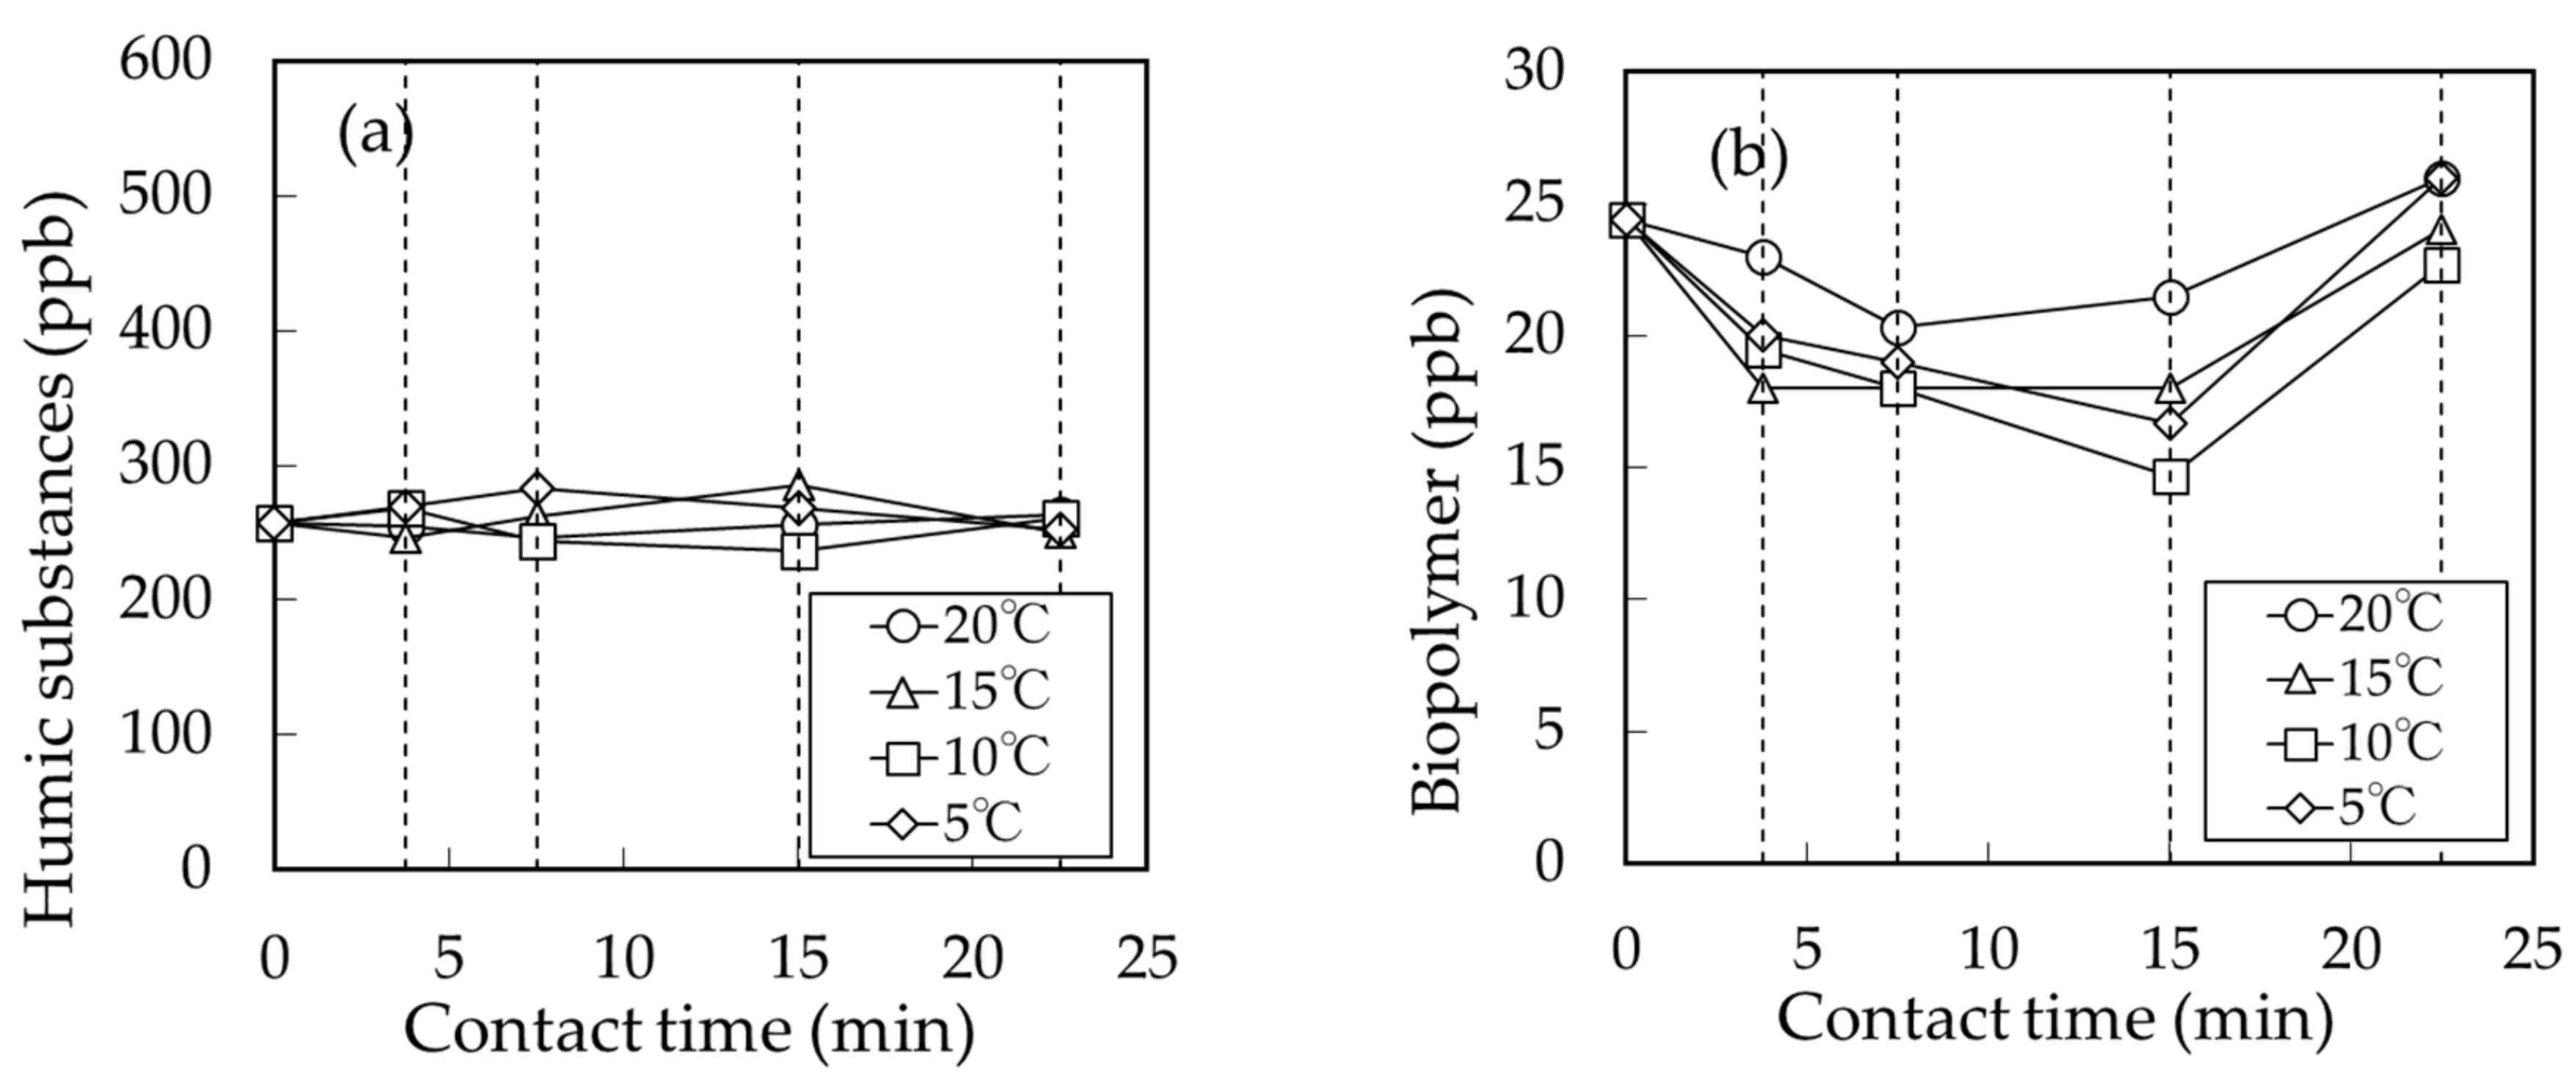
3.2. Effect of BCF Pretreatment on MF Membrane Fouling
4. Conclusions
Author Contributions
Conflicts of Interest
References
- Yang, H.; Li, D.; Zhang, J.; Hao, R.; Li, B. Design of biological filter for iron and manganese removal from water. J. Environ. Sci. Health. 2004, 39, 1447–1454. [Google Scholar] [CrossRef]
- Gao, W.; Liang, H.; Ma, J.; Han, M.; Chen, Z.; Han, Z.; Li, G. Membrane fouling control in ultrafiltration technology for drinking water production: A review. Desalination 2011, 272, 1–8. [Google Scholar] [CrossRef]
- Bouwer, E.J.; Crowe, P.B. Biological processes in drinking water treatment. J. Am. Water Works Assoc. 1988, 80, 82–93. [Google Scholar]
- Katsoyiannis, I.A.; Zouboulis, A.I. Biological treatment of Mn (II) and Fe (II) containing groundwater: Kinetic consideration and product characterization. Water Res. 2004, 38, 1922–1932. [Google Scholar] [CrossRef] [PubMed]
- Tian, J.; Ernst, M.; Cui, F.; Fekel, M. Correlations of relevant membrane foulants with UF membrane fouling in different waters. Water Res. 2013, 47, 1218–1228. [Google Scholar] [CrossRef] [PubMed]
- Haberkamp, J.; Ernst, M.; Bockelmann, U.; Szewzyk, U.; Jekel, M. Complexity of ultrafiltration membrane fouling caused by macromolecular dissolved organic compounds in secondary effluents. Water Res. 2008, 42, 3153–3161. [Google Scholar] [CrossRef] [PubMed]
- Miyoshi, T.; Aizawa, T.; Kimura, K.; Watanabe, Y. Identification of proteins involved in membrane fouling in membrane bioreactors (MBRs) treating municipal wastewater. Int. Biodeterior. Biodegrad. 2012, 75, 15–22. [Google Scholar] [CrossRef]
- Chen, W.; Westerhoff, P.; Leenheer, J.A.; Booksh, K. Fluorescence excitation-emission matrix regional integration to quantify spectra for dissolved organic matter. Environ. Sci. Technol. 2003, 37, 5701–5710. [Google Scholar] [CrossRef] [PubMed]
- Halle, C.; Huck, P.M.; Peldszus, S.; Haberkamp, J.; Jekel, M. Assessing the performance of biological filtration as pretreatment to low pressure membranes for drinking water. Environ. Sci. Technol. 2009, 43, 3878–3884. [Google Scholar] [PubMed]
- Peldszus, S.; Halle, C.; Peiris, R.H.; Hamouda, M.; Jin, X.; Legge, R.L.; Budman, H.; Moresoli, C.; Huck, P.M. Reversible and irreversible low-pressure membrane foulants in drinking water treatment: Identification by principal component analysis of fluorescence EEM and mitigation by biofiltration pretreatment. Water Res. 2011, 45, 5161–5170. [Google Scholar] [CrossRef] [PubMed]
- Fan, L.; Harris, J.L.; Roddick, F.A.; Booker, N.A. Influence of the characteristics of natural organic matter on the fouling of microfiltration membranes. Water Res. 2001, 35, 4455–4463. [Google Scholar] [CrossRef]
- Peiris, R.H.; Jaklewicz, M.; Budman, H.; Legge, R.L.; Moresoli, C. Assessing the role of feed water constituents in irreversible membrane fouling of pilot-scale ultrafiltration drinking water treatment systems. Water Res. 2011, 47, 3364–3374. [Google Scholar] [CrossRef] [PubMed]
- Kimura, K.; Tanaka, K.; Watanabe, Y. Microfiltration of different surface waters with/without coagulation: Clear correlations between membrane fouling and hydrophilic biopolymers. Water Res. 2014, 49, 434–443. [Google Scholar] [CrossRef] [PubMed]


| Specifications of Membrane | |
|---|---|
| Material | polyvinylidene fluoride (PVDF) |
| Pore size | 0.08 μm |
| Effective area | 15 cm2 |
| Operating Conditions | |
| Filtration flux | 1.5 m3/(m2·day) |
| Backwash flux | 2.25 m3/(m2·day) |
| Backwash water | permeate water with 5 ppm NaClO |
| Backwash repetition | 1 min every 30 min |
| Wiping with sponge | once/week and at test end |
© 2017 by the authors. Licensee MDPI, Basel, Switzerland. This article is an open access article distributed under the terms and conditions of the Creative Commons Attribution (CC BY) license (http://creativecommons.org/licenses/by/4.0/).
Share and Cite
Hasegawa, S.; Iwamoto, T.; Miyoshi, T.; Onoda, S.; Morita, K.; Takagi, R.; Matsuyama, H. Effect of Biological Contact Filters (BCFs) on Membrane Fouling in Drinking Water Treatment Systems. Water 2017, 9, 981. https://doi.org/10.3390/w9120981
Hasegawa S, Iwamoto T, Miyoshi T, Onoda S, Morita K, Takagi R, Matsuyama H. Effect of Biological Contact Filters (BCFs) on Membrane Fouling in Drinking Water Treatment Systems. Water. 2017; 9(12):981. https://doi.org/10.3390/w9120981
Chicago/Turabian StyleHasegawa, Susumu, Takuya Iwamoto, Taro Miyoshi, Sosuke Onoda, Kazushi Morita, Ryosuke Takagi, and Hideto Matsuyama. 2017. "Effect of Biological Contact Filters (BCFs) on Membrane Fouling in Drinking Water Treatment Systems" Water 9, no. 12: 981. https://doi.org/10.3390/w9120981