Impacts of Climate Change and Human Activities on the Three Gorges Reservoir Inflow

1
College of Hydrology and Water Resources, Hohai University, Nanjing 210098, China
2
National Engineering Research Center of Water Resources Efficient Utilization and Engineering Safety, Hohai University, Nanjing 210098, China
3
School of Earth Sciences and Engineering, Hohai University, Nanjing 210098, China
4
Bureau of Hydrology, Changjiang Water Resources Commission, Wuhan 430010, China
5
Jiuweigang Water Conservancy Project Management Office of Nantong City, Nantong 226003, China
6
Geological Survey of Jiangsu Province, Nanjing 210018, China
*
Author to whom correspondence should be addressed.
Water 2017, 9(12), 957; https://doi.org/10.3390/w9120957
Submission received: 10 November 2017
/
Revised: 1 December 2017
/
Accepted: 4 December 2017
/
Published: 7 December 2017
Abstract
:Identifying changes in runoff and quantifying the impacts of climate change and human activities are of great significance for water resources planning and management in a river basin. In this study, an inflow series of the Three Gorges Reservoir observed from 1951 to 2016 is used to identify the trend and abrupt change point by using statistical methods. Based on the meteorological data, soil type data, and land use data during the same period, the Soil and Water Assessment Tool (SWAT) model is established to quantitatively attribute changes in the Three Gorges Reservoir inflow to climate change and human activities separately and discuss the differences between the two-stage method, which divides the whole study period into two stages to analyze the reasons for runoff evolution, and multi-stage method, which divides the whole study period into more stages to consider the temporal and spatial variation of land use/cover (LULC). The results show: (1) During the study period, a significant decrease is detected in the Three Gorges Reservoir inflow and the decrease rate is 7.7 km3 per ten years, annual total precipitation decreases by −13.5 mm per ten years, and annual average temperature increases by 0.1 °C per ten years. (2) Contribution of climate change and human activities is around 7:3. Climate change is the main reason for the decrease in the Three Gorges Reservoir inflow. (3) Results of stages in multi-stage method are different from the result of two-stage method. Accumulative results of multi-stage method and result of two-stage method are consistent. There are some changes in results of every stage, which are different from the accumulative results.
1. Introduction
Affected by global warming, the hydrological cycle is accelerating [1]. Meanwhile, intense human activities, for instance, land use/cover change (LUCC) and wholesale water projects, profoundly affect the hydrological processes [2,3]. Uncertainty of the hydrological processes is aggravated due to both climate change and human activities [4]. Identifying the changes in the runoff and attributing the changes to various driving factors have become one focus in water science [5].
In recent years, several studies have been conducted to assess impacts of changing environment on runoff [6]. Impacts of climate change and human activities on runoff have different manifestations across the world. In some watersheds, impact of climate change is greater than that from human activities, while other watersheds are the opposite. Reviewing extensive literature, quantitative methods used to assess impacts from climate change and human activities on runoff generally fall into two categories: statistical methods and simulated methods. Statistical methods are based on observed data, while simulated methods are based on various hydrological models, and have gone through a transformation from methods based on lumped hydrological models to methods based on distributed hydrological models.
Statistical methods generally use regression to assess impacts on runoff based on observed meteorological data and hydrological data. The regression is established between runoff and one or more meteorological factors. For example, Revelle and Waggoner [7] used a multiple regression to assess impact of climate change on runoff in the upper reaches of the Colorado River. The climatic elasticity method, which was first proposed by Schaake [8] and continually extended, is another classic method. These statistical methods have some simple principles and are easy to use. However, these methods are based on, and limited to, the data series, because longer series bring better regression. Data uncertainty and number of driving factors used surely could influence the results. Apart from the impacts from climate change, the rest changes in runoff are attributed to human activities. Such methods have not explained in what way, how much, and how human activities factors influence the runoff, which greatly reduces the reliability of the analysis results.
The hydrological processes are very complex and highly non-linear. Models based on the linear system theory generally fail to represent the non-linear processes [9]. During the history of hydrological models, many famous and excellent lumped hydrological models sprang up, for instance, Tank model [10], Stanford watershed model [11], and Xinanjiang model [12]. These models consider the processes from runoff generation to runoff concentration and have a certain summary of specific ones including precipitation, evapotranspiration, infiltration, surface runoff, groundwater discharge, and so on. The lumped hydrological models often regard a watershed as a whole, and spatial variations are rarely taken into account. There are many empirical formulas in the models which lack explicit physical meanings. Lumped hydrological models are used to assess impacts from climate change and human activities on runoff in various watersheds across the world because of simplicity [13,14]. Compared to other hydrological models, distributed hydrological models can describe mechanisms of hydrological processes as well as spatial heterogeneity. With the help of reams of information obtained from Geographic Information System and Remote Sensing, distributed hydrological models are generally effective and accurate to simulate the hydrological processes. As a result, distributed hydrological models are more effective to assess impacts from climate change, LUCC and other human activities [15]. The Soil and Water Assessment Tool (SWAT) is a representative one. SWAT is a river basin or watershed model that has been widely used to predict flow, sediment, and agricultural chemical yields from watersheds of various sizes, particularly in large, complex watersheds. It is the most vigorous method for simulating the long-term impacts of watershed management (e.g., dam building, timber harvesting, and irrigation) on hydrologic process [16].
In China, economy is booming. The great developments in agriculture and industry, together with the climate change, have caused varying degrees of changes in hydrological processes [17]. The Three Gorges Reservoir is currently the largest water conservancy project in the world and attracts flocks of scholars and researchers. Runoff in the upstream Yangtze River flows into the Three Gorges Reservoir in the form of reservoir inflow finally. Great changes have been observed in the Three Gorges Reservoir inflow [18]. However, limited studies have been conducted to seek the specific reasons and assess the impacts. This study selects the changing Three Gorges Reservoir inflow as the study case and assesses the impacts from climate change and human activities on it by using SWAT. In previous studies, when assessing impacts on runoff via the SWAT, land use/cover (LULC) is considered stable during a certain period, and one piece of LULC map is enough to represent the period [16,19]. However, it is always being blurred and muddled how long the period should be. The two-stage method and the multi-stage method are two parties holding different opinions. Both methods are based on the premise that LULC remains stable during a certain period. Divergence between the two is how long the certain period continues. LULC is considered stable during a long period, while the stable condition lasts shorter in the multi-stage method. Both methods are discussed in this study.
2. Study Area and Data
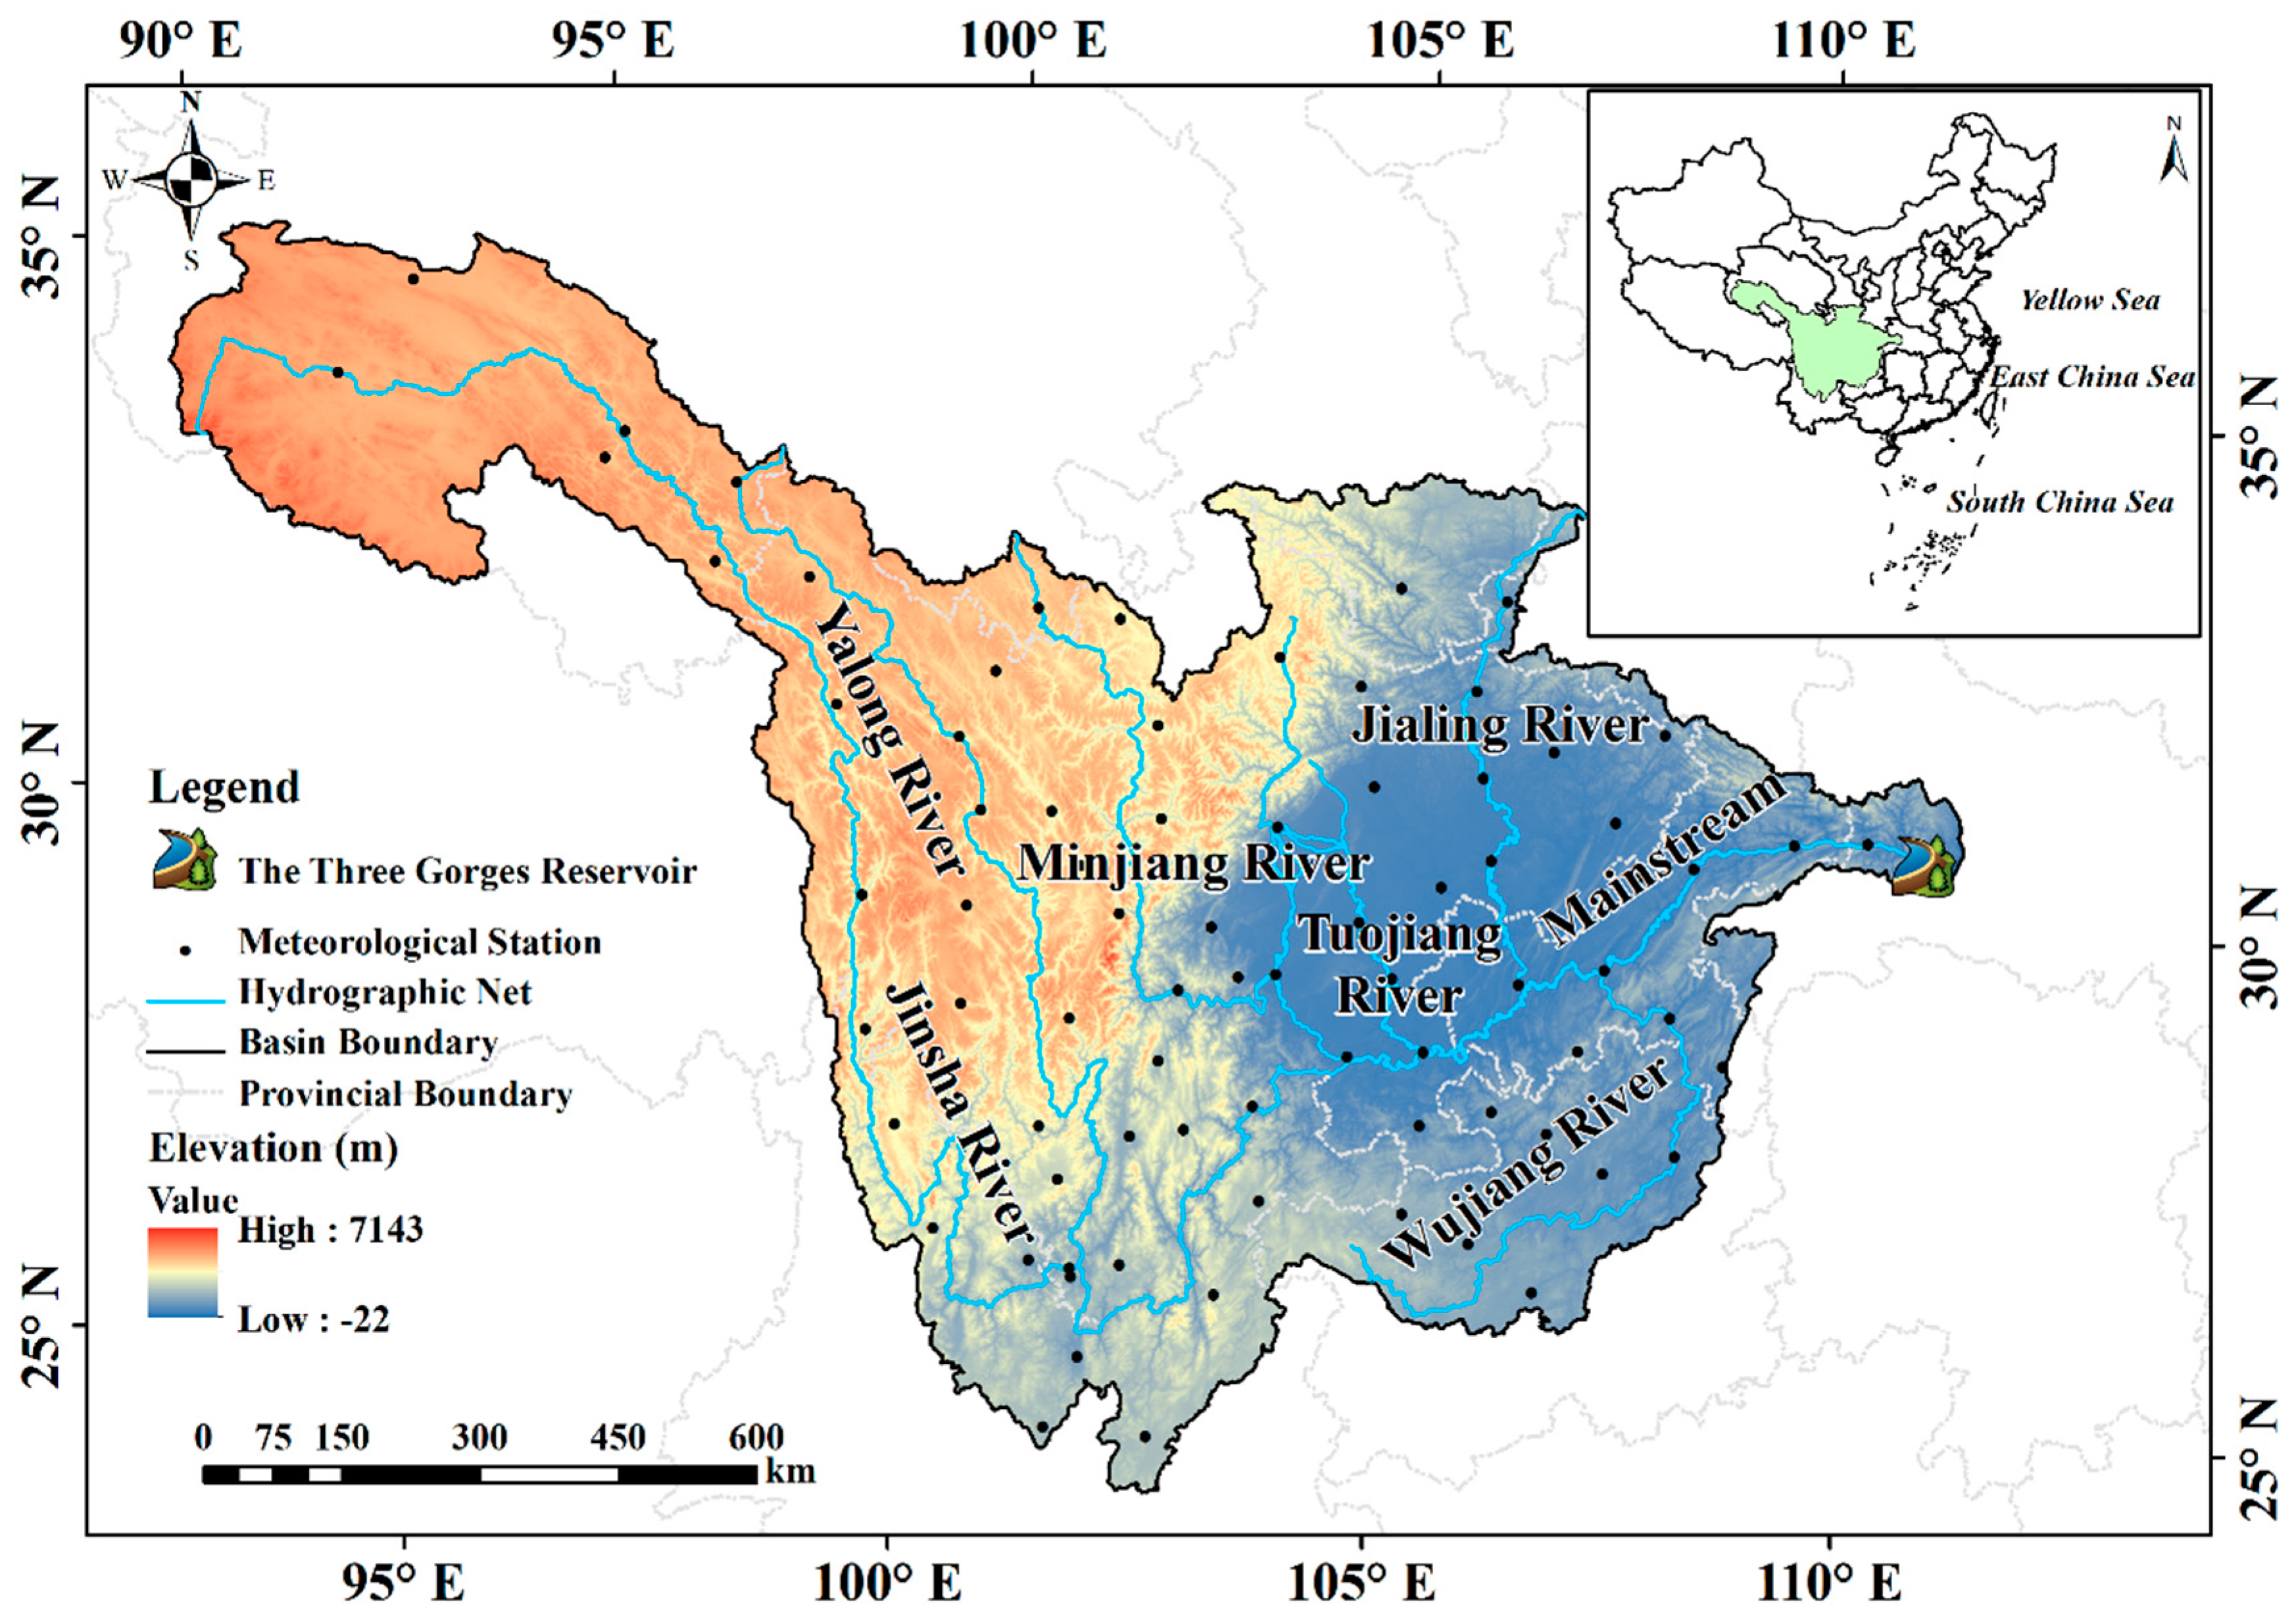
The Three Gorges Reservoir is located at the mainstream of the Yangtze River, in Yichang City, Hubei Province. It has a total storage of 3.93 × 10¹⁰ m3 and a total installed capacity for the hydraulic turbines of 2.25 × 10⁷ kW. It is a multi-purpose water conservancy project, including flood protection, electric power generation, shipping, water supply, recreation, and ecological protection. In this study, the upstream Yangtze River is selected as the study area. As shown in Figure 1, the study area is located in the region within 97.37° E–110.18° E and 21.13° N–34.33° N, with a total area of 1 × 10⁶ km2 covering nine provinces. The elevation of study area ranges from −22 to 7143 m.
Daily inflow series from 1951 to 2016 is obtained from the China Three Gorges Corporation. Daily meteorological factors series from 80 National Meteorological Observatory (NMO) stations within the study area are collected from the National Meteorological Information Centre of China (NMIC) (http://data.cma.cn), including daily precipitation, mean air temperature, maximum air temperature, minimum air temperature, sunshine duration, mean wind speed, and mean relative humidity. Soil type data (with a scale of 1: 1,000,000) and LULC data (with a scale of 1: 100,000 for late 1980s, 1995, 2000, 2010) are provided by the Data Center for Resources and Environmental Sciences, Chinese Academy of Sciences (RESDC) (http://www.resdc.cn). In addition, a Digital Elevation Model (DEM) with a spatial resolution of 90 m × 90 m is obtained from the Consultative Group on International Agricultural Research (CGIAR) Consortium for Spatial Information (CGIAR-CSI) (http://srtm.csi.cgiar.org).
3. Methodology
3.1. Trend and Change Point Test
Before assessing impacts of climate change and human activities on the Three Gorges Reservoir inflow, the temporal trends and break point of the inflow series and meteorological series are analyzed. After the temporal trends and change points are detected by the statistical methods, the whole study period can be divided into pre-change period, which is less affected by climate change or human activities, and post-change period, which is affected by changing environment obviously. Different statistical methods sometimes get different results for the same runoff series. Therefore, in this study, four statistical methods are selected: (1) A simple linear regression method, which is a traditional parametric t-test method, is used to analyze linear trend of the data series in this study. (2) The non-parametric Mann–Kendall test, which was originally devised by Mann [20] and derived by Kendall [21], is highly recommended by the World Meteorological Organization and widely used to detect monotonic trends in long-term hydrological variations. It is used to detect monotonic trends in inflow series, precipitation series, and temperature series and assess the significance of monotonic trends. (3) The non-parametric Pettitt’s test [22], which is similar to the Mann–Kendall test, is a rank-based and distribution-free test. In this study, it is used to detect the occurrence of an abrupt change point in historical inflow. (4) A sequential clustering method [23] is also used to identify the break point in the inflow series as a reconfirmation of the abrupt change point detected by the Pettitt’s test.
3.2. Inflow Simulation by SWAT
SWAT is a hydrological modeling tool designed to assess surface runoff, groundwater discharge, evapotranspiration, and soil water content. It has been certified as an effective tool for evaluating water resources and LUCC at a wide range of scales [24]. As a physically based distributed hydrological model, SWAT can assess impacts from various environmental changes on hydrological cycles in complex watersheds with heterogeneous LULC, topography, and soils conditions. More detailed description about SWAT model structure, model setup and so on can be found in the literature [16,25]. Based on the DEM map, LULC map and soil type map, the model structure for basin up the Three Gorges Reservoir could be established. The coefficient of determination (R2) and the Nash–Sutcliffe model efficiency coefficient (NSE) are chosen to evaluate the performance of the calibrated model. R2 is used to evaluate linear correlation between simulated results and observed inflow. NSE is used to evaluate the fitting and predictive power of the model [26].
3.3. Quantitative Assessment Method
After determining the abrupt change point and establishing the model, changes in the Three Gorges Reservoir inflow can be attributed to climate change, LUCC and human activities that are related to water directly, such as domestic and industrial water supply inside the watershed, and water diversion towards other watersheds. To calculate the impacts, the steps are as follows:
- Step. 1.
- Divide the whole study period into N + 1 stages based on temporal feature of inflow series. One of them is the pre-change period (stage 0) which is considered as a natural period, and other N stages all belong to the post-change period and cover the whole post-change period.
- Step. 2.
- Simulate inflow with LULC data and meteorological data in stage i − 1 (i = 1, 2, …, N) by SWAT. This inflow is denoted with R(Li−1, Ci−1), where Li−1 means LULC data in stage i − 1, Ci−1 means meteorological data in stage i − 1.
- Step. 3.
- Remain the LULC condition in stage i − 1 unchanged, input meteorological data in stage i. Then, simulate inflow and denote this inflow with R(Li−1, Ci), where Li−1 means LULC data in stage i − 1, means meteorological data in stage . Impact of climate change on the inflow in stage can be calculated as:where is the change caused by climate change in stage , and the other items are the same as mentioned earlier.
- Step. 4.
- Leave the meteorological data in stage i unchanged, input LULC data in stage i. Then, simulate inflow and denote this inflow with R(Li, Ci), where Li means LULC data in stage i, Ci means meteorological data in stage i. Impact of LUCC on the inflow in stage i can be calculated as:where ΔRL,i is the change caused by LUCC in stage i, and other items are the same as mentioned earlier.
- Step. 5.
- After the impacts of climate change and LUCC on the inflow are calculated, the remaining changes in the inflow can be attributed to human activities that are related to water directly, and can be calculated as:where ΔRD,i is the change caused by direct human activities in stage , ΔRT,i is total changes in the inflow in stage i, RO,i is observed inflow in stage i, and other items are the same as above.
The number of stages is also based on the temporal feature of the runoff series. When N = 1, the steps above are procedures for the two-stage method, and the two stages are the pre-change period (stage 0) and the post-change period (stage 1). When N > 1, the steps above are procedures for the multi-stage method, the first stage (stage 0) is the pre-change period (Figure 2). In other words, the two-stage method is a special case of the multi-stage method, and the multi-stage method is a generalization of the two-stage method.
4. Changes in Reservoir Inflow, Precipitation and Temperature
The annual reservoir inflow shows a decreasing trend with a slope of −7.7 km3 per ten years during the study period (Figure 3a). Both the simple linear regression method and the Mann–Kendall test indicate that this decreasing trend is remarkable with a confidence level of 95%. The annual total precipitation up the Three Gorges Reservoir shows a decreasing trend with a slope of −13.5 mm per ten years (Figure 3b), whereas the annual mean temperature shows an increasing trend with a slope of 0.1 °C per ten years (Figure 3c), which is in accordance with the context that global temperature increased by 0.7 °C during the last one hundred years [27]. It also can be seen in Figure 3 that there is a strong positive correlation between precipitation and reservoir inflow, while temperature is negatively correlated to the reservoir inflow.
The non-parametric Pettitt’s test is used to detect the occurrence of an abrupt change point in the Three Gorges Reservoir inflow, and the sequential clustering method is used to further confirm the break point identified by the Pettitt’s test. Both methods indicate that the year 1993 is the abrupt change point. The reservoir inflow is considered less affected by climate change and human activities before the abrupt change point and changes obviously. Accordingly, the study period can be divided into pre-change period and post-change period (i.e., 1951–1993 and 1994–2016) by the change point. The means, standard deviations and coefficient of variation of the annual reservoir inflow, precipitation and temperature in the two periods are analyzed to better understand the characteristics of changes in the reservoir inflow and climate (Table 1). The mean of annual reservoir inflow for the post-change period relative to that for the pre-change period decreases 7.7%, indicating large decrease in the annual inflow during the post-change period. Statistically significant differences between the means of two periods can be found with a confidence level of 99% using the t-test, whereas using the F-test, differences between the standard deviations of the two periods are not statistically significant. In addition, the increasing coefficient of variation of the reservoir inflow indicates that the inflow varies more in the post-change period than in the pre-change period. This change in the coefficient of variation is in accordance with facts that human activities are becoming more complex and greater [18]. As for precipitation and temperature, statistically significant differences between the means of two periods are also found at a 95% confidence level using the t-test. The mean of annual precipitation for the post-change period relative to that for the pre-change period decreases 4.5% and temperature increases 3.7%, whereas, using the F-test, differences between the standard deviations of the two periods are not statistically significant. Comparing with the pre-change period (i.e., 1951–1993), the Three Gorges Reservoir inflow is at a low level in the post-change period (i.e., 1994–2016), as well as the precipitation, whereas the temperature is at a high level.
5. Reservoir Inflow Simulation
Sensitivity analysis is performed to evaluate the effect of parameters on the performance of the model in runoff simulation. Based on the sensitivity analysis, eleven highly sensitive parameters are selected and calibrated (Table 1). The pre-change period is divided into calibration period from 1951 to 1980 and validation period from 1981 to 1993. The LULC map of the late 1980s is used as the LULC input for calibration and validation. Calibrated values for the eleven parameters are also listed in Table 2. Simulated and observed inflow during the calibration and validation period are plotted in Figure 4.
Moriasi et al. [28] suggest that NSE values greater than 0.75 are considered excellent, values greater than 0.65 are considered good, and values greater than 0.5 are considered satisfactory for hydrological model evaluation. They further conclude that R2 values greater than 0.5 are regarded as acceptable for model simulation. Values of R2 and NSE are 0.89 and 0.87 for the calibration period, indicating an excellent calibration simulation; values of R2 and NSE are 0.91 and 0.83 for the validation period, indicating an excellent simulation beyond the pre-change period.
6. Quantitative Assessment Analysis
One piece of LULC map is a composite of dozens of pictures taken by the orbiting satellite. Limited to track of the orbiting satellite, every picture is taken sequentially. As a result, there is an interval of about several years between pieces. Different from changes in erratic weather or subjective water diversion, LULC are sometimes considered accumulative and chronic [16,19,29,30]. The two-stage method and multi-stage method are both based on the premise that LULC remains stable during a certain period. Divergence between the two is how long the certain period continues. In the procedure of the two-stage method, LULC is considered stable during the whole post-change period, while the stable condition lasts shorter in the multi-stage method.
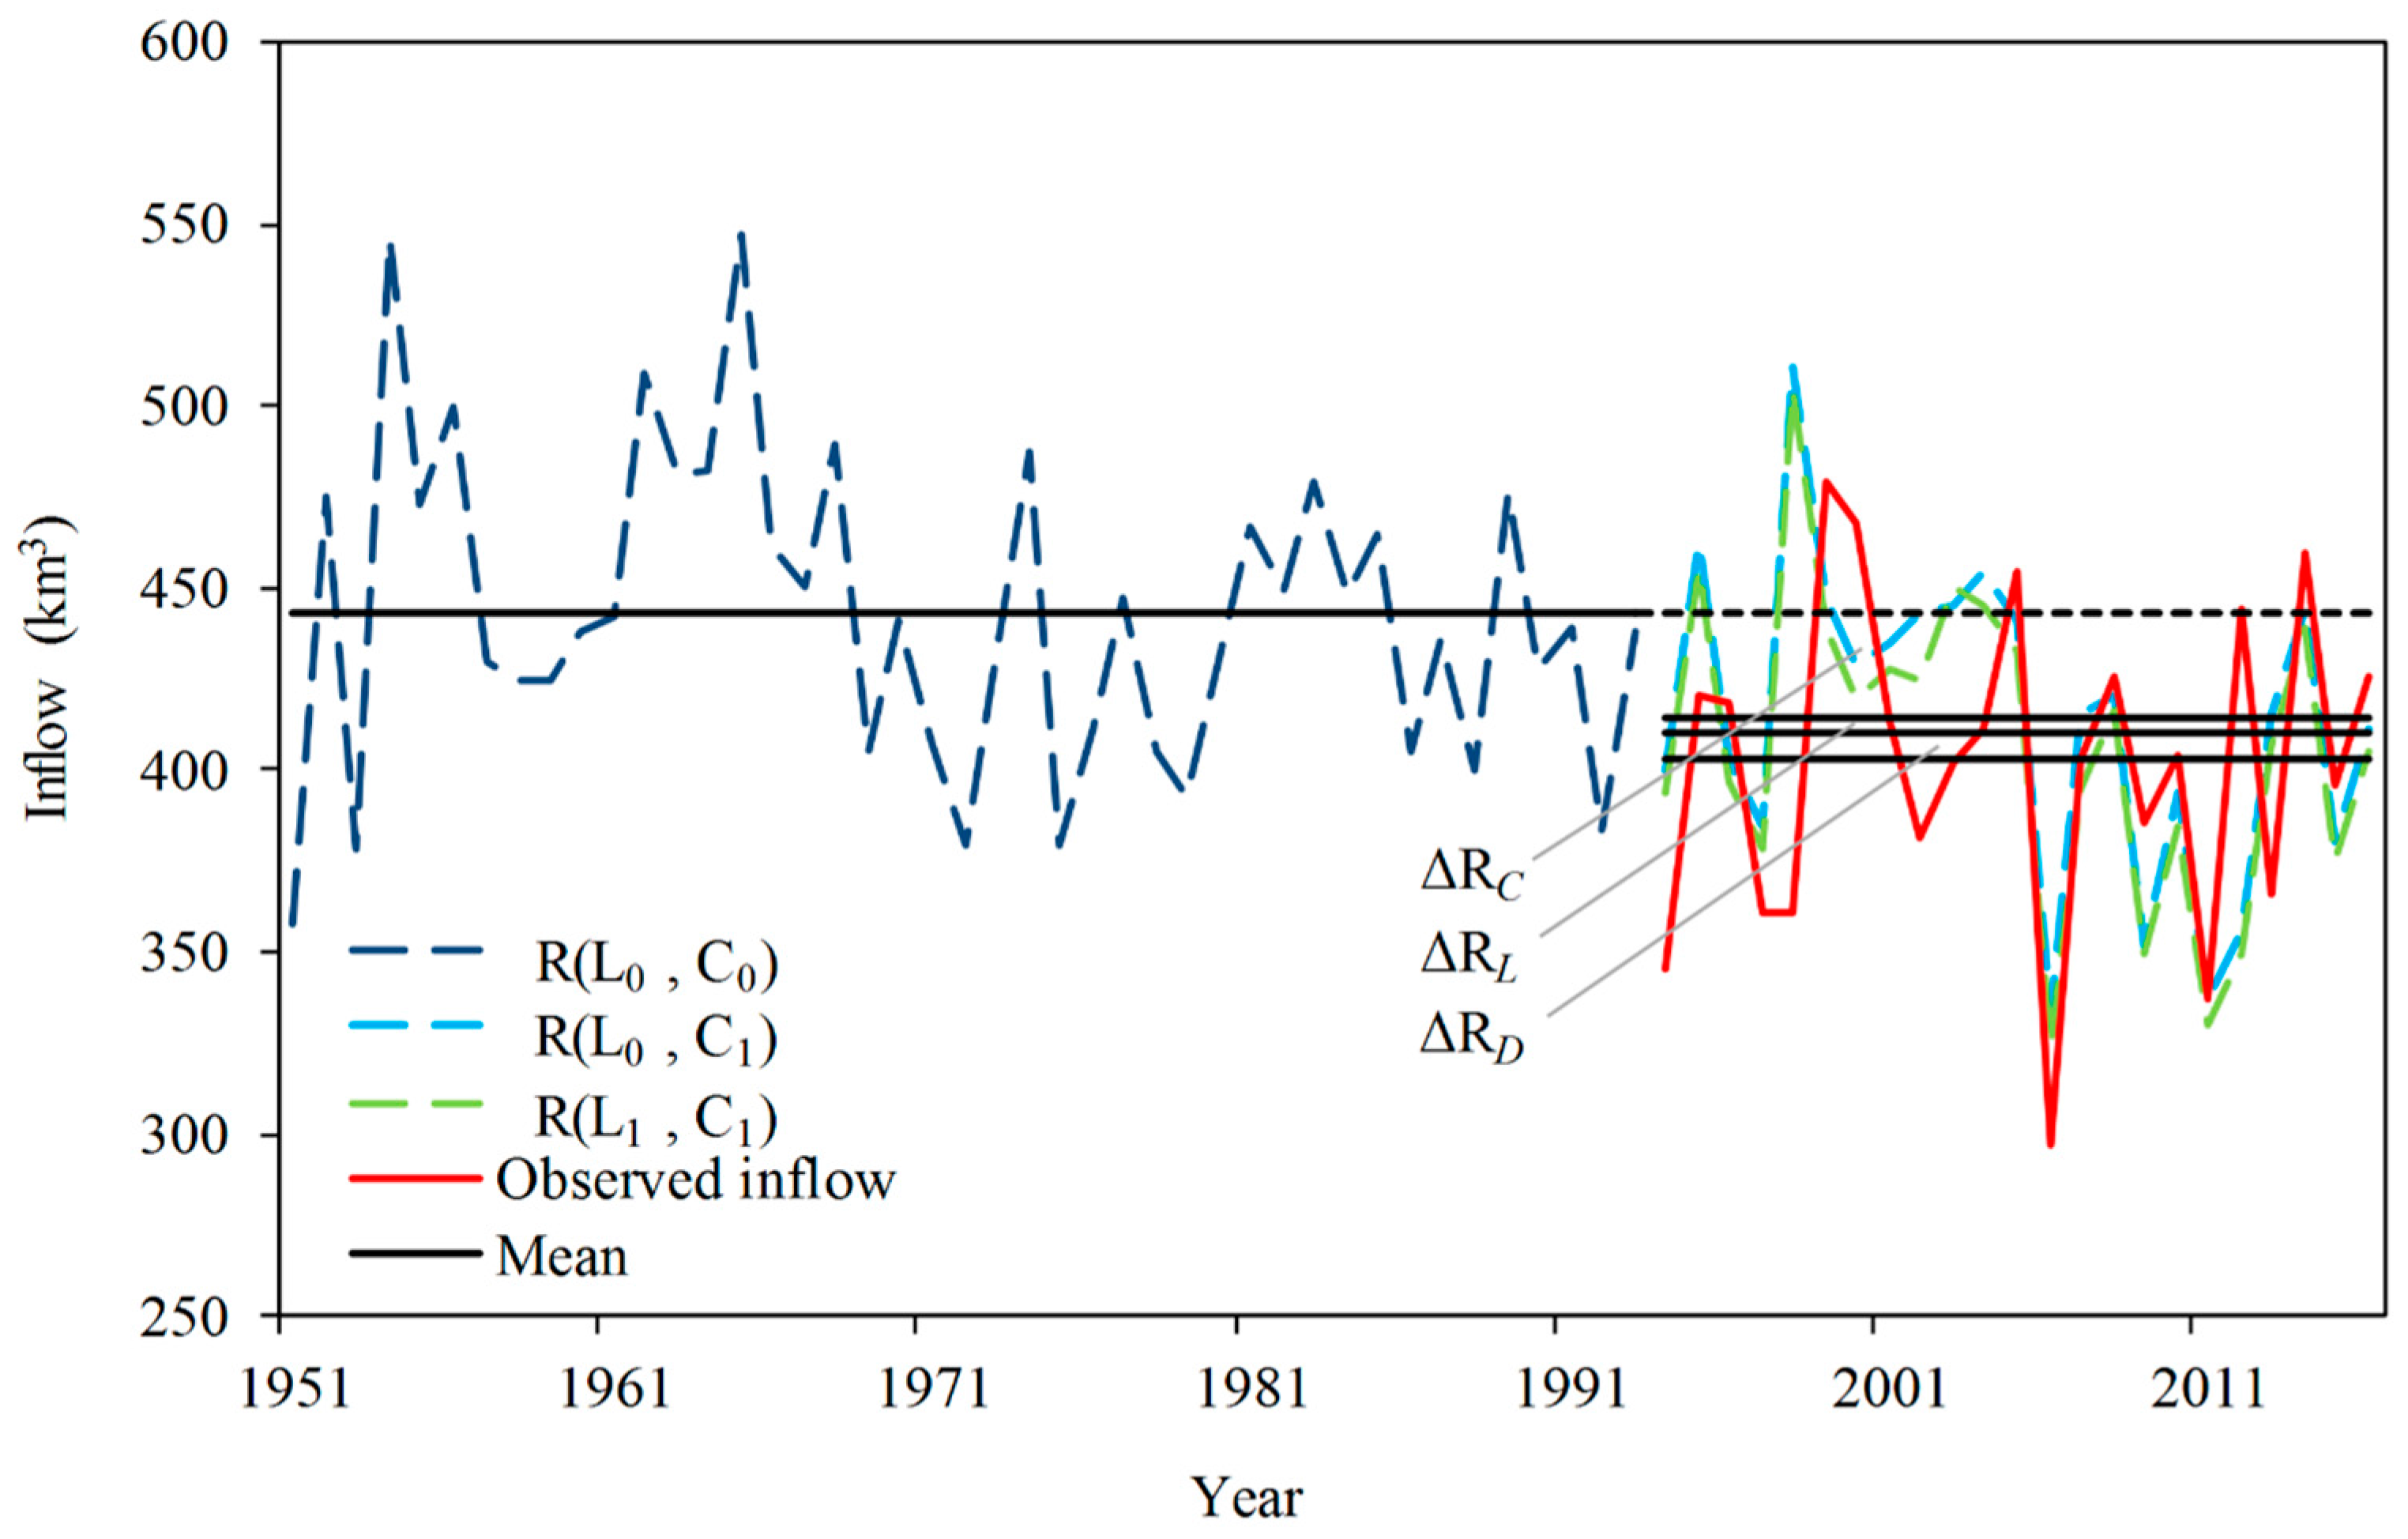
One piece of LULC map in each stage is enough for quantitative assessment. The map in the late 1980s has been used to represent LULC condition during the pre-change period (the first stage). As for the two-stage method, the LULC map in 2010 is used to represent the condition during the whole post-change period (the second stage). The inflow R(L0, C1) and R(L1, C1) during the post-change period mentioned above are simulated by the built SWAT model and plotted in Figure 5, as well as the simulated inflow during the pre-change period and observed inflow during the post-change period. Changes in the Three Gorges Reservoir inflow can be attributed to climate change, LUCC, and direct human activities by the steps introduced above. They are −30.5 km3, −4.8 km3, and −8.3 km3, accounting for 70%, 11%, and 19%, respectively (Table 3).
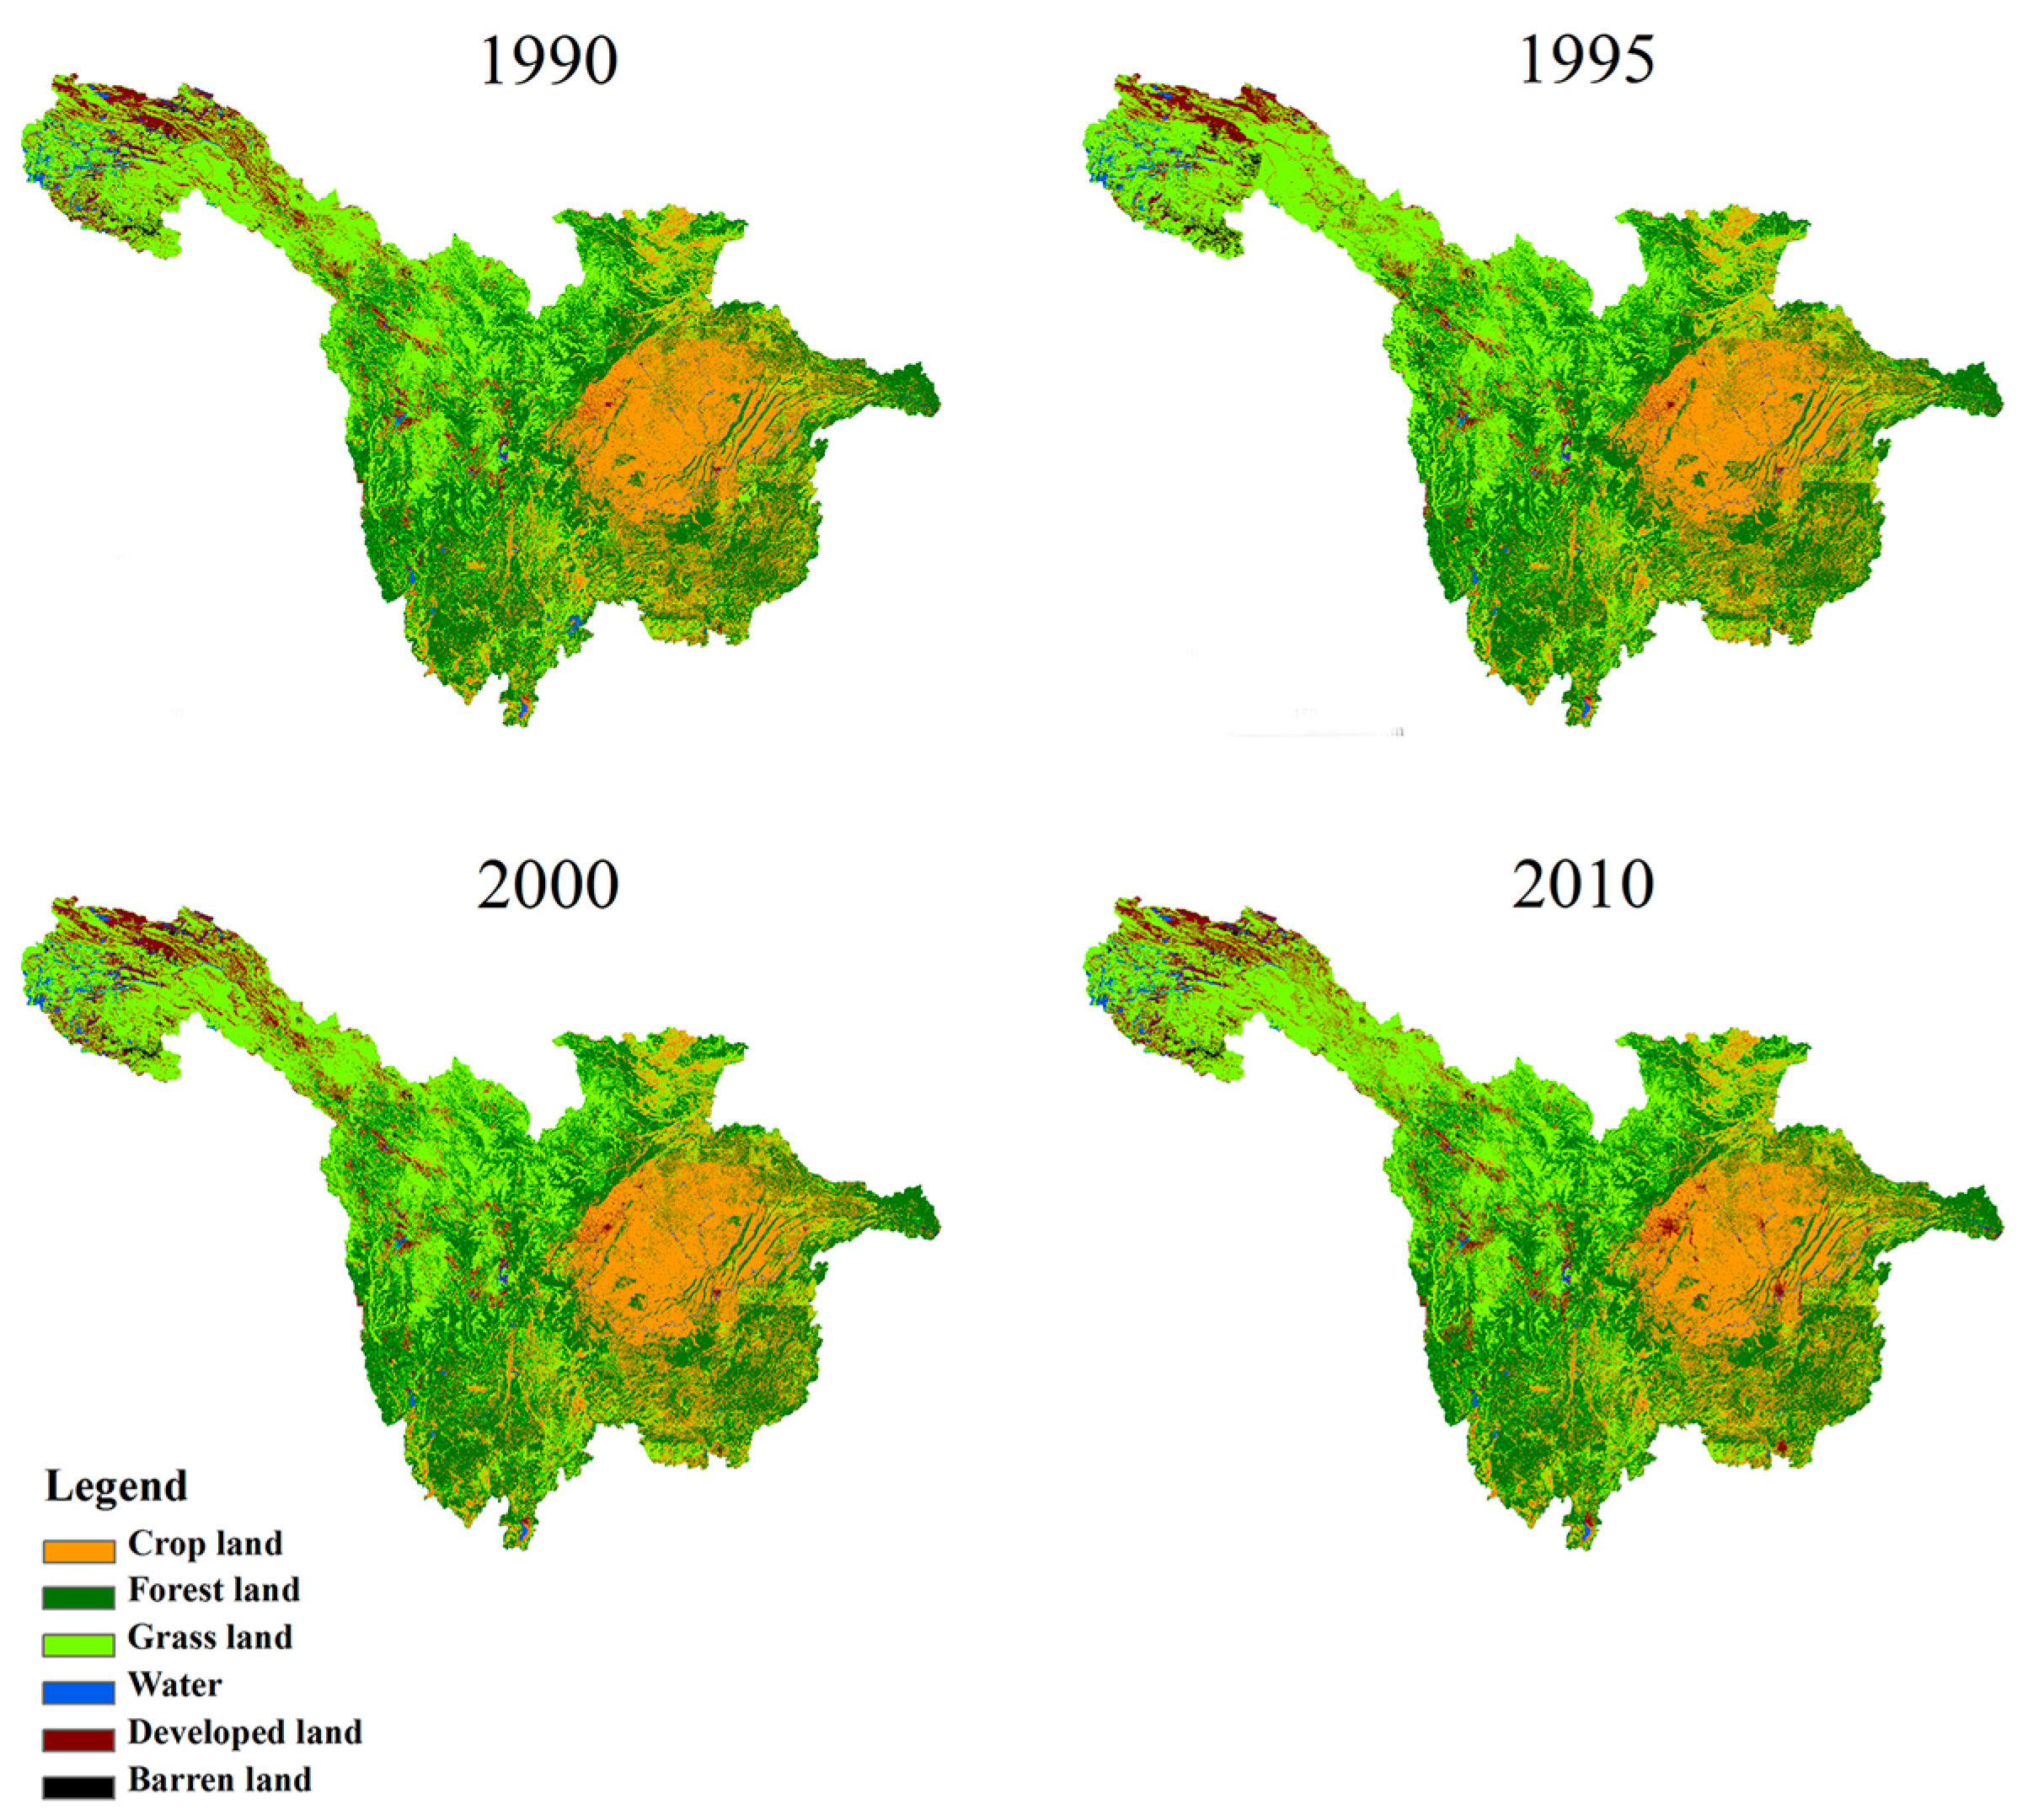
When LULC condition changes a lot during the post-change period, the multi-stage method is superior to the two-stage method, because it can describe the impact of temporal and spatial variation of LULC condition on the reservoir inflow. However, the boundaries between changing a little and changing a lot are always being blurred and muddled. There has not been a clear criterion on whether the two-stage method or the multi-stage method performs better in a certain situation. In this study, LULC from the late 1980s to 2010 are compared and Figure 6 displays the historical LULC maps for the study area. The overall LULC has changed “little” between the historical maps, except some local obvious changes. The areas and percentages of LULC types during the four different periods are shown in Table 4.
In area up the Three Gorges Reservoir, the most major LULC types are grass land, forest land, and crop land, accounting for more than 90% of the total area. Changes in the areas of different LULC types range from −4 to 4 × 10³ km2. “Little changes” in areas of LULC types often become the basis of the previous studies, which suggested that LULC condition changed slowly and the two-stage method could be used [27]. Although “little changes” are detected in areas of different LULC types, there are abundant transformations between different types, indicating the spatial variation of LULC (Table 5). For the crop land, 65.5% of crop land in 1990 is unchanged in 2010, while 34.5% turns into other types. These transformations are involved in most part of the hydrological process from runoff generation to concentration and cause changes in the Three Gorges Reservoir inflow finally [31,32]. Therefore, the multi-stage method could be more suitable for assessing the impact of LUCC.
To consider the temporal and spatial variation of LULC, the multi-stage method is also used to assess the impact on the Three Gorges Reservoir inflow. Before quantitative calculations, the post-change period must be divided into some shorter stages. The temporal pattern studied above shows a mixed level of both high and low amount of inflows, where 1994–1997 shows a low level, 1998–2005 shows a high level and 2006–2016 shows a low level (Figure 3a). According to the temporal pattern, the post-change period can be divided into three stages (i.e., 1994–1997, 1998–2005, and 2006–2016). The LULC maps of 1995, 2000, and 2010 are used as the LULC inputs for the three stages in the post-change period, respectively. Following the steps of the multi-stage method introduced above, changes in the Three Gorges Reservoir inflow can be attributed to climate change, LULC, and direct human activities for every stage. The calculation results are listed in Table 6.
7. Comparison between Two- and Multi-Stage Method
To test impact of the number of stages on assessing quantitative assessment, and obtain credible attribution results, both two- and multi-stage method are used in this study. For ease of comparison, impacts of climate change, LUCC, and direct human activities for every stage are accumulated. The accumulated results are listed in Table 7, as well as the results of the two-stage method. It can be seen that assessment of impacts on the Three Gorges Reservoir inflow via the two methods are close in results. For the multi- stage method, the contribution of climate change in stage 1994–1997 and 1998–2005 is larger than that in two-stage method (Table 6). Because impact of LULC and other human activities are accumulated stage by stage, and impact of climate is related to difference of meteorological factors between stages. It is noteworthy that there are some abrupt changes in different stage results of multi-stage method. LUCC during the stage 1999–2005 result in increased reservoir inflow, which are different from the general characteristics. However, it is virtually impossible to make an obvious change in LULC condition in a short time. Different from the chronic climate change, the LULC condition is usually affected by policy at the time.
In recent decades, intense human activities up the Three Gorges Reservoir have had profound effects on the reservoir inflow [18]. Therefore, it is particularly important to fully consider the human activities either directly or indirectly related to water when identifying and analyzing the changes in the Three Gorges Reservoir inflow.
For the term ΔRL, LUCC have lasting impacts on runoff. Until the end of 2010, up the Three Gorges Reservoir, 13,000 reservoirs have been built, which have a total storage of 56 km3. Evaporation from water surface is usually greater than that from land surface. Therefore, increasing water area caused by constructions of reservoirs results in increasing evaporation. Mean annual actual evapotranspiration in the Yangtze River basin is 520 mm and mean annual pan evaporation is 1400 mm [33]. Moreover, evaporation from airy and open water surface is greater than the pan evaporation. Therefore, increase in actual evaporation caused by constructions of reservoirs could be estimated at 1 m per year. As shown in Table 4, area of water increased by 4 × 10³ km2 from 1990 to 2010. Under the above conditions, 4 km3 of the Three Gorges Reservoir inflow is lost due to the increased actual evaporation. After 2010, more and more reservoirs are planning to be constructed, and the loss of water is increasing.
For the term ΔRD, some human activities get involved with runoff directly, for instance, reservoir impoundment, domestic and industrial water supply inside the watershed, water diversion towards other watersheds. These human activities have great and direct impacts on runoff [34]. Reservoir impoundment is used as an example. It is mentioned in the prior context that, until the end of 2010, reservoirs built up the Three Gorges Reservoir have a total storage of 56 km3. In other words, 56 km3 of water, which is the equivalent of 13% of the Three Gorges Reservoir mean annual inflow, has been impounded in the reservoirs until the end of 2010. The Three Gorges Reservoir inflow decreases 0.2% per year because of reservoir impoundment. In addition, reservoir impoundment also leads to increase in the water usage. Although most of this will return to the runoff and be collected into the reservoir finally, significant water loses in the processes in the form of evaporation [35,36]. All these activities are attributed to the term ΔRD. According to the national strategy, a complex water and hydropower system composed of more than one hundred large reservoirs will be built in the future. Because of the constructions of more reservoirs, together with start of the Western Route of South-to-North Water Transfer Project and economic development, the Three Gorges Reservoir inflow will continue to decrease in future.
8. Conclusions
Influenced by both climate change and human activities, significant changes occur in the Three Gorges Reservoir inflow. These changes are identified and attributed to the impacts of climate change and human activities separately in this study. Findings of this study are important for both the Three Gorges Reservoir and application of SWAT. The findings are concluded as follows:
- (1)
- Significant decrease has occurred in the Three Gorges Reservoir inflow in the past 66 years. The reservoir inflow decreases by 7.7 km3 per ten years, annual total precipitation decreases by −13.5 mm per ten years, and annual average temperature increases by 0.1 °C per ten years. The abrupt change point of the Three Gorges Reservoir inflow series is the year 1993; reservoir inflows are significantly different before and after this year.
- (2)
- Climate change, especially the decreased precipitation and the increased temperature, is the primary cause. Intense human activities are also important causes, whether they are directly or indirectly related to the runoff. The contribution of climate change and human activities is around 7:3.
- (3)
- The two-stage method and the multi-stage method are close in results when using assessing impacts on the Three Gorges Reservoir inflow during the whole post-change period. Impacts of the temporal and spatial variation of LULC can be described in some detail by the multi-stage method. The two-stage method is recommended for large scale basins considering the complexity of simulation. The multi-stage method is recommended for detailed assessment.
- (4)
- Both the two-stage method and multi-stage method are based on the distributed hydrological model, and can describe and assess the impacts from direct or indirect human activities. The description and assessment of the human activities accord with the facts in the area up the Three Gorges Reservoir.
Acknowledgments
This work is supported by the National Key R&D Program of China (grant 2017YFC0405606), the National Natural Science Foundation of China (grant 51579068), the China Postdoctoral Science Foundation (grant 2017M621612), and the Postgraduate Research & Practice Innovation Program of Jiangsu Province. The authors also thank the anonymous reviewers and editors for their constructive comments that greatly improve the quality of the manuscript.
Author Contributions
This research was carried out in collaboration among all authors. Yu Zhang and Ping-an Zhong had the original idea for the study; Juan Chen and Jianping Bing conducted the research methods; Dinghao Xu collected and processed the data; Manlin Wang provided many improvements on the manuscript.
Conflicts of Interest
The authors declare no conflict of interest.
References
- Ohmura, A.; Wild, M. Is the hydrological cycle accelerating? Science 2002, 298, 1345–1346. [Google Scholar] [CrossRef] [PubMed]
- Brown, A.E.; Zhang, L.; McMahon, T.A.; Western, A.W.; Vertessy, R.A. A review of paired catchment studies for determining changes in water yield resulting from alterations in vegetation. J. Hydrol. 2005, 310, 28–61. [Google Scholar] [CrossRef]
- Zhang, X.P.; Zhang, L.; Zhao, J.; Rustomji, P.; Hairsine, P. Responses of streamflow to changes in climate and land use/cover in the Loess Plateau, China. WRR 2009, 44, 2183–2188. [Google Scholar] [CrossRef]
- Milly, P.C.D.; Dunne, K.A.; Vecchia, A.V. Global pattern of trends in streamflow and water availability in a changing climate. Nature 2005, 438, 347–350. [Google Scholar] [CrossRef] [PubMed]
- Notter, B.; Macmillan, L.; Viviroli, D.; Weingartner, R.; Liniger, H.P. Impacts of environmental change on water resources in the Mt. Kenya region. J. Hydrol. 2007, 343, 266–278. [Google Scholar] [CrossRef]
- Wang, X. Advances in separating effects of climate variability and human activity on stream discharge: An overview. Adv. Water Resour. 2014, 71, 209–218. [Google Scholar] [CrossRef]
- Revelle, R.R.; Waggoner, P.E. Effects of a carbon dioxide-induced climatic change on water supplies in the western United States. In Changing Climate; National Academy of Sciences, National Academy Press: Washington, DC, USA, 1983; pp. 419–432. [Google Scholar]
- Schaake, J.C. From climate to flow. In Climate Change and U.S. Water Resources; Waggoner, P.E., Ed.; John Wiley: New York, NY, USA, 1990; Chapter 8; pp. 177–206. [Google Scholar]
- Raveendra, K.; Rai, B.; Mathur, S. Event-based sediment yield modeling using artificial neural network. Water Resour. Manag. 2008, 22, 423–441. [Google Scholar]
- Sugawara, M. On the analysis of runoff structure about several Japanese rivers. Jap. J. Geophys. 1961, 2, 1–77. [Google Scholar]
- Crawford, N.H.; Linsley, R.K. Digital Simulation on Hydrology: Stanford Watershed Model IV: Stanford University Technical Report No. 39; Stanford University: Palo Alto, CA, USA, 1966. [Google Scholar]
- Zhao, R.J. Hydrological Modeling; Water Resources and Electric Power Press: Beijing, China, 1984. [Google Scholar]
- Zeng, S.D.; Xia, J.; Du, H. Separating the effects of climate change and human activities on runoff over different time scales in the Zhang River basin. Stoch. Environ. Res. Risk Assess. 2014, 28, 401–413. [Google Scholar] [CrossRef]
- Zuo, D.P.; Xu, Z.X.; Wu, W.; Zhao, J.; Zhao, F.F. Identification of Streamflow Response to Climate Change and Human Activities in the Wei River Basin, China. Water Resour. Manag. 2014, 28, 833–851. [Google Scholar] [CrossRef]
- Chang, J.X.; Wang, Y.M.; Istanbulluoglu, E.; Bai, T.; Huang, Q.; Yang, D.W.; Huang, S.Z. Impact of climate change and human activities on runoff in the Weihe River Basin, China. Quat. Int. 2015, 380, 169–179. [Google Scholar] [CrossRef]
- Li, Q.Y.; Yu, X.X.; Xin, Z.B.; Sun, Y.W. Modeling the Effects of Climate Change and Human Activities on the Hydrological Processes in a Semiarid Watershed of Loess Plateau. J. Hydrol. Eng. 2012, 18, 401–412. [Google Scholar] [CrossRef]
- Piao, S.L.; Ciais, P.; Huang, Y.; Shen, Z.H.; Peng, S.S.; Li, J.S.; Zhou, L.P.; Liu, H.Y.; Ma, Y.C.; Ding, Y.H.; et al. The impacts of climate change on water resources and agriculture in China. Nature 2010, 467, 43–51. [Google Scholar] [CrossRef] [PubMed]
- Zhang, Y.; Zhong, P.A.; Wang, M.L.; Xu, B.; Chen, J. Changes identification of the Three Gorges reservoir inflow and the driving factors quantification. Quat. Int. 2016, in press. [Google Scholar] [CrossRef]
- Dong, W.; Cui, B.S.; Liu, Z.H.; Zhang, K.J. Relative effects of human activities and climate change on the river runoff in an arid basin in northwest China. Hydrol. Process. 2014, 28, 4854–4864. [Google Scholar] [CrossRef]
- Mann, H.B. Non-parametric test against trend. Econometrica 1945, 13, 245–259. [Google Scholar] [CrossRef]
- Kendall, M.G. Rank Correlation Methods; Charles Griffin: London, UK, 1975. [Google Scholar]
- Pettitt, A.N. A non-parametric approach to the change-point problem. Appl. Stat. 1979, 28, 126–135. [Google Scholar] [CrossRef]
- Sharma, T.C. Stochastic models applied to evaluating hydrologic changes. J. Hydrol. 1985, 78, 61–81. [Google Scholar] [CrossRef]
- Zhang, X.; Srinivasan, R.; Liew, M.V. On the use of multi-algorithm, genetically adaptive multi-objective method for multi-site calibration of the SWAT model. Hydrol. Process. 2010, 24, 955–969. [Google Scholar] [CrossRef]
- Arnold, J.G.; Srinisvan, R.; Muttiah, R.S.; Williams, J.R. Large area hydrologic modeling and assessment, part I: Model development. J. Am. Water Resour. 1998, 34, 73–89. [Google Scholar] [CrossRef]
- Nash, J.E.; Sutcliffe, J.V. River flow forecasting through conceptual models part I—A discussion of principles. J. Hydrol. 1970, 10, 282–290. [Google Scholar] [CrossRef]
- Heo, J.; Yu, J.; Giardino, J.R.; Cho, H. Water Resources Response to Climate and Land-Cover Changes in a Semi-Arid Watershed, New Mexico, USA. Terr. Atmos. Ocean. Sci. 2015, 26, 463–474. [Google Scholar] [CrossRef]
- Mosbahi, M.; Benabdallah, S.; Boussema, M.R. Sensitivity analysis of a GIS-based model: A case study of a large semi-arid catchment. Earth Sci. Inform. 2015, 8, 569–581. [Google Scholar] [CrossRef]
- Zhang, A.J.; Zhang, C.; Fu, G.B.; Wang, B.D.; Bao, Z.X.; Zheng, H.X. Assessments of Impacts of Climate Change and Human Activities on Runoff with SWAT for the Huifa River Basin, Northeast China. Water Resour Manag. 2012, 26, 2199–2217. [Google Scholar] [CrossRef]
- Xu, Y.P.; Zhang, X.J.; Ran, Q.H.; Tian, Y. Impact of climate change on hydrology of upper reaches of Qiantang River Basin, East China. J. Hydrol. 2013, 483, 51–60. [Google Scholar] [CrossRef]
- Bari, M.A.; Smettem, K.R.J.; Sivapalan, M. Understanding changes in annual runoff following land use changes: A systematic data-based approach. Hydrol. Process. 2005, 19, 2463–2479. [Google Scholar] [CrossRef]
- Bulygina, N.; Mcintyre, N.; Wheater, H. Bayesian conditioning of a rainfall-runoff model for predicting flows in ungauged catchments and under land use changes. Water Resour. Res. 2011, 47, W02503. [Google Scholar] [CrossRef]
- Xu, C.Y.; Gong, L.; Jiang, T.; Chen, D.; Singh, V.P. Analysis of spatial distribution and temporal trend of reference evapotranspiration and pan evaporation in Changjiang (Yangtze River) catchment. J. Hydrol. 2006, 327, 81–93. [Google Scholar] [CrossRef]
- Hall, J.W.; Grey, D.; Garrick, D.; Fung, F.; Brown, C.; Dadson, S.J.; Sadoff, C.W. Water Security. Coping with the curse of freshwater variability. Science 2014, 346, 429–430. [Google Scholar] [CrossRef] [PubMed]
- Feng, B.Q. Study on the Evaluation and Management of Irrigation Water Use Efficiency for Different Scales in Countrywide; China Institute of Water Resources and Hydropower Research: Beijing, China, 2013. (In Chinese) [Google Scholar]
- Yang, X.Q.; Yong, B.; Ren, L.L.; Zhang, Y.Q.; Long, D. Multi-scale validation of GLEAM evapotranspiration products over China via ChinaFLUX ET measurements. Int. J. Remote Sens. 2017, 38, 5688–5709. [Google Scholar] [CrossRef]
Figure 1.
Map of the study area.

Figure 2.
Divisions of study period by two-stage method and multi-stage method.
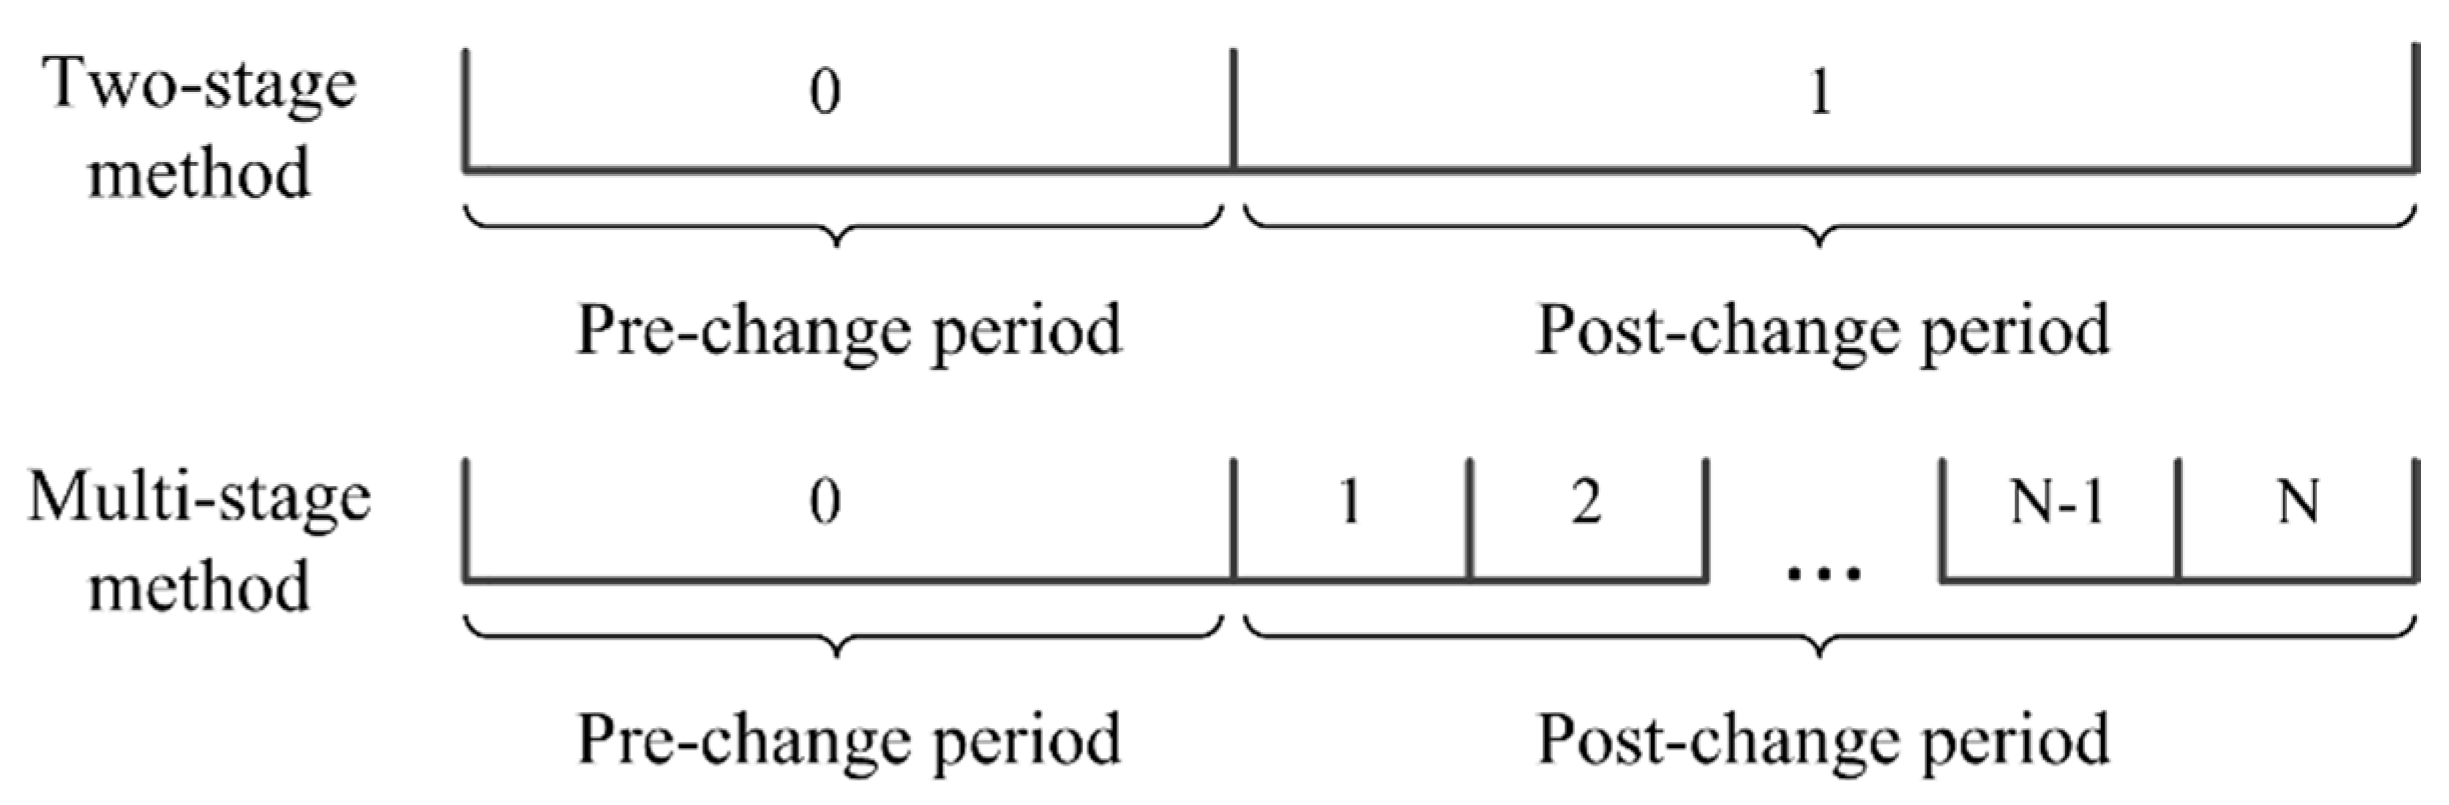
Figure 3.
Long term variations of the Three Gorges reservoir annual inflow, annual total precipitation and annual average temperature: (a) annual inflow; (b) annual total precipitation; and (c) annual average temperature.
Figure 3.
Long term variations of the Three Gorges reservoir annual inflow, annual total precipitation and annual average temperature: (a) annual inflow; (b) annual total precipitation; and (c) annual average temperature.
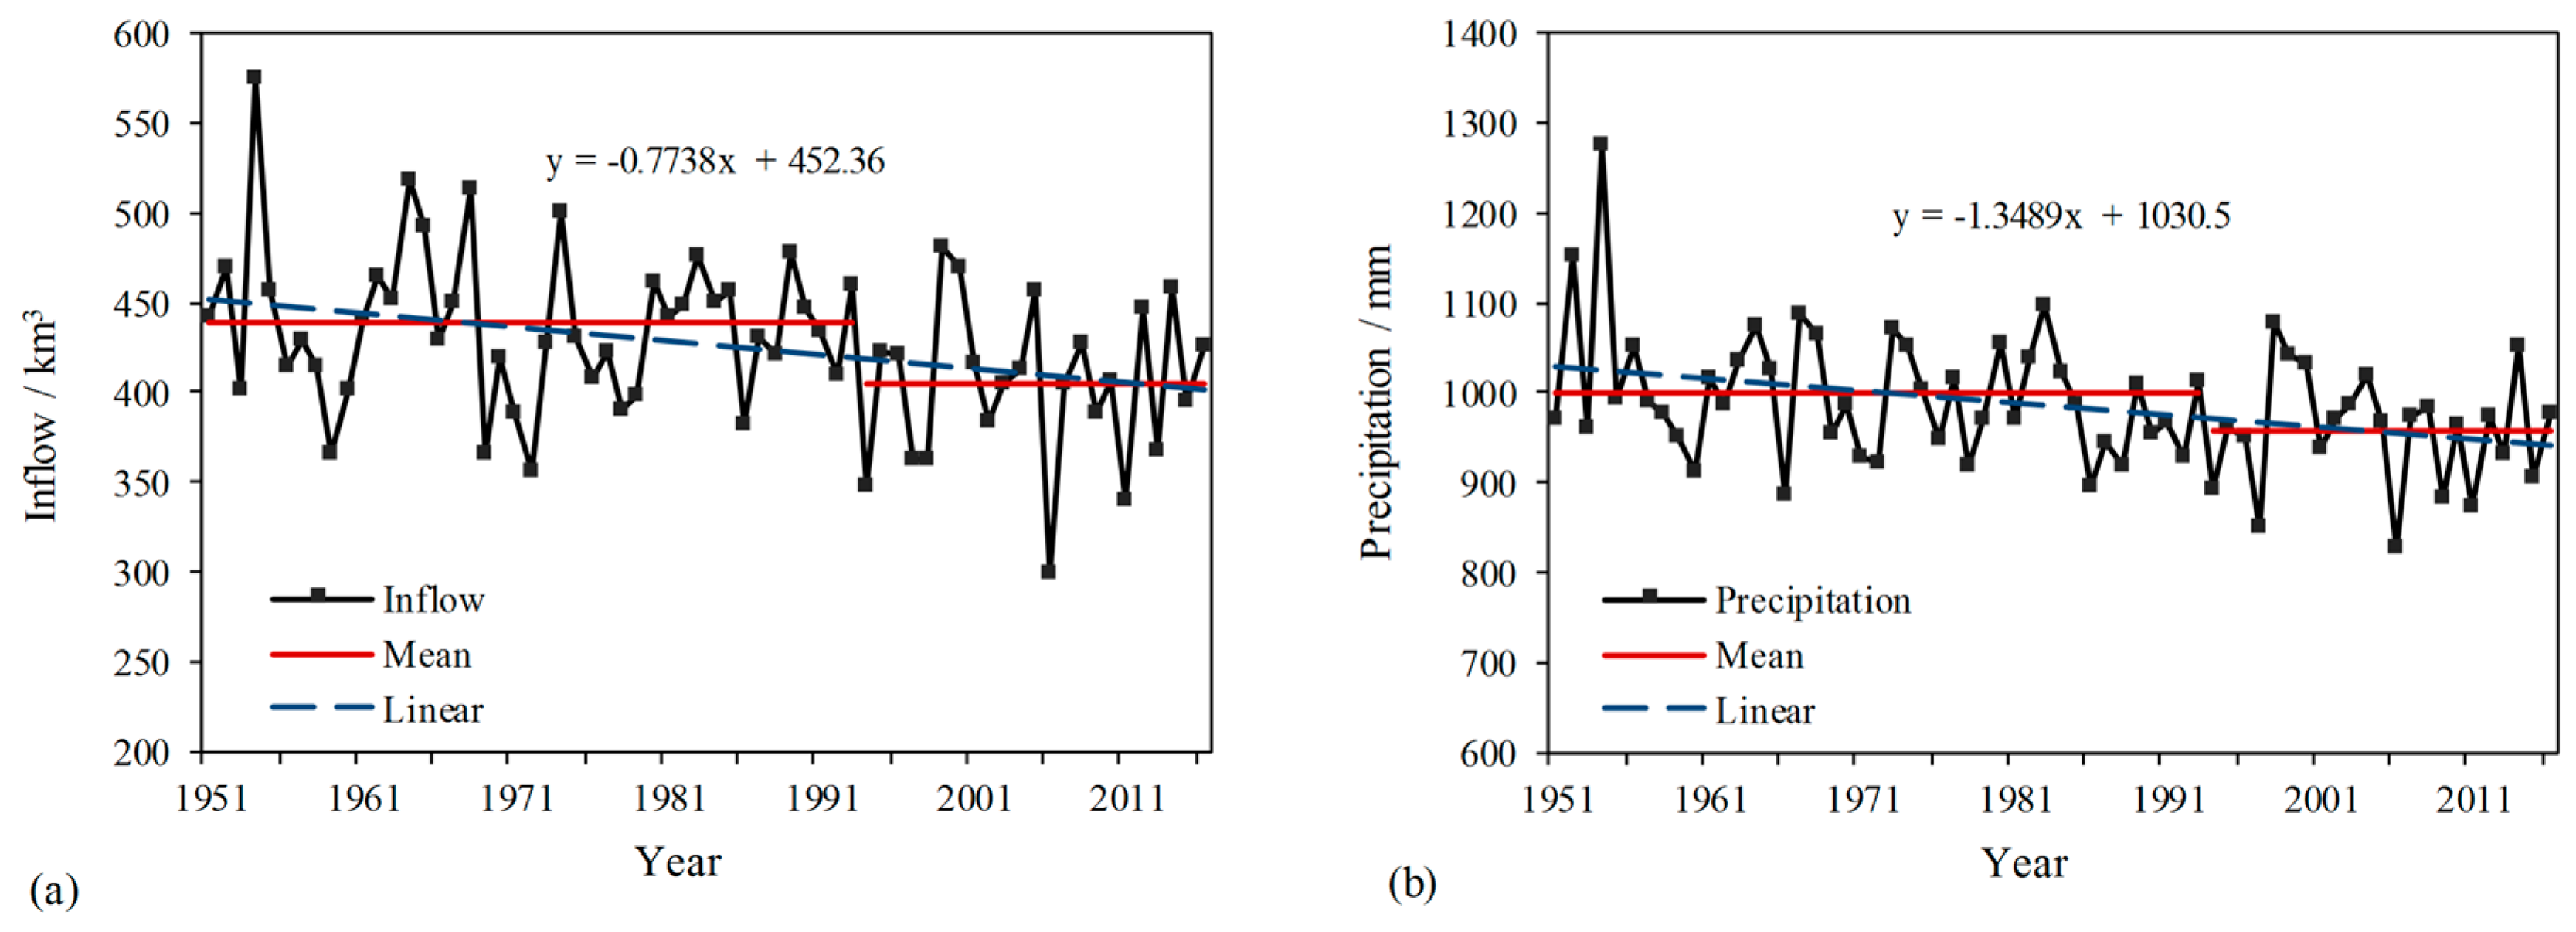
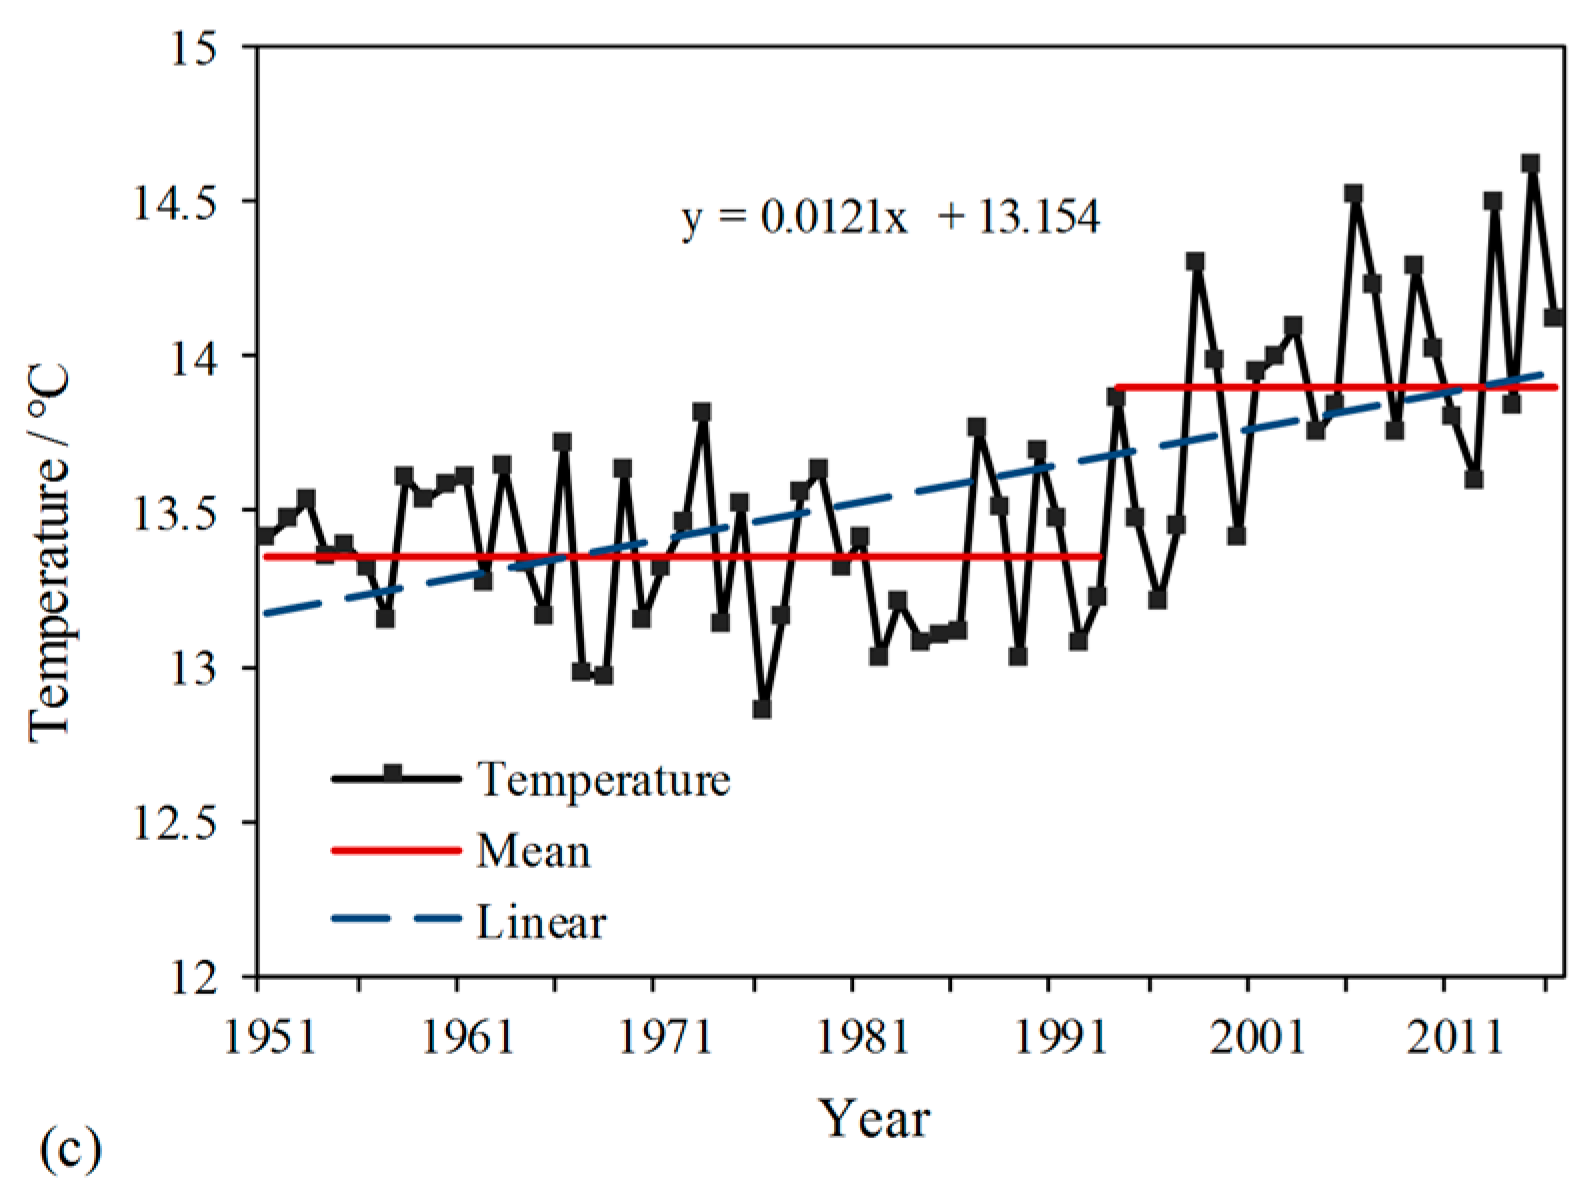
Figure 4.
Calibration and validation of the SWAT model.
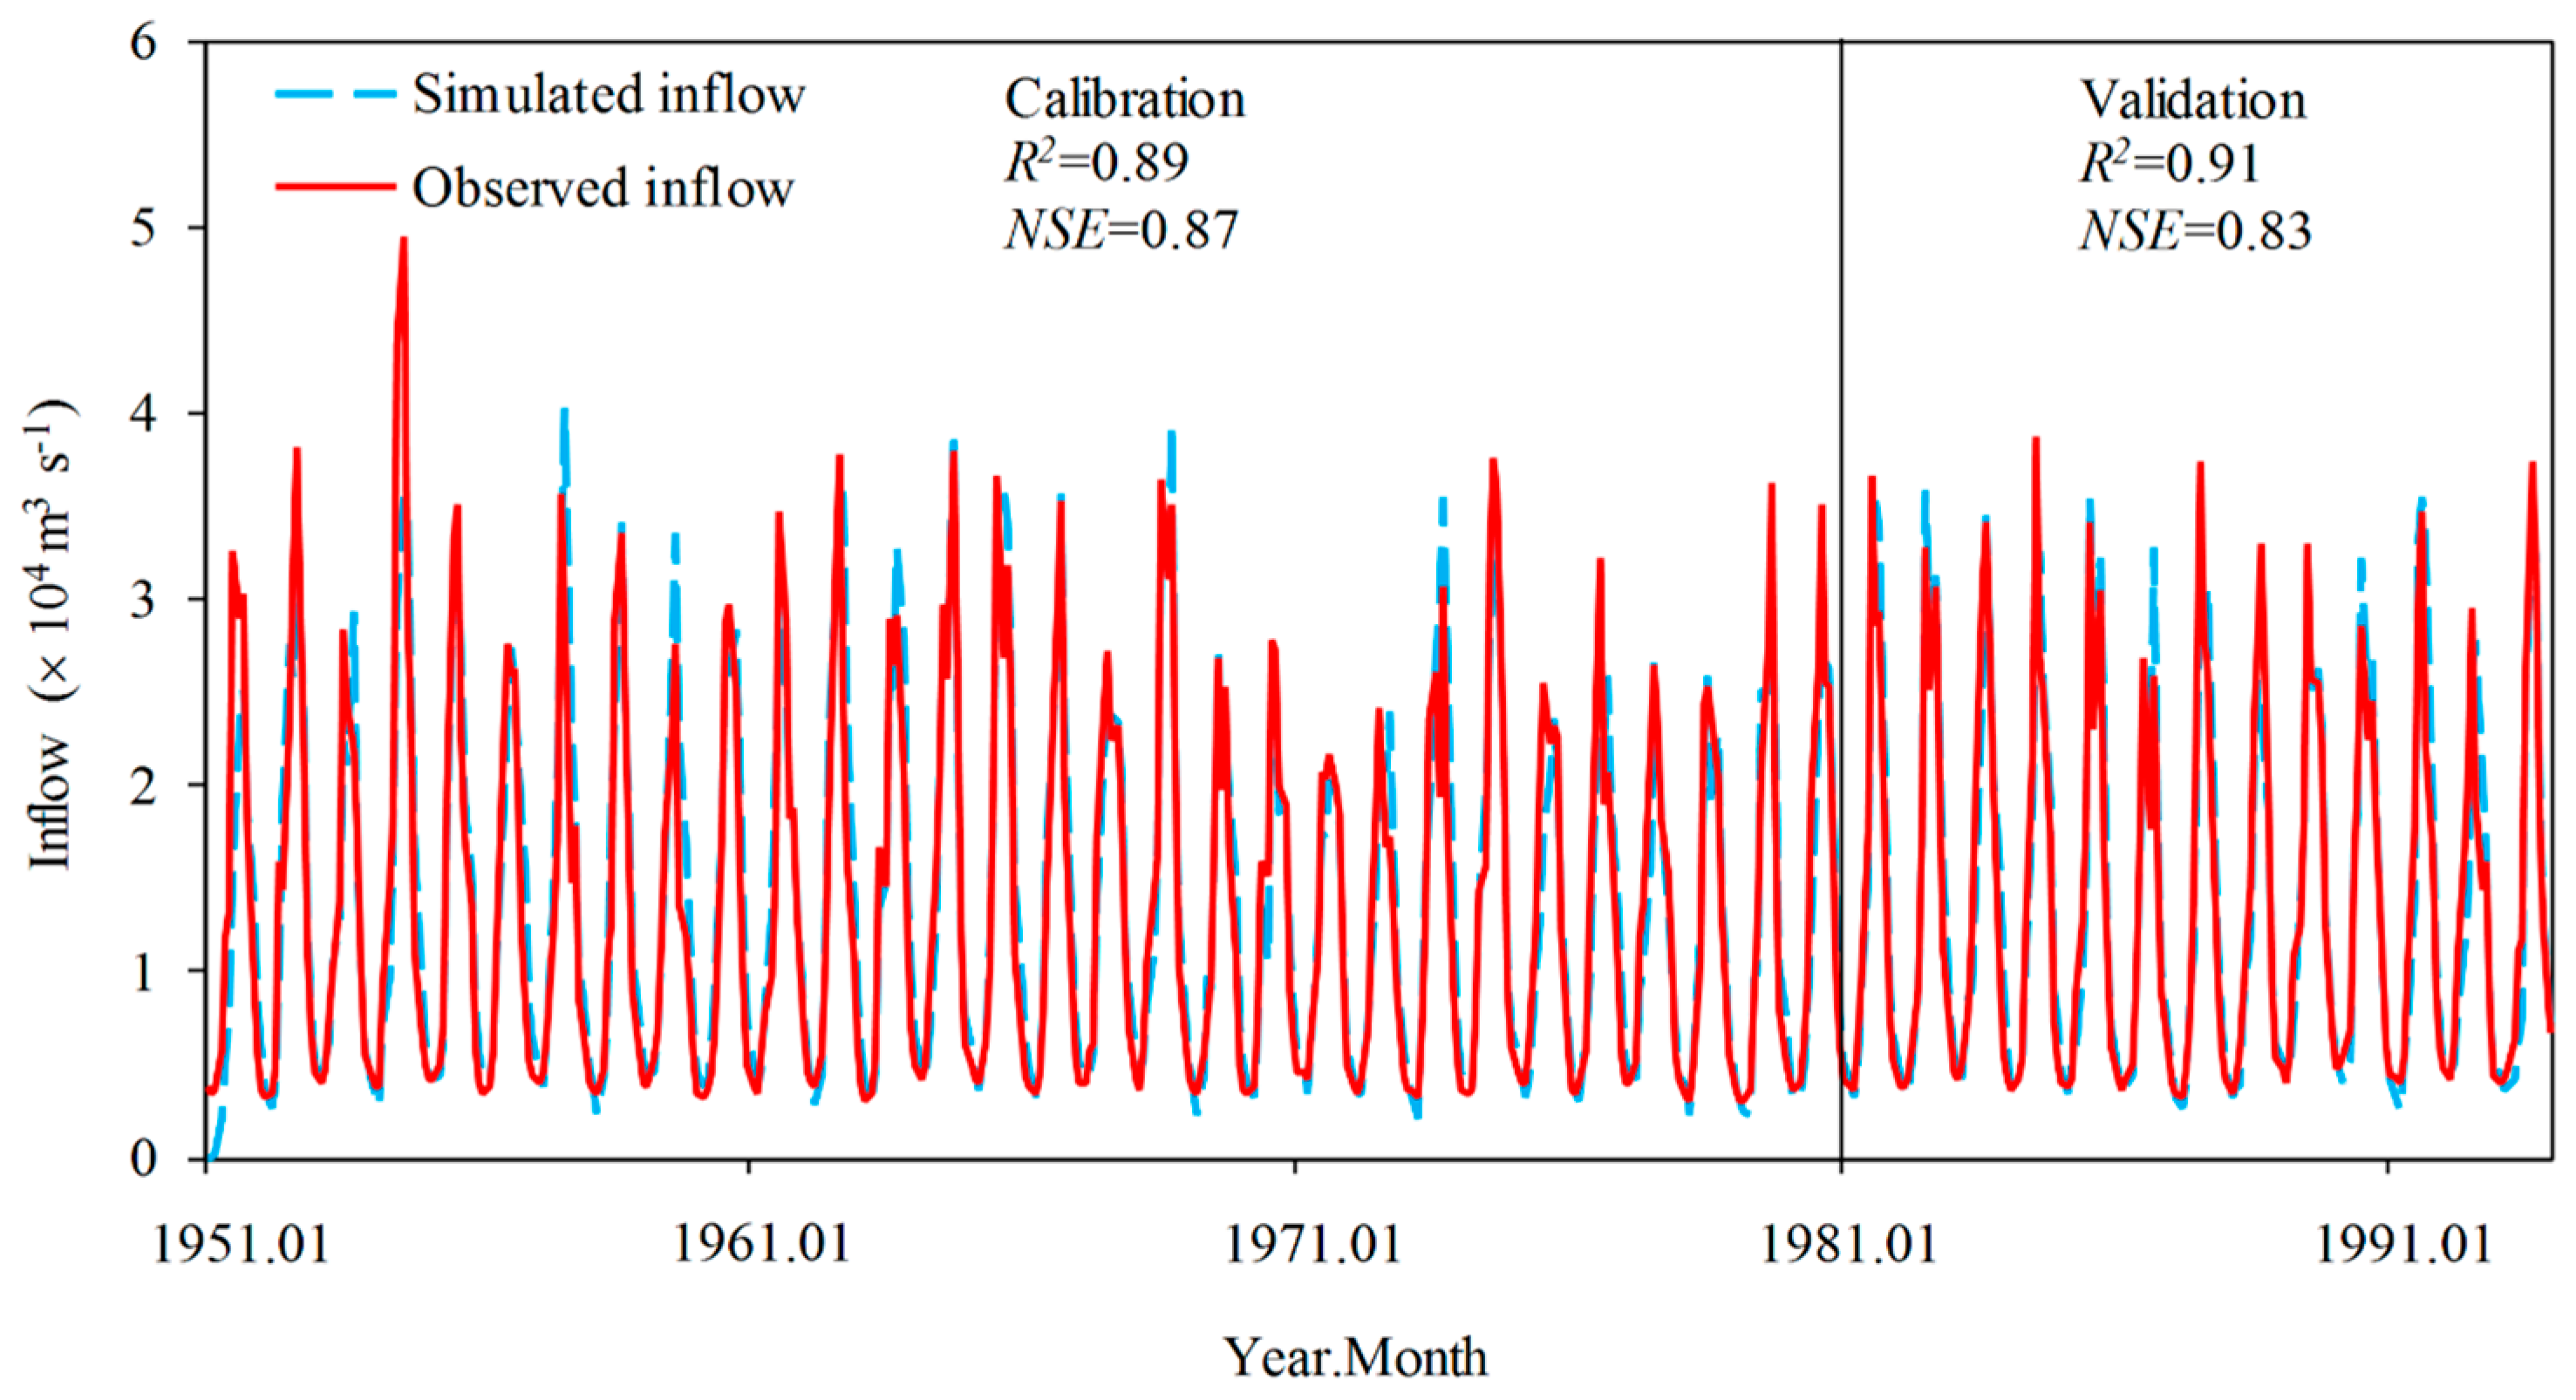
Figure 5.
Assessment of impacts using the two-stage method. Note: ΔRC indicates impact of climate change on the reservoir inflow (change caused by climate change); ΔRL indicates impact of LUCC on the reservoir inflow (change caused by LUCC); ΔRD indicates impact of direct human activities on the reservoir inflow (change caused by direct human activities); R(L0, C0) indicates simulated inflow with LULC data and meteorological data during the pre-change period; R(L0, C1) indicates simulated inflow with LULC data during the pre-change period and meteorological data during the post-change period; R(L1, C1) indicates simulated inflow with LULC data and meteorological data during the post-change period. The three horizontal lines show the mean value of R(L0, C1), R(L1, C1) and observed inflow.

Figure 6.
Historical LULC maps in the study area: 1990, 1995, 2000, and 2010.


Table 1.
Characteristics of the annual inflow, precipitation, and temperature before and after change point.
Table 1.
Characteristics of the annual inflow, precipitation, and temperature before and after change point.
| Item | Pre-Change Period | Post-Change Period | Changes in Mean | ||||
|---|---|---|---|---|---|---|---|
| Mean | SD | CV | Mean | SD | CV | ||
| Inflow (km3) | 438.2 | 42.7 | 0.10 | 404.5 | 43.6 | 0.11 | −33.7 |
| Precipitation (mm) | 999.9 | 72.1 | 0.07 | 957.9 | 63.1 | 0.07 | −42.0 |
| Temperature (°C) | 13.4 | 0.2 | 0.02 | 13.9 | 0.4 | 0.03 | 0.5 |
Note: CV indicates coefficient of variation; SD indicates standard deviation.
Table 2.
Parameters used in the SWAT models.
| Name | Description | Range | Calibrated Value |
|---|---|---|---|
| ALPHA_BF | Base flow alpha factor (days) | 0–1 | 0.28 |
| CANMX | Maximum canopy storage (mm) | 0–100 | 30.92 |
| CN2 | The SCS curve number | 0–100 | 24–85 |
| EPCO | Plant evaporation compensation factor | 0–1 | 0.03 |
| ESCO | Soil evaporation compensation factor | 0–1 | 0.90 |
| GW_DELAY | Groundwater delay (days) | 0–500 | 8.74–325 |
| GW_REVAP | Groundwater re-evaporation coefficient | 0.02–0.2 | 0.03 |
| GWQMN | Threshold depth of water in shallow aquifer required for return flow to occur (mm) | 0–5000 | 468.73 |
| SFTMP | Snowfall temperature (°C) | −20–20 | −5–4.6 |
| SMFMX | Melt factor for snow on June 21 (mm/day°C) | 0–20 | 1.40–6.24 |
| SOL_AWC | Available water capacity of the soil layer(mm mm−1 soil) | 0–1 | 0.03 |
| SURLAG | Surface runoff lag coefficient | 1–24 | 12.70 |
Table 3.
Results of two-stage method (unit: km3).
| Period | ΔRC | ΔRL | ΔRD | ΔRT |
|---|---|---|---|---|
| 1994–2016 | −30.5 | −4.8 | −8.3 | −43.6 |
| (70%) | (11%) | (19%) | (100%) |
Note: ΔRT indicates total changes in reservoir inflow; ΔRC indicates impact of climate change on the reservoir inflow (change caused by climate change); ΔRL indicates impact of LUCC on the reservoir inflow (change caused by LUCC); ΔRD indicates impact of direct human activities on the reservoir inflow (change caused by direct human activities).
Table 4.
Area of each LULC type based on historical LULC maps (unit: ×104 km2).
| LULC Maps | C | F | G | W | D | B | Total |
|---|---|---|---|---|---|---|---|
| 1990 | 22.3 | 33.9 | 36.1 | 1.5 | 5.7 | 0.5 | 100.0 |
| 1995 | 21.9 | 34.2 | 37.2 | 1.7 | 4.6 | 0.4 | 100.0 |
| 2000 | 22.1 | 33.9 | 36.2 | 1.5 | 5.8 | 0.5 | 100.0 |
| 2010 | 21.9 | 34.0 | 35.8 | 1.9 | 5.9 | 0.5 | 100.0 |
| Changes | −0.4 | 0.1 | −0.3 | 0.4 | 0.2 | 0.0 |
Note: C indicates crop land; F indicates forest land; G indicates grass land; W indicates water; D indicates developed land; B indicates barren land.
Table 5.
Transform of each LULC type based on historical LULC maps (unit: ×104 km2).
| LULC | 2010 | 1990 Total | ||||||
|---|---|---|---|---|---|---|---|---|
| C | F | G | W | D | B | |||
| 1990 | C | 14.6 | 4.7 | 2.3 | 0.3 | 0.4 | 0 | 22.3 |
| (65.5%) | (21.1%) | (10.3%) | (1.3%) | (1.8%) | (0%) | (100%) | ||
| F | 4.5 | 23.3 | 5.8 | 0.1 | 0.2 | 0 | 33.9 | |
| (13.3%) | (68.7%) | (17.0%) | (0.3%) | (0.6%) | (0%) | (100%) | ||
| G | 2.4 | 5.7 | 25.6 | 0.4 | 1.8 | 0.2 | 36.1 | |
| (6.6%) | (15.8%) | (70.9%) | (1.1%) | (5.0%) | (0.6%) | (100%) | ||
| W | 0.2 | 0.1 | 0.1 | 0.9 | 0.2 | 0 | 1.5 | |
| (13.3%) | (6.7%) | (6.7%) | (60.0%) | (13.3%) | (0%) | (100%) | ||
| D | 0.2 | 0.2 | 1.8 | 0.2 | 3.2 | 0.1 | 5.7 | |
| (3.5%) | (3.5%) | (31.6%) | (3.5%) | (56.1%) | (1.8%) | (100%) | ||
| B | 0 | 0 | 0.2 | 0.0 | 0.1 | 0.2 | 0.5 | |
| (0%) | (0%) | (40.0%) | (0%) | (20.0%) | (40.0%) | (100%) | ||
| 2010 Total | 21.9 | 34.0 | 35.8 | 1.9 | 5.9 | 0.5 | 100 | |
| (100%) | (100%) | (100%) | (100%) | (100%) | (100%) | |||
Note: C indicates crop land; F indicates forest land; G indicates grass land; W indicates water; D indicates developed land; B indicates barren land.
Table 6.
Results of multi-stage method (unit: km3).
| Period | ΔRC | ΔRL | ΔRD | ΔRT |
|---|---|---|---|---|
| 1994–1997 | −49.3 | −3.3 | −1.7 | −54.3 |
| (91%) | (6%) | (3%) | (100%) | |
| 1998–2005 | 35.6 | 2.9 | −3.4 | 35.1 |
| (85%) | (7%) | (8%) | (100%) | |
| 2006–2016 | −17.7 | −4.2 | −5.1 | −27 |
| (66%) | (15%) | (19%) | (100%) |
Note: ΔRT indicates total changes in reservoir inflow; ΔRC indicates impact of climate change on the reservoir inflow (change caused by climate change); ΔRL indicates impact of LUCC on the reservoir inflow (change caused by LUCC); ΔRD indicates impact of direct human activities on the reservoir inflow (change caused by direct human activities).
Table 7.
Summary for results of two-stage method and multi-stage method (unit: km3).
| Method | ΔRC | ΔRL | ΔRD | ΔRT |
|---|---|---|---|---|
| Two-stage method | −30.5 | −4.8 | −8.3 | −43.6 |
| (70%) | (11%) | (19%) | (100%) | |
| Multi-stage method (Accumulative) | −31.4 | −4.6 | −10.2 | −46.2 |
| (68%) | (10%) | (22%) | (100%) |
Note: ΔRT indicates total changes in reservoir inflow; ΔRC indicates impact of climate change on the reservoir inflow (change caused by climate change); ΔRL indicates impact of LUCC on the reservoir inflow (change caused by LUCC); ΔRD indicates impact of direct human activities on the reservoir inflow (change caused by direct human activities).
© 2017 by the authors. Licensee MDPI, Basel, Switzerland. This article is an open access article distributed under the terms and conditions of the Creative Commons Attribution (CC BY) license (http://creativecommons.org/licenses/by/4.0/).
Share and Cite
MDPI and ACS Style
Zhang, Y.; Zhong, P.-a.; Chen, J.; Bing, J.; Xu, D.; Wang, M. Impacts of Climate Change and Human Activities on the Three Gorges Reservoir Inflow. Water 2017, 9, 957. https://doi.org/10.3390/w9120957
AMA Style
Zhang Y, Zhong P-a, Chen J, Bing J, Xu D, Wang M. Impacts of Climate Change and Human Activities on the Three Gorges Reservoir Inflow. Water. 2017; 9(12):957. https://doi.org/10.3390/w9120957
Chicago/Turabian StyleZhang, Yu, Ping-an Zhong, Juan Chen, Jianping Bing, Dinghao Xu, and Manlin Wang. 2017. "Impacts of Climate Change and Human Activities on the Three Gorges Reservoir Inflow" Water 9, no. 12: 957. https://doi.org/10.3390/w9120957
Note that from the first issue of 2016, this journal uses article numbers instead of page numbers. See further details here.