Characteristics and Factors Influencing the Hysteresis of Water Area–Stage Curves for Poyang Lake
by
Aiping Huang
, 
Wenqi Peng
,
Xiaobo Liu
*,
Yanliang Du
,
Shijie Zhang
,
Shiyan Wang
,
Fei Du
and
Fei Dong
State Key Laboratory of Simulation and Regulation of River Basin Water Cycle, China Institute of Water Resources and Hydropower Research, Beijing 100038, China
*
Author to whom correspondence should be addressed.
Water 2017, 9(12), 938; https://doi.org/10.3390/w9120938
Submission received: 22 October 2017
/
Revised: 28 November 2017
/
Accepted: 29 November 2017
/
Published: 7 December 2017
Abstract
:Flood dynamics of large lake floodplain systems are typically complex. This paper analyses the characteristics and factors that influence the hysteresis of water area–stage curves for Poyang Lake, the largest freshwater lake in China characterized by complex geomorphology and upstream–downstream exchange conditions. For this purpose, a two-dimensional hydrodynamic model (EFDC) based on seven scenarios is established. The results indicate that the area–stage curve presents significant hysteretic characteristics due to different water surface gradients that emerge during the water-rising and water-falling periods. Counter-clockwise, clockwise, and splayed hysteresis directions observed at the northern, southern, and central hydrometric stations, respectively, are found in Poyang Lake for the first time. Upstream catchment inflows and Hukou stage reflecting the downstream condition are the main factors that influence hysteresis. The temporal fluctuation of catchment inflows and Hukou stage has a remarkably positive impact on hysteresis, namely, an increase in fluctuation brings about a larger hysteresis. The effects of magnitude change in the two factors on hysteresis are opposing. Catchment inflows are positively related, while the decline of the Hukou stage will produce a more pronounced hysteresis. The outcomes of this study will benefit the water management of Poyang Lake and other similar large lakes.
1. Introduction
Lake floodplains are vital for ecosystems and humanity, serving as important habitats for wetland biota and providing many services (e.g., flood protection and agriculture and fishing resources) [1,2,3]. As a key indicator used to evaluate a lake’s ecosystem status and evolution, the lake inundation area has attracted much attention [4,5]. Over the past several decades, inundation areas of many lakes around the world have undergone pronounced variations or have even vanished as a result of climate change and human activities [6,7,8]. For example, the number of lakes in the Mongolian Plateau with a water surface area of greater than 1 km2 dropped dramatically from 785 in the late 1980s to 577 in 2010 [9]. The water area–stage curve determined by lake hydrodynamic processes is central to the study of inundation areas and is widely used for water management, as areas can be estimated by stage, which is a more accessible method [10].
The area–stage curve does not always demonstrate the presence of single-valued relationships. In some lakes, hysteretic phenomena can be observed, i.e., a given stage value may correspond to different area values. Rudorff et al. simulated the flood dynamics of the lower Amazon floodplain, observing that inundation areas are smaller during the water-rising period than during the water-falling period for the same water level [11]. Ogilvie et al. adopted Moderate Resolution Imaging Spectroradiometer (MODIS) optical data to research the spatiotemporal dynamics of the Niger Inner Delta flood [3]. In their study, water area–stage relationships were refined by accounting for hysteresis behavior. Hysteretic phenomena are often found in hydrology relationships [12] (e.g., runoff connectivity streamflow, discharge, and runoff storage). Phillips et al. found hysteresis between runoff connectivity and streamflow in the Baker Creek Research Basin [13]. Wolfs et al. used three approaches to develop discharge–stage curves affected by hysteresis [14]. The corresponding results show that all of the methods used are superior to the traditional rating curve, and that the model tree method is the best because it is easy to understand and generates accurate outputs. Sproles et al. analyzed a number of hysteresis loops of runoff and water storage and found that loops are controlled by the terrain, weather, and geology of a drainage basin [15].
Influencing factors and inner mechanisms of hysteresis found between water areas and stages have not been systematically and thoroughly analyzed in previous studies. Fortunately, as another feature of highly non-linear hydrologic systems of lake floodplains, research on hysteresis found between discharge levels and stages has been precise and long-standing and may provide a reference. Factors affecting stage–discharge relationships proposed by Boyer [16] are as follows: (1) the unsteadiness of river flows, which alter the slope of the water surface; (2) backwater effects that change downstream environments; (3) vegetation that affects bed roughness levels; (4) bed evolution as a result of dredging or sediment transport, etc.
As an important wetland in the world, Poyang Lake includes extensive floodplains that support numerous vegetation species, aquatic organisms, and birds. Poyang Lake is a shallow and water-carrying seasonal lake, and catchment inflows and water levels observed at the Hukou station along the Yangtze River undergo significant fluctuations. Complex hydrological behaviors controlled by the combined effects of hydraulic interactions between upstream watershed runoff and the downstream Yangtze River and the complex topography of the lake basin bring about sizable seasonal and annual variations in lake water stages, areas, and storage capacities [5,17,18]. A number of researchers have studied area variations [19,20,21] and water area–stage relationships [22]. Feng et al. found that Poyang Lake encountered significant seasonal and annual variations from 2000 to 2010 as a result of changes in watershed precipitation [23]. Mei et al. estimated the daily Emergent Wetland Area and found a rapid increase in average annual conditions from 2003 as a result of seasonal drought occurring in October [24]. In addition, since the operation of the Three Gorges Dam (TGD), the wetland exposure period has occurred nearly one month sooner than before. Chen et al. analyzed the relationship between annual minimum water level and corresponding area based on data for 2000 to 2006 [22]. They found that the relationship could be expressed approximately by a linear equation. Li et al. established a single-valued regression equation for the flooded area and stage that was then employed to estimate lake areas for a long-term period of 1961 to 2010 [10].
In summary, previous inundation area studies have shown that Poyang Lake has undergone significant variations in past decades and single-valued empirical formulas of areas and stages have been developed. The hysteresis of the area–stage curve has not been sufficiently reported, though it is significant for Poyang Lake. The latest study conducted on the hysteresis of Poyang Lake was conducted by Zhang et al. They used daily average hydrologic conditions for 1959–2000 and found two hysteresis directions (namely, clockwise and counter-clockwise) and concluded that watershed inflows are the main factors that affect hysteresis behavior rather than Yangtze River flows or lake basin roughness levels [25]. However, the analyses of hysteresis mechanisms (especially the presence of different hysteresis directions) are qualitative and inadequate. Effects of magnitude changes of watershed inflows and Yangtze River flows on hysteresis are not considered. The two aspects above are the critical points to reveal the hysteresis phenomenon of Poyang Lake. On the other hand, the water regime of Poyang Lake has, in recent decades, shown remarkable variation, especially since the operation of TGD from 2003, and the corresponding catchment inflows will continue to change [26,27]. How these changes will affect the floodplain extent and hysteresis in the inundation dynamics is not known. Therefore, comprehensive research on the characteristics and influencing factors of hysteresis relationships between water stages and inundation areas is necessary to study the inundation area of Poyang Lake.
Water stage data are typically available for hydrometric stations at a daily resolution, but area data are difficult to acquire. Two methods widely used to obtain flooded area data are satellite remote sensing and numerical model simulations. Several forms of satellite remote sensing exist (e.g., Synthetic Aperture Radar (SAR) [28], Moderate Resolution Imaging Spectroradiometer (MODIS) [29], etc.). Numerical simulations are efficient and economical tools that generate enough simulated area data of high spatial and temporal frequency [30,31]. In this study, a two-dimensional Environmental Fluid Dynamics Code (EFDC) model is used while accounting for the need for area data of a high temporal resolution. The aim of this paper is to study hysteresis relationships of the inundation area–storage–stage for Poyang Lake. To accomplish this, seven simulation scenarios based on the EFDC model are established, accounting for different upstream catchment inflows and downstream water level conditions. The specific objectives of this study are to: (1) reveal the spatiotemporal traits of hysteresis behaviors; and (2) discern the main factors that influence hysteresis and explore influence rules. Our research results reveal inherent connections of the area storage stage, extend knowledge of large floodplain hydrology, and can facilitate the future water management of Poyang Lake and other similar lake floodplains.
2. Materials and Methods
2.1. Study Area
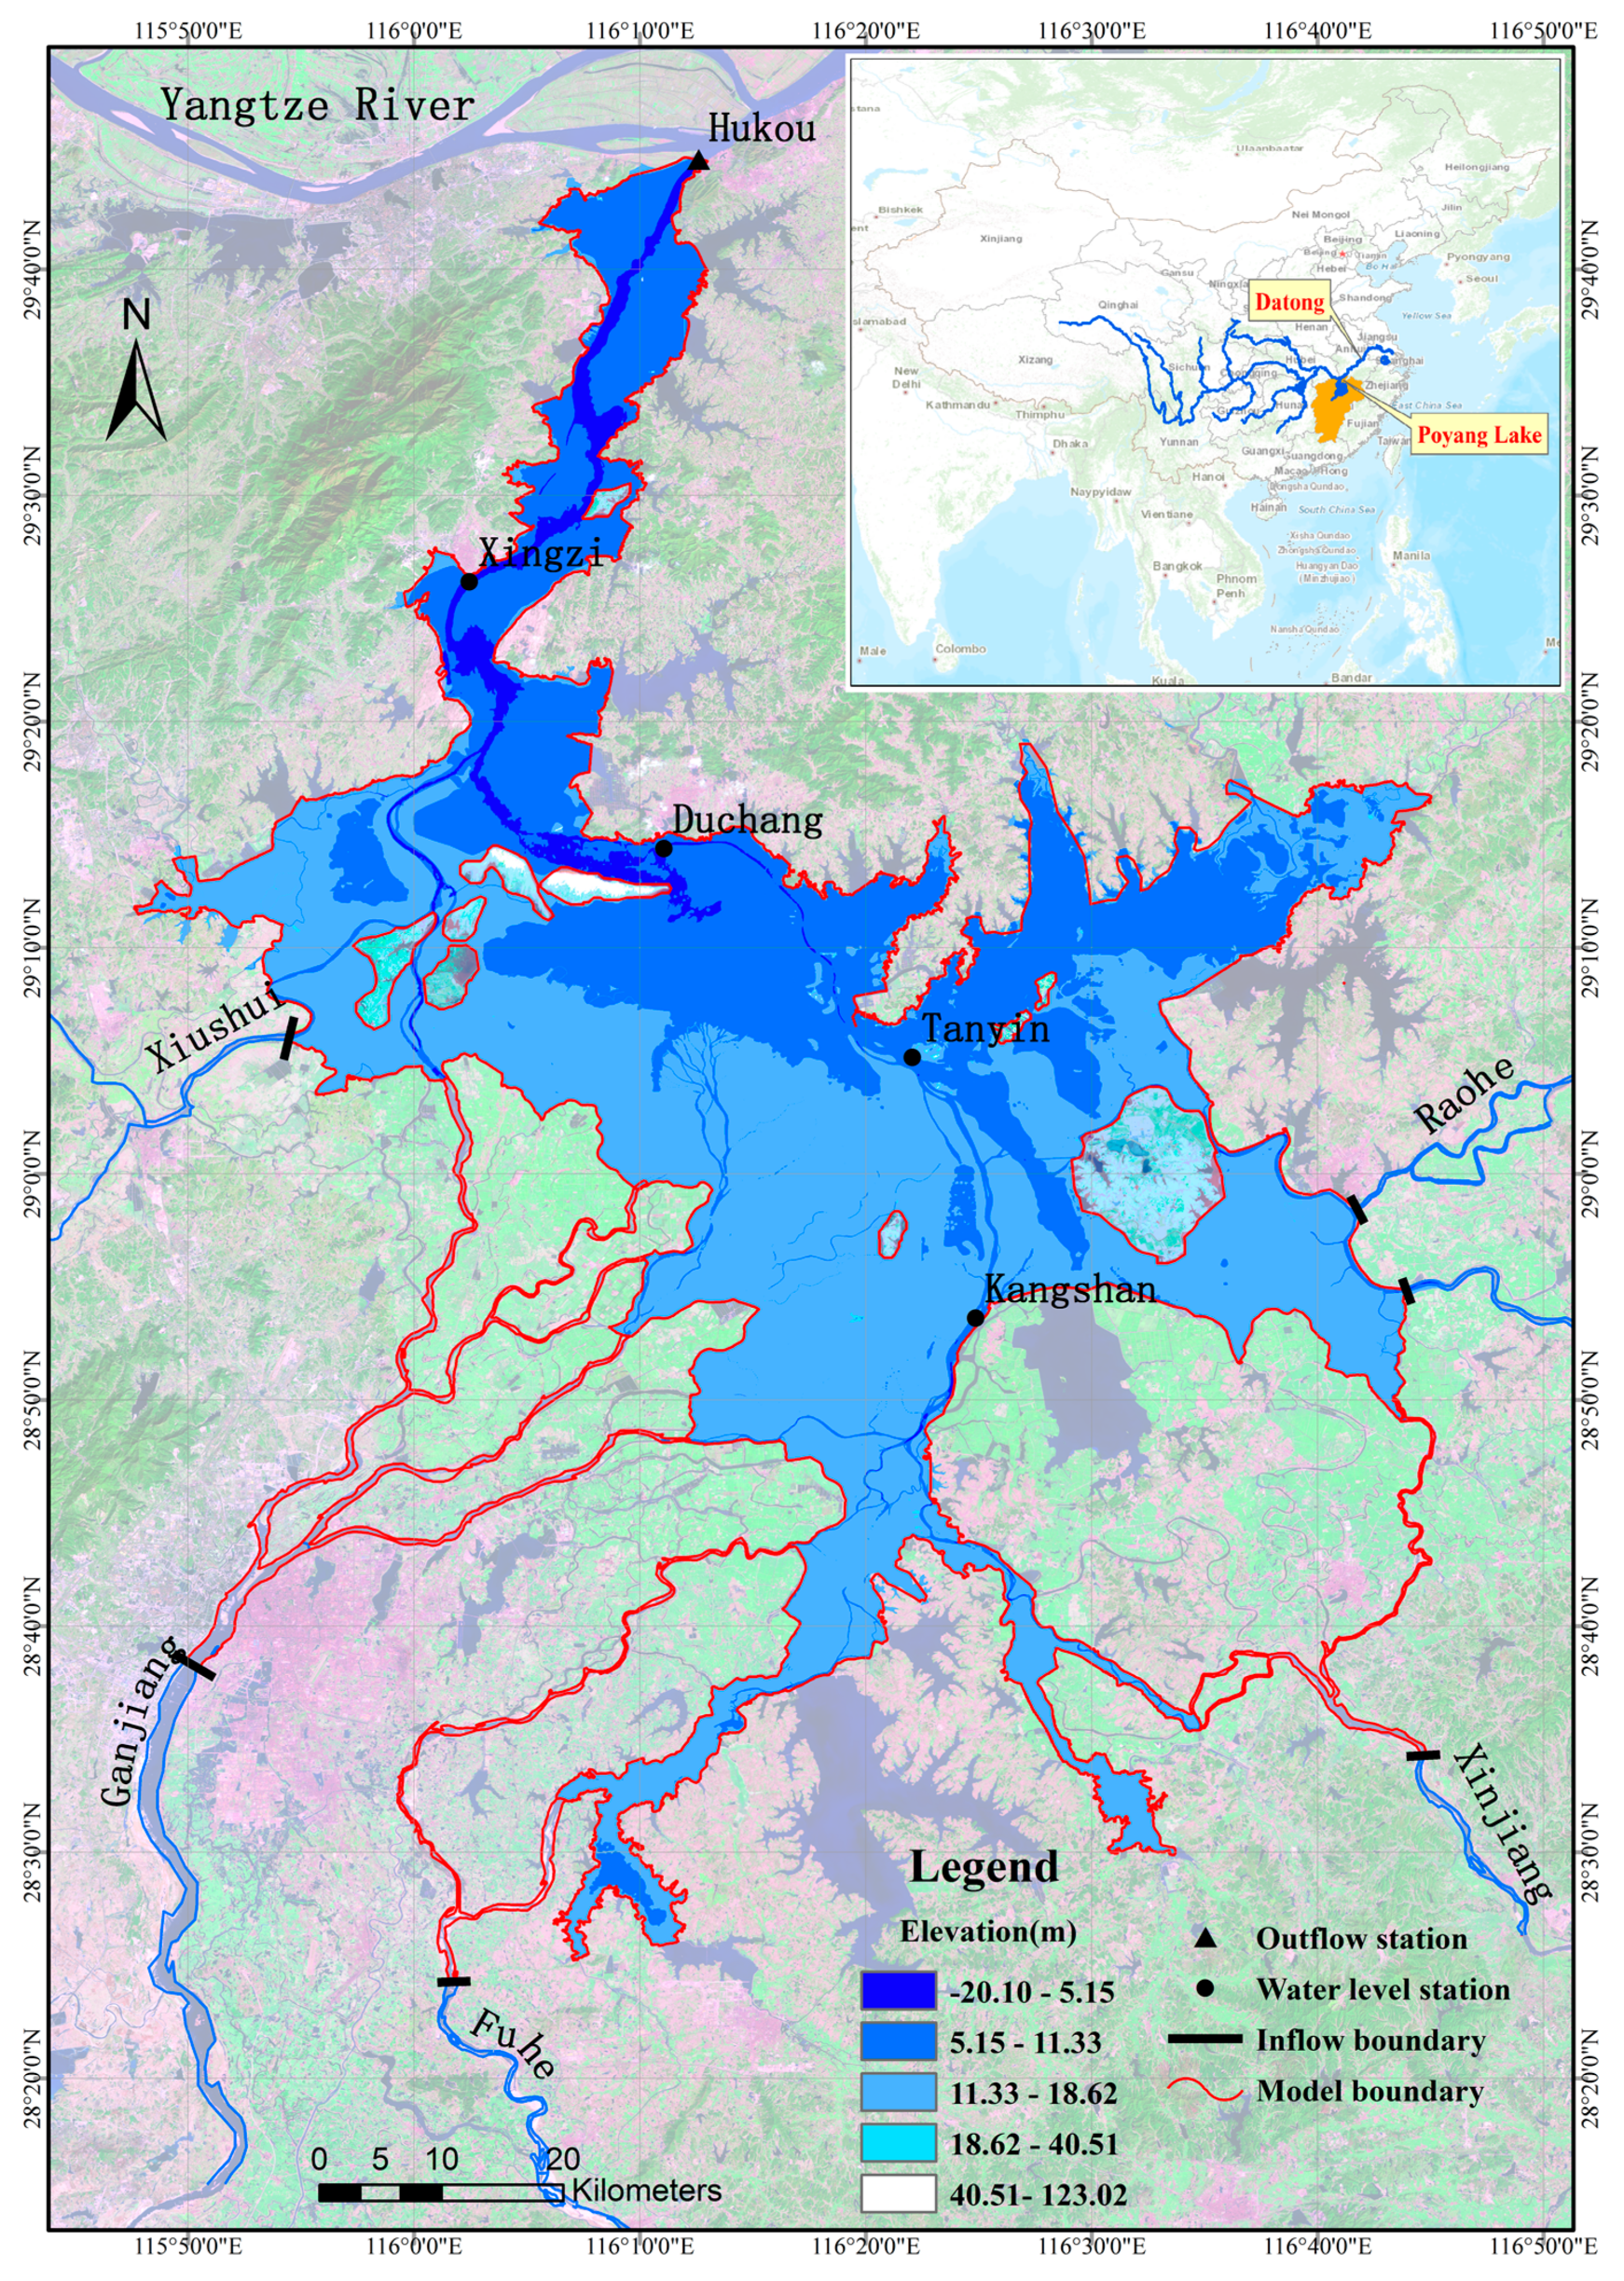
Poyang Lake is located in the central and lower reaches of the Yangtze River (28°24′–29°46′ N, 115°49′–116°46′ E, Figure 1). The drainage area of the Poyang Lake Basin is roughly 162,225 km2 in area, occupying 9% of the Yangtze River Basin. The lake is shaped like a calabash, and it is divided from a geographical perspective into northern and southern sections by the Songmen Mountains (Figure 1). The northern section includes a long and narrow water channel, with a narrowest width of 2.8 km, that connects the Yangtze River at the Hukou station, and the southern portion includes an extensive lake district, with a widest width of 74.0 km, linking to upstream rivers [30]. The geomorphology of the lake includes a water channel, bottomland area, island, inner lake, and bay. The watershed belongs to the monsoon zone of East Asia, which is characterized by a moderate climate and abundant rainfall. The average annual air temperature (1954–2015) of the region varies from 16 °C to 20 °C, with maximum values observed in July and lowest values observed in January. The annual mean precipitation level is 1634 mm, and it undergoes dramatic inter-annual changes of 1082 mm (1978) to 2452 mm (1954). The annual distribution of precipitation in the area is uneven, with 57% occurring between March and June. Annual potential evaporation levels range from 829 mm to 1321 mm, and nearly half of all evaporation occurs from July to September.
The five main tributaries flowing into the Poyang Lake include the Xiushui, Ganjiang, Fuhe, Xinjiang, and Raohe Rivers (Figure 1). Water sources of the lake mainly include stream inflows from the five tributaries and direct precipitation falling onto the lake surface. Outflows of the lake include water flowing into the Yangtze River at Hukou and direct evaporation from the lake surface. An extreme hydrologic regime of reverse flows from the Yangtze River to Poyang Lake can occur, as the Yangtze River heavily obstructs lake outflows, leading to the formation of a more prominent water stage in the Yangtze River than that of the lake surface from July to September when the Yangtze River undergoes its main flooding period [17,32]. The uneven distribution of catchment rainfall and impediment forces from the Yangtze River produces complex water stage fluctuations at Hukou. Relationships observed between Hukou water levels, Hukou discharge levels, and Datong (representing the Yangtze River) discharge levels from 2003 to 2015 are shown in Figure 2. The relationship between the Hukou stage and Datong discharge clearly shows a positive correlation with a value R2 of 0.995, yet the relationship between the Hukou stage and Hukou discharge is disordered and dispersive. It can be concluded that Hukou stage is largely determined by the Yangtze River. Therefore, effects of the Yangtze River on the hysteresis of Poyang Lake are represented based on the Hukou stage in this study.
Water levels and the lake area undergo remarkable seasonal variations [33]. During the wet season, the floodplains are submerged and form a lake with a sensibly horizontal water surface. During the dry season, the inundation area shrinks drastically and the lake turns into a river with a remarkable water surface gradient. The size of the inundation area varies considerably from less than 1000 km2 to over 3000 km2 [23]. According to such features, the water stage of Poyang Lake is typically divided into the following four phases: a water-rising period (from roughly March to June), a high-water period (July to August), a water-falling period (September to October), and a low-water period (November to February) [34].
2.2. Model Description
The EFDC is an open source surface water modelling system that can simulate hydrodynamics and water age, sediment, and water quality levels in one, two, and three dimensions [35]. The coordinate is curvilinear and orthogonal in the horizontal direction, and it is stretched to follow the topography of the water and free water surfaces in the vertical plane. Governing equations of hydrodynamics include three-dimensional equations of turbulent currents with a second moment turbulence closure scheme. The numerical solution of the EFDC adopts an external–internal model based on a staggered grid system. A detailed introduction of theoretical and computational features of the model can be found in materials written by the author of [36]. Over the past two decades, the EFDC has been successfully employed in several studies on rivers, lakes, and coast-supported water management schemes, which are highly recommended by the US Environmental Protection Agency.
As Poyang Lake is a shallow lake and has limited vertical stratification, a two-dimensional EFDC model was established to reduce computational costs [30,37]. The irregular lake boundary was delimited according to a remote image of an extraordinary flood occurring in 1998, which determined the maximum inundation area. The lake’s topography was determined based on field data for 2010 of a scale of 1:25,000. The study zone was divided into 93,410 rectangular grid elements with a uniform size of 180 m. Upstream boundary conditions used included six flow inlets based on the daily discharge series of hydrometric stations positioned at the five major tributaries (Figure 1). The downstream condition is the open boundary of the daily water stage (using the Yellow Sea height datum) for the Hukou station. Atmospheric and wind data, which were drawn from the Poyang meteorological station, were inputted into the model, including precipitation and evaporation (which affected the water balance) and wind speed and direction (which generated wind stress on the water surface). The horizontal eddy viscosity is calculated using the Smagorinsky subgrid scale scheme and the Coriolis effect is considered. To ensure calculation stability, the time step was set to 8 s to satisfy the restricted Courant–Friedrichs–Lewy condition. The initial water level was set as the average value for several stations in the lake region, and a spin-up time of 2 months was set to eliminate the influence of initial values.
2.3. Model Calibration and Validation
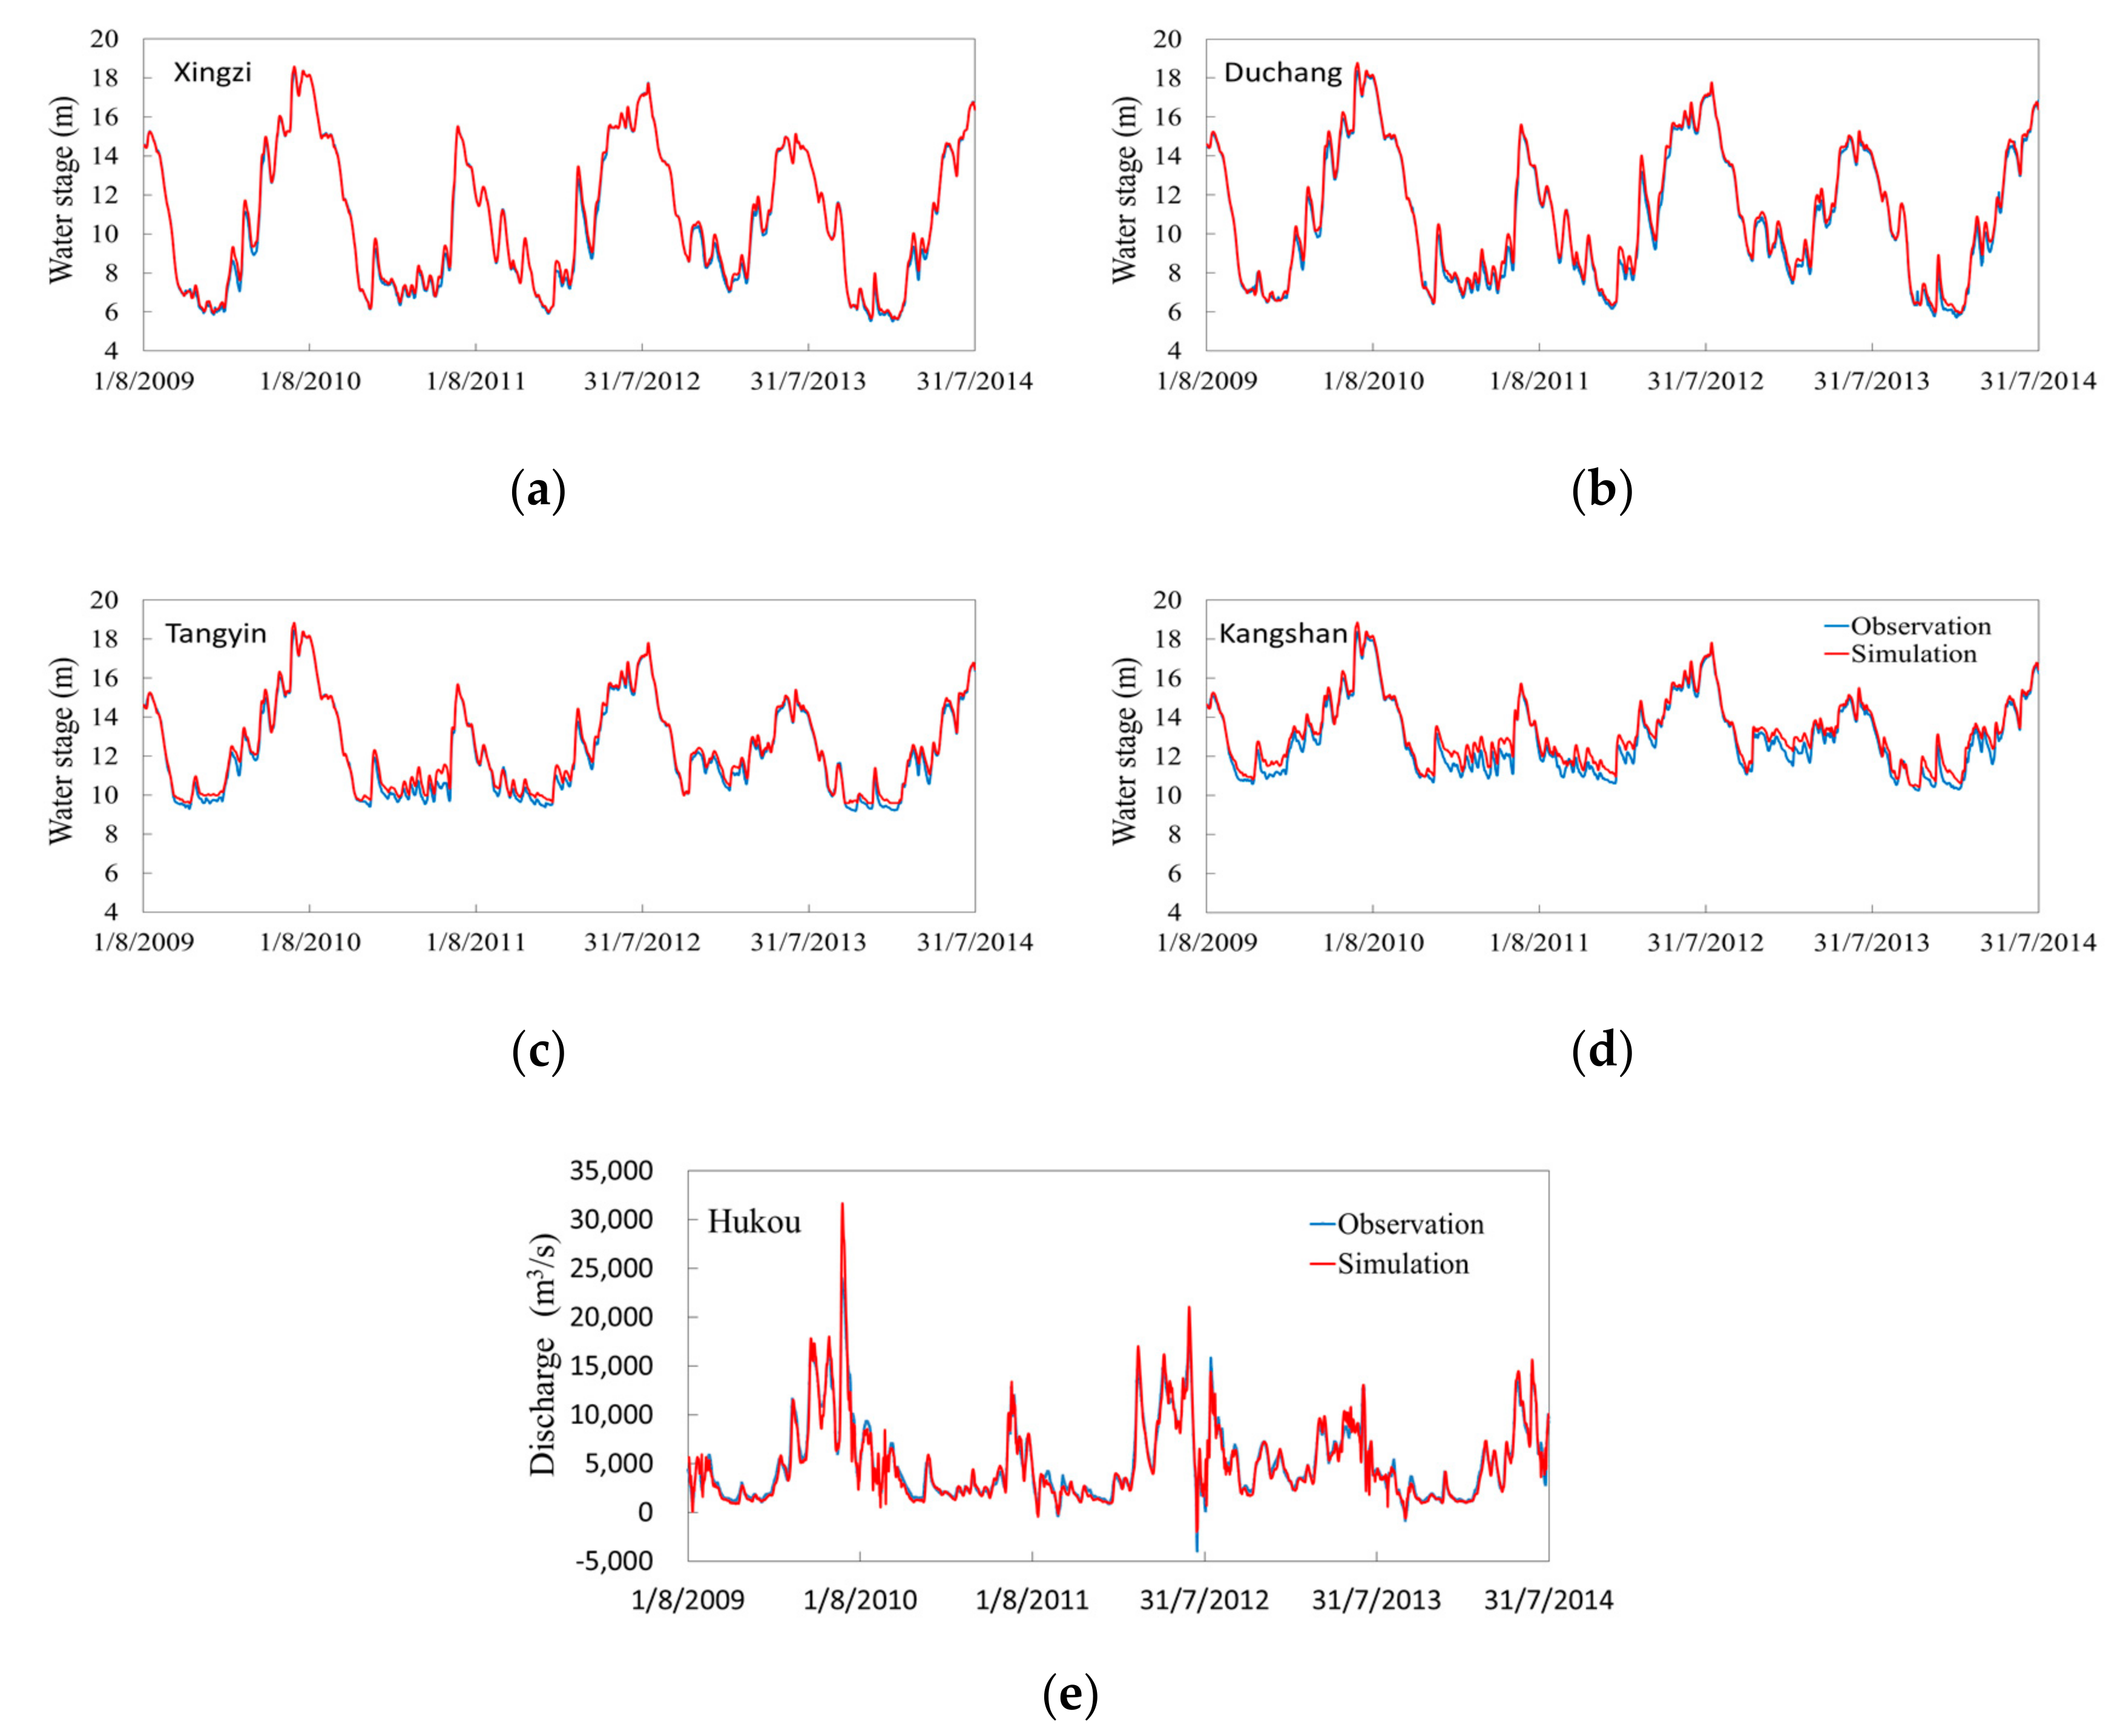
The model calibration period covers 1 August 2009 to 31 July 2010 for a whole year. Dry depths (determining shifts between wet and dry mesh, and affecting the water area) and bottom roughness levels (changing the hydrodynamic process) were optimized with initial values of 0.050 m and 0.020 m, respectively. After many tests, the dry depth was adjusted to 0.150 m, the bottom roughness of the water channel was set to 0.010 m, and the floodplain was set to 0.020 m. A period of four years from 1 August 2010 to 31 July 2014 was used as the model verification period based on a comparison between simulated values and observed data for water stages, discharge levels, and inundation areas.
Water stages were verified based on daily data for four stations (Xingzi, Duchang, Tangyin, and Kangshan) located from the north to the south of Poyang Lake, reflecting water level features of the region (Figure 1). As the only outlet, Hukou was selected as a discharge verification station to analyze interactions between Poyang Lake and the Yangtze River. Figure 3 and Table 1 show that the simulated water level is consistent with the observed values, showing that the model employed in this study can accurately capture dramatic variations of water stages for Poyang Lake. The mean absolute error value of the water stage across the four stations ranges from 0.138 m to 0.365 m, the mean relative error varies from 1.310 to 2.851%, the root-mean-square error varies from 0.205 m to 0.434 m and the Nash–Sutcliffe model efficiency coefficient ranges from 0.931 to 0.996. Simulation accuracies observed during the wet season are more pronounced than those of the dry season when flows travel into the water channel, where the bed topography is complex and heavily influences water levels. Compared with other locations, a larger simulation error is found for Kangshan, which might due to the fact that the actual terrain here is more complex with a larger elevation change (Figure 1). After interpolation based on the actual terrain, the terrain of the model gets higher, which lead to the raise in the water level in Kangshan during the low-water period. The simulation of discharge levels at Hukou is reasonably consistent with measurements for the mean absolute error of 518.079 m3/s and for a Nash–Sutcliffe model efficiency coefficient of 0.933. According to statistical results derived from the gauged data, reverse flows occurred 11 times during the validation period. Dates of occurrence and discharge levels of reverse flows are accurately captured by the EFDC model (Figure 3). Calculations of outflows and especially of reverse flows show that the model can reproduce impeding effects of the Yangtze River on Poyang Lake.
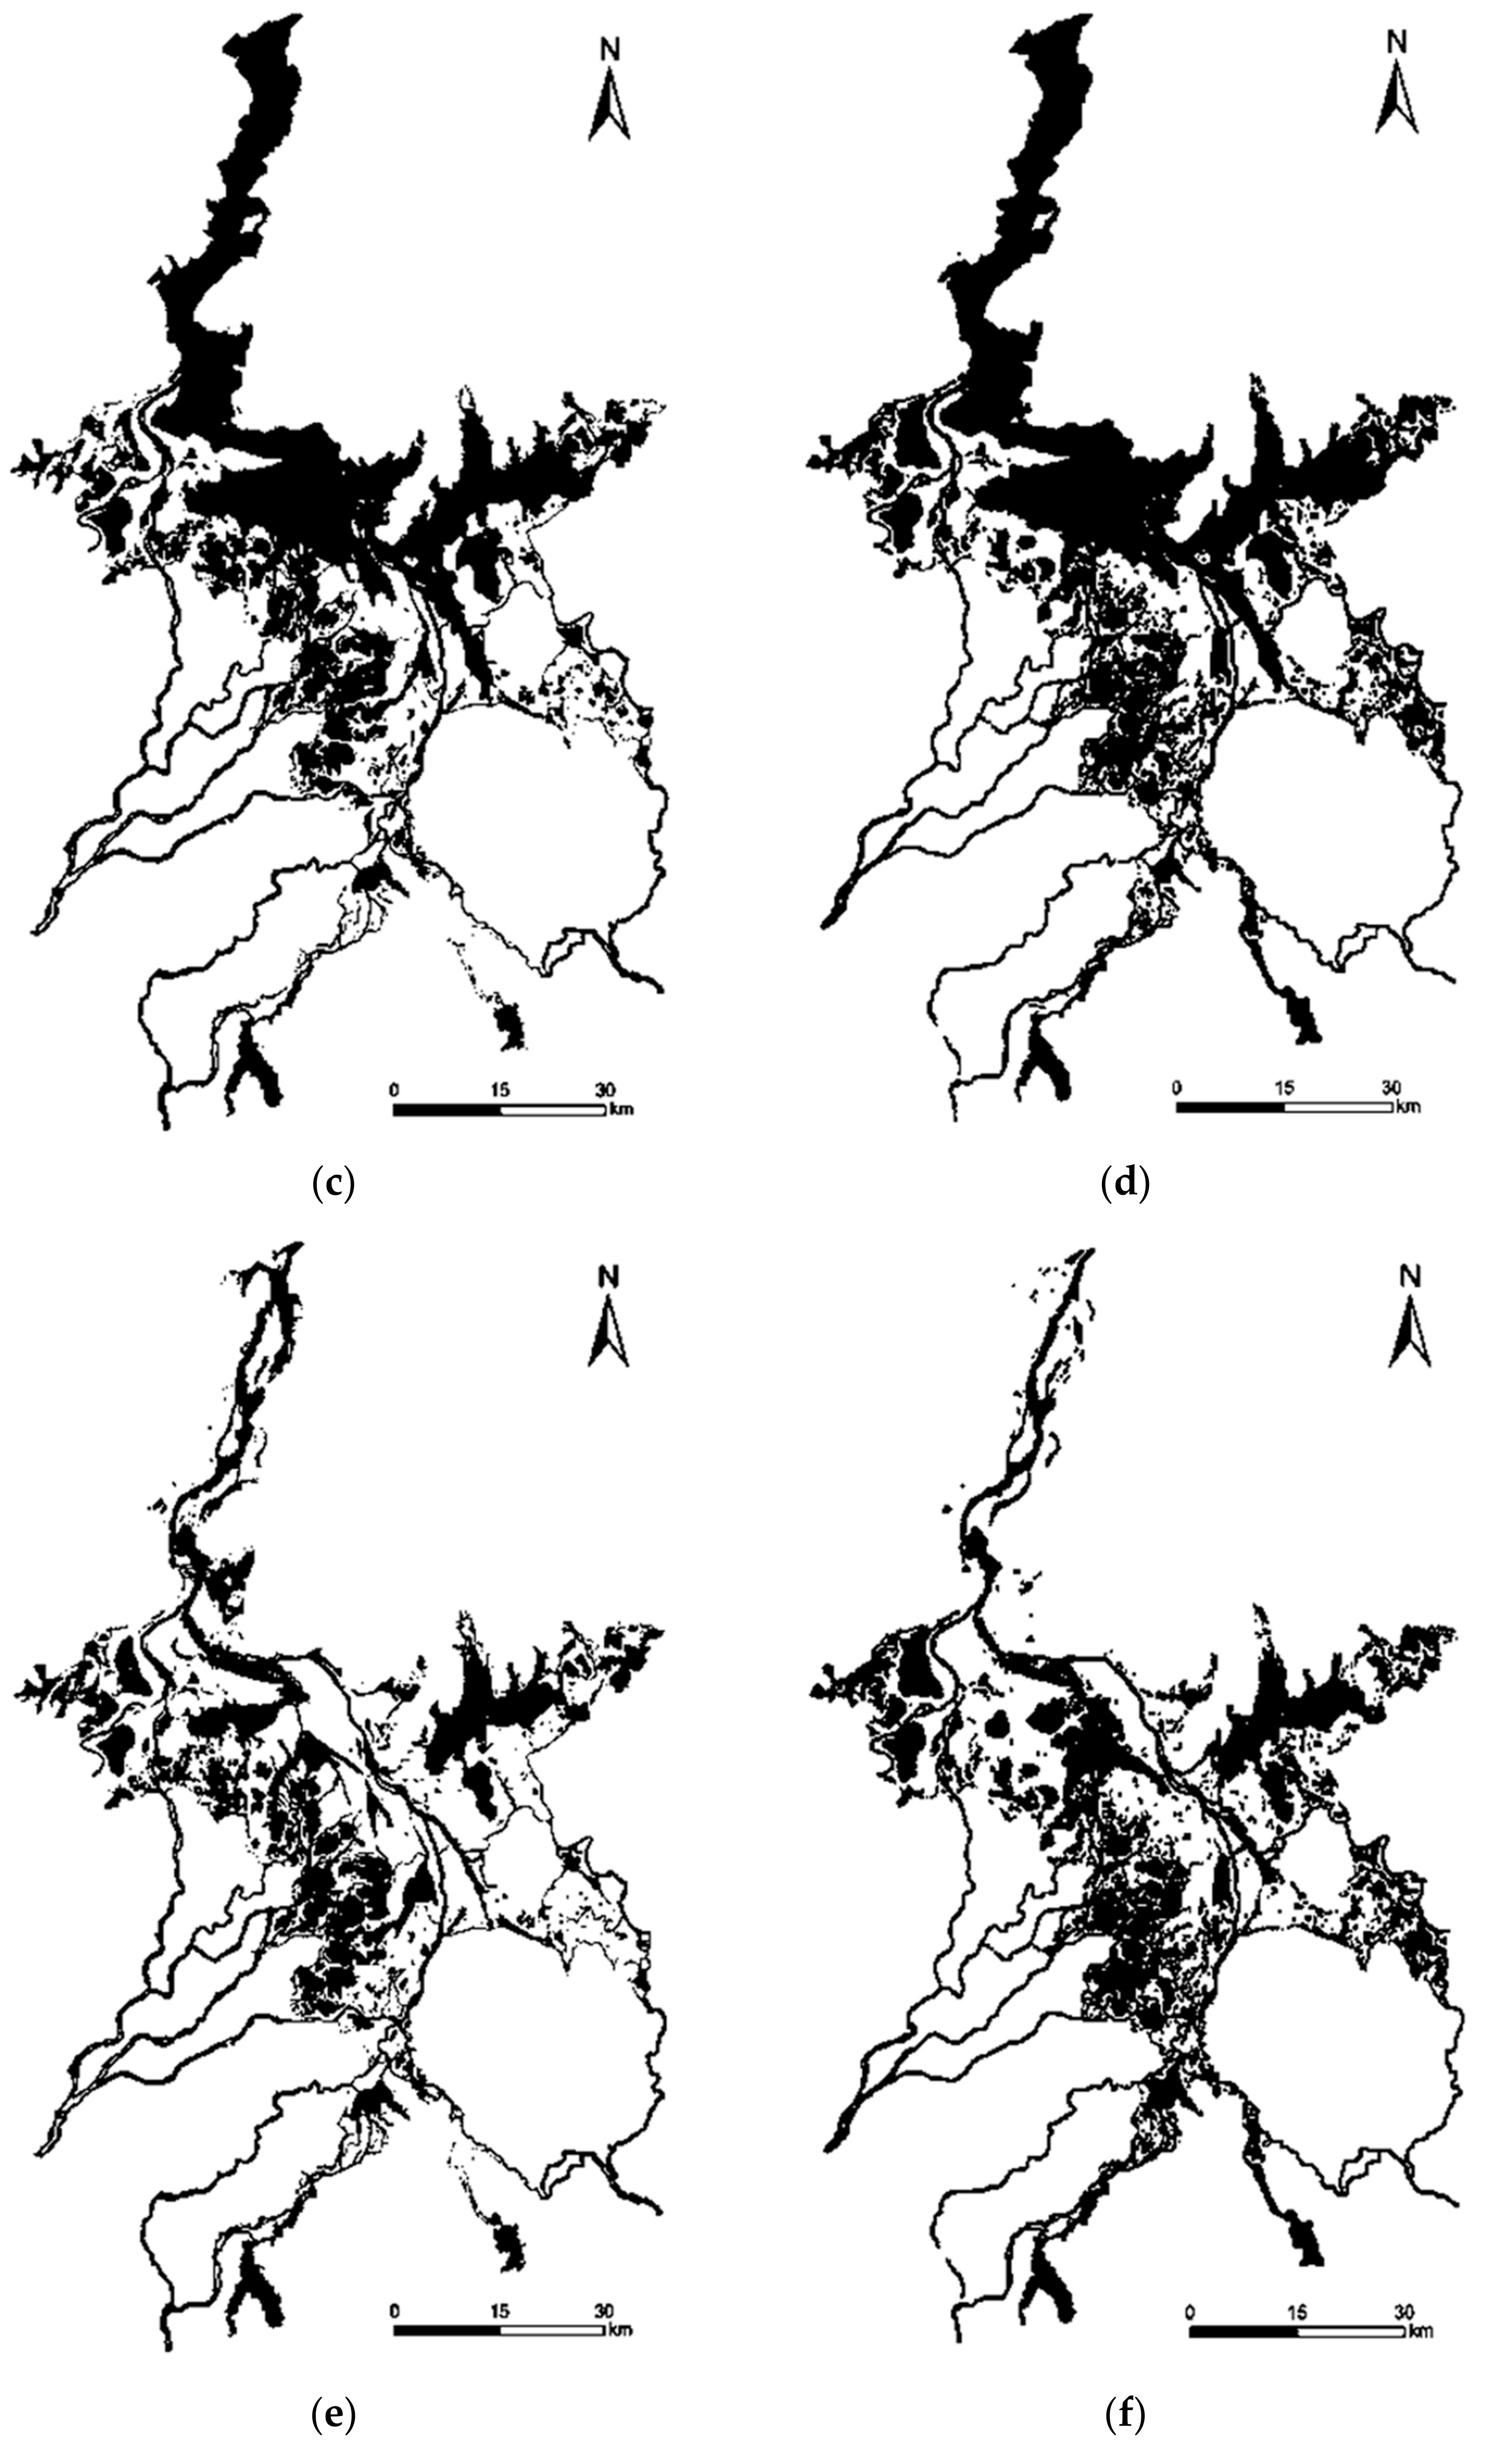
Figure 4 and Table 2 compare lake inundation areas simulated by the model and extracted from remote sensing images. Three days were used for area validation (20 July 2014 (the water stage of Xingzi was set to 16.473 m), 5 October 2013 (the water stage of Xingzi was set to 11.562 m), and 22 November 2013 (the water stage of Xingzi was set to 7.094 m)) to represent high, moderate, and low water level conditions, respectively. The results show a high degree of consistency between the simulation data and remote sensing images with relative errors of 1.593%, 5.372%, and 11.153%, respectively. On 22 November 2013, water levels were very low and some central lakes not hydraulically connected to the water channel formed in the southern area of the lake. Following water channel disconnection, the water levels of the central lakes were artificially controlled by floodgates, producing a relative simulation error of 11.153% for the low water level condition.
The above validation results show that the model employed in this study reliably simulated the hydrodynamics of Poyang Lake and can be used in further research on hysteresis processes.
2.4. Recognition of Influencing Factors
As noted previously [16], factors affecting the floodplain dynamics of hysteresis relationships can include flow variations, backwater effects, vegetation affecting bed roughness, and patterns of topographical evolution. For Poyang Lake, flow variations originate from dramatic temporal variations in basin inflows. Backwater effects derive from the Yangtze River’s inhibiting effects on Poyang Lake, and are represented by the Hukou water levels. Catchment inflows and Hukou water stages have undergone remarkable annual variations over past decades. After the operation of TGD from 2003, the uneven coefficient (the ratio of standard deviation to mean value) of daily mean data during the period of 2003 to 2015 is 0.629 and 0.293 for basin inflows and Hukou water levels, respectively. Ratios of maximum vs minimum values of catchment inflows and Hukou water stages reached up to 10.755 and 2.441. On the other hand, relative to values for 1956–2002, catchment flows changed inordinately in different months and notably from March to June. Water stages observed in Hukou declined significantly with an annual mean drop of 1.00 m and a maximum daily drop of 3.01 m (Figure 5).
The greater the bed roughness of Poyang Lake, the greater the magnitude of hysteresis [25]. However, the effects of bed roughness are expected to be minor compared with those of basin inflows and the inhibiting effects of the Yangtze River. The bottom topographical evolution of Poyang Lake is attributed to human activities (e.g., sand mining and dike project) and weather events (e.g., erosion and deposition resulting from extreme flooding) [38]. A comparison of landforms observed in 1998 and 2010 shows that changes in the southern main lake zone were not significant while the northern water channel was scoured, particularly at the main channel. Nevertheless, for Poyang Lake with a large floodplain area of >3000 km2, such effects of topographical changes on hysteresis behaviors are limited.
Therefore, catchment inflows and Hukou water stages are the main factors that influence hysteresis relationships for Poyang Lake. By contrast, effects of bed roughness and topographical evolution patterns are minor and are not considered in this study.
2.5. Setting of Computational Scenarios
To quantify the impacts of catchment inflows and Hukou water stages on the hysteresis of Poyang Lake, seven computational scenarios with a run time of a whole year (1 January to 31 December) were established (Table 3). As a basis for comparison, Scenario 1 (S1) represents the average hydrologic conditions of Poyang Lake. Catchment inflows and Hukou levels are based on average daily data for 2003–2015 (Figure 5, Table 3). The same treatment method is used for atmospheric and wind data. As noted above, the water regime of Poyang Lake has undergone significant variations from 2003 when the TGD was built. Thus, the 2003–2015 period reflects the most current average hydrological conditions. Scenarios 2–4 and Scenarios 5–7 are used to analyze the impacts of catchment inflows and Hukou water stages on hysteresis, respectively. Changes of amplitude of fluctuation and magnitude of catchment inflows or Hukou water stages are both considered. For Scenario 2 (S2), catchment inflows are assigned a fixed value, which is the mean value of catchment inflows for S1. The Hukou water stage is the same as S1. Compared with S1, it can be seen that the amplitude of fluctuation is obviously reduced for S2. Therefore, S2 is used to investigate hysteresis responses to the change of the amplitude of fluctuation of catchment inflows. In Scenarios 3 (S3) and 4 (S4), catchment inflows increase and decrease by 20% of the values adopted in S1, respectively. The Hukou stage maintains the same conditions as in S1. For S3, the annual mean value of catchment inflows is 1.2 times as much as that of S1, as are the maximum value and minimum value. On the other hand, the value of the maximum divided by the minimum is the same as that of S1, which means that the amplitude of fluctuation of catchment inflows does not change. Therefore, the results of S3 and S4 are used to analyze the effects of magnitude variations in watershed inflows on hysteresis. For Scenario 5 (S5), the Hukou water stage is specified as a stationary value equal to the mean water stage of S1. The homogenization of the Hukou stage reveals the effects of annual variations of the Hukou stage on hysteresis. Under Scenarios 6 (S6) and 7 (S7), the Hukou water stage increases and declines by 20% of corresponding values used in S1, respectively. S6 and S7 are used to explore effects of magnitude changes in Yangtze River flows.
To facilitate comparisons, hysteresis typically has a dimensionless quantity [39]. Therefore, the three terms of hysteresis relationships of the water area–storage–stage for the lake floodplain are made non-dimensional using Equations (1)–(3). The area of the non-dimensional hysteresis loop is taken to represent the magnitude of hysteresis. Indeed, a larger loop area denotes the occurrence of more serious hysteresis behavior.
where h is the dimensionless water stage; H is the water stage (m); Hmax is the maximum value for the data series of H; Hmin is the minimum value; a is the dimensionless inundation area; A is the inundation area (km2); Amax and Amin denote maximum and minimum values, respectively; v denotes dimensionless storage; V denotes storage (m3); and Vmax and Vmin denote maximum and minimum values, respectively.
3. Results
3.1. Characteristics of Hysteretic Relationships
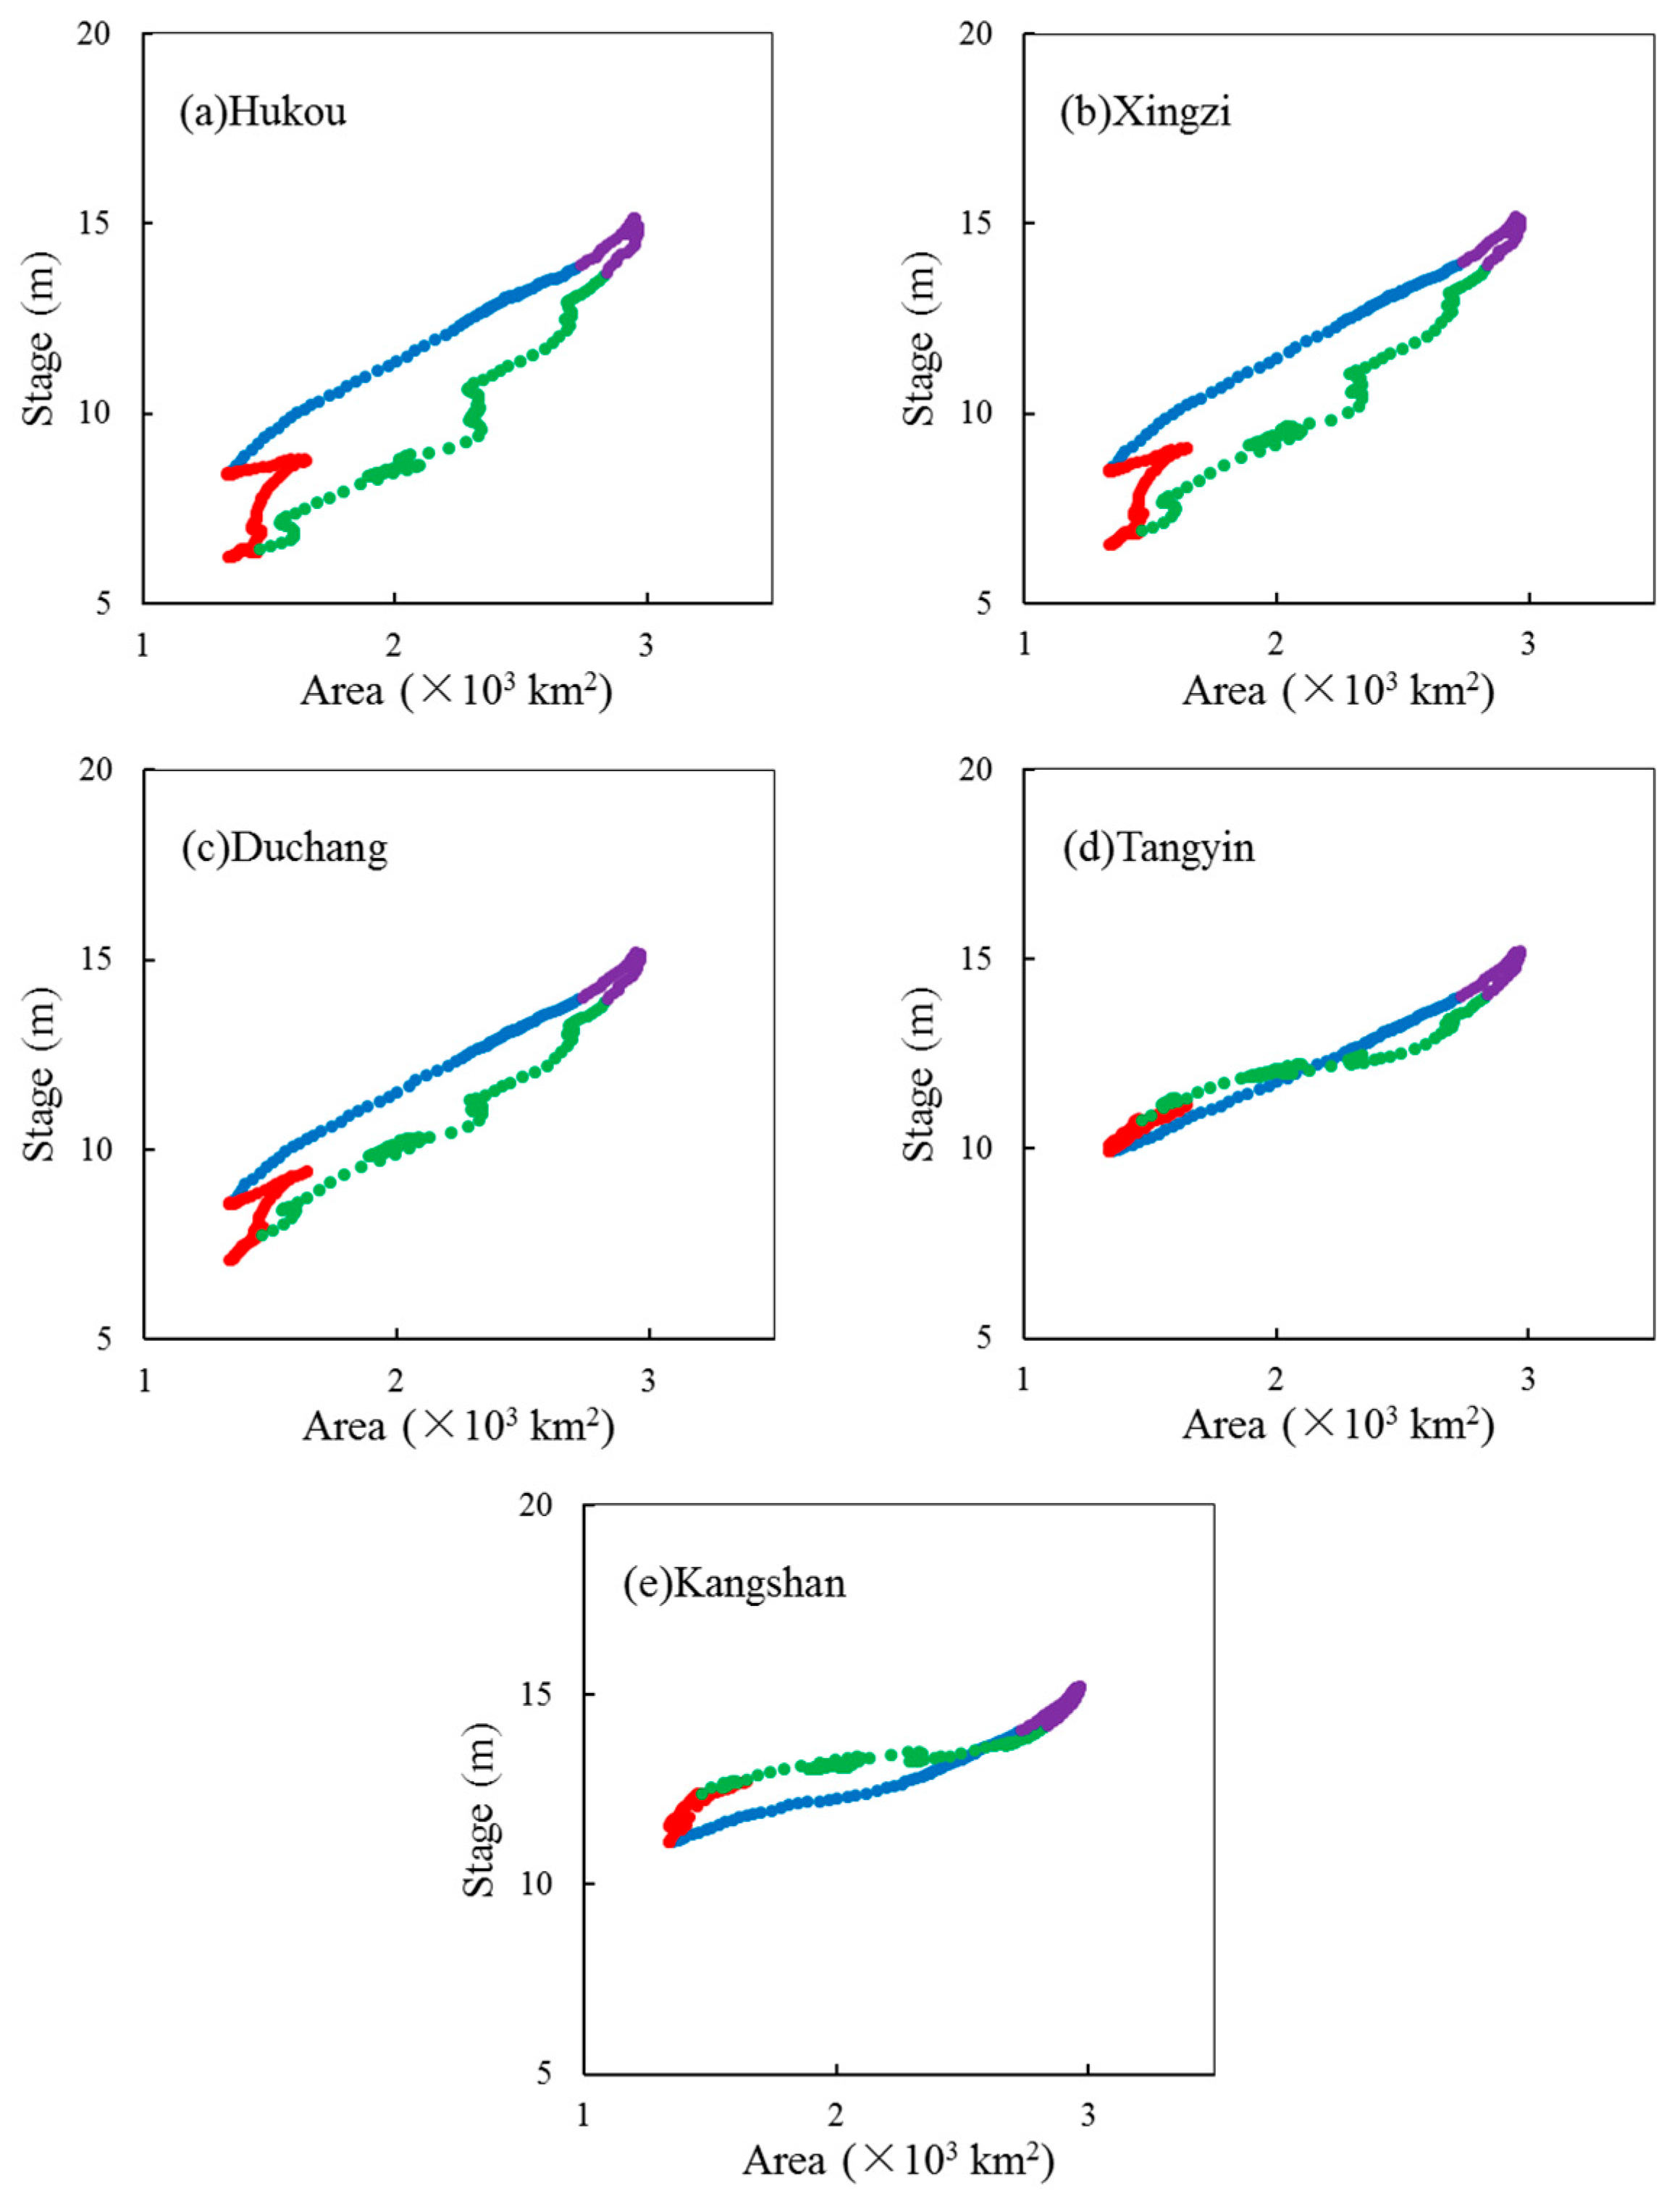
Hysteresis relationships between areas and stages for four periods (water-rising period, high-water period, water-falling period, and low-water period) at five hydrometric stations (Hukou, Xingzi, Duchang, Tangyin, and Kangshan) in S1 were simulated. As shown in Figure 6, hysteresis is significant in Poyang Lake due to a large discrepancy found between corresponding areas for the same water stage for the water-rising and water-falling periods. Further, three hysteresis directions are observed as follows: counter-clockwise hysteresis at three stations (Hukou, Xingzi, and Duchang), whereby the area during the water-rising period is larger than it is during the water-falling period for a given stage; clockwise hysteresis at Kangshan station located in the southern area of the lake [25]; and splayed hysteresis of the clockwise and counter-clockwise directions observed at Tangyin station, located in the center of the lake. Table 4 shows the magnitude of hysteresis (namely, the area of the non-dimensional hysteresis loop) and that the smallest and largest hysteresis values are observed at Tangyin and Hukou, respectively. Spatially heterogeneous distributions of directions and magnitudes of hysteresis illustrate the complexities of the lake floodplain hydrodynamics of Poyang Lake. If the lake area is determined from a single-valued statistical equation for areas and water levels at Xingzi as in previous studies [40], a calculation error may manifest with maximum value of up to 25%, showing that hysteresis behaviors have a remarkable effect on the assessment of relationships between areas and stages for Poyang Lake.
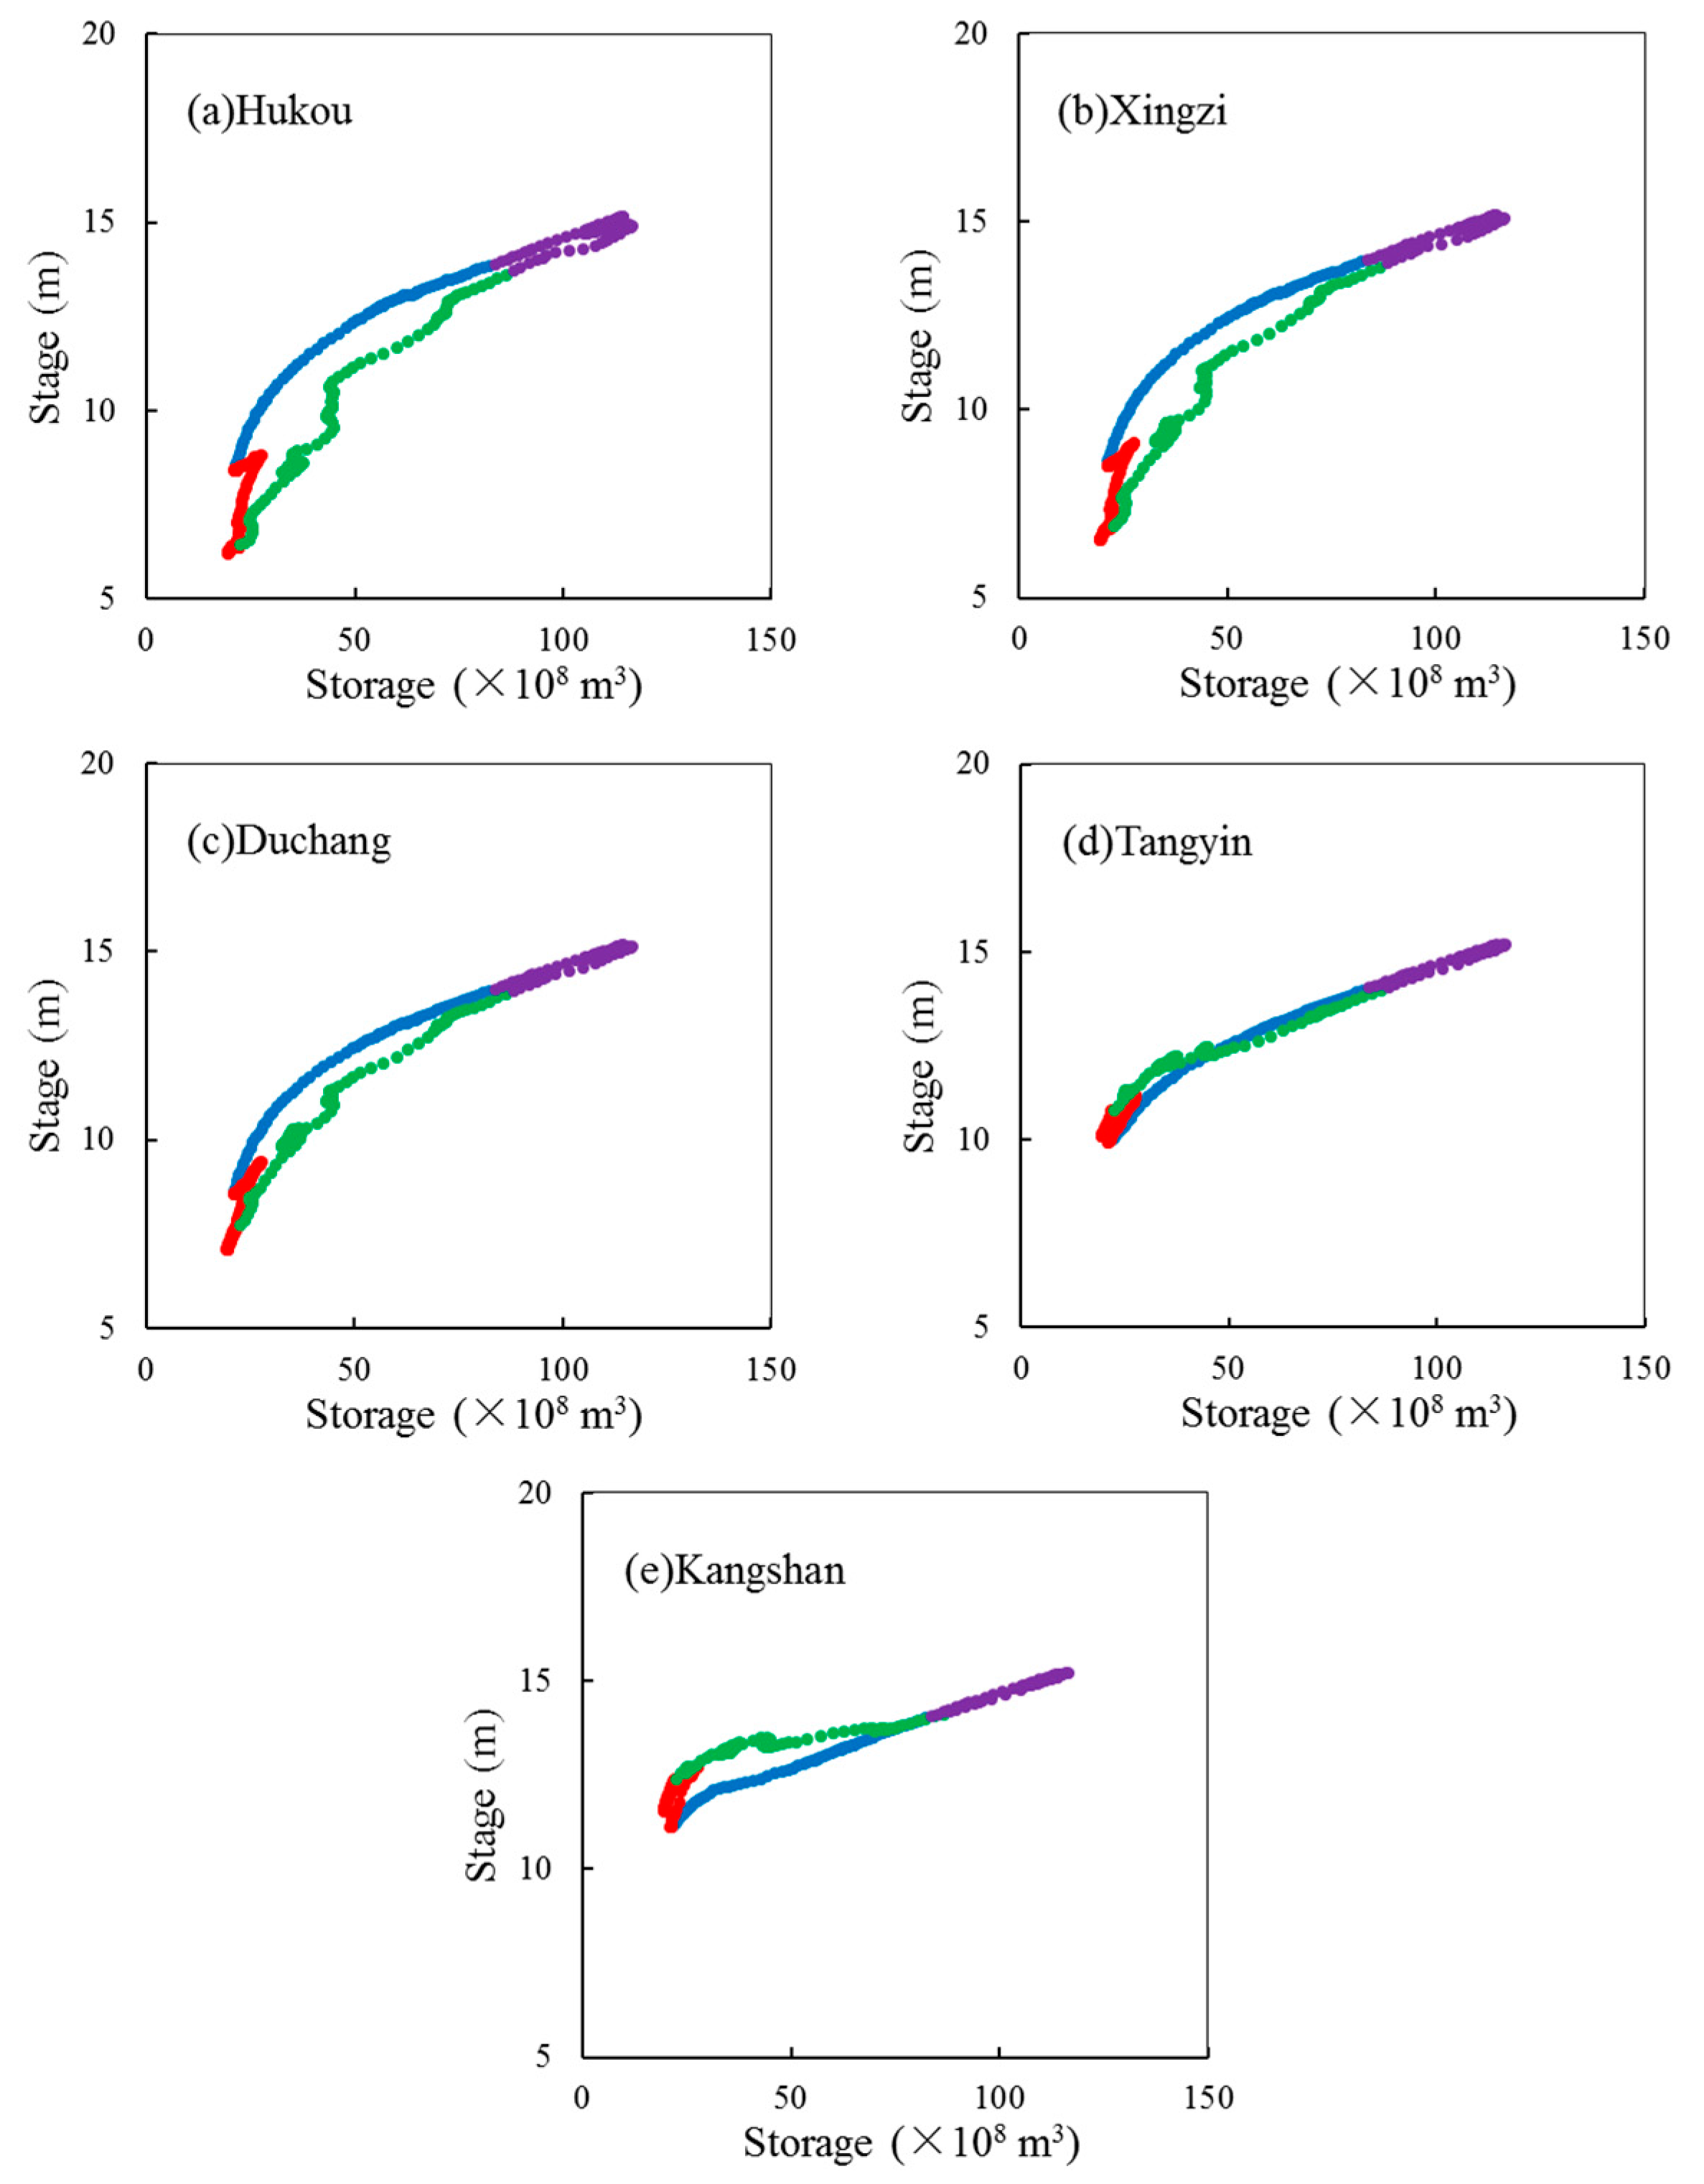
Hysteresis behaviors of water storage and stages are shown in Figure 7 and Table 4. Compared to those of the relationship between areas and stages, rules for hysteresis between water storage and stages are similar, whereas those for magnitudes are less significant. Figure 8 shows the area–storage curve and illustrates that the water area and storage are closely correlated with a low hysteresis value of 0.043 in the counter-clockwise direction. From the above finding, it can be concluded that hysteresis behavior between area and stage is the most obvious among the area–storage–stage relationships for Poyang Lake. Further analyses of causes of hysteresis behavior and of the hysteresis direction are presented in the Discussion.
3.2. Impacts of Catchment Inflows and Yangtze River Flows
Table 5 shows changes in hysteresis magnitude observed across the area and between different computational scenarios (S2–S7) relative to S1. Hysteresis levels decline sharply with an average value of 89% when catchment inflows remain constant under S2. When catchment inflows increase by 20% (S3), hysteresis levels increase at a change rate of 14%. Different stations show different change rates, with the Tangyin station presenting the lowest. By contrast, hysteresis levels decline by 11% when catchment inflows decrease by 20% (S4). Hysteresis levels decline by 46% when the Hukou water stage remains fixed under S5. The decline is smaller than in S2, due to the constant water stage reducing hysteresis, but variable catchment inflows keep it relevant. In contrast with increasing catchment inflows observed in S3, when the Hukou water stage increases by 20%, hysteresis produces a significant decline of up to 48%. Under S7, the Hukou water stage declines by 20%, causing hysteresis levels to grow by 42%.
It can be concluded that annual fluctuations in catchment inflows and Hukou water stages have a significantly positive influence on hysteresis levels, as a constant hydrological regime reduces the hysteresis under S2 and S5. A larger catchment inflow generates more hysteresis while the opposite pattern is observed for the Hukou stage (S3, S4, S6, and S7). Differences found between effects of magnitude changes in catchment inflows and Hukou stages reveal the complexities of hysteresis for Poyang Lake.
4. Discussion
As noted above, area–storage–stage relationships of Poyang Lake show significant hysteretic traits mainly found between the water-rising and water-falling periods. To explore this further, seasonal variations in water stages and lake area are discussed. Figure 9 shows daily data for catchment inflow, area, and water levels observed at the five stations. During the low-water period, the water stage and area changed slightly and remained at relatively low levels with mean values of 8.860 m and 1440.202 km2, respectively. Water was confined to long and narrow channels and to internal lakes, including lakes in the southwest separated from open water and lakes in the northeast weakly connected to open water through channels. During the high-water period, due to the inhibiting effects of the Yangtze River, the water stage and area showed high values. Water level differences observed between the five stations were very minor, showing that, in terms of hydrological characteristics, Poyang Lake covered a relatively stabilized large area. Therefore, hysteresis levels were low during the low-water and high-water periods. With catchment precipitation occurring in March, water flowed to the bottomland, and water exchange between the bottomland and channel was frequent and complex. Consequently, the water level and area underwent remarkable variations with differences between maximum and minimum values reaching 3.961 m and 1360.721 km2 during the water-rising period. During the water-falling period, water levels began to decline and the lake area of the southern main lake reduced significantly, which, in turn, spurred considerable variations in the lake area. In brief, dramatic variations of lake area and complex patterns of water exchange between bottomland and water channel areas shaped hysteresis development during the water-rising and water-falling periods.
However, what is puzzling is that three hysteresis directions (counter-clockwise, clockwise, and splayed) are observed for Poyang Lake. Regarding area–stage relationships, clockwise hysteresis is reported for river floodplain systems, as some water remains in local low-lying zones during the water-falling period, producing an area larger than that of the water-rising period (e.g., [11]). With regard to discharge–stage relationships caused by flooding, counter-clockwise hysteresis appears due to an additional surface gradient originating from flooding occurring during the flood rising period [14]. However, for discharge–stage relationships controlled by backwater effects, different directions can manifest depending on the effects of backwater.
For Poyang Lake, three hysteresis directions and different hysteresis magnitudes are observed because the surface gradient observed during the water-rising period is greater than that of the water-falling period (Figure 9) due to flood fluctuations resulting from catchment inflows and backwater effects of the Yangtze River. During the low-water period, the surface gradient is very large, which can be observed from water level differences found between the stations (Figure 9). With the onset of the water-rising period, large volumes of upstream catchment water flow into the lake from the south. On the other hand, the Hukou stage begins to become more pronounced due to enhanced Yangtze River flows. Consequently, water stages gradually rise while surface gradients dwindle but remain at relatively high levels. During the water-falling period, the lake begins to drain, as catchment inflows decline with less rainfall while Yangtze River flows also decline. The drainage direction is oriented from south to north through the long and narrow water channel, and water finally drains from the lake into the Yangtze River via the outlet of the Hukou section, which is roughly 1.5 km wide. This implies that the drainage route may not be sufficiently smoothed. Table 6 shows relative water stage change rates for the water-rising and water-falling periods. It is evident that differences in water level change rates observed at the five stations are less significant during the water-falling periods, revealing a smaller surface gradient for the lake. Hence, counter-clockwise hysteresis occurs at the Hukou station, as corresponding water stages observed at other stations are more significant for the same water stages for Hukou during the water-rising period, resulting in the formation of a larger lake area than that of the water-falling period (Figure 10). In the same way, counter-clockwise hysteresis occurs at the Xingzi and Duchang stations. Conversely, for a given water stage observed at the Kangshan station, water stages observed at other stations are less significant during the water-rising period than during the water-falling period, causing the area–stage curve to invert (Figure 10). As the transitional station is located in the center of the lake, the hysteresis direction for the Tangyin station is splayed.
As the two main factors that influence hysteresis, influencing patterns of catchment inflows and Hukou stages are not the same. When catchment inflows increase during the water-rising period, more water flows into the lake from the southern area of Poyang Lake. Water levels observed from the southern stations increase and amplification levels become greater than those of the water-falling period. On the other hand, the Hukou station, which is governed by the Yangtze River, remains unchanged. Hence, the difference in surface gradients between the water-rising and water-falling periods increases, resulting in stronger patterns of hysteresis. Regarding the magnitude change of the Hukou stage, the effect is adverse. Relative to that for 1956–2002, the Hukou stage for 2003–2015 undergoes an obvious decline, mainly as a result of bed downcutting occurring along the main channel of the Yangtze River and along the northern water channel of Poyang Lake. If water levels at the Hukou station continue to reduce—for example, under the condition of S7—the flooded area will decrease accordingly and the hysteresis of Poyang Lake will become more pronounced in the future according to the effect rules listed above. The annual averaged area for S7 will decrease by 11% compared with S1. During the period of June to August, the decrease in the average area, which is an important piece of information for flood hazard research, is up to 16%, with an absolute change of 461.622 km2. The hysteresis will become larger, which means that the estimation of the water area will produce a larger error if the hysteresis is ignored. These analyses may provide useful guidance to water management, for example, managing flood hazards.
5. Conclusions
Through a quantitative analysis of area–stage relationships based on the EFDC model, the hysteresis behaviors of Poyang Lake were revealed. The results show that hysteresis levels are significant and should spur further research on inundation hydrodynamics. Maximum calculation error values of up to 25% can result when estimating a lake area from a conventional single-valued function of areas and Xingzi stages without considering hysteresis effects, as other researchers have done. Characteristics of hysteresis are complex and present obvious spatial differences. Three hysteresis directions (counter-clockwise, clockwise, and splayed loop) were observed at different stations, and these are reported for the first time for Poyang Lake. From the combined function of watershed inflows and Yangtze River flows, water surface gradients observed during the water-rising period are greater than those of the water-falling period. This explains the different hysteresis directions and magnitudes observed for the Hukou station, which is located at the northernmost point and which shows the largest values, while the Tangyin station is located in the center of the lake and presents the smallest values. Therefore, functions between areas and stages during water-rising and water-falling periods should be established, respectively, in the research of area–stage relationships and management of flood protection and water withdrawal. If the hysteresis is not considered when estimating the lake area from the water stage in the water management of Poyang Lake, Tangyin station (not the conventional Xingzi station) should be chosen as the water stage station due to its weak hysteresis.
Catchment inflows and Yangtze River flows reflected by the Hukou stage are the main factors that influence the hysteresis of Poyang Lake due to its particular hydrological regime and complex topography. Temporal fluctuations in catchment inflows and of the Hukou stage have strong positive effects on hysteresis development. The effects of magnitude changes in catchment inflows and of Hukou stages on hysteresis were found to be adverse. For the Hukou stage, a smaller magnitude produces stronger hysteresis behavior by aggravating the difference between surface gradients observed during the water-rising and water-falling periods. With the continuing dramatic evolution of the hydrological regimes of Poyang Lake and the Yangtze River, research conclusions on the decline of the Hukou stage may reveal pronounced hysteresis trends, which can guide the future water management of Poyang Lake. This paper analyses characteristics, influencing factors and mechanisms of hysteresis for Poyang Lake, enhances the calculation accuracy of area estimations based on water stages, and furthers understanding of hydrodynamic behaviors observed in large lake floodplain systems.
Acknowledgments
This work is supported by the National Basic Research Program of China (2016YFC0401701), National Natural Science Foundation of China (51439007, 51479219), Theory and Application of Integrated Regulation and Control of Water Environment Process in River Basin (WE0145B532017), Research and Innovation Team of Water Ecological Security and Control Technology for Major Water Conservancy Projects of IWHR.
Author Contributions
Aiping Huang performed model simulations and data analysis; Wenqi Peng and Xiaobo Liu conceived and supervised the study; Yanliang Du, Shijie Zhang, Shiyan Wang, Fei Du, and Fei Dong helped the establishment of model and data analysis.
Conflicts of Interest
The authors declare no conflict of interest.
References
- Zhang, L.X.; Sergio, U.; Yang, Z.F. Emergy evaluation and economic analysis of three wetland fish farming systems in Nansi Lake area, China. J. Environ. Manag. 2011, 92, 683–694. [Google Scholar] [CrossRef] [PubMed]
- Arnesen, A.S.; Silva, T.F.; Hess, L.L.; Novo, E.M.; Rudorff, C.M.; Chapman, B.D.; McDonald, K.C. Monitoring flood extent in the lower Amazon River floodplain using ALOS/PALSAR ScanSAR images. Remote Sens. Environ. 2013, 130, 51–61. [Google Scholar] [CrossRef]
- Ogilvie, A.; Belaud, G.; Delenne, C.; Bailly, J.S.; Bader, J.C.; Oleksiak, A.; Ferry, L.; Martin, D. Decadal monitoring of the Niger Inner Delta flood dynamics using MODIS optical data. J. Hydrol. 2015, 523, 368–383. [Google Scholar] [CrossRef]
- Carroll, M.L.; Townshend, J.G.; Dimiceli, C.M.; Loboda, T.; Sohlberg, R.A. Shrinking lakes of the Arctic: Spatial relationships and trajectory of change. Geophys. Res. Lett. 2011, 38, 4–16. [Google Scholar] [CrossRef]
- Tian, H.F.; Li, W.; Wu, M.Q.; Huang, N.; Li, G.; Li, X.; Niu, Z. Dynamic Monitoring of the Largest Freshwater Lake in China Using a New Water Index Derived from High Spatiotemporal Resolution Sentinel-1A Data. Remote Sens. 2017, 9, 521. [Google Scholar] [CrossRef]
- Bryant, M.D. Global climate change and potential effects on Pacific salmonids in freshwater ecosystems of southeast Alaska. Clim. Chang. 2009, 95, 169–193. [Google Scholar] [CrossRef]
- Stevenson, J.; Siringan, F.; Finn, J.; Madulid, D.; Heijnis, H. Paoay Lake, northern Luzon, the Philippines: A record of Holocene environmental change. Glob. Chang. Biol. 2010, 16, 1672–1688. [Google Scholar] [CrossRef]
- Ma, R.; Duan, H.T.; Hu, C.M.; Yang, G.S. A half-century of changes in China’s lakes: Global warming or human influence? Geophys. Res. Lett. 2010, 37. [Google Scholar] [CrossRef]
- Tao, S.L.; Fang, J.Y.; Zhao, X.; Guo, Q.H. Rapid loss of lakes on the Mongolian Plateau. Proc. Natl. Acad. Sci. USA 2015, 112, 2281–2286. [Google Scholar] [CrossRef] [PubMed]
- Li, M.; Zhang, Q.; Li, Y.; Tan, Z. Inter-annual variations of Poyang Lake area during dry seasons: Characteristics and implications. Hydrol. Res. 2016, 47, 40–50. [Google Scholar] [CrossRef]
- Rudorff, C.M.; Melack, J.M.; Bates, P.D. Flooding dynamics on the lower Amazon floodplain: 1. Hydraulic controls on water elevation, inundation extent, and river-floodplain discharge. Water Resour. Res. 2014, 50, 619–634. [Google Scholar] [CrossRef]
- O’Kane, J.P. Hysteresis in hydrology. Acta Geophys. 2005, 53, 373–383. [Google Scholar]
- Phillips, R.W.; Spence, C.; Pomeroy, J.W. Connectivity and runoff dynamics in heterogeneous basins. Hydrol. Process. 2011, 25, 3061–3075. [Google Scholar] [CrossRef]
- Wolfs, V.; Willems, P. Development of discharge-stage curves affected by hysteresis using time varying models, model trees and neural networks. Environ. Model. Softw. 2014, 55, 107–119. [Google Scholar] [CrossRef]
- Sproles, E.A.; Leibowitz, S.G.; Reager, J.T.; Wigington, P.J.; Famiglietti, J.S. GRACE storage-runoff hystereses reveal the dynamics of regional watersheds. Hydrol. Earth Syst. Sci. 2015, 19, 3253–3272. [Google Scholar] [CrossRef]
- Boyer, M.C. Streamflow measurement. In Handbook of Applied Hydrology; Chow, V.T., Ed.; McGraw-Hill: New York, NY, USA, 1964; Chapter 15. [Google Scholar]
- Shankman, D.; Keim, B.D.; Song, J. Flood frequency in China’s Poyang Lake region: Trends and teleconnections. Int. J. Climatol. 2006, 26, 1255–1266. [Google Scholar] [CrossRef]
- Feng, L.; Hu, C.; Chen, X.; Zhao, X. Dramatic inundation changes of China’s two largest freshwater lakes linked to the Three Gorges Dam. Environ. Sci. Technol. 2013, 47, 9628–9634. [Google Scholar] [CrossRef] [PubMed]
- Zhao, X. Monitoring the dynamics of wetland inundation by random sets on multi-temporal images. Remote Sens. Environ. 2011, 115, 2390–2401. [Google Scholar] [CrossRef]
- Han, X.; Chen, X.; Feng, L. Four decades of winter wetland changes in Poyang Lake based on Landsat observations between 1973 and 2013. Remote Sens. Environ. 2015, 156, 426–437. [Google Scholar] [CrossRef]
- Huang, C.; Chen, Y.; Zhang, S.Q.; Liu, R. Surface Water Mapping from Suomi NPP-VIIRS Imagery at 30 m Resolution via Blending with Landsat Data. Remote Sens. 2016, 8, 631. [Google Scholar] [CrossRef]
- Chen, L.; Jin, Z.Y.; Michishita, R.; Xu, B. Dynamic monitoring of wetland cover changes using time-series remote sensing imagery. Ecol. Inform. 2014, 24, 17–26. [Google Scholar] [CrossRef]
- Feng, L.; Hu, C.; Chen, X.; Cai, X.; Tian, L. Assessment of inundation changes of Poyang Lake using MODIS observations between 2000 and 2010. Remote Sens. Environ. 2012, 121, 80–92. [Google Scholar] [CrossRef]
- Mei, X.; Dai, Z.; Fagherazzi, S.; Chen, J. Dramatic variations in emergent wetland area in China’s largest freshwater lake, Poyang Lake. Adv. Water Resour. 2016, 96, 1–10. [Google Scholar] [CrossRef]
- Zhang, Q.; Werner, A.D. Hysteretic relationships in inundation dynamics for a large lake-floodplain system. J. Hydrol. 2015, 527, 160–171. [Google Scholar] [CrossRef]
- Guo, H.; Hu, Q.; Zhang, Q.; Feng, S. Effects of the Three Gorges Dam on Yangtze River flow and river interaction with Poyang Lake, China: 2003–2008. J. Hydrol. 2012, 416, 19–27. [Google Scholar] [CrossRef]
- Sun, S.L.; Chen, H.S.; Ju, W.M.; Song, J.; Li, J.J.; Ren, Y.J.; Sun, J. The past and future changes of streamflow in Poyang Lake Basin, Southeastern China. Hydrol. Earth Syst. Sci. 2012, 16, 2005–2020. [Google Scholar] [CrossRef]
- Leauthaud, C.; Belaud, G.; Duvail, S.; Moussa, R.; Olivier, G.; Albergel, J. Characterizing floods in the poorly gauged wetlands of the Tana River Delta, Kenya, using a water balance model and satellite data. Hydrol. Earth Syst. Sci. 2013, 17, 3059–3075. [Google Scholar] [CrossRef] [Green Version]
- Aires, F.; Papa, F.; Prigent, C.; Cretaux, J.F.; Nguyen, M.B. Characterization and Space–Time Downscaling of the Inundation Extent over the Inner Niger Delta Using GIEMS and MODIS Data. J. Hydrometeorol. 2014, 15, 171–192. [Google Scholar] [CrossRef] [Green Version]
- Wang, P.; Lai, G.; Li, L. Predicting the Hydrological Impacts of the Poyang Lake Project Using an EFDC Model. J. Hydrol. Eng. 2015, 20, 05015009. [Google Scholar] [CrossRef]
- Lai, X.; Huang, Q.; Zhang, Y.; Jiang, J. Impact of lake inflow and the Yangtze River flow alterations on water levels in Poyang Lake, China. Lake Reserv. Manag. 2014, 30, 321–330. [Google Scholar] [CrossRef]
- Gao, J.H.; Jia, J.; Kettner, A.J.; Xing, F.; Wang, Y.P.; Xu, X.N.; Yang, Y.; Zhou, X.Q. Changes in water and sediment exchange between the Changjiang River and Poyang Lake under natural and anthropogenic conditions, China. Sci. Total Environ. 2014, 481, 542–553. [Google Scholar] [CrossRef] [PubMed]
- Hu, Q.; Feng, S.; Guo, H.; Chen, G.; Jiang, T. Interactions of the Yangtze River flow and hydrologic processes of the Poyang Lake, China. J. Hydrol. 2007, 347, 90–100. [Google Scholar] [CrossRef]
- Wu, N.H.; You, L.; Liu, T.H.; Huang, Z.W. Experimental study on the effect of the Three Gorges Project on water level in Lake Poyang. J. Lake Sci. 2014, 26, 522–528. (In Chinese) [Google Scholar]
- Qi, H.; Lu, J.; Sauvage, S.; Sanchez, J.M. Water age prediction and its potential impacts on water quality using a hydrodynamic model for Poyang Lake, China. Environ. Sci. Pollut. Res. 2016, 23, 13327–13341. [Google Scholar] [CrossRef] [PubMed]
- Hamrick, J.M. A Three-Dimensional Environmental Fluid Dynamics Computer Code: Theoretical and Computational Aspect; Virginia Institute of Marine Science, College of William and Mary: Gloucester Point, VA, USA, 1992. [Google Scholar]
- Li, L.; Lai, G.Y.; Wang, P. Study on the dynamic correlation between water-level and reservoir capacity of Poyang Lake based on EFDC. J. Appl. Sci. Eng. 2016, 19, 413–428. [Google Scholar]
- Feng, L.; Hu, C.M.; Chen, X.L.; Li, R.F.; Tian, L.Q.; Murch, B. MODIS observations of the bottom topography and its inter-annual variability of Poyang Lake. Remote Sens. Environ. 2011, 115, 2729–2741. [Google Scholar] [CrossRef]
- Mishra, S.K.; Seth, S.M. Use of hysteresis for defining the nature of flood wave propagation in natural channels. Hydrol. Sci. J. 1996, 41, 153–170. [Google Scholar] [CrossRef]
- Xiong, J.; Lai, G.; Peng, X.; Sheng, Y. Poyang Lake area estimation based on EFDC model. J. Nanjing Univ. Inf. Sci. Technol. 2016, 8, 56–63. (In Chinese) [Google Scholar]
Figure 1.
Location, topography, hydrological stations and boundaries of Poyang Lake. The lake watershed includes five main tributaries shown as blue lines and connected to the Yangtze River at the Hukou station, which is marked as a triangle. The circles denote four water level stations, and the red line shows the boundaries of the model used in this paper. Datong station is shown in the upper right corner.

Figure 2.
(a) Relationship between Hukou discharge and the Hukou stage; (b) Relationship between Datong discharge and the Hukou stage.
Figure 2.
(a) Relationship between Hukou discharge and the Hukou stage; (b) Relationship between Datong discharge and the Hukou stage.
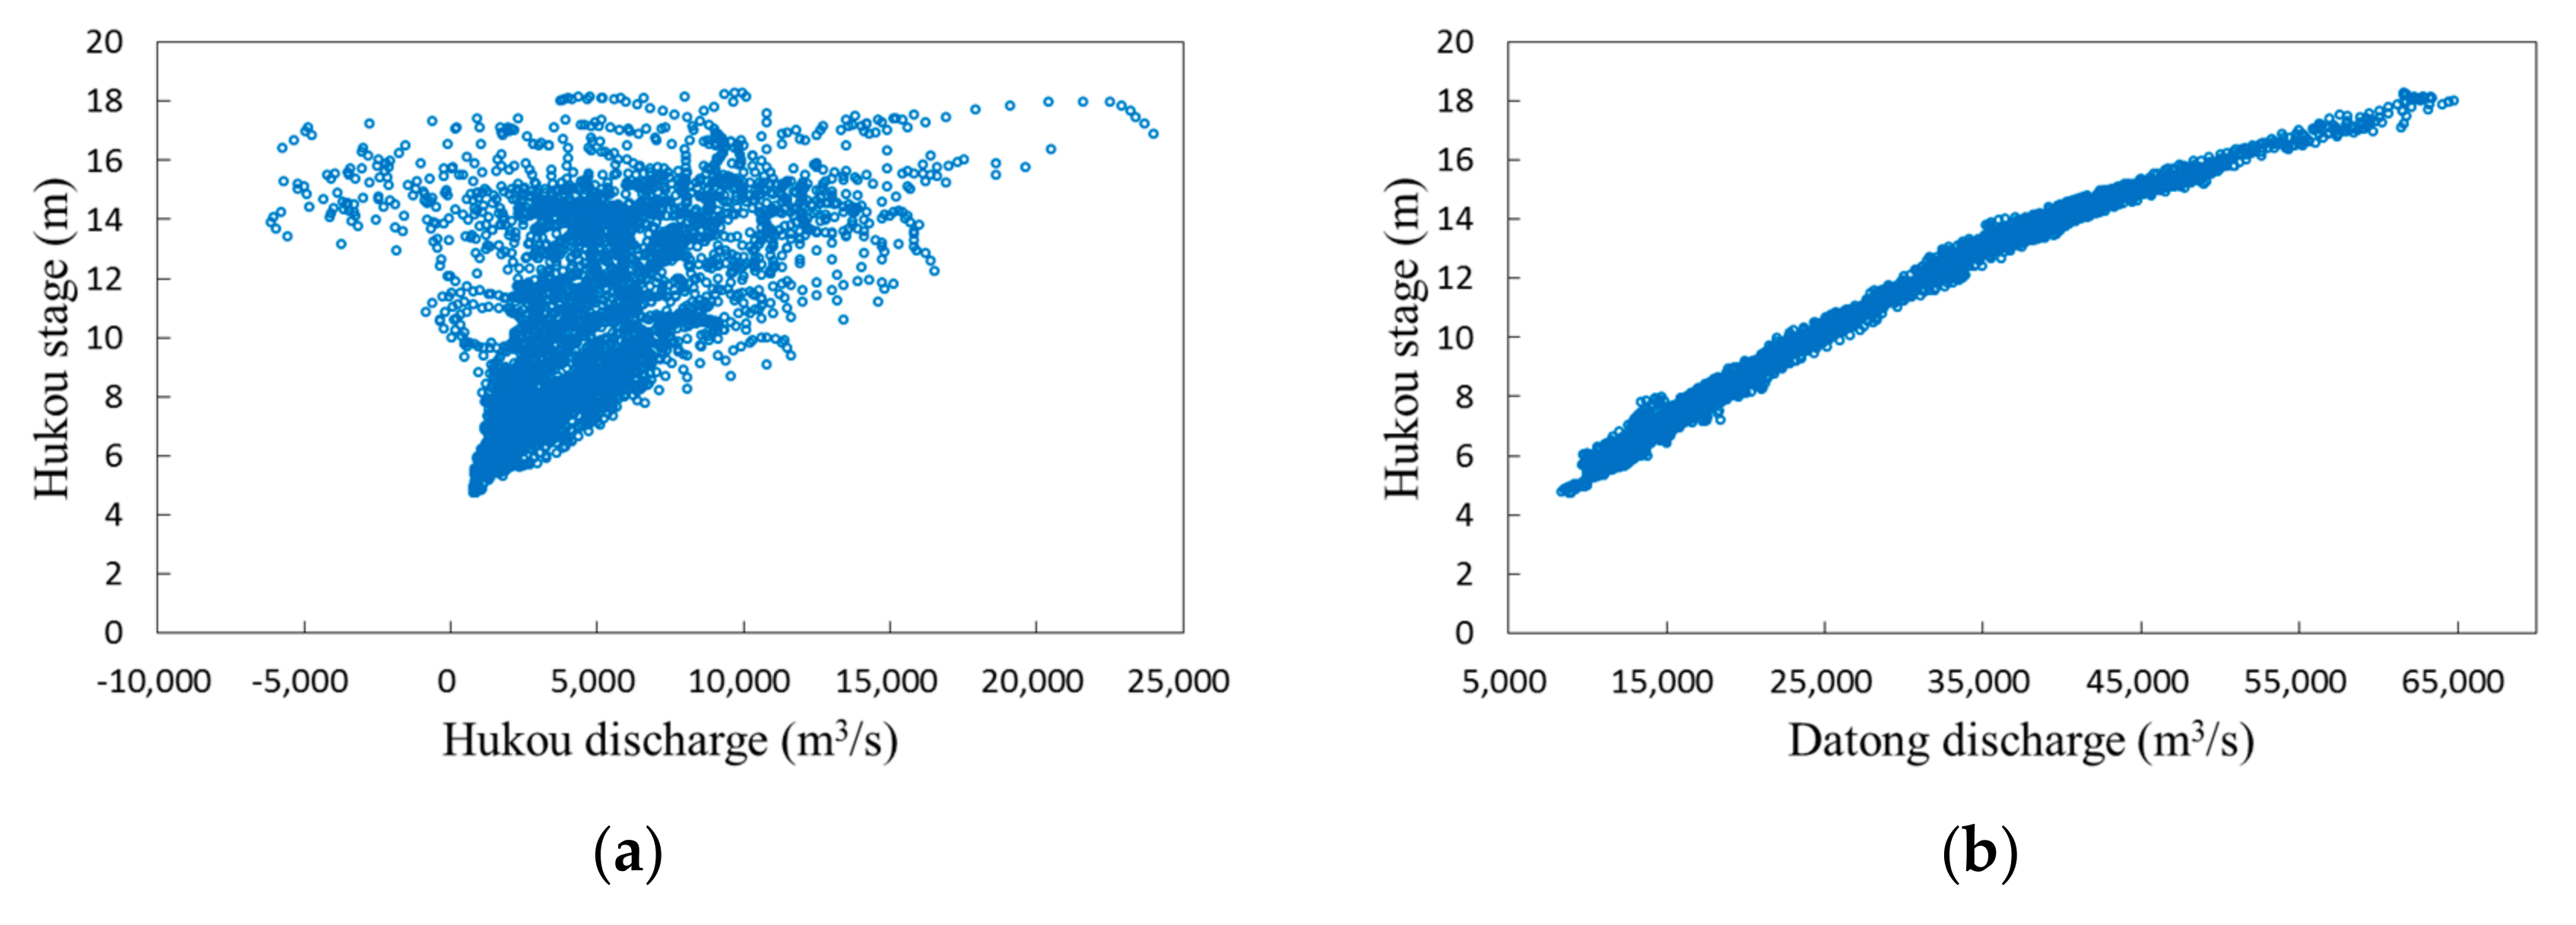
Figure 3.
Simulated and observed daily water stages: (a) Xingzi; (b) Duchang; (c) Tangyin; and (d) Kangshan. Simulated and observed daily discharge levels for Hukou (e). Red and blue lines denote simulated and observed data, respectively.
Figure 3.
Simulated and observed daily water stages: (a) Xingzi; (b) Duchang; (c) Tangyin; and (d) Kangshan. Simulated and observed daily discharge levels for Hukou (e). Red and blue lines denote simulated and observed data, respectively.

Figure 4.
Inundation area simulated by the EFDC model and obtained from remote sensing images: (a) simulated by the model and (b) obtained from remote sensing images for 20 July 2014; (c) simulated by the model and (d) obtained from remote sensing images for 5 October 2013; (e) simulated by the model and (f) obtained from remote sensing images for 22 November 2013. Black areas mark the water surface.
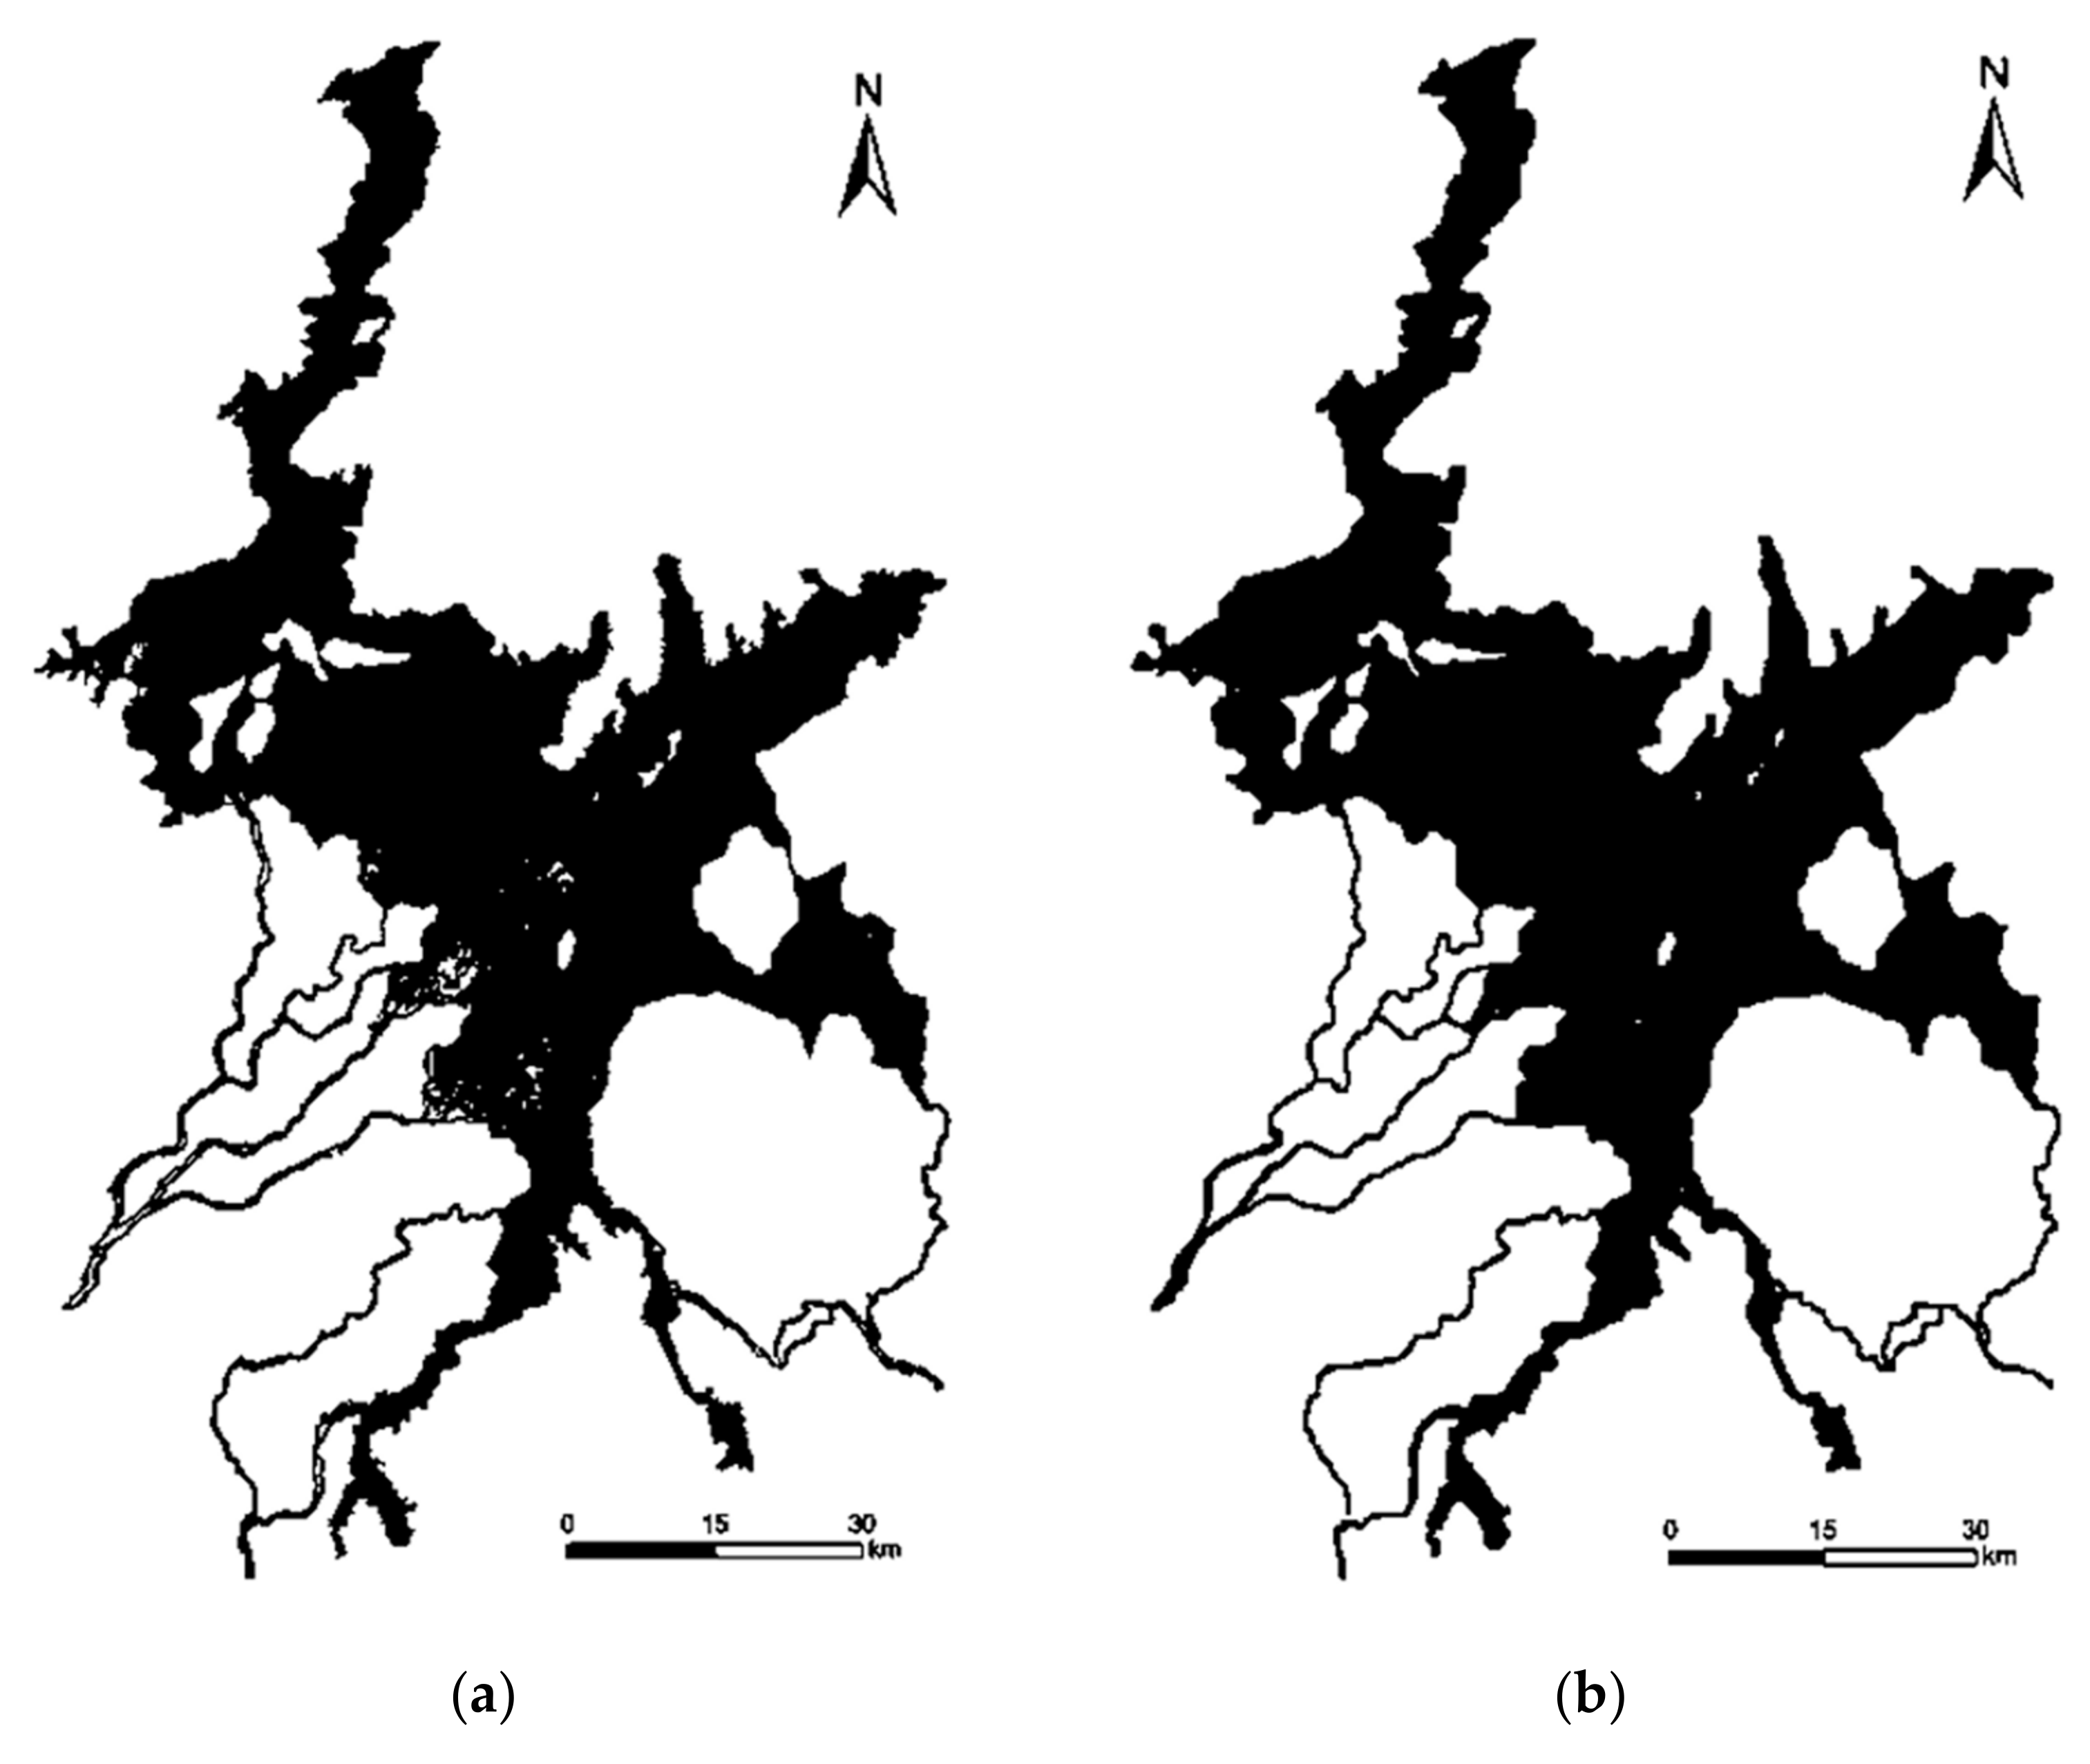

Figure 5.
Daily mean values for catchment inflows and Hukou stages for 2003–2015 and 1956–2002.
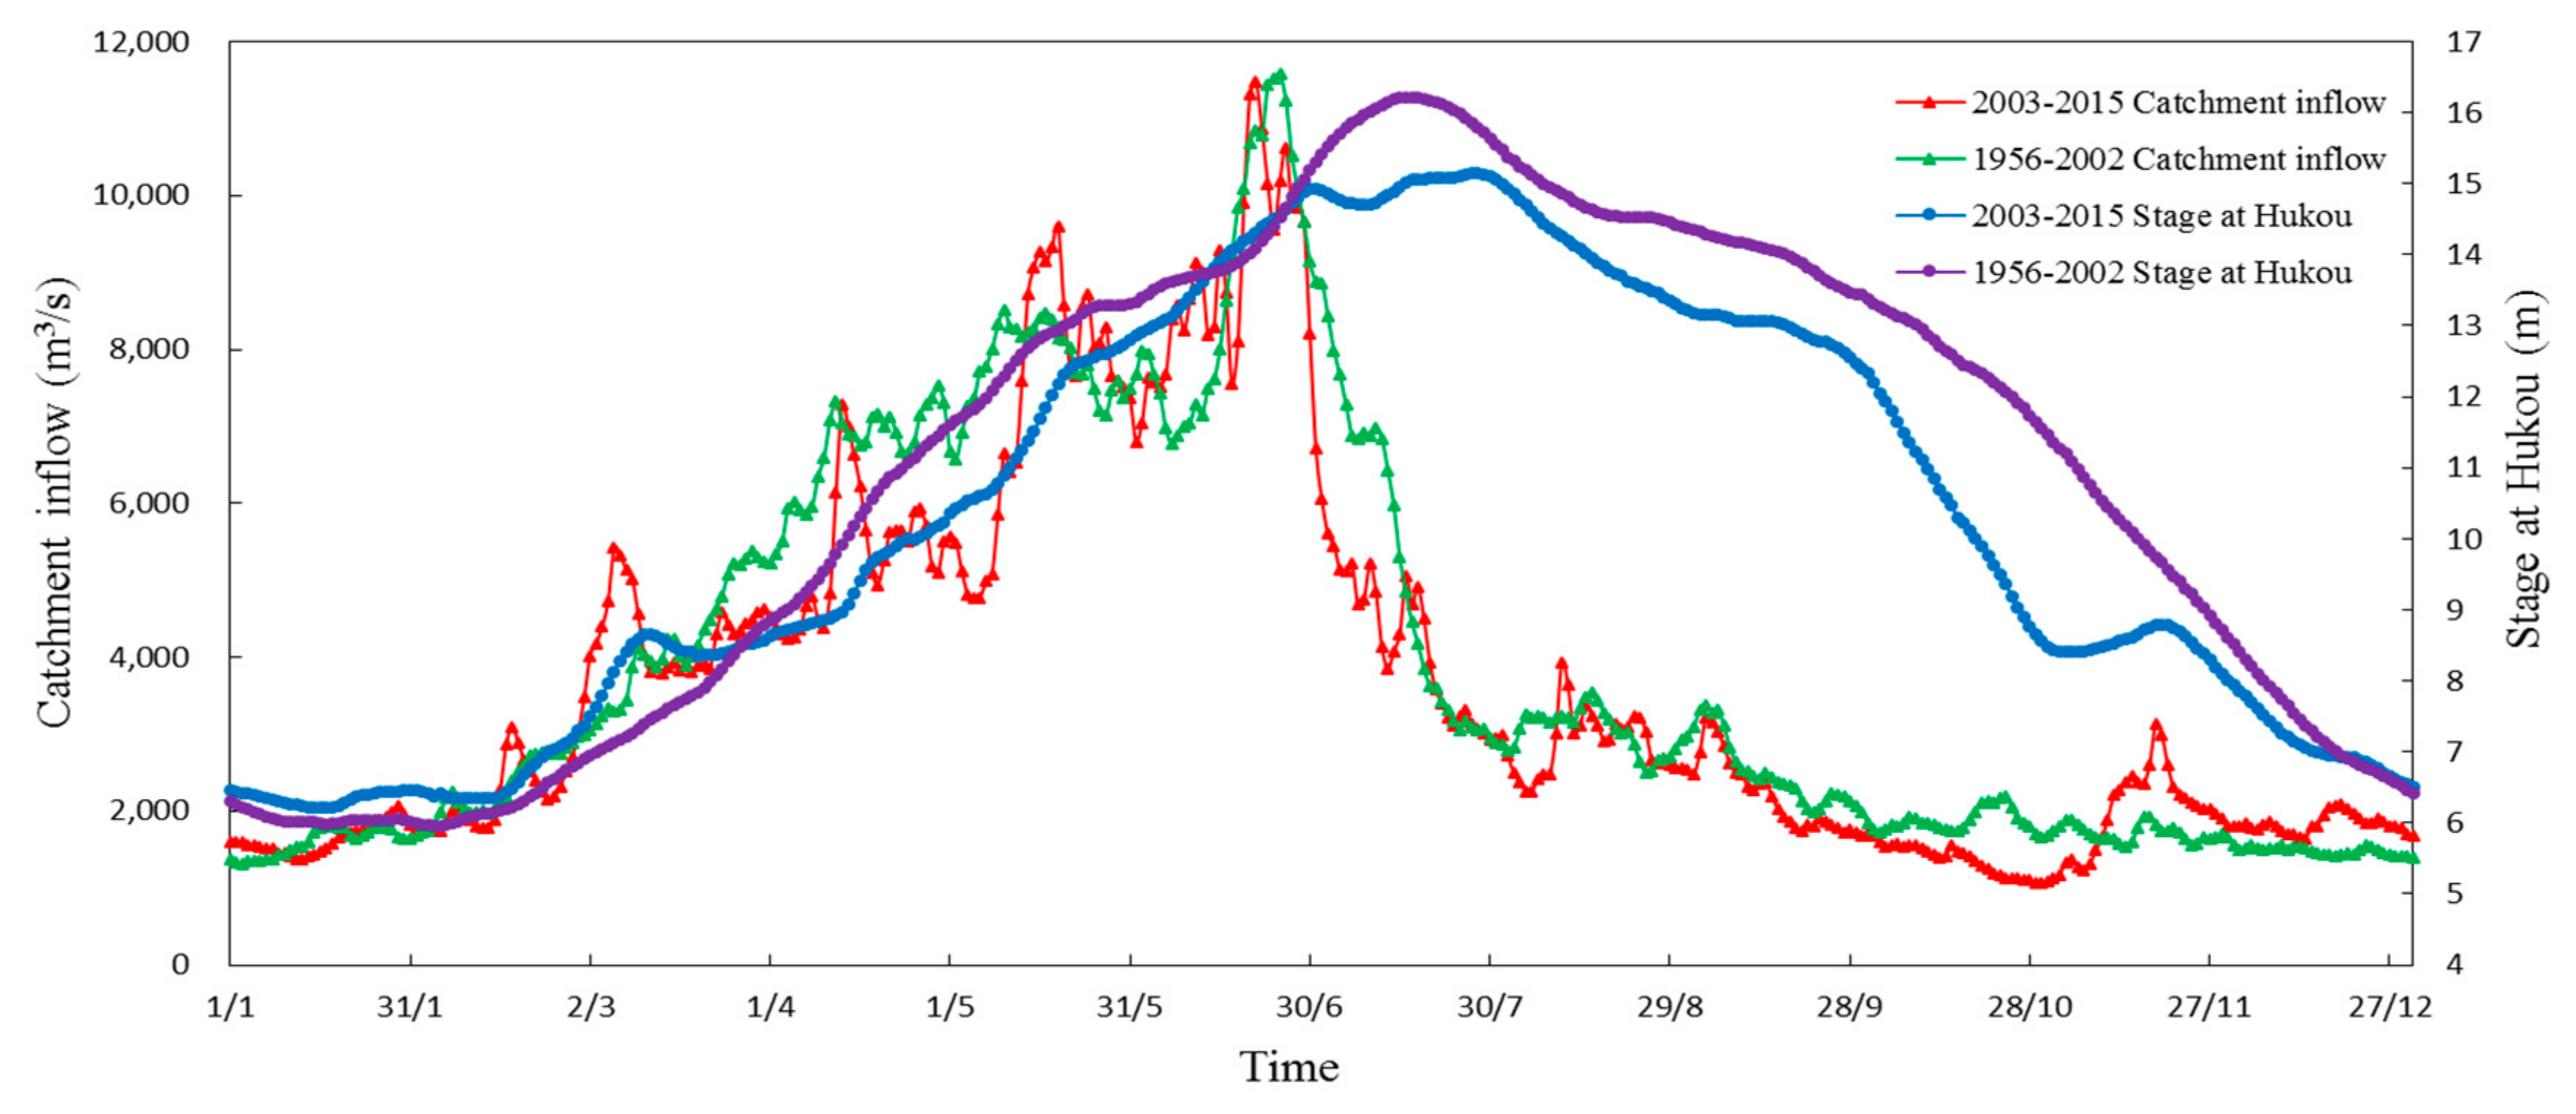
Figure 6.
Hysteresis relationships of the lake area and water stages for five stations. Green, purple, blue, and red lines denote the water-rising, high-water, water-falling, and low-water periods, respectively. The highest points of the red lines are shown in Figures (a–e) due to the presence of a peak in catchment inflows and in the Hukou stage occurring in November (shown in Figure 5).

Figure 7.
Hysteresis relationships between storage and stage for five stations. Green, purple, blue, and red lines denote the water-rising, high-water, water-falling, and low-water periods, respectively.
Figure 7.
Hysteresis relationships between storage and stage for five stations. Green, purple, blue, and red lines denote the water-rising, high-water, water-falling, and low-water periods, respectively.

Figure 8.
Hysteresis relationships between area and storage. Green, purple, blue, and red lines denote the water-rising, high-water, water-falling, and low-water periods, respectively.
Figure 8.
Hysteresis relationships between area and storage. Green, purple, blue, and red lines denote the water-rising, high-water, water-falling, and low-water periods, respectively.
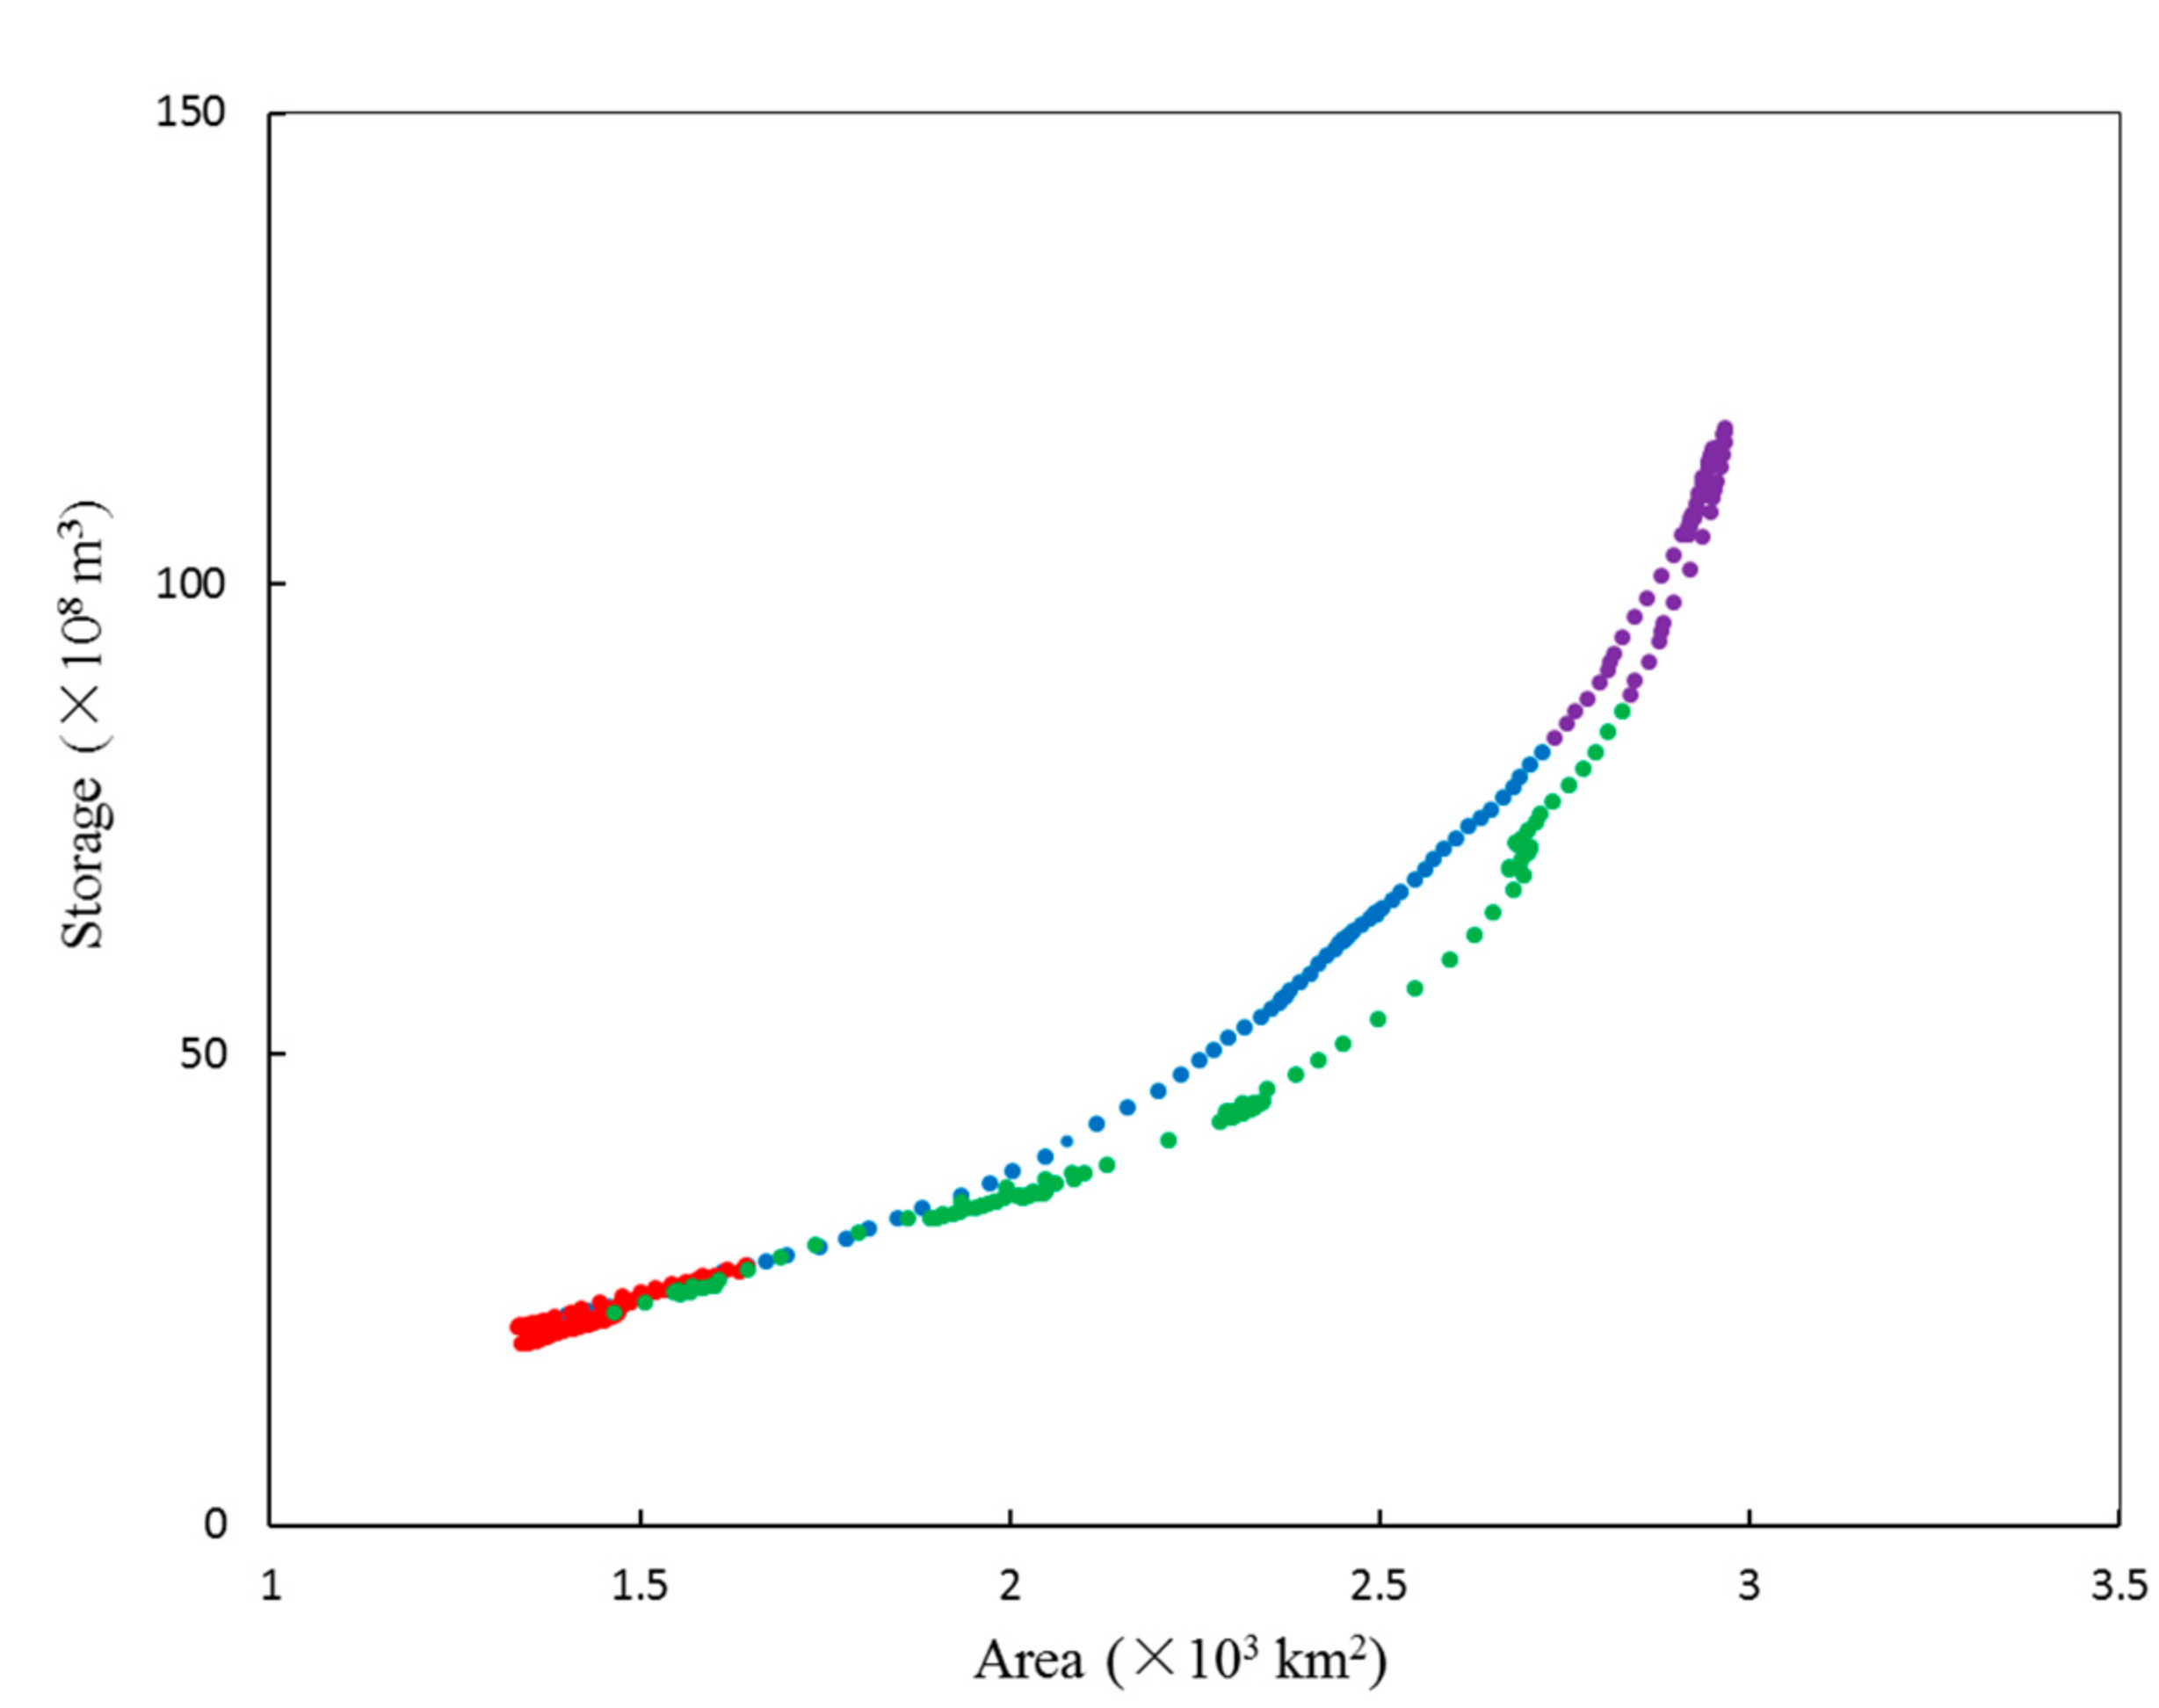
Figure 9.
Daily variations in catchment inflows, lake area, and water stages for the five stations.
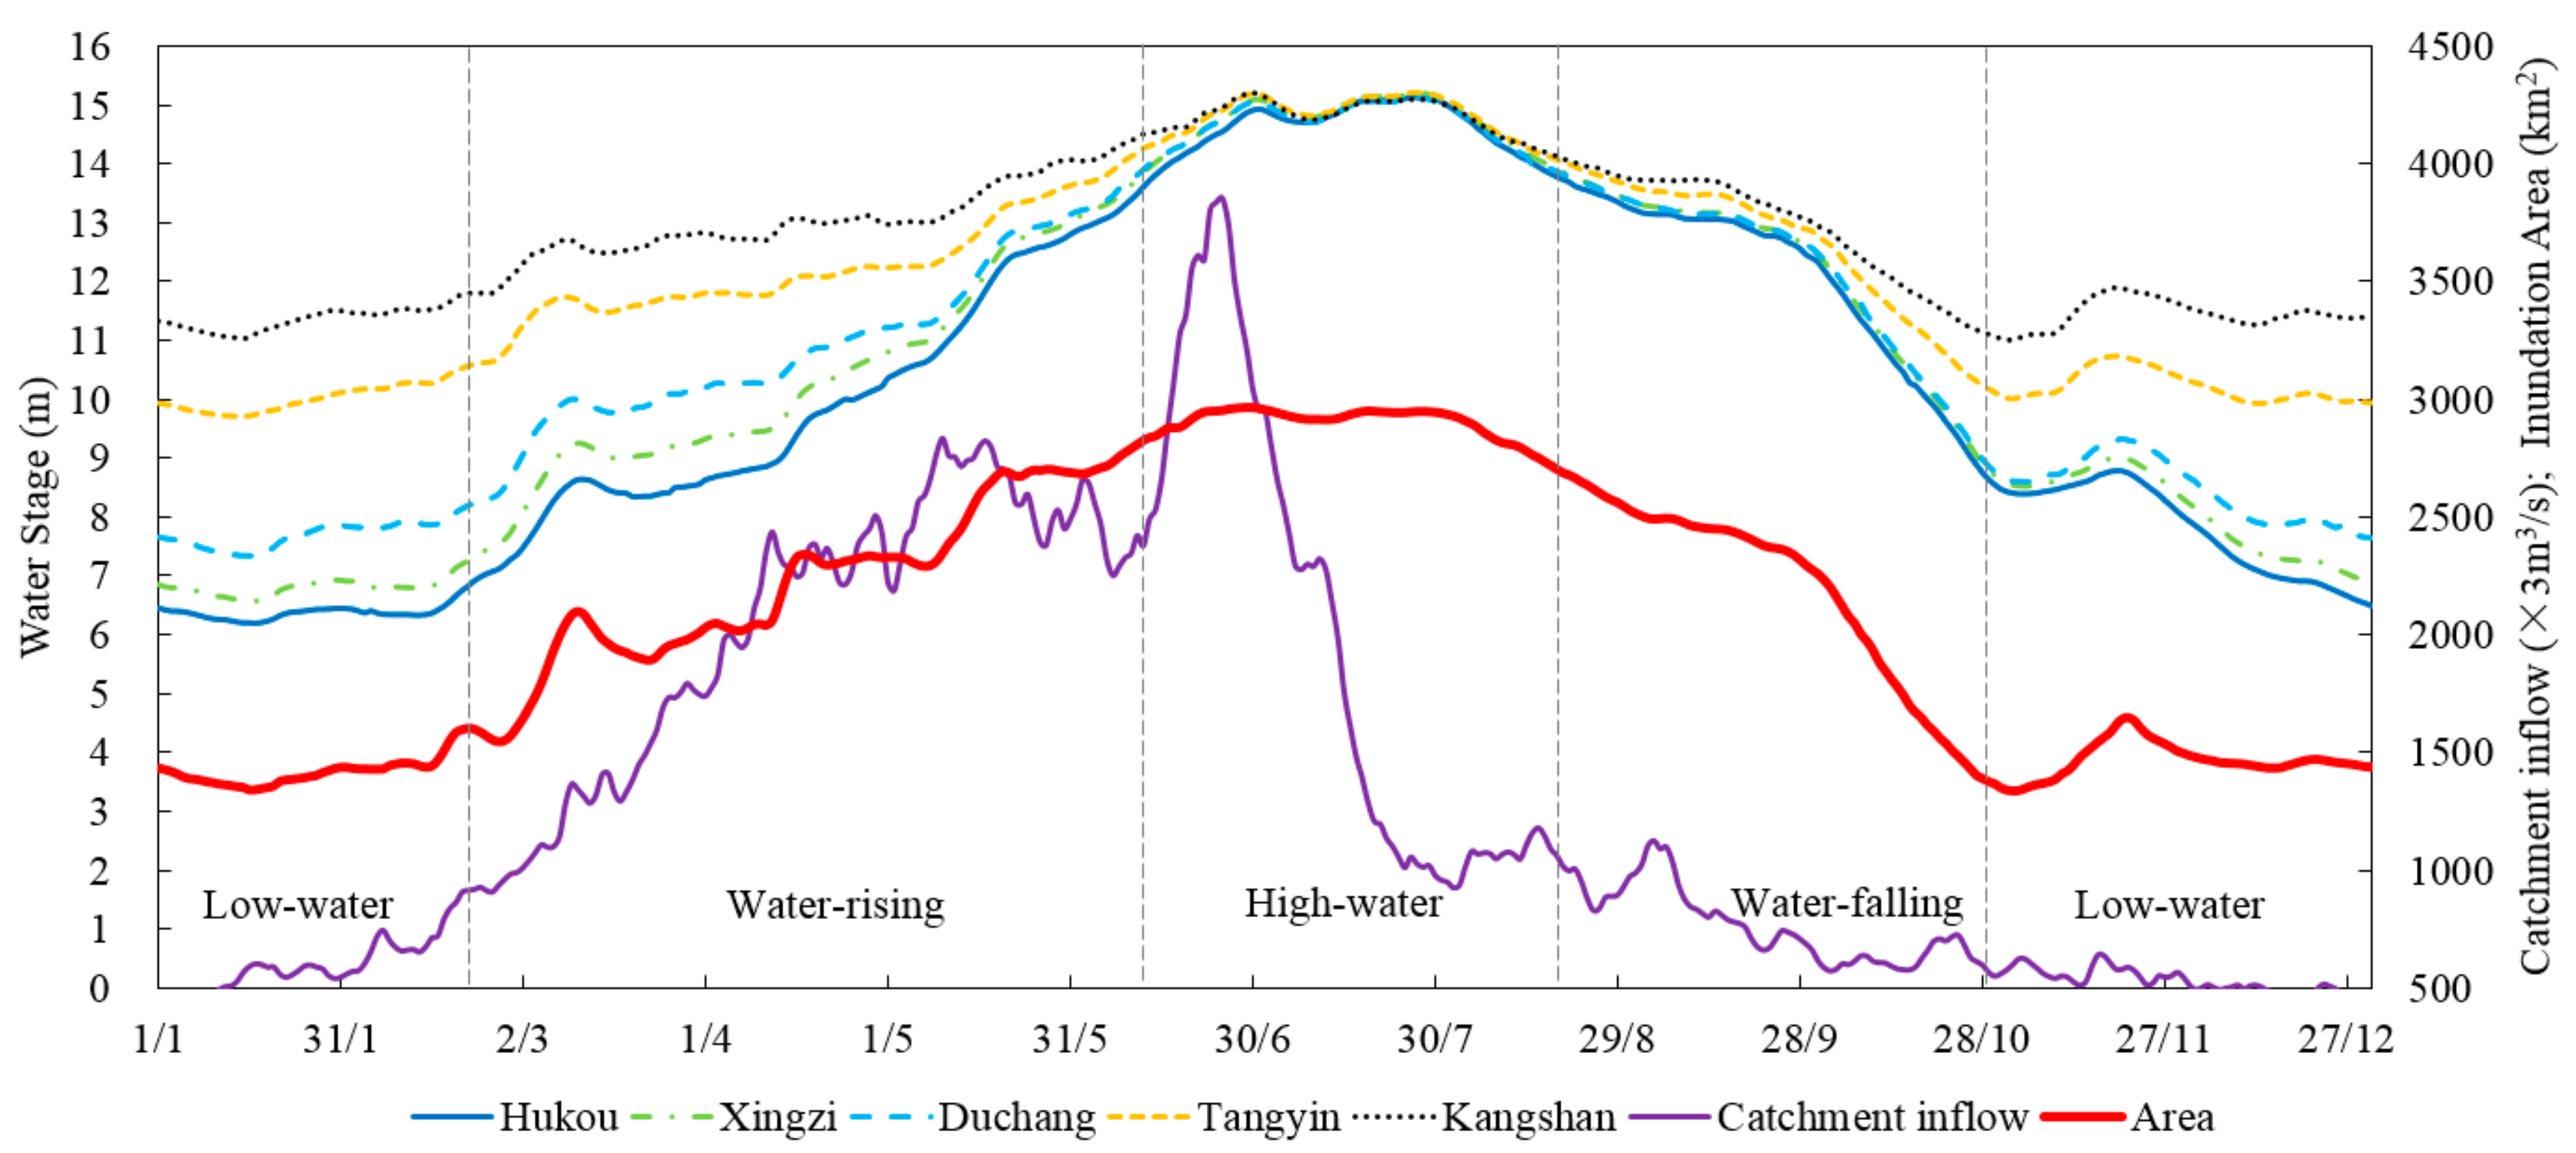
Figure 10.
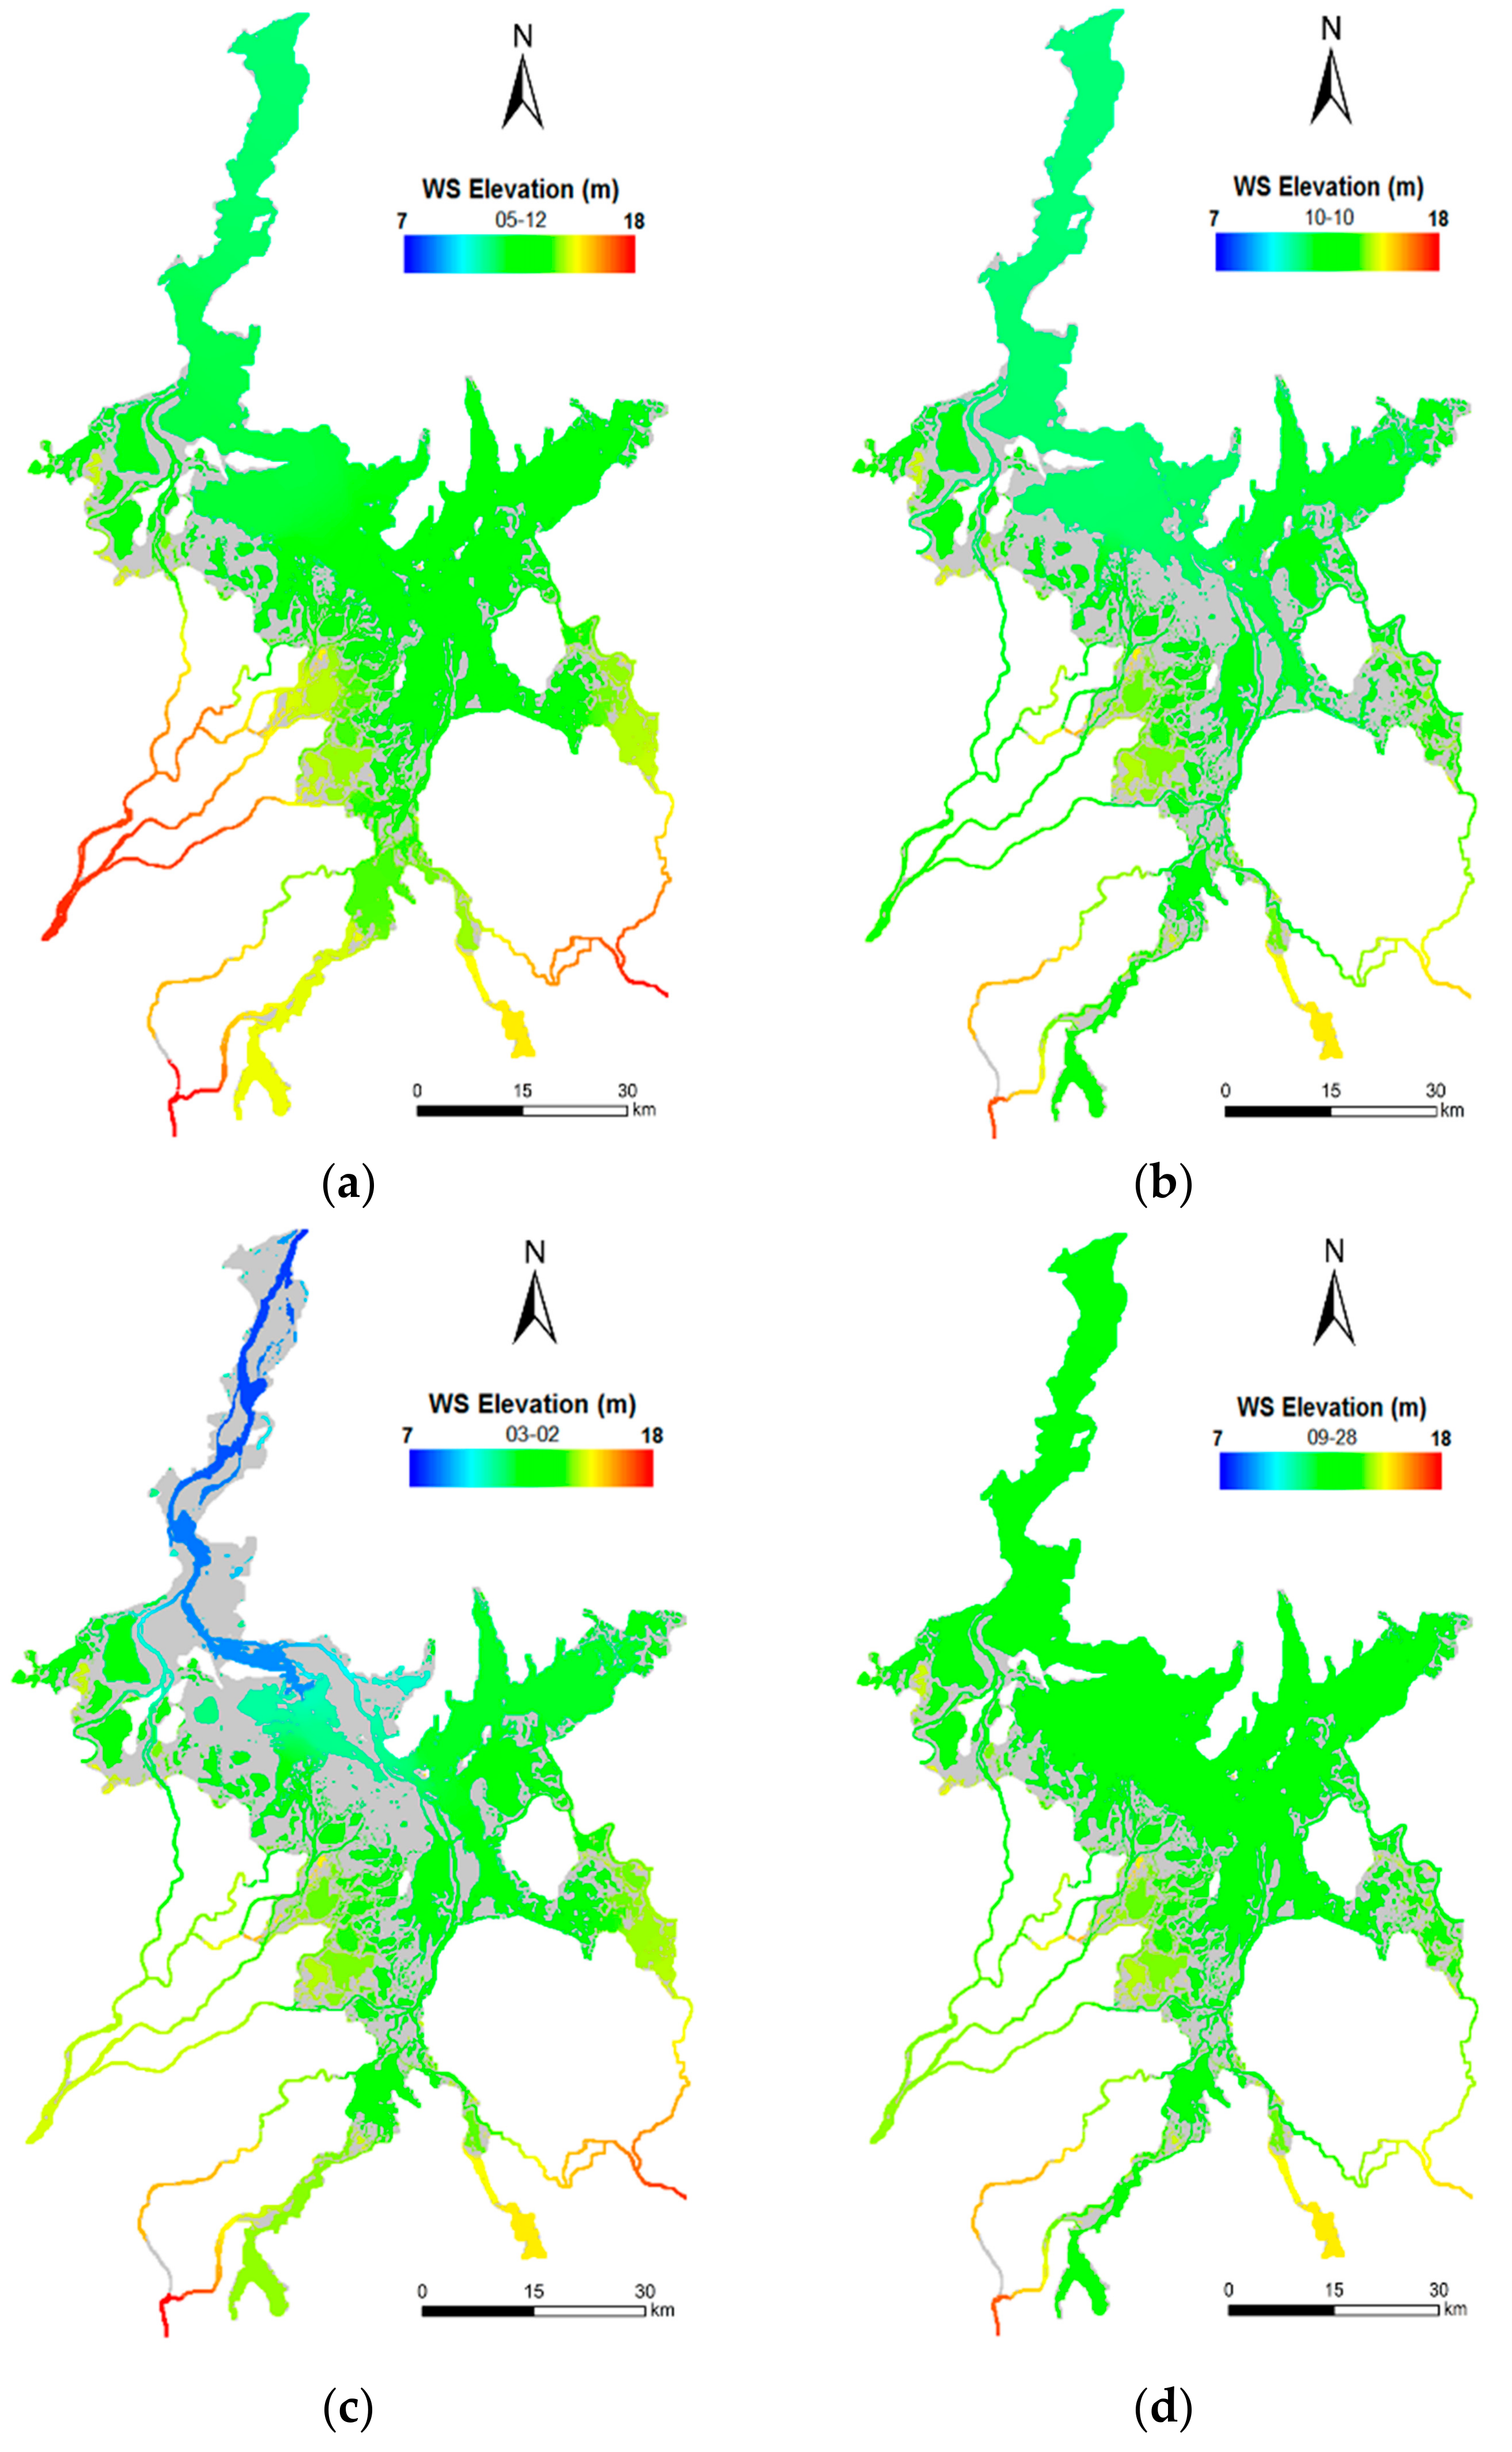
Water stage for S1 measured on (a) 12 May during the water-rising period (the water stage observed at the Hukou station is 11.124 m; the lake area is 2417.332 km2); (b) 10 October during the water-falling period (the water stage observed at the Hukou station is 11.123 m; the lake area is 1933.342 km2); (c) 2 March during the water-rising period (the water stage observed at the Kangshan station is 12.791 m; the lake area is 1644.364 km2); (d) 28 September during the water-falling period (the water stage observed at the Kangshan station is 12.784 m; the lake area is 2318.352 km2).
Figure 10.
Water stage for S1 measured on (a) 12 May during the water-rising period (the water stage observed at the Hukou station is 11.124 m; the lake area is 2417.332 km2); (b) 10 October during the water-falling period (the water stage observed at the Hukou station is 11.123 m; the lake area is 1933.342 km2); (c) 2 March during the water-rising period (the water stage observed at the Kangshan station is 12.791 m; the lake area is 1644.364 km2); (d) 28 September during the water-falling period (the water stage observed at the Kangshan station is 12.784 m; the lake area is 2318.352 km2).

Table 1.
Error analysis of water stages and discharge simulations. Units of the mean absolute error for water stages and discharge levels are m and m3/s, respectively; the unit of the mean relative error is %; units of the root-mean-square error for water and discharge levels are m and m3/s, respectively; The Nash–Sutcliffe model efficiency coefficient is dimensionless.
| Station | Mean Absolute Error | Mean Relative Error | Root-Mean-Square Error | Nash–Sutcliffe Model Efficiency Coefficient |
|---|---|---|---|---|
| Water stage validation | ||||
| Xingzi | 0.138 | 1.310 | 0.205 | 0.996 |
| Duchang | 0.242 | 2.267 | 0.305 | 0.990 |
| Tangyin | 0.230 | 1.917 | 0.292 | 0.981 |
| Kangshan | 0.365 | 2.851 | 0.434 | 0.931 |
| Discharge validation | ||||
| Hukou | 518.079 | 10.867 | 746.029 | 0.933 |
Table 2.
Error analysis of the water area simulation.
| Time | Water Level at Xingzi (m) | Area Derived from Remote Sensing Images (km2) | Area Derived from the Simulated Model (km2) | Absolute Error (km2) | Relative Error (%) |
|---|---|---|---|---|---|
| 20 July 2014 | 16.473 | 3065.349 | 3016.505 | −48.844 | −1.593 |
| 5 October 2013 | 11.562 | 1769.924 | 1865.009 | 95.086 | 5.372 |
| 22 November 2013 | 7.094 | 1158.844 | 1288.094 | 129.249 | 11.153 |
Table 3.
Setup of the computational scenarios.
| Item | S1 | S2 | S3 | S4 | S5 | S6 | S7 |
|---|---|---|---|---|---|---|---|
| Catchment inflow | Daily mean for 2003 to 2015 | Average of S1 | Increase by 20% of S1 | Decrease by 20% of S1 | Same as S1 | Same as S1 | Same as S1 |
| Hukou stage | Daily mean for 2003 to 2015 | Same as S1 | Same as S1 | Same as S1 | Average of S1 | Increase by 20% of S1 | Decrease by 20% of S1 |
Table 4.
Magnitude of hysteresis.
| Item | Hukou | Xingzi | Duchang | Tangyin | Kangshan |
|---|---|---|---|---|---|
| Area and stage | 0.230 | 0.195 | 0.162 | 0.089 | 0.118 |
| Storage and stage | 0.126 | 0.102 | 0.084 | 0.048 | 0.075 |
Table 5.
Variations in hysteresis levels by area and stage for computational scenarios of S2–S7 relative to those of S1.
Table 5.
Variations in hysteresis levels by area and stage for computational scenarios of S2–S7 relative to those of S1.
| Item | Catchment Inflow | Hukou Stage | ||||
|---|---|---|---|---|---|---|
| S2 | S3 | S4 | S5 | S6 | S7 | |
| Hukou | −89% | 16% | −19% | - | −57% | 73% |
| Xingzi | −94% | 12% | −13% | −48% | −52% | 48% |
| Duchang | −97% | 8% | −12% | −37% | −47% | 33% |
| Tangyin | −84% | 1% | −1% | −38% | −52% | 5% |
| Kangshan | −82% | 34% | −10% | −59% | −33% | 47% |
| Average | −89% | 14% | −11% | −46% | −48% | 41% |
Table 6.
Relative change rates of water levels compared to those of the Hukou station (unit is m/d).
Table 6.
Relative change rates of water levels compared to those of the Hukou station (unit is m/d).
| Period | Hukou | Xingzi | Duchang | Tangyin | Kangshan |
|---|---|---|---|---|---|
| Water-rising | 1.00 | 0.97 | 0.83 | 0.55 | 0.41 |
| Water-falling | 1.00 | 1.00 | 0.98 | 0.76 | 0.59 |
© 2017 by the authors. Licensee MDPI, Basel, Switzerland. This article is an open access article distributed under the terms and conditions of the Creative Commons Attribution (CC BY) license (http://creativecommons.org/licenses/by/4.0/).
Share and Cite
MDPI and ACS Style
Huang, A.; Peng, W.; Liu, X.; Du, Y.; Zhang, S.; Wang, S.; Du, F.; Dong, F. Characteristics and Factors Influencing the Hysteresis of Water Area–Stage Curves for Poyang Lake. Water 2017, 9, 938. https://doi.org/10.3390/w9120938
AMA Style
Huang A, Peng W, Liu X, Du Y, Zhang S, Wang S, Du F, Dong F. Characteristics and Factors Influencing the Hysteresis of Water Area–Stage Curves for Poyang Lake. Water. 2017; 9(12):938. https://doi.org/10.3390/w9120938
Chicago/Turabian StyleHuang, Aiping, Wenqi Peng, Xiaobo Liu, Yanliang Du, Shijie Zhang, Shiyan Wang, Fei Du, and Fei Dong. 2017. "Characteristics and Factors Influencing the Hysteresis of Water Area–Stage Curves for Poyang Lake" Water 9, no. 12: 938. https://doi.org/10.3390/w9120938
Note that from the first issue of 2016, this journal uses article numbers instead of page numbers. See further details here.