1. Introduction
To pursue the objective of the sustainable management of marine and maritime sectors, the European Commission launched the “Blue Growth” strategy, strengthened in the Mediterranean area via the Bluemed initiative (Venice Declaration on Mediterranean Sea Cooperation, 16 October 2015). The focal challenge of Bluemed is the integration of knowledge and efforts within European Union (EU) members of the Mediterranean basin to jointly create new “blue jobs” and industrial marine and maritime growth. In this context, ports are of strategically importance, being the crossroads of numerous activities including tourism, pleasure boating, commercial traffic, fishing and cabotage.
The regulatory framework to support the sustainable management of coastal activities includes the Water Framework Directive (WFD) [
1] and marine spatial planning (MSP) [
2]. WFD aims at achieving a good ecological status (GES) for the protection of groundwater, inland surface waters, estuarial (i.e., transitional) waters and coastal waters that extend one nautical mile from the coast [
3]. Port basins fall within the category of heavily modified water bodies (HMWB), since they continuously suffer from severe physical and chemical modifications due to anthropogenic activities. According to the WFD, HMWB must obtain or maintain a good ecological potential (GEP) [
4], which is attained when there are “slight” changes in the values of the relevant biological quality elements compared with the values found at maximum ecological potential (MEP); the latter is intended to describe the best approximation to a natural aquatic ecosystem. Although several attempts have been made to define MEP and GEP, there are still gaps in the analysis of ecological quality, which is based on the status of the biological elements and the associated hydromorphological and physico-chemical conditions [
4]. Unlike the WFD, which individually analyses the ecosystem components, MSP is based on a holistic approach for the sustainable management of user–user and user–environment conflicts that may be generated by port activities, resulting in undesirable effects such as the loss and destruction of habitat, pollution, climate change, over-fishing, and cumulative threats to the oceans and human health as a whole [
5].
The sustainability of sea-port development is also a crucial topic in the environmental code of the European Sea Ports Organisation. Sustainability can be achieved via continuous environmental monitoring. For this reason, in recent years the European community has funded the ECOPORT project “Towards A Sustainable Transport Network” [
6], the goal of which is to design a system of sustainable management indicators to be used by any port authorities. The Pearl Project [
7] highlights the importance of environmental monitoring in the management of port activities that can alter the characteristics of harbour waters.
The development of coastal observing systems (COS) in port areas (i.e., the Chesapeake Bay Observing System, CBOS [
8]; the Long-term Ecosystem Observatory, LEO-15 [
9]) is strategic to monitor episodic/occasional phenomena related to natural/man-made events that cannot be identified using traditional sampling methods. In this perspective, COS support port managers in facing eventual emergency situations that may occur in their ports by integrating in situ measures, remote observations and numerical models.
Some port activities, such as dredging operations necessary to keep waterways navigable or to build a new work, may also compromise the environmental status of the adjacent coastal areas. The dispersion of resuspended material can cause direct and/or indirect impacts on species and habitats enclosed in attachments one and two of the EU directive 92/43/EEC [
10,
11]. In this context, the “building with nature” approach [
12] promoted by the Dutch dredging industry in the Netherlands is relevant. This approach is recommended by the European Commission, and aims at designing water infrastructure taking into account the additional socio-economic costs due to potential impacts on the environment. This concept should also be extended to other anthropogenic pressures that occur in ports and influence their water quality. In this context, a useful contribution could be given by predictive and low-cost indexes, which allow coastal managers to properly evaluate the potential impacts produced by anthropic activities, before and after their realization.
The residence time provides a great contribution to the analysis of the ecological quality of semi-enclosed basins, directly affecting the hydromorphological condition, thereby contributing to MEP and GEP identification [
13]. Water renewal has been estimated in the literature using different hydrodynamic time parameters (e.g., age, flushing time (FT), residence time, transit time and time turnover) [
14] and analysed by many authors using numerical models [
15,
16,
17,
18,
19,
20,
21,
22,
23,
24,
25]. The hydrodynamic time parameter chosen in this study is a FT that corresponds to the time required for the total mass of a conservative tracer originally within the entire water body or a segment of the water body to be reduced to a factor of 1/e [
17,
19,
26,
27,
28] (e is the Nepier’s constant). Within a port area, the FT largely depends on the dominant forcing conditions, the basin size, and the number of entrances, affecting the water circulation patterns of the harbour domain [
24].
The relation between the hydrodynamic time parameters and the spatial distribution of chemical and biological variables in the water column within semi-enclosed areas has been demonstrated for phytoplankton blooms [
29], silicates, chlorophyll-a and bacterial production [
20], particulate and dissolved organic matter [
30] and heavy metal [
31,
32] dynamics.
Nevertheless, sediments are recognized as good indicators of anthropogenic impacts on estuarine and coastal environments [
33,
34], also providing time-integrated information onthe contamination of the water column [
33,
35]. Therefore, to test the reliability of the residence time calculation within harbour basins, the concentration of contaminants in sediments is a more representative parameter with respect to a single measurement of the water column [
36,
37,
38]. In this study, the enrichment factor (EF) [
39,
40] is proposed to describe the relation between the water recirculation time and the contamination level of heavy metals in the sediments.
This study presents the results of the development and the application of the new flushing efficiency index (FEI) to evaluate the effects of forthcoming structural changes on harbour water quality, confirming its usefulness as a tool to support the sustainable management of port basins. FEI has been applied to Civitavecchia harbour since it has been and will be subjected to new major structural changes (breakwater extension, the construction of new docks, the realization of a new entrance) to become one of the largest ports on the Mediterranean in terms of passenger traffic and goods.
2. Materials and Methods
2.1. Study Area
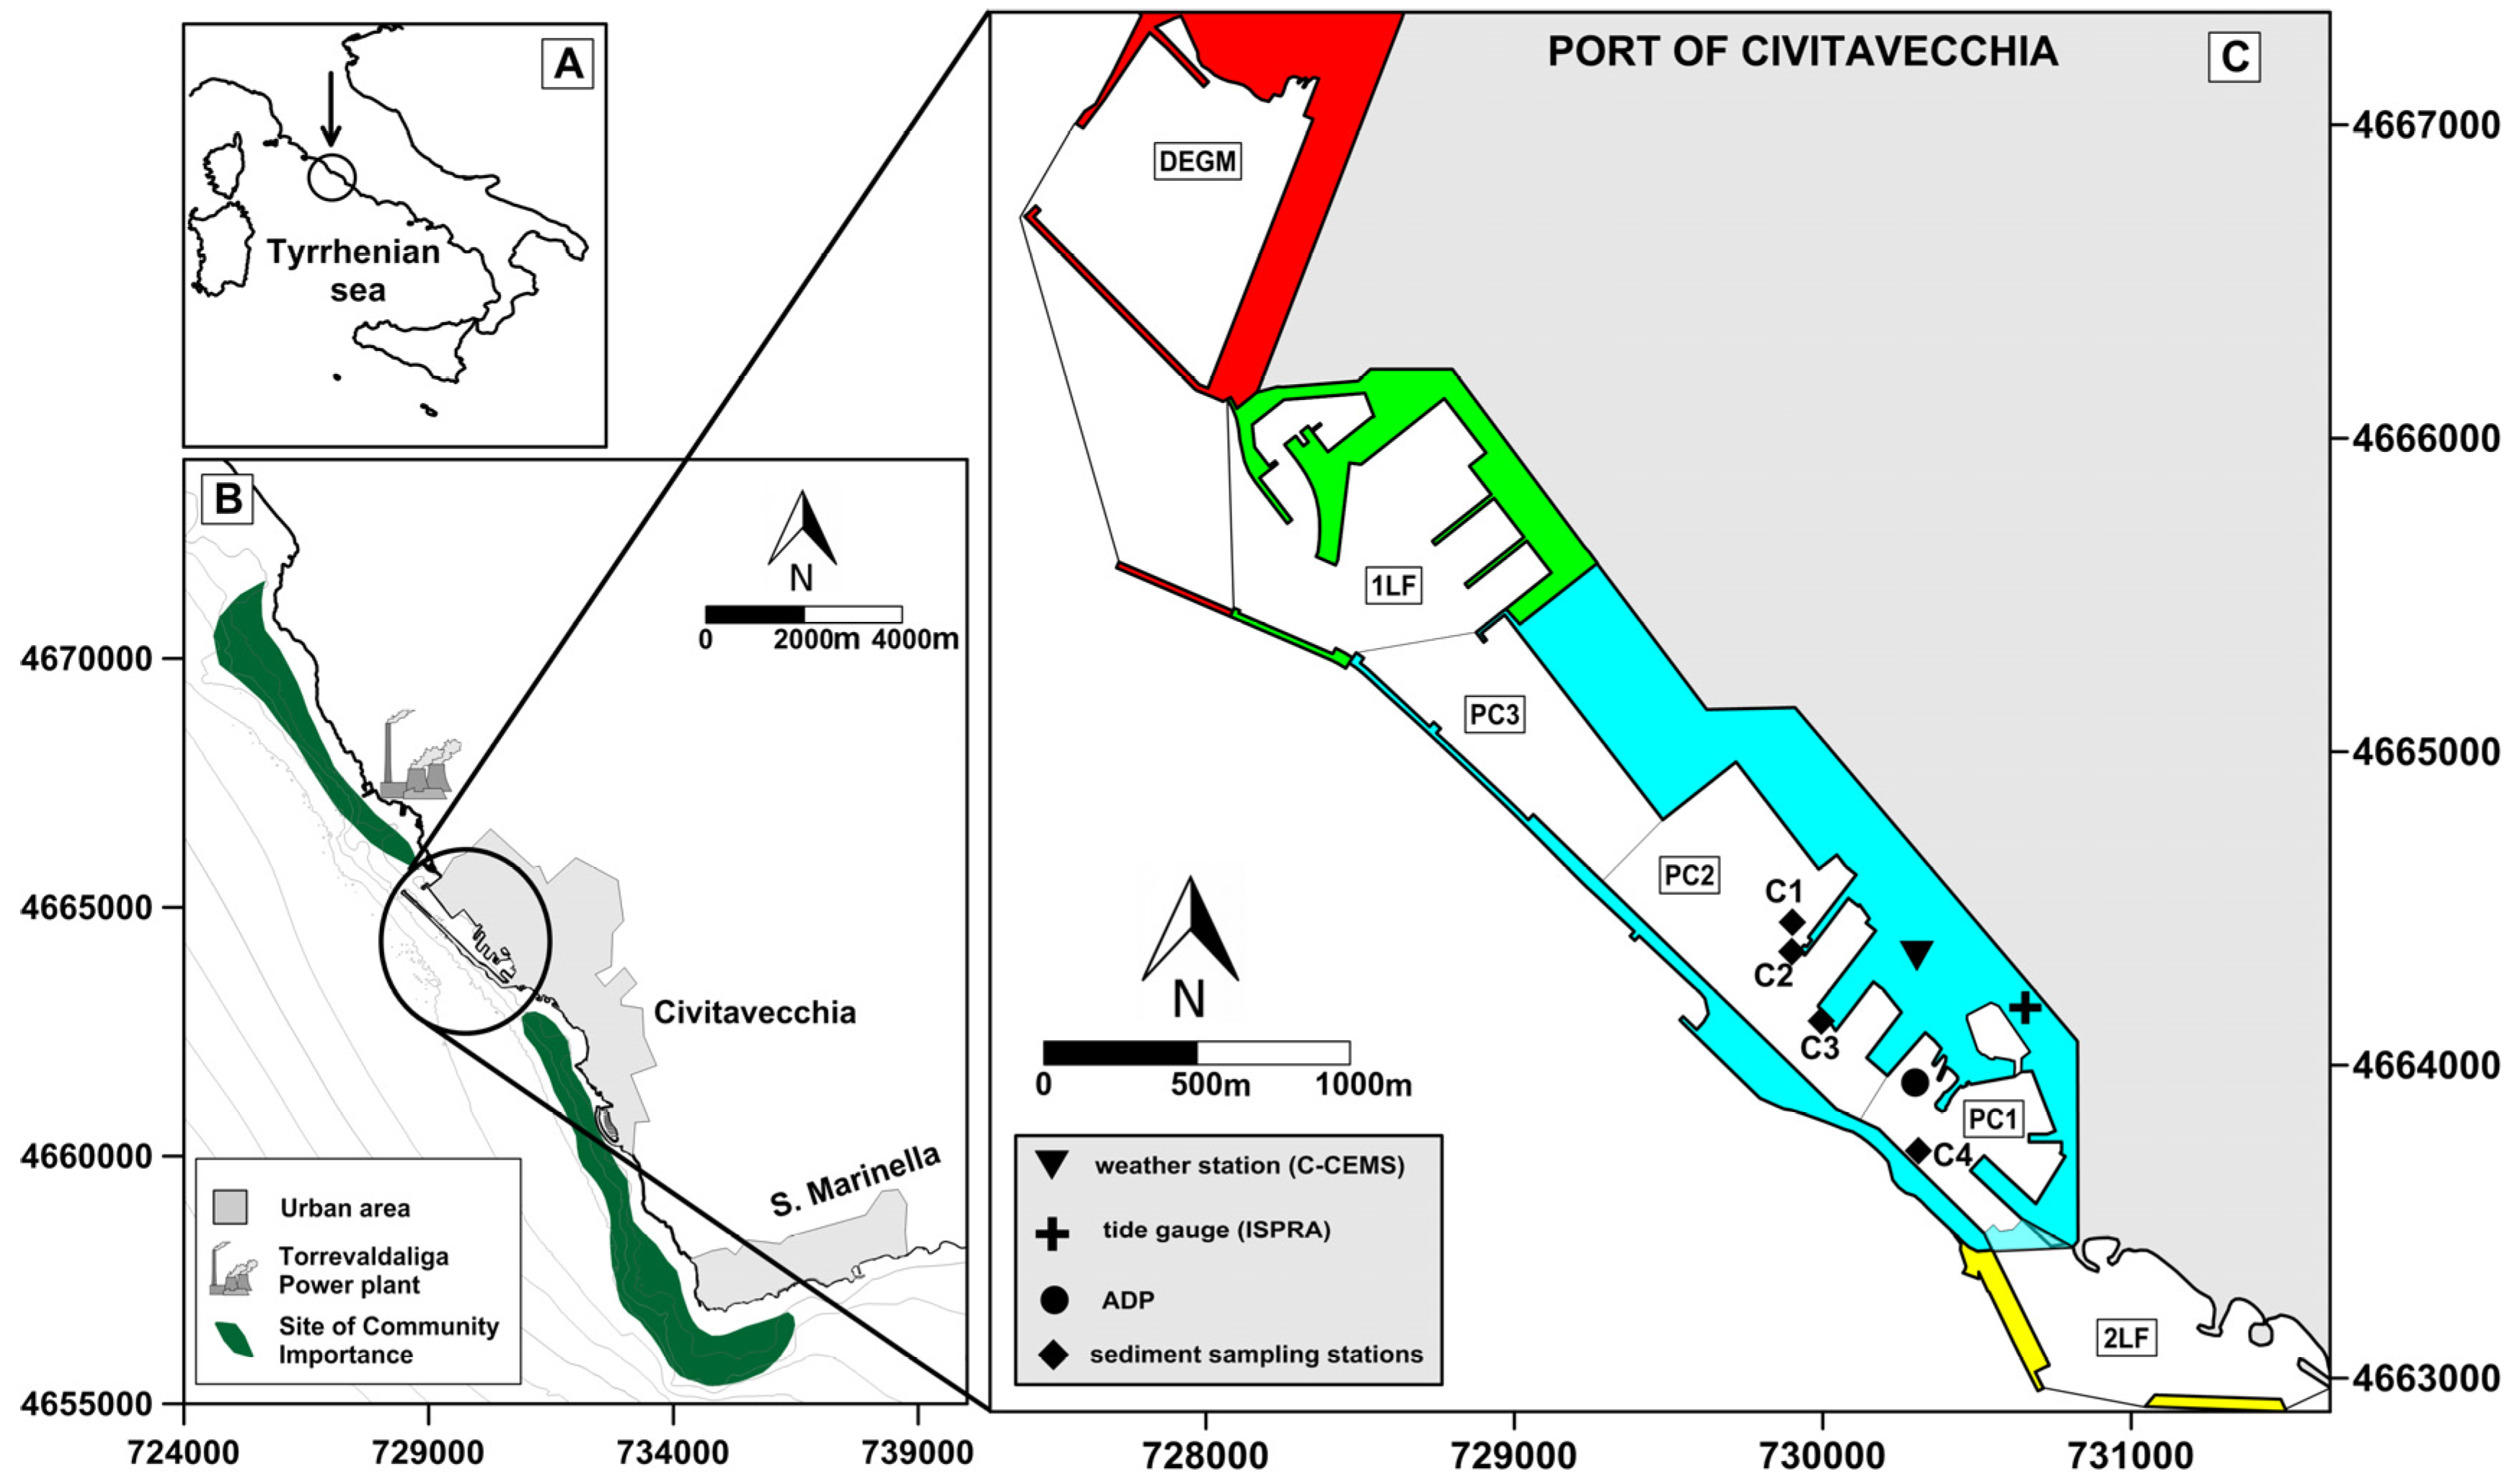
Civitavecchia harbour basin is located on the central western coast of Italy in the western Mediterranean Sea, approximately 31 miles north of Rome (
Figure 1A).
Currently the harbour is 3.3 km in length and 550 m wide, and it has an average depth of 15 m. Civitavecchia port lies along a longitudinal axis rotated approximately 135° from north. It is connected to the open sea via its north mouth that causes a progressive decrease in the intensity of sea currents proceeding toward the southern part of the harbour basin [
10,
41]. Since 2005, the marine environment of Civitavecchia port is continuously monitored through the C-CEMS observational system (Civitavecchia Coastal Environment Monitoring System), which enables the analysis of coastal processes at a high spatial and temporal resolution [
42]. The observing system includes different components such as fixed stations, in situ surveys, satellite observations and numerical models. The components interact between them to transfer data (by input and validation) from in situ and satellite observations to numerical models in order to predict the water quality within the harbour basin and the surrounding areas.
Civitavecchia port lies between two sites of community importance (SCIs) (
Figure 1B), established to protect habitats (
Posidoniaoceanica and reefs of rocky substrates and biogenic concretions) and species (
Pinna nobilis and
Coralliumrubrum) enclosed in attachments one and two of EU Directive 92/43/EEC [
43].
Thanks to the new Port Regulating Plan (PRP) developed in 2004, which approved the new harbour infrastructure, the Port of Civitavecchia has increased its commercial traffic and now welcomes a total of two million tons of bulk goods each year. Thanks to the construction of new docks, the flow of tourists has been boosted, and the Port of Civitavecchia led Mediterranean cruise traffic in 2011 with more than 2.6 million passengers per year (considering the data provided by booking.com).
Figure 1C shows the port configuration prior to PRP approval (light blue area) and the new projects that will be realized in the following order: first lot of strategic works (1LF in green), dock energetic great masses (DEGM in red) and second lot of strategic works (2LF in yellow ). In this study, the infrastructure and the surrounding water basin are treated as a single module. The past configuration (PC) module can be divided into three sub-areas: PC3 (northern zone) for cruise ship docking, PC2 (central zone) for passengers and cargo ship docking, and PC1 (southern area) arranged for rescue, general services and recreation vessels.
The other modules concern the new infrastructure of the PRP, realized or in phases of preparation. In particular, the 1LF module concerns the Cristoforo Colombo embankment extension, ferries and service dock realization, which was completed by the end of 2016. The DEGM module primarily refers to the realization of a docking basin between the Port of Civitavecchia and the Torrevaldaliga plant station, dedicated to an oil products and container terminal.
It is worth noting that the 1LF and DEGM projects produced an embankment extension with an increase in the harbour basin size and related to the port entrance to the north. For this reason, 2LF was designed to create a new mouth in the southern part of the port, which will allow yachting, rescue and service vessels to directly access PC1 module.
2.2. Samples and Data Collection
Meteo-marine conditions in the study area have been analysed using data collected by the weather station of the Civitavecchia Port Authority (
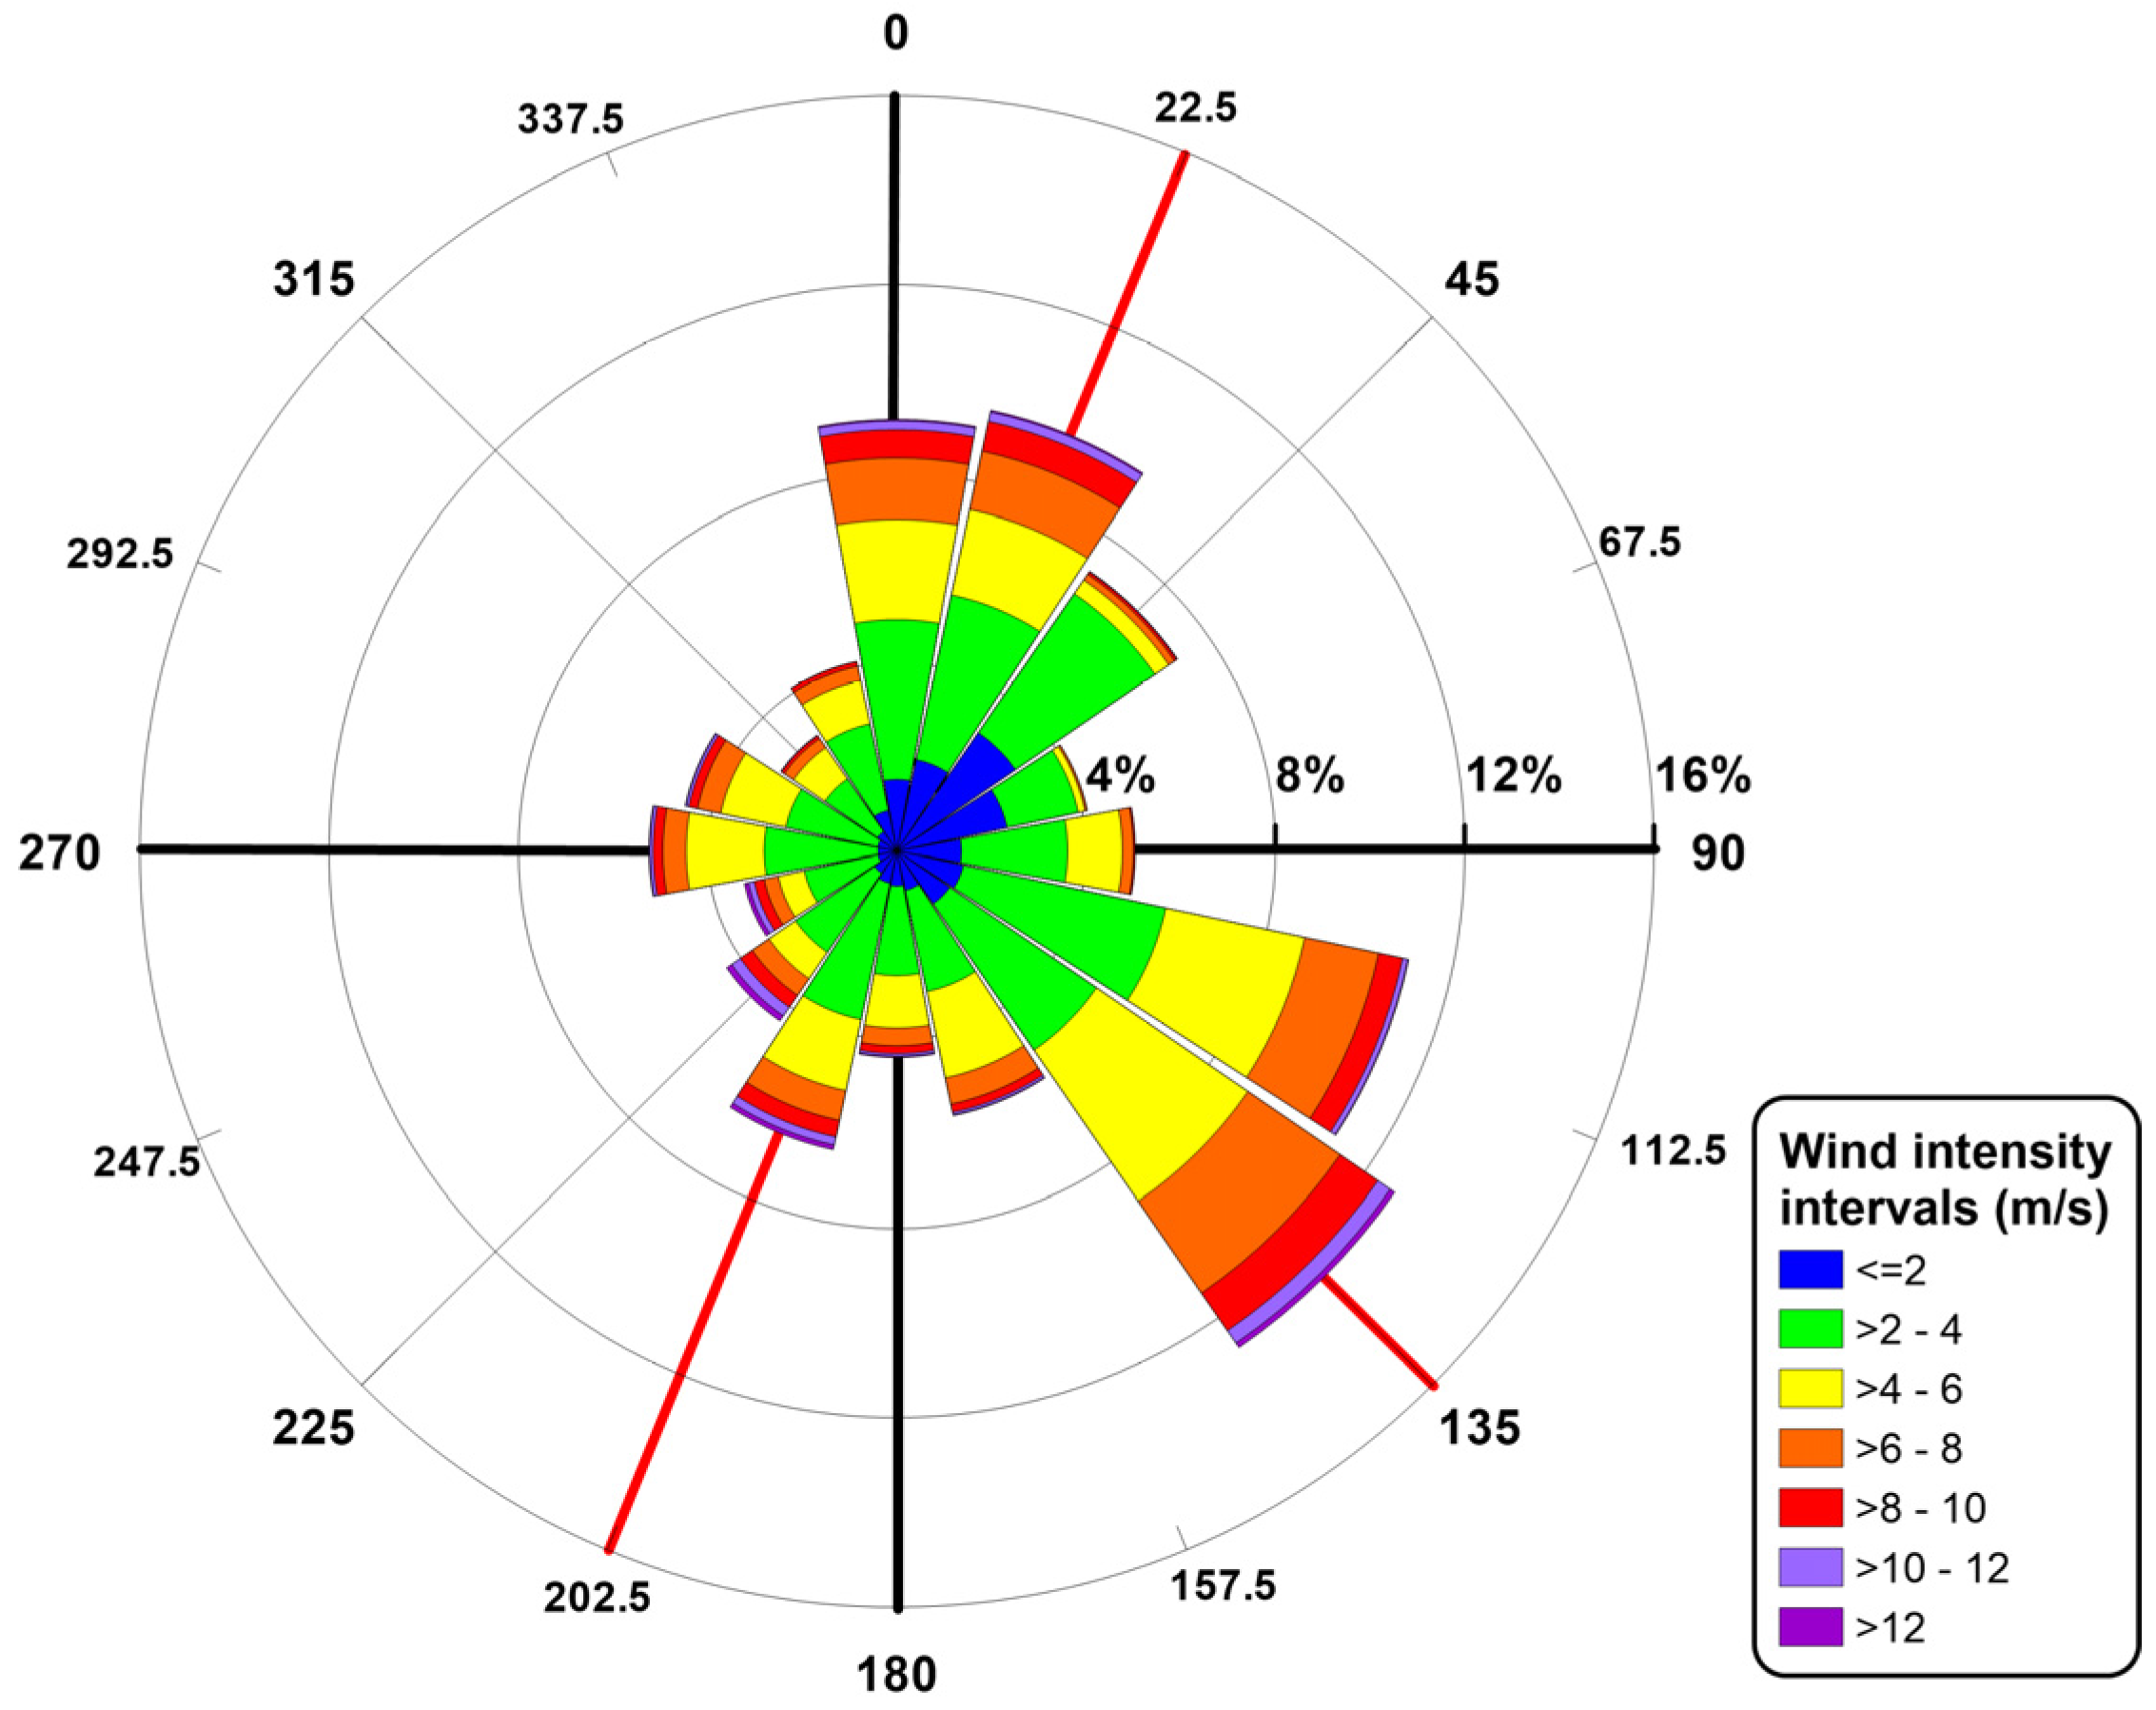
Figure 1C). This station is included in the C-CEMS and measures air temperature and pressure, relative humidity, solar radiation, rainfall, wind speed and direction, with a time resolution of 10 min. The analysis of wind data reported in
Figure 2 (over the temporal interval between 2008 and 2017) shows that prevailing wind events derive from the southeast (mean annual occurrence of 13%) and from the northeast (mean annual occurrence of 10%). The maximum wind speed recorded by the weather station was derived 135° from north and was about 20 m/s. The second and third quadrants show events with low mean annual occurrence (<5%) and high wind speed values (>18 m/s) only in the southwest direction.
We calculated tidal forcing using level data collected by the Civitavecchia station (located within Civitavecchia harbour;
Figure 1C) belonging to the Italian Mareographic Network of the Institute for the Environmental Protection and Research (ISPRA). Standard harmonic analysis [
44] reveals that the semidiurnal component M2, with an amplitude of 0.1 m and a phase of 212.64°, is more significant than the other tidal constituents.
In order to analyse the water circulation within the port domain, the marine current velocity was recorded using an acoustic doppler profiler (ADP) between 24 October and 20 November 2013. This instrument was deployed on a Barnacle seafloor platform at a depth of approximately 10 m (
Figure 1C) to enable measurements of the sea current in the surface layer.
In order to efficiently remove the noise produced by the passage of ships in the proximity of the instrument and other local disturbances due to the harbour boundaries, the data collected by the ADP were filtered using a Gaussian function and then averaged over both depth and time.
To evaluate a possible relation between water renewal and trace metal pollution status, we collected surface sediments from four sampling stations within Civitavecchia harbour (
Figure 1C) prior to the realization of the projects included in the PRP. The surface layer (1 cm) of each sample was sub-sampled, homogenized and transported to the laboratory at 4 °C in polyethylene bags.
The extraction of Cd, Pb, As, Cu, Ni, Zi, Cr and Al from surface sediments was performed following the EPA (Environmental Protection Agency) 3051A:2007 [
45] and 6020A:2007 [
46] methods. In particular, 1 g of the sediment samples was weighed using an analytical scale and mineralized in a microwave system with a digestion solution prepared using 9 mL of 65% HNO
3 and 3 mL of 30% HCl. Finally, the analytical determination of the metals was performed using inductively coupled plasma—mass spectrometry (ICP-MS, Perkin Elmer, Waltham, MA, USA).
In order to evaluate the enrichment degree of the selected trace metals, the EF [
39,
40] was used. For EF calculation, trace metal concentrations were normalized with respect to a sample reference metal (such as Fe or Al). Fe and Al are considered to be proxies for the clay content [
47,
48]. As described by Woitke et al. [
49], Al was used for the normalization. EF is expressed as:
where (
Me/
Al)
Sample is the metal-to-Al ratio in the samples of interest and (
Me/
Al)
Background is the natural background value of the metal-to-Al ratio [
50].
In absence of data relating to the local trace metals background levels, the values used in this study were those reported in Turekian and Wedepohl [
51] for continental shale. We evaluated the heavy metal contamination using five categories [
52,
53] associated with the classes proposed in
Table 1.
2.3. Numerical Model Implementation
To calculate the spatial distribution of FT within the Civitavecchia port, we used DELF3D-FLOW, a multi-dimensional (two- or three-dimensional) hydrodynamic (and transport) simulation model that calculates non-steady flow and transport phenomena that result from tidal and meteorological forcing on a rectilinear or a curvilinear grid.
In this application, the flow is primarily forced by the tide at the open boundaries and wind stress at the free surface. The equilibrium tide is modelled by including it in the right-hand side of the momentum equations ([
25,
54]), in the tide generating potential terms
and
in
x e
y direction, respectively. In these terms g represents the gravity acceleration and
ζ is the water surface elevation above the reference datum. The wind stress is applied at the free surface and is included in the right-hand side of the momentum equations as
and
, where
ρ0 is the reference density of water, and
τx and
τy are wind shear stresses at surface in
x and
y direction, respectively. The magnitude of wind shear stress is determined by
, where
ρa is the density of air,
CD is the wind drag coefficient and
U10 is the wind speed at 10 m above the free surface. For the wind drag coefficient, variable values depending on the wind speed were used. Vertically integrated water circulation in the shallow harbour basin has been reproduced using a two-dimensional curvilinear grid. In this case, the use of a 2D hydrodynamic model does not significantly affect the circulation pattern in the study area, since vertical variations of temperature and salinity within Civitavecchia harbour are very small for most of the year. Therefore, in the first approximation, vertical stratification induced by density gradients was ignored. The curvilinear grid also makes it possible to obtain a higher resolution inside the harbour basin (up to 15 × 15 m) and a lower resolution in the other parts of the computational domain that extends 70 km from the coastal zone. In order to analyse the variations in the harbour dynamics due to new infrastructures, four different meshes were built to make them well suited to the following configuration hypotheses:
hp0, considering only the PC module and its PC1, PC2 and PC3 sub-modules;
hp1, taking into account the PC and 1LF modules;
hp2, considering the PC, 1LF and DEGM modules;
hp3, taking into account the PC, 1LF, DEGM and 2LF modules.
The grid cell number within the harbour basin ranges from 1054 in hp0 to 1937 in hp3.
The features of these computational grids are a good compromise between quality and computational cost, even if the grid resolution is not sufficient to reproduce the dynamic processes within the dock located to the southeast of the harbour (the width of the input channel is less than 15 m). To impose the along-shore water level gradient inside the rectangular model domain, we applied the Neumann condition on the cross-shore boundaries in combination with a water level boundary at the seaward margin. At the closed coastal boundaries, we assigned a free slip condition. Since small errors may occur near the boundaries, Civitavecchia port was positioned away from the sides of the model domain.
All of the simulations proposed in this work were carried out using a time step of 90 s, which is sufficient to meet the Courant condition. In order to damp out all of the noise that was introduced through the initial conditions, a spin-up time of 30 days was adopted.
The DELFT3D-FLOW model has been validated with the depth and daily averaged currents obtained by analysing the ADP data acquired within the harbour basin (see
Section 2.2). The model was fed with the wind speed and direction recorded by the C-CEMS weather station and the tidal component M2 was calculated via standard harmonic analysis [
44], using level data collected by the Civitavecchia station belonging to the Italian Mareographic Network (see
Section 2.2). We evaluated the model performance using the scatter index (SI), which gives a measure of the discrepancy between predicted (
p) and measured (
m) data [
55]. The
SI is given by:
To avoid strange values of SI associated with low means, the relative bias was normalized with a higher value between the root mean square of the data (rmsm) and the absolute value of the mean of the data ().
In order to estimate separately the tidal and wind contributions to the water circulation within the harbour basin, we carried out two numerical simulations applying the M2 astronomical component and the still-water level at the seaward boundary, respectively.
To analyse the transport of a passive tracer (c) within the harbour basin, we used the advection–dispersion equation. This equation is given as:
where
U and
V are the horizontal components of the current’s velocity in the
x and
y directions, respectively,
h is the water depth, and
Q is source or sink term per unit area. The horizontal diffusion coefficient
Kh is kept constant and was set equal to 0.05 m
2/s, as reported by Riddle and Lewis [
56] and Jounon et al. [
16].
2.4. FT and FEI Calculation
According to Cucco and Umgiesser [
18], FT can be estimated by simulating the transport and diffusion processes of an Eulerian conservative tracer uniformly released in the harbour basin, in which each grid element has an initial concentration equal to one. The tracer concentration decay is due to the exchanges between source area and the outer domain, where the tracer concentration is set to zero. FT is then calculated by applying the remanent function of the tracer concentration in each element of the computational domain [
19,
57] for the entire duration of the simulation. We note that the source area changes according to the different harbour configurations.
We calculated FT in 12 scenarios obtained by combining three of the most frequent meteo-marine events (
Table 2) and four subsequent developments of the Civitavecchia port (hereafter called the “configuration hypotheses”). It must be noted that the hypothesized scenarios are not intended to reproduce real situations; they are instead meant to improve our understanding of the mechanisms that affect water renewal in Civitavecchia harbour.
The weather conditions were selected by analysing the data acquired by the C-CEMS weather station (
Figure 2). These data revealed that the wind events with a high mean annual occurrence derived from the southeast (Scirocco), northeast (Grecale) and southwest (Libeccio). For each of the three directions, the wind speed was selected with an exceedance frequency of approximately 100 days per year in order to simulate the wind-induced circulation that occurred frequently [
21].
Table 2 lists the wind speed and direction of each weather condition considered in this study.
The semidiurnal component M2 was also included in each scenario.
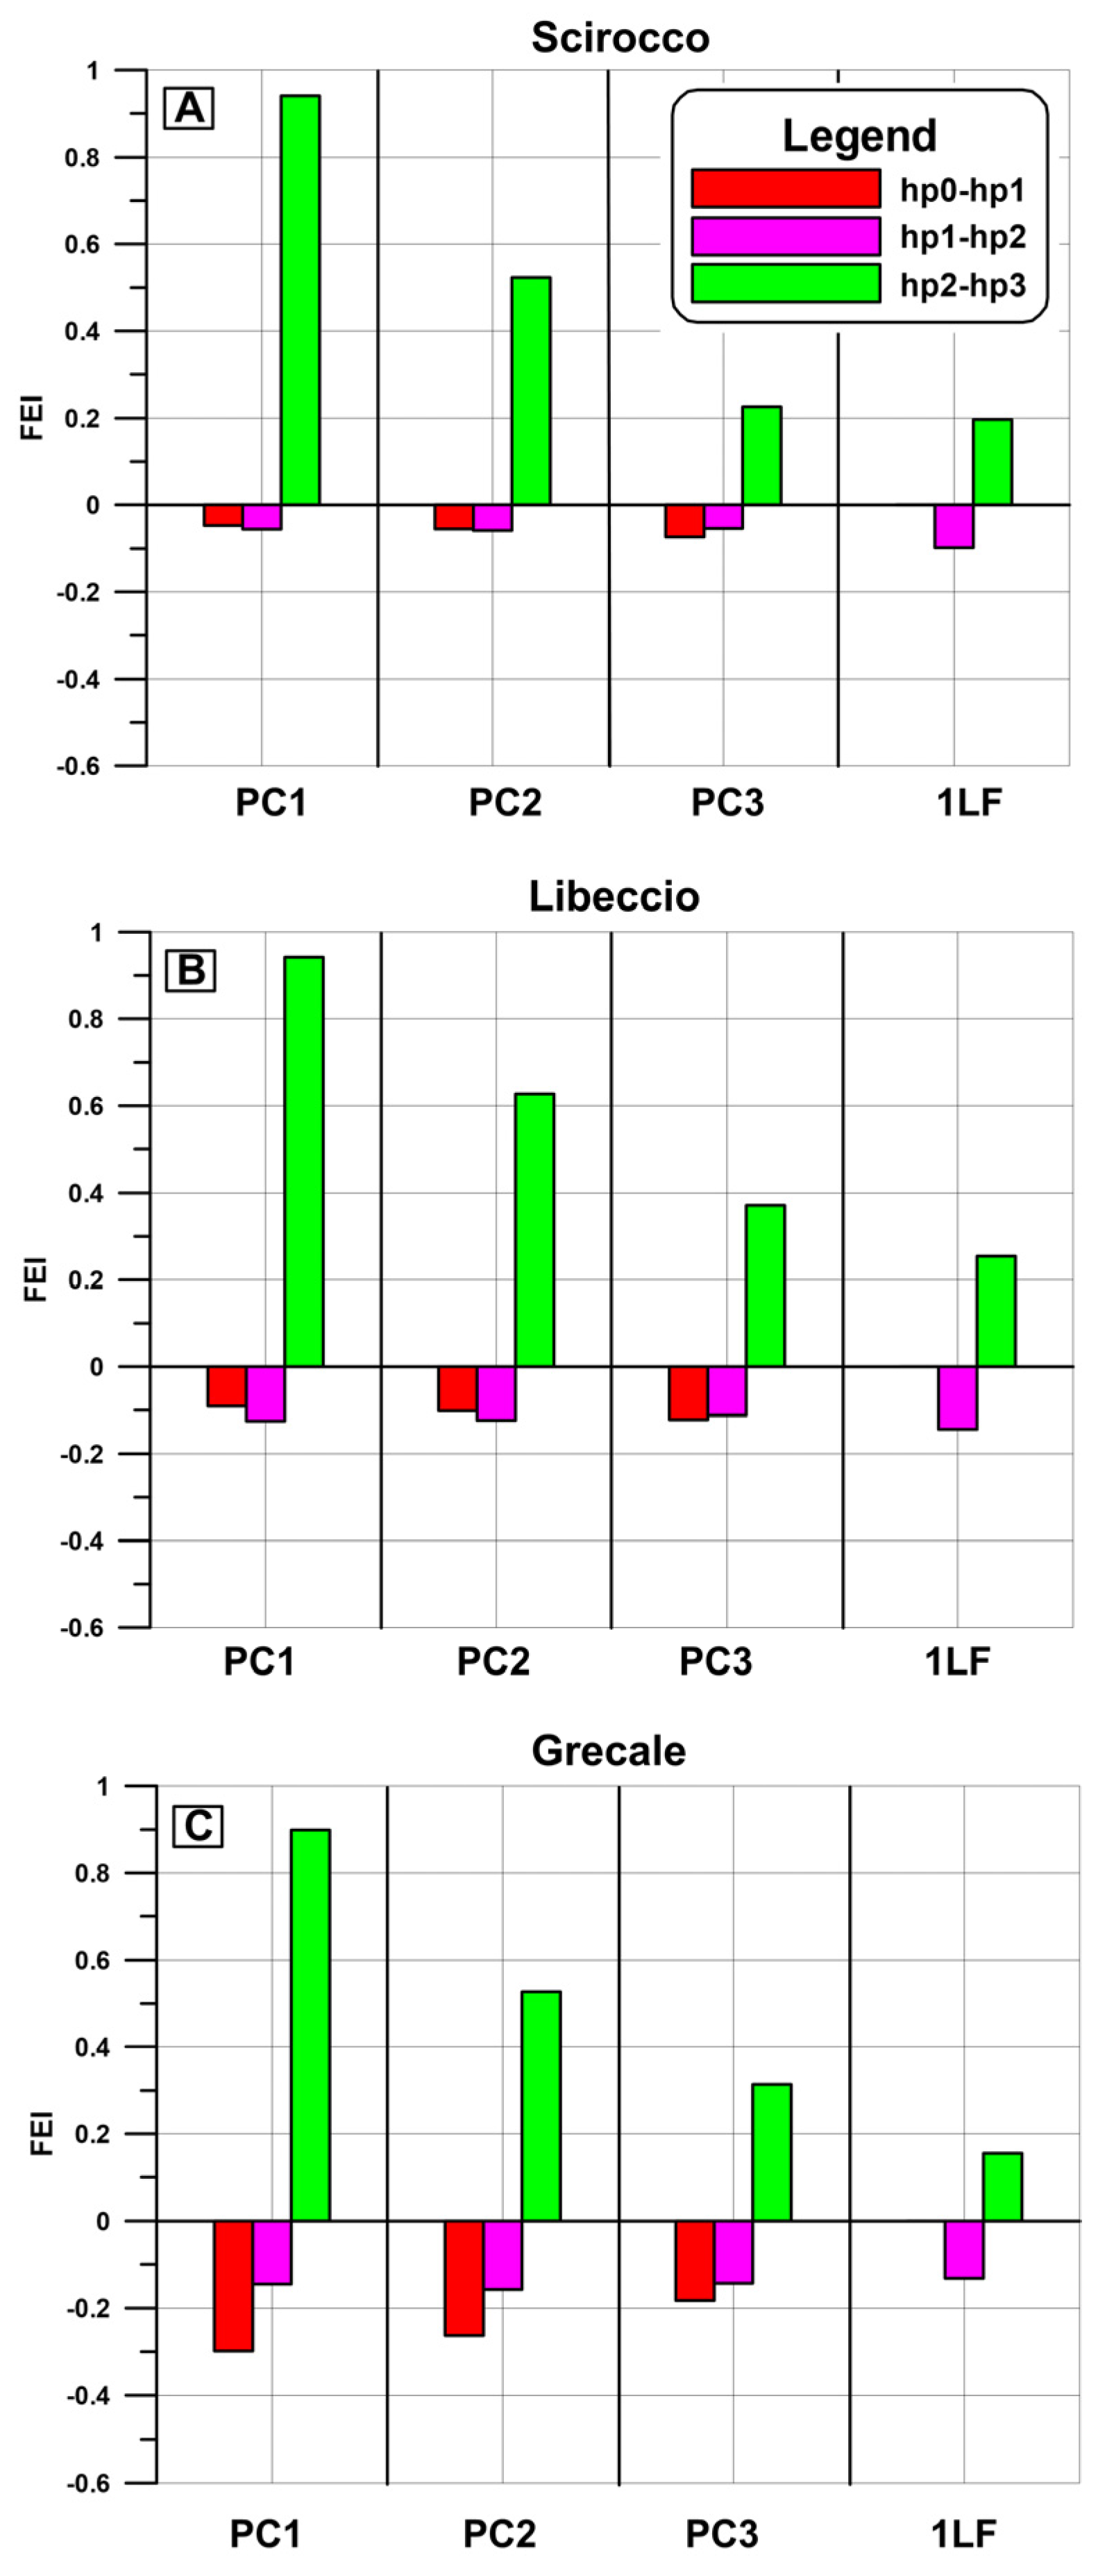
In each weather condition, the water renewal spatial discrepancy in the different harbour configurations was analysed based on the development of a new predictive index called FEI, which allows us to analyse the renewal water efficiency within an entire area affected by a structural change.
FEI is given by the following expression:
where <FT
bef − FT
aft> represents the mean value of the difference between the FT values calculated before and after a structural change within a specific module and max(FT
bef) is the maximum FT of its previous configuration.
In order to calculate FT differences point-by-point within each module, FT values were prior interpolated onto the same regular grid with a spatial interval of 15 m, equal to the minimum resolution used in the four meshes. The obtained results were averaged and then divided for the maximum value of FTbef. FEI calculation has been applied to those modules that are common to the four port configurations (PC1, PC2, PC3 and 1LF).
FEI can range between −1 and 1, where positive and negative values indicate an improvement and worsening of water quality conditions, respectively, compared with the previous harbour configuration. Moreover, FEI values near 0 imply that no significant changes occurred before and after the realization of the harbour projects.
3. Results
3.1. Model Validation
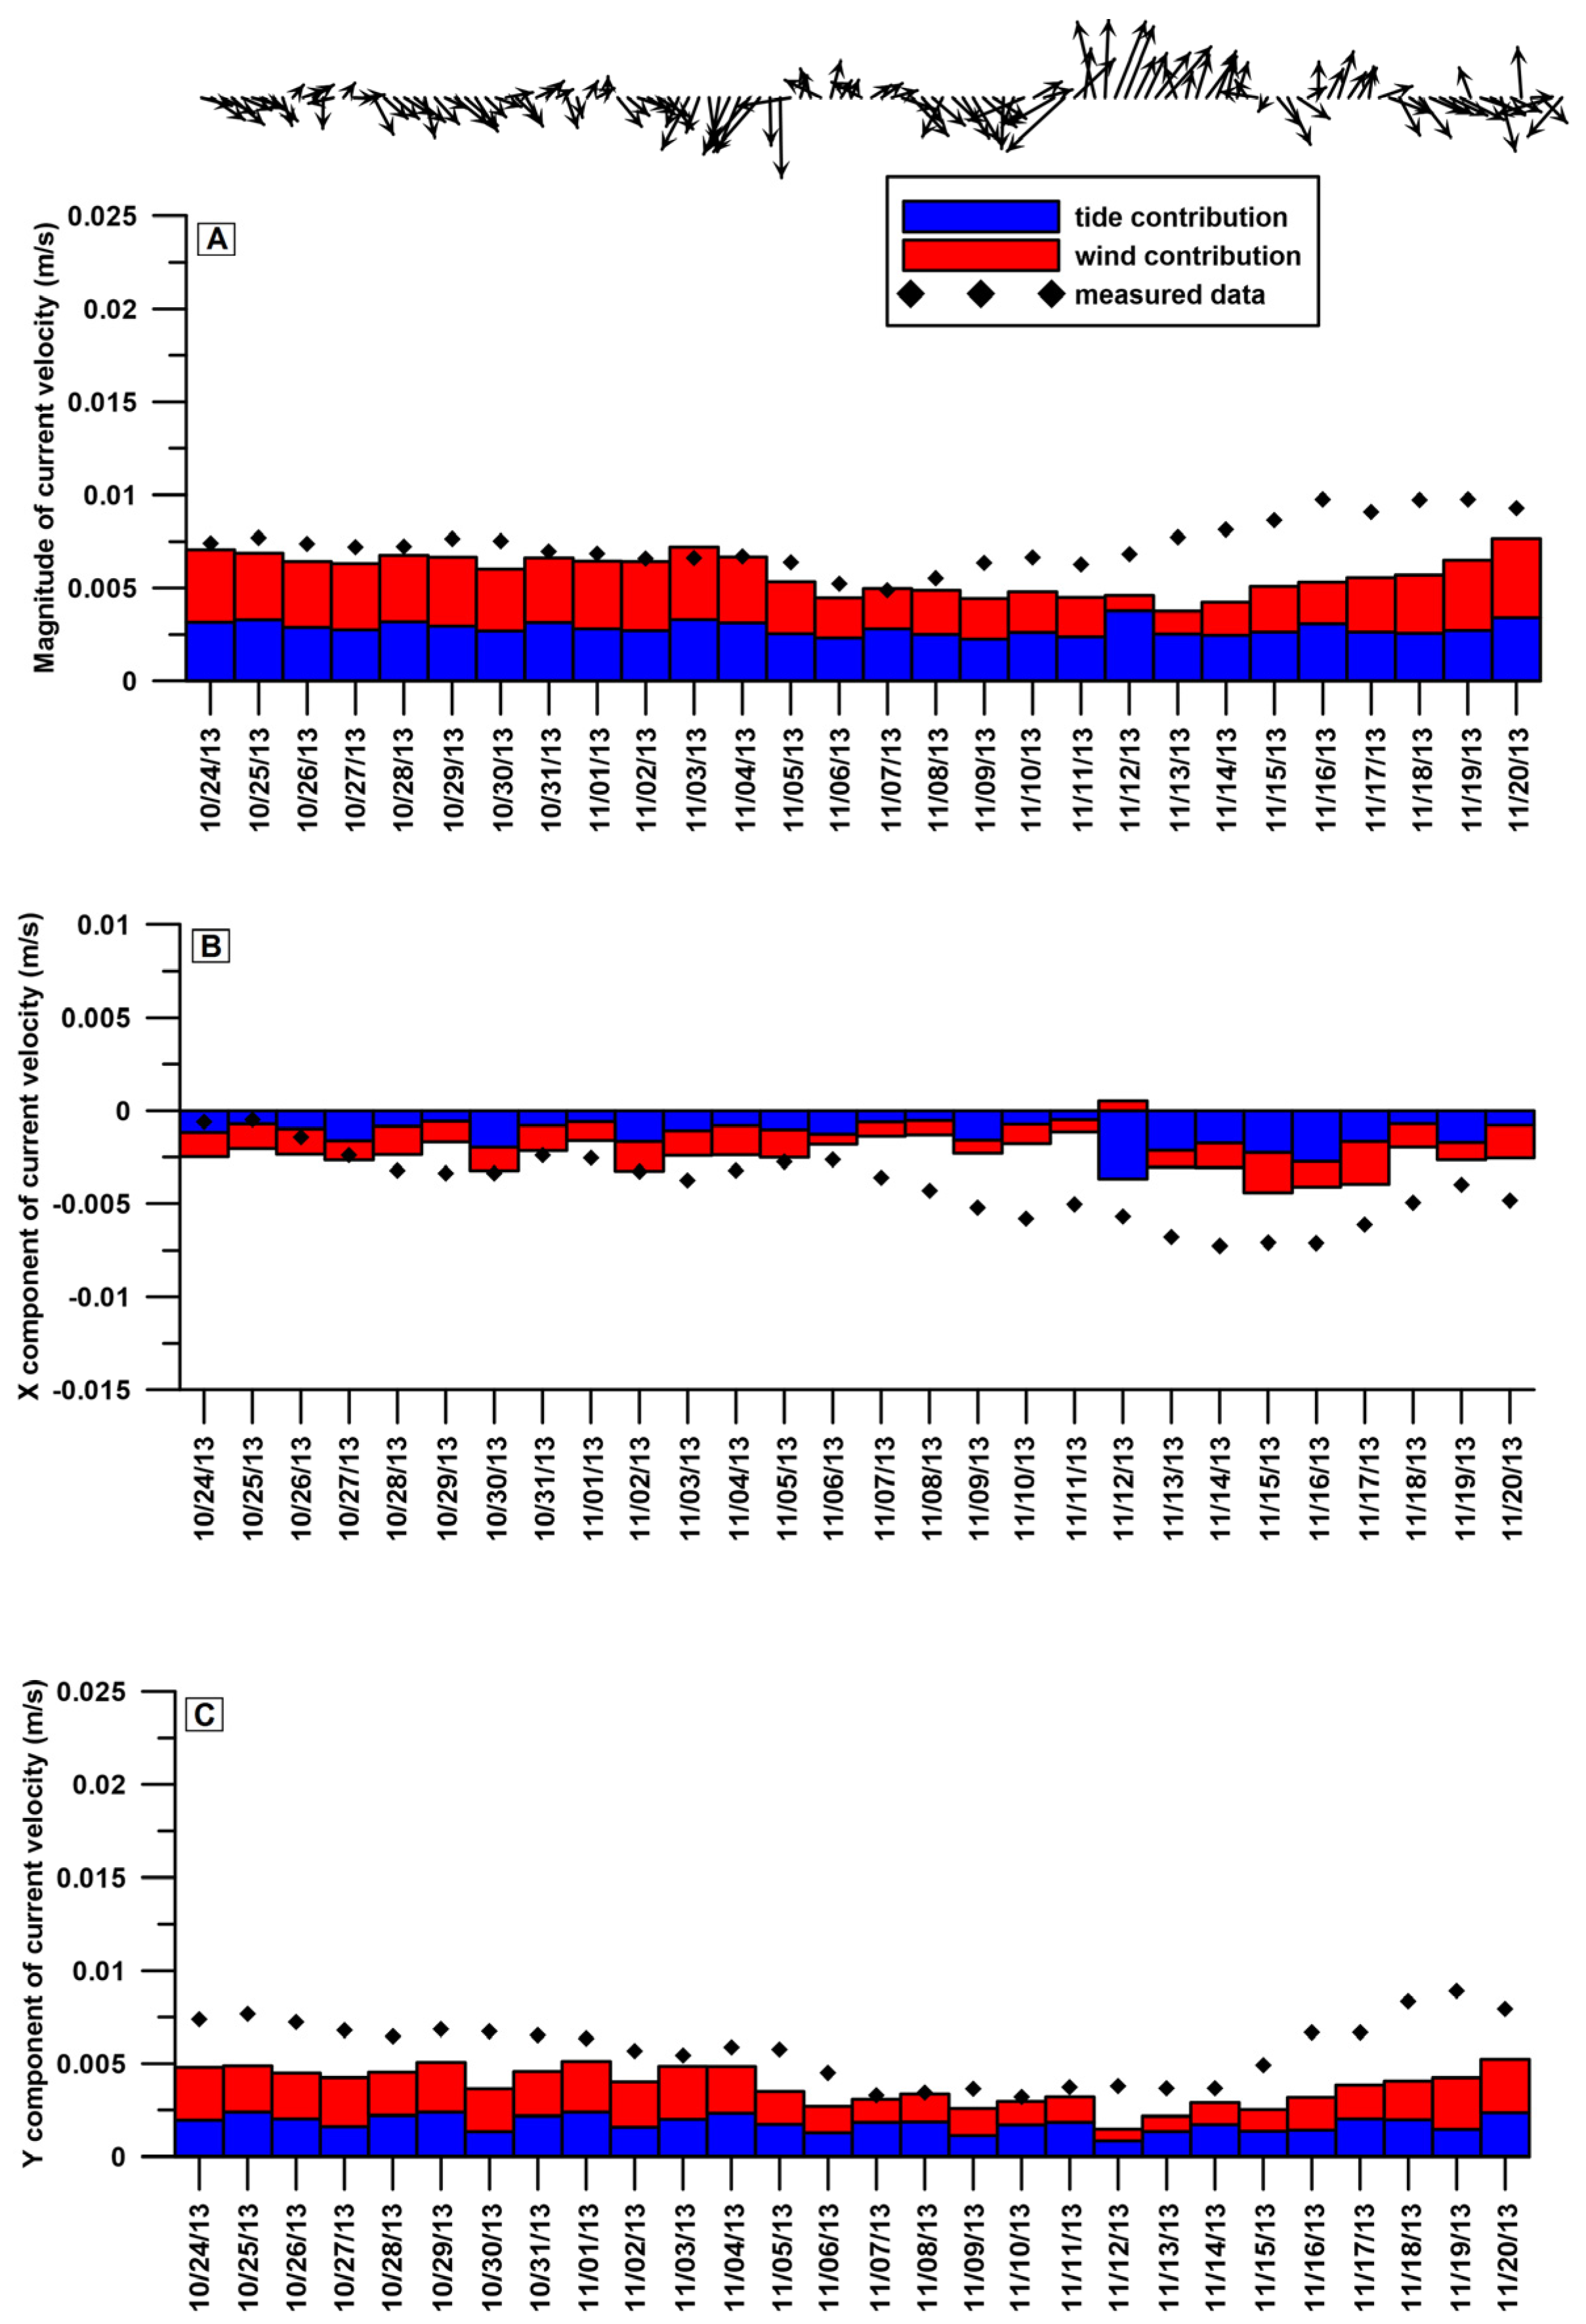
The DELFT3D-FLOW model, evaluated using the marine current velocity obtained from the analysis of the ADP data (
Figure 3), demonstrates good accuracy in reproducing the water circulation within the harbour domain (SI = 0.3805). The horizontal components of the velocity (
Vx and
Vy) exhibit higher SI of 0.5094 and 0.3809, respectively.
In particular, in the first part of the simulation period, the model did a good job at reproducing the velocity variation within the harbour domain. In the last part of the simulation period, we noted a significant discrepancy between the predicted and measured data.
Figure 3 shows the contribution of the wind (red bars) and tide (blue bars) on the water circulation within Civitavecchia port. Although the tide excursion was not very high, its effect was greater than that of wind, particularly when the study area was characterized by wind events coming from the southern quadrants. On the contrary, the contribution of the northern winds to the water circulation within the harbour basin was higher than that derived from the tide.
3.2. FT Distribution
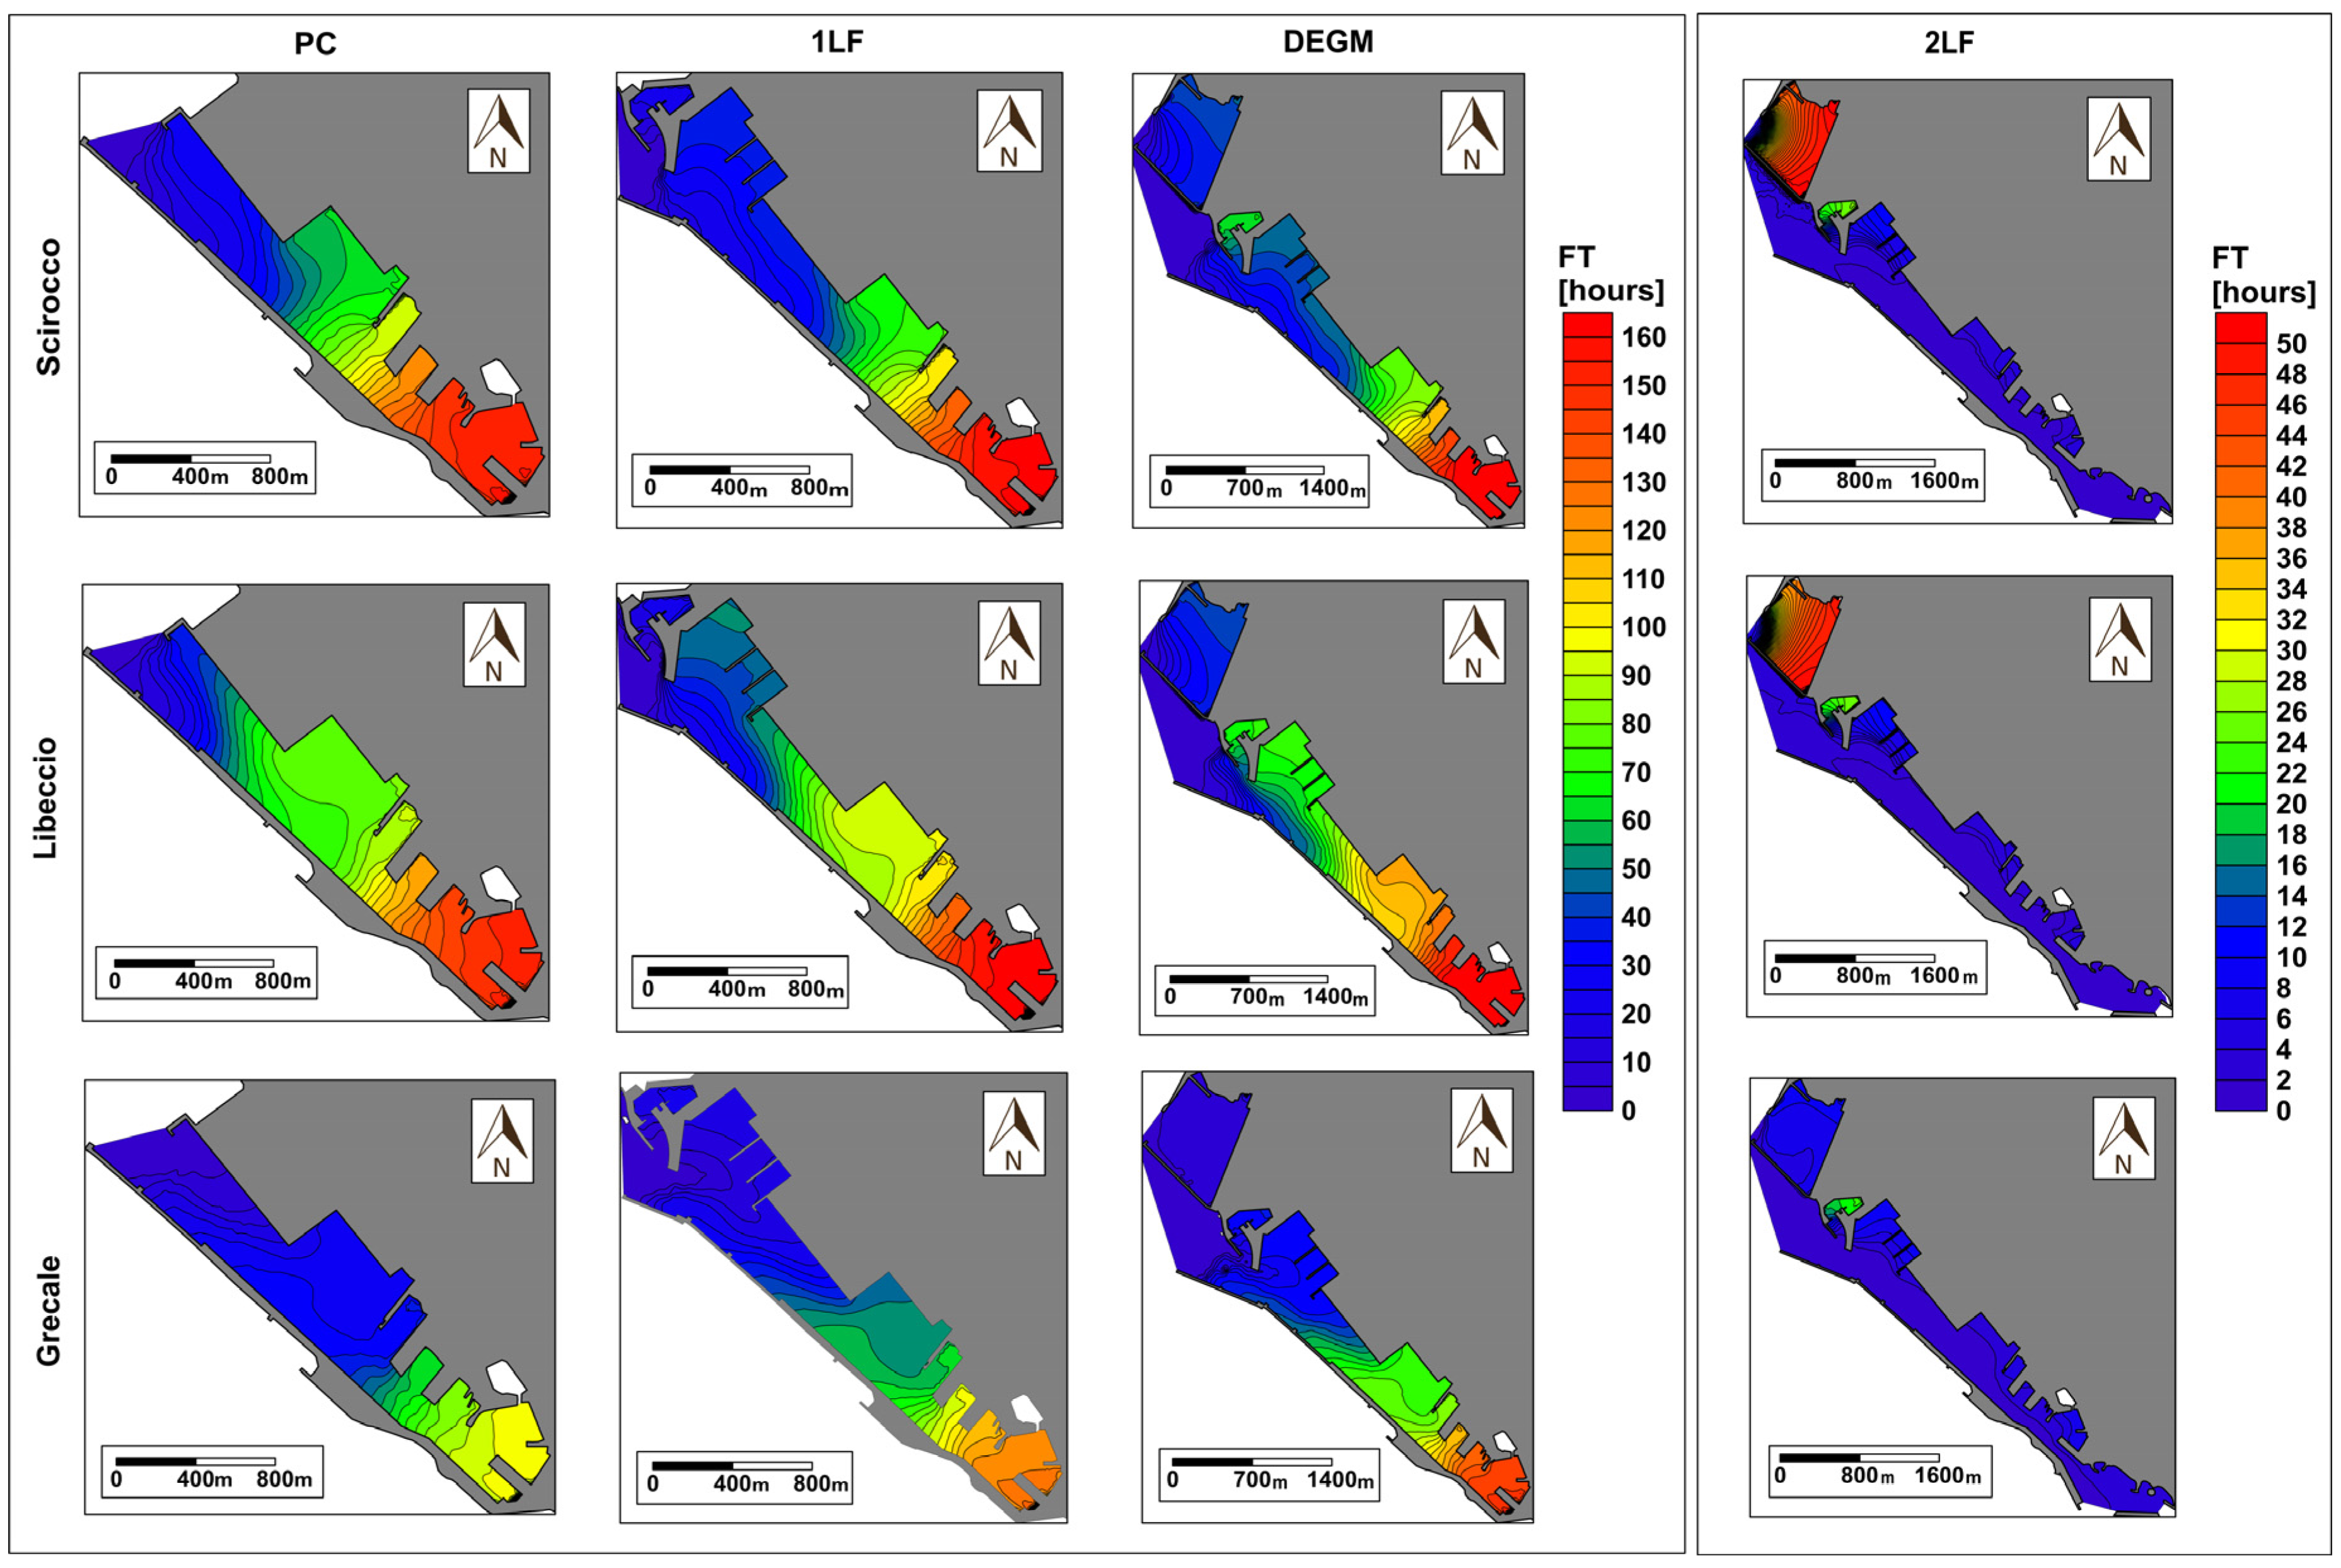
Figure 4 shows the spatial distribution of FT (expressed in hours) within Civitavecchia harbour calculated in different weather conditions (rows) and configuration hypotheses (columns).
In the configurations with the northern entrance (hp0, hp1 and hp2), the renewal time varies significantly along the harbour longitudinal axis, with values increasing toward PC1. The realization of the southern mouth (hp3) induces a more uniform distribution of FT, with higher values located within the 1LF and DEGM modules.
To quantitatively analyse the renewal time in the harbour basin, we estimated the mean FT and its standard deviation (
Table 3) in all the modules reported in
Figure 1.
In the hp0 configuration, the renewal time in PC1 ranged between 151.0 ± 5.1 h in the southeast condition and 91.7 ± 6.2 h in the northeast condition. The PC2 sub-module was characterized by high spatial variation in FT, with mean values of 35.3 ± 12.6 h during Grecale, 84.4 ± 15.3 h during Libeccio and 75.4 ± 12.6 h during Scirocco. The zone closest to the northern mouth (PC3) exhibited low FT with minimum and maximum values recorded in the northeast (11.8 ± 9.4 h) and southwest (34.1 ± 20.3 h) conditions, respectively.
The realization of 1LF projects (hp1) yielded an increase in the renewal time in the three areas of the PC module. In PC1, the FT data calculated during Libeccio and Scirocco were very similar (160.0 ± 10.6 h and 158.5 ± 5.3 h, respectively). The FT data were lower in northeast condition (121.5 ± 5.3 h). The PC2 and PC3 sub-modules demonstrated high FT in the southwest condition (100.1 ± 15.5 h and 52.9 ± 19.0 h) and low values during Grecale (61.6 ± 15.5 h and 30.1 ± 11.1 h). The same pattern was also found in 1LF, where the minimum and maximum values were 11.4 ± 6.9h and 30.1 ± 18.0h, respectively.
The presence of DEGM in the north of Civitavecchia port further increased the renewal time within the modules. In the inner part of the harbour basin (PC1), the FT was the highest of all configuration hypotheses, with values of 181.1 ± 6.8 h during Libeccio, 167.8 ± 5.5 h during Scirocco and 140.8 ± 5.6 h during Grecale. Furthermore, the PC2, PC3 and 1LF were characterized by renewal times longer than those calculated in the same modules in the other configurations, with minimum and maximum values found in the northeast and southwest conditions, respectively.
The southern mouth (hp3) induced a strong decrease in FT within the harbour domain, with the exception of the DEGM module, in which the renewal time was similar to that in the previous configuration (about 40 h for Libeccio and Scirocco and 9 h for Grecale). The presence of two harbour entrances produced a homogenous spatial distribution of FT in the PC module, with high values recorded in the northeast condition (2.4 ± 1.1 h) and low values during Libeccio (0.9 ± 0.7 h).
3.3. Trace Metal Analysis in Harbour Sediments
We analysed the degree of enrichment of Cd, Pb, As, Cu, Ni, Zi, and Cr of marine sediments within the Civitavecchia port using the EF (
Table 4). A high enrichment (EF > 40) of lead (59.1), arsenic (63.4) and zinc (44.7) was found in the C4 station located in the inner harbour area (PC1). Unlike other trace metals, arsenic also maintained high EF values (>20) in the stations included in the PC2 module (C1, C2 and C3). Nevertheless, the degree of enrichment of As, as well as other trace metals (with the exception of chromium), decreased from the PC1 module to the PC2 module. Among the stations located in the PC2 module, we noted that the EF values demonstrated small changes such that the data fell within the same enrichment class.
3.4. FEI Calculation
In order to evaluate the efficiency of water renewal between the different configuration hypotheses, we calculated the FEI in the PC and 1LF modules (
Figure 5). The DEGM was not considered because the successive changes in the harbour structures (2LF) did not significantly alter the values of FT within this area. The realization of the infrastructures connected to the 1LF (hp0 vs. hp1) and DEGM (hp1 vs. hp2) modules resulted in a worsening of water renewal within the harbour basin. This effect was particularly pronounced between the hp0 and hp1 configurations during the northeast condition, where FEI was approximately −0.29, −0.27 and −0.19 in PC1, PC2 and PC3, respectively. During Scirocco, the increase in the harbour size did not induce a significant degradation in water quality, since FEI was maintained slightly below zero. The presence of a southern mouth (hp3) resulted in a significant improvement in water renewal in all of the modules that we analysed. The highest values of FEI (>0.9) were attained in the inner part of Civitavecchia port (PC1) in the weather conditions proposed. The index decreased from the northern entrance, where low values (<0.3) occurred in the 1LF module during Grecale and Scirocco.
4. Discussion
Port basins can be considered as semi-enclosed areas constantly subjected to physical and chemical alterations due to anthropogenic activities that can degrade their water quality. In order to understand the potential water quality degradation within a harbour area, it is essential to comprehend the hydrodynamic behaviour of the system [
22].
In this study, the use of the DELFT3D-FLOW model allowed us to reproduce with good accuracy the hydrodynamic field within the harbour, as highlighted by the strong correlation of the model outputs with in situ ADP data. In particular, the model accuracy is higher when the northern wind occurs, as it is the primary forcing of water mass dynamics within the port. Conversely, the discrepancies observed in the last part of the validation period can be associated to the increase of tidal contribution to the water circulation that occurs when winds come from the south.
The FT calculation obtained using the DELFT3D-FLOW water circulation allowed us to evaluate the potential degradation of water quality linked to the forthcoming projects scheduled by the management plan of Civitavecchia port. To analyse the water renewal variation, the most frequent winds (Scirocco, Libeccio and Grecale) were used as forcing conditions in four configuration hypotheses: the port structure prior to PRP approval (hp0) and the changes proposed in the first lot of strategic works (hp1), dock energetic great masses (hp2) and the second lot of strategic works (hp3) projects. The simulation results showed a strong north–south gradient in all of the configurations, except for hp3, which will involve a new mouth in the southern part of the port. In all of the configurations with a single entrance, the innermost part of the harbour (PC1) was characterized by the highest FT values. These values can lead to high risk levels of water degradation due to the accumulation of pollutants, both in seawater and sediments [
22]. This unfavourable condition is particularly enhanced by the expansion of the port analysed in the hp2 configuration, confirming that the harbour basin size has a significant impact on the renewal of water masses within a harbour domain. The weather condition that resulted in the highest FT values in hp2 was Libeccio (~180 h), followed by Scirocco (~170 h). Conversely, Grecale wind favoured a more rapid exchange of water (~40 h) by inducing higher current speeds in the harbour basin. These values are in agreement with those calculated for the dimensionally analogous Terragona (~40 h [
58]) and Bilbao (~20 h [
23]) ports, although different forcing conditions were considered in those simulations. The FT values for Civitavecchia harbour are also comparable to those of the Augusta and Barcelona harbours (~300 h), calculated using the same criteria in the choice of weather conditions, but differing in size (roughly twice that of Civitavecchia port). As noted above, the realization of the southern entrance (hp3) strongly decreased the renewal time within the port, favouring a more homogeneous distribution of FT. In this case, the northeast condition exhibited the highest FT, and the lowest FT values were found during Libeccio.
To confirm the relation between the renewal time and the water quality within harbour basins, we investigated the degree of enrichment of Cd, Pb, As, Cu, Ni, Zn, and Cr in the marine sediments in the area in which the maximum FT variation occurred (i.e., PC1 and PC2). The highest EF values of Pb, As and Zn in PC1 (EF > 40) corresponded to the highest values of FT found in that area and in those configurations with the only northern entrance (hp0, hp1 and hp2). It should also be noted that the EF difference observed between PC1 and PC2 for all of the trace metals (with the exception of chromium) was strictly related to the south–north decrease in FT values. As reported in the Common Implementation Strategy (CIS) guidelines [
13], this relation confirms that water renewal can be used as a proxy for the water quality in a harbour basin, and for the identification of the MEP and GEP in the HMWB.
The main novelty of this study was to quantify the changes in harbour water quality using the FEI index, which can take on negative values when structural modifications adversely affect the quality of harbour waters. Likewise, the FEI index can take on positive values when the changes in the port configuration result in an improvement of environmental conditions. The water quality of Civitavecchia port was subjected to degradation as we moved from the hp0 to hp1 and hp2 configurations, particularly during the northwest condition. This effect was due to an increase in the harbour basin size and the relocation of the entrance further north, which reduced the effects of the external currents on the inner harbour hydrodynamics. For this reason, the realization of a southern mouth (hp3) produced a net improvement in the water quality in the innermost area of the port, particularly during Libeccio and Scirocco conditions, in which the FEI values exceeded 0.9. In such conditions, the southern currents caused a pronounced increase in the intensity of water circulation within the port, allowing pollutants to leave the harbour basin within a shorter period of time. These results show that the presence of two mouths in Civitavecchia port produces a greater effect in enhancing water renewal than the contributions due to the forcing conditions and the harbour basin size. The extent of the improvement has therefore led to a substantial modification of the hydromorphological conditions of the port basin that may have produced a change in the typology of water body, from HMWB to “natural” waters. The realization of the southern mouth can be considered a mitigation action that facilitates the achievement of GES/GEP.
In conclusion, the FEI index allowed us to select the best solution prior to the implementation of a project that involved a significant structural change (e.g., breakwater extension, the construction of new docks, realization of new entrances, etc.). The proposed approach enables port managers to adopt sustainable strategies for harbour management consistent with WFD and MSP objectives. Our approach also makes it possible to analyse and prevent the dynamic conditions that could lead to a decrease in water quality.
5. Conclusions
Achieving GEP, as well as ensuring the ability to analyse user–environment conflicts, are the primary challenges of WFD and MSP directives and therefore the main tasks of port managers for the sustainable management of port basins and surrounding areas. To fulfil these tasks, port managers must have the proper tools to monitor the quality of seawater that can be compromised by the numerous activities taking place within the harbour. The deterioration of water quality is one of the primary environmental problems within a port since this process is often linked to the significant accumulation of pollutants in seawater and sediments. For this reason, a detailed understanding of water renewal time is critical. The high spatial resolution of FT distribution attained with numerical models made it possible to implement WFD for these specific water bodies (HMWB), optimizing sediment and water samplings for a more suitable evaluation of water quality conditions [
38]. The methodology developed in this study can also be applied to the sustainable management of other semi-enclosed basins, such as bathing areas, where the risk of water degradation from microbiological pollution is increasing due to the direct input of untreated wastewater and lower-circulation conditions due to the presence of coastal barriers [
25,
42,
59,
60].
Since the realization of new projects scheduled in PRP affects the water quality conditions within Civitavecchia port, the FEI was developed not only to quantitatively evaluate these effects but also to prevent the occurrence of potential user–environment conflicts. Its development represents a consistent implementation of the C-CEMS observing system, increasing the available products/services that support the European directives requirements, and the “building with nature” approach [
12].
This study provides a low-cost and predictive tool to correctly address the environmentally sustainable management of port activities, thereby contributing to the development of career opportunities in the blue economy, a goal of the “Blue Growth” and Bluemed initiatives.

 ,
, 


