Simulation of Infrastructure Options for Urban Water Management in Two Urban Catchments in Bogotá, Colombia
by
 , ,
, ,
Carlos Andrés Peña-Guzmán
1,2,* ,
,
Joaquín Melgarejo
2 ,
,
Inmaculada Lopez-Ortiz
2 and
Duvan Javier Mesa
3 1
Environmental Engineering Program, Universidad Autónoma de Colombia, Bogotá 111711, Colombia
2
Institute of Water and Environmental Sciences, Universidad de Alicante, San Vicente del Raspeig Route, S/n, 03690 Alicante, Spain
3
Environmental Engineering Program, Universidad Santo Tomas, Bogotá 110311, Colombia
*
Author to whom correspondence should be addressed.
Water 2017, 9(11), 858; https://doi.org/10.3390/w9110858
Submission received: 27 August 2017
/
Revised: 30 October 2017
/
Accepted: 1 November 2017
/
Published: 5 November 2017
(This article belongs to the Special Issue Urban Water Cycle Modelling and Management)
Abstract
:Urban areas are currently experiencing rapid growth, which brings with it increases in the population, the expansion of impervious surfaces, and an overall jump in the environmental and hydrological impact. To mitigate such an impact, different strategies proposed to tackle this problem often vary; for example, stormwater tanks, the reuse of wastewater and grey water, the installation of equipment to reduce water consumption, and education-based approaches. Consequently, this article presents the simulation and evaluation of implementing infrastructure options (stormwater harvesting, reuse of industrial waters, water-saving technology in residential sectors, and reuse of water from washing machines) for managing urban water in two urban catchments (Fucha and Tunjuelo) in Bogotá, Colombia, over three periods: baseline, 10 years, and 20 years. The simulation was performed using the software Urban Volume Quality (UVQ) and revealed a possible reduction in drinking water consumption of up to 47% for the Fucha Catchment and 40% for the Tunjuelo Catchment; with respect to wastewater, the reduction was up to 20% for the Fucha Catchment and 25% for the Tunjuelo Catchment. Lastly, two scenarios were evaluated in terms of potential savings related to water supply and sewage fees. The implementation of strategies 3 and 6 insofar as these two strategies impacted the hydric resources. Therefore, there would be a significant reduction in contaminant loads and notable economic benefits attributable to implementing these strategies.
1. Introduction
The world is witnessing fast-paced urban development. At present, urban areas account for more than half of the global population, and more than 500 cities are already home to one million people or more [1,2]. It is estimated that 60% of world’s population will inhabit such areas by 2025 [3].
In urban areas, water’s importance is hard to overstate; it is an essential resource for human and environmental well-being in a city. It should come as no surprise that Integrated Urban Water Management (IUWM) has taken on prominence internationally [4,5] given that it enables the definition of problems, identifies and determines solutions, and facilitates the implementation of these solutions [6]. Most efforts in this vein focus on new sources of water [7], wastewater reduction [8], the control of flooding caused by stormwater [9], effective treatment systems [10], and active participation by the different actors in the urban water cycle (users, government, etc.) [11].
Several strategies for urban water management have been proposed, including structural and nonstructural actions. These actions have been applied to different scales, from regions, cities, towns, and neighborhoods to houses, apartments, and independent properties, all of which contribute—to varying degrees—to the IUWM [12]. Some examples include: (i) harvesting stormwater; (ii) reusing greywater and wastewater; (iii) treating stormwater, wastewater, and greywater; (iv) runoff and contaminant reduction in stormwater via structural work (filters, artificial wetlands, porous pavement, etc.); (v) water-saving technology; and (vi) environmental education, among other proposals [13,14,15,16,17,18,19,20]. To evaluate the implementation or the selection of these options, software and mathematical models have been used, offering appropriate technical support to plan cities’ growth and sustainability.
Among the most frequently employed infrastructure options for smaller-scale alternatives are the use of rainwater, reuse of greywater, and water-saving devices. The collection of rainwater is a clear and direct strategy for the sustainability of the urban water cycle. It offers myriad benefits, including: reduced water demand (30–70%), less hydric stress, minimized contaminant loads, and flooding mitigation [21,22,23,24,25].
The use of greywater offers notable potential in light of the constant supply of this source, i.e., a high population density in cities leads to large volumes of greywater [26]. Water-saving devices, for their part, have been gaining traction due to their ease of implementation and affordability. These strategies have been studied across the globe with promising reductions in the consumption of drinking water, namely from 20% to 60% [27,28,29,30]. Combining these two strategies (greywater reuse and domestic water-saving systems) enhances the positive impact: Baskaran et al. [31] found savings of up to 77% relative to normal consumption. It is important to mention that these strategies entail benefits from an economic standpoint for cities, regions, and countries, as well as individuals.
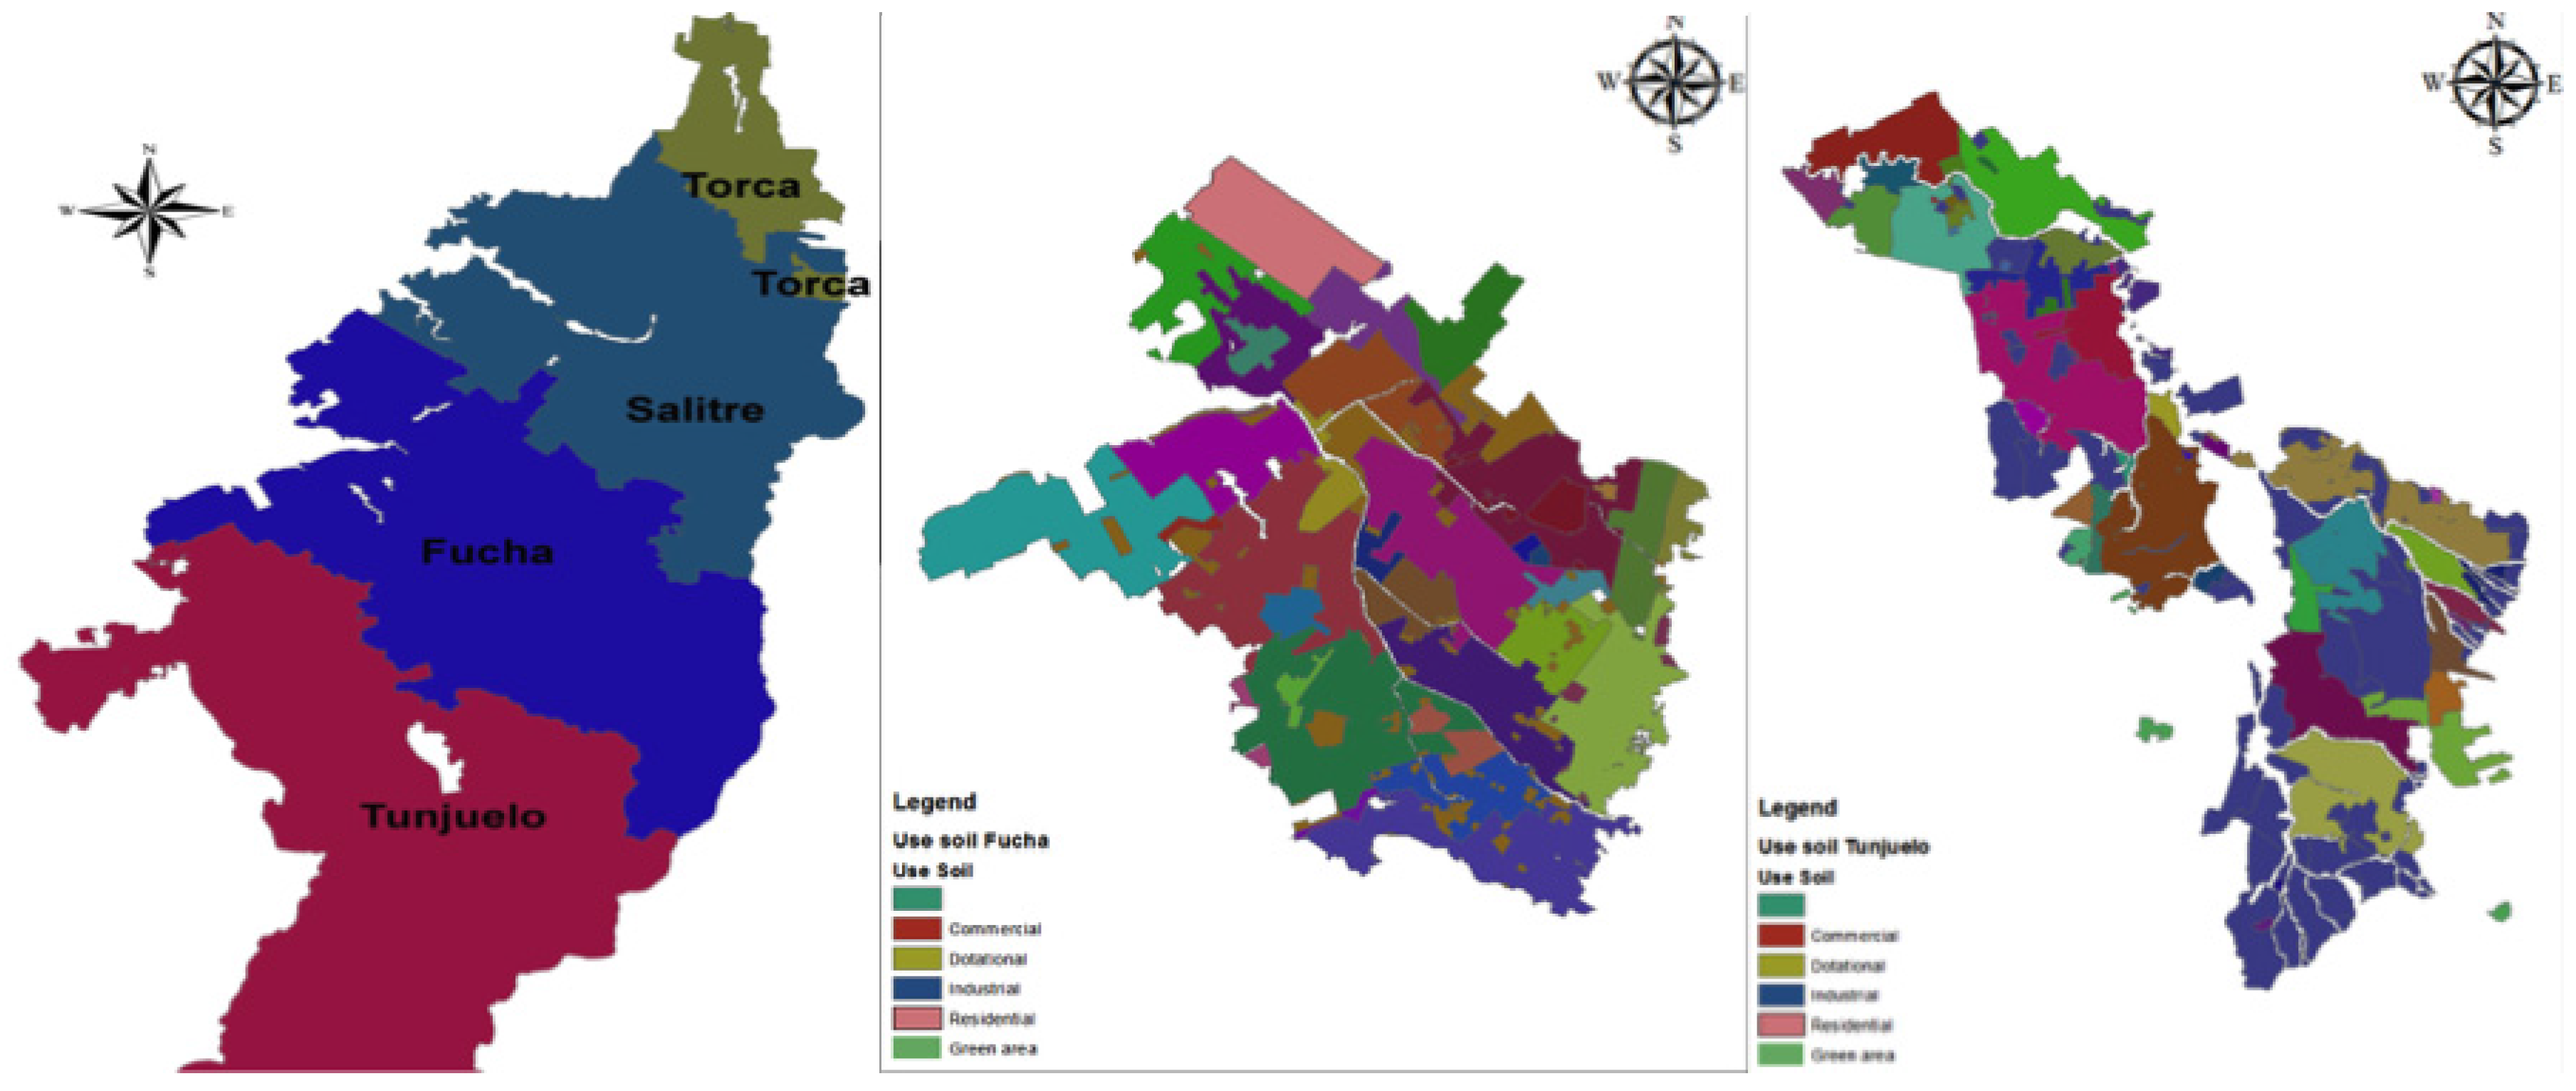
Bogotá, Colombia’s capital and largest urban center, has more than eight million inhabitants and essentially requires the implementation of such strategies. The treatment of water for human consumption in the city is led by a public company whose primary sources are rivers, dams, and gullies; the company has achieved full (100%) coverage. The drinking water supply comprises three systems (Tibitoc, Chingaza, and La Regadera), which have five drinking water treatment plants (DWTP) and present an installed capacity of 27.5 m3/s, of which 53% is used. Groundwater represents an insignificant source and is mostly used by industrial and commercial sectors. The city’s public sewage system has achieved coverage exceeding 90%. This system comprises four sanitary catchments, as can be observed in Figure 1; these catchments bear the names of the four principal rivers in Bogotá: Torca, Salitre, Fucha, and Tunjuelo. Within these catchments, there are a total of 65 subcatchments, which are subdivided into 49 sanitary subcatchments and 16 rain subcatchments. Most of the sanitary systems are separated, with only a small portion in the Fucha and Salitre Catchments [32]. Bogotá currently has only one wastewater treatment plant (El Salitre), which is located at the confluence of the Salitre River with the Bogotá River. At present, the El Salitre plant only runs primary treatment and has a treatment capacity of 4 m3/s. It receives wastewater from approximately 2,200,000 people in the north of the city, the area circumscribed by the Salitre Catchment.
It is important to mention that in Colombia, as is the case for many countries around the world, clear policies for urban water management have not been set forth; for that reason, in a previous study, the authors of this paper underscored the urgent need to carry out activities aimed at conserving water to sustainably supply Bogotá’s population. The previous study highlighted alternative sources of water supply, and the authors demonstrated that renewed emphasis should be placed on managing the city’s drainage systems and treatment systems, primarily to reduce wastewater, contamination, and runoff. These three aspects should be considered holistically, that is, in tandem, for the design of policies for the management of urban water in line with the principles of IUWM [33].
In this article, the simulated implementation of four strategies (stormwater harvesting, reuse of industrial waters, water-saving technology in residential sectors, and reuse of water from washing machines) for managing urban water in two urban catchments (Fucha and Tunjuelo) are evaluated at three periods: baseline, 10 years, and 20 years. This simulation was done using Urban Volume Quality (UVQ) software. In addition, two scenarios are assessed and compared in terms of potential savings related to water supply and sewage fees.
2. Materials and Methods
2.1. Location
Only the Fucha and Tunjuelo catchments were evaluated, for they account for 50% of Bogotá’s population, which is a sufficient sample size for the purposes of the present article. The Fucha Catchment has a total area of 14,024.61 ha for wastewater and 3824.67 ha for stormwater. This catchment has the highest area of industrial
development in the city, including dry cleaners, tanneries, food-related businesses, metal-mechanic companies, and chemical companies. Also, this catchment’s eastern end has a combined sewage system, with a total coverage of 40.5 km2. The Tunjuelo Catchment is predominately rural (agriculture use), thus serving mostly residences, with some industrial and commercial sectors. Furthermore, this is the only completely separate sanitary catchment in Bogotá. Its total coverage area is 21,956.69 ha for wastewater and 62,606.85 ha for stormwater. Figure 1 shows the dominant land use of the Fucha and Tunjuelo Catchments (these uses will be employed as inputs for the software on the movement of water flows).
2.2. Urban Volume and Quality (UVQ)
The UVQ software program is an extension of Aquacycle, another software program; UVQ was initially developed as support for the evaluation of alternatives in the management of the urban water cycle in Australia within the feasibility stage of the CSIRO urban water program, which began in the year 1999 [34]. Subsequently, it became part of the fifth European-Australian Assessing and Improving Sustainability of Urban Water Resources and Systems (AISUWRS) project. The objective of this project was to evaluate and improve the sustainability of the urban groundwater resources by means of computer tools [35,36]. UVQ was selected for use in four cities globally, with detailed case studies available: Mt. Gambier (Australia), Doncaster (UK), Rastatt (Germany), and Ljubljana (Slovenia). As a management tool, UVQ has thus far generated a positive impact on urban water management [34,37,38,39].
This software sequentially simulates the water balances in the provision of drinking water, as well as the hydrological (precipitation, runoff, and evapotranspiration) and wastewater processes within the study areas. These balances are given as loops that traverse the entire system at a daily timescale. Spatially, UVQ relies on three different scales: single dwelling, neighborhood, and study area. Additionally, it has the capacity to simulate contaminants through the already-obtained water balances. Note that the model assumes no degradation or conversion of the contaminants during the different steps [34,40,41]. UVQ was chosen in light of the fact that it is a free tool, encompasses all components of the urban water cycle, and is suitable for expansive urban areas such as Bogotá.
2.3. Input Data
The input variables and their source are presented in Table 1.
Climate data were obtained from the Institute of Hydrology, Meteorology, and Environmental Studies (IDEAM per its name in Spanish). For this research, two stations were selected (one for each catchment). The stations selected had data for at least the last seven years. Model calibration was performed by trial and error for runoff, wastewater, and consumption values reported by the Aqueduct, Sewage, and Sanitation Company (EAAB per its name in Spanish), which was in charge of providing these services in the city of Bogotá for these two catchments in the year 2014. As a reference for calibration, the data with the best fit between simulated and reported values for each water flow were chosen. The model was validated with data from the second half of 2015 and the first half of 2016.
2.4. Scenarios
For the simulation, six scenarios were developed, as shown in Table 2. Each was run at three adopted points in time. The first time point reflects baseline conditions (2015–2016). The second represents forecast population growth after 10 years. The third forecasts population growth after 20 years. For the forecasts, historical rates of population growth for these catchments were used; these rates were calculated using a census administered by Bogotá’s mayoral office.
Rainwater was used given its immense potential as an alternative source in city with a climate such as Bogotá’s. Wastewater reuse was chosen as an alternative source because of the general need for treatment systems to control the contamination of this water. Lastly, greywater reuse and water-saving technology were chosen due to the fact that they represent affordable strategies for the residential sector.
The stormwater tank volumes for residential areas were calculated by looking at water use for toilets, dishwashers, sinks washbasins, and showers, and by accounting for infrastructure capacity, especially as pertains to areas for household and apartment building storage tanks. For industrial and commercial areas, tank volumes for stormwater and wastewater reuse were calculated based on water demand. These tank volumes represent average consumption, so a single volume was determined for each sector. For this purpose, the following equation, developed by Santos and Taveira-Pinto [45], was used:
2.5. Statistical Analysis
To evaluate the differences in water flows between the base scenario and the proposed scenarios, a nonparametric Wilcoxon statistical test was used. With this test, it was possible to assess the statistical significance, or lack thereof, of the observed (forecast) reductions. The test was performed using all values from each simulated neighborhood. For all statistical testing, significance was established using a 95% confidence interval (α = 0.05) [46].
2.6. Economic Evaluation
To conduct the economic evaluation, two strategies that would impact drinking water consumption and wastewater generation, respectively, were employed. The average consumption per user (residential, industrial, and commercial) for the year 2015 was determined. For the same period, fixed and base fees for water supply and sewage were obtained to determine the average costs of each. Subsequently, the forecast results for the implementation of either of the strategies were compared to average consumption. It is important to mention that, during this evaluation, only the cost of service was taken into account (i.e., the cost of infrastructure was excluded).
3. Results
Although results were obtained at a daily scale, they are presented here in m m3/s. The results show that the Fucha Catchment presented higher levels for all water flows relative to those obtained for the Tunjuelo Catchment. With respect to the consumption of drinking water, approximately 2 m3/s was the biggest difference between these catchments. For the generation of wastewater, this value was approximately 1.5 m3/s, which may be associated with the fact that the Fucha Catchment has more users, mainly residential, industrial, and commercial, than the Tunjuelo Catchment. In contrast, the stormwater flows were also greater for the former catchment, given that the Tunjuelo Catchment has more pervious surfaces, e.g., green areas, parks, etc., allowing for a higher infiltration rate. In the following paragraphs, the results are broken down by catchment.
3.1. Fucha Catchment
3.1.1. Flow of Drinking Water, Wastewater, and Stormwater
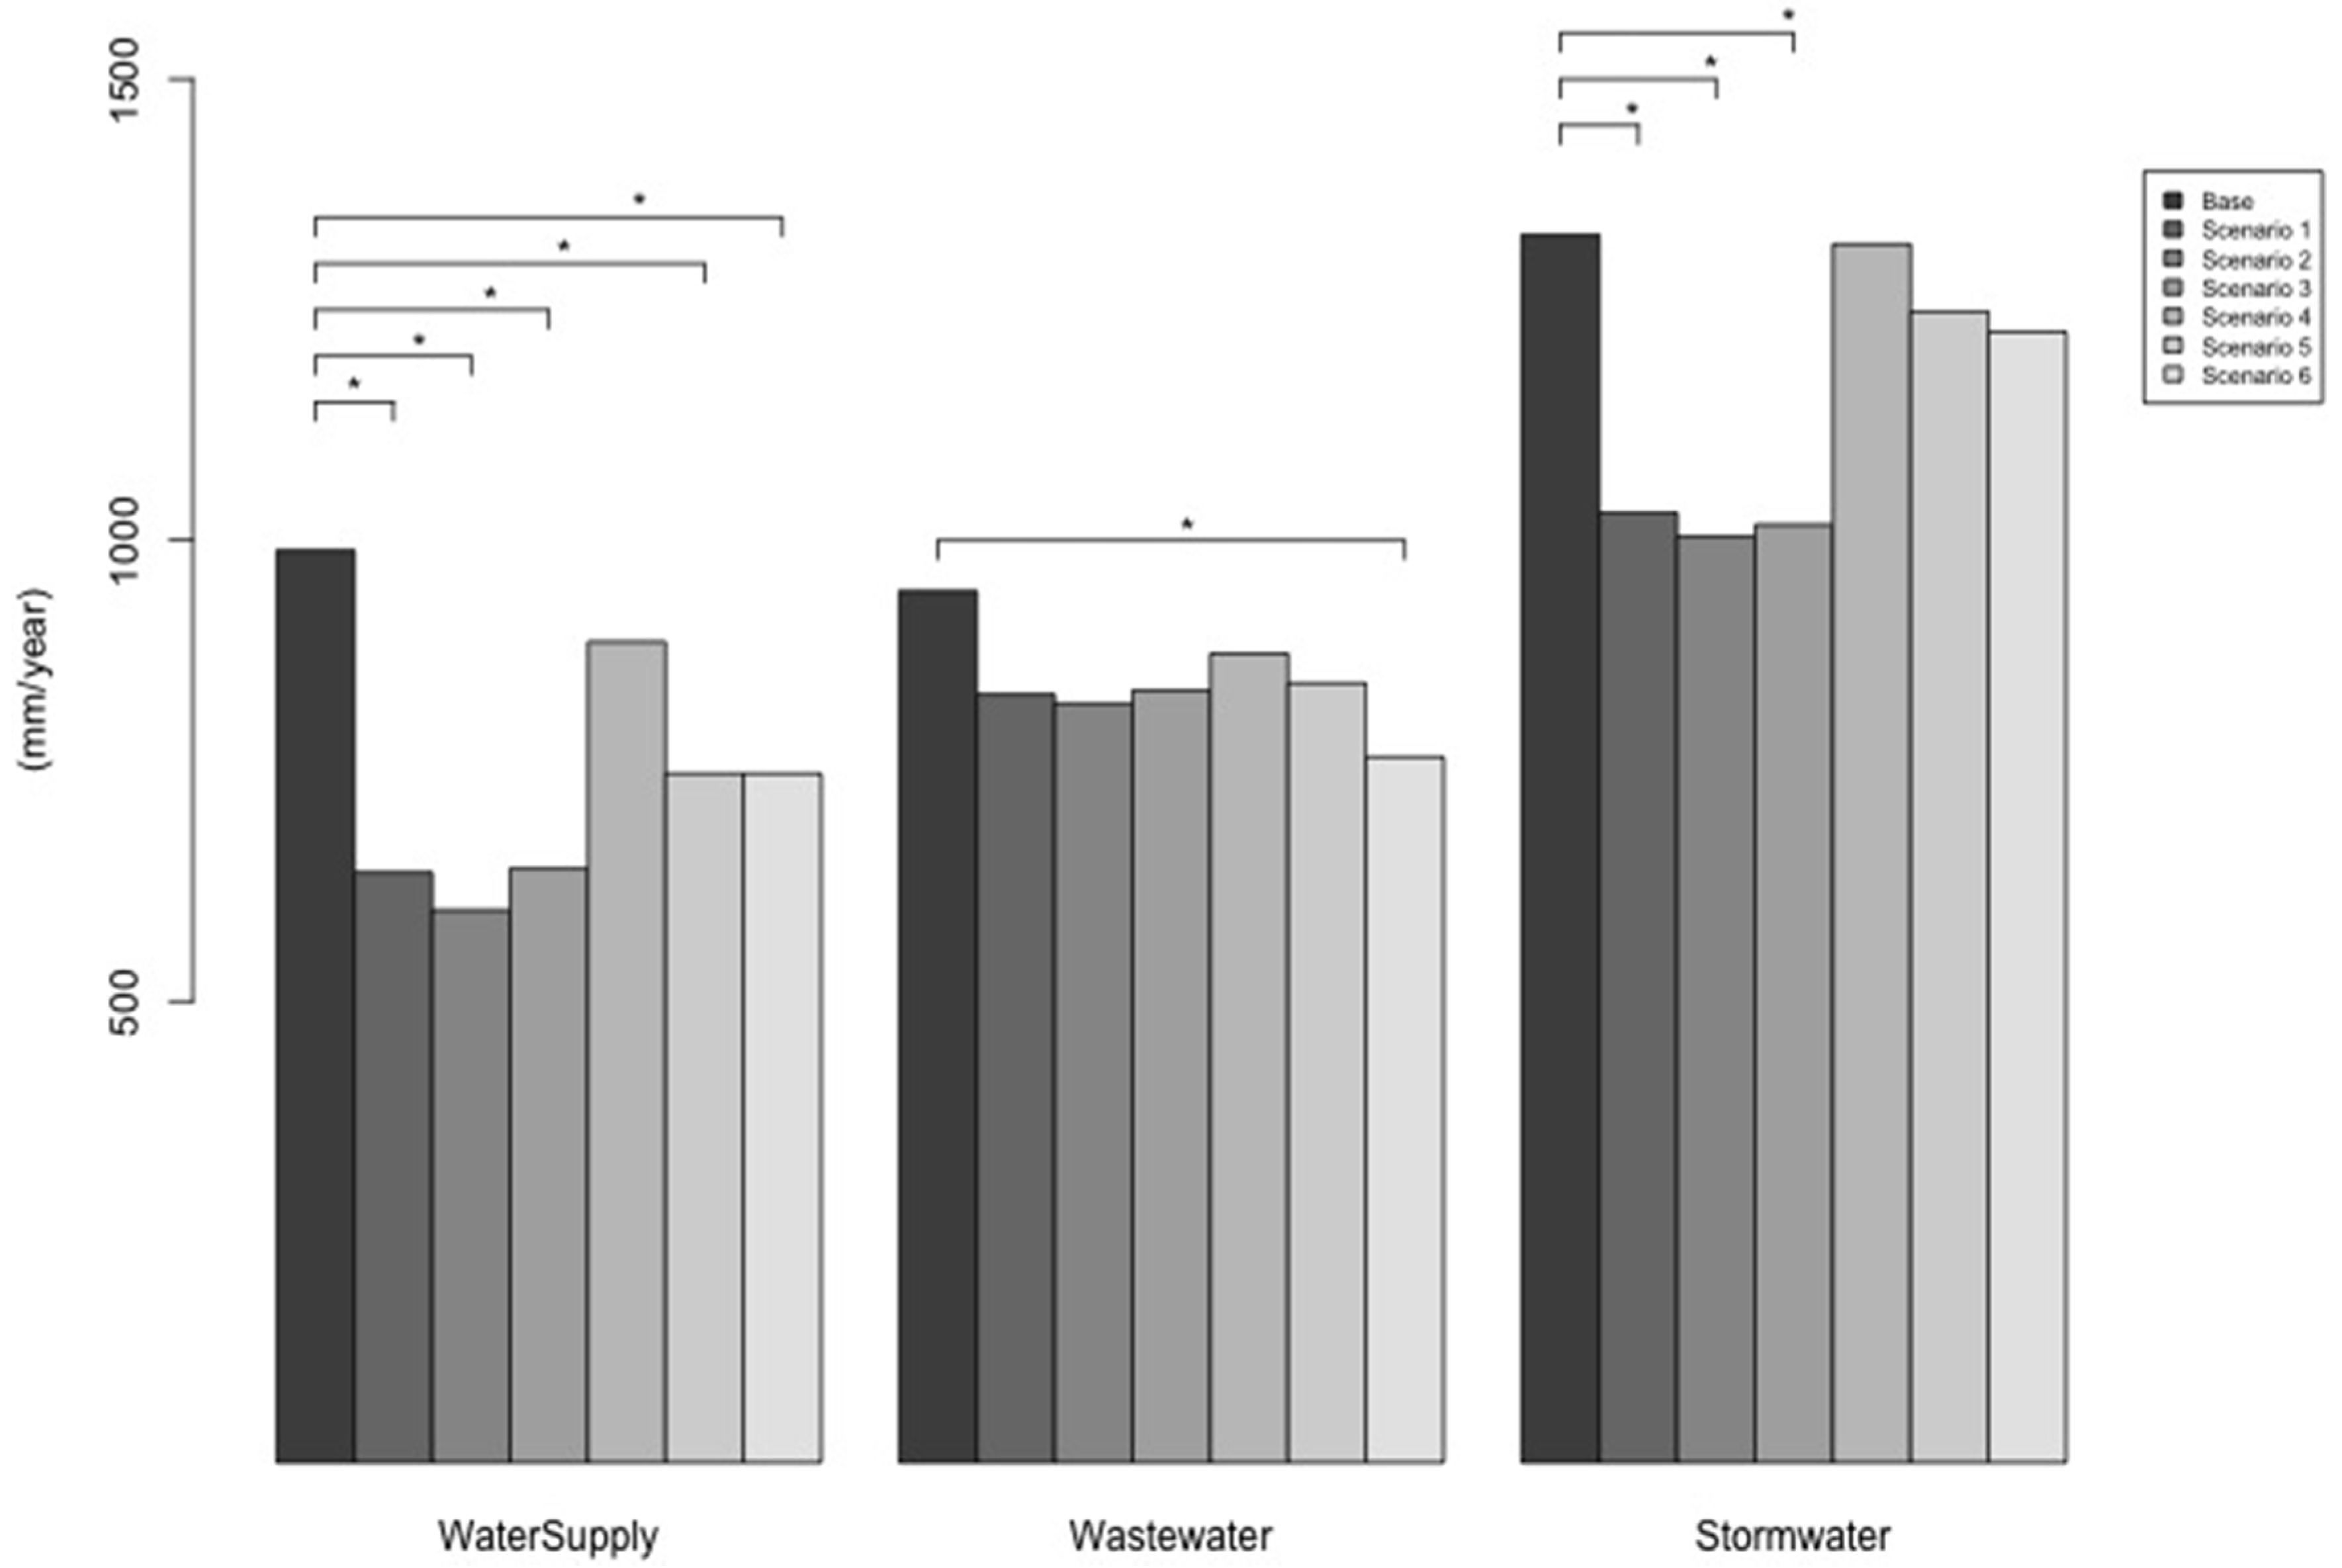
In terms of drinking-water consumption, scenarios 1, 2, and 3 were projected to bring about 42 to 47% reductions relative to the baseline scenario without any modifications/improvements. Scenarios 5 and 6 led to a reduction in drinking-water consumption of 29%. The results revealed that scenarios 1, 2, 3, 5, and 6 produced statistically significant differences. However, scenario 4’s reduction was 4.9%. For wastewater, the biggest drop was observed for scenario 6—at 20%—with statistical significance. For scenarios 1, 2, 3, and 5, decreases between 11% and 13% were projected. Scenario 4 presented a drop of 7%. Finally, for stormwater values, the first three scenarios provided 21% to 23% reductions, with statistical significance confirmed, whereas scenarios 4, 5, and 6 presented a reduction though not to the level of significance. The decrease in the all flows can be seen in Figure 2.
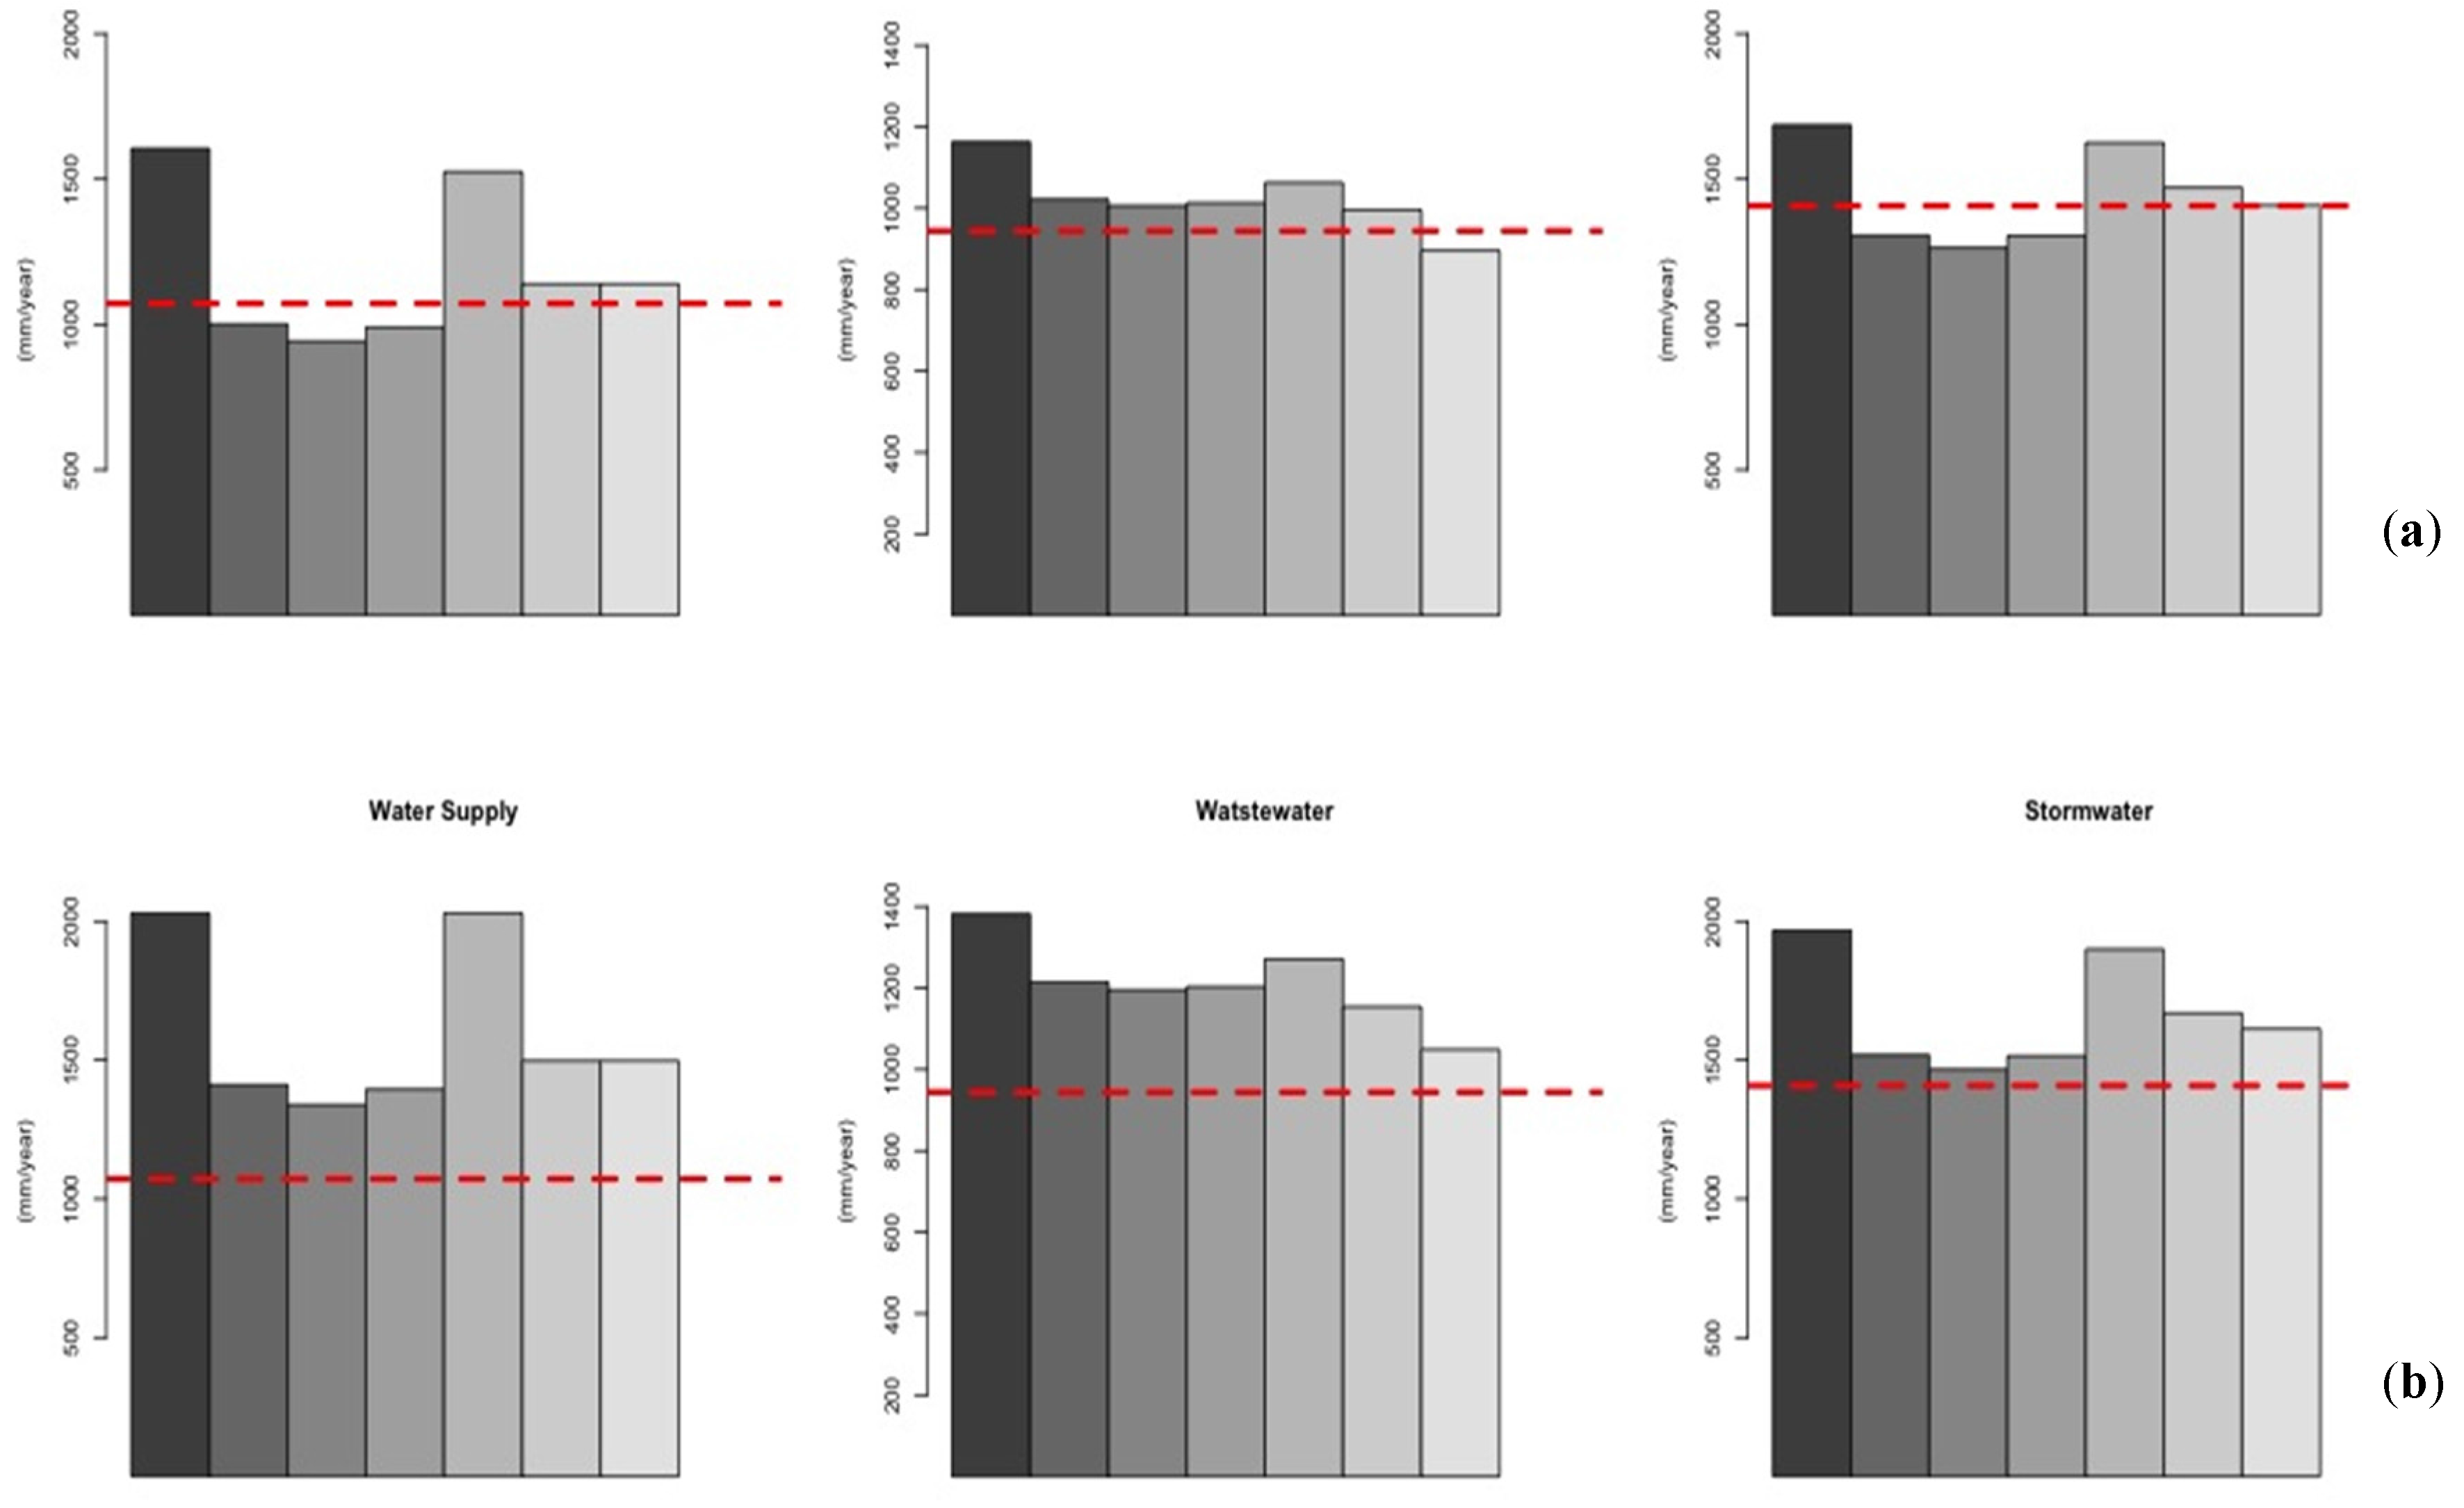
For the forecast water flows (10 and 20 years), an approximate increase of 49% in water consumption is expected for the 10-year period and 89% for the 20-year period (relative to the current values). With respect to wastewater, increases of approximately 24% and 48% are expected for the 10- and 20-year periods, respectively (relative to the current values). The infiltration expected for the stormwater sewage system from the sanitation systems from the drinking-water piping is 19% over the next 10 years and 21% over the next 20 years, with these percentages referring to increases relative to current values. Infiltration is caused by faulty wastewate-system connections and exfiltration by piping for drinking water and wastewater.
To compare the future values with current ones, a red line was included in Figure 3. This line clearly indicates the current values for drinking-water consumption, wastewater generation, and stormwater flows. As shown in Figure 2, the expected drinking-water consumption when implementing strategies 1, 2, and 3 for the 10-year period is less than current consumption levels, representing a reduction of 7%, 12.2%, and 8%, respectively, when employing these three strategies, which indicates that beginning to implement any of these measures for this period would be insufficient if aiming to maintain current consumption levels. Moreover, the use of stormwater as a water source allows for these same scenarios to help reduce stormwater flows. As for wastewater, scenario 6 for the 10-year period resulted in values that are minimally below the current levels, with a difference of only 1.8%. Finally, for the 20-year period, all wastewater values were greater than the current base state.
3.1.2. Contaminant Loads
Scenario 6, which displayed the greatest reduction in terms of wastewater flow, also produced the greatest reduction in terms of contaminant loads. If implementing this scenario, when compared to the current state, decreases would be: 13% for total phosphorus (TP), 12% for total nitrogen (TN), 26% for biological oxygen demand (BOD), 27% for chemical oxygen demand (COD), and 30% for total suspended solids (TSS). For scenarios 1, 2, 3, and 5, reductions were between 7% and 9% for TP and TN; for BOD and COD, these reductions were between 18% and 20%. Finally, TSS levels dropped between 20% and 25%. Despite the fact that industrial wastewater treatment was simulated for scenario 3, the reduction observed was not significant because industrial commercial users do not represent more than 10% of the Fucha Catchment’s users.
3.2. Tunjuelo Catchment
3.2.1. Flow of Drinking Water, Wastewater, and Stormwater
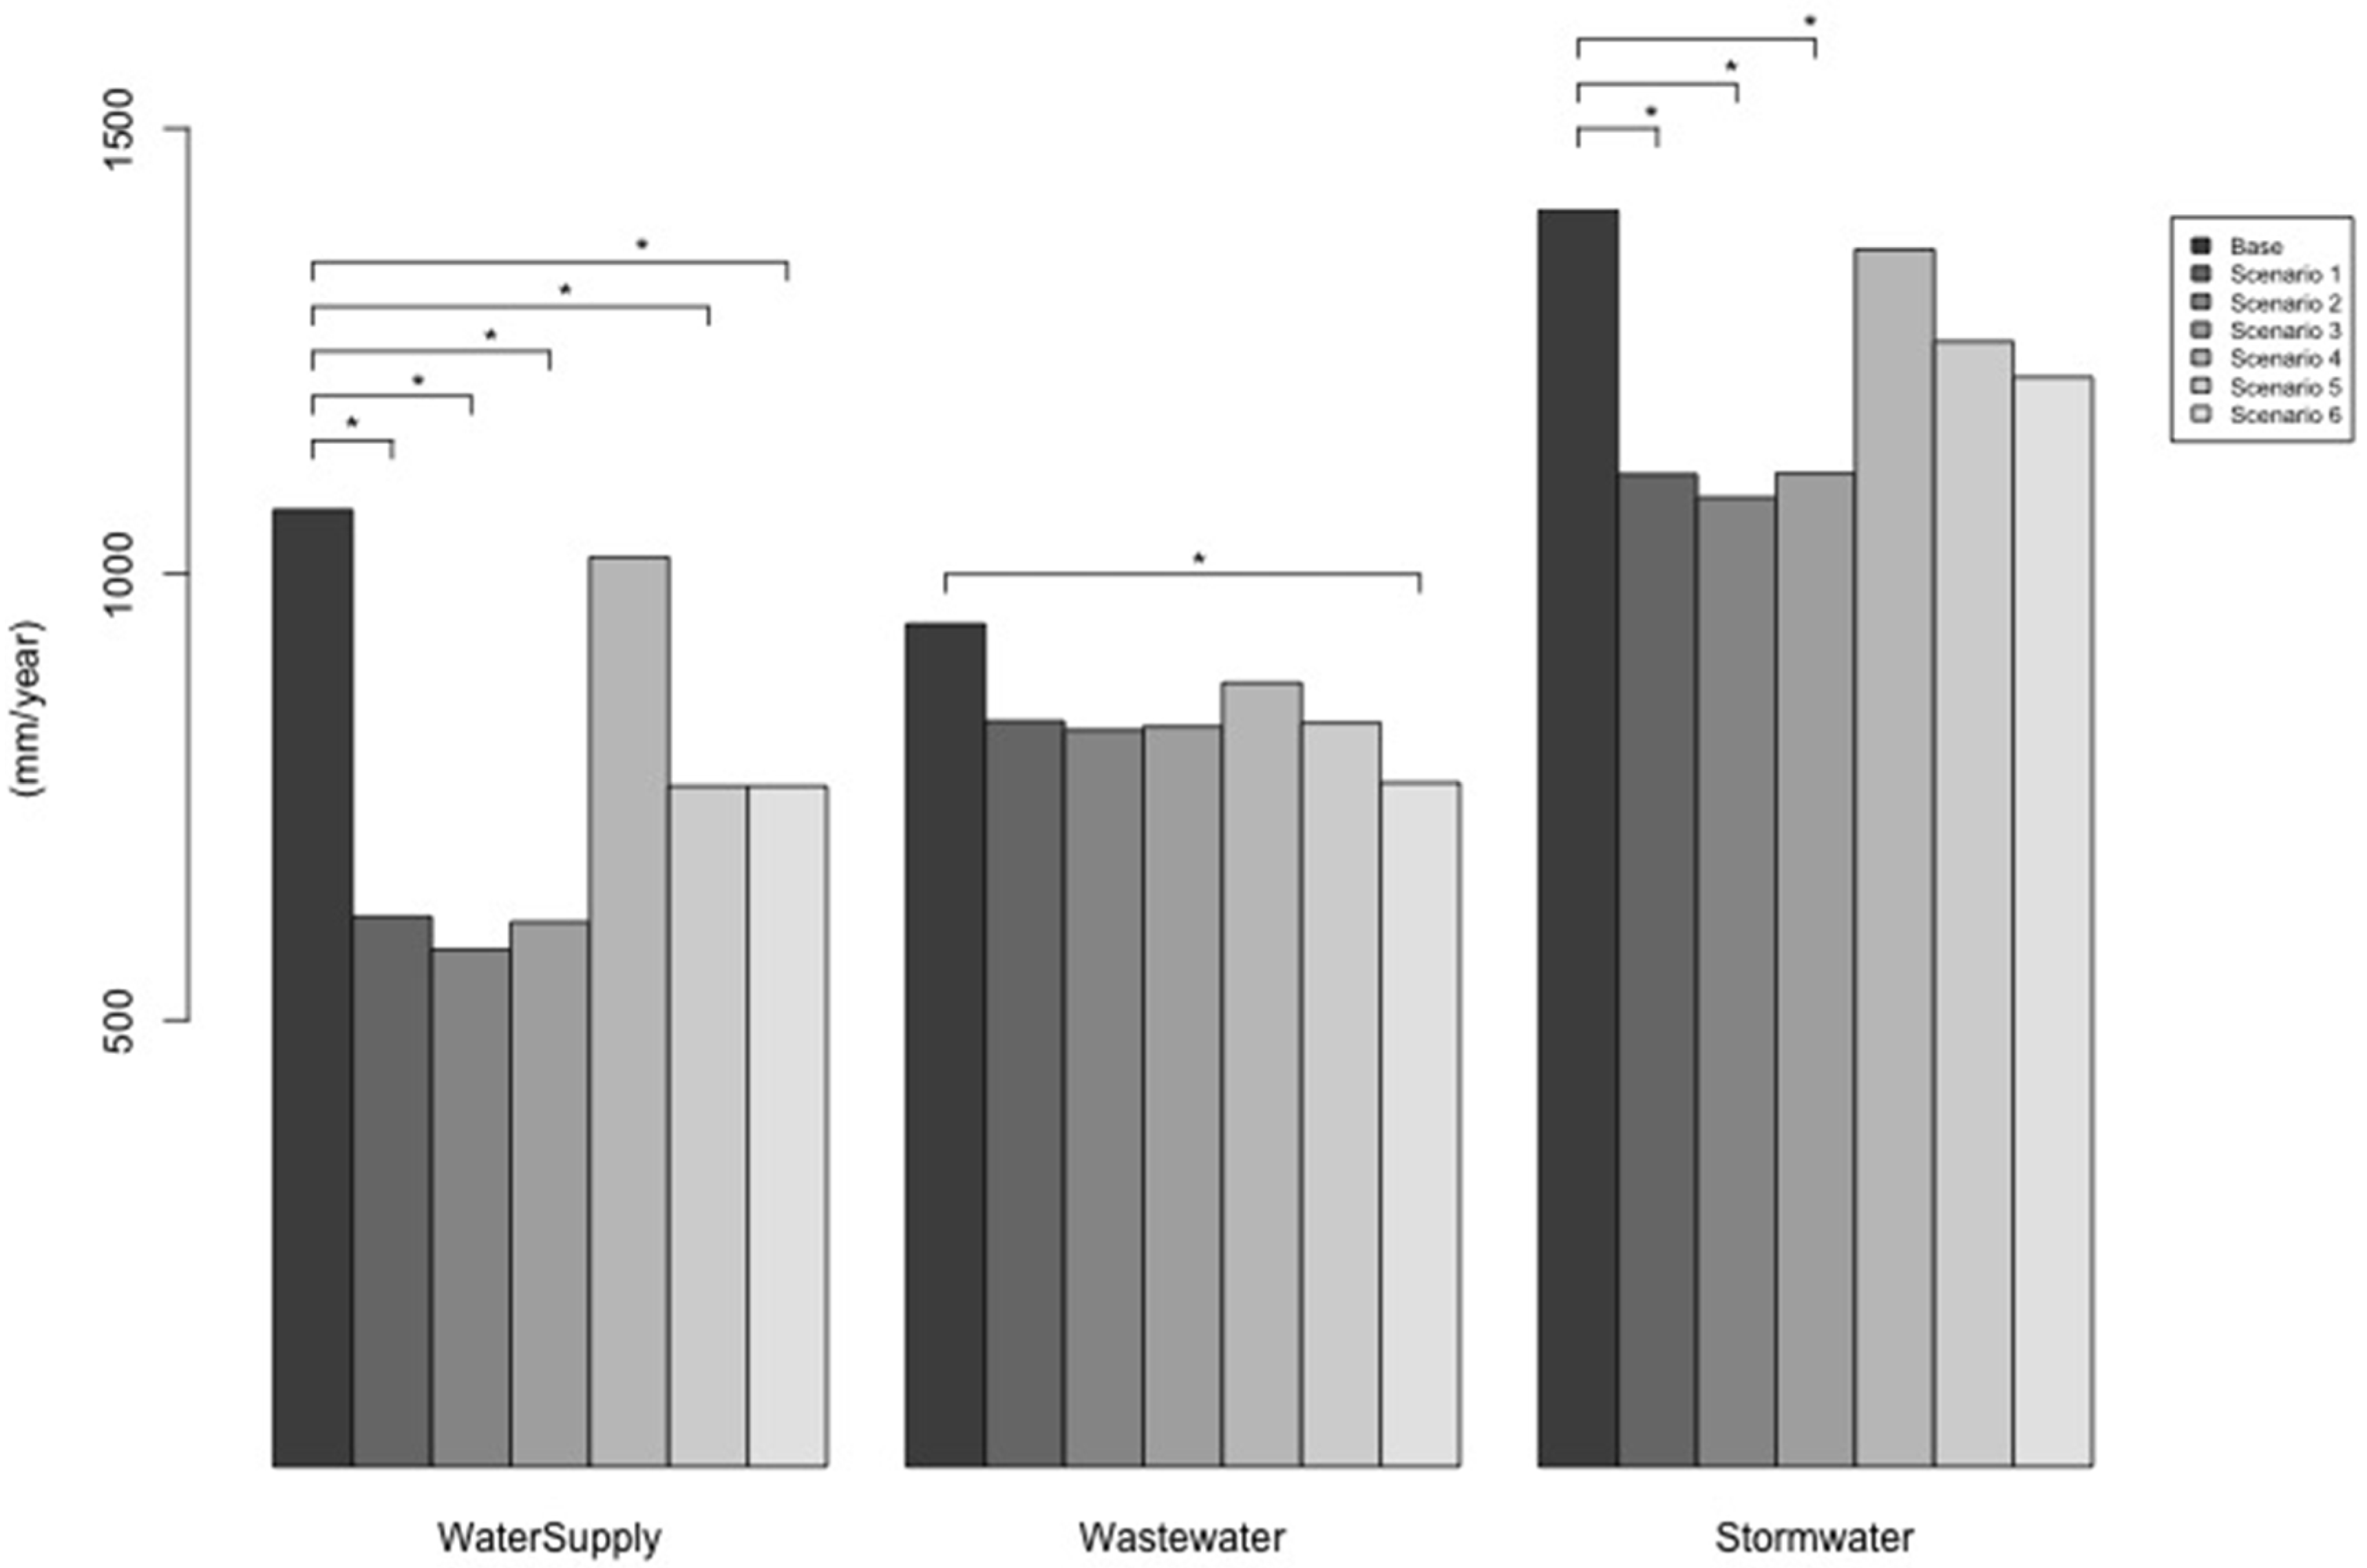
In terms of drinking-water consumption, scenarios 1, 2, and 3 presented reductions of 35% to 40%. For scenarios 5 and 6, reductions in drinking-water consumption were 24.5%. These five scenarios led to statistically significant decreases relative to the baseline. For scenario 4, the drinking-water reduction was 10%. For wastewater, a statistically the significant statistics reduction stemmed from scenario 6 (19%). For scenarios 1, 2, 3, and 5, drops were between 11% and 13%; for scenario 4, this value was 7.2%. For the stormwater flow, the first three scenarios led to a drop of 22% to 25%, though scenarios 4, 5, and 6 presented a drop, albeit an insignificant one. The results can be seen in Figure 4.
Looking at the projected scenarios, increases of 38% in water consumption for the 10-year period and 66% for the 20-year period were forecast; for wastewater, increases of approximately 30% and 42% for the 10-year and 20-year periods, respectively, were forecast. The infiltration expected for stormwater drainage from the sanitation system and drinking-water pipelines is 11% and 23% higher for the 10-year and 20-year periods relative to the current scenario.
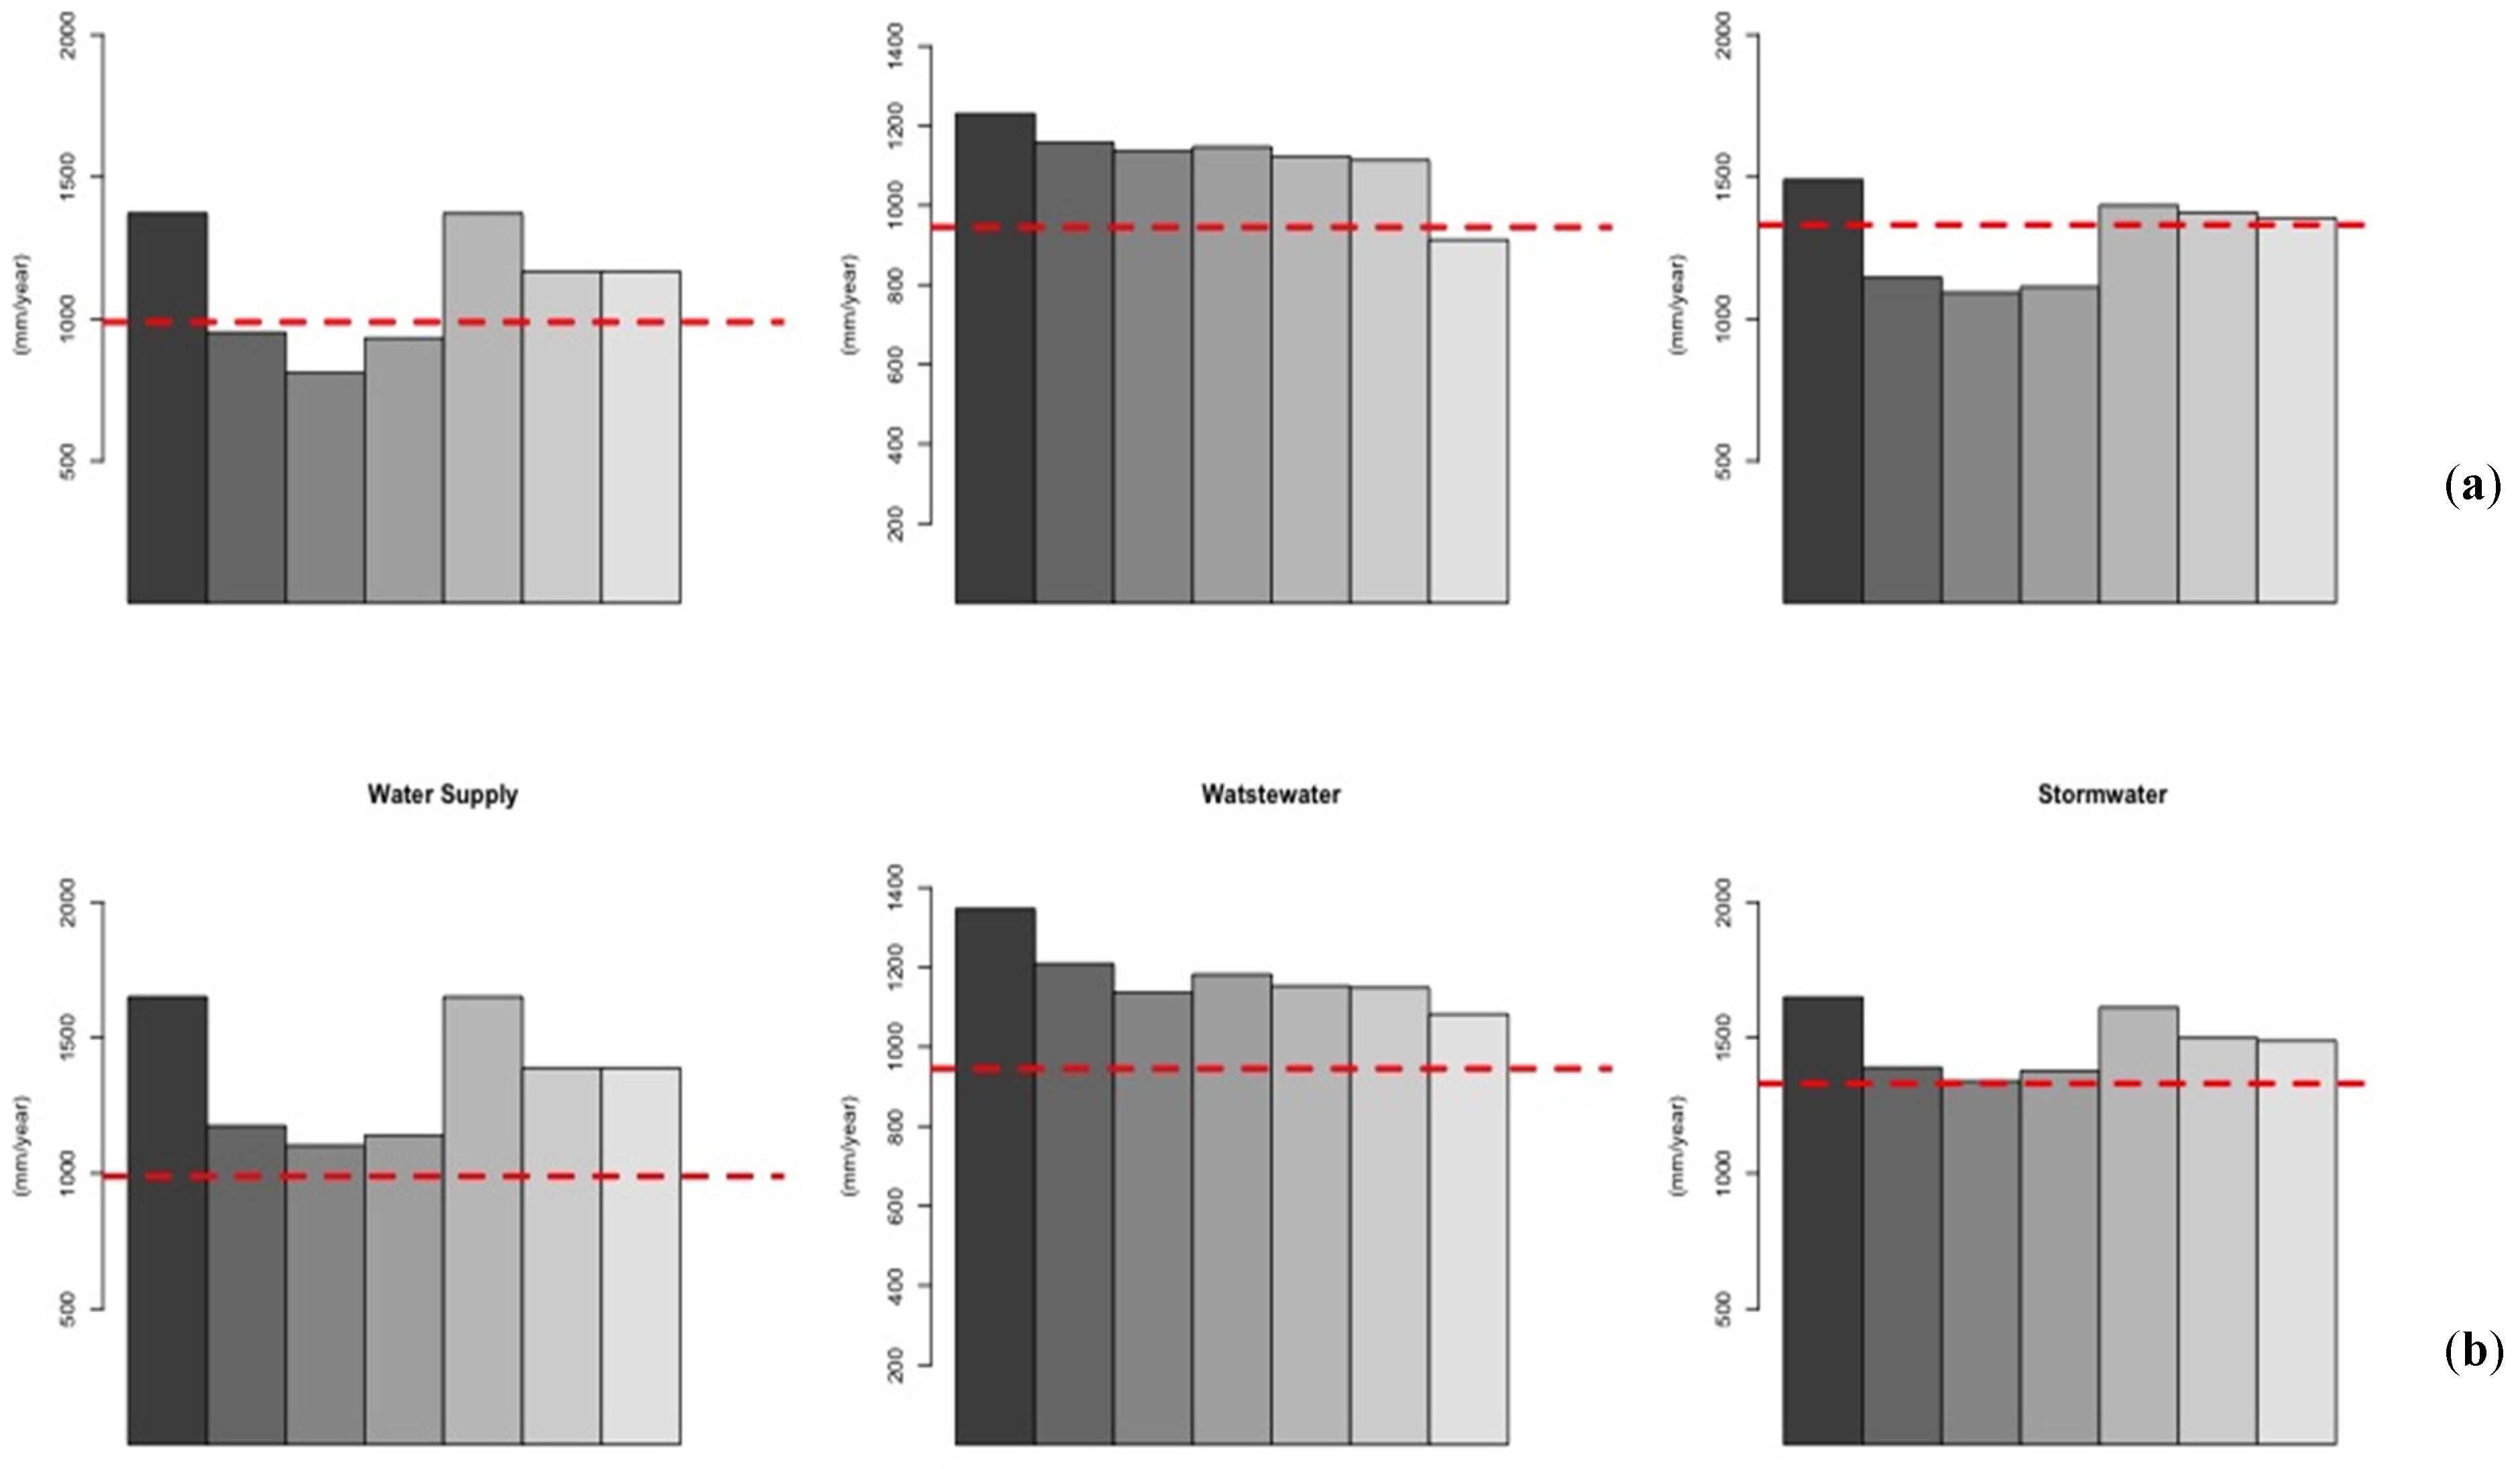
Comparing the projected flow values to the current ones, strikingly similar behavior was observed for the Fucha Catchment. For drinking water, in scenarios 1 and 3 for the 10-year period, the values were almost the same as the current drinking-water consumption (differences of 4% and 6%, respectively, for each scenario). For scenario 2, the difference between the 10-year projection and the baseline was 180 mm/year in consumption, equivalent to an 18% increase. The flow of wastewater in scenario 6 for the 10-year period was lower than that of the current state (though only by 3%); although this value is relatively small, its impact may be high, and for the catchment growth, it would be 23%. Finally, for the 20-year period, all values were above those of the baseline state (see Figure 5).
3.2.2. Contaminant Loads
The simulation results show that scenario 6 generated a decrease of 6% for TP, 4% for TN, 12% for BOD and COD, and, 15% for TSS. For scenarios 1, 2, 3, and 5, the values for TP and TN were 2%. For BOD and COD, these values were 5% and 7%, respectively; for TSS, they were 8%.
3.3. Comparing Scenarios 3 and 6
The (hypothetical) implementation of different scenarios pointed to the importance of strategies 3 and 6 insofar as these two strategies impacted the hydric resources. Therefore, there would be a significant reduction in contaminant loads and notable economic benefits attributable to implementing these strategies. Scenario 3 was selected because of the low costs associated with 1-m3 tanks, and scenario 6 was chosen primarily because of the practicality of its implementation in residential sectors.
The first step in comparing these strategies consisted of determining the reduction in the water volume captured under maximum conditions for each scenario. For the Fucha Catchment, simulation results showed that each drinking-water treatment plant supplying this catchment (Tibitoc and Wiesner) reduced its capture by 1 m3/s for scenario 3 and 0.6 m3/s for scenario 6. The reduction for the Tunjuelo Catchment was 0.55 m3/s for each plant (South treatment plant and Wiesner) for scenario 3 and 0.22 m3/s for scenario 6.
When running scenario 3, the treatment plants delivering water to the Fucha Catchment would capture approximately 5.26 GL/month less water. For the Tunjuelo Catchment, scenario 3 would reduce water capture by 2.23 GL/month. In other words, the two catchments would capture 7.8 GL/month less. For scenario 6, the reduction in drinking-water consumption for each plant supplying the Fucha Catchment would be 3.15 × GL/month 1 and 5.78 × 10⁵ m3/month for the Tunjuelo Catchment; thus, a total of 3.73 GL/month in water would no longer be captured if implementing scenario 6. Therefore, there was a difference in flow captured of 52% between scenarios 3 and 6, with the former providing greater benefits. However, both strategies would positively impact the ecosystem, environment, society, and economy at city and national levels.
In light of the fact that neither catchment has a wastewater treatment system, the reduction of this water and the concomitant reduction in contaminant loads represent an optimal—perhaps even necessary—strategy for controlling contamination in the city’s water bodies. On balance, scenario 3 would lead to a reduction of 32% for nutrients, 20% for organic material, and 26% for solids for both catchments. For scenario 6, the contaminant improvements would be 36%, 38%, and 39% for nutrients, organic material, and solids, respectively, revealing that an improvement in all parameters associated with this scenario present the highest reduction in wastewater flow.
Lastly, savings on water supply and sewage fees were evaluated for both proposed scenarios. In Table 3, the fixed and base fees for sanitation and sewage, in addition to the average values of drinking-water consumption and sewage, for both catchments are displayed.
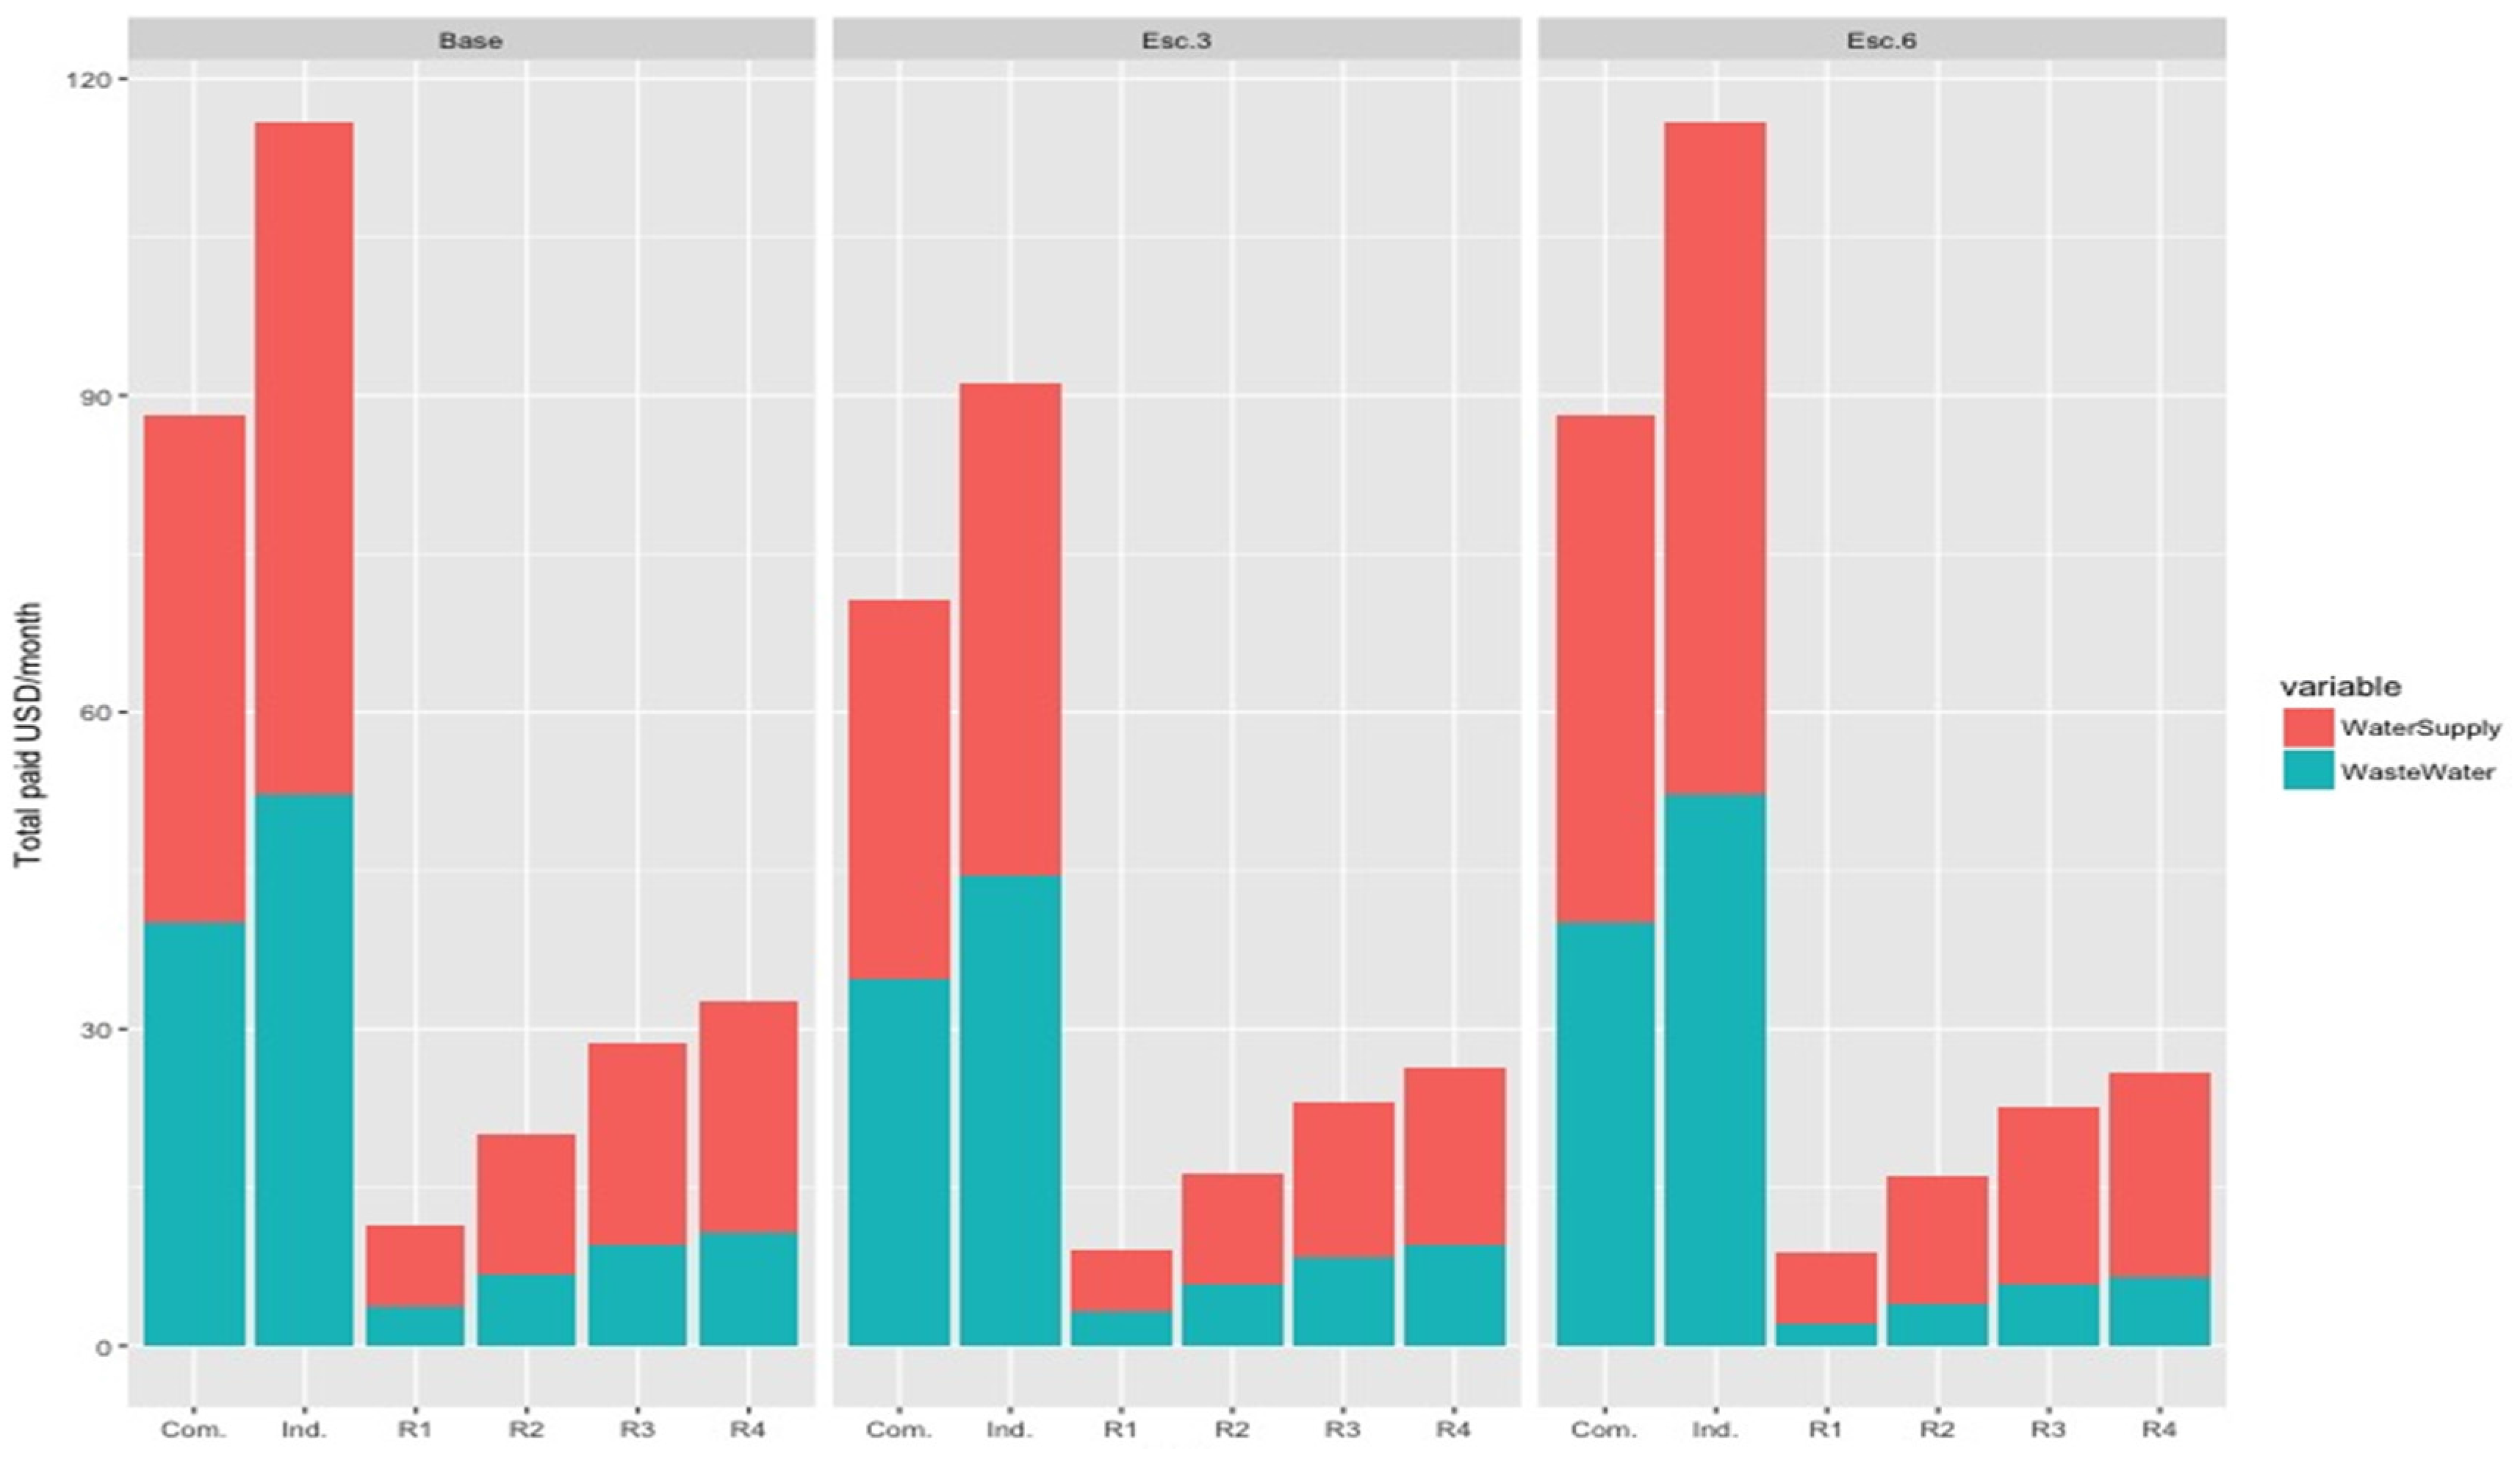
As shown in Figure 6 scenario 3 for the Fucha Catchment was identified as undergoing the greatest drop in total cost (water supply and sanitation) per month for all land uses, which is primarily attributable to the fact that this strategy allows for the greatest reductions in drinking-water consumption (the highest-cost service). Furthermore, this scenario showed how the industrial and commercial sectors could cut total costs between 40% and 47%compared to the baseline; in residential sectors, this drop could be between 10% and 20%.
Scenario 3, once more, presented the lowest total costs per month for all land uses. In contrast to what was observed for the Fucha Catchment in the industrial and commercial sectors, the reduction was between 18% and 27% of the total payment for the residences served by the Fucha Catchment; for residential sectors, reductions were between 5% and 9.5%. However, the difference between scenarios 3 and 6 with respect to the residential sector for this catchment did not exceed 4%, showing that the implementation of either of these two strategies would essentially generate the same reduction in expenses (see Figure 7).
It is worth mentioning that the annual savings on water supply and wastewater treatment is significant in Colombian pesos (COP), such that implementing either of these two strategies would engender a major positive impact on Bogota residents’ wallets. Moreover, by estimating the costs of materials and construction labor per building in scenario 3, it is expected that dwellings could recoup their investment in 1 to 2.5 years. Turning to the industrial and commercial sectors, recouping the investment would take approximately 2.5 to 3.5 years. In fact, one scenario 6 should leave policy makers optimistic: In the residential sector, investments (infrastructure) would be offset in less than one year. However, to reap any of these benefits, the public sector must develop a model of financing or subsidization, as recommended by Furlong et al. [47], for doing so would facilitate the mass implementation of these strategies.
4. Conclusions
The simulation results obtained using UVQ software, which allow for the simulation of all components of the urban water cycle, revealed a reduction between both catchments of nearly 2 m3/s in drinking-water consumption and 1.5 m3/s in wastewater volume treated at when implementing.
Scenarios 1 (1-m3 stormwater tanks for dwellings and 10-m3 tanks for industries, big businesses commercial, and business or office centers), 2 (2-m3 stormwater tanks for dwellings and 20-m3 tanks for industries, big businesses commercial, and business or office centers), and 3 (1-m3 stormwater tanks for dwellings and 10-m3 tanks for other uses. Wastewater treatment with removal of 40% TN, 40% TP, 40% BOD, 40% COD, and 60% TSS) for the Fucha Catchment presented the highest reductions in drinking-water consumption, with values ranging from 42% to 47%, which were statistically significant. Yet, for scenarios 5 (Installation of water-saving equipment in dwellings, sinks, dishwashers, toilets, and showers) and 6 (0.1-m3 tank for dwellings with water from washing machines and installation of water-saving equipment in dwellings for sinks, dishwashers, toilets, and showers), the reductions were not as impressive, though they were significant. Regarding wastewater, scenario 6 presented the greatest reduction at 20%, with statistical significance. Finally, for stormwater, the first three scenarios were projected to offer reductions in the range of 21 to 23%. Turning to the Tunjuelo Catchment, scenarios 1, 2, and 3 presented reductions of 35% to 40% for drinking-water consumption. The biggest drop in wastewater flow was observed for scenario 6 (19%). For stormwater flows, the first three scenarios resulted in reductions of 22% to 25%. Reductions in contaminant loads in organic material for the Fucha Catchment exceeded 20%, though only 12% for the Tunjuelo Catchment. However, either case would notably help the Fucha and Tunjuelo rivers, which do not have treatment systems, as well as the Bogotá River, for the Fucha and Tunjuelo are tributaries of the Bogotá River.
Evaluating scenarios 3 and 6 showed that the two catchments, in conjunction, would stop capturing 7.8 GL/month if implementing strategy 3 and 3.73 GL/month if implementing strategy 6—a difference of 52% between these scenarios, favoring the former. Scenario 3 would reduce contaminant loads by 32% for nutrients, 20% for organic material, and 26% for solids for both catchments. For scenario 6, decreases of 36%, 38%, and 39% for nutrients, organic material, and solids, respectively, were projected.
In terms of the costs associated with users’ sewage and sanitation services, scenario 3 presented the greatest reductions for both catchments, mainly benefiting the industrial sector for the Fucha catchment, though the implementation strategy 3 would offset the investment in residential sectors in less time.
Author Contributions
Carlos Peña-Guzman worked on model construction and the development of scenarios. All authors contributed to analysis of results.
Conflicts of Interest
The authors declare no conflicts of interest.
References
- Fletcher, T.D.; Andrieu, H.; Hamel, P. Understanding, management and modelling of urban hydrology and its consequences for receiving waters: A state of the art. Adv. Water Resour. 2013, 51, 261–279. [Google Scholar] [CrossRef]
- Lee, T.R. Urban water management for better urban life in Latin America. Urban Water 2000, 2, 71–78. [Google Scholar] [CrossRef]
- McIntyre, N.E.; Knowles-Yánez, K.; Hope, D. Urban Ecology as an Interdisciplinary Field: Differences in the use of “Urban” Between the Social and Natural Sciences. In Urban Ecology; Marzluff, J.M., Shulenberger, E., Endlicher, W., Alberti, M., Bradley, G., Ryan, C., Simon, U., ZumBrunnen, C., Eds.; Springer: New York, NY, USA, 2008; pp. 49–65. ISBN 978-0-387-73411-8. [Google Scholar]
- Wen, B.; van der Zouwen, M.; Horlings, E.; van der Meulen, B.; van Vierssen, W. Transitions in urban water management and patterns of international, interdisciplinary and intersectoral collaboration in urban water science. Environ. Innov. Soc. Transit. 2015, 15, 123–139. [Google Scholar] [CrossRef]
- Makropoulos, C.K.; Natsis, K.; Liu, S.; Mittas, K.; Butler, D. Decision support for sustainable option selection in integrated urban water management. Environ. Model. Softw. 2008, 23, 1448–1460. [Google Scholar] [CrossRef]
- Furlong, C.; Brotchie, R.; Considine, R.; Finlayson, G.; Guthrie, L. Key concepts for Integrated Urban Water Management infrastructure planning: Lessons from Melbourne. Util. Policy 2017, 45, 84–96. [Google Scholar] [CrossRef]
- Mitchell, V.G. Applying Integrated Urban Water Management Concepts: A Review of Australian Experience. Environ. Manag. 2006, 37, 589–605. [Google Scholar] [CrossRef] [PubMed]
- Brown, R.R.; Keath, N.; Wong, T.H.F. Urban water management in cities: Historical, current and future regimes. Water Sci. Technol. 2009, 59, 847–855. [Google Scholar] [CrossRef] [PubMed]
- Larsen, T.A.; Gujer, W. The concept of sustainable Urban Water Management. Water Sci. Technol. 1997, 35, 3–10. [Google Scholar] [CrossRef]
- Price, R.K.; Vojinović, Z. Urban Hydroinformatics: Data, Models, and Decision Support for Integrated Urban Water Management; IWA Publishing: London, UK, 2011; ISBN 978-1-84339-274-3. [Google Scholar]
- Furlong, C.; De Silva, S.; Guthrie, L.; Considine, R. Developing a water infrastructure planning framework for the complex modern planning environment. Util. Policy 2016, 38, 1–10. [Google Scholar] [CrossRef]
- Furlong, C.; Silva, S.D.; Guthrie, L. Planning scales and approval processes for IUWM projects; lessons from Melbourne, Australia. Water Policy 2016, 18, 783–802. [Google Scholar] [CrossRef]
- Asano, T.; Levine, A.D. Wastewater reclamation, recycling and reuse: Past, present, and future. Water Sci. Technol. 1996, 33, 1–14. [Google Scholar] [CrossRef]
- Brodie, I. Stormwater harvesting and WSUD frequent flow management: A compatibility analysis. Water Sci. Technol. 2012, 66, 612–619. [Google Scholar] [CrossRef] [PubMed]
- Christova-Boal, D.; Eden, R.E.; McFarlane, S. An investigation into greywater reuse for urban residential properties. Desalination 1996, 106, 391–397. [Google Scholar] [CrossRef]
- Fletcher, T.D.; Mitchell, V.G.; Deletic, A.; Ladson, T.R.; Séven, A. Is stormwater harvesting beneficial to urban waterway environmental flows? Water Sci. Technol. 2007, 55, 265–272. [Google Scholar] [CrossRef] [PubMed]
- Geller, E.S.; Erickson, J.B.; Buttram, B.A. Attempts to promote residential water conservation with educational, behavioral and engineering strategies. Popul. Environ. 1983, 6, 96–112. [Google Scholar] [CrossRef]
- McArdle, P.; Gleeson, J.; Hammond, T.; Heslop, E.; Holden, R.; Kuczera, G. Centralised urban stormwater harvesting for potable reuse. Water Sci. Technol. 2011, 63, 16–24. [Google Scholar] [CrossRef] [PubMed]
- Mitchell, V.G.; Deletic, A.; Fletcher, T.D.; Hatt, B.E.; McCarthy, D.T. Achieving multiple benefits from stormwater harvesting. Water Sci. Technol. 2007, 55, 135–144. [Google Scholar] [CrossRef] [PubMed]
- Strecker, E.; Quigley, M.; Urbonas, B.; Jones, J.; Clary, J. Determining urban storm water BMP effectiveness. J. Water Resour. Plan. Manag. 2001, 127, 144–149. [Google Scholar] [CrossRef]
- Eroksuz, E.; Rahman, A. Rainwater tanks in multi-unit buildings: A case study for three Australian cities. Resour. Conserv. Recycl. 2010, 54, 1449–1452. [Google Scholar] [CrossRef]
- Gikas, G.D.; Tsihrintzis, V.A. Assessment of water quality of first-flush roof runoff and harvested rainwater. J. Hydrol. 2012, 466, 115–126. [Google Scholar] [CrossRef]
- Farreny, R.; Gabarrell, X.; Rieradevall, J. Cost-efficiency of rainwater harvesting strategies in dense Mediterranean neighbourhoods. Resour. Conserv. Recycl. 2011, 55, 686–694. [Google Scholar] [CrossRef]
- Aladenola, O.O.; Adeboye, O.B. Assessing the Potential for Rainwater Harvesting. Water Resour. Manag. 2010, 24, 2129–2137. [Google Scholar] [CrossRef]
- Cook, S.; Sharma, A.; Chong, M. Performance Analysis of a Communal Residential Rainwater System for Potable Supply: A Case Study in Brisbane, Australia. Water Resour. Manag. 2013, 27, 4865–4876. [Google Scholar] [CrossRef]
- Zhang, Y.; Grant, A.; Sharma, A.; Donghui, C.; Liang, C. Assessment of rainwater use and greywater reuse in high-rise buildings in a brownfield site. Water Sci. Technol. 2009, 60, 575–581. [Google Scholar] [CrossRef] [PubMed]
- Ghisi, E.; Mengotti de Oliveira, S. Potential for potable water savings by combining the use of rainwater and greywater in houses in southern Brazil. Build. Environ. 2007, 42, 1731–1742. [Google Scholar] [CrossRef]
- Zhang, D.; Gersberg, R.M.; Wilhelm, C.; Voigt, M. Decentralized water management: Rainwater harvesting and greywater reuse in an urban area of Beijing, China. Urban Water J. 2009, 6, 375–385. [Google Scholar] [CrossRef]
- Liu, S.; Butler, D.; Memon, F.A.; Makropoulos, C.; Avery, L.; Jefferson, B. Impacts of residence time during storage on potential of water saving for grey water recycling system. Water Res. 2010, 44, 267–277. [Google Scholar] [CrossRef] [PubMed] [Green Version]
- Penn, R.; Hadari, M.; Friedler, E. Evaluation of the effects of greywater reuse on domestic wastewater quality and quantity. Urban Water J. 2012, 9, 137–148. [Google Scholar] [CrossRef]
- Muthukumaran, S.; Baskaran, K.; Sexton, N. Quantification of potable water savings by residential water conservation and reuse—A case study. Resour. Conserv. Recycl. 2011, 55, 945–952. [Google Scholar] [CrossRef]
- Rodríguez, J.; Díaz-Granados, M.; Camacho, L.; Raciny, I.; Maksimovic, C.; McIntyre, N. Bogotá’s urban drainage system: Context, research activities and perspectives. In Proceedings of the 10th National Hydrology Symposium, British Hydrological Society, Exeter, UK, 15–17 September 2008. [Google Scholar]
- Peña-Guzmán, C.; Melgarejo, J.; Prats, D. El ciclo urbano del agua en Bogotá, Colombia: Estado actual y desafíos para la sostenibilidad. Tecnol. Cienc. Agua 2016, 7, 57–71. [Google Scholar]
- Mitchell, V.G.; Diaper, C. Simulating the urban water and contaminant cycle. Environ. Model. Softw. 2006, 21, 129–134. [Google Scholar] [CrossRef]
- Wolf, L.; Morris, B.L.; Burn, S.; Hötzl, H. The AISUWRS approach. In Urban Water Resources Toolbox—Integrating Groundwater into Urban Water Management; Wolf, L., Morris, B., Burn, S., Eds.; International Water Association: London, UK, 2008. [Google Scholar]
- Mitchell, V.G.; Diaper, C. UVQ: A tool for assessing the water and contaminant balance impacts of urban development scenarios. Water Sci. Technol. 2005, 52, 91–98. [Google Scholar] [PubMed]
- Wolf, L.; Klinger, J.; Held, I.; Hötzl, H. Integrating groundwater into urban water management. Water Sci. Technol. 2006, 54, 395–403. [Google Scholar] [CrossRef] [PubMed]
- Mitchell, V.G.; Diaper, C.; Gray, S.R.; Rahilly, M. UVQ: Modelling the Movement of Water and Contaminants through the Total Urban Water Cycle. In Proceedings of the 28th International Hydrology and Water Resources Symposium: About Water, Barton, Australia, 10–13 November 2003. [Google Scholar]
- Rueedi, J.; Cronin, A.A.; Moon, B.; Wolf, L.; Hoetzl, H. Effect of different water management strategies on water and contaminant fluxes in Doncaster, United Kingdom. Water Sci. Technol. 2005, 52, 115–123. [Google Scholar] [PubMed]
- Burn, S.; DeSilva, D.; Ambrose, M.; Meddings, S.; Diaper, C.; Correll, R.; Miller, R.; Wolf, L. A decision support system for urban groundwater resource sustainability. Water Pract. Technol. 2006, 1, wpt2006010. [Google Scholar] [CrossRef]
- Marleni, N.; Gray, S.; Sharma, A.; Burn, S.; Muttil, N. Impact of water management practice scenarios on wastewater flow and contaminant concentration. J. Environ. Manag. 2015, 151, 461–471. [Google Scholar] [CrossRef] [PubMed]
- Martinez, S.E.; Escolero, O.; Wolf, L. Total Urban Water Cycle Models in Semiarid Environments—Quantitative Scenario Analysis at the Area of San Luis Potosi, Mexico. Water Resour. Manag. 2011, 25, 239–263. [Google Scholar] [CrossRef]
- Niño, D.; Martinez, C. Estudio de las Aguas Grises Domésticas en Tres niveles Socioeconómicos de la Ciudad de Bogotá; Pontificia Universidad Javeriana: Bogotá, Colombia, 2013. [Google Scholar]
- Sharma, A.; Grant, A.; Tjandraatmadja, G.; Gray, S. Sustainability of Alternative Sewerage and Water Servicing Options-Yarra Valley Water, Stage 2—Backlog Areas; CISRO: Canberra, Australia, 2006. [Google Scholar]
- Santos, C.; Taveira-Pinto, F. Analysis of different criteria to size rainwater storage tanks using detailed methods. Resour. Conserv. Recycl. 2013, 71, 1–6. [Google Scholar] [CrossRef]
- Kruskal, W.H. Historical Notes on the Wilcoxon Unpaired Two-Sample Test. J. Am. Stat. Assoc. 1957, 52, 356–360. [Google Scholar] [CrossRef]
- Furlong, C.; De Silva, S.; Gan, K.; Guthrie, L.; Considine, R. Risk management, financial evaluation and funding for wastewater and stormwater reuse projects. J. Environ. Manag. 2017, 191, 83–95. [Google Scholar] [CrossRef] [PubMed]
Figure 1.
Land use of Fucha and Tunjuelo Catchments.

Figure 2.
Flow of Drinking Water, Wastewater, and Stormwater in the Fucha Catchment.

Figure 3.
(a) Flow of Drinking Water, Wastewater, and Stormwater for the 10-year period and (b) Flow of Drinking Water, Wastewater, and Stormwater for the 20-year future cases in Fucha Catchment.
Figure 3.
(a) Flow of Drinking Water, Wastewater, and Stormwater for the 10-year period and (b) Flow of Drinking Water, Wastewater, and Stormwater for the 20-year future cases in Fucha Catchment.

Figure 4.
Flow of Drinking Water, Wastewater, and Stormwater in Tunjuelo Catchment.
Figure 5.
(a) Flow of Drinking Water, Wastewater, and Stormwater for the 10-year period and (b) Flow of Drinking Water, Wastewater, and Stormwater for the 20-year future cases in Tunjuelo Catchment.
Figure 5.
(a) Flow of Drinking Water, Wastewater, and Stormwater for the 10-year period and (b) Flow of Drinking Water, Wastewater, and Stormwater for the 20-year future cases in Tunjuelo Catchment.

Figure 6.
Comparison of the cost for services in the baseline and scenarios 3 and 6 for the Fucha Catchment.
Figure 6.
Comparison of the cost for services in the baseline and scenarios 3 and 6 for the Fucha Catchment.
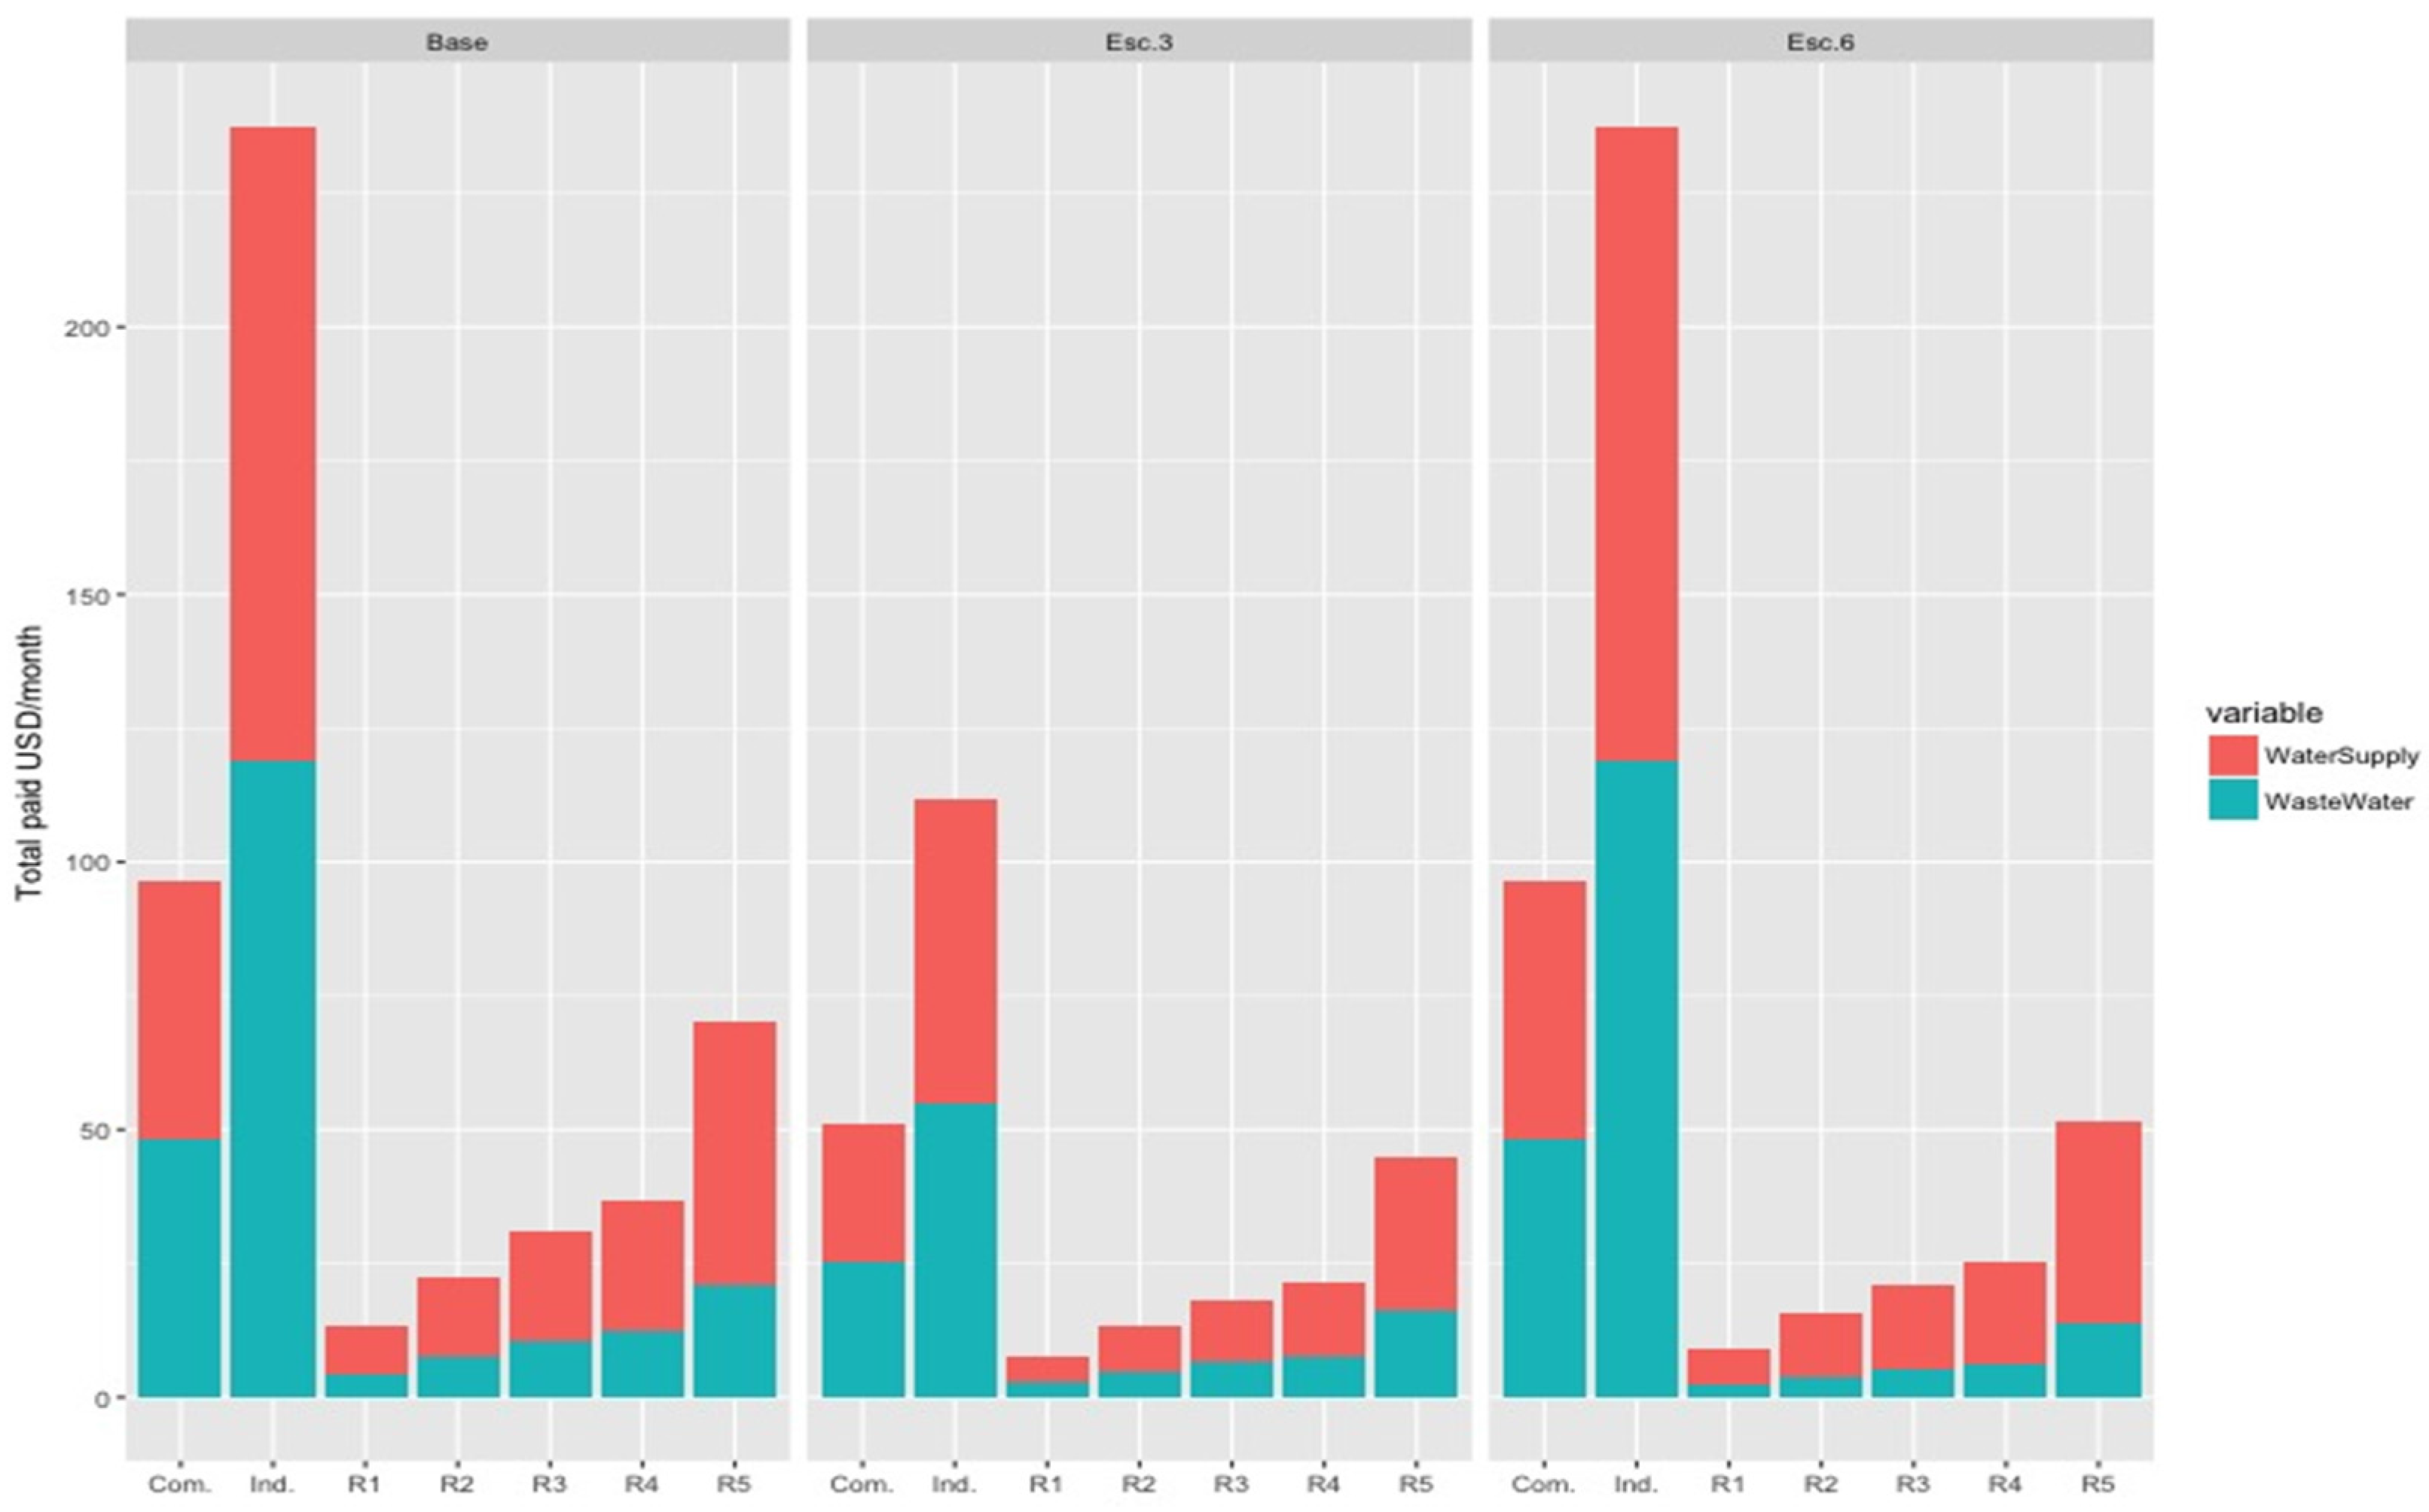
Figure 7.
Comparison of the pay for services in baseline and the sceneries 3 and 6 for Tunjuelo Catchment.
Figure 7.
Comparison of the pay for services in baseline and the sceneries 3 and 6 for Tunjuelo Catchment.


Table 1.
Input variables and their source.
| Variable | Type | Unit | Source | Observation | ||
|---|---|---|---|---|---|---|
| Measured | Local Literature | International Literature | ||||
| Total area | N.A. | ha | X | Measured using ArcGis | ||
| Road area | N.A. | ha | X | Measured using ArcGis | ||
| Open space | N.A. | ha | X | Measured using ArcGis | ||
| Exfiltration of wastewater | N.A. | ratio | X | The rate was estimated using a value of 7.67 L/d/m, as proposed by [42] | ||
| Number of dwellings in a neighborhood | N.A. | # | X | Measured in the field by a pilot study and using ArcGis | ||
| Dwelling area | N.A. | m2 | X | Measured using ArcGis | ||
| People per dwelling | N.A. | # | X | Measured in the field by a pilot study | ||
| Dwelling garden area | N.A. | m2 | X | Measured using ArcGis | ||
| Dwelling roof area | N.A. | m2 | X | Measured using ArcGis | ||
| Dwelling paved area | N.A. | m2 | X | Measured using ArcGis | ||
| Consumption of water—kitchen, bathroom, toilet and laundry | N.A. | L/d/c | X | [43] | ||
| Contaminant load—kitchen, bathroom, toilet and laundry | BOD | m/c/d | X | [44] | ||
| COD | m/c/d | X | [44] | |||
| TN | m/c/d | X | [44] | |||
| TF | m/c/d | X | [44] | |||
| TSS | m/c/d | X | [44] | |||
| Precipitation | N.A. | mm | X | Weather stations | ||
| Temperature | N.A. | °C | X | Weather stations | ||
| Actual evaporation | N.A. | mm | X | Weather stations | ||
BOD: Biochemical oxygen demand, COD: Chemical oxygen demand, TSS: Total suspended solids, TN: Total nitrogen, TP: Total phosphorus.
Table 2.
Scenario Descriptions.
| Scenario | Strategy | Description |
|---|---|---|
| Scenario 1 | Stormwater use | 1-m3 stormwater tanks for dwellings and 10-m3 tanks for industries, big businesses commercial, and business or office centers. |
| Scenario 2 | Stormwater use | 2-m3 stormwater tanks for dwellings and 20-m3 tanks for industries, big businesses, and business or office centers. |
| Scenario 3 | Stormwater use, wastewater treatment for the industrial and commercial sector, and reuse of wastewater in industries | 1-m3 stormwater tanks for dwellings and 10-m3 tanks for industries, big businesses commercial, and business or office centers. Wastewater treatment with removal of 40% TN, 40% TP, 40% BOD, 40% COD, and 60% TSS. Water tanks to reuse industrial waters after treatment with the 10-m3 tanks. |
| Scenario 4 | Greywater use | 0.1-m3 tank for dwellings with water from washing machines. |
| Scenario 5 | Water-saving technology | Installation of water-saving equipment in dwellings, sinks, dishwashers, toilets, and showers. |
| Scenario 6 | Combination of scenarios 4 and 5 | 0.1-m3 tank for dwellings with water from washing machines and installation of water-saving equipment in dwellings for sinks, dishwashers, toilets, and showers. |
Table 3.
Cost to pay for services and values of drinking-water consumption and sewage for Fucha and Tunjuelo catchments.
Table 3.
Cost to pay for services and values of drinking-water consumption and sewage for Fucha and Tunjuelo catchments.
| Land Use | Fixed Fee—Water Supply (USD) | Base Fee—Water Supply (USD) | Average Consumption—Water Supply Catchment Fucha (m3 month−1) | Average Consumption—Water Supply Catchment Tunjuelo (m3 month−1) | Fixed Fee—Sanitation (USD) | Base Fee—Sanitation (USD) | Average Consumption—Sanitation Catchment Fucha (m3 month−1) | Average Consumption—Sanitation Catchment Tunjuelo (m3 month−1) |
|---|---|---|---|---|---|---|---|---|
| Residential Stratus 1 | 1.58 | 0.27 | 27.6 | 22.6 | 0.8 | 0.16 | 22.08 | 15.03 |
| Residential Stratus 2 | 3.16 | 0.54 | 22.34 | 19.12 | 1.61 | 0.33 | 17.46 | 12.71 |
| Residential Stratus 3 | 4.47 | 0.76 | 21 | 19.2 | 2.28 | 0.47 | 17.46 | 12.77 |
| Residential Stratus 4 | 5.26 | 0.89 | 21.5 | 18.5 | 2.68 | 0.55 | 17.46 | 12.3 |
| Residential Stratus 5 | 11.78 | 1.38 | 26.82 | N.A. | 6.67 | 0.83 | 17.46 | N.A. |
| Industrial | 6.84 | 1.23 | 91 | 46.2 | 6.84 | 1.23 | 91 | 30.72 |
| Commercial | 7.89 | 1.34 | 30.1 | 30 | 7.89 | 1.34 | 30.1 | 19.95 |
© 2017 by the authors. Licensee MDPI, Basel, Switzerland. This article is an open access article distributed under the terms and conditions of the Creative Commons Attribution (CC BY) license (http://creativecommons.org/licenses/by/4.0/).
Share and Cite
MDPI and ACS Style
Peña-Guzmán, C.A.; Melgarejo, J.; Lopez-Ortiz, I.; Mesa, D.J. Simulation of Infrastructure Options for Urban Water Management in Two Urban Catchments in Bogotá, Colombia. Water 2017, 9, 858. https://doi.org/10.3390/w9110858
AMA Style
Peña-Guzmán CA, Melgarejo J, Lopez-Ortiz I, Mesa DJ. Simulation of Infrastructure Options for Urban Water Management in Two Urban Catchments in Bogotá, Colombia. Water. 2017; 9(11):858. https://doi.org/10.3390/w9110858
Chicago/Turabian StylePeña-Guzmán, Carlos Andrés, Joaquín Melgarejo, Inmaculada Lopez-Ortiz, and Duvan Javier Mesa. 2017. "Simulation of Infrastructure Options for Urban Water Management in Two Urban Catchments in Bogotá, Colombia" Water 9, no. 11: 858. https://doi.org/10.3390/w9110858
Note that from the first issue of 2016, this journal uses article numbers instead of page numbers. See further details here.