Article

Saltwater Intrusion and Freshwater Storage in Sand Sediments along the Coastline: Hydrogeological Investigations and Groundwater Modeling of Nauru Island

Dipartimento di Ingegneria Civile Ambientale, Politecnico di Milano, Piazza L. da Vinci 32, 20133 Milano, Italy
*
Author to whom correspondence should be addressed.
Water 2017, 9(10), 788; https://doi.org/10.3390/w9100788
Submission received: 6 August 2017 / Revised: 4 October 2017 / Accepted: 9 October 2017 / Published: 13 October 2017

Abstract

:
Water resources sustainable management is a vital issue for small islands where groundwater is often the only available water resource. Nauru is an isolated and uplifted limestone atoll island located in the Pacific Ocean. Politecnico di Milano performed a feasibility study for the development of sustainable use of groundwater on the island. This paper focuses on the first phase of the study that concerns the conceptual site model development, the hydrogeological characterization and the 2D model implementation. During the project, different activities were performed such as GNSS topographic survey of monitoring wells and groundwater level surveys taking into account tidal fluctuation. This data collection and the analysis of previous studies made it possible to identify the most suitable areas for groundwater sustainable extraction. The characterization findings suggested, unlike previous studies and surveys, the presence of only few drought resilient thin freshwater lenses, taking place in low conductivity sandy deposits, unexpectedly next to the seashore. Thanks to the 2D modeling results, it has been possible to clarify the mechanism that allows the storage of freshwater so close to the sea.

1. Introduction

The integrated and sustainable management of water resources in small island countries is a fundamental issue for health and social well-being, protection of the environment and development of the economy. Here, it becomes a very high-level priority because of the strong limited nature of resources, worsened by climate change. Recently, White and Falkland [1] provided an insight into the key climatic, hydrogeological, physiographic, and management factors that influence the quantity of fresh water and saline intrusion into small islands aquifers. The Small Island Developing States (SIDS) organization has evaluated the sustainability problems faced by its member countries in the Pacific Regional Action Plan [2]. Falkland [3] and White et al. [4] described the main concerns that currently constrain the achievement of the goal of sustainable integrated water resources management in these countries: in many islands, there are insufficient hydrological data available for the analysis and planning of water governance reforms. Werner et al. [5] have shown in their review of the state of knowledge of atoll island groundwater that over fifty years of investigation have led to important advancements in the understanding of atoll hydrogeology, but a paucity of hydrogeological data persists on all but a small number of atoll islands. The lack of data is usually due to the difficulties related to the accessibility and the lack of instruments for parameter survey. Other issues include conflicts related to the use of water resources and location of water supply systems on customary land, problems with design and implementation of projects, and insufficient community education, awareness and participation.
Water resources on small islands can be classified as either conventional or non-conventional [6]. Conventional water resources include naturally occurring water such as surface water, groundwater, and rainwater. Non-conventional water resources involve a high level of technology and often high-energy consumption, such as desalination of seawater or brackish ground water, importation, or treated wastewater. Often, in small islands, lack of surface water and large periods of absence of precipitation make groundwater the only conventional and cheaper water resource available. Climatic projections suggest a dramatic amplification of droughts [7], with significant effects on groundwater availability, as observed in many fractured-karsts aquifers all over the world [8,9,10].
Groundwater occurs on small islands as either perched or basal aquifers [11]. The first ones occur over horizontal confining layers (aquicludes), while the second ones, which are the most common form on small coral and limestone islands, consist of unconfined, partially confined or confined freshwater bodies, which form at or below sea level. On many small coral and limestone islands, the basal aquifer takes the form of a “fresh water lens” which can underlie the whole island (Figure 1). These lenses of fresh groundwater accumulate from rainfall percolating through the soil zone and reside in fragile hydrodynamic equilibrium with the underlying saltwater, separated only by slight differences in density (transition zone). Basal aquifers are, indeed, vulnerable to saline intrusion owing to the freshwater-seawater interaction, and must be carefully managed to avoid over-exploitation and resultant increase of salt concentration in groundwater [6]. However, as shown in this study, freshwater in small islands can also store next to the seashore, in the sandy parts of the coast. The hydrogeology of atoll aquifers (“dual aquifer” systems in the hydrologic literature) is unique, consisting of a surficial, relatively low-permeability Holocene carbonate sand aquifer lying on a higher permeability Pleistocene limestone or karst aquifer [12]. The hydraulic conductivity of the Holocene aquifer, where the freshwater lens resides, is generally one to two orders of magnitude less than that of the underlying Pleistocene aquifer [13]. As reported by Nakada et al. [14], low permeability materials can suppress salinization and keep the groundwater relatively fresh and recharged by rainfall, even in low-elevation areas surrounded by saline water. Asymmetry is common in the lenses of atoll islands: the freshwater lens is commonly thicker on the lagoon side than on the reef side of the island and a cross-island variation in hydraulic conductivity is the usual explanation [15].
Through field investigations, long term surveys and groundwater modeling on Nauru island, this paper means to understand the hydrogeological structures and the groundwater process that allow fresh water to store in that position. This aspect needs to be clarified in order to quantify the fresh groundwater resource and to understand if these freshwater lenses are resilient to saltwater intrusion even in drought periods. Generally, resilience describes the capability of a system to maintain its basic functions and structures in a time of shocks and perturbations and can continue to deliver resources and ecosystem services that are essential for human livelihoods [16]. From the hydrogeological point of view, groundwater resilience defines the capability of the freshwater body to maintain its function of water supply even in periods of crisis as drought or not sufficient water supply from other resources. The time frame then should be the maximum crisis period length the hydrogeological system has so far experienced. The study of Nauru’s hydrogeology is a step toward the knowledge of groundwater circulation into highly permeable aquifers, underlain and surrounded by seawater, and could contribute to improving the global knowledge on water management in these particular and fragile environments.
Nauru is an isolated raised coral-limestone atoll island [17] standing 4300 m above the ocean floor and located 41 km south of the Equator in the Pacific Ocean (Figure 2).
In 2001, the World Health Organization (WHO) [18], collaborating with Nauru public authorities, formulated a Long-Term Water Plan which has to be considered the starting point of any future water resources-related action. The main potential supply options identified by WHO for Nauru, also resumed in the National Sustainable Development Strategy 2005–2025 of Nauru [19], are: (a) extraction of freshwater from the shallow part of the aquifer; (b) collection and storage of rainwater; and (c) additional desalination plants. Point (c) looks to be the hardest one to face, since it is strictly linked to the problem of additional power energy supply based on renewable energy instead of fuel. Until 2015, an effective national integrated water resource management plan for Nauru was missing [20]. Then Nauru government published the Nauru Water and Sanitation Master Plan [21]. The plan is proposing as main supply options: (a) the collection and storage of rainwater; (b) a limited use of groundwater; and (c) building a reticulation network linking each house to desalinated water. The suggested limited use on groundwater was mainly due to the lack of knowledge of groundwater resources availability on the island.
Politecnico di Milano has been involved in a project focused on a feasibility study for the development of infrastructures for sustainable use of groundwater resources in Nauru [22]. The project, funded by Milano Municipality and related to EXPO 2015, aimed to seize the opportunity to enable the island to take an additional step toward a sustainable water supply, starting from the WHO results/directives [18,19,20] and providing Nauru with a new and improved system for groundwater exploitation. The characterization and modeling approach described in next pages could be followed by Pacific, Caribbean and Mediterranean islands that suffer the same problem. The entire project consisted of three steps: (1) development of the conceptual site model through the geological and hydrogeological characterization of the island; (2) implementation of 2D and 3D density-dependent flow and transport groundwater numerical models on the part of the island, which turned out to be more suitable for the groundwater development; and (3) study and preliminary design of infrastructural actions for groundwater sustainable exploitation. This paper focuses on the first step of the project and on 2D model results analysis that have made possible to clarify the mechanism for storing freshwater next to the seashore.

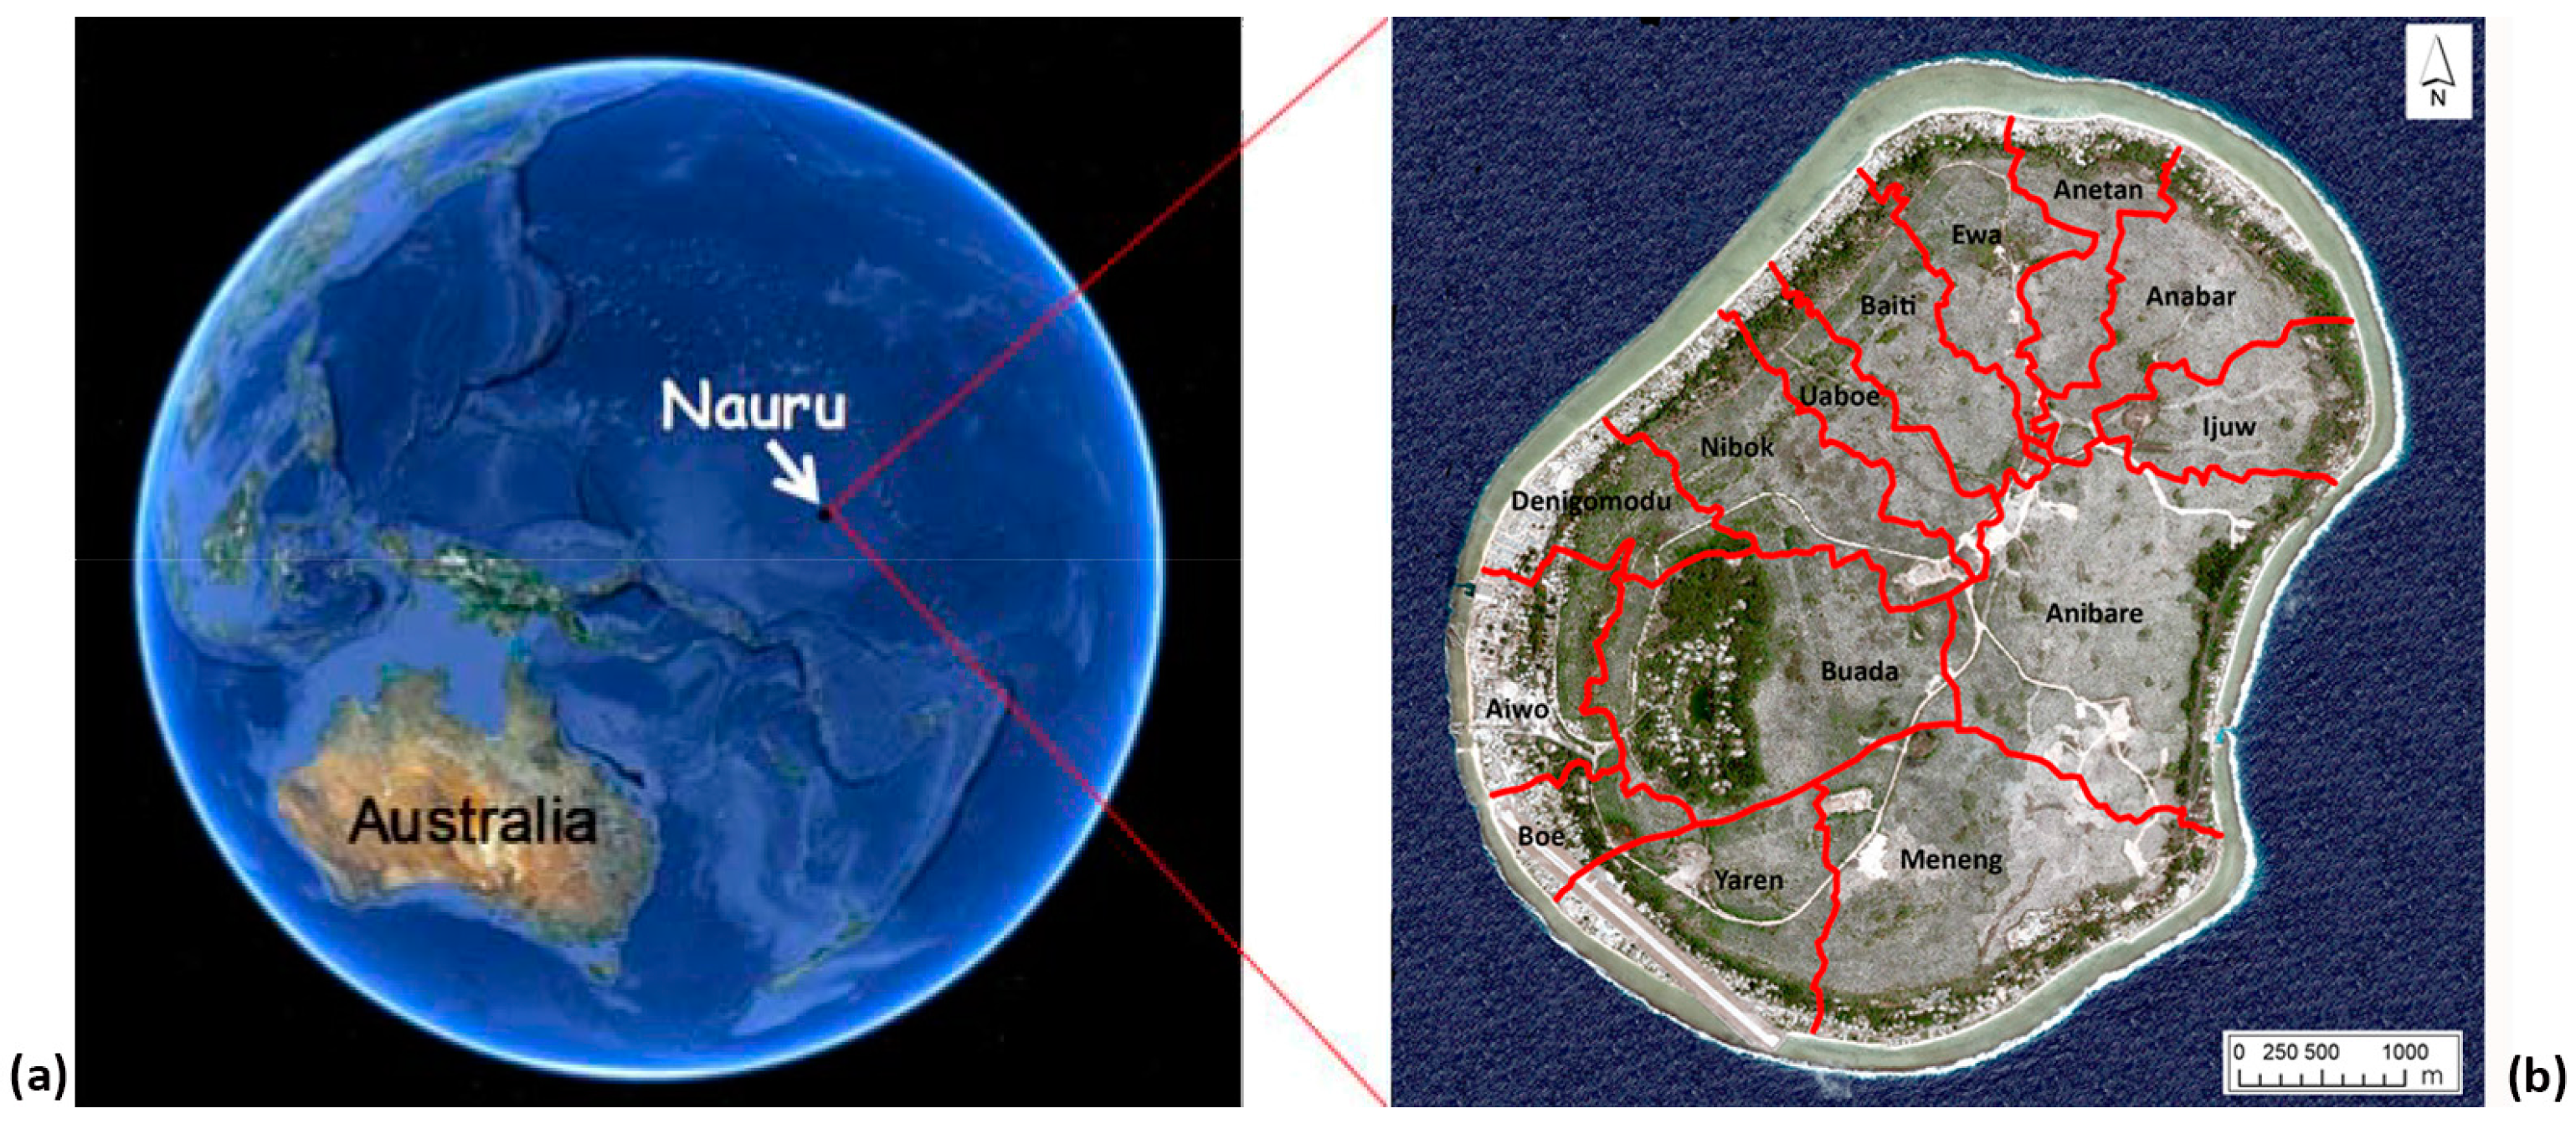
1.1. Nauru: Overview of the Island

Nauru has an oval shape, with an extension of about 22 km2, and its 30 km of coastline are surrounded by a fringing coral reef 120–300 m wide (Figure 2). It is an independent state with a 2016 population of 9591 inhabitants. In the early 1980s, the island experienced a long economic wellbeing period thanks to the mining of the tricalcic phosphate deposits that originate from the droppings of sea birds. However, intensive phosphate mining has made 80 percent of Nauru’s land very unusable (Figures S1–S3 in Supplementary Materials).
The climate of Nauru is hot and humid with mean daily temperatures of 29–31 °C and a mean minimum daily temperatures of 24–26 °C [23]. Annual rainfall data from 1946 show a mean annual rainfall of about 2100 mm, with a high variability (Figure S4 in Supplementary Materials). The wet season usually stretches from December to April, although El Niño Southern Oscillation (ENSO) events have a very strong impact on precipitation: a negative Southern Oscillation Index (SOI) is in high correlation with periods of high rainfall (El Niño period); conversely a positive SOI indicates periods of drought (La Niña period) as reported by Falkland [24]. El Niño phenomenon usually lasts for about 18 months and occurs on average every four years, although it is not completely predictable.
The total water for Nauru demand was estimated to be 1500 m3/day of potable water and 1000 m3/day of non-potable water. Today, potable water is supplied through the operation of the Nauru Phosphate Company (NPC) desalination plant in conjunction with the power station. This plant supplies 950 t/day of high quality potable water (1998/2001 data). Additional potable water is captured by houses through rainwater harvesting. The present supply of potable water can meet the population demand in rainy years, but not in dry years or when the plant runs low due to technical issues or the high oil prices.
The main concentration of groundwater wells is located along the coastline and around Buada Lagoon, where pumping or bailing are the methods used for water extraction. Groundwater is used in the island, even though in most wells it does not meet WHO drinking water standards set at 1000 mg/L of Total Dissolved Solids (TDS) [25]: consumption is mostly related to flushing toilets, showers and house work. However, during drought periods, it is used for wide purposes even in those areas where the TDS content is very high (e.g., for cooking/boiling and animals breeding). Acceptability of groundwater quality may vary not only according to the season but also depending on local circumstances: water tanks and rainwater harvesting systems maintenance, delays in delivery of desalinated water and people awareness about water quality/risks. For this reason, Jacobson et al. [26] suggested to set an upper limit for drinking water at 1500 mg/L of TDS.

1.2. Previous Hydrogeological Studies

Several hydrogeological studies on Nauru Island have been conducted in the past but few of them are reported in scientific publications. Jacobson et al. [26] have previously carried out hydrogeological studies of Nauru Island during the 1980s. The studies included core drilling, water electrical conductivity (EC) measurements inside drilled boreholes, and electrical sounding for determination of resistivity profiling on the island. The studies resulted in the construction of a conceptual model of the underlying geological units of the island and the distribution of groundwater with the location of freshwater/saltwater interface. From the analysis of core drilling samples [27], the underlying rock resulted to be made up by limestone intensely karstified up to at least 55 m below sea level. The water table had an average level of 0.3 m above the sea level, with water flowing radially towards the sea.
The freshwater was evaluated to lay above a 60 m thick transition zone. The hypothesis made during these studies is that the thickness of mixed water may be due to high hydraulic conductivity of the limestone present in Nauru subsoil. As known, an important contribution to this high conductivity is the presence of karstic systems, which allow free and quick movement of seawater inland, behaving as a source of saltwater [28]. Another factor responsible for the wide transition zone was detected in the tidal fluctuations, which ranged from 0.33 m below mean sea level to 0.51 m above sea level [27]. A reversal of hydraulic gradient at the shoreline was identified, with drainage outwards at low tide, and seawater flow inwards at high tide. The tidal effects looked to have a significant influence on groundwater levels too, being about half of the amplitude of the ocean tidal stage throughout the island. Unlike the rest of the island, the Buada Lagoon levels had shown a lack of tidal response suggesting the idea that the lagoon is an independent system in which the lowering water levels could be potentially induced by evapotranspiration in drought periods [26]. Jacobson and Hill [27] in 1987 did a groundwater EC survey for determining the position of freshwater lenses in the island subsoil. Two large freshwater lenses (with thickness greater than 7 m) were firstly identified [27], one located close to the Buada Lagoon depression, covering approximately 2.4 km2, and the other on the north-central part of the island, extending for about 1.3 km2. A threshold concentration of 1500 mg/L TDS was used for the localization and estimation of the freshwater lenses thickness [29]. However, the freshwater lenses located in the Topside area seemed not to be resilient: by contrast to the first investigations, in 2008, Falkland [24] performed a groundwater EC survey, after an extended dry period, showing very limited fresh groundwater resources, except for some boreholes by the northern coastal fringe in Ewa and Anetan districts, suggesting the possible presence in that area of a small freshwater lens resilient to sweater intrusion even in periods of droughts.
One of the most recent documents regarding groundwater assessment in the island is by Bouchet and Sinclair [30]: an EC survey was taken in 283 domestic wells on the coastal fringe of the island in the period March–April 2010. Considering the water of those wells fresh with a value of electrical conductivity smaller than 2500 µs/cm, the study reported an average freshwater thickness in the coastal fringe of about 0.8 m. These measures were taken at the end of a period of 8 months with rainfall above the average value. This suggested a quite significant impact of rainfall on groundwater salinity and a quick response of the system to rainfall changes. The 2008 and 2010 surveys [30] show that groundwater in Nauru is highly sensitive to climate variability, and therefore highly vulnerable, as already underlined by White and Falkland [7,31]. Nevertheless, the reason of the presence of these lenses was not clarified and the freshwater amount stored underground was not quantified.

2. Materials and Methods

This paper takes the main information from the activities completed by the authors during the project developed by Politecnico di Milano. This project (2010–2015) aimed to start the exploitation of groundwater resources addressing the extraction from the fresh surface layer of groundwater. For this reason, the study has been carried out to investigate the current situation of seawater intrusion in the Nauru aquifer. Starting from the data available in previous studies, in this work, the hypothesis arose that freshwater accumulates in the sandy part of the island, close to the coastline. The intent of the project was then to further the conceptual model of the island and verify the hypothesis of freshwater storage, in order to evaluate where more resilient fresh groundwater lenses are present and accordingly address groundwater extraction in the more feasible zones. Politecnico di Milano has carried out the field activities in collaboration with the Nauru Rehabilitation Company (NRC) and Ministry of Commerce, Industry and Environment (CIE) technicians. The results reached in the different steps of this study are deeply described in the documents [32,33,34,35] available on the Nauru project website [22].

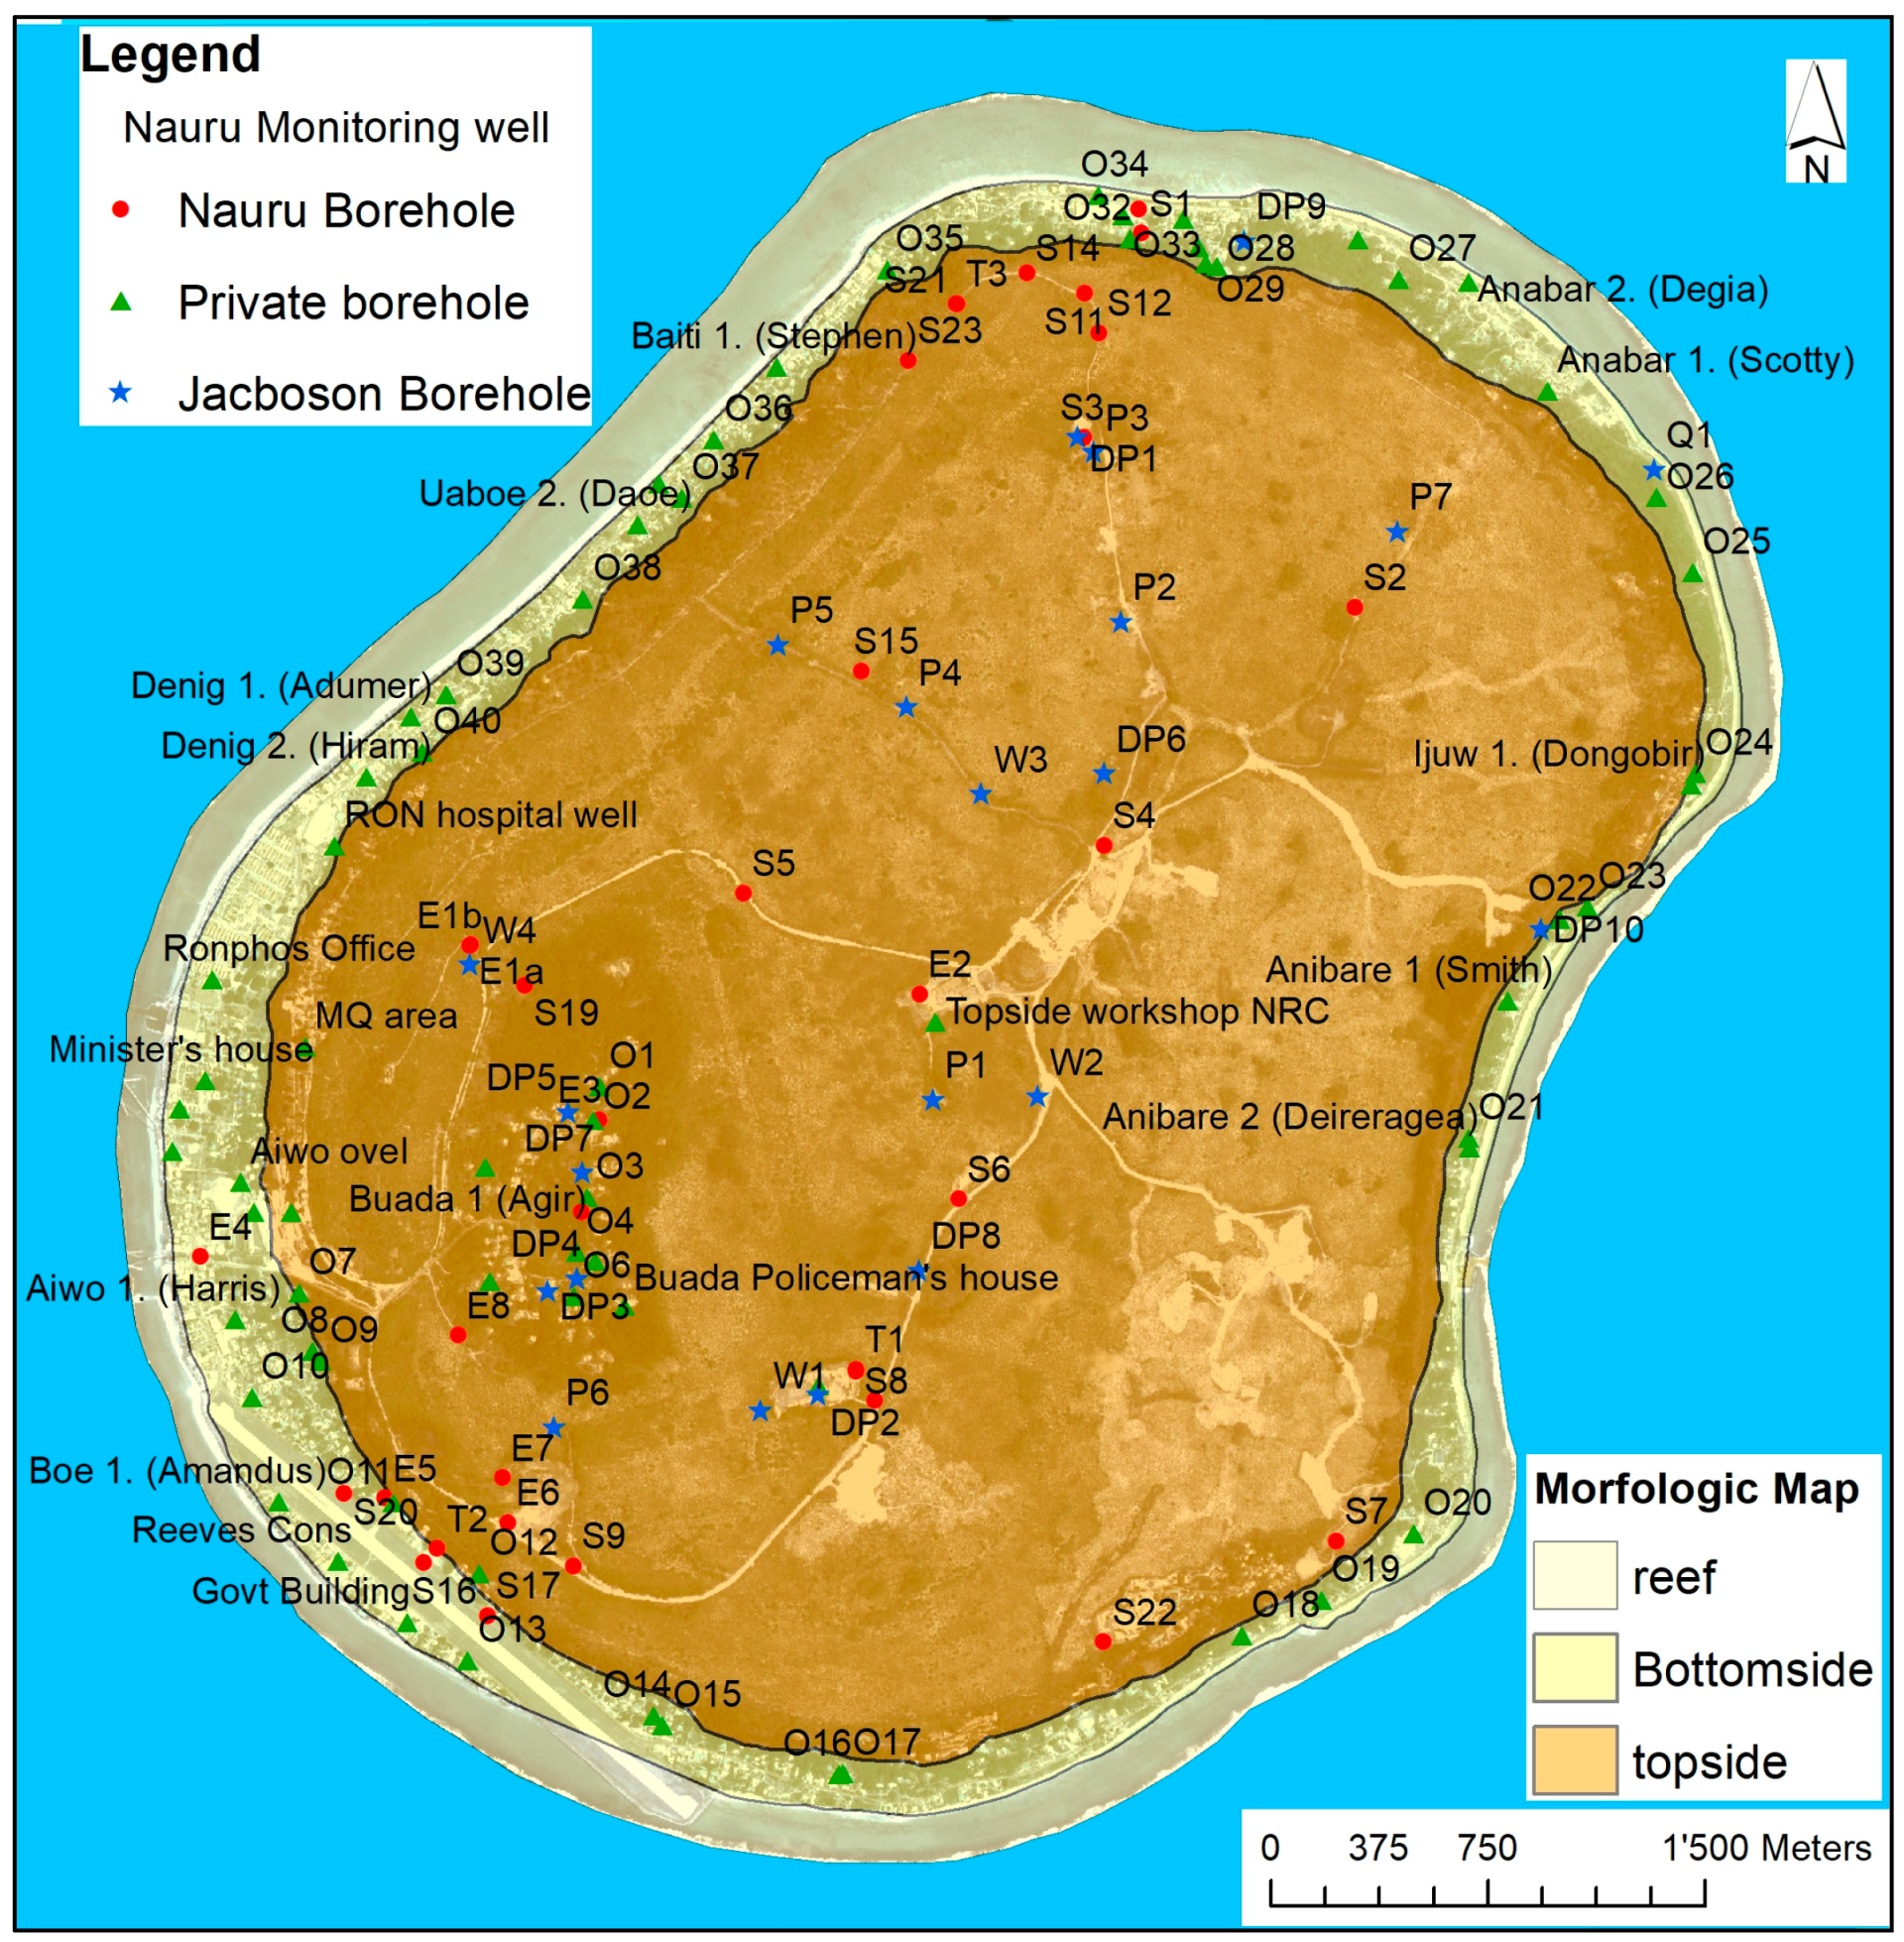
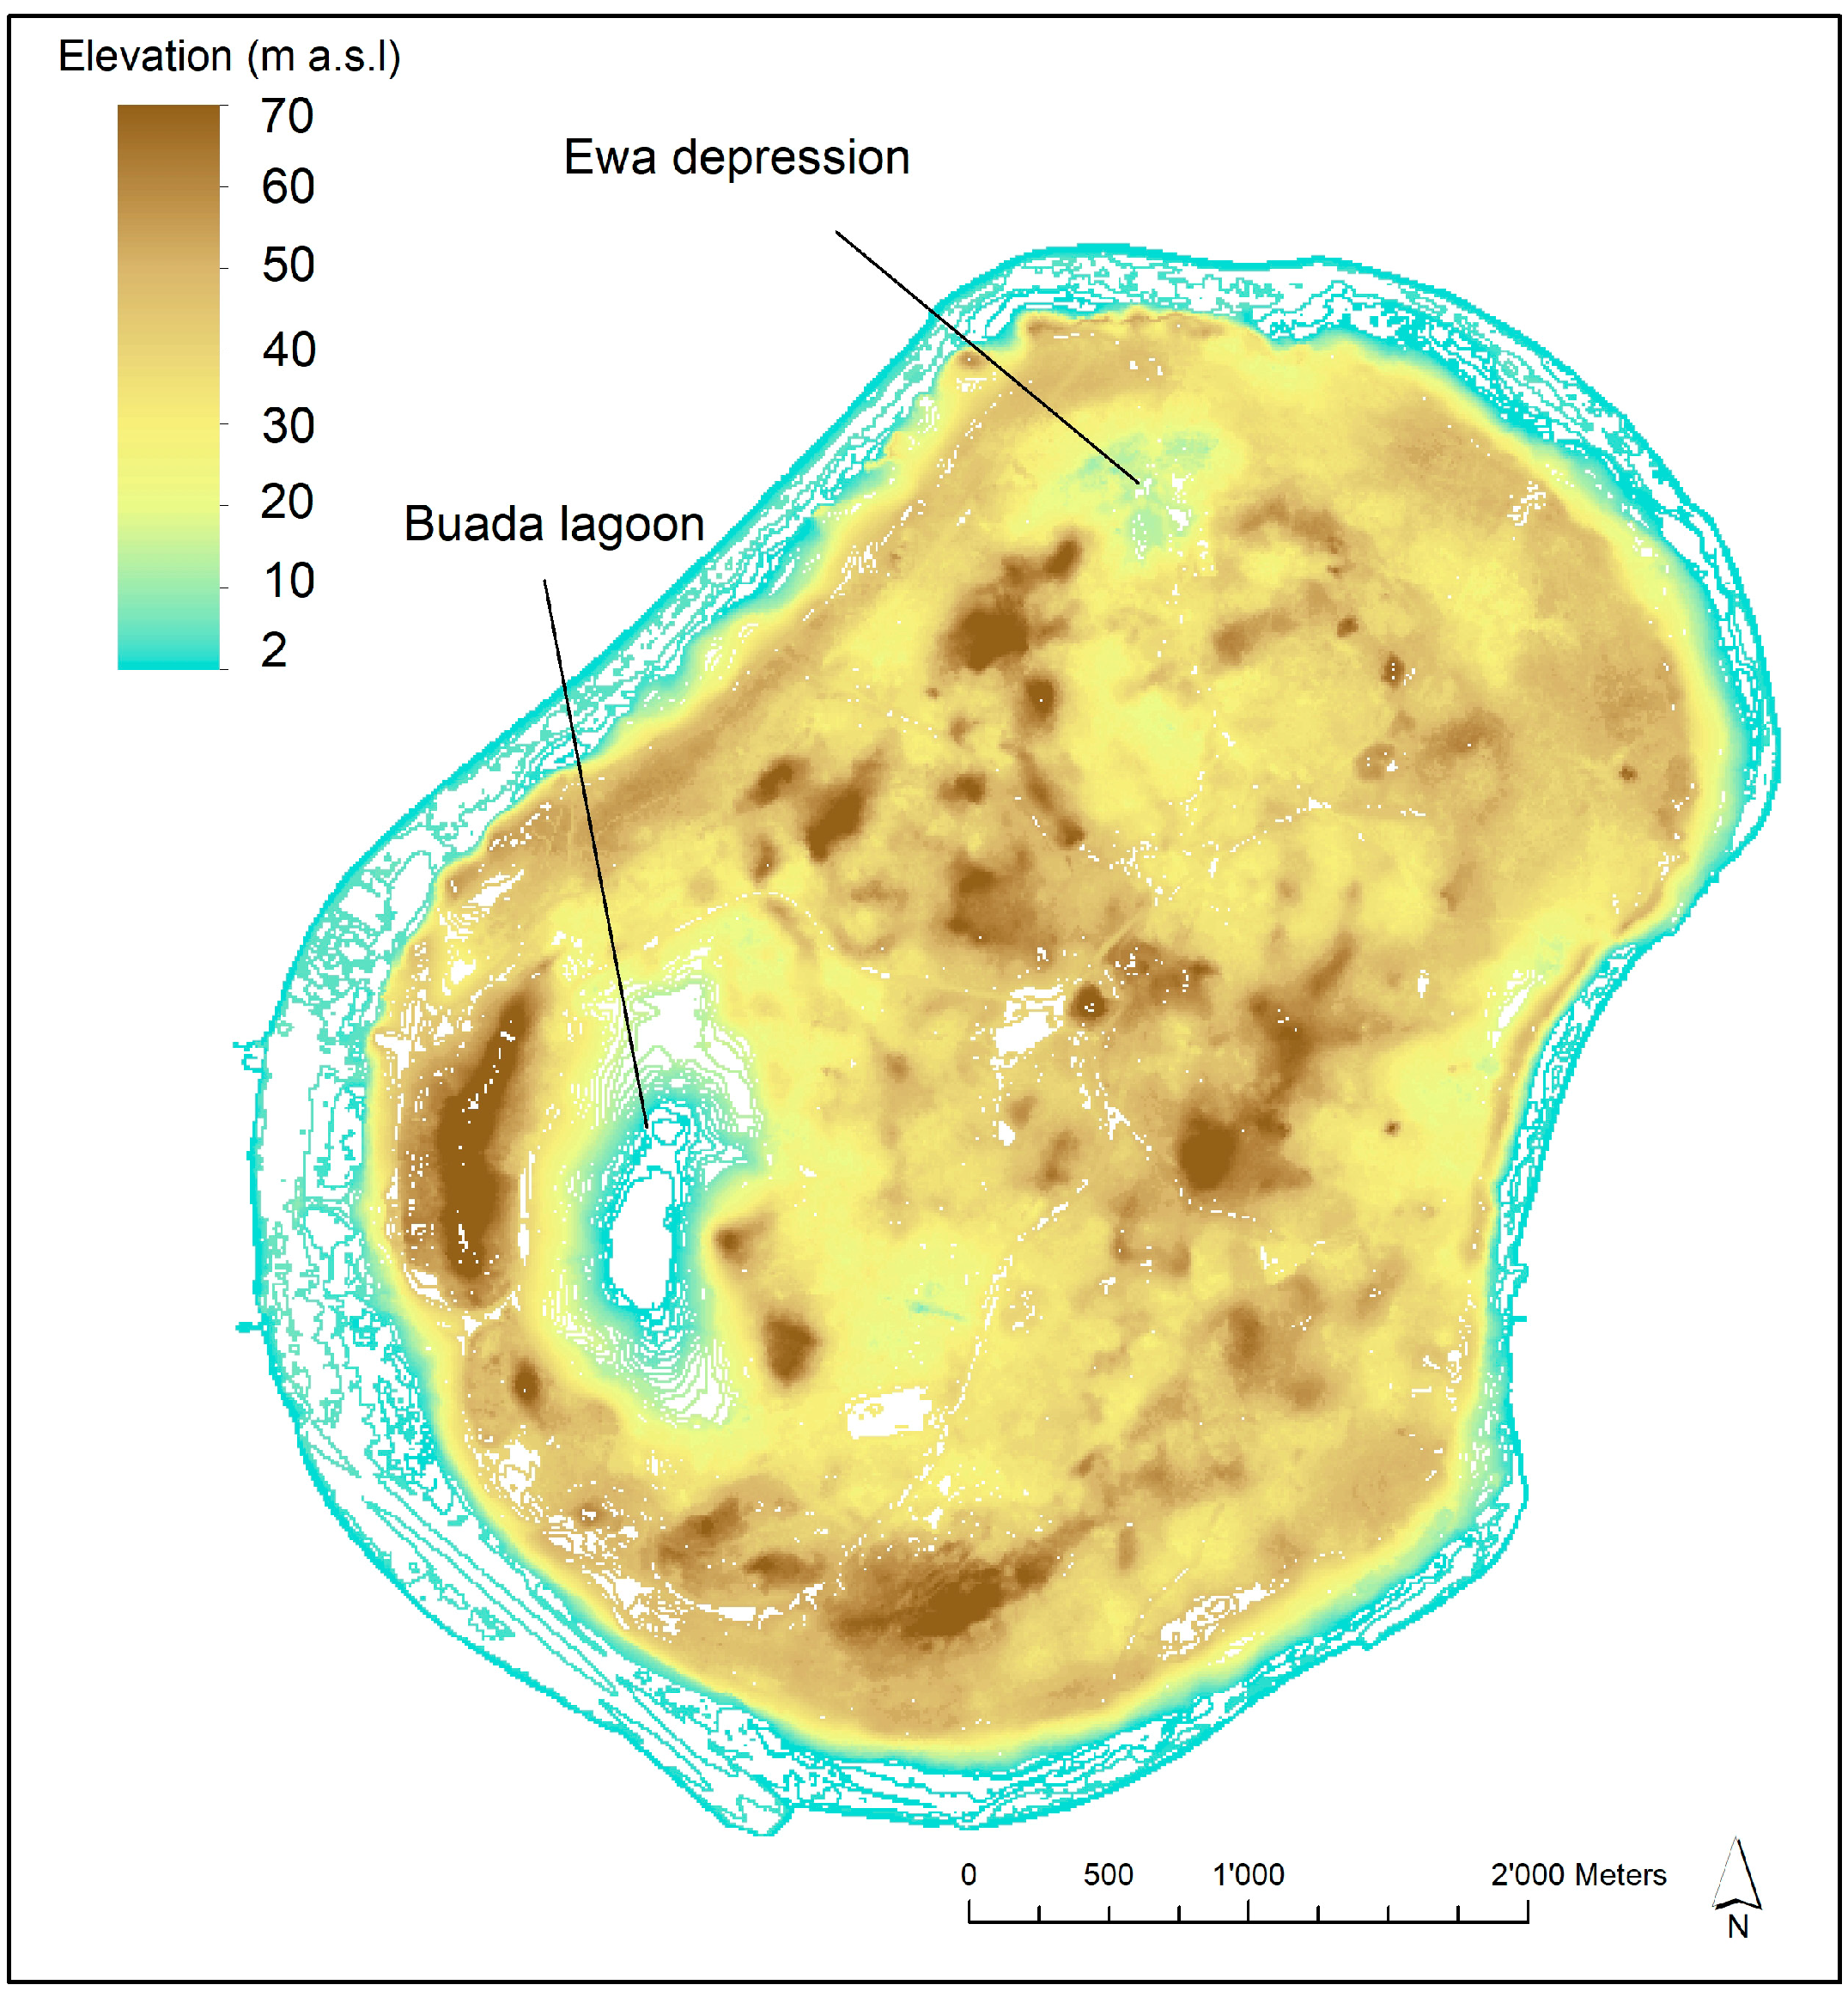
2.1. Island Characterization

2.1.1. Geomorphology and Geology

The land area of Nauru consists in a narrow coastal plain, which encircles a limestone escarpment. From a morphological point of view, the island is divided in three parts: Topside, Bottomside and Fringing Reef (Figure 3). The lowest zone (Bottomside) is the coastal plain that presents a maximum width of 400 m and with an elevation ranging from 0 to 10 m a.s.l. The Bottomside consists of a sandy or rocky beach on the seaward edge and a beach ridge or foredune, behind which are either relatively flat ground or, in some places, low-lying small lagoons, filled by brackish water (Ijuw and Anibare districts, Figure 2). Scattered limestone outcrops or pinnacles are found on both the coastal plain and on the intertidal flats of the fringing reef, with particularly good examples in the Anibare Bay area. The Fringing Reef encircles the whole island and extends from the coastline for about 150 m; the maximum width, about 250 m, is reached in the northern part, close to the Ewa and Anetan districts.
The transition between the Bottomside and the Topside is a scarp about 30 m high. Relative elevations on the plateau generally vary between 20 and 45 m a.s.l.; the highest point on the island, Command Ridge, is located in the west and presents an elevation of 70 m a.s.l. The outstanding topography after completion of primary phosphate mining is a pinnacle and pit relief.
On the southwest-central part of the island, there is a wide and fertile depression (about 120,000 m2), where a brackish water lake known as Buada Lagoon is located. This is the only surface water body (38,000 m2) existing on the entire island. Another depression, Ewa depression, is located in the northern sector (Figure 4) and extends for about 200,000 m2. Unlike the Buada Lagoon, the Ewa depression is dry, although we might formulate the hypothesis that also there a lagoon was present in the past.
The first phase of the characterization was the Digital Terrain Model (DTM) implementation from the photogrammetric survey carried out by NRC in 2009 and elaborated by Politecnico di Milano during the first months of 2010. Using the developed DTM, it was possible to distinguish the low-lying zones from the most elevated ones (Figure 4 and Figure S5 in Supplementary Materials) with the aim of evaluating preferred runoff zones or areas where rainwater can accumulate. In a preliminary phase, this also allowed knowing the elevation of the stratigraphic logs and wells available in the area before the topographic survey was carried out.
The information related to the subsoil has been drawn from the 127 geo-referenced wells present in the island (Figure 3). Some of these points are now used uniquely for groundwater level and electrical conductivity monitoring (35), while others (22) have been realized for the previous studies [26] but are nowadays impossible to be tacked down or used. The rest are private wells used for domestic purposes and rarely monitored by public authorities.
From the subsoil data, it has been possible to define the geological setting of the island. The whole Bottomside consists of coastal homogeneous sandy sediments that are present until about 5 m from the ground. Below these sediments, there are the carbonate rocks, as documented by Jacobson et al. [26], that distinguished the pliocenic dolomitic limestone located on the Topside from the pleisto-holocenic limestone that constitute the reef. From a geological point of view, the Topside consists of a matrix of coral-limestone pinnacles and limestone/dolomitesoutcrops, between which lie extensive deposits of soil and high-grade tricalcic phosphate rock. The phosphate has been mined for the past century. Due to the mining activity, the topsoil layer of around 75% of the island has been exploited cutting the natural vegetation quite completely [36,37,38]. The karst phenomenon in Nauru is very diffuse and the limestone assumes Karren shapes. Ewa depression can be interpreted as a sinkhole that formed because of subsidence phenomena. The stratigraphic logs highlight the great number of voids and caves present in the subsoil and caused by the karstic phenomenon; this phenomenon had modified and altered the groundwater flow, creating caves that in some cases may be observed at the ground level (Moqua and Anetan caves). The stratigraphic log analysis and the conceptual site model developed in this study lead to the conclusion that, from a hydrogeological point of view, it is possible to identify two aquifers in the island: one is represented by the Bottomside (made of sandy sediments), the other is located in the limestone and dolomite that make up the rest of the island. These two aquifer systems are connected vertically and laterally, as there are no separating low permeability levels. Probably, water rapidly crosses through the Topside and then slows down in the sandy aquifer of the Bottomside before discharging into the sea.

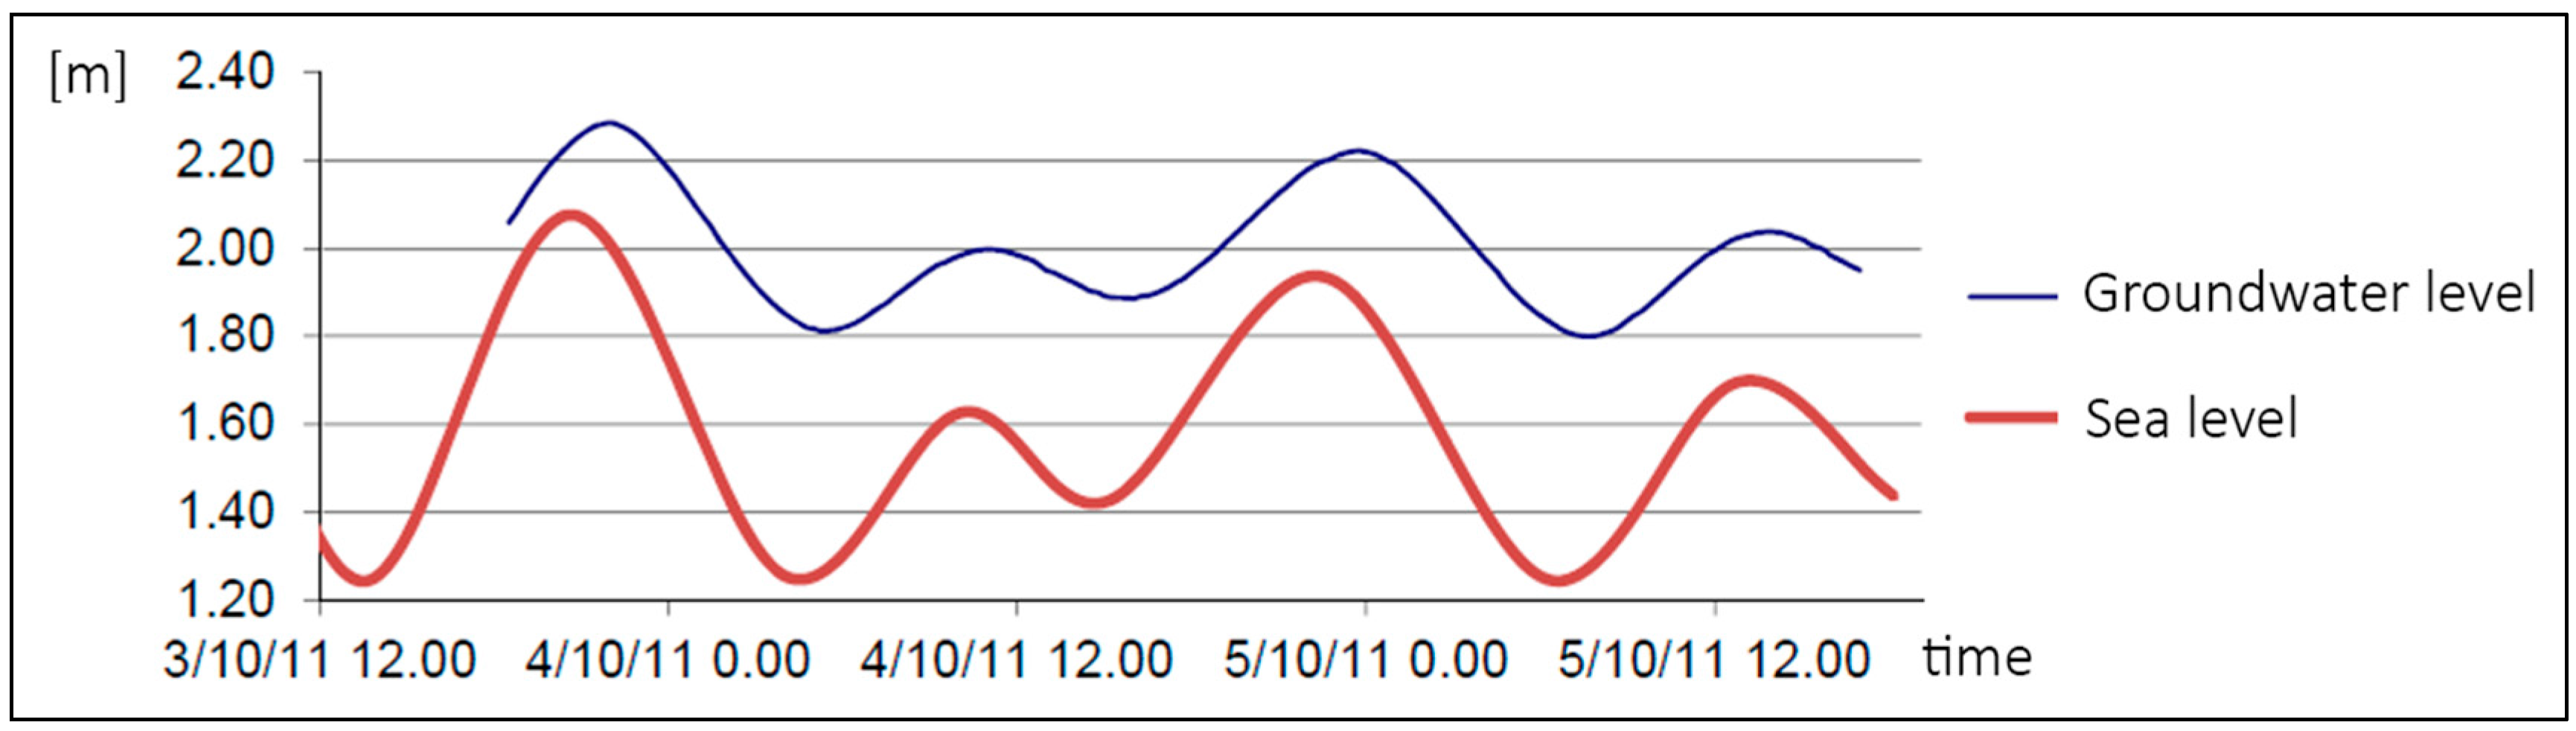
2.1.2. Piezometric Survey—Nauru Datum and Tidal Correction

To obtain a confirmation of the definitive conceptual site model and get data useful for the successive calibration of the numerical model, different piezometric surveys have been carried out by Politecnico di Milano. The identification of the flow field in presence of low hydraulic gradient needs an accurate knowledge of the monitoring point’s elevation. For this reason, in October 2011 Politecnico di Milano researchers performed a GNSS (Global Navigation Satellite System) survey and 35 monitoring wells plus seven private wells have been geo-referenced, using two double frequency GNSS receivers (Table S1 in Supplementary Materials). One of the two receivers has been used as “master station” and has been located in a fixed point close to the NRC office. The second receiver has been used as rover, estimating the position of the remaining points. The double-difference method (with the point surveyed with the master station) has been used to post-process the data. This method consists in the evaluation of the differences in measurements obtained by the two different GNSS receivers observing more than two different GNSS satellites at the same time. This technique allows the removal of systematic errors due to receivers and satellites; for short base length (as in Nauru case), it also allows to considerably reduce the atmospheric signal propagation errors [34]. After the post-processing of the GNSS observations, the ellipsoidal heights of all the points have been obtained with a formal variance smaller than 1 cm.
Jacobson and Hill [27], for the first time, conducted a hydrogeological survey in Nauru and adopted a Reduced Level (RL) as reference point for all their measurements. Even today, all the hydrogeological data collected in Nauru are referred to RL (Figure S6 in Supplementary Materials). Thus, the measurements performed during the present GNSS survey needed to be linked to RL. However, the tide data provided by the Australian Bureau of Meteorology are referred to the Nauru Island Datum (NID), which corresponds to the zero tide gauge, located 0.166 m above the RL [39]. For the present study, the tide data have been corrected to refer them to the RL (Figure S7 in Supplementary Materials).
The Australian Bureau of Meteorology records the hourly tidal variations in the Aiwo district. Nauru Island has a micro-tidal regime and the average amplitude of the tidal signal is currently of about 130 cm compared to the mean sea level. It is a bit higher than the value reported in their study by Jacobson e Hill [27]. In the 2001–2011 decade, a maximum value of 3.15 m has been recorded in 2001 and a minimum of 0.36 m in 2011, compared to the RL [39]. In this study, 14 monitoring wells have been used to observe the groundwater variations related to the tidal fluctuations (Figure 5).
Falkland [24] had previously evaluated for the SIDS some parameters that characterize the groundwater variability in response to the tidal signal. Table 1 shows the average Tidal Lag and Efficiency of the tide calculated by Falkland in each monitoring well: the Tidal Lag (TL) expresses the delay between the occurrences of a tide maximum/minimum and the related maximum/minimum observed in the monitoring well. The Efficiency of the tide (E) is calculated as the ratio between the difference of maximum/minimum levels observed in the monitoring well and the related tidal difference (∆G and ∆T in Figure 6).
Implementation of a piezometric survey on the whole island needs about 5 h and this makes the measures influenced by the tidal event related to the monitoring time. In previous piezometric surveys, this issue has never been considered. Thus, here is proposed a method for data correction, developed during the project to adjust the measured levels by considering the tidal effect. Knowing the Tidal Lag (TL) and the tide Efficiency (E) for each measured monitoring well, it was possible to correct the measured groundwater levels referring them to the same time, as the measurements in all the monitoring wells have been done concurrently.
The correction process consists of four phases:
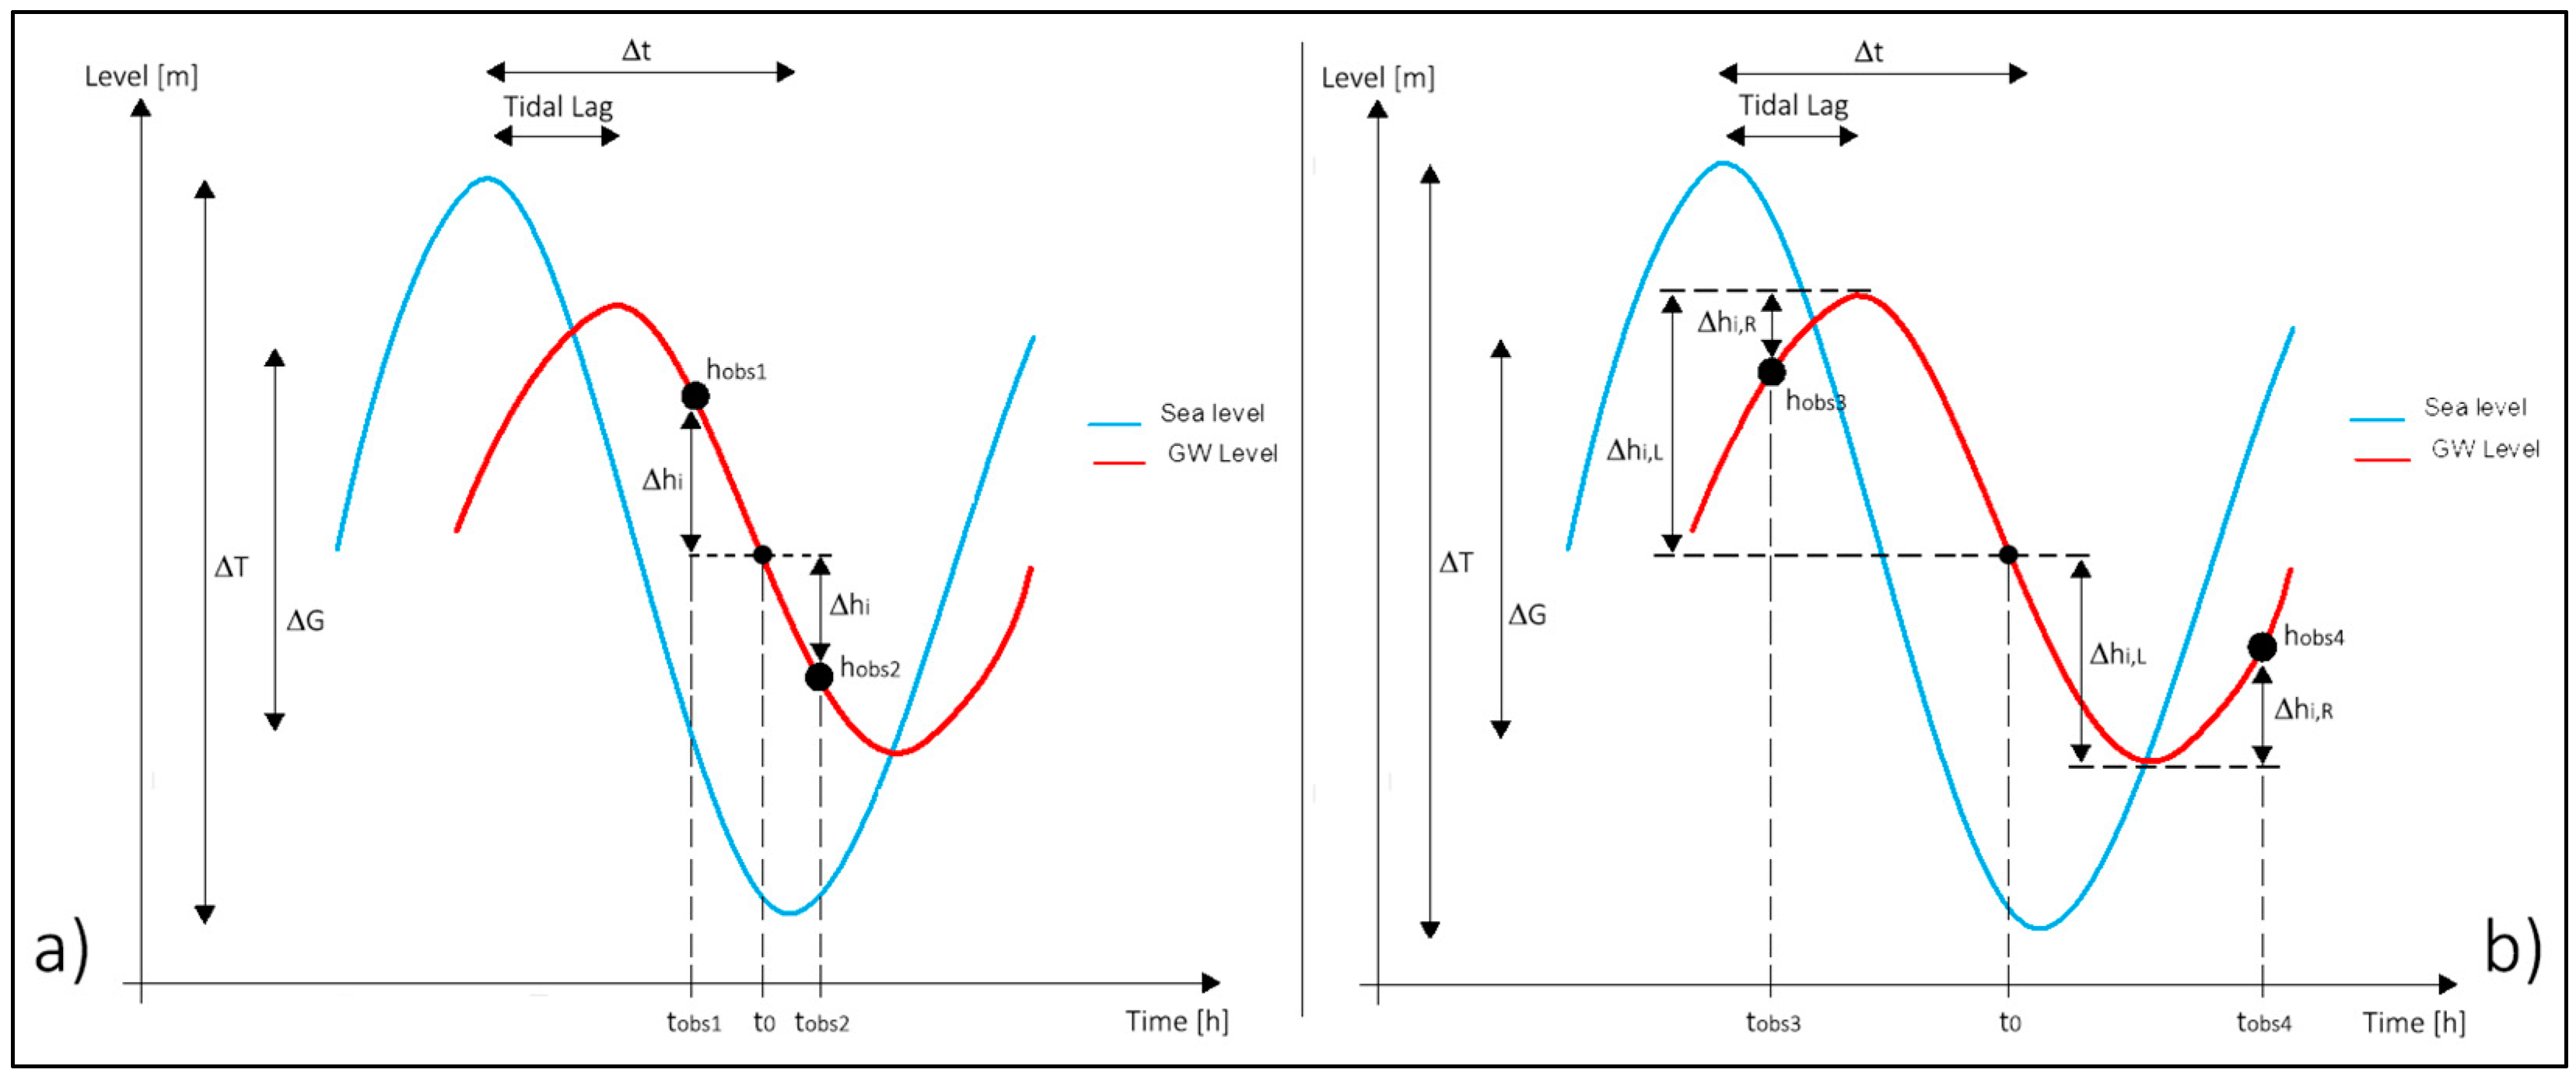
  • Reference time definition: A reference time (t0) is fixed with the aim of referring all the field measurements to a standard time. Furthermore, tobs is defined as the real time corresponding to the instant when the hydraulic head is observed in the monitoring well.
  • Tide maximum variation definition: Analyzing the tide fluctuation curve it is possible to calculate the difference between minimum and maximum tide levels (∆T) that occur just before and after the groundwater head measurement. ∆t is the time lag between minimum and maximum tide level occurrences. Furthermore, the Tidal Lag (TL) can be used to evaluate the occurrence of the maximum or minimum level in the observed monitoring well. For the Nauru case, all tide data need to be corrected compared to the RL.
  • Correction factor estimation: The correction factor (∆hi), which should be applied to the groundwater level measured at tobs, can be calculated through the following equation:
    h i = E i T t   | ( t 0 t o b s ) |
    where ∆T/∆t represents the tide level variation velocity and Ei is the efficiency for the monitoring well i. Consequently, (EiT/∆t) is the groundwater level variation velocity due to the tide influence in the monitoring well considered.
  • Groundwater level correction: Four cases are possible, as summarized in Figure 6:
    • The observation time (tobs) and the reference time (t0) are both between the same maximum and minimum groundwater levels and the head in the monitoring well (hobs1) has been observed before the reference time t0 (Figure 6a)—in this case, ∆hi must to be subtracted from hobs1.
    • The observation time (tobs) and the reference time (t0) are both between the same maximum and minimum groundwater level and the head in the monitoring well (hobs2) has been observed after the reference time t0 (Figure 6a)—in this case, ∆hi must to be added to hobs2.
    • The observation time (tobs) falls before the maximum groundwater level but the reference time (t0) is after the same maximum (see hobs3 in Figure 6b)—in this case, the correction must account for the fact that from tobs to t0 the groundwater level increases and then decreases. This means that ∆hi must be added to hobs3, but now it should be considered that ∆hi = (∆hi,R − ∆hi,L) where ∆hi,R is the correction during the groundwater rising phase and ∆hi,L is the correction during the groundwater lowering phase.
    • The observation time (tobs) falls after the minimum groundwater level but the reference time (t0) is before the same minimum (see hobs4 in Figure 6b)—in this case, the correction must account for the fact that from t0 to tobs the groundwater level decreases and then increases. This means that the ∆hi must be added to hobs4, but now it should be considered that ∆hi = (∆hi,L − ∆hi,R) where ∆hi,L is the correction during the groundwater lowering phase and ∆hi,R is the correction during the groundwater rising phase.
On the island, 23 piezometric surveys have been performed from June 2008 to April 2013 and interpolation after measures correction are showed in Results section.

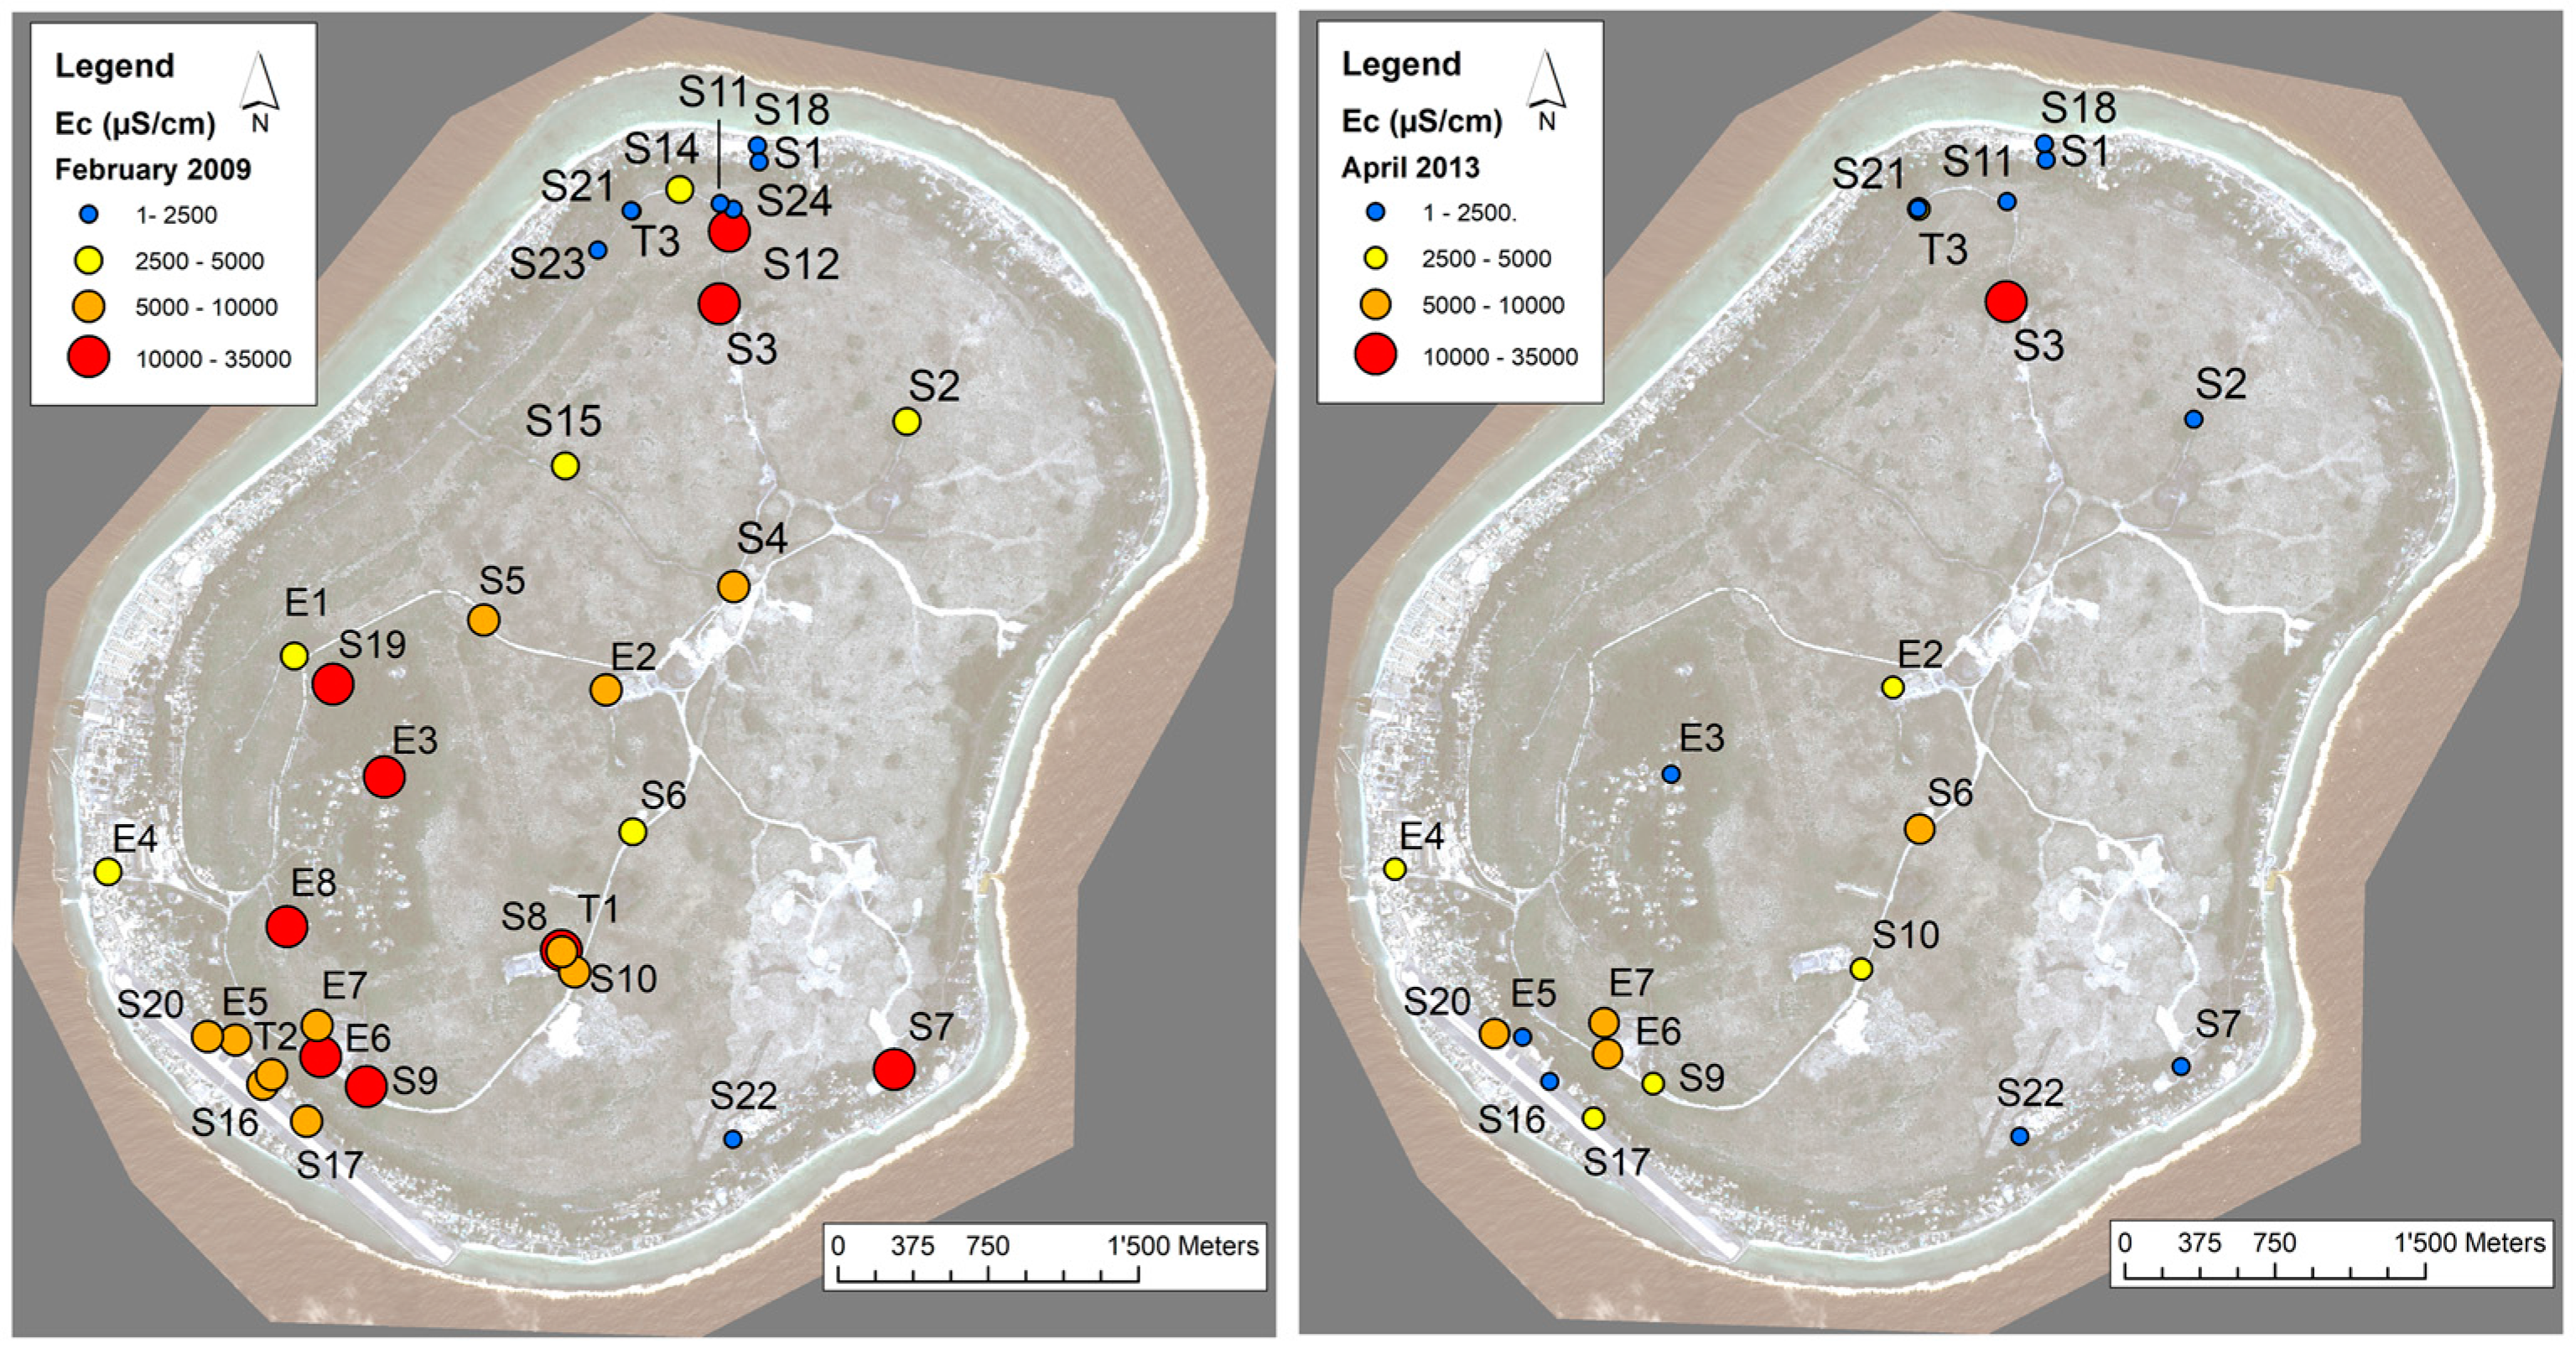
2.1.3. Electric Conductivity Survey

Since 2008, during the piezometric surveys, the EC was measured at the surface and at the bottom of each monitoring well. In this way, the concentration distribution in plant and along the depth has been assessed. The monitoring wells in the southern part of the island show EC values always higher than 10,000 µS/cm. More in detail, the EC in the monitoring wells located in the northern sector along the coastline is around 520 µS/cm, while the internal monitoring wells (S11, S21, S23, S24 and T3) show an average value of 1300 µS/cm. The points located in the Topside, far from the northern sector, have higher values, often above the potable threshold value. In particular, close to the Buada Lagoon (E3, E7 and E8), the EC average values are around 11,300 µS/cm and the monitoring wells located in the airport area (Boe-Yaren districts) have elevated values of the parameter (around 5400 µS/cm). The monitoring well S3 always show very high values of EC (22,600 µS/cm), independently from the rainfall distribution. These high values can be justified by the fact that this zone had been used to deposit the sea sediments resulting from the building of the harbor facility at Anibar bay [40].
The data from the literature and the ones collected during this project have allowed drawing the following maps, where it is possible to see the salt concentration evolution into the Nauru aquifer from 2009 to 2013 (Figure 7 and Figure S8 and Table S2 in Supplementary Materials).

2.2. Bi-Dimensional Numerical Model

To understand the cause of fresh water storage in the Bottomside area, a 2D steady state modeling phase was started, using the MODFLOW/SEAWAT finite difference codes [41,42]. The 2D model represents a preliminary study phase, preparatory to the hydrogeological parameter calibration for a following full 3D model implementation. For the bi-dimensional modeling, one section has been selected, the trace of which is shown in Figure 8. Section AA’ has been chosen passing through the northern sector of the island, characterized by the thickest freshwater. The section has also been identified on the base of the position and number of monitoring wells and the head and concentration data available for the calibration process.
Given that this is a problem of saltwater intrusion, the vertical discretization has been made very fine in the coastal zone where 1 m cells have been chosen (Figure 9). The cell size becomes bigger as we move inland, until a maximum size of 10 m.
For the vertical discretization, 18 layers have been set. The layer thickness increases from the surface to the bottom of the model (at −60 m respect to the RL) from a minimum value of 0.5 m for first four layers to a maximum of 7.5 for the last three. Constant head (1352 m above RL) and concentration (35.7 kg/m3 from Ghassemi et al. [29]) boundary conditions have been assigned at the borders of the two sections from the eighth layer to the last one. The layers above have been assigned boundary conditions to represent the sea bottom slope from the coastal line to the reef. Even though the hydrogeological investigation carried out in Nauru did not measure hydraulic conductivity, Jacobson and Hill [27] reported values for other limestone atoll islands where this parameter ranges between 1000 and 3500 m/day. For the assignment of parameters, the chosen initial values, uniform in the all model domain, have been the ones used by Ghassemi et al. [29] as shown in Table 2.
The initial simulation has been run for a 200-year period, using an average recharge (540 mm/year) in order to simulate the natural extension of the saltwater wedge. The model was then calibrated in accordance to the head and concentration data relating to the 2010 survey carried out in wells and monitoring wells located along the section. The performed sensitivity analysis has shown that the model is highly influenced by horizontal hydraulic conductivity and dispersivity. As Ghassemi et al. [29] did not consider the presence of sand sediments along the coastline, the calibration process in this study has mainly considered monitoring wells S1 and S18 (Figure 8) located in that zone (Ewa and Anetan districts ), where the limestone is replaced by sand sediments in the shallow part of the aquifer. On these two points, the concentration values at different depths were available and have been used to compare the model results with real data. The calibration process followed a trial and error approach using 16 concentration data collected at different depths in eight multi-pipes monitoring wells. In Table 3 statistical results of the calibrated model are presented and the graphs in Figure 10 depict a detailed observed/simulated comparison along the depth in S1 and S18.
The calibrated hydraulic conductivity distribution adopted is the one shown in Figure 11 where the limestone zone (white part) is assigned Kx = Ky = 800 m/d, whereas the sand zone (red) is assigned Kx = Ky = 40 m/d (the ratio 0.1 is used for Kz).
Even the dispersivity value has been the object of the calibration phase. In fact, tidal effects can produce considerable impacts on seawater intrusion processes in mixing zones. La Licata et al. [43] simulated seawater intrusion with and without tidal effects on a mixing zone; their results indicated that tidal mixing results in more mixed pollutant and salinity concentrations than the distributions from an equivalent steady-state model without tidal effects. For this reason, the dispersivity value has been slightly modified compared to Ghassemi et al. [29] on the limestone zone (50 m, 5 m and 0.2 m for longitudinal, transverse and vertical dispersivity, respectively), whereas it has been assigned a different value on the sandy coastal zones (2 m, 0.2 m and 0.008 m). The increase in the dispersivity values in the limestone zone was also necessary to represent the role of the karstic canals that characterize the internal part of the island. Campana and Fidelibus [44] used in their model values that ranged 2–100 m to represent a gypsum formation characterized by variously oriented fractures and karst features.

3. Results

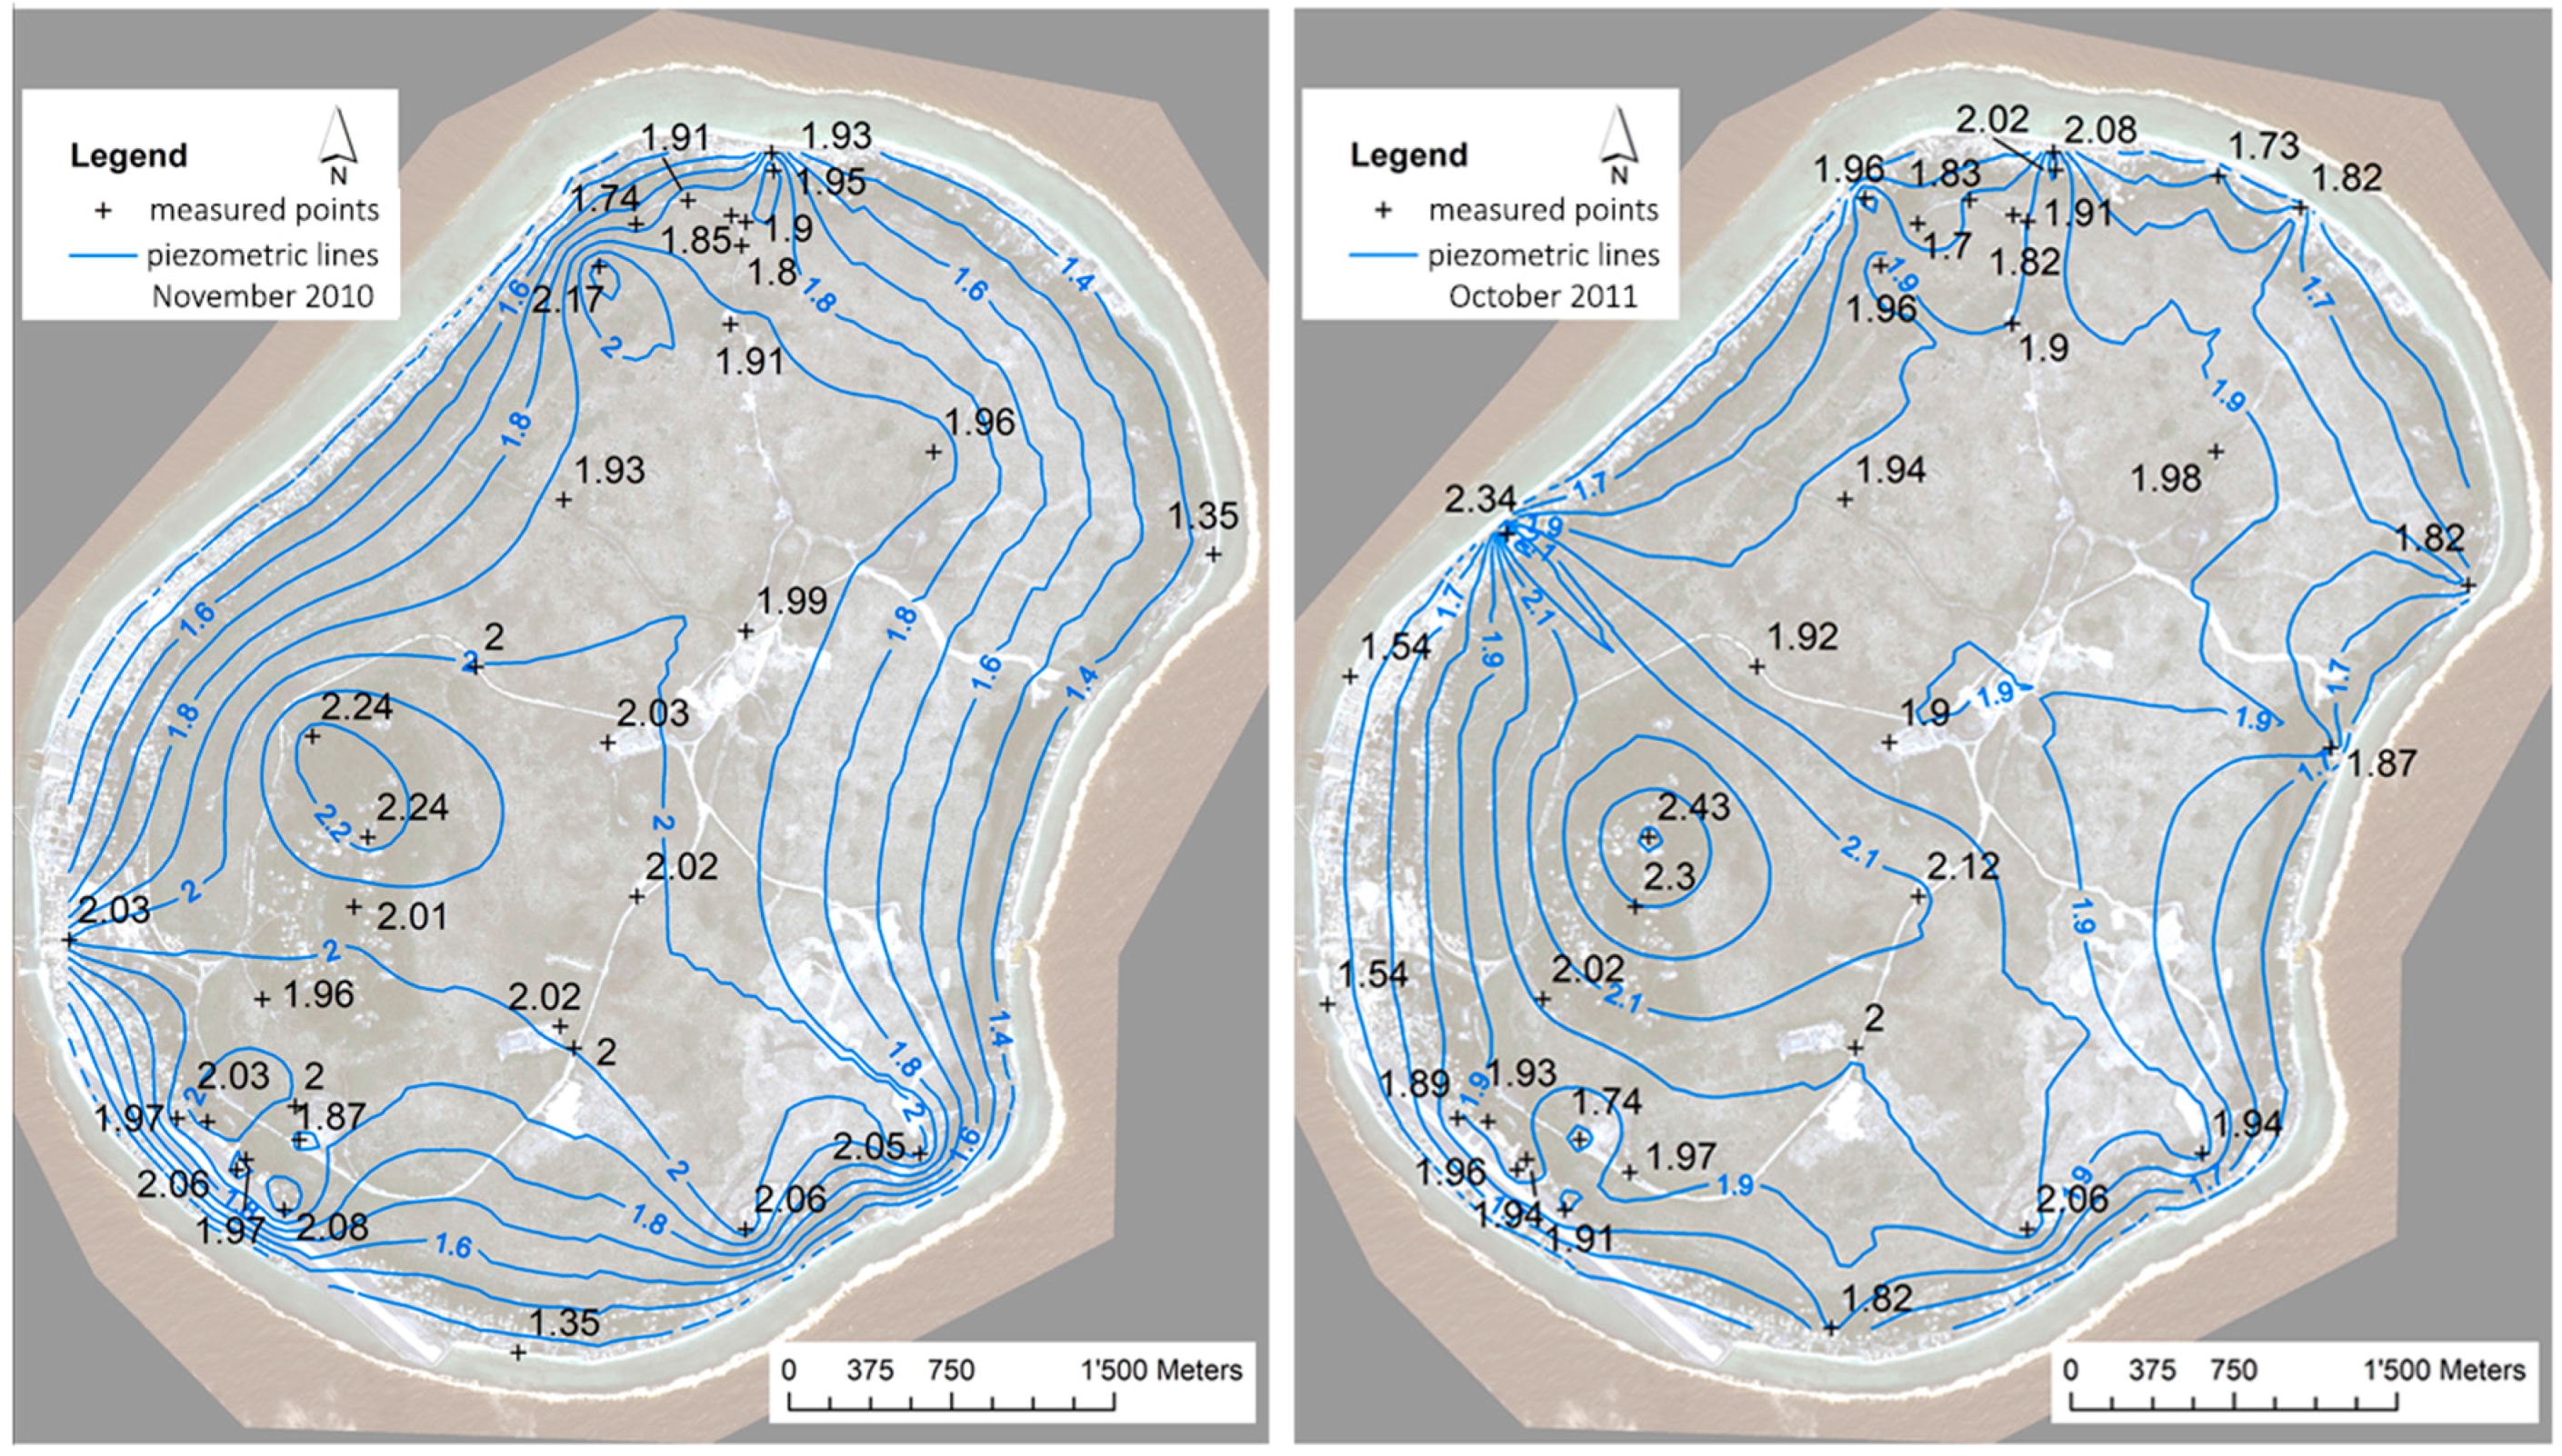
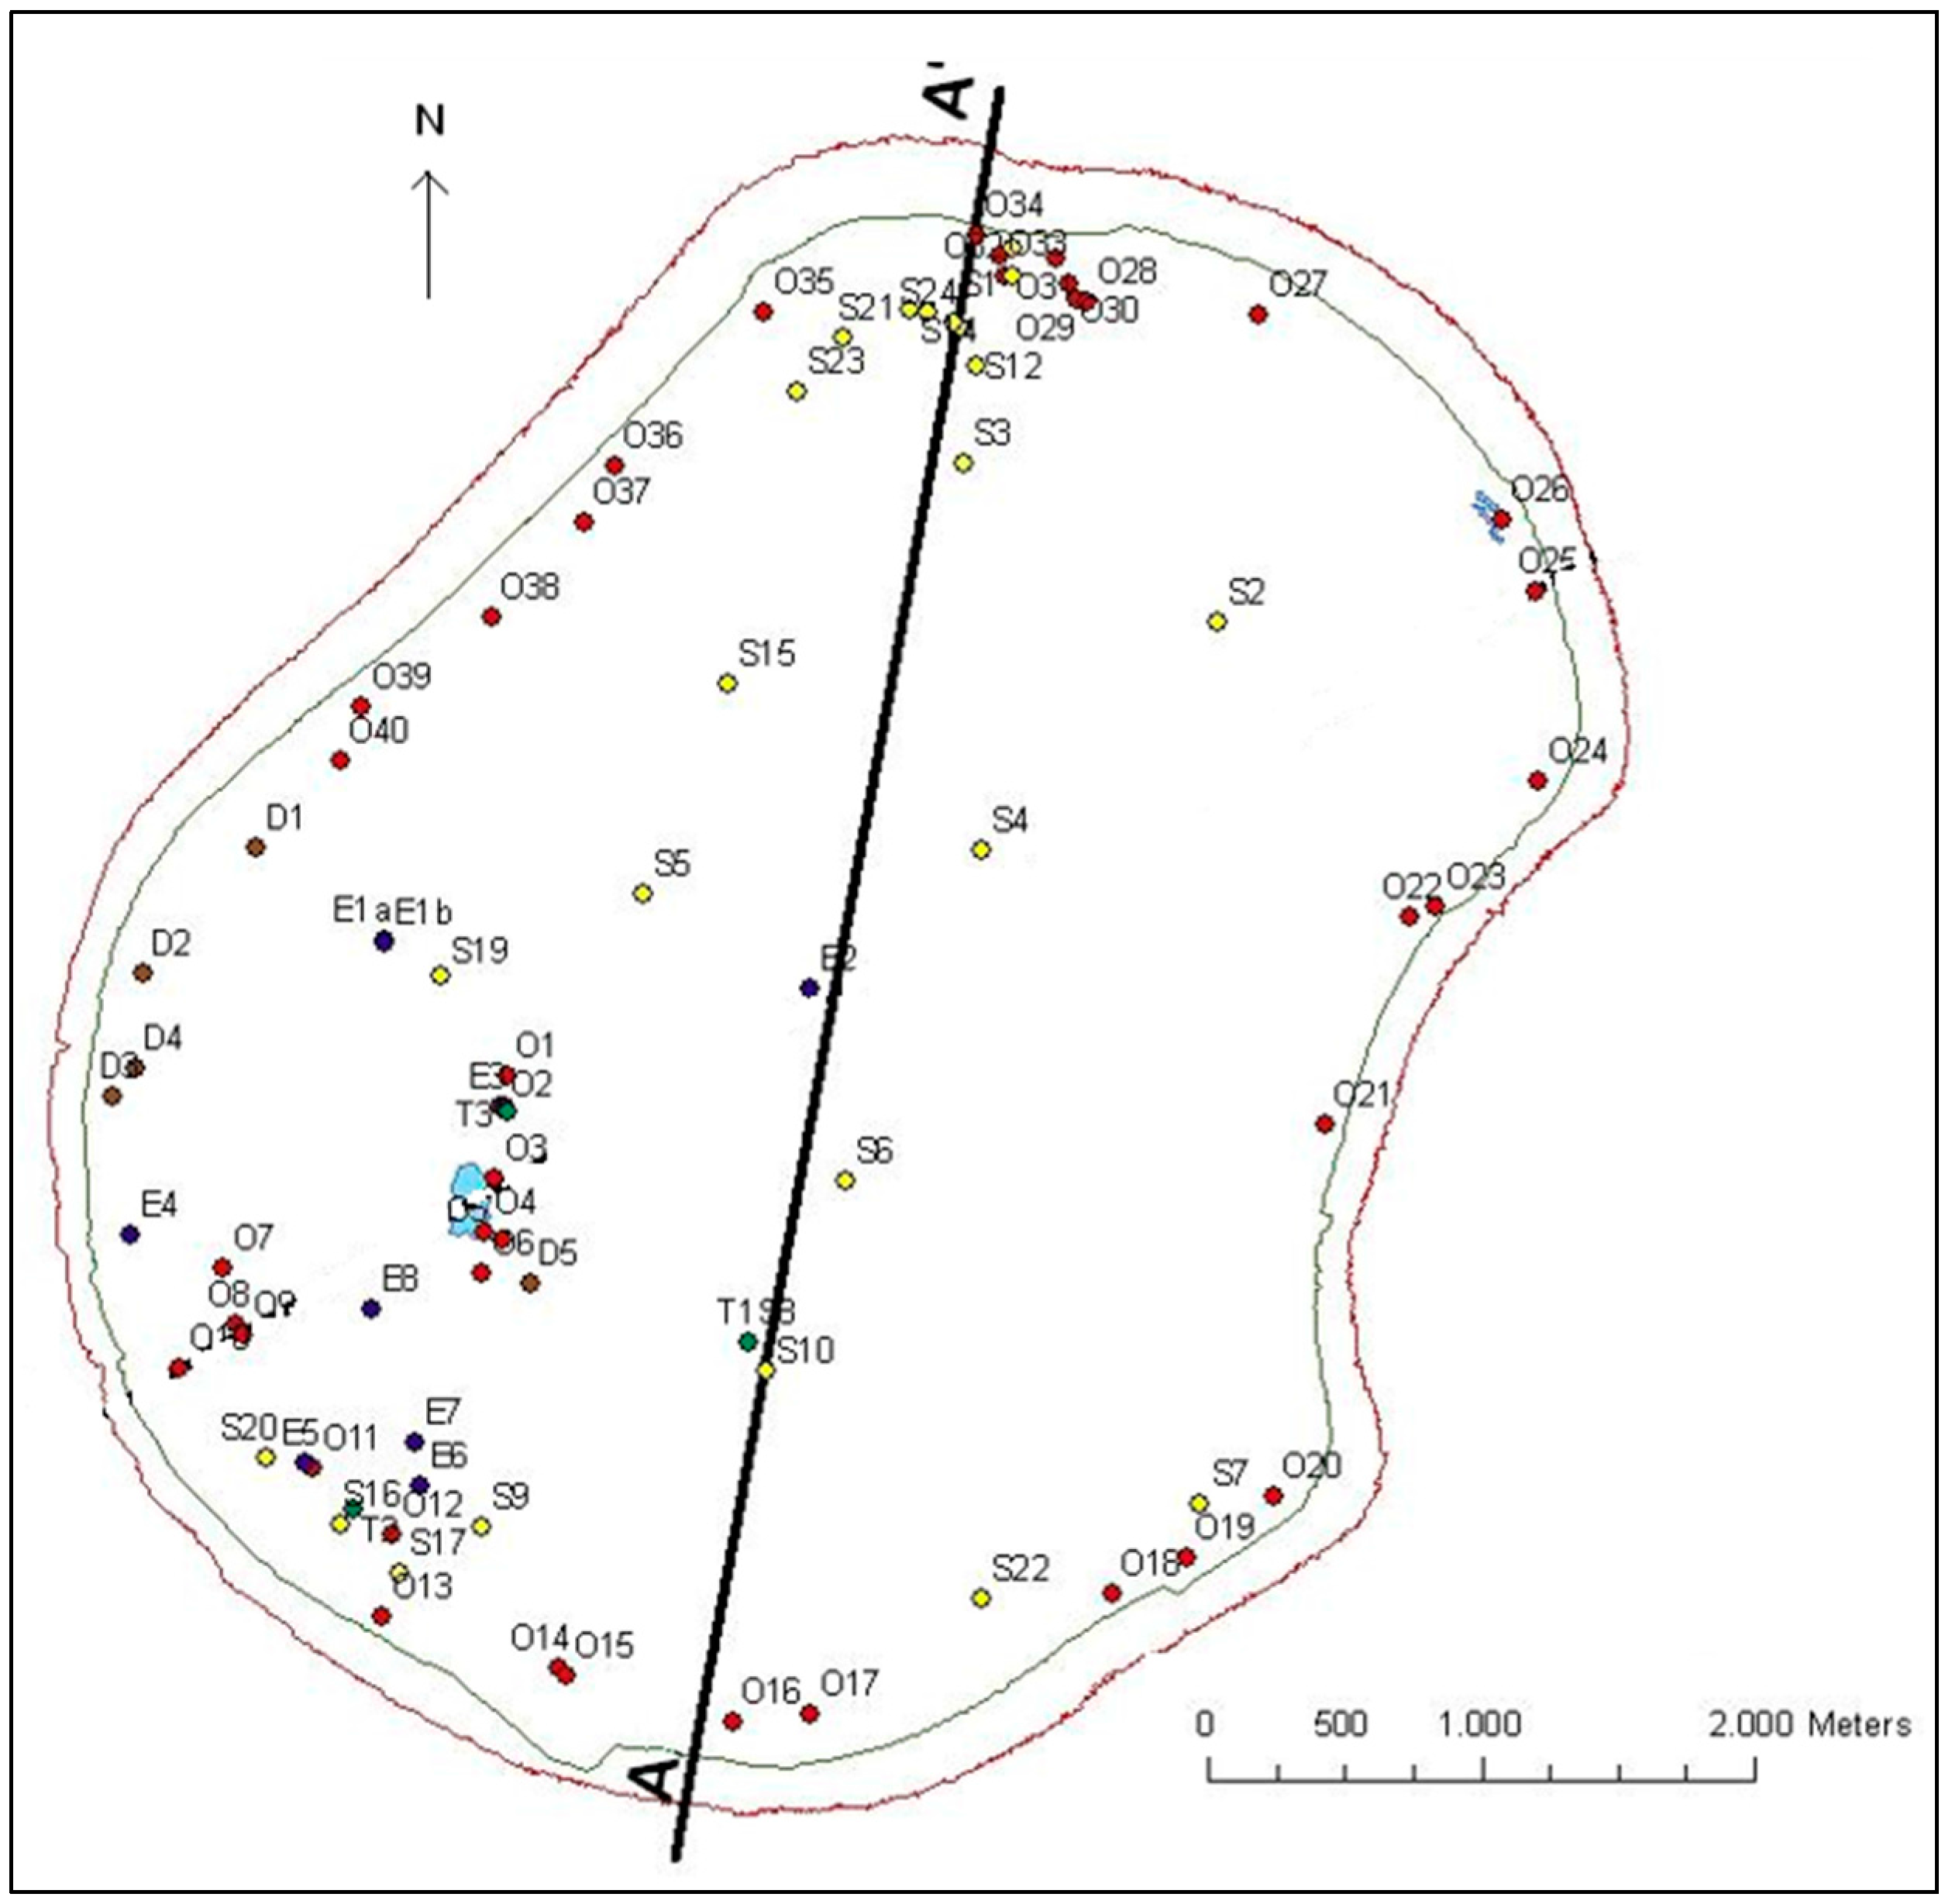
3.1. Heads Distribution

The collected data related to the groundwater fluctuations in response to tidal variations have made possible the representation of the piezometric surface for Nauru Island as measures were carried out at the same time. The surveys have been carried out on an average of about 30 monitoring wells. The data have been corrected through the already described methodology and the piezometric maps have been created in order to understand the hydraulic gradient values and the main flow directions. The Jacobson et al. [26] piezometric map shows a radial groundwater flow from the center of the island toward the coastline. The eight surveys performed for this study in 2010–2013, conveniently corrected, have enabled us to reach some conclusions regarding the groundwater surface morphology (Figure 12). A high level persists during the time in the area where monitoring wells E3 and S19 (2.24 m, November 2010) are located, close to the Buada Lagoon (2.01 m, November 2010). Generally, in the Topside the hydraulic gradient is very low (<0.05%) and increases moving from the cliff toward the Bottomside (about 0.1%). Locally, the coastal area presents piezometric values similar to or a bit higher than the monitoring wells located in the internal part of the Topside. This phenomenon is more significant in the northern part of the island, especially in the Ewa and Anetan districts, where relevant freshwater presence has been detected. All the surveys carried out during this project confirm the radial flow toward the ocean. The Buada Lagoon does not seem to modify or influence the piezometric surface, but contrary to previous studies it does not represent a drainage area and shows levels that respond to tidal variations and are comparable to the surrounding groundwater ones.

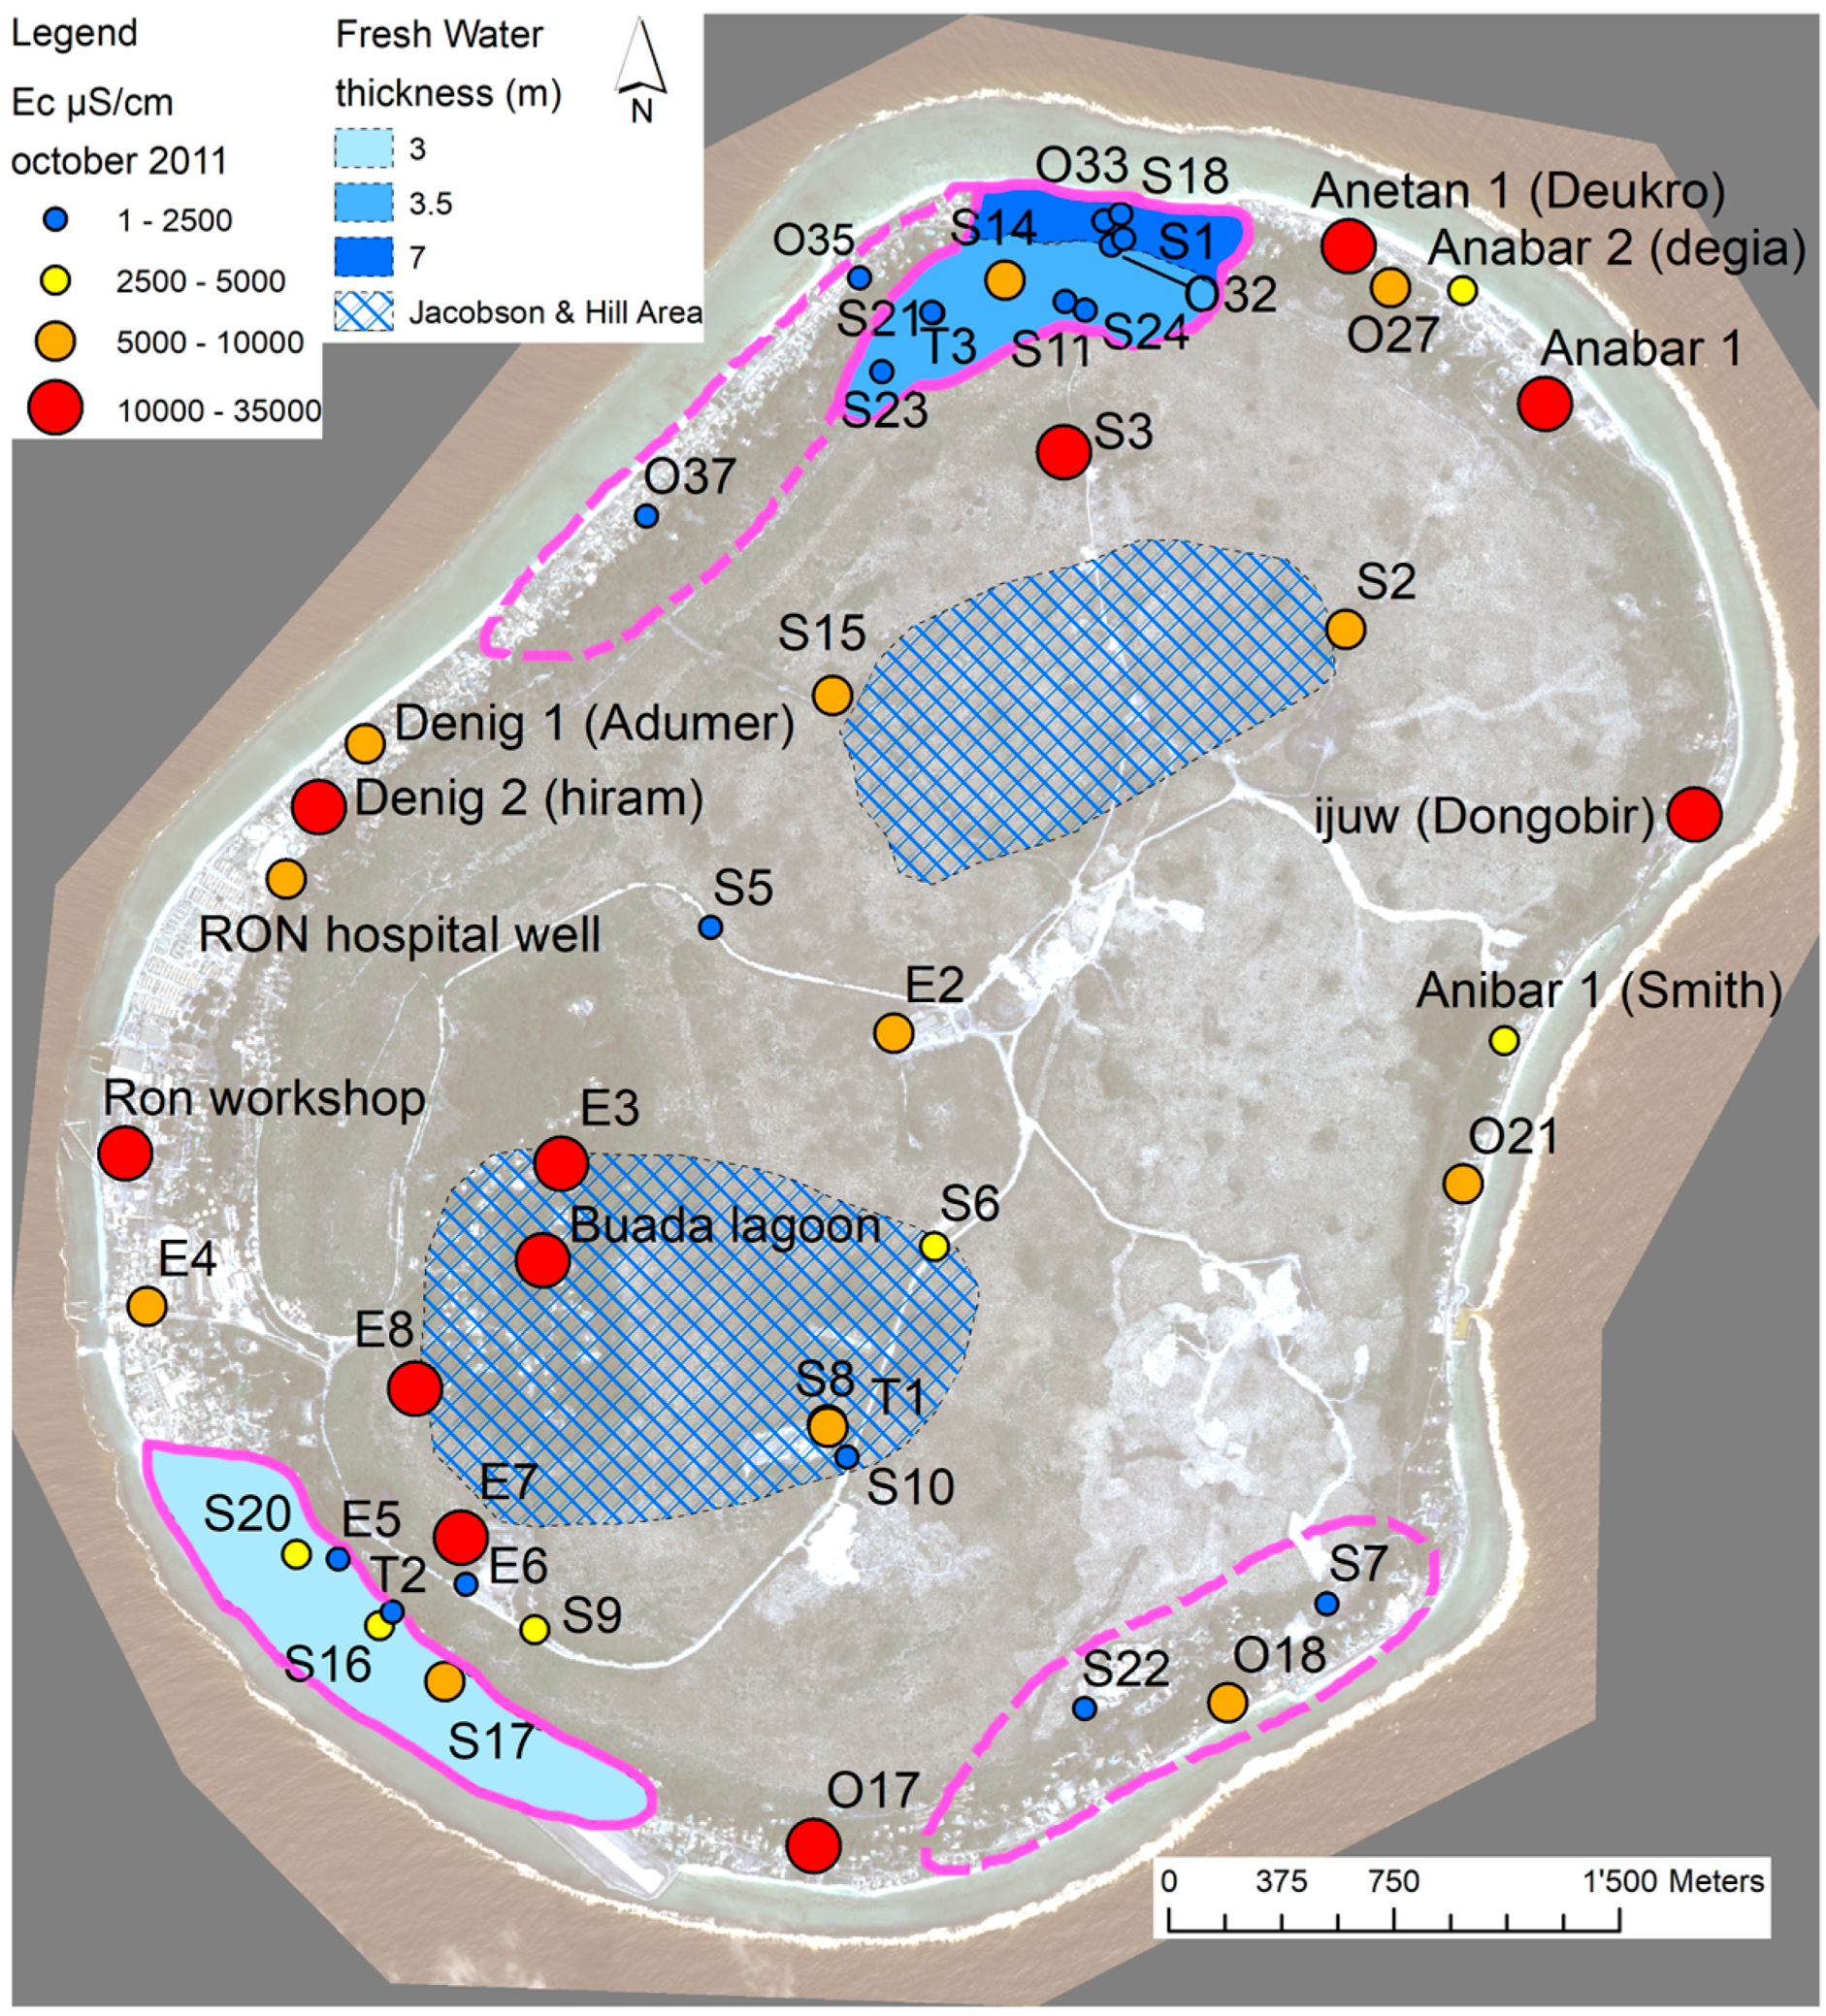
3.2. Electric Conductivity Distribution and Exploitable Areas
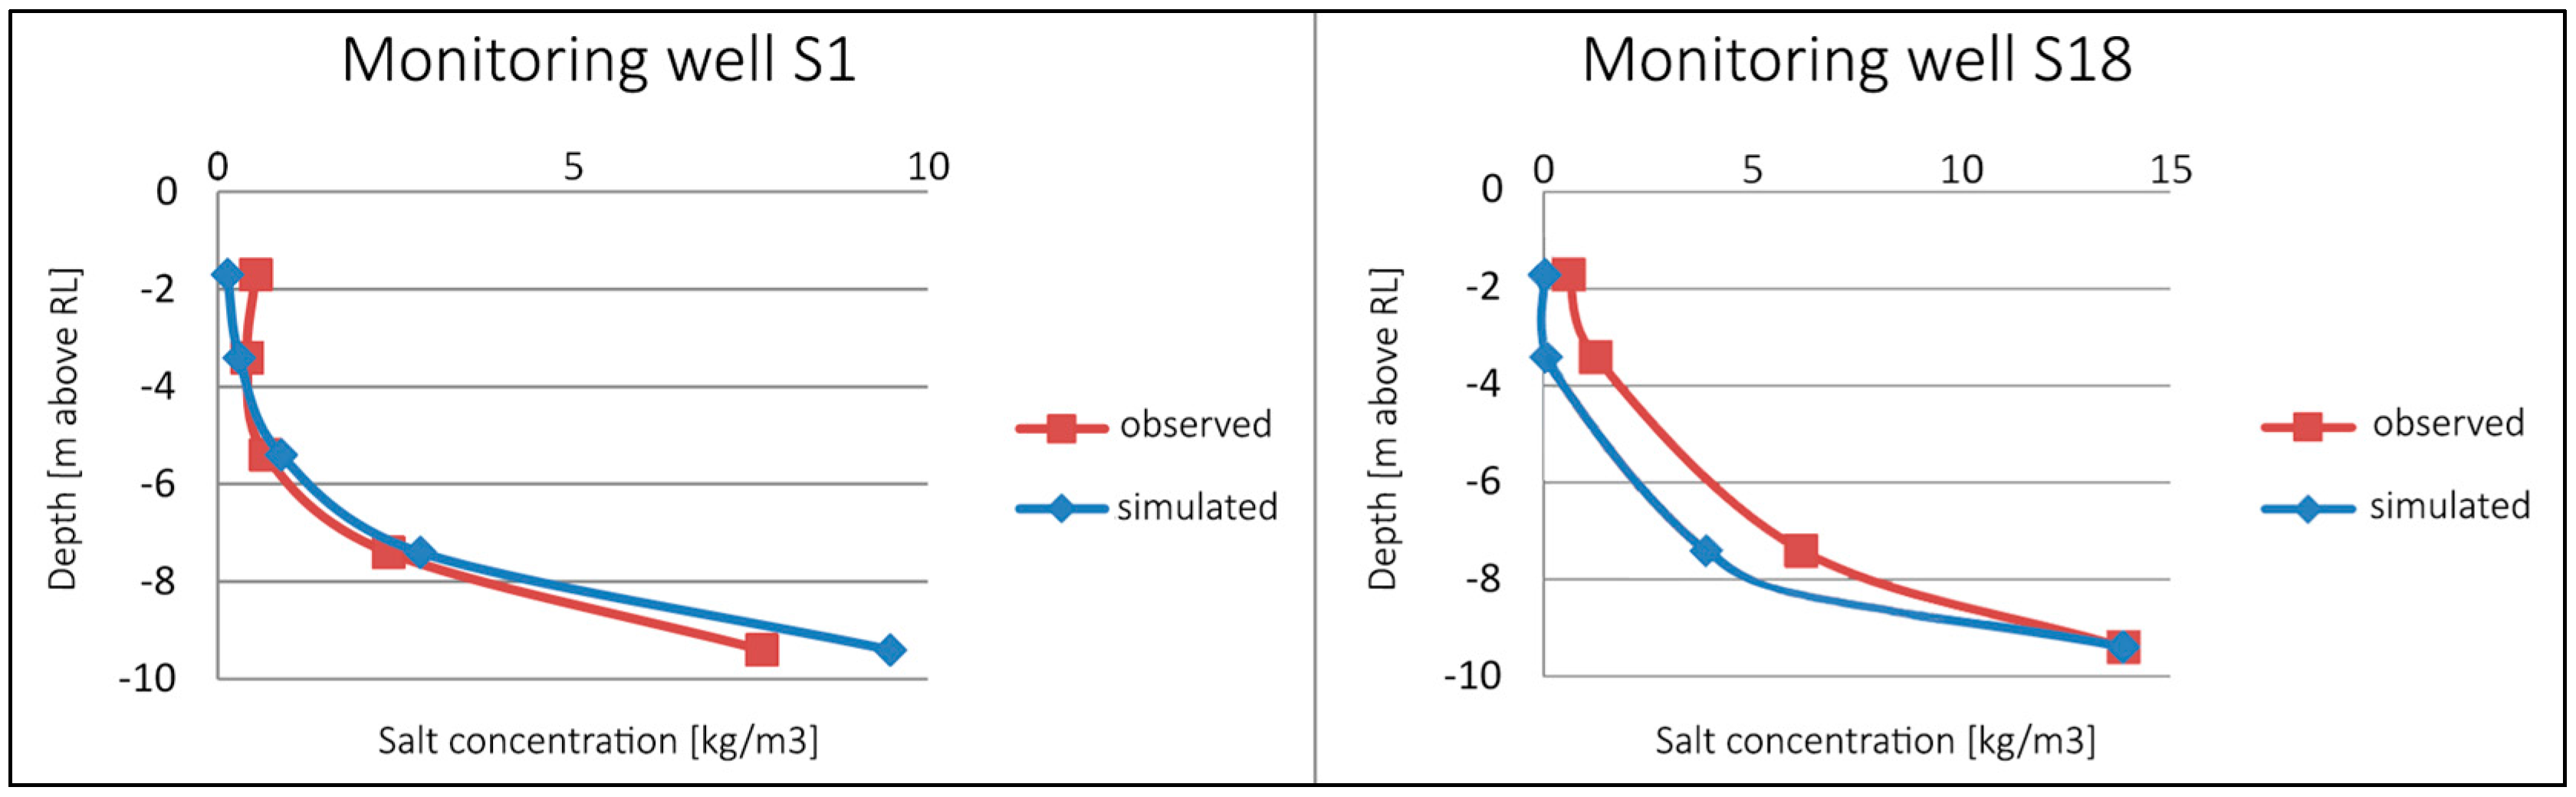
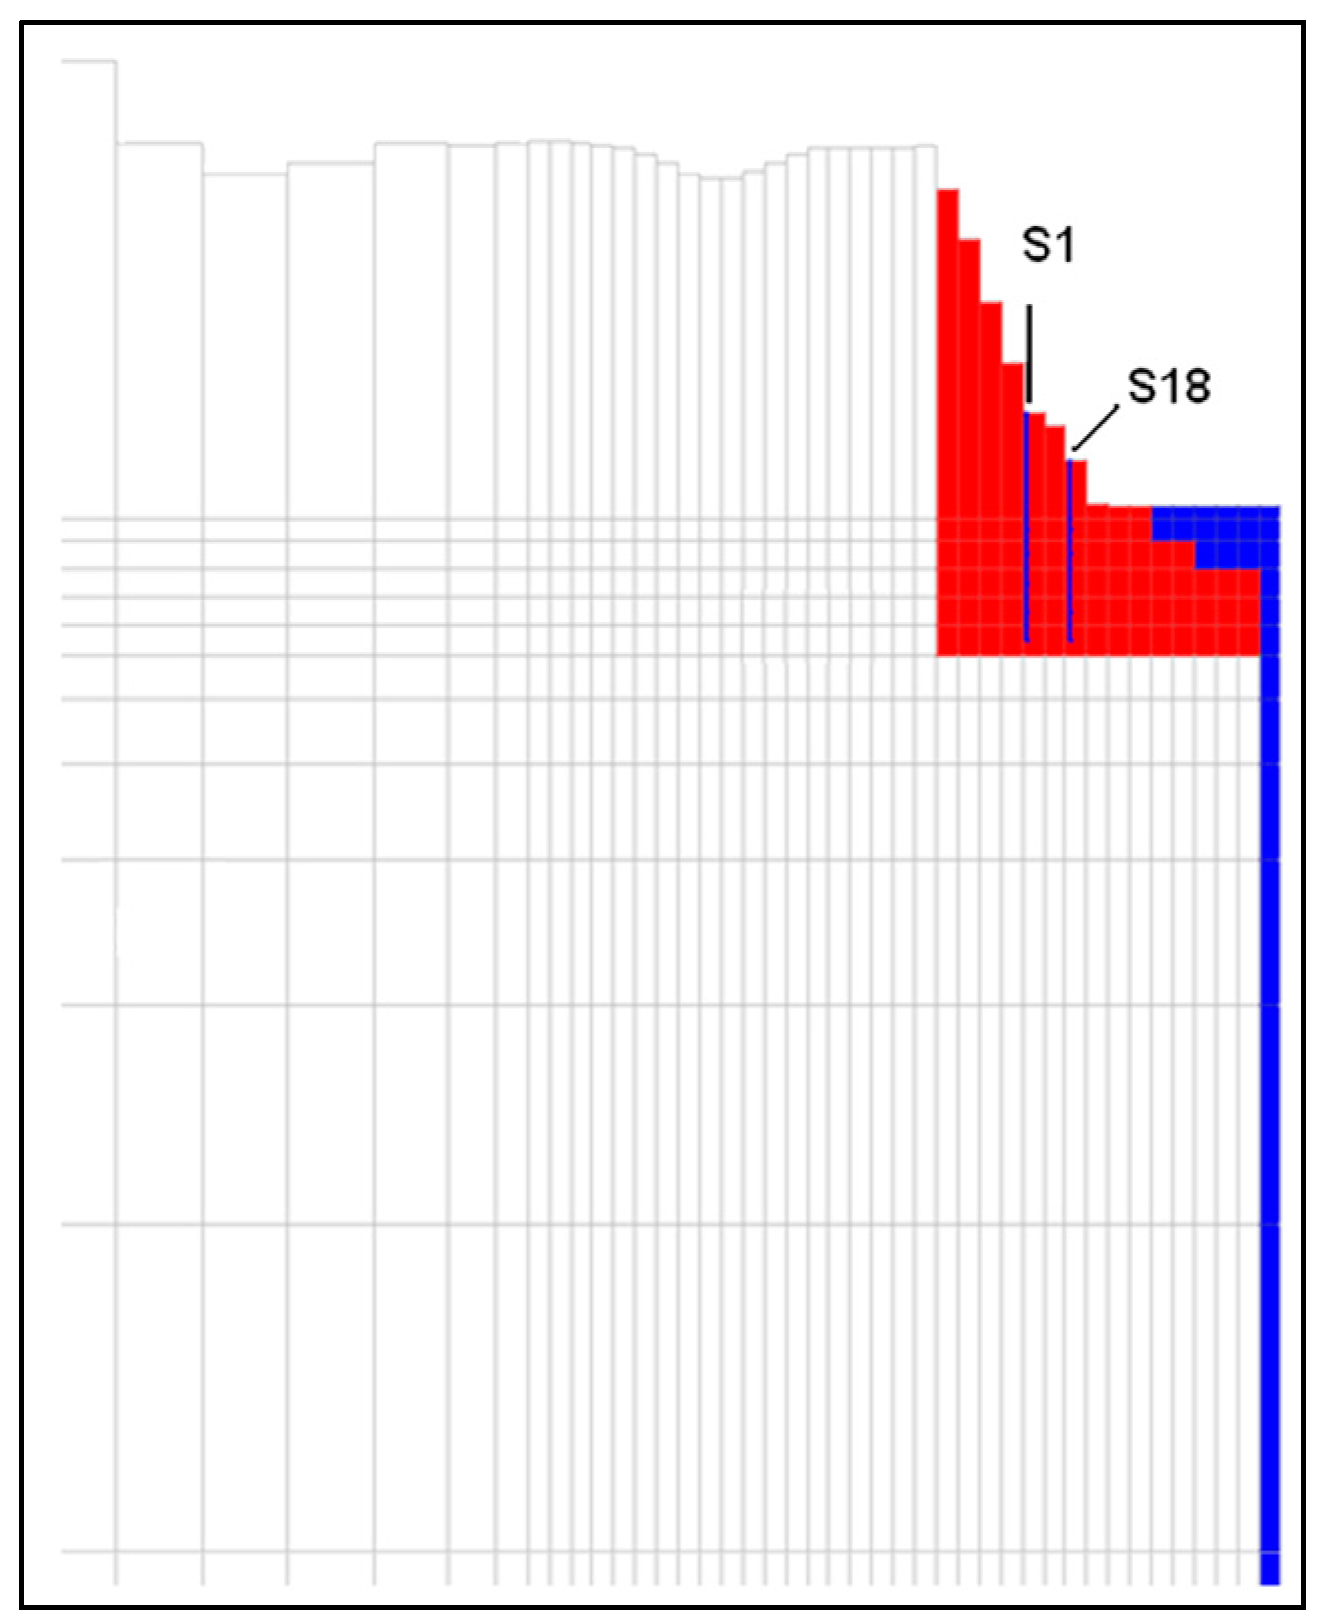
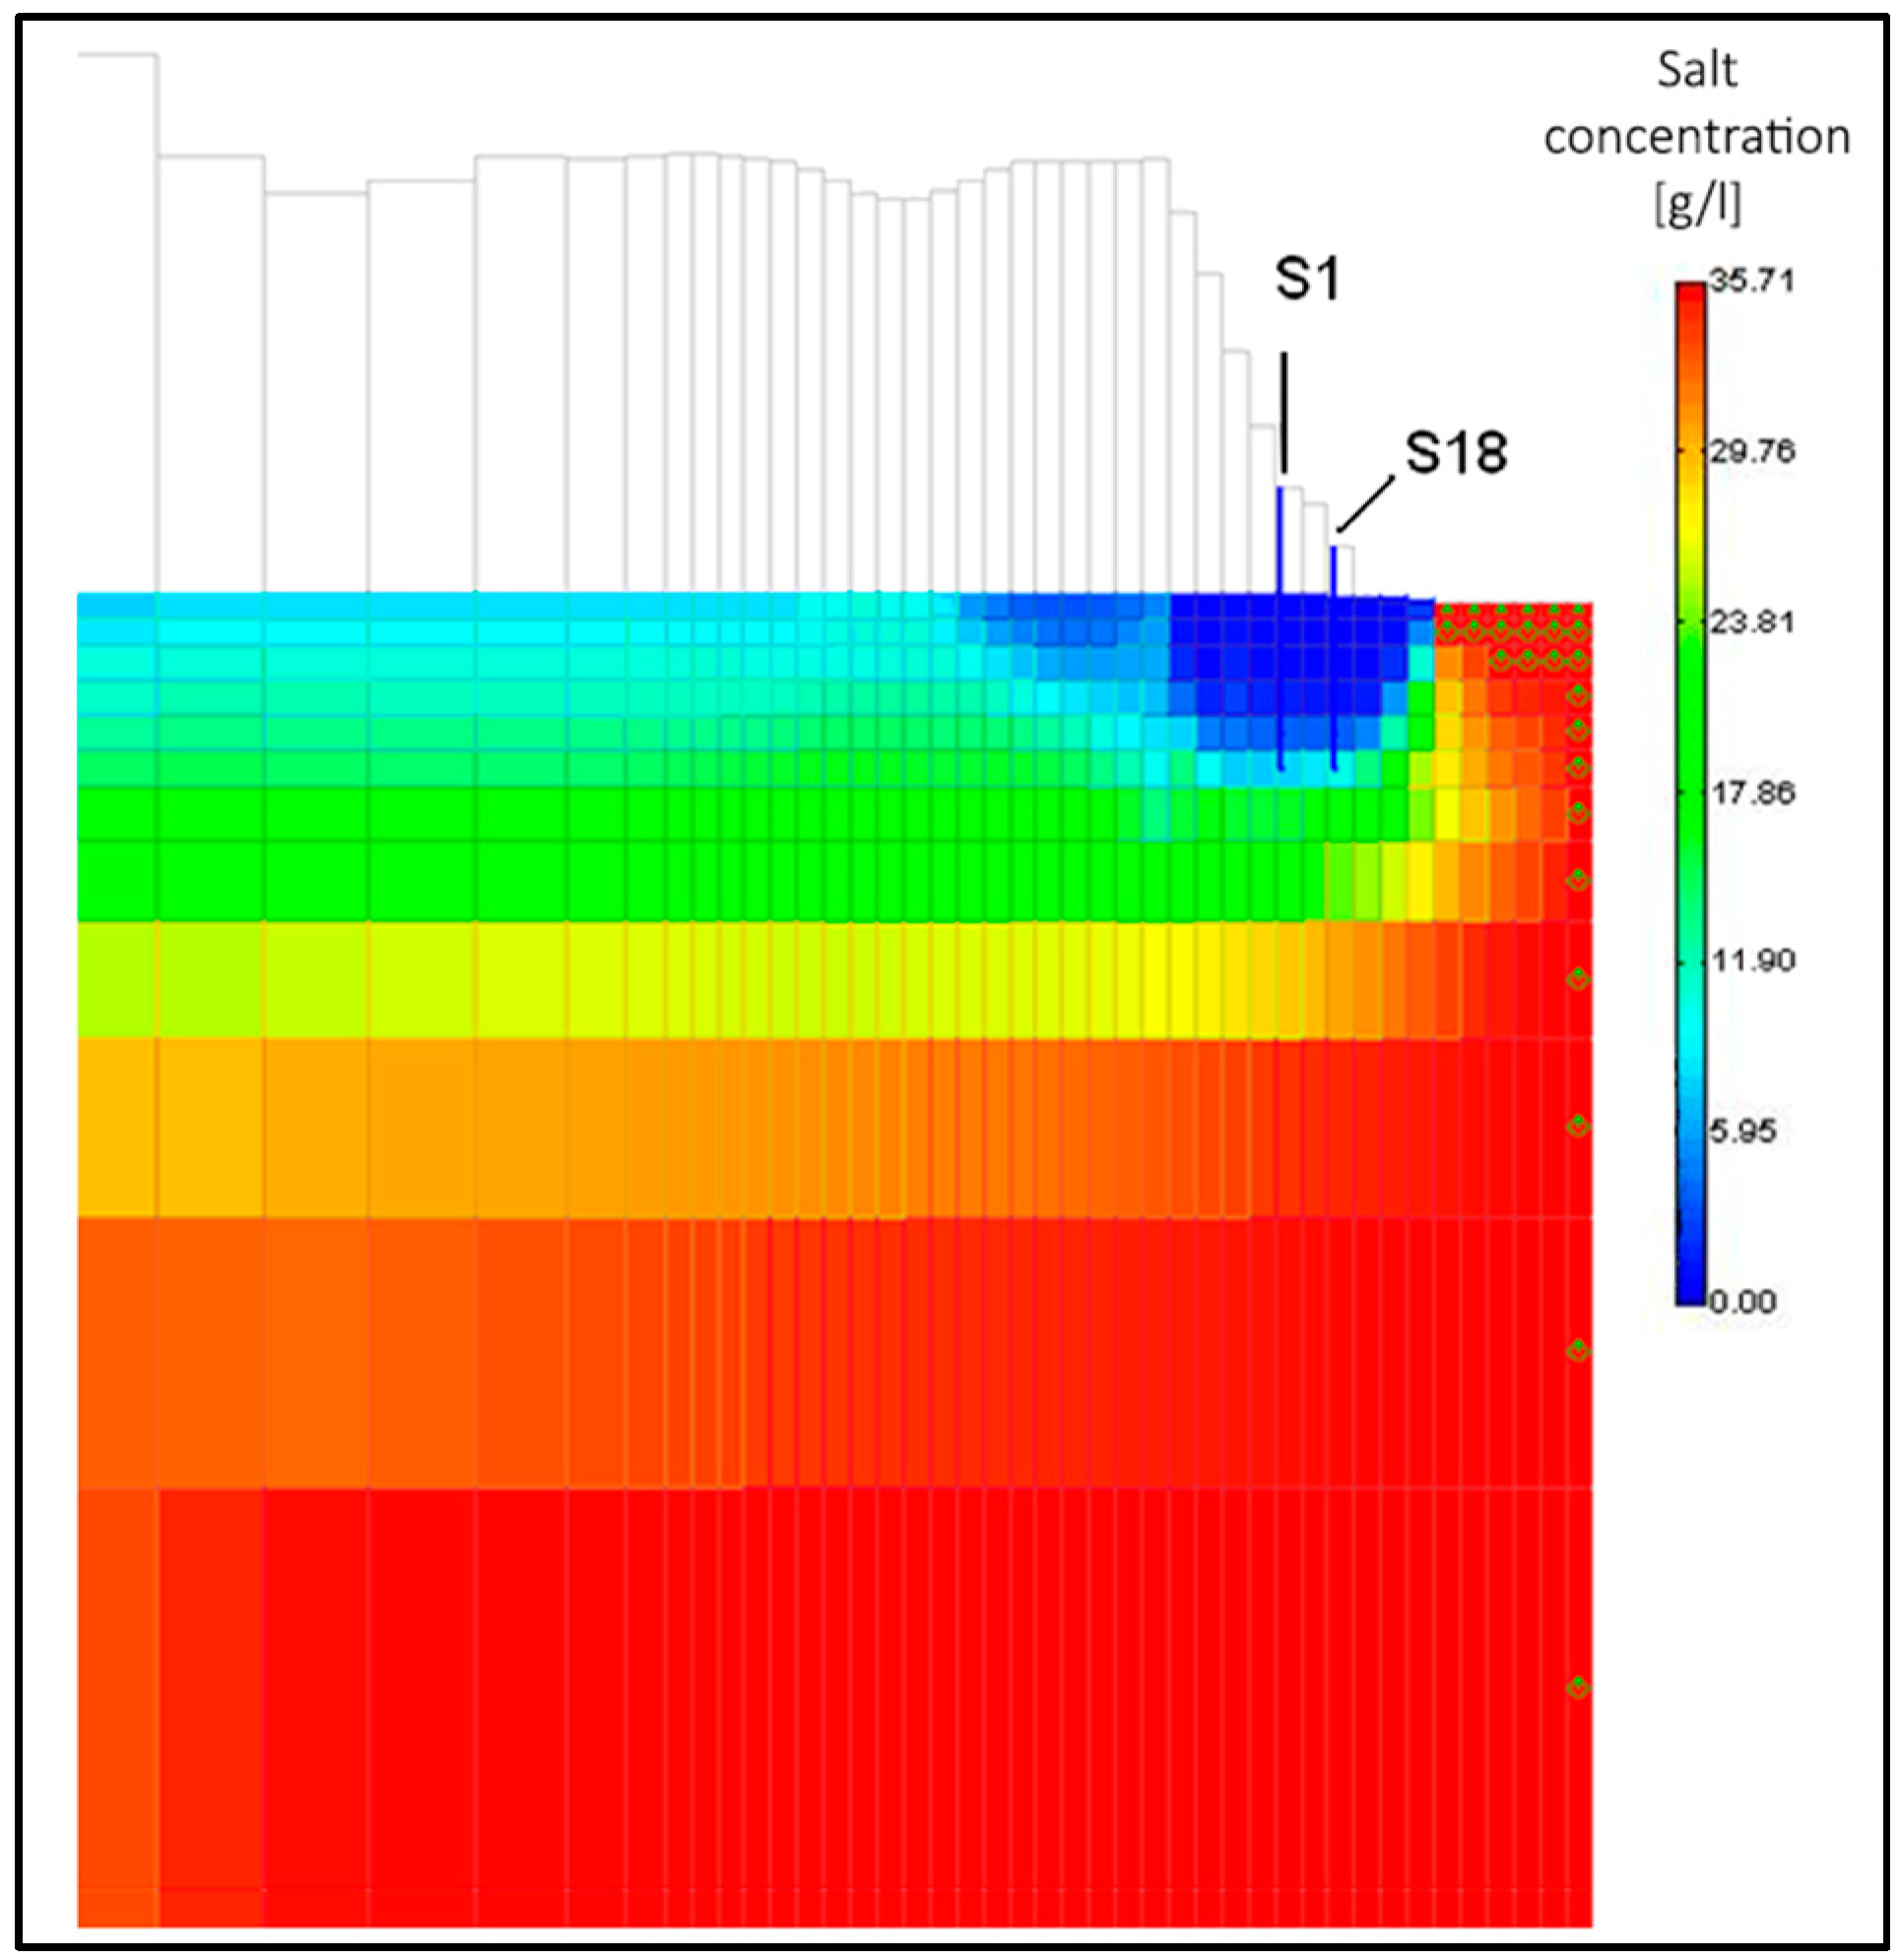
Given that many monitoring wells are multi-pipe, it has been possible to evaluate the EC vertical profile and then the geometry of the saltwater wedge and the thickness of freshwater lenses. In the northern sector of the island, monitoring wells S1 and S18 show quite a high thickness of freshwater (about 7 m) that is also constant in time. The lens thickness decreases in the southern part where monitoring wells S21, S24 and S23 show a freshwater thickness of about 3.5 m, which remain stable only in S24, while in the other points are more influenced by the rain periods. The central sector of the Topside (S6, S10) does not show any freshwater availability given that the EC values are between 10,000 and 20,000 µS/cm at the surface and reach about 35,000 µS/cm at 20 m depth from the water table. In the area close to the airport, freshwater does not accumulate in large quantity and only S16 has a freshwater thickness of 3 m. This lens was present only in April 2010, which was very rainy (390 mm of rain), whereas, during the dry months, the freshwater previously stored in this zone flowed toward the sea. As described in the Introduction Section, previous studies [27] had determined two areas with a freshwater thickness higher than 5 m: one located close to the Buada Lagoon and the other near the S15, S4 and S2 monitoring wells. The hydrogeological surveys carried for this study combined with the Falkland ones, had shown that in these zones there is no resilient freshwater lens; this means that the areas determined by Jacobson and Hill are strictly linked to a very rainy period (1986–1987) and not to particular hydrogeological structures able to store freshwater. Figure 13 sums up these results. The characterization activities carried out during this study have made possible to determine the areas most suitable for the design and development of groundwater infrastructures for water withdrawal (e.g., wells and infiltration galleries). The most suitable area is surely the northern zone where S1 and S18 are located, given that there have been found freshwater lens with a thickness resilient in time and independent from the rainfall distribution. A quite thick freshwater lens (3 m) is also located in the southern part of the island, in Yaren and Boe districts.

3.3. Model Results

As the surveys clearly show that the largest volume of freshwater is present in the northern part of the island, modeling activities focused on coastal monitoring wells (S1–S18) to understand the mechanism that allows this storage. Considering the calibration statistics and the S1 and S18 results (Figure 10), the model can be considered able to properly represent the salinity vertical distribution. In S1, located about 150 m from the sea, a freshwater thickness of 7 m is simulated with a following sharp increase in concentration values. In S18, located about 50 from the sea, the model results are a little bit worse because simulated concentrations are lower than the measured ones. The model properly represents the concentration at three of the four available depths, but it underestimates the salinity at the depth of −7.5 m above RL, consequently overestimating the freshwater thickness of about 25%. This difference is because S18 is very near the coast line and is strongly influenced by tide level variation. For the future 3D modeling phase, this aspect should be considered and, probably, daily average salinity values, rather than instant measurements, would be more suitable for a steady state simulation. In Figure 14, concentration values are visible along the northern portion of the cross section examined. The saltwater wedge from the cost toward the inland is clearly depicted.
Thanks to the low hydraulic conductivity, freshwater is stored in sand sediments creating a sort of “pillow” that has a sharp limit toward the seaside and a smoothed one toward the inland side. The low hydraulic conductivity of the sands, slowing the groundwater flow, also results in a decrease of groundwater concentrations in the limestones area immediately upgradient of the S18–S1 area. Nevertheless, these freshwater lenses are thin and with concentration values above 4 kg/m3 that limit the exploitation possibilities.
The 2D model results highlight the fact that the transition from limestone to sand occurring in the Bottomside is responsible for the freshwater storage mainly observed in the northern zone of the island. In particular, the study conducted and the calibration process of the mathematical models have highlighted the fact that the coastal zone, filled by sands, is the one where the biggest thickness of freshwater occurs. This is because the hydraulic conductivity of this area, smaller than the limestone internal zone, allows the flow to slow down and the groundwater to store. The 2D model demonstrated that even the dispersivity values and the recharge play a role in concentration distribution.

4. Discussion

The hydrogeological characterization and the modeling activity carried out, albeit preliminary, have enabled to achieve important new results in comprehending the freshwater lens formation phenomenon in small islands.
In the case of Nauru Island, the investigations performed have unexpectedly allowed identifying the presence of freshwater lenses hosted into the sandy sediments of the coastal zone, close to the seashore. The monitoring activity, carried out for a six-year period, has moreover highlighted that these lenses are resilient even in drought conditions. This result is in contrast with the previous studies that, on the other hand, had identified freshwater lenses into the limestone forming the internal part of the island. The difference in the results is due to: (1) previous authors had carried out just a single survey corresponding to a particularly rainy period; and (2) their conceptual site model did not consider the presence of sandy sediments along the coastline. Thus, thanks to the data collected during this study, a new conceptual site model has been developed for Nauru, one presuming that the low hydraulic conductivity of sand makes the groundwater slow down toward the coast consequently allowing freshwater storage where saltwater is instead expected to penetrate more easily into the aquifer. This preliminary conceptual site model has been verified through a steady state 2D numerical model along a N-S oriented section. During periods with great rainfall, water easily infiltrates the subsoil because of the paucity of vegetation and the karst phenomenon that characterize the limestone making up the internal part of the island. Freshwater then flows in the high conductivity limestones (800 m/d) radially moving toward the coast and slowing down when it reaches the low permeability sands (40 m/d). Here, freshwater stores in lenses that remain protected from saltwater intrusion by the low hydraulic conductivity of the sediments. Unlike the case of the Topside, characterized by high hydraulic conductivity and dispersivity, the infiltrated rain quickly mixes with the deeper saltwater, thereby determining a fast disappearance of freshwater lenses in the periods with scarce rainfall distribution.
Three hydrogeological/geomorphological factors can be considered responsible for the large storage of fresh water in Nauru’s northern sector
  • The wind: During the humid season (November/April), the winds blow from the West, while, in the dry season, they come from East. This means that the northern and southern coastal zone are not particularly exposed to the wave action, and consequently there is a smaller erosion of the sands [40].
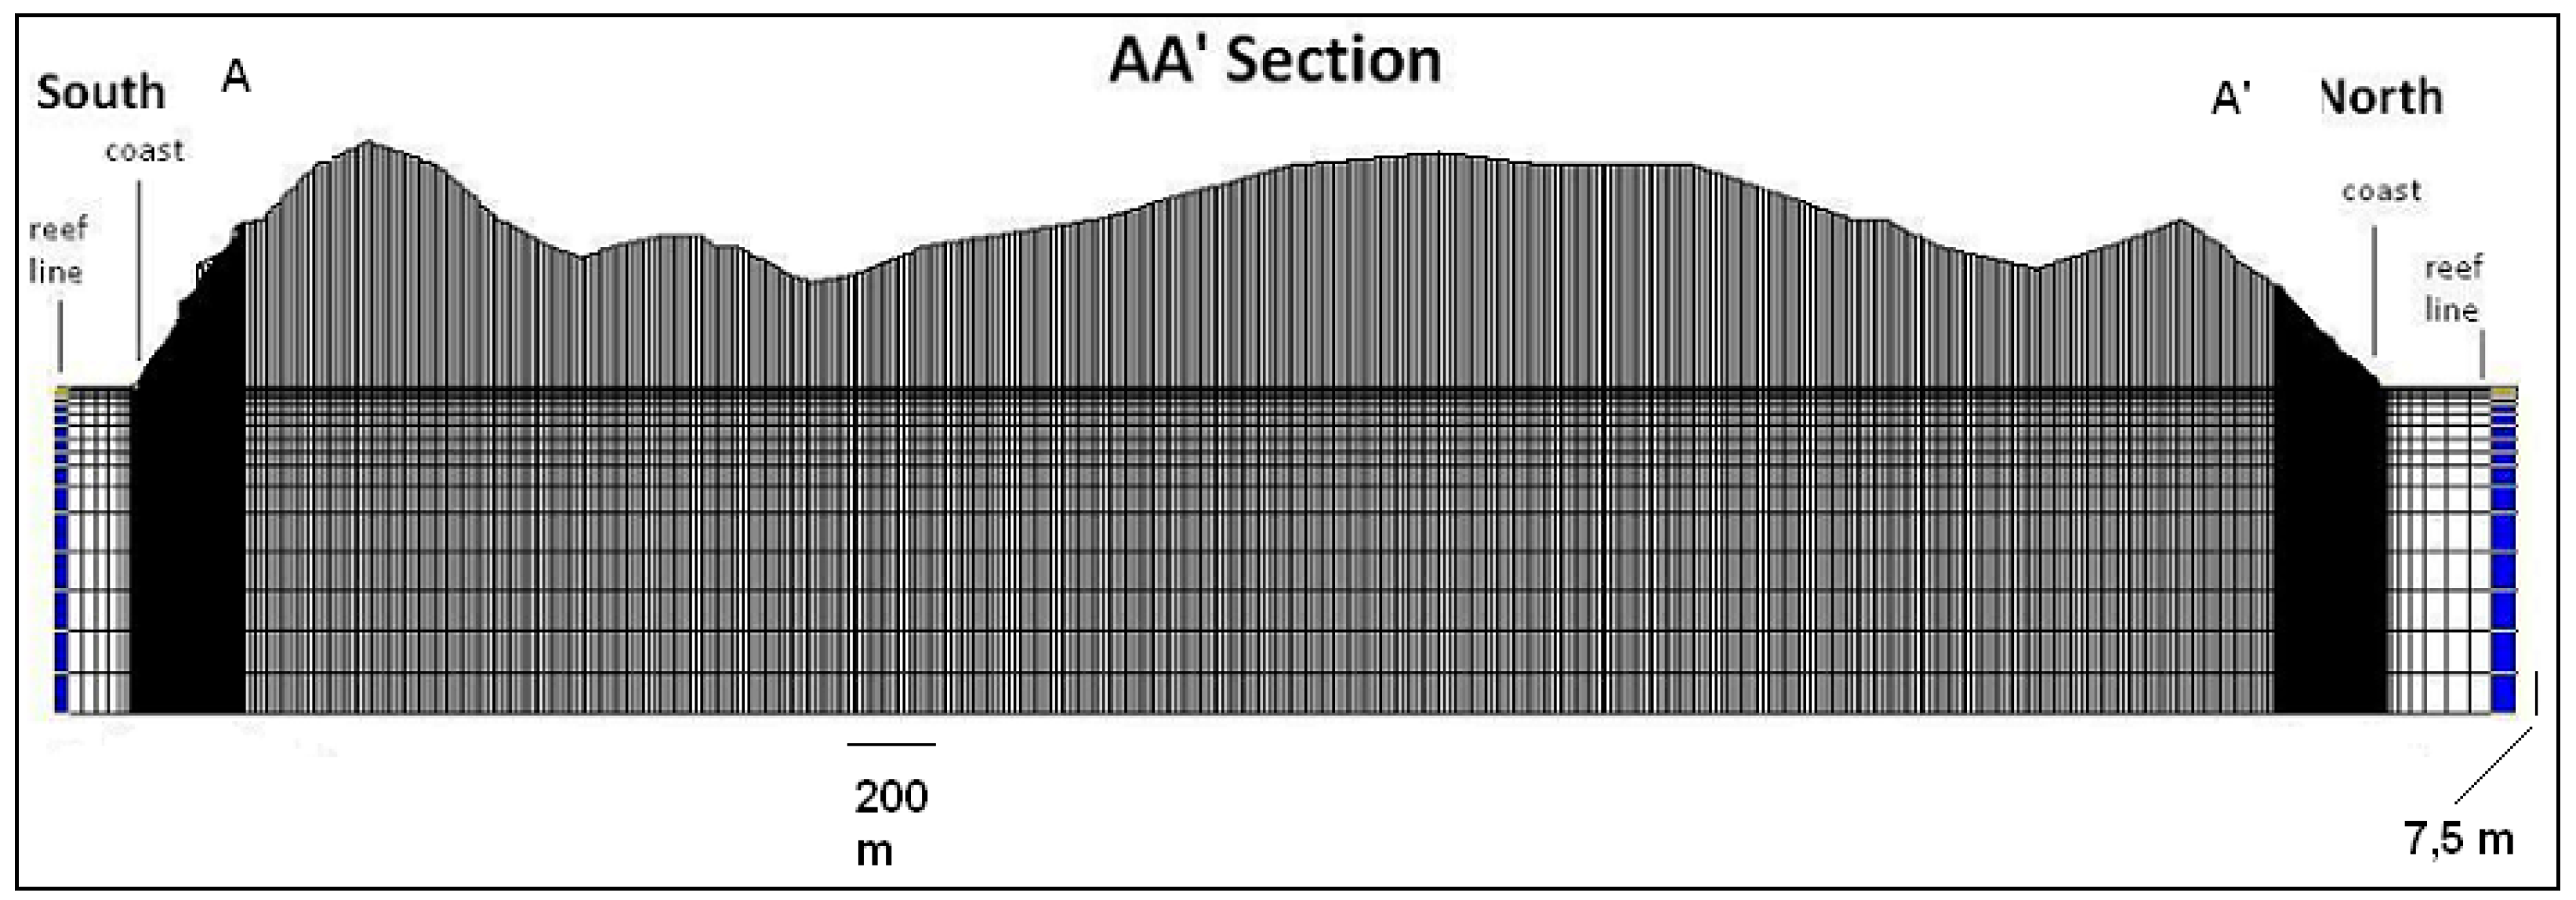
  • The morphology and petrography of the coastal zone: The coastal zone has a variable width, from 400 m close to the airport to a few meters close to Anabar Bay. Near the S1 and S18 monitoring wells, the Bottomside width is 180 m and the sediments mainly consist of by carbonate sands. The main difference is linked to the thickness of sediments: in S1 and S18 the sediments are 15 m thick. Other boreholes in the Bottomside had shown that the basement is around 6 m from the ground level in the eastern sector, 10 m close to the airport and only 3 m in the Anibar bay. The elevated thickness of the sandy sediments in the northern zone is probably the cause of the groundwater slowing down and of storage. Here, the flow circulation is therefore different from the other zones where instead, due to the presence of karst tunnels, the groundwater flows rapidly toward the sea.
  • The bathymetry: Looking at the bathymetric maps of Nauru [45], it is possible to notice that in the northern sector the sea bottom declines smoothly compared, for example, to the Anabar Bay zone where submarine cliff is present. That probably allows the decrease of wave intensity in the northern sector, thereby determining the sand sedimentation and the freshwater storage in the S1 and S18 area.
Comprehension of the way freshwater lenses form in the subsoil of small islands and how they behave is a fundamental aspect to be understood in order to achieve a sustainable development of groundwater. The Nauru experience show how, on small islands, with the aim to archive a proper groundwater management, a detailed aquifer characterization and an exhaustive implementation of the hydrogeological conceptual site model are necessary. Nevertheless, even for Nauru, the studies presented in this paper can not be considered sufficient to prepare a reliable groundwater management plan. The complete understanding of freshwater storage and its quantification would need a more accurate 3D modeling phase supported by data collection. In particular it would be useful a series of hydraulic conductivity tests to confirm the parameters used in the 2D modeling and some geo-electrical tomography campaigns to better assess the freshwater thickness along the coast. This new investigations have been designed for Nauru and will indeed allow: (i) a more precise simulation of the system behavior; (ii) a better comprehension of the role played by the sand sediment thickness in the different zones of the island; and (iii) an improved assessment of the volume of stored freshwater and its resilience capacity during drought periods. Furthermore, an unsteady state 3D model will constitute a useful tool for management of water resources, their protection from pollution and definition of a sustainable use of freshwater lenses avoiding saltwater intrusion increasing. Through this kind of model, it will possible to design new and tailored groundwater withdrawal systems, forecasting their effects on groundwater availability and on saltwater intrusion in different meteorological scenarios. This will allow optimizing their number, position, depth and pumping helping public authorities in preparing a groundwater management plan in the aim to achieve a sustainable development.

5. Conclusions

On Pacific, Caribbean and Mediterranean small islands, groundwater is an important, or the main, source of freshwater whose availability is often limited and whose quality is frequently compromised. The present study of Nauru’s hydrogeology is a step toward the knowledge of groundwater behavior into highly permeable aquifers, underlain and surrounded by seawater, and can contribute to improve the global knowledge on water management in these fragile systems. The study findings are mainly related to the following aspects:
  • Unlike generally assumed, small island aquifers can not only host continuous freshwater lens in the central part of the island, but, unexpectedly, freshwater storage can also occur next to the coastline. In Nauru case, long-term investigations carried out by authors, have shown that those lenses are resilient to saltwater intrusion even in drought periods.
  • A method to correct head measurements vs. tide has been proposed and applied to better characterize the groundwater flow patterns in small islands.
  • Thanks to the investigations and the numerical modeling, it has been possible to clarify the mechanism for freshwater storage next to the seashore and the role played by the hydrogeological structure and aquifers hydraulic conductivity.
  • In previous studies, the durability of freshwater lenses had not been proven yet; the characterization activities here presented cover a long period and show that freshwater lenses located along the coastline turn out to be resilient to drought and saltwater intrusion.
Despite the previous groundwater investigations, considering climate change, rising sea levels and increasing frequency of extreme events, there was a need for a more comprehensive assessment of groundwater potential on Nauru. The characterization presented in this study makes available new and more useful data related to the hydrogeological setting of the island. The results achieved have highlighted the existence of a fresh groundwater resource that can be exploited, in a sustainability perspective. The volume stored in the subsoil will have to be better quantified in the future both in the northern sector of the island and throughout the coast. Probably groundwater alone would not be sufficient to meet the needs of the Nauru population and therefore, as the island’s Water Plan suggests, the use of the groundwater must undoubtedly be combined with others water resources. However, the use of this resource alongside rainwater harvesting is an important resource to ensure the island’s future water security, even during periods of drought or desalination plant breakdown. Due to the vulnerability of fresh groundwater lenses, their use should be carefully managed in order to avoid any uncontrolled phenomena of saltwater intrusion and the overexploitation of the resource. Furthermore, at least where fresh groundwater is available, strict rules are necessary to avoid any pollution by anthropogenic activities (mainly cesspits/septic tanks and animals breeding). Groundwater is a natural resource that should be considered as public and shared resource for present and future generations, even more on small islands where are present some of the most vulnerable aquifer systems in the world. Fresh groundwater should not be freely exploited by any private entity without control, and it would be desirable that in the future the State would directly assume the responsibility for extracting and distributing water. Consequently, Nauru’s next Water Plan would have to addresses these issues, ruling groundwater exploitation and pollutant activities, as well as adopting a program of groundwater survey and monitoring wells maintenance.

Supplementary Materials

The following are available online at www.mdpi.com/2073-4441/9/10/788/s1, Figure S1: Nauru Topside—landscape, 2010; Figure S2: Nauru Topside—Scattered limestone outcrops (or pinnacles), 2010; Figure S3: Nauru Bottomside, 2010; Figure S4: Annual rainfall in Nauru from 1946 to 2015 (data from Nauru Government and Australian Bureau of Meteorology [46]); Figure S5: 3D visualization of the DTM elaborated by Politecnico di Milano with the data of the photogrammetric aerial survey carried out in 2010; Figure S6: Mean sea level and relationship between Reduced Level (or Nauru Datum) and tidal height (by Jacobson et al. [26]); Figure S7: Pattern of the leveling operations in order to obtain the orthometric elevation of RL from H1. The Australian Bureau of Meteorology uses the Nauru Island Datum (NID) as reference level for the tide measurement; Figure S8: Salt concentration evolution into the Nauru aquifer from 2008 to 2013 at the water table, Table S1: Coordinates of the points directly observed trough GNSS receiver. RL stays for the elevation measured above the Reduced Level. Annex 1: Monographs of the surveyed monitoring wells. Table S2: Electrical Conductivity [µS/cm] at water table (data referred to Figure 7 in the paper and S8).

Acknowledgments

This study was supported by the Nauru Project (2010–2015), which was funded by Milano Municipality and related to EXPO 2015. Authors did not received funds for covering the costs to publish in open access. The authors thank the Nauru Rehabilitation Company (NRC) and the technicians of Ministry of Commerce, Industry and Environment (CIE), for carrying out the field activities in Nauru Island in collaboration with the researchers of Politecnico di Milano. The authors are also grateful to Tony Falkland for being available in discussing groundwater data, groundwater investigations and possible groundwater development options for Nauru. The authors would like to thank Daniel Feinstein (U.S. Geological Survey—Wisconsin) for his help and his assistance in the model implementation and run. Finally, the authors would like to thank Louis Bouchet for his help in the field and for being the connection between the researchers of Politecnico di Milano and Nauru Island.

Author Contributions

The authors have contributed to this study carrying out different activities including project organization and development, characterization surveys, model implementation and calibration. All authors conceived and designed the methodology and discussed simulation results. Luca Alberti and Ivana La Licata, as experts in the hydrogeology area and in groundwater numerical modeling through MODFLOW/SEAWAT codes, conceived and designed the project for Nauru Island. Luca Alberti and Martino Cantone performed the survey activities on Nauru Island and analyzed the data. Martino Cantone, who is an expert in hydrogeology area and skilled in mapping tools, carried out the data organization. Luca Alberti and Ivana La Licata implemented the 2D numerical model. All authors carried out the calibration process and discussed model results. Therefore, the manuscript was written by the three authors in equal parts.

Conflicts of Interest

The authors declare no conflict of interest.

References

  1. White, I.; Falkland, T. Reducing groundwater vulnerability in Carbonate Island countries in the Pacific. In Climate Change Effects on Groundwater Resources: A Global Synthesis of Findings and Recommendations; Gurdak, J.J., Ed.; CRC Press: Boca Raton, FL, USA, 2011; Volume 27, pp. 75–110. ISBN 978-0-203-12076-7. [Google Scholar]
  2. South Pacific Applied Geoscience Commission. ADB Pacific Regional Action Plan on Sustainable Water Management; South Pacific Applied Geoscience Commission: Suva, Fiji, 2003. [Google Scholar]
  3. Falkland, T. From Vision to Action Towards Sustainable Water Management in the Pacific. In Theme 1 Overview Report, Water Resources Management; Ecowise Environmental: Camberra, Australia, 2002. [Google Scholar]
  4. White, I.; Falkland, T.; Perez, P.; Dray, A.; Metutera, T.; Metai, E.; Overmars, M. Challenges in freshwater management in low coral atolls. J. Clean. Prod. 2007, 15, 1522–1528. [Google Scholar] [CrossRef]
  5. Werner, A.D.; Sharp, H.K.; Galvis, S.C.; Post, V.E.A.; Sinclair, P. Hydrogeology and management of freshwater lenses on atoll islands: Review of current knowledge and research needs. J. Hydrol. 2017, 551, 819–844. [Google Scholar] [CrossRef]
  6. Falkland, T. Water resources issues of small island developing states. Nat. Resour. Forum 1999, 23, 245–260. [Google Scholar] [CrossRef]
  7. White, I.; Falkland, T. Practical Responses to climate change: Developing National Water Policy and Implementation Plans for Pacific Small Island Countries. In Water and Climate: Policy Implementation Challenges, Proceedings of the 2nd Practical Responses to Climate Change Conference, Canberra Australia, 1–3 May 2012; Engineers Australia: Canberra, Australia, 2012; pp. 439–449. [Google Scholar]
  8. Chen, Z.; Grasby, S.E.; Osadetz, K.G. Relation between climate variability and groundwater levels in the upper carbonate aquifer, southern Manitoba, Canada. J. Hydrol. 2004, 290, 43–62. [Google Scholar] [CrossRef]
  9. Ma, T.; Wang, Y.; Guo, Q. Response of carbonate aquifer to climate change in northern China: A case study at the Shentou karst springs. J. Hydrol. 2004, 297, 274–284. [Google Scholar] [CrossRef]
  10. Gattinoni, P.; Francani, V. Depletion risk assessment of the Nossana Spring (Bergamo, Italy) based on the stochastic modeling of recharge. Hydrogeol. J. 2010, 18, 325–337. [Google Scholar] [CrossRef]
  11. Scott, D.; Overmars, M.; Falkland, T.; Carpenter, C. Pacific Dialogue on Water and Climate; South Pacific Applied Geoscience Commission: Suva, Fiji, 2003. [Google Scholar]
  12. Ayers, J.F.; Vacher, H.L. Hydrogeology of an Atoll Island: A Conceptual Model from Detailed Study of a Micronesian Example. Groundwater 1986, 24, 185–198. [Google Scholar] [CrossRef]
  13. Bailey, R.T.; Jenson, J.W.; Olsen, A.E. Numerical modeling of Atoll Island hydrogeology. Groundwater 2009, 47, 184–196. [Google Scholar] [CrossRef] [PubMed]
  14. Nakada, S.; Umezawa, Y.; Taniguchi, M.; Yamano, H. Groundwater Dynamics of Fongafale Islet, Funafuti Atoll, Tuvalu. Groundwater 2012, 50, 639–644. [Google Scholar] [CrossRef] [PubMed]
  15. Vacher, H.L. Introduction: Varieties of carbonate islands and a historical perspective. In Geology and Hydrogeology of Carbonate Islands; Vacher, H.L., Quinn, T.M., Eds.; Elsevier: Amsterdam, The Netherlands, 1997; pp. 1–33. ISBN 0444815201. [Google Scholar]
  16. Adger, W.N. Social-Ecological Resilience to Coastal Disasters. Science 2005, 309, 1036–1039. [Google Scholar] [CrossRef] [PubMed]
  17. Hill, P.J.; Jacobson, G. Structure and evolution of Nauru Island, central Pacific Ocean. Aust. J. Earth Sci. 1989, 36, 365–381. [Google Scholar] [CrossRef]
  18. Wallis, I. Draft National Water Plan for Government of Nauru, Prepared in Cooperation with Ministry of Health; Workshop Notes September 2001, in press.
  19. Government of the Republic of Nauru. National Sustainable Development Strategy; Ministry of Finance and Economic Planning, Development Planning and Policy Division: Yaren, Nauru, 2005.
  20. South Pacific Applied Geoscience Commission. Sustainable Integrated Water Resources and Wastewater Management in Pacific Island Countries National IWRM Diagnostic Report, Nauru; South Pacific Applied Geoscience Commission: Suva, Fiji, 2007. [Google Scholar]
  21. Government of the Republic of Nauru. Nauru Water and Sanitation Master Plan; European Union: Brussels, Belgium, 2015.
  22. Nauru Project. Available online: http://nauru.como.polimi.it (accessed on 15 September 2017).
  23. Australian Bureau of Meteorology; CSIRO. Climate Change in the Pacific: Scientific Assessment and New Research. Volume 1: Regional Overview; Australian Bureau of Meteorology: Melbourne, Australia; CSIRO: Canberra, Australia, 2011; Volume 2. [Google Scholar]
  24. Falkland, T. Country Implementation Plan for Improving Water Security in the Republic of Nauru; South Pacific Applied Geoscience Commission: Suva, Fiji, 2010. [Google Scholar]
  25. World Health Organization. Total Dissolved Solids in Drinking-Water Background Document for Development of Health Criteria and other Supporting Information; World Health Organization: Geneva, Switzerland, 1996. [Google Scholar]
  26. Jacobson, G.; Hill, P.J.; Ghassemi, F. Geology and Hydrogeology of Nauru Island. In Geology and Hydrogeology of Carbonate Islands; Vacher, H.L., Quinn, T.M., Eds.; Elsevier: Amsterdam, The Netherlands, 1997; pp. 707–742. ISBN 0444815201. [Google Scholar]
  27. Jacobson, G.; Hill, P.J. Hydogeology and groundwater resources of Nauru Island, Central Pacific Ocean. Groundwater 1988, 12, 85. [Google Scholar]
  28. Romanazzi, A.; Gentile, F.; Polemio, M. Modelling and management of a Mediterranean karstic coastal aquifer under the effects of seawater intrusion and climate change. Environ. Earth Sci. 2015, 74, 115–128. [Google Scholar] [CrossRef]
  29. Ghassemi, F.; Jakeman, A.J.; Jacobson, G.; Howard, K.W.F. Simulation of seawater intrusion with 2D and 3D models: Nauru Island case study. Hydrogeol. J. 1996, 4, 4–22. [Google Scholar] [CrossRef]
  30. Bouchet, L.; Sinclair, P. Assessing the Vulnerability of Shallow Domestic Wells in Nauru; Technical Report 435; South Pacific Applied Geoscience Commission: Suva, Fiji, 2010. [Google Scholar]
  31. White, I.; Falkland, T. Management of freshwater lenses on small Pacific islands. Hydrogeol. J. 2010, 18, 227–246. [Google Scholar] [CrossRef]
  32. Alberti, L.; Cantone, M.; La Licata, I. Carried Out Activities in Nauru 24 November–1 December 2010. Available online: http://nauru.como.polimi.it/activities-report-november-2010/activities-report-november-2010 (accessed on 15 September 2017).
  33. Alberti, L.; Cantone, M.; La Licata, I.; Oberto, G. Carried Out Activities in Nauru 29 September–13 October 2011. Available online: http://nauru.como.polimi.it/activities-report-november-2010/activities-report-october-2011 (accessed on 15 September 2017).
  34. Alberti, L.; Cantone, M.; Oberto, G.; Sampietro, D. GNSS Static Suvey Report. Available online: http://nauru.como.polimi.it/activities-report-november-2010/gnss-nauru-survey-report-oct-2011 (accessed on 15 September 2017).
  35. Alberti, L.; La Licata, I.; Cantone, M. PROGETTO NAURU—Sintesi delle attività del primo anno. Available online: http://nauru.como.polimi.it/activities-report-november-2010/nauru-report-july-2011 (accessed on 15 September 2017).
  36. Dupon, J.F.; Bonvallot, J.; Florence, J. Pacific Phosphate Island Environments Versus the Mining Industry: An Unequal Struggle; South Pacific Regional Environment Programme, South Pacific Commission: Noumea CEDEX, New Caledonia, 1989. [Google Scholar]
  37. Barrett, P.J. Report on Phosphate, other Minerals and Groundwater Resources, and on Aspects of Rehabilitation Planning and Methodology, Nauru, Pacific Ocean; Commission of Inquiry into the Rehabilitation of Mined-out Phosphate Lands of Nauru: Menen, Nauru, 1988. [Google Scholar]
  38. Morrison, R.J.; Manner, H.I. Pre-mining pattern of soils on Nauru, Central Pacific. Pac. Sci. 2005, 59, 523–540. [Google Scholar] [CrossRef] [Green Version]
  39. Australia Geoscience. EDM Height Traversing Levelling Survey, Nauru; Australia Geoscience: Canberra, Australia, 2009.
  40. Maharaj, R.J. Evaluation of the Impacts of Harbour Engineering, Anibare Bay, Republic of Nauru (RON); Technical Report 316; South Pacific Applied Geoscience Commission: Suva, Fiji, 2011. [Google Scholar]
  41. Harbaugh, A.W. MODFLOW-2005, The U.S. Geological Survey Modular Ground-Water Model—The Ground-Water Flow Process; U.S. Department of the Interior: Washington, DC, USA, 2005; p. 253.
  42. Langevin, C.D.; Guo, W. MODFLOW/MT3DMS-based simulation of variable-density ground water flow and transport. Groundwater 2006, 44, 339–351. [Google Scholar] [CrossRef] [PubMed]
  43. La Licata, I.; Langevin, C.D.; Dausman, A.M.; Alberti, L. Effect of tidal fluctuations on transient dispersion of simulated contaminant concentrations in coastal aquifers. Hydrogeol. J. 2011, 19, 1313–1322. [Google Scholar] [CrossRef]
  44. Campana, C.; Fidelibus, M.D. Reactive-transport modelling of gypsum dissolution in a coastal karst aquifer in Puglia, southern Italy. Hydrogeol. J. 2015, 23, 1381–1398. [Google Scholar] [CrossRef]
  45. Kruger, J.; Sharma, A. Nauru Technical Report. High-Resolution Bathymetric Survey, Fieldwork Undertaken on 30 September 2005; EU EDF 8/9—SOPAC Project Report 116. Reducing Vulnerability of Pacific ACP States; South Pacific Applied Geoscience Commission: Suva, Fiji, 2008. [Google Scholar]
  46. Australian Bureau of Meteorology. Available online: http://www.abs.gov.au/websitedbs/d3310114.nsf/home/Consumer+Price+Index+Inflation+Calculator (accessed on 15 September 2017).
Figure 1. Small islands’ typical freshwater lens-shape over the brackish/salt water. The effect of a pumping well (upconing) is indicated.
Water 09 00788 g001
Figure 2. Nauru position at 0°32′ S and 166°56′ E (a); and aerial photo of the island in 2009 with its districts (b).
Water 09 00788 g002
Figure 3. Reef, Bottomside and Topside of Nauru and location of wells and monitoring wells present in the island.
Water 09 00788 g003
Figure 4. DTM elaborated by Politecnico di Milano with the data of the photogrammetric aerial survey carried out in 2010. Bottomside, cyan; and Topside, brown.
Water 09 00788 g004
Figure 5. Sea and groundwater levels over a two-day observation period (compared to RL) in monitoring well S1 where the phreatic level varies within a range of 1.80–2.30 m every 6 h.
Water 09 00788 g005
Figure 6. Groundwater level correction: Cases (i.) and (ii.) (a); and Cases (iii.) and (iv.) (b).
Water 09 00788 g006
Figure 7. The 2009 and 2013 Electric Conductivity values at the water table into the Nauru aquifer.
Water 09 00788 g007
Figure 8. Section AA’ trace and monitoring points present in the island.
Water 09 00788 g008
Figure 9. AA’ section, black zones represent the most refined part of the model domain (1 m cells).
Water 09 00788 g009
Figure 10. Observed vs simulated concentration values in monitoring wells S1 and S18.
Water 09 00788 g010
Figure 11. Calibrated hydraulic conductivity settings: sandy sediments (red) and limestone (white). In blue the constant head and constant concentration boundary conditions are indicated (zoom on the northern part of section AA’).
Water 09 00788 g011
Figure 12. Piezometric maps of the groundwater heads measured in November 2010 and October 2011 (sea level 1.35 and 1.54 m, respectively).
Water 09 00788 g012
Figure 13. Results of the EC survey in monitoring wells and private wells (October 2011). Pink line indicates the most suitable areas for groundwater exploitation and the pink dashed one the potential suitable areas.
Water 09 00788 g013
Figure 14. Concentration distribution of the calibrated model (kg/m3) simulated for November 2010 (zoom on the northern part of section AA); green dots indicate cells hosting the boundary condition.
Water 09 00788 g014
Table 1. Tidal Lag, Efficiency and Distance from the coastline of the monitored monitoring wells.
Monitoring WellLocationAverage Tidal Lag (hours:min)Average Tidal Efficiency (E)Minimum Sea Distance (m)
E2Topside01:370.501950
E3Topside01:270.541500
E8Topside01:490.49950
S3Topside01:550.47820
S9Topside01:320.46520
S10Topside01:510.441400
S11Topside01:230.50340
S15Topside01:310.541040
S21Topside01:200.41397
S22Topside01:200.49290
T1Topside01:270.561500
AverageTopside01:330.49
S1Bottomside01:170.50140
S16Bottomside02:100.27280
T2Bottomside01:270.56342
AverageBottomside01:380.44
Table 2. Hydrogeological parameters initially assigned to the 2D models (from Ghassemi et al., [29]).
Hydrogeological ParameterGhassemi Adopted Values
Hydraulic conductivity (Kx, Kz)900 m/d18 m/d
Porosity0.3
Specific Storage and Specific Yield (Ss, Sy)0.0003 m−10.3 m−1
Longitudinal dispersivity65 m
Transverse dispersivity0.15 m
Recharge540 mm/year
Molecular diffusion8.64 × 10−6 m2/d
Table 3. Statistical results of the salt concentrations (kg/m3) calibrated with the 2D density-dependent model.
Statistics
Absolute Residual Mean1.70
Residual Std. Deviation2.10
RMS Error2.73
Scaled RMS0.17
Min. Residual−0.28
Max. Residual7.23
Number of Observations16
Range in Observations15.81

