How to Improve Water Usage Efficiency? Characterization of Family Farms in A Semi-Arid Area


Department of Economics and Business, University of Almería (Agrifood Campus of International Excellence, ceiA3), Ctra. Sacramento s/n, 04120 Almería, Spain
*
Author to whom correspondence should be addressed.
Water 2017, 9(10), 785; https://doi.org/10.3390/w9100785
Submission received: 8 September 2017
/
Revised: 28 September 2017
/
Accepted: 9 October 2017
/
Published: 13 October 2017
Abstract
:Water scarcity in Spain is partly due to poor management of this resource in the agricultural sector. The main aim of this study is to present the major factors related to water usage efficiency in farming. It focuses on the Almería coast, southeast Spain, which is one of the most arid areas of the country, and in particular, on family farms as the main direct managers of water use in this zone. Many of these farms are among the most water efficient in Spanish agriculture but this efficiency is not generalized throughout the sector. This work conducts a comprehensive assessment of water performance in this area, using on-farm water-use, structural, socio-economic, and environmental information. Two statistical techniques are used: descriptive analysis and cluster analysis. Thus, two groups are identified: farms that are less and farms that are more efficient regarding water usage. By analyzing both the common characteristics within each group and the differences between the groups with a one-way ANOVA analysis, several conclusions can be reached. The main differences between the two clusters center on the extent to which innovation and new technologies are used in irrigation. The most water efficient farms are characterized by more educated farmers, a greater degree of innovation, new irrigation technology, and an awareness of water issues and environmental sustainability. The findings of this study can be extended to farms in similar arid and semi-arid areas and contribute to fostering appropriate policies to improve the efficiency of water usage in the agricultural sector.
1. Introduction
Water is a limited resource, a scarce asset, because its demand usually exceeds its natural availability. This pressure on water resources will increase in the future due to growing populations and economies, the effects of climate change, and an expected higher standard of living. The agricultural sector accounts for approximately two thirds of all water usage in the world. Consequently, there is a growing international concern about efficient water usage in agriculture [1], especially in arid areas [2].
Spain is very sensitive to water management issues due to its climatic characteristics and the deficit of this resource in a large part of its territory. Spain’s per capita water consumption is one of the highest in Europe [3], even though its territories are among the most arid. Perhaps for this reason, in 2008, Spain became the first country to include analysis of the water footprint and water use efficiency in formulating planning policies in the context of the Water Framework Directive [4]. In Spain, there are several analyses on water usage, dealing with the country as a whole, in the autonomous regions and industrial sectors [3,5]. The agricultural sector is among those that have received the most attention, as it represents approximately 80% of Spanish water consumption [6].
Some studies have shown that applying more efficient water usage practices in farming is one of the factors that could relieve water shortage [7,8]. In this context, it becomes crucial to analyze the most water efficient agricultural activities. The family farms in the province of Almería in southeast Spain, one of the most arid areas of the country, are one such location where we can examine these phenomena.
This agriculture is the key driver behind the enormous socioeconomic development the province has undergone in the last five decades, due to the hugely successful agricultural activity and a great effort on the part of family farms [9]. The production structure consists of around 13,500 such farms, with a mean size of three hectares. As it is an irrigated agriculture, water is extremely important. Although the weather conditions are mainly favorable, rainfall is very low. As average annual precipitation is around 220 mm, all of the available water sources must be used. Groundwater is the main source (80%), followed by desalinated water, surface water, and reused wastewater. Though the price varies depending on the kind of water supplied, relative water costs on farms are low, accounting for between 2.5 and 3% of total expenses. Water usage in the sector is highly efficient when compared to other Spanish agrarian systems. Sotelo [5] showed that the environmental impact of water use in horticulture in Almería is twenty times lower than the mean for Spanish agriculture as a whole, and Fernández et al. [10] proved that water use is six times more efficient on average than horticulture in the rest of Spain. Nevertheless, the adaptation to water scarcity is not homogeneous among farms; also, current climatological conditions and insufficient public investment in infrastructure to increase water supply [11] mean that further technological and managerial improvements in efficient water use are required.
This study examines the characteristics of the family farms that have a bearing on the better use of water. The purpose of this paper is to present the principal factors related to water use efficiency in Almería on the one hand and a typology analysis of farms on the other.
This work thus bridges a major gap in the literature related to lowering the environmental impact of water use and the family farm. Some studies have related water consumption to macroeconomic variables, e.g., [12,13], but there are hardly any studies relating water use to microeconomic variables [14]. To overcome this limitation, this study uses a micro approach. Along these lines, some analyses have tried to characterize actions and behaviors of farmers regarding water usage, particularly in situations where this resource is limited [15,16]. Frequently, these analyses distinguish expansive actions, e.g., purchasing land or water entitlement, in order to achieve scale economies and maintain productivity [17]; contracting actions aimed at reducing land or irrigated areas [18]; and, accommodation actions, e.g., investment to improve water management or efficiency, as farmers adapt to the water shortage [15]. In recent decades, water policies in Spain have been directed at improving farms’ water usage efficiency in particular and making them more sustainable in general, although with heterogeneous results [10]. In certain specific areas in which the farms share common characteristics, results have depended on the farmers’ attitudes [19] and the farms’ managerial features [20].
From a methodological point of view, there is a lack of adequate research in this area to develop appropriate methods that can be used to measure the relative water efficiency at farming level. Efficiency in water usage is a complex term, which has different meanings depending on the field where it is applied [21]. In the case of irrigated agriculture, water usage efficiency usually means consuming less water to produce the same amount of crops, or consuming a given amount of water to produce more crops [13]. Therefore, water efficiency usually indicates water productivity in terms of yield (kg m−3) [8,10,22], or, less frequently, in economic terms (euros m−3) [10,23]. Thus, these two water usage indicators were considered according to other studies on water efficiency in the horticultural area under analysis [10,24,25]: water usage efficiency (WUE), defined as the ratio of crop production divided by the amount of water supplied (kg m−3); and, water productivity (WP), defined as the ratio of value of crop production divided by the amount of water supplied (euros m−3).
Two statistical techniques are used: descriptive analysis and cluster analysis. After the cluster analysis, two different types of family farms, less and more efficient in water usage, are considered to explain the most crucial factors for water efficiency. Both the common characteristics within each group and the differences between the groups with a one-way ANOVA analysis are then studied. Similar methodological approaches have been used in the literature to classify farms based on adaptation to water scarcity [15,20,25], but it should be highlighted that this study is the first to do it based on water usage efficiency.
Thus, the present study contributes to the current strand of literature in the field of water efficient performance assessment by pursuing two main aims: (a) to analyze the characteristics of family farms that influence water use (water analysis, control systems, technology, efficiency plans, water consumption…); and, (b) to identify the profile of the farmers that are more water efficient by means of a cluster analysis. This approach could provide suggestions for improving the efficient utilization of water resources in agriculture, along with useful information for farmers and policymakers, which could be applied in similar areas. Hence, the results of this study allow managers to identify the principal factors and best practices related to water efficiency in order to promote and/or implement them in inefficient farms to improve their performance and lower the environmental impact, regarding the better use of a natural resource such as water.
In order to achieve these goals, the remainder of the paper is organized as follows. Section 2 describes the agro-food system under study and the features of water usage in this productive activity. Section 3 describes the methodology used, the data collection, variables, and empirical setting. Section 4 explains the estimations and results from the descriptive analysis and the cluster analysis. Finally, Section 5 outlines the main discussions and conclusions drawn from the research.
2. Research Area
The study area is located in the Campo de Dalías, on the west coast of the Almería province, southeast Spain (see Figure 1), whose production is carried out by small-scale family farms. This agricultural system originated about five decades ago, and evolved from the cultivation of fresh vegetables in the open air to greenhouse production. The Campo de Dalías is the area where the first farming initiatives under plastic began in Almería, and it is the largest concentration of greenhouses in Spain [26]. In 2016, there were 21,081 hectares that accounted for 70.25% of all greenhouses in the Almería province and 35% in Spain [27].
The Campo de Dalías is a flat, semi-arid area with low precipitation, but with subterranean water resources and a mild climate due to the proximity of the sea and the nearby mountain ranges that provide protection. The average annual temperatures and rainfall are 18 °C and 220 mm, respectively. These climatological characteristics and technologies adapted to local requirements have allowed a ten-month long growing season (from September to June) and given rise to a highly productive sector.
The farming activity has become specialized in certain crops such as pepper, cucumber, and tomato, though some also cultivate zucchini, eggplant, watermelon, and melon. Farmers tend to rotate the production of these crops (usually two crops a year). In hopes of achieving homogeneity in order to avoid differences in crop productivity and water requirements, in the sample study farmers only cultivated pepper and cucumber, the most common rotation in the area during the growing season when the survey was conducted [28] (specifically, the crops considered are cucumber “tipo Almería” and long cycle pepper, the crop varieties more cultivated in the Campo de Dalías [26]).
Among the local cultivation strategies, the “enarenado” technique is of particular interest, as it has allowed reduced water supplied and the condensation of atmospheric humidity, protecting the natural soil with a layer of sand and natural manure. Specifically, the sand mulch or “enarenado” soil consists of covering the natural soil with an initial layer of silty-loam soil, then a second layer of manure, and a third small layer of sand on top [29]. Although other alternatives such as soilless or hydroponic systems have appeared, this artificial layered soil (“enarenado”) is used by 90.2% of all farms in the area [28], and by all of the farms in the sample. Therefore, and as other previous works on water efficiency show [10,24], the topographic and soil characteristics in the research area are similar.
On the other hand, the sector has developed through the use of greenhouses with plastic covering held in place between wire meshes and supported on metal posts. This simple system, combined with the area’s natural sunlight (over 3000 h per year), is highly efficient as it requires almost no extra energy, improves water savings, and reduces the effects of erosion caused by heavy occasional rainfall and strong winds which are characteristic of such semi-arid regions [30].
Traditionally, the increasing surface area dedicated to crop production has caused concern over the limited hydrological resources. However, since the late 1980s this sector has progressively incorporated systems of water economy and increased supply (desalination plants, reservoirs, reusage, etc.). Nowadays, the Campo de Dalías is Spain’s most technical and efficient irrigation area, with widespread use of drip irrigation systems and an increasing application of water treatment and reusage techniques [10].
Although this sector underwent considerable expansion over several decades, it is worth mentioning that since the early 2000’s, the surface area dedicated to vegetable production has hardly increased. Several factors have played a part here, namely increased input costs (labor, seeds, etc.) and the stabilization of sale prices. Consequently, growers have made a great investment in technology, with a view to increasing crop productivity, and to the need to continue improving resource efficiency, e.g., irrigation optimization, improved cultivars, machinery or crop practices [29].
Despite these technological improvements, the results in terms of efficiency are still quite heterogenous among family farms [31]. This suggests that further improvements are required, particularly in light of the decrease in precipitation in the area in recent years [11], and the absence of policies, both regionally and nationally, to develop infrastructures and guarantee water supply in the short term.
3. Data and Methodology
3.1. Data Collection
Data for this study were collected by means of a structured survey of randomly selected farmers in the Campo de Dalías (Almería) conducted during the spring 2015.
157 farms were surveyed but 14 of them were discarded due to errors in the responses, and another 33 were rejected for not having the same rotating crops (pepper and cucumber). Thus, after data entry and quality control, 110 samples were considered for the analysis, all of them homogeneous in their crops, soil conditions (“enarenado”), and location.
Questionnaires consisted of four basic sections. The first one included questions about the general socio-economic characteristics of farmers (age, education, gender, etc.). The second requested information on farm structure (scale, workers, age, profit, etc.). The third and fourth sections contained, respectively, questions on the assessment of current water usage (water analysis, control systems, technology, efficiency plans, water supplied, etc.) and other environmental issues (organic production, certifications, awareness, etc.).
3.2. Analysis and Methods
27 variables were analyzed, 13 related to the farms’ water usage, and the remainder to the farmers’ socio-economic characteristics, farm structure, and environmental performance. Table 1 shows the list of the variables included in the study.
As explained in the introduction section, two indicators of efficiency in water usage were considered: water usage efficiency (WUE) and water productivity (WP). These indicators were determined annually and the amount of rainwater entering the greenhouse is considered negligible [10]. The indicators are defined as [8,10,22]:
WUE (kg/m3) = (annual crop production)/(annual crop water supplied),
WP (€/m3) = (annual value of crop production)/(annual crop water supplied),
Certain previous studies have considered that low water supplied [32], innovative irrigation practices [33], water-efficient technology [34], and water-saving practices [35] contribute to the better use of water. This study also aims to take all of these aspects into account by means of the 13 variables included in the water usage characteristics of Table 1. The cost of water has not been included as a variable since it is very homogeneous among all of the farms in the sample.
Two statistical techniques are used: descriptive analysis and cluster analysis (k-means procedure). The former provides a better understanding of the study area, the characteristics of these family farms, and their water usage. After examining the descriptive statistics for various variables, those related to water use have been selected as clustering variables. Cluster analysis allows the sample to be separated into two homogeneous groups: Group 1 (less efficient regarding water usage) and Group 2 (more efficient). An analysis of variance (one-way ANOVA) is then implemented in order to find statistically significant differences in the group means of the variables that characterize them. This information is vital to identify the typology of farm households and to define measures and programs for the region, when considering that some farmers have already adopted the practices to achieve a higher level of efficiency, while other farmers have not.
Cluster analysis is a group of multivariate analysis techniques used to sort samples (farms in our case) into groups based on the characteristics that they possess. Family farms within a certain group must be similar to each other, yet every group should be different from the others. There are several algorithms for cluster analysis, and one of the most popular is the K-means cluster analysis [36]. It divides the data into k clusters at random and calculates the centroid of each cluster, assigning each case to the closest cluster. Then, new centroids are computed and farms are reassigned to the closest new cluster. This process is repeated until no more reassignment can be made. Different kinds of distance measures can be utilized. The one used in this study is the Euclidean distance as it is the most common for clustering purposes [37]. It is defined as the length of the line segment connecting two points.
Since there is no specific procedure to find the most appropriate number of clusters, agglomerative hierarchical clustering (Ward’s method) was used in this paper to determine the clusters [38]. Each observation starts in its own cluster, and pairs of clusters are merged as one moves up the hierarchy. The results of hierarchical clustering are usually presented in a dendrogram and this graphical representation helps to decide the optimal number of clusters. Then, the analysis is performed using different possible numbers of groups in the k-means procedure and in our case it was concluded that two clusters is the most balanced aggregation solution [39]. In order to test the statistically significant differences of the clustered centers for each group a one-way ANOVA was done.
4. Main Results
4.1. Findings from the Descriptive Statistic. Profile of the Respondents
Table 2 presents a brief description of the main variables measured in the study in order to provide a profile of the family farms.
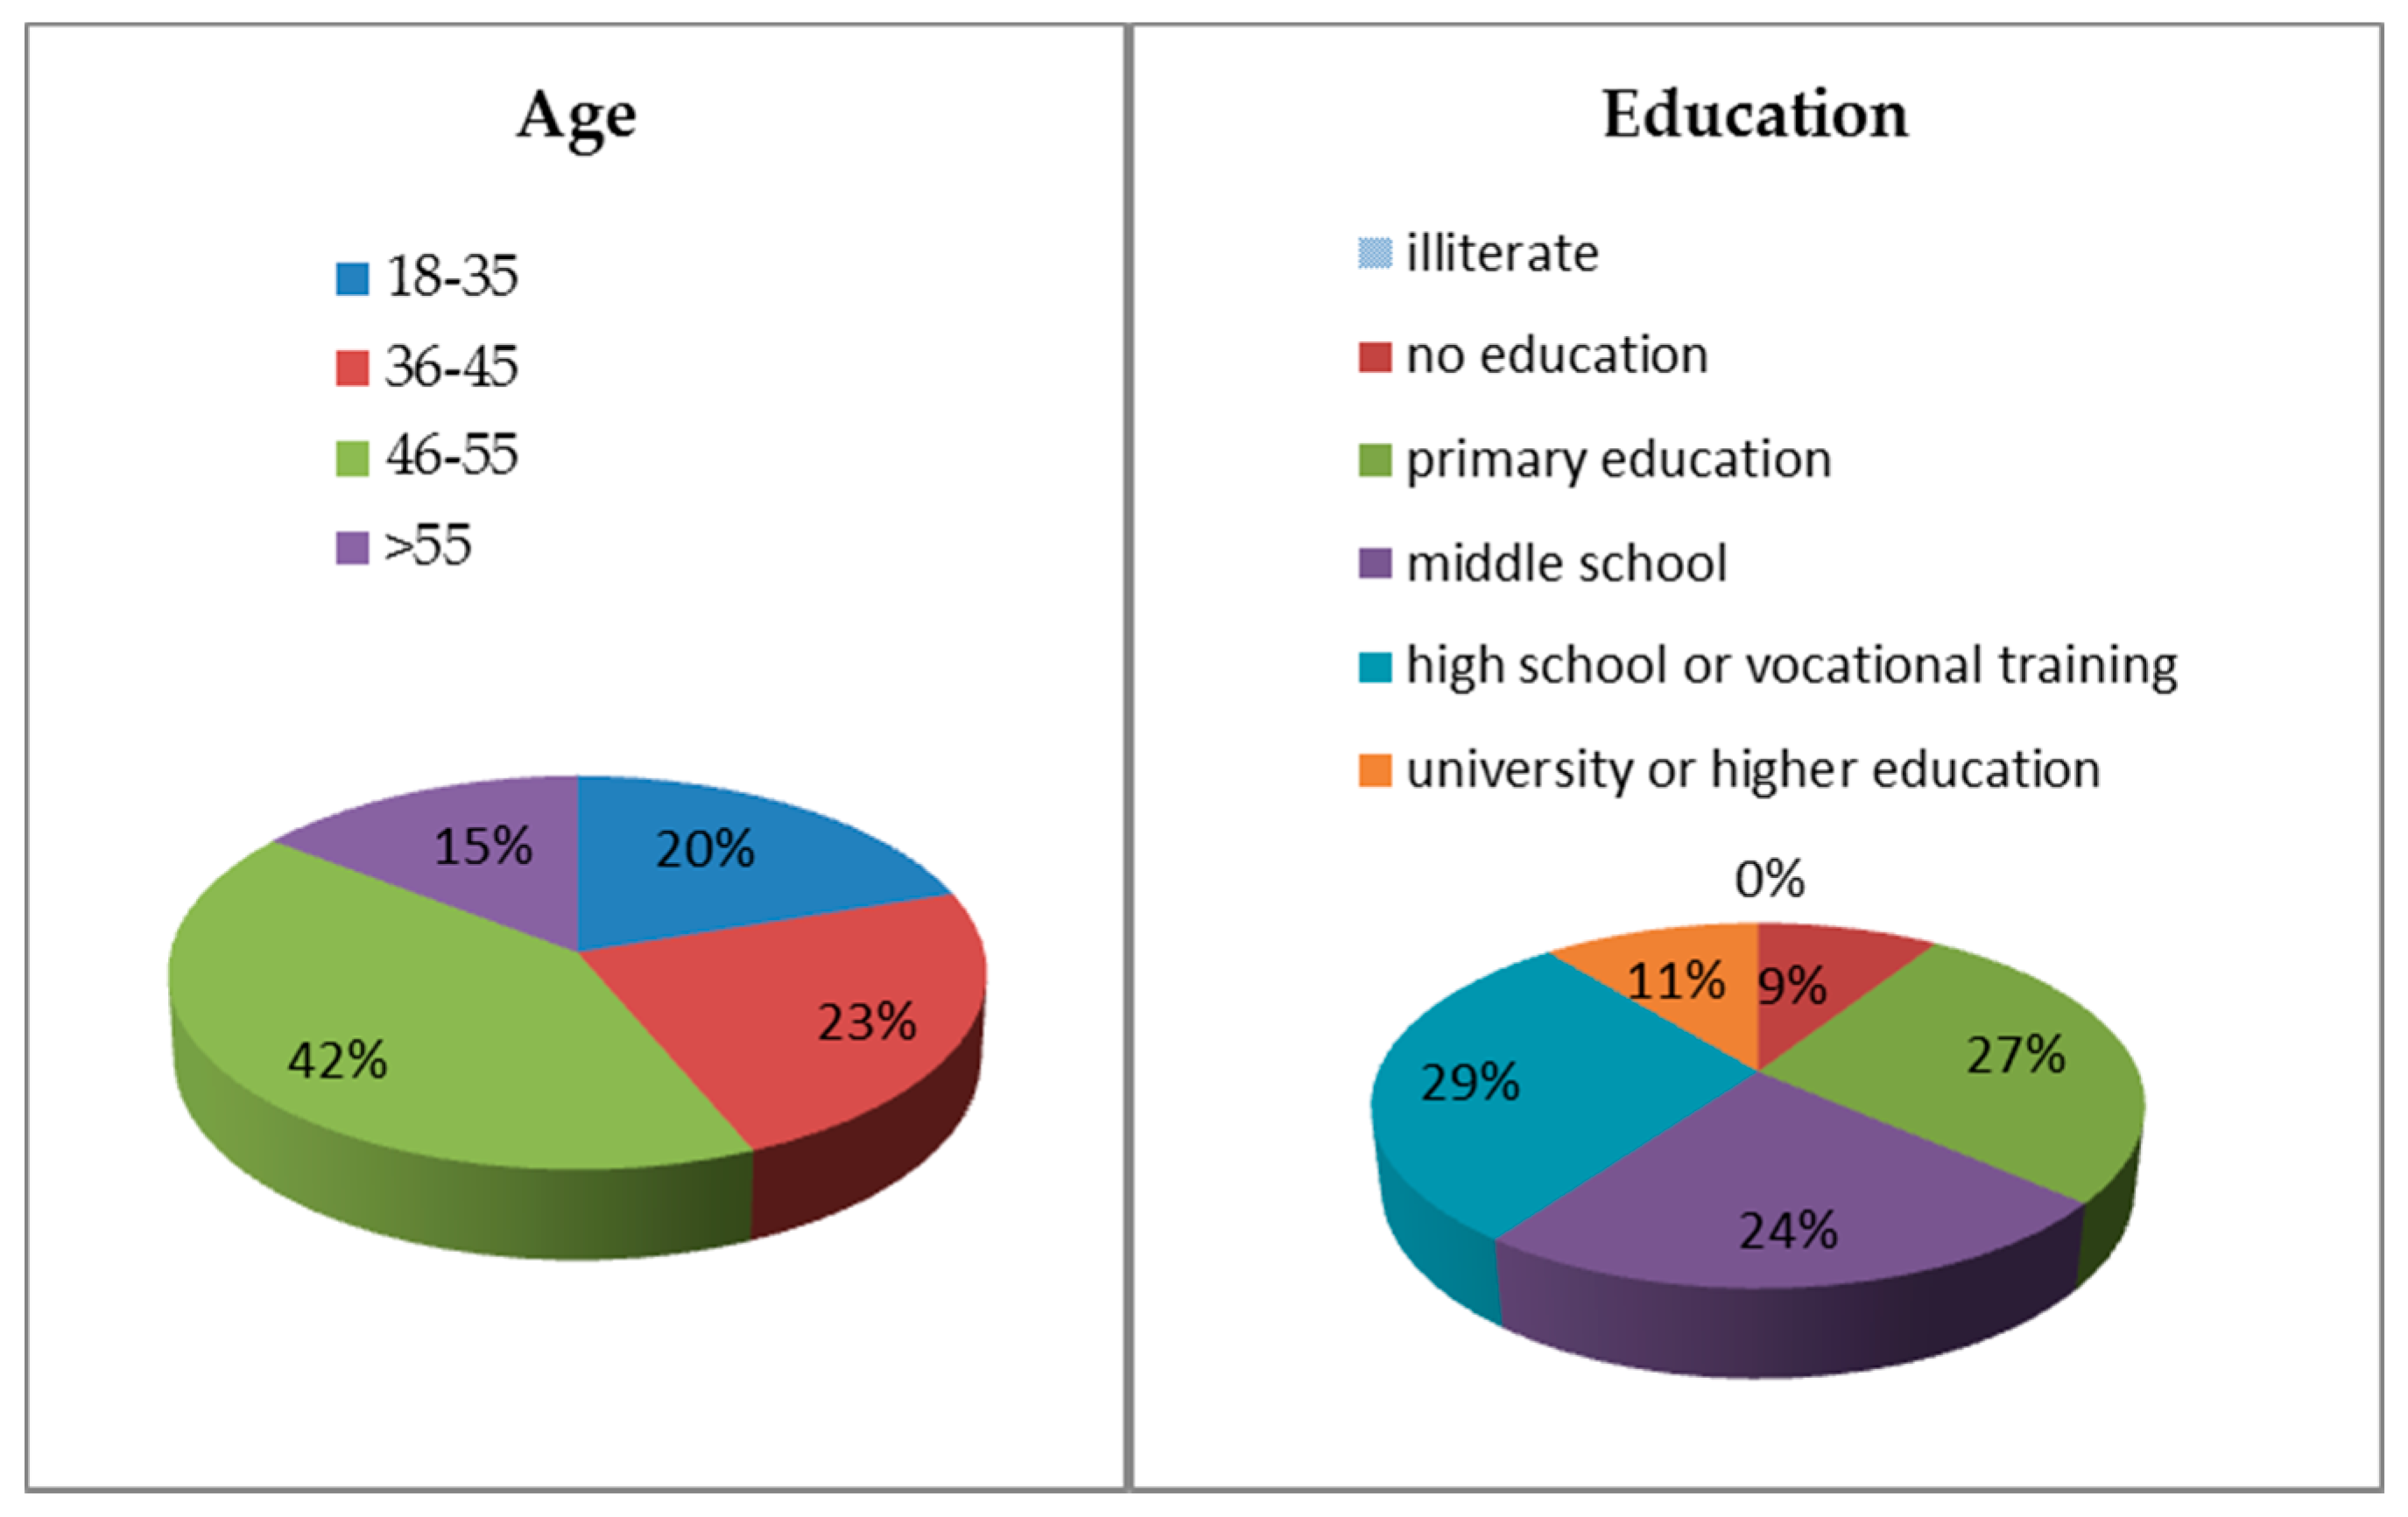
The results show that the farmers are relatively young, with almost 43% below the age of 46 (Figure 2). The age of the farmers influences the level of education. The farmers’ average education level is middle school, while about 11% have university or higher education (Figure 2). Only 9% of the farmers are female. Nevertheless, as they are family farms, it is common that other family members that work on the farm also participate in decision-making regarding farming activity. On average, women account for 32% of farm decision-makers (Table 2).
Of the farms surveyed, they are small family farms of approximately 3.6 hectares on average. Current farmers belong to the second generation and very positively value the efficiency of the marketing cooperatives in the sector. In fact, cooperatives play a key role in the development of water efficient practices. They offer advice on investment subsidies and on new irrigation technologies. 52.4% of the farms have taken out some kind of agrarian insurance, most commonly against possible damage to the greenhouse structure. This figure is not very high because the production costs have increased and farmers tend to dispense with any expenditure not directly related to production.
80% of the farmers replied to be environmentally aware to some degree, while 71% of them feel a strong influence from the sector to become more aware. The destination markets increasingly demand a guarantee of quality of the products. Such guarantees are a widespread practice, and many farmers certify their production following at least one quality standard. The achievement of the certification implies the fulfillment of certain requirements established in a protocol that allows quality products to be obtained while respecting the environment. The main environmental certifications obtained by most family farms in Almería are the Integrated Pest Management (Andalusian regional government), organic production (Andalusian regional government), GLOBAL-GAP, and UNE 155001. Biological production -ecological practices in agriculture, mainly represented in this case by the use of organic production and Integrated Pest Management- represent over 90% of total production. In addition, 26.6% of farms have at least one of the other environmental certifications, although 15% of them do not know the exact name.
Among other aspects, most of these environmental certifications require an appropriate use of natural resources, such as water. As a result, almost all of the farms in possession of such a certification declare that it is related to efficient water usage, although only 5.4% think that there is a strong relationship between their certifications and the efficiency in water use. Again, due to the quality demands of international markets regarding the products they purchase, 75.9% of the farms perform chemical and physical analyses to obtain quantitative values with respect to water quality.
Focusing on their water usage (Figure 3), 74.2% of the farms have installed structures to harvest and store rainwater and to incorporate it into the irrigation water supply system, but, as mentioned above, rainfall is very low. 75.1% use water from an irrigation community, while the remainders have their own well. The percentage of farms with water meter boxes is 63.6%, and 65.7% follow the instructions of a technician on water use for irrigation. 49.1% of the farms use the most technological irrigation system, i.e., irrigation on demand, which, as explained above, uses sensors to provide water automatically depending on crop requirements (Figure 4a). Among these sensors, tensiometers are used in 44.7% of the farms (Figure 4b).
83.4% of the farms have recently implemented some innovation for reducing water usage, most of them (89.1%) without receiving any public subsidy. This last reason may explain why only 50.9% of the farms are developing a water usage efficiency plan, although 89% of farmers engage in water-saving practices in their daily life. As mentioned above, the cost of water has not been taken into account as a variable since it is similar among all of the farms, at around 0.16 euros per cubic meter (this price refers to groundwater, i.e., aquifers, used by all farms in the sample). Finally, the average water supplied is 4683 m3 per hectare and year; the mean water productivity (WP) is 12.01 €/m3; and the average water usage efficiency (WUE) is 20.7 kg/m3. Although these two last amounts are relatively high as compared to other similar agricultural areas in the country according to the Spanish Agriculture Department, there are major differences among the farmers in this area, as indicated by the standard deviations from the mean.
4.2. Findings from the Cluster Analysis. Typology of Family Farms with Regard to Water Usage Efficiency
Even though these family farms are, in general, highly efficient in the use of water when compared to other agrarian systems [10,43], there is heterogeneity among them. For this reason, the sample was clustered.
To decide the most realistic and meaningful solution, k-mean analysis was used followed by one-way variance analysis to identify the difference in variance between clusters. By using k-mean procedure, the best solution was two clusters, which showed the lowest p-values for one-way analysis, representing the most significant difference of each variable among groups.
In this way, two groups of farms were identified applying cluster analysis: Group 1, made up of the less efficient farms regarding water usage; and, Group 2, consisting of the more efficient ones. The results are shown in Table 3, which displays the values of the main variables.
Each of these clusters is characterized by a distinct set of variables, allowing the following interpretation:
- Group 1: consisting of the less efficient farms regarding water usage, this group accounts for 38.2% of the farms in the sample (42 observations). Their mean WP of 10.43 €/m3 and WUE of 18.72 kg/m3 are 23% and 17%, respectively, lower than in Group 2. This cluster is therefore identified as having less efficient water usage. Their average water supplied of 5113 m3 per hectare is 16% higher than in the Group 2, with essentially the same yield. 37% of the farms perform water analysis; 55% harvest rainwater; 59% use water from an irrigation community; only 16% have a water meter box; and, 15% use technical advice for irrigation. None use irrigation on demand; 63% of the farms have implemented an innovation for irrigation with only 6% receiving a subsidy; and, 7% have a water usage efficiency plan, although 81% of these farmers claim to carry out water-saving practices in their daily life. The farmers are approximately 48 years old, and their average education level is primary school. The percentage of farm decision-makers that are women is 19.7%. These farms have cultivated about three types of crops in the last years and 11% of the farms have taken out agrarian insurance. 63% of the farmers claim to be environmentally aware, and 59% think the sector is also highly aware. About 73% of the yield from these farms is biological, but none of them have other environmental certifications.
- Group 2: is the larger cluster, including 61.8% of the farms in the sample (68 observations). Their mean WP of 13.54 €/m3 and WUE of 22.60 kg/m3 are 23% and 17%, respectively, higher than in Group 2. This cluster is therefore identified as being more efficient regarding water usage. Their mean water supplied of 4420 m3 per hectare is 16% lower than the other groups, while the average yield is 109.15 tons per hectare. All of the farms perform water analysis; 86% harvest the rainwater; 85% use water from an irrigation community; and, 93% have a water meter box. Almost all of them use technical advice and irrigation on demand, employing tensiometers in 68% of the cases. Only 14% have received a subsidy, but this has not prevented them from implementing water innovations. 78% of them have a water usage efficiency plan, and they carry out water-saving measures in their daily life. The farmers are about 43 years old, and their average education level is high school or vocational training. Approximately 39% of farm decision-makers are women and 78% of them have taken out agrarian insurance. 96% of the farmers claim to be environmentally aware and 82% also consider the sector to be aware. 90% of the yield is biological, and 43% of farms have other environmental certifications, but only 25% of them consider these certifications to be closely related to efficient water usage.
Table 3 also shows the analysis of variance of the cluster analysis (one-way ANOVA analysis). All of the variables except subsidy, scale, generation, yield, and income differ significantly between groups with a level of likelihood of 5% (p-value < 0.05). This is a good indication of the suitability of the typology created.
For clustering variables, WUE, WP, water_supplied, meter_box, analysis, technician, system, control, plan, and water_saving are significantly different among the groups, and thus contribute the most to the definition of the two clusters. Rain, community, innovation, and water_certification also contribute to the definition of these groups, but to a lower extent. Subsidy is non-significant (p = 0.423).
Among the personal attributes of the farmer, education is more significantly different. Regarding farm characteristics, employment, insurance, and cooperatives are the most statistically significant in this analysis. Scale, generation, yield, and income are non-significant.
Finally, related to environmental performance, all of the variables are significantly different among the groups, especially green_certification and farmer_awareness.
Therefore, the main differences between the two groups are based on the extent to which innovation and new technologies are used in irrigation (Figure 5). In fact, most of the innovations applied in this agricultural sector have been oriented towards optimizing water usage and this is reflected in the results. The closer the value shown in Figure 5 is to 1, the more farms in the group meet that characteristic. Indeed, the farms in Group 2 have technical advisors and use irrigation on demand and tensiometers, which measure the water needs of the crops and are therefore considered the most technological irrigation system. As these farms are more technological, they are less labor intensive. To protect these investments against possible non-expected damages, farmers take out agrarian insurance policies. Being aware of water scarcity and the need to conserve the environment also contributes to water use efficiency. Farmers in Group 2 show a greater awareness of these issues. They also have water efficiency plans and environmental certifications.
Education is a further aspect that differentiates the farms in Group 2 from less efficient ones. Finally, farmers in Group 2 have a higher average level of education.
5. Discussion
The current agricultural system in some arid and semi-arid areas is not sustainable in the long term. In southeast Spain, groundwater is the main water source and it is overexploited, while alternatives like desalination are still limited [11]. The Water Plan for the Mediterranean Basins 2015–2020 indicates a global deficit of 73.42 × 10⁶ m3 and an overexploitation of the aquifers in Almería of 150 × 106 m3. In order to solve this serious problem, two major actions can be taken: increasing available water, and/or improving the efficiency of its use. This study focuses on the latter, finding that better practices and policies can have a substantial impact on achieving a more sustainable and efficient use of water.
Data on 27 variables from 110 observations were evaluated in the selected area of research, especially regarding water usage. The analysis has shown that, in general, the family farms in the study area are highly efficient in their use of water, achieving a high productivity with low supply. This efficiency is based mainly on the management of irrigation, the permanent improvement of irrigation systems, the adoption of new technology, and improved knowledge of irrigation programming.
By means of a cluster analysis, two groups have been identified: Group 1, which includes less efficient farms as regards water usage; and, Group 2, which comprises of the more efficient ones. The typology of the family farms proposed in this study is interesting because it shows internally homogeneous clusters that are different from each other. This information could aid the decision making of both farmers and public policy makers with a view to better management of the region’s water resources.
The first cluster or Group 1, which comprises of the less efficient farms, is less numerous and is characterized by farmers with lower level of education, less innovation, traditional irrigation systems based on farmers’ experience, more intensive labor, and less awareness of water scarcity and environmental conservation. On the other hand, Group 2, with the more efficient farms, is larger and is characterized by more educated farmers, more female decision-makers, a greater degree of innovation, new irrigation technology, membership of irrigation communities, and a greater awareness of water issues and environmental sustainability [31]. However, there is no difference between the two clusters in terms of farm scale, age (generation), yield, income and public subsidies received.
Most of the family farms in Group 1 irrigate on the basis of their own experience or following standard recommendations with little use of available technical information. They do not use sensors that measure the water status of the soil or crop, such as tensiometers. In general, these farmers misuse water because they do not determine crop water requirements. This may be due to a lack of knowledge, training, awareness, or money to invest. Sensors require time, knowledge, and maintenance, all of which is costly in a sector for which few public subsidies are provided. However, faced with higher input costs and the stabilization of sales prices, farms can improve productivity and efficiency by investing in technology. Indeed, the family farms in Group 2 employ more technological irrigation techniques, such as irrigation on demand and tensiometers.
One of the best ways to improve the efficiency of water usage is to adjust the irrigation to the water needs of the crops and soil [34]. In the case of Group 1, farmers should be made more aware of the available information. Improvements in water efficiency could be achieved through educational and knowledge sharing programs that train farmers in the use of more efficient water practices [44]. At the same time, farmers should better understand how innovation and technology could improve their situation. Ervin and Ervin [45] argue that awareness of the problem that the technology is supposed to solve plays a crucial role in the decision-making process of technology adoption. More public subsidies and financing facilities through agro-environmental lines would also be needed. In fact, Karali et al. [46] found that public subsidies are one of the major factors that influence farmer participation in environmental management practices.
On the other hand, the irrigation systems used by the farms in Group 2 do adjust the irrigation to the water needs of the soil, but measure the water status of a reduced volume of soil, so even this technology should continue to improve in order to automate and optimize irrigation. All of the farms should also maximize irrigation with systems for water recycling and rainwater harvesting systems. Moreover, all of the farms should be organized into irrigation communities, which have given rise to what might be termed a culture of correct water usage [10].
One more point of interest for policy makers is that there is a lower degree of male dominance in the farms belonging to the more efficient group regarding water use. Female influence in decision-making could therefore contribute to sensitivity on different issues, including water efficiency [47]. Thus, policies should promote the access of women to management and decision-making circles via educational programs and measures to reconcile work and family life.
Another differentiating aspect is the fact that the family farms in Group 1 have not obtained any environmental certifications, while almost half of those in Group 2 have. These certifications usually require minimum quality standards in production, and many of them are also related to the sustainable usage of natural resources, including water. It will prove difficult for family farms to be competitive if their products do not meet the environmental quality requirements of end markets, and so these certifications are highly recommendable [48]. One of the problems is that there are a large number of different quality standards. Some have been created by supermarkets and distributors that oblige companies to comply with them if they want to maintain the commercial relationship. Homogenization of these certifications would certainly facilitate the farmers’ adoption of them. In addition, government support defraying part of the expenses derived from certification and offering information and personalized advisory services to growers would also help.
Having one of these certifications depends in part on the demands of the markets, but also on the farmers’ own environmental awareness. In this sense, it seems that farmers’ water usage relates to their awareness of environmental sustainability and also their awareness of water scarcity. Along these lines, Jorgensen et al. [49] found that households with lower water usage display a greater awareness of water conservation issues. For agriculture, Wang et al. [35] studied the relationship between awareness of water scarcity and water usage. Hence, in arid and semi-arid areas such as this one, awareness campaigns should be carried out highlighting the problem of water scarcity [44]. Education also plays an important role and is therefore an area for future improvements, as the results show that the more efficient farmers have a higher average level of education.
In general, the study has emphasized the heterogeneity of family farms to explain the most crucial factors for water usage efficiency. According to the results, family farms’ water usage efficiency is significantly improved by a higher incidence of technology, innovation, education, and awareness of environmental and water issues. Local, regional, and national governments should provide more support to these farms. The findings provide useful information for planners and policy-makers to improve the design and the implementation of a strategic plan regarding water planning and agricultural policies. The results of this work can be extended to farms in other arid or semi-arid areas (southern Italy, Greece, Turkey, Israel, or northern Africa), as well as to those in areas that have already attempted to imitate the so-called “Almería model”, such as Mexico (Sinaloa, Zacatecas), Morocco (Agadir, Larache), Chile (Arica), Peru (Tacna), Bolivia (Chuquisaca), and China (Beijing, Kunming) [30]. Nevertheless, the present study has limitations. Future work could focus on expanding the factors that have an influence on efficient use of water resources in agriculture, as this is one of the most important measures required to reduce the impact on the environment and to achieve a resource-efficient economy with a view to building a sustainable future.
6. Conclusions
One of the most important challenges for the sustainability of the agricultural sector in the current context is the efficient use of natural resources such as water. In many arid and semi-arid areas, there is considerable pressure on water resources due to farming. Adequate management is crucial to maintain a balance between food production and water resource constraints.
The main aim of this study is to present the major factors related to water usage efficiency in farming. The research area is one of the most efficient in water usage in Spain, but there is a high heterogeneity between family farms, and, therefore, there are many aspects to improve. The results show that agricultural policies should mainly focus on technology, innovation, education, and environmental awareness, which is crucial to change farmers’ behavior. As policies relating to water costs are complex, water awareness programs should be promoted to reward the most efficient farmers or organizations. In this sense, public institutions and agricultural organizations should work together to achieve a constant improvement in water use and water saving, and, in general, promote the adoption of practices involving the efficient use of natural resources and respect for the environment.
Acknowledgments
This research was partially funded by Spanish MCINN and FEDER aid (project ECO2014-52268-P) and by Andalusian Regional Government (project SEJ-2555, Consejería de Economía, Innovación y Ciencia). The authors are also grateful for the support received from C-BIRD project, Cooperative Business and Innovative Rural Development (project 611490, FP7-PEOPLE-2013-IAPP).
Author Contributions
All authors contributed equally to this work.
Conflicts of Interest
The authors declare no conflict of interest.
References
- Azad, M.A.S.; Ancev, T. Measuring environmental efficiency of agricultural water use: A Luenberger environmental indicator. J. Environ. Manag. 2014, 145, 314–320. [Google Scholar] [CrossRef] [PubMed]
- Todorovic, M.; Mehmeti, A.; Scardigno, A. Eco-efficiency of agricultural water systems: Methodological approach and assessment at meso-level scale. J. Environ. Manag. 2016, 165, 62–71. [Google Scholar] [CrossRef] [PubMed]
- Aldaya, M.M.; Garrido, A.; Llamas, M.R.; Varela-Ortega, C.; Novo, P.; Rodríguez Casado, R. Water footprints and virtual trade in Spain. In Water Policy in Spain; Garrido, A., Llamas, M.R., Eds.; CRC Press: Leiden, The Netherlands, 2010; pp. 49–59. [Google Scholar]
- European Union. Directive 2000/60/EC of the European Parliament and of the Council of 23 October 2000 Establishing a Framework for Community Action in the Field of Water Policy; European Union: Brussels, Belgium, 2000. [Google Scholar]
- Sotelo, J.A. Huella Hídrica, Desarrollo y Sostenibilidad en España; Fundación Mapfre: Madrid, Spain, 2011. (In Spanish) [Google Scholar]
- Duarte, R.; Pinilla, V.; Serrano, A. The water footprint of the Spanish agricultural sector: 1860–2010. Ecol. Econ. 2014, 108, 200–207. [Google Scholar] [CrossRef]
- López-Gunn, E.; Zorrilla, P.; Prieto, F.; Llamas, M.R. Lost in translation? Water efficiency in Spanish agriculture. Agric. Water Manag. 2012, 108, 83–95. [Google Scholar] [CrossRef]
- Zoebl, D. Is Water Productivity a Useful Concept in Agricultural Water Management? Agric. Water Manag. 2006, 84, 265–273. [Google Scholar] [CrossRef]
- Galdeano-Gómez, E.; Pérez-Mesa, J.C.; Godoy-Durán, A. The social dimension as a driver of sustainable development: The case of family farms in southeast Spain. Sustain. Sci. 2016, 11, 349–362. [Google Scholar] [CrossRef]
- Fernández, M.D.; González, A.M.; Carreño, J.; Pérez, C.; Bonachela, S. Analysis of on-farm irrigation performance in Mediterranean greenhouses. Agric. Water Manag. 2007, 89, 251–260. [Google Scholar]
- Cajamar. Análisis de la Campaña Hortofrutícola de Almería, Campaña 2014/2015; Cajamar: Almería, Spain, 2016. (In Spanish) [Google Scholar]
- Cazcarro, I.; Duarte, R.; Martin-Retortillo, M.; Pinilla, V.; Serrano, A. How sustainable is the increase in the water footprint of the Spanish agricultural sector? A provincial analysis between 1955 and 2005–2010. Sustainability 2015, 7, 5094–5119. [Google Scholar] [CrossRef]
- Ma, H.; Shi, C.; Chou, N. China’s Water Utilization Efficiency: An Analysis with Environmental Considerations. Sustainability 2016, 8, 516. [Google Scholar] [CrossRef]
- Mitchell, M.; Curtis, A.; Sharp, E.; Mendham, E. Social Research to Improve Groundwater Governance: A Literature Review; Institute for Land, Water and Society, Charles Sturt University: Albury, Australia, 2011. [Google Scholar]
- Frija, A.; Chebil, A.; Speelman, S. Farmers’ adaptation to groundwater shortage in the dry areas: Improving appropriation or enhancing accommodation? Irrig. Drain. 2016, 65, 691–700. [Google Scholar] [CrossRef]
- Wheeler, S.; Zuo, A.; Bjornlund, H. Farmers’ climate change beliefs and adaptation strategies for a water scarce future in Australia. Glob. Environ. Chang. 2013, 23, 537–547. [Google Scholar] [CrossRef]
- Barr, N. The House on the Hill: The Transformation of Australia’s Farming Communities; Land & Water Australia and Halstead Press: Canberra, Australia, 2009. [Google Scholar]
- Van Steenbergen, F.; Kaisarani, A.B.; Khan, N.U.; Gohar, M.S. A case of groundwater depletion in Balochistan, Pakistan: Enter into the void. J. Hydrol. Reg. Stud. 2015, 27, 36–47. [Google Scholar] [CrossRef]
- Piedra-Muñoz, L.; Vega-López, L.L.; Galdeano-Gómez, E.; Zepeda-Zepeda, J.A. Drivers for efficient water use in agriculture: An empirical analysis of family farms in Almería (Spain). Exp. Agric. 2016. [Google Scholar] [CrossRef]
- Gómez-Limón, J.A.; Arriaza, M.; Villanueva, A.J. Typifying irrigated areas to support policy design and implementation: The case of the Guadalquivir river basin. Irrig. Drain. 2013, 62, 322–329. [Google Scholar] [CrossRef]
- Gleick, P.H.; Christina-Smith, J.; Cooley, H. Water-use efficiency and productivity: Rethinking the basin approach. Water Int. 2011, 36, 784–798. [Google Scholar] [CrossRef]
- Lu, Y.; Zhang, X.; Chen, S.; Shao, L.; Sun, H. Changes in water use efficiency and water footprint in grain production over the past 35 years: A case study in the North China Plain. J. Clean. Prod. 2016, 116, 71–79. [Google Scholar] [CrossRef]
- Guo, S.; Shen, G.Q.; Peng, Y. Embodied agricultural water use in China from 1997 to 2010. J. Clean. Prod. 2016, 112, 3176–3184. [Google Scholar] [CrossRef]
- González, A.M. Programas de Riego Para Cultivos Hortícolas en Invernaderos Enarenados en Almería. Ph.D. Thesis, University of Almería, Almería, Spain, 2003. (In Spanish). [Google Scholar]
- Bonachela, S.; González, A.M.; Fernández, M.D. Irrigation scheduling of plastic greenhouse vegetable crops based on historical weather data. Irrig. Sci. 2006, 25, 53–62. [Google Scholar] [CrossRef]
- Junta, D.A. Caracterización de los Invernaderos de Andalucía; Junta de Andalucía: Seville, Spain, 2015. (In Spanish) [Google Scholar]
- Junta, D.A. Cartografía de Invernaderos en el Litoral de Andalucía Oriental; Junta de Andalucía: Seville, Spain, 2016. (In Spanish) [Google Scholar]
- García García, M.C.; Céspedes López, A.J.; Pérez Parra, J.J.; Lorenzo Mínguez, P. El Sistema de Producción Hortícola Protegido de la Provincia de Almería; IFAPA: Seville, Spain, 2016. (In Spanish) [Google Scholar]
- Valera, D.; Belmonte, L.; Molina, F.; López, A. Greenhouse Agriculture in Almería. A Comprehensive Techno-Economic Analysis; Cajamar: Almería, Spain, 2016. [Google Scholar]
- Galdeano-Gómez, E.; Aznar-Sánchez, J.A.; Pérez-Mesa, J.C. Sustainability dimensions related to agricultural based-development: The experience of 50 years of intensive farming in Almería (Spain). Int. J. Agric. Sustain. 2013, 11, 125–143. [Google Scholar] [CrossRef]
- Piedra-Muñoz, L.; Galdeano-Gómez, E.; Pérez-Mesa, J.C. Is sustainability compatible with profitability? An empirical analysis on family farms activity. Sustainability 2016, 8, 893. [Google Scholar] [CrossRef]
- Sun, S.; Liu, J.; Wu, P.; Wang, Y.; Zhao, X.; Zhang, X. Comprehensive evaluation of water use in agricultural production: A case study in Hetao Irrigation District, China. J. Clean. Prod. 2016, 112, 4569–4575. [Google Scholar] [CrossRef]
- Levidow, L.; Zaccaria, D.; Maria, R.; Vivas, E.; Todorovic, M. Improving water-efficient irrigation: Prospects and difficulties of innovative practices. Agric. Water Manag. 2014, 146, 84–94. [Google Scholar] [CrossRef]
- López-Gunn, E.; Mayor, B.; Dumont, A. Implications of the modernization of irrigation systems. In Water, Agriculture and the Environment in Spain: Can We Square the Circle? De-Stefano, L., Ed.; CRC Press/Balkema: Leiden, The Netherlands, 2012; pp. 241–253. [Google Scholar]
- Wang, J.; Xu, Z.; Huang, J.; Rozelle, S. Incentives to managers or participation of farmers in China’s irrigation systems: Which matters most for water savings, farmer income, and poverty? Agric. Econ. 2006, 34, 315–330. [Google Scholar] [CrossRef]
- Setyaningsih, S. Using cluster analysis study to examine the successful performance entrepreneur in Indonesia. Procedia Econ. Financ. 2012, 4, 286–298. [Google Scholar] [CrossRef]
- Hair, J.F.; Black, C.W.; Babin, J.B.; Anderson, E.R.; Tatham, L.R. Multivariate Data Analysis; Pearson Prentice Hall: Upper Saddle River, NJ, USA, 2006. [Google Scholar]
- Kobrich, C.; Rehman, T.; Khan, M. Typification of farming systems for constructing representative farm models: Two illustrations of the application of multi-variate analyses in Chile and Pakistan. Agric. Syst. 2003, 76, 141–157. [Google Scholar] [CrossRef]
- Jung, Y.; Park, H.; Du, D.; Drake, B.L. A decision criterion for the optimal number of clusters in hierarchical clustering. J. Glob. Optim. 2003, 25, 91–111. [Google Scholar] [CrossRef]
- Kuswardhani, N.; Soni, P.; Shivakoti, G.P. Cluster analysis for classification of farm households based on socio-economic characteristics for technology adoption in agriculture: A case study of West Java province, Indonesia. J. Food Agric. Environ. 2014, 12, 238–247. [Google Scholar]
- Nunes, B.; Bennett, D.; Marques Júnior, S. Sustainable agricultural production: An investigation in Brazilian semi-arid livestock farms. J. Clean. Prod. 2014, 64, 414–425. [Google Scholar] [CrossRef]
- Maleksaeidi, H.; Karami, E.; Zamani, G.H.; Rezaei-Moghaddam, K.; Hayati, D. Discovering and characterizing farm households´resilience under water scarcity. Environment, Development and Sustainability 2016, 18, 499–525. [Google Scholar] [CrossRef]
- Gil, M.; Garrido, A.; Gómez-Ramos, A. Análisis de la productividad de la tierra y del agua en el regadío español. In La Economía del Agua de Riego en España; Gómez-Limón, J.A., Calatrava, J., Garrido, A., Sáez, F.J., Eds.; Fundación Cajamar: Almería, Spain, 2009; pp. 95–114. (In Spanish) [Google Scholar]
- Nguyen, T.P.L.; Mula, L.; Cortignani, R.; Seddaiu, G.; Dono, G.; Virdis, S.G.P.; Pasqui, M.; Roggero, P.P. Perceptions of present and future climate change impacts on water availability for agricultural systems in the Western Mediterranean Region. Water 2016, 8, 523. [Google Scholar] [CrossRef]
- Ervin, C.A.; Ervin, D.E. Factor affecting the use of soil conservation practices: Hypotheses, evidence and policy implications. Land. Econ. 1982, 58, 277–292. [Google Scholar] [CrossRef]
- Karali, E.; Brunner, B.; Doherty, R.; Hersperger, A.; Rounsevell, M. Identifying the factors that influence farmer participation in environmental management practices in Switzerland. Hum. Ecol. 2014, 42, 951–963. [Google Scholar] [CrossRef]
- Tong, Y.; Fan, L.; Niu, H. Water conservation awareness and practices in households receiving improved water supply: A gender-based analysis. J. Clean. Prod. 2017, 141, 947–955. [Google Scholar] [CrossRef]
- Galdeano-Gómez, E.; Zepeda-Zepeda, J.A.; Piedra-Muñoz, L.; Vega-López, L.L. Family farm´s features influencing socio-economic sustainability: An analysis of agrifood sector in southeast Spain. New Medit 2017, 1, 50–61. [Google Scholar]
- Jorgensen, B.; Graymore, M.; O’Toole, K. Household water use behavior: An integrated model. J. Environ. Manag. 2009, 91, 227–236. [Google Scholar] [CrossRef] [PubMed]
Figure 1.
Map of Spain showing the location of the research area.

Figure 2.
Personal attributes of the farmers.

Figure 3.
Results related to water usage.

Figure 4.
(a) Measurement of water level of soil and crops; (b) Tensiometer.
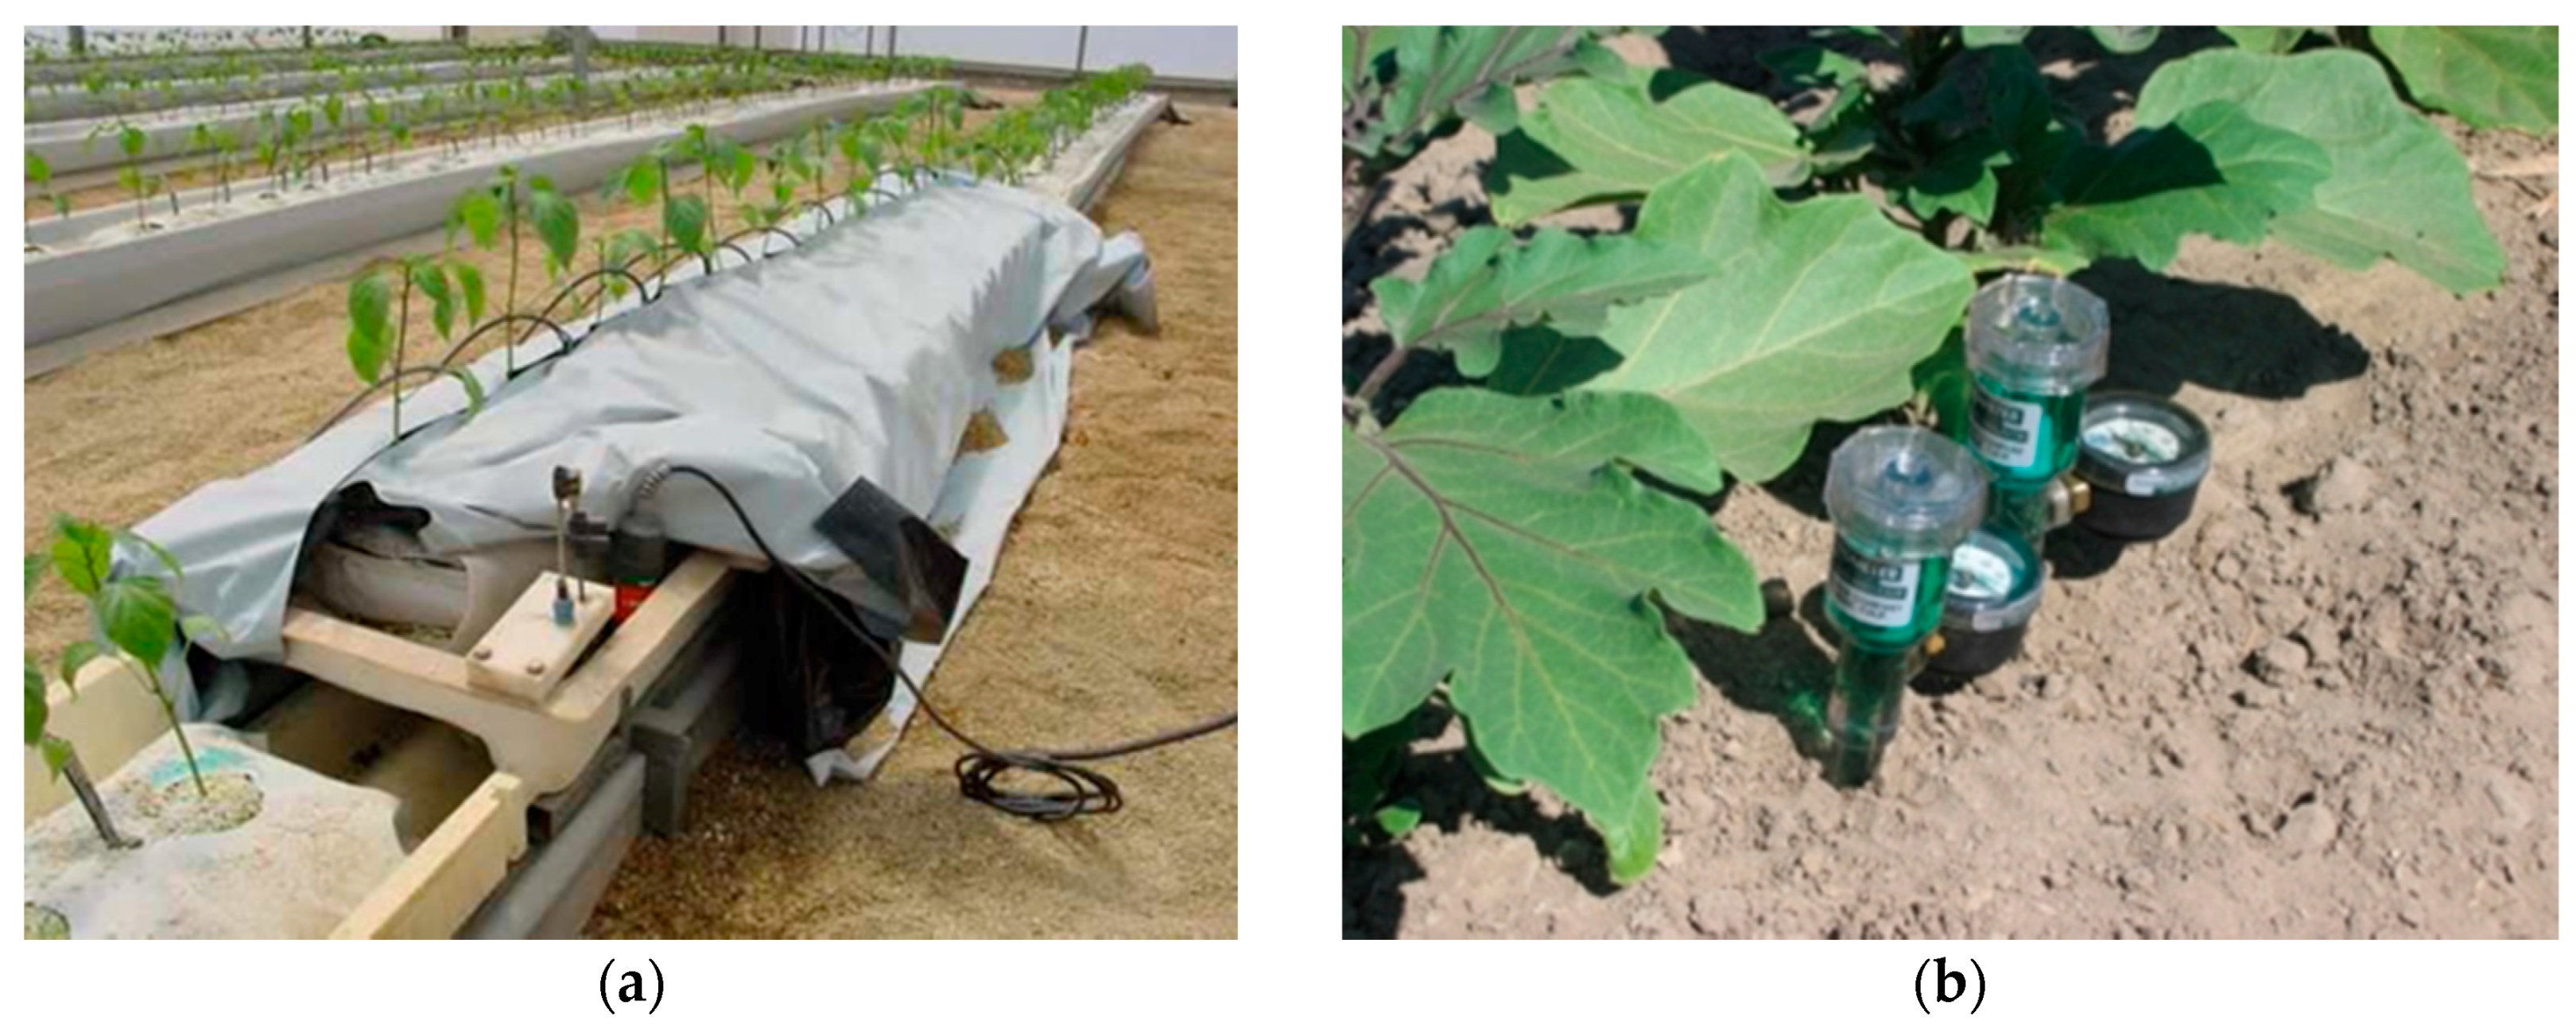
Figure 5.
Average scores for Groups 1 and 2 on dummy variables.


Table 1.
Variables included in the analysis.
| Name of Variable | Description |
|---|---|
| Personal Attributes of the Farmer | |
| Age | Farmer’s age |
| Education | Farmer’s education, measured on a scale of 0—no education to 5—university or higher education |
| Characteristics of the Farm | |
| Women | Percentage of farm decision-makers that are women |
| Scale | Area of agricultural farm in hectares |
| Generation | Farm’s age, measured by the number of generations that have run the family farm |
| Employment | Number of total workers per hectare |
| Yield | Annual crop production in tons per hectare |
| Income | Annual income in thousands of euros per hectare |
| Insurance | Whether the farm has taken out agrarian insurance (=1) or not (=0) |
| Cooperatives | Farm’s evaluation of the efficiency of the marketing cooperatives in the sector, on a scale of 0–5 |
| Environmental Performance | |
| Bio | Annual biological production—organic and/or Integrated Pest Management—in tons per hectare |
| Green_certification | Whether the farm has any environmental certification (= 1) or not (= 0) |
| Farmer_awareness | Farmer’s environmental awareness, on a scale of 0–5 |
| Sector_awareness | How much influence from the sector the farmer perceives to be more aware of environmental sustainability, on a scale of 0–5 |
| Water Usage Characteristics | |
| Rain | Whether the farm harvests rainwater to incorporate it into the irrigation system (=1) or not (=0) |
| Community | Whether the irrigation water comes from an irrigation community (=1) or not (=0) |
| Analysis | Whether the farm performs irrigation water analysis to control its quality (=1) or not (=0) |
| Meter_box | Whether the farm has a water meter box (=1) or not (=0) |
| Technician | Whether the farm is advised by a technician regarding the use of water in irrigation (=1) or not (=0) |
| System 1 | Whether the farm uses irrigation on demand (=1) or scheduled irrigation (=0) |
| Control 2 | Whether the farm uses a tensiometer for irrigation (=1) or not (=0) |
| Innovation | Whether the farm has recently implanted any innovation for reducing water usage (=1) or not (=0) |
| Plan | Whether the farm is developing any water usage efficiency plan (=1) or not (= 0) |
| Water_certification | Whether the environmental certification is related to efficient water usage, on a scale of 0–5 |
| Water_supplied | Annual water applied to the crops in thousands of m3 per hectare |
| Water_saving | Farmer’s employment of water-saving practices in daily life, on a scale of 0–5 |
| Subsidy | Dummy variable of 1 if the farm has received any public subsidy to implant water use improvements, and 0 if this is not the case |
Notes: 1 Given the diversity of systems that can coexist on the farming analyzed, this study has considered the most technological irrigation system available. Two possible systems have been differentiated: (a) irrigation on demand, which provides water depending on the requirements of the crops, using climatic sensors that establish the critical values of temperature or humidity at which irrigation is necessary. This is considered the most technological irrigation system; or, (b) scheduled irrigation, in which the farmer calculates the irrigation time required each day based on the crop and climate, either manually or using a programmer. 2 Tensiometer is an advanced sensor used to determine water requirements and adjust irrigation. The activation of irrigation is performed according to the state of humidity of the soil and this information is obtained by the soil moisture tension measured with tensiometers. Soil moisture tension is the force that plant roots must use to draw water from the soil. This tension reflects the level of moisture in the soil: the higher the tension, the drier the soil. The tensiometer must be positioned accurately with respect to the crops to avoid errors caused by heterogeneity of the soil.
Table 2.
Summary statistics for the main variables of the study.
| Variable | Mean | Std. Dev. | Minimum | Maximum |
|---|---|---|---|---|
| Efficiency Measures | ||||
| WUE (kg/m3) | 20.70 | 2.39 | 18.18 | 25.38 |
| WP (€/m3) | 12.01 | 3.39 | 4.72 | 22.90 |
| Personal Attributes of the Farmer | ||||
| Age | 45 | 10.48 | 18 | 69 |
| Education | 3.25 | 1.17 | 1 | 5 |
| Characteristics of the Farm | ||||
| Women | 32.01 | 24.41 | 0 | 66.67 |
| Scale | 3.65 | 3.49 | 0.4 | 20 |
| Generation | 1.96 | 0.75 | 1 | 4 |
| Employment | 1.64 | 1.20 | 0.05 | 6 |
| Yield | 109.11 | 21.20 | 90.74 | 175.54 |
| Income | 63.53 | 14.20 | 25.03 | 100.78 |
| Insurance | 0.52 | 0.50 | 0 | 1 |
| Cooperatives | 3.97 | 1.04 | 2 | 5 |
| Environmental Performance | ||||
| Bio | 91.53 | 19.15 | 81.31 | 159.59 |
| Green_certification | 0.27 | 0.42 | 0 | 1 |
| Farmer_awareness | 2.43 | 1.39 | 0 | 5 |
| Sector_awareness | 3.55 | 1.45 | 1 | 5 |
| Water Usage Characteristics | ||||
| Rain | 0.74 | 0.46 | 0 | 1 |
| Community | 0.75 | 0.45 | 0 | 1 |
| Analysis | 0.76 | 0.47 | 0 | 1 |
| Meter_box | 0.64 | 0.50 | 0 | 1 |
| Technician | 0.66 | 0.50 | 0 | 1 |
| System | 0.59 | 0.50 | 0 | 1 |
| Control | 0.45 | 0.49 | 0 | 1 |
| Innovation | 0.83 | 0.40 | 0 | 1 |
| Plan | 0.51 | 0.50 | 0 | 1 |
| Water_certification | 0.51 | 0.92 | 0 | 4 |
| Water_supplied | 4.68 | 0.96 | 4.21 | 5.95 |
| Water_saving | 4.16 | 1.13 | 1 | 5 |
| Subsidy | 0.11 | 0.31 | 0 | 1 |
Table 3.
Characteristics of identified clusters of farms and test statistics of one-way ANOVA.
| Water Usage Efficiency Clusters | ||||||
|---|---|---|---|---|---|---|
| Group 1 N = 42 | Group 2 N = 68 | |||||
| Low | High | |||||
| Variable | Mean | Std. Dev. | Mean | Std. Dev. | F | p-Value |
| Efficiency measures | ||||||
| WUE (kg/m3) | 18.72 | 0.83 | 22.60 | 1.75 | 109.14 | 0.000 |
| WP (€/m3) | 10.43 | 1.95 | 13.54 | 2.79 | 14.50 | 0.000 |
| Personal Attributes of the Farmer | ||||||
| Age | 48.52 | 9.21 | 42.79 | 11.01 | 4.37 | 0.041 |
| Education | 2.15 | 0.82 | 3.93 | 0.72 | 75.78 | 0.000 |
| Characteristics of the Farm | ||||||
| Women | 19.75 | 22.43 | 39.58 | 22.52 | 10.7 | 0.002 |
| Scale | 3.44 | 3.69 | 3.78 | 3.36 | 0.12 | 0.725 |
| Generation | 1.85 | 0.66 | 2.03 | 0.84 | 0.81 | 0.372 |
| Employment | 2.34 | 0.98 | 1.21 | 1.15 | 15.44 | 0.000 |
| Yield | 109.06 | 21.50 | 109.15 | 20.03 | 0.32 | 0.664 |
| Income | 60.77 | 11.06 | 65.24 | 16.59 | 1.37 | 0.247 |
| Insurance | 0.11 | 0.32 | 0.78 | 0.42 | 44.92 | 0.000 |
| Cooperatives | 3.07 | 0.78 | 4.53 | 0.69 | 54.01 | 0.000 |
| Environmental Performance | ||||||
| Bio | 80.12 | 27.70 | 98.57 | 25.94 | 6.50 | 0.014 |
| Green_certification | 0 | 0 | 0.43 | 0.5 | 19.51 | 0.000 |
| Farmer_awareness | 1.59 | 1.25 | 2.95 | 1.19 | 16.97 | 0.000 |
| Sector_awareness | 3.04 | 1.48 | 3.86 | 1.32 | 4.69 | 0.035 |
| Water Usage Characteristics | ||||||
| Rain | 0.55 | 0.51 | 0.86 | 0.35 | 6.56 | 0.013 |
| Community | 0.59 | 0.5 | 0.85 | 0.36 | 5.13 | 0.028 |
| Analysis | 0.37 | 0.49 | 1 | 0 | 45.87 | 0.000 |
| Meter_box | 0.16 | 0.35 | 0.93 | 0.26 | 84.28 | 0.000 |
| Technician | 0.15 | 0.36 | 0.97 | 0.18 | 111 | 0.000 |
| System | 0 | 0 | 0.96 | 0.19 | 702.49 | 0.000 |
| Control | 0.07 | 0.27 | 0.68 | 0.47 | 33.45 | 0.000 |
| Innovation | 0.63 | 0.49 | 0.96 | 0.19 | 11.24 | 0.002 |
| Plan | 0.07 | 0.26 | 0.78 | 0.42 | 56.19 | 0.000 |
| Water_certification | 0 | 0 | 0.82 | 1.16 | 13.61 | 0.001 |
| Water_supplied | 5.11 | 0.24 | 4.42 | 0.38 | 128.79 | 0.000 |
| Water_saving | 3.15 | 0.91 | 4.78 | 0.63 | 60.82 | 0.000 |
| Subsidy | 0.06 | 0.27 | 0.14 | 0.36 | 0.65 | 0.423 |
© 2017 by the authors. Licensee MDPI, Basel, Switzerland. This article is an open access article distributed under the terms and conditions of the Creative Commons Attribution (CC BY) license (http://creativecommons.org/licenses/by/4.0/).
Share and Cite
MDPI and ACS Style
Piedra-Muñoz, L.; Godoy-Durán, Á.; Giagnocavo, C. How to Improve Water Usage Efficiency? Characterization of Family Farms in A Semi-Arid Area. Water 2017, 9, 785. https://doi.org/10.3390/w9100785
AMA Style
Piedra-Muñoz L, Godoy-Durán Á, Giagnocavo C. How to Improve Water Usage Efficiency? Characterization of Family Farms in A Semi-Arid Area. Water. 2017; 9(10):785. https://doi.org/10.3390/w9100785
Chicago/Turabian StylePiedra-Muñoz, Laura, Ángeles Godoy-Durán, and Cynthia Giagnocavo. 2017. "How to Improve Water Usage Efficiency? Characterization of Family Farms in A Semi-Arid Area" Water 9, no. 10: 785. https://doi.org/10.3390/w9100785
Note that from the first issue of 2016, this journal uses article numbers instead of page numbers. See further details here.