Article

Effect of Geogenic Factors on Water Quality and Its Relation to Human Health around Mount Ida, Turkey

1
Department of Civil Engineering, İzmir Institute of Technology, Izmir 35430, Turkey
2
Department of Environmental Engineering, Dokuz Eylul University, Izmir 35160, Turkey
*
Author to whom correspondence should be addressed.
Water 2017, 9(1), 66; https://doi.org/10.3390/w9010066
Submission received: 26 September 2016 / Revised: 16 January 2017 / Accepted: 18 January 2017 / Published: 21 January 2017
(This article belongs to the Special Issue Water Quality and Health)

Abstract

:
Water–rock interactions strongly influence water quality. Waters originating from highly altered zones affect human health. Mount Ida region in western Anatolia is an example for such geogenic interactions and additional anthropogenic impacts. A water quality monitoring study was held and a total of 189 samples were collected from 63 monitoring stations to characterize the quality of water resources and its relation with human health. The results indicated that waters originating from altered volcanic rocks that are mainly used for drinking purposes have low pH, high conductivity and elevated trace element levels. In addition, a number of acidic mining lakes were formed in the open pits of abandoned mine sites in the study area and pyrite oxidation in altered volcanic rocks resulted in extremely acidic, high mineral content and toxic waters that demonstrate an eminent threat for the environmental health in the area. Overall, the water quality constituents in Mount Ida region had a spatially variable pattern and were locally found to exceed the national and international standards, mainly due to geogenic alteration zones and anthropogenic intervention.

1. Introduction

The geology of an area is a significant factor in the overall quality of its water resources. The dominant geological formations typically determine the physicochemical quality characteristics of local surface and subsurface waters. Thus, geogenic factors become as important as anthropogenic factors on the overall quality of water resources. Human intervention such as mining activities frequently accelerates the negative consequences of the influence of geology on water quality. The dissolution of numerous minerals from geological formations results in spatial and temporal variations in water quality and consequently influence human and environmental health. In this regard, water–rock interactions in altered zones of geological units are now considered to be key topics influencing the quality of water resources. These interactions are mostly responsible for a variety of health consequences of local inhabitants who consume such water resources for drinking purposes. Presence of increased levels of certain elements that are potentially detrimental to human health are proven to cause major illnesses such as cancers of internal organs, Alzheimer’s disease, mesothelioma, fluorosis, thyroid goiter problems and several others [1,2,3,4,5].
Mount Ida is an area of mythological significance situated in northwestern Anatolia, Turkey that also contains rich deposits of industrial minerals and coal. It is a natural reserve area that serves as the main water supply for many residential areas. Nowadays, the area is under threat from numerous mining activities that influence the quality of surface and subsurface waters of the region.
Despite the wide range and number of studies conducted on local geological characteristics and mining activities, no study was done on the hydrogeological setting of Mount Ida and its environs. Consequently, this study is conducted to assess the influence of active tectonism and local geology on hydrogeological and hydrogeochemical characteristics of the region. In particular, water resources that originate from altered zones of volcanic formations are analyzed to determine the extent and spatial variability of mineral enrichment and overall hydrogeochemistry. Therefore, a comprehensive water quality monitoring study was conducted in Mount Ida and its environs to understand the composition of various water resources of the region and its relation with the regional geological and hydrogeological setting.

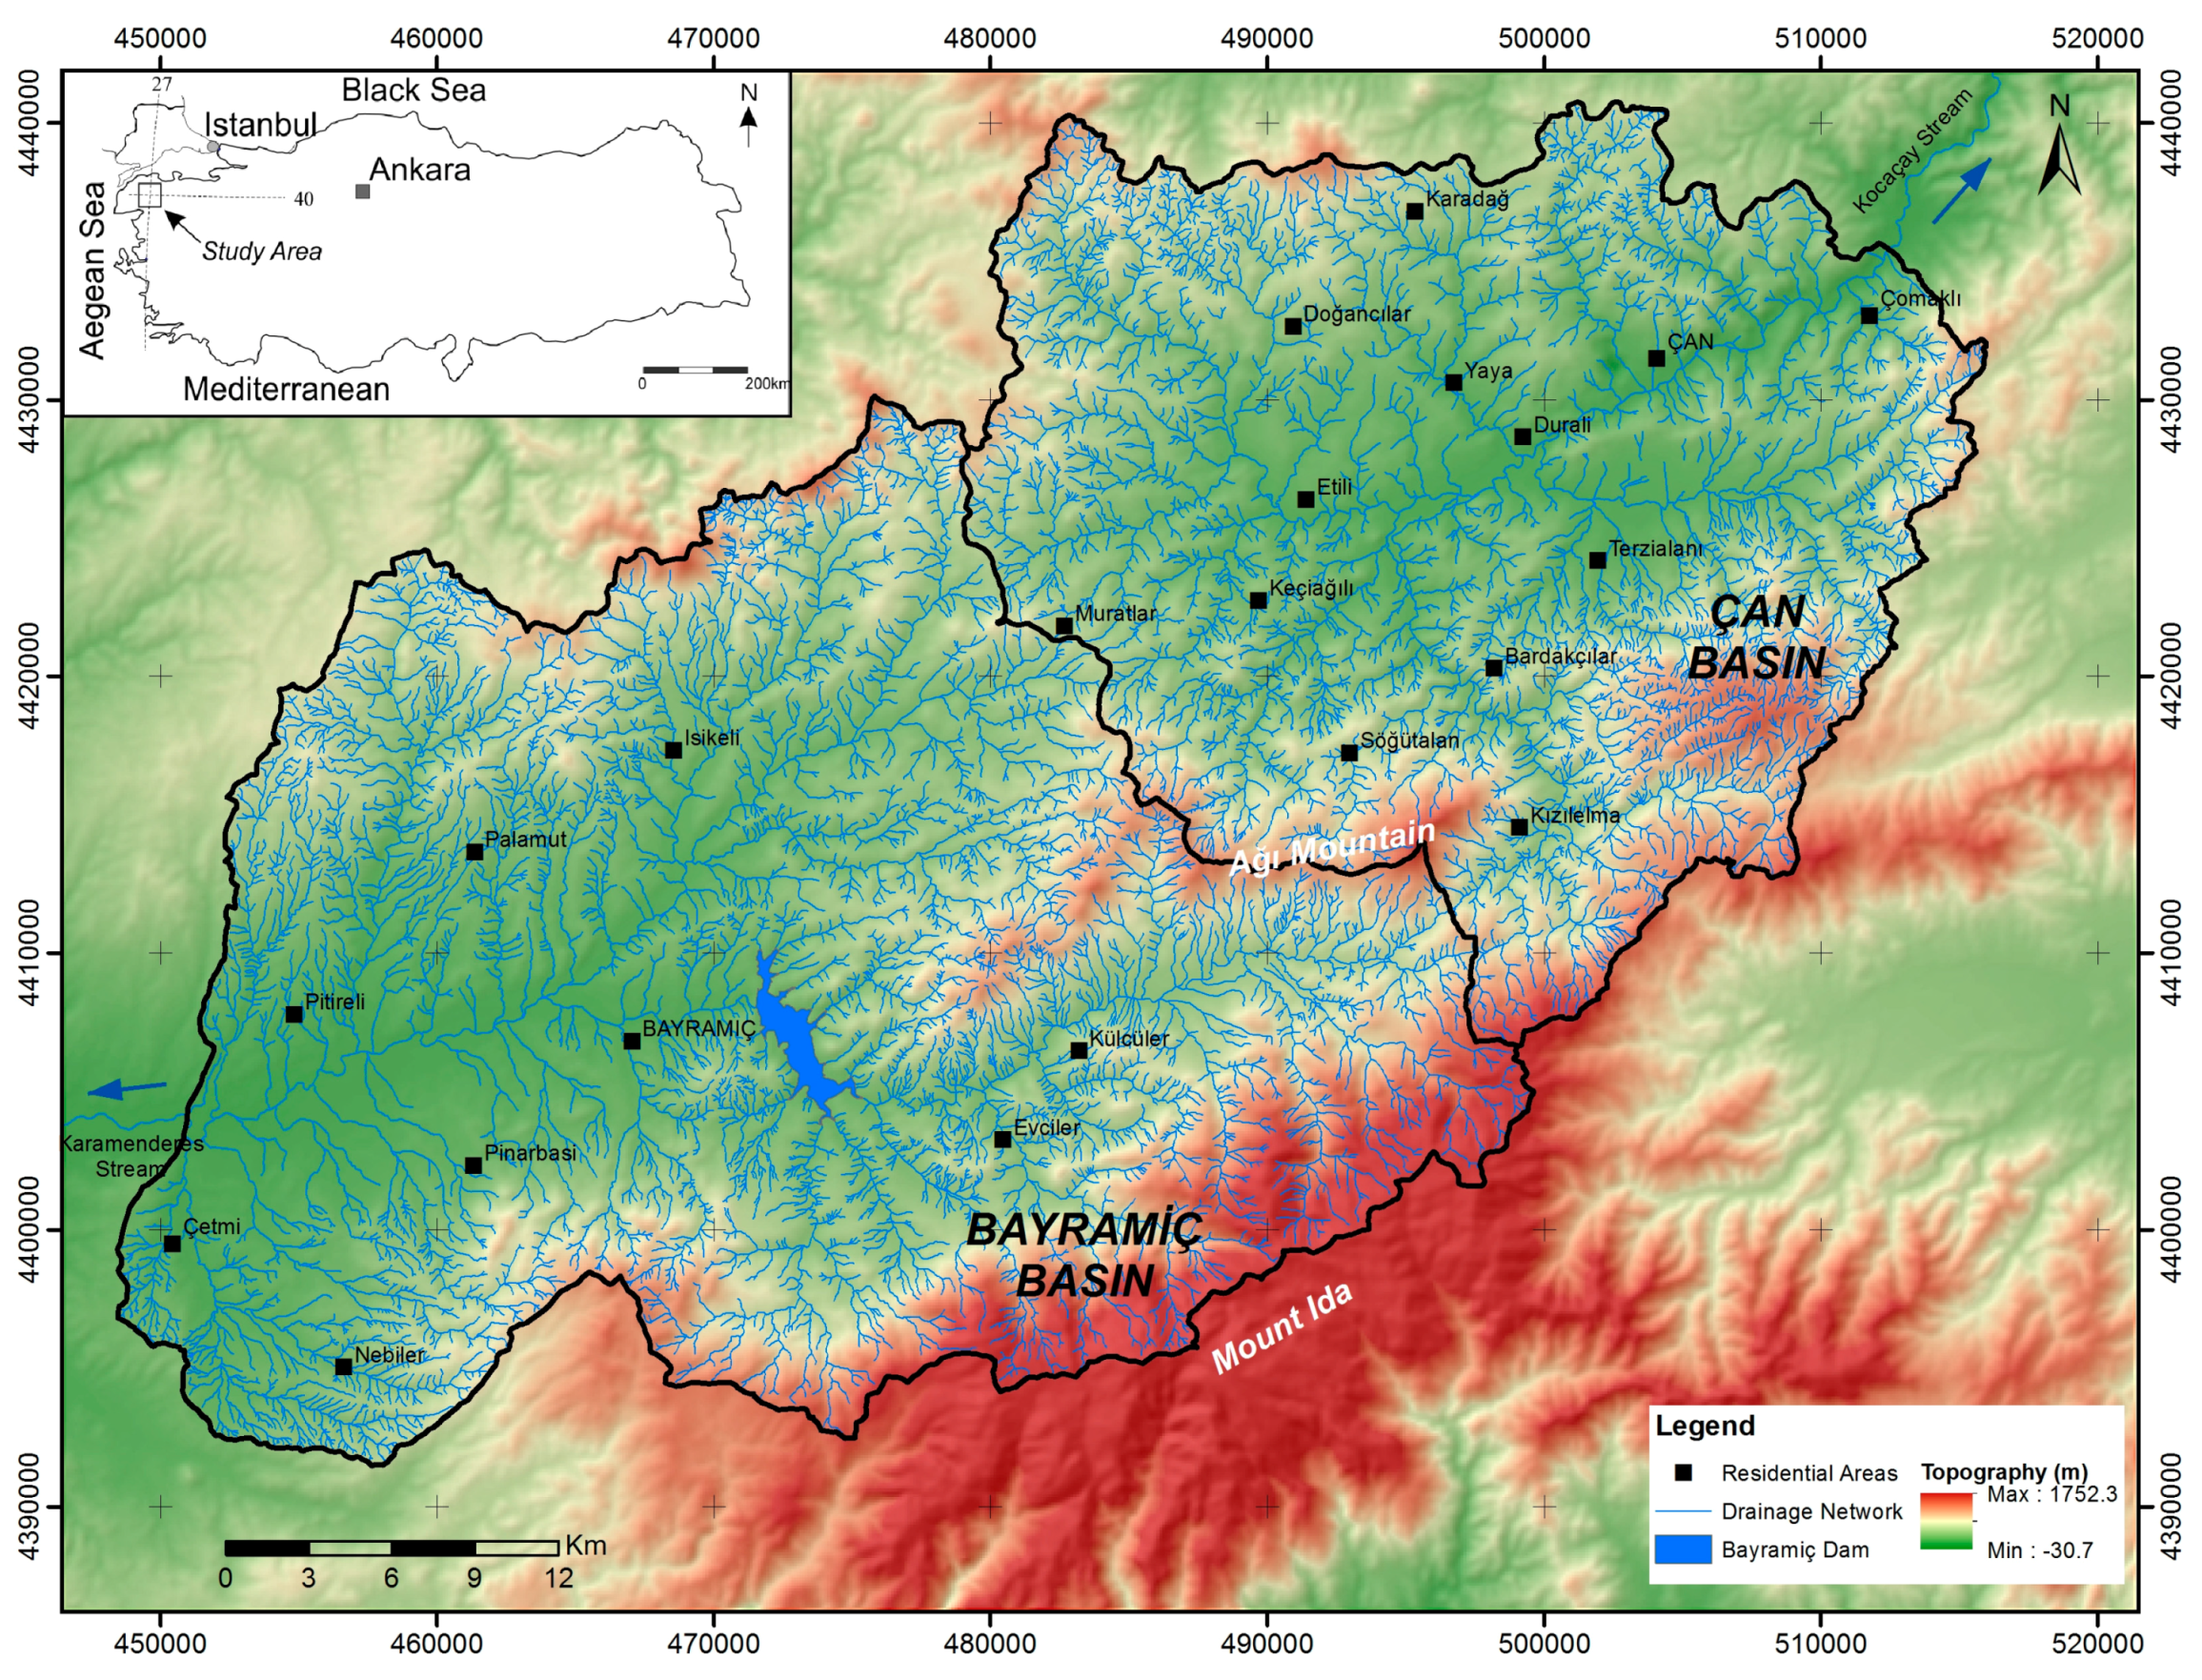
2. Characteristics of the Study Area

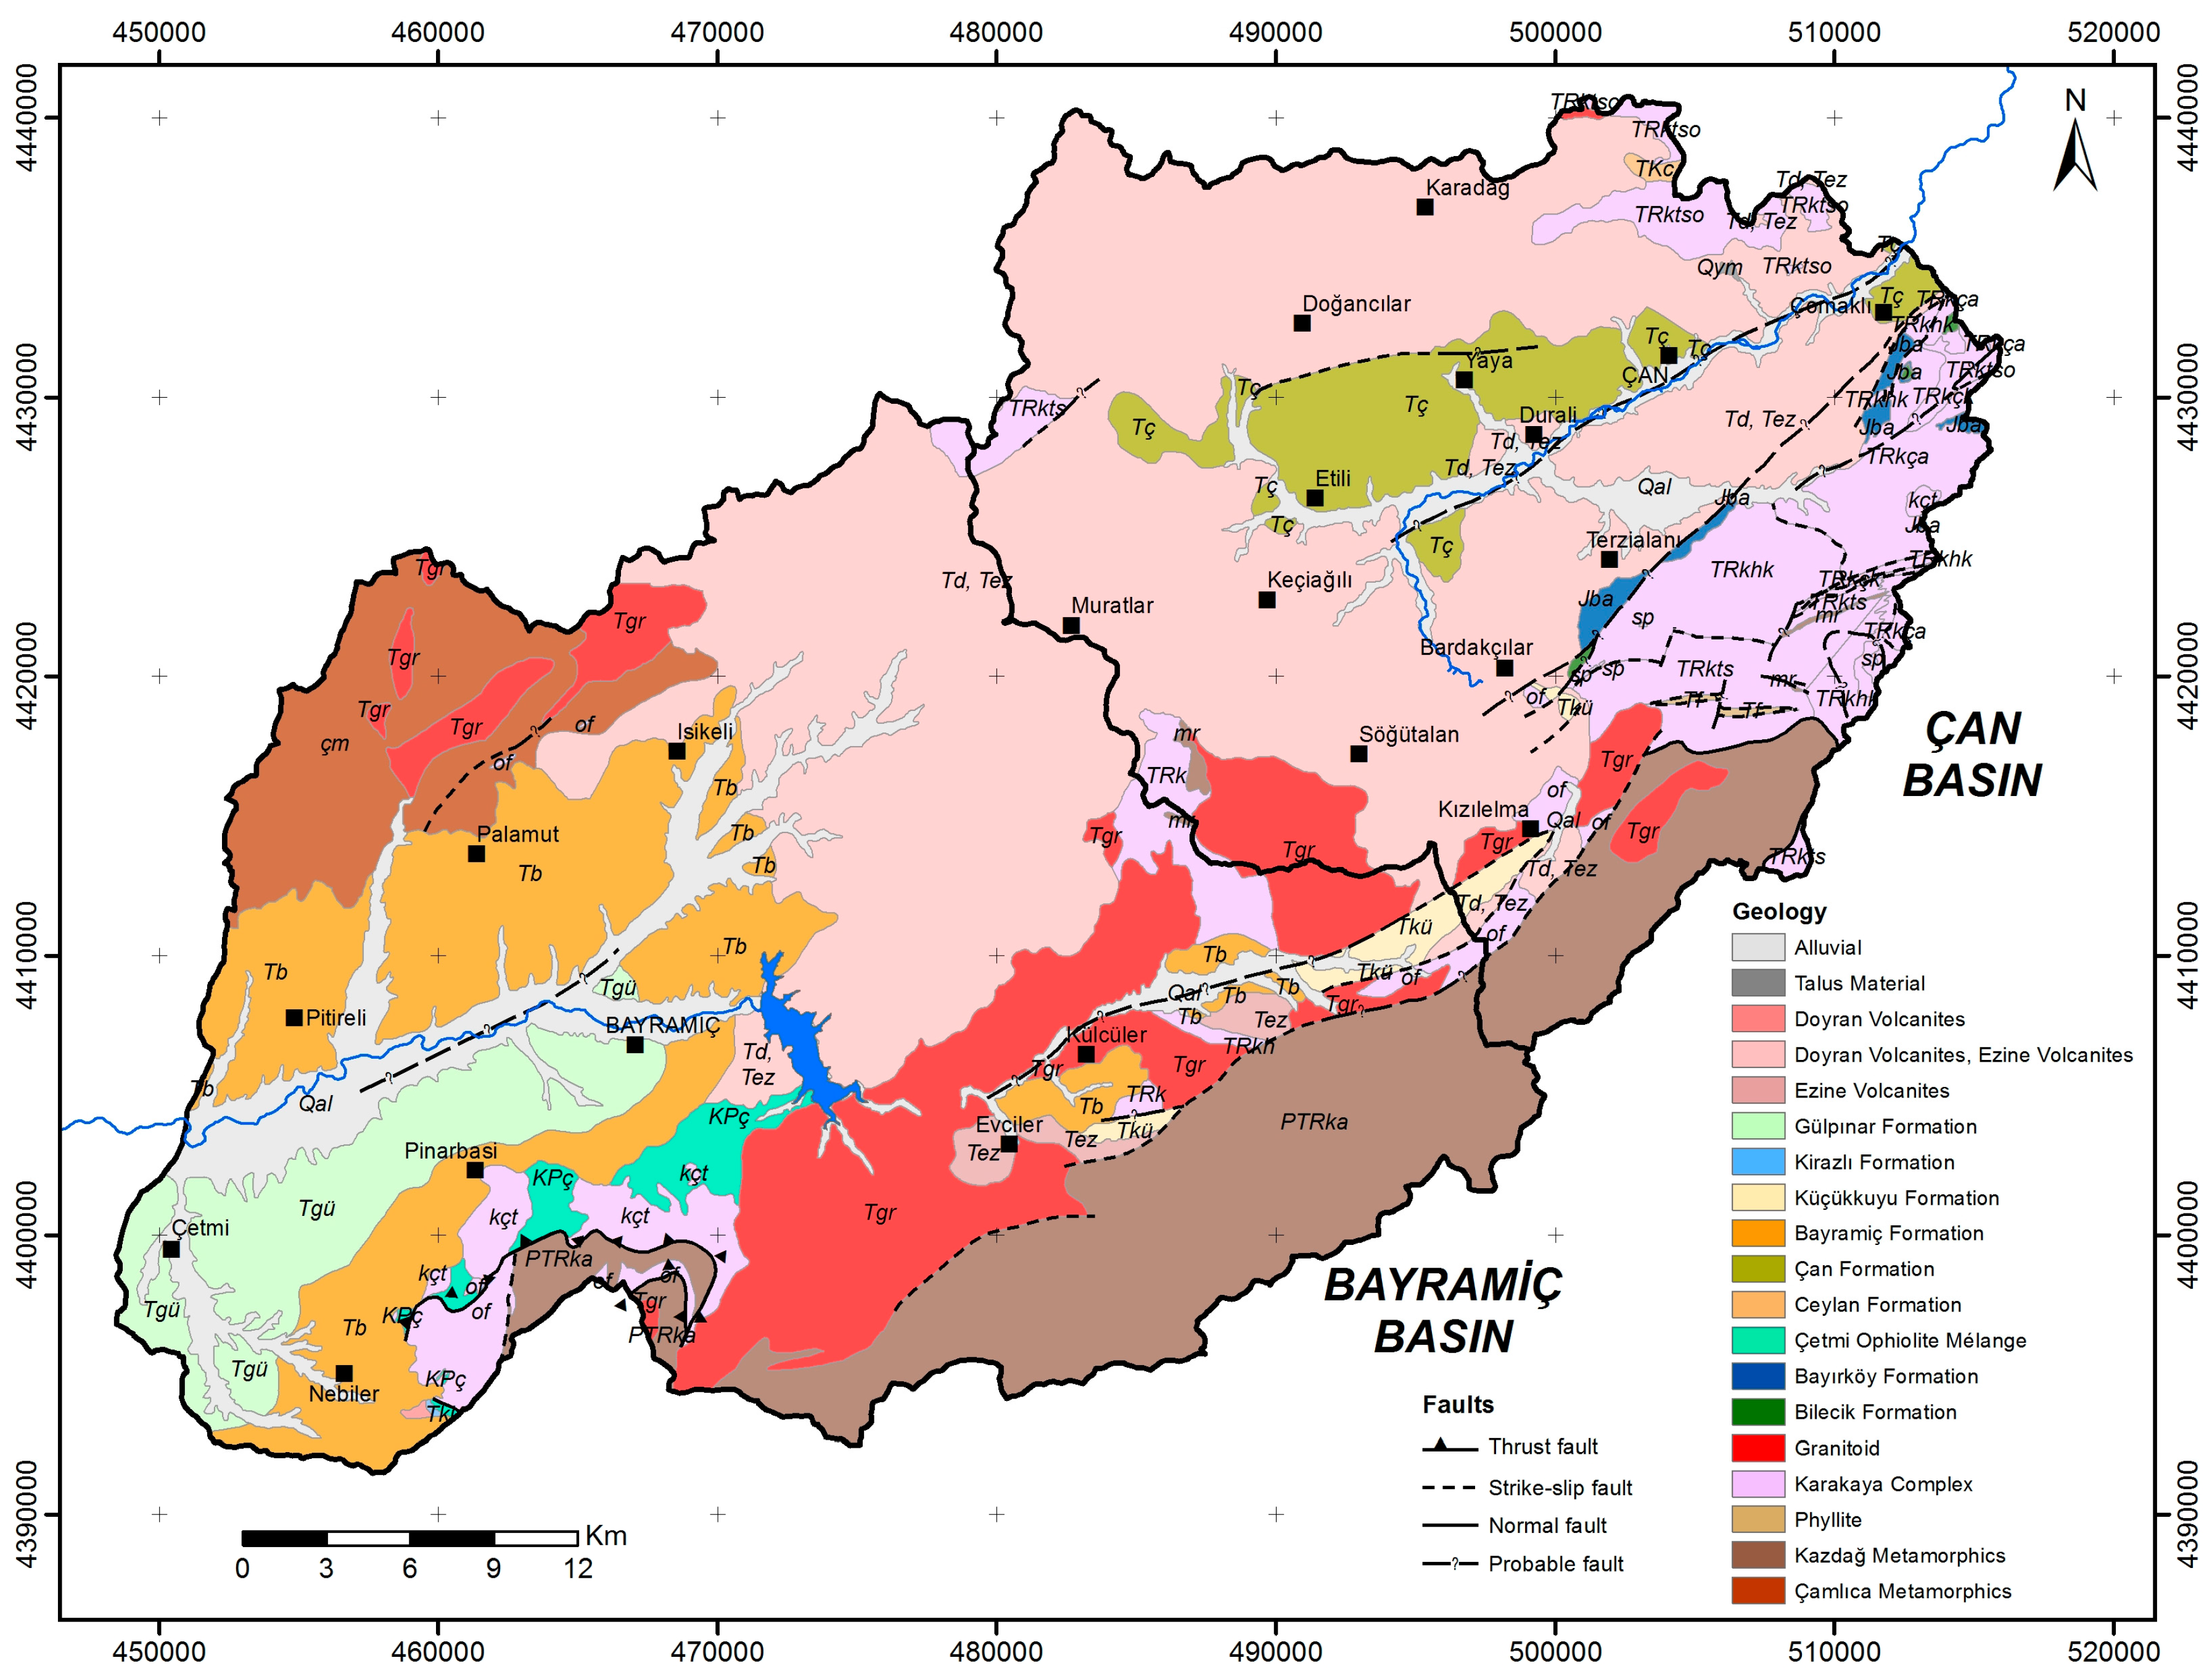
2.1. Geology of the Study Area

The geology and mining characteristics of Mount Ida and its environs have been studied by numerous researchers. Kaaden [6] and Ketin [7] have studied the general geology and active tectonics of the region. They focused on the effect of North Anatolia Fault in Biga Peninsula and the fault mechanism. Okay et al. [8,9], and Okay and Satır [10] have focused on medium-grade metamorphic rocks, which consist predominantly of quartz-micaschists with minor calc-schist, marble, quartzite and metabasite, which outcrop over a large area under the Neogene sedimentary and volcanic rocks in central Biga Peninsula in northwest Turkey. Yılmaz [11] and Yılmaz et al. [12,13] have focused on different specific regions within the project area and studied the general magmatism and young tectonics. They mentioned that young volcanism has evolved under a strong tectonic control which was linked to episodes of subduction, collision, and extension related to the northward movement of the African-Arabian plate. Houssa [14] has studied industrial minerals such as clay, coal, and others that are present in the study area. On the other hand, geothermal resources and their alterations as well as lead–zinc–copper and gold deposits of the region were determined and studied by a large group of researchers [15,16,17,18,19,20,21,22,23]. Epithermal Au–Ag deposits including high, low and intermediate-sulfidation styles, porphyry Au–Cu–Mo and base-metal skarn systems are economically considered to be the most important resource in Biga Peninsula. More recent studies are mostly conducted by private mining companies on the extent and the operational details of economic reserves such as coal, kaolinite and gold [24].
The tectonic and mining characteristics of the region have a strong influence on the surface and subsurface water quality in the study area, which is located about 60 km southeast of Çanakkale City near the town of Çan and Bayramiç on Biga Peninsula in northwestern Turkey (Figure 1). The basement rocks of Ida Mountain Region consist of Paleozoic metamorphic rocks and a mixture of Mesozoic rocks including schist and marble, which are commonly known as the Kazdağ Metamorphics. The basement rocks are overlain by Karakaya Complex, which is composed of metavolcanics, sandstones, siltstones, ophiolites, basic volcanics and limestones. Volcanic and sedimentary rock series cover these units at different parts of the study area. In particular, Doyuran and Ezine volcanic rocks, which consist of andesite, dacite, basalt, tuff and agglomerate, are dominant in the area. These rocks are highly altered and fractured due to active tectonics. Several mineral deposits including numerous industrial metals as well as some precious metals such as gold can be seen in these units. Neogene-aged sedimentary rocks, which mostly consist of fine-grained material such as sand, silt and clay, overlie volcanic rocks in the region. Moreover, these sedimentary rocks locally contain thick coal veins. All of these formations are finally covered by quaternary alluvium, which is mostly heterogeneous and contains loose sand and gravel (Figure 2).

2.2. Hydrology of the Study Area

A Mediterranean climate with mild, wet winters and hot, dry summers is predominant in the study area. The average annual precipitation in the region is 714 mm. Precipitation mostly takes place in late fall and winter in the form of rain and snow. The highest and lowest monthly average precipitation occurs in December (106.4 mm) and August (10.6 mm). Monthly average temperatures vary from 4.1 °C in January to 22.6 °C in July. The average annual temperature is 13.3 °C [24].
The study area is situated to the north of Mount Ida and is formed of two watersheds that are drained by two perennial streams, namely Kocaçay and Karamenderes streams (Figure 1). The major part of the project area is located in Kocaçay Stream, which flows in a northeasterly direction to its confluence with the Sea of Marmara. The monthly average discharge of the Kocaçay Stream varies from a minimum of 0.06 m3/s in August to a maximum of 15.2 m3/s in January [24]. The Karamenderes Stream, on the other hand, flows towards the west of Mount Ida and discharges to the Aegean Sea near the strait of Dardanelles.

2.3. Hydrogeology of the Study Area

The characteristics of saturated formations and patterns of groundwater use in Mount Ida region are influenced to a large degree by the regional geology. The lithologies present in this part of Turkey comprise a high percentage of crystalline basement rocks exemplified by the pre-Tertiary metamorphic lithologies of the Kazdağı Group and Karakaya Complex and by the later Tertiary igneous intrusive and volcanics. These rock-types tend to have very limited primary porosity and permeability, meaning that there is much more reliance on structural discontinuities (joints and faults) to obtain water. In addition, the absence of significant primary porosity tends to mean that sustainable yields are typically low. By contrast, the recent sediments that blanket the valley bottoms in this region frequently have a significant porous matrix that yields significant groundwater, especially where the alluvial sediments comprise coarse sands and gravels. In general, the main alluvial aquifers in the region supply the domestic water requirements of large residential areas and the process water requirements of industrial establishments (i.e., factories and power plants). The karstified marble and jointed volcanic units provide the domestic water requirements of small towns and villages [24].
Overall, the hydrogeology of the study area is mostly driven by the units of the associated geological formation. Five major units provide water for local domestic, industrial and irrigational uses. These units include the metamorphics, Karakaya Complex structure, volcanics, neogene sediments and alluvium formations. The metamorphic unit is characterized by the Kazdağı group that is composed of schists and marbles. These marbles have been extensively folded and fractured as a result of local tectonism, whilst subsequent solution weathering along bedding surfaces and discontinuities has resulted in karstification and the development of a multitude of springs in the area. These springs are particularly evident at higher elevations of Mount Ida to the south and southeast of the study area and have typical flow rates ranging from 1 to 100 L/s. The Karakaya Complex structure is mostly impermeable except for the local limestone units that are karstified. The water yield of this unit is typically poor with flowrates less than 1 L/s. The tertiary volcanic units generally consist of andesites, basalts, tuffs and agglomerates and are widely distributed within the study area. Although this unit is extensively jointed and fractured, its water bearing potential is low and the yields typically range between 0.01 and 2 L/s. Some of the springs that originate from this unit in Ağı Mountain region are used as the drinking water supply for 23 villages and the Çan District Center situated within the region. The Neogene unit, on the other hand, is observed in the vicinity of Etili and Çan districts to the north of the study area. This sedimentary unit that consists mainly of sand, silt and clay possess some locally elevated permeability but limited water bearing potential. The thickness of Neogene changes from 50 to 300 m in different parts of the study area. Finally, the alluvial unit is the largest and the most important aquifer in the study area. The unit is mostly observed along the river beds of Kocaçay and Karamenderes streams and has a high porosity and permeability. The wells drilled in this unit have large yields and provide the water requirements of Çan District Center (85 L/s), Çanakkale ceramic factories (80 L/s) and the coal-fired Çan Thermal Power Plant (40 L/s). There is also an extensive network of shallow hand-dug wells that have depths ranging from 3 to 12 m providing water for field irrigation and animal husbandry. The alluvial aquifer is mostly fed by recharge from rainfall and infiltration from Kocaçay stream bed [24].

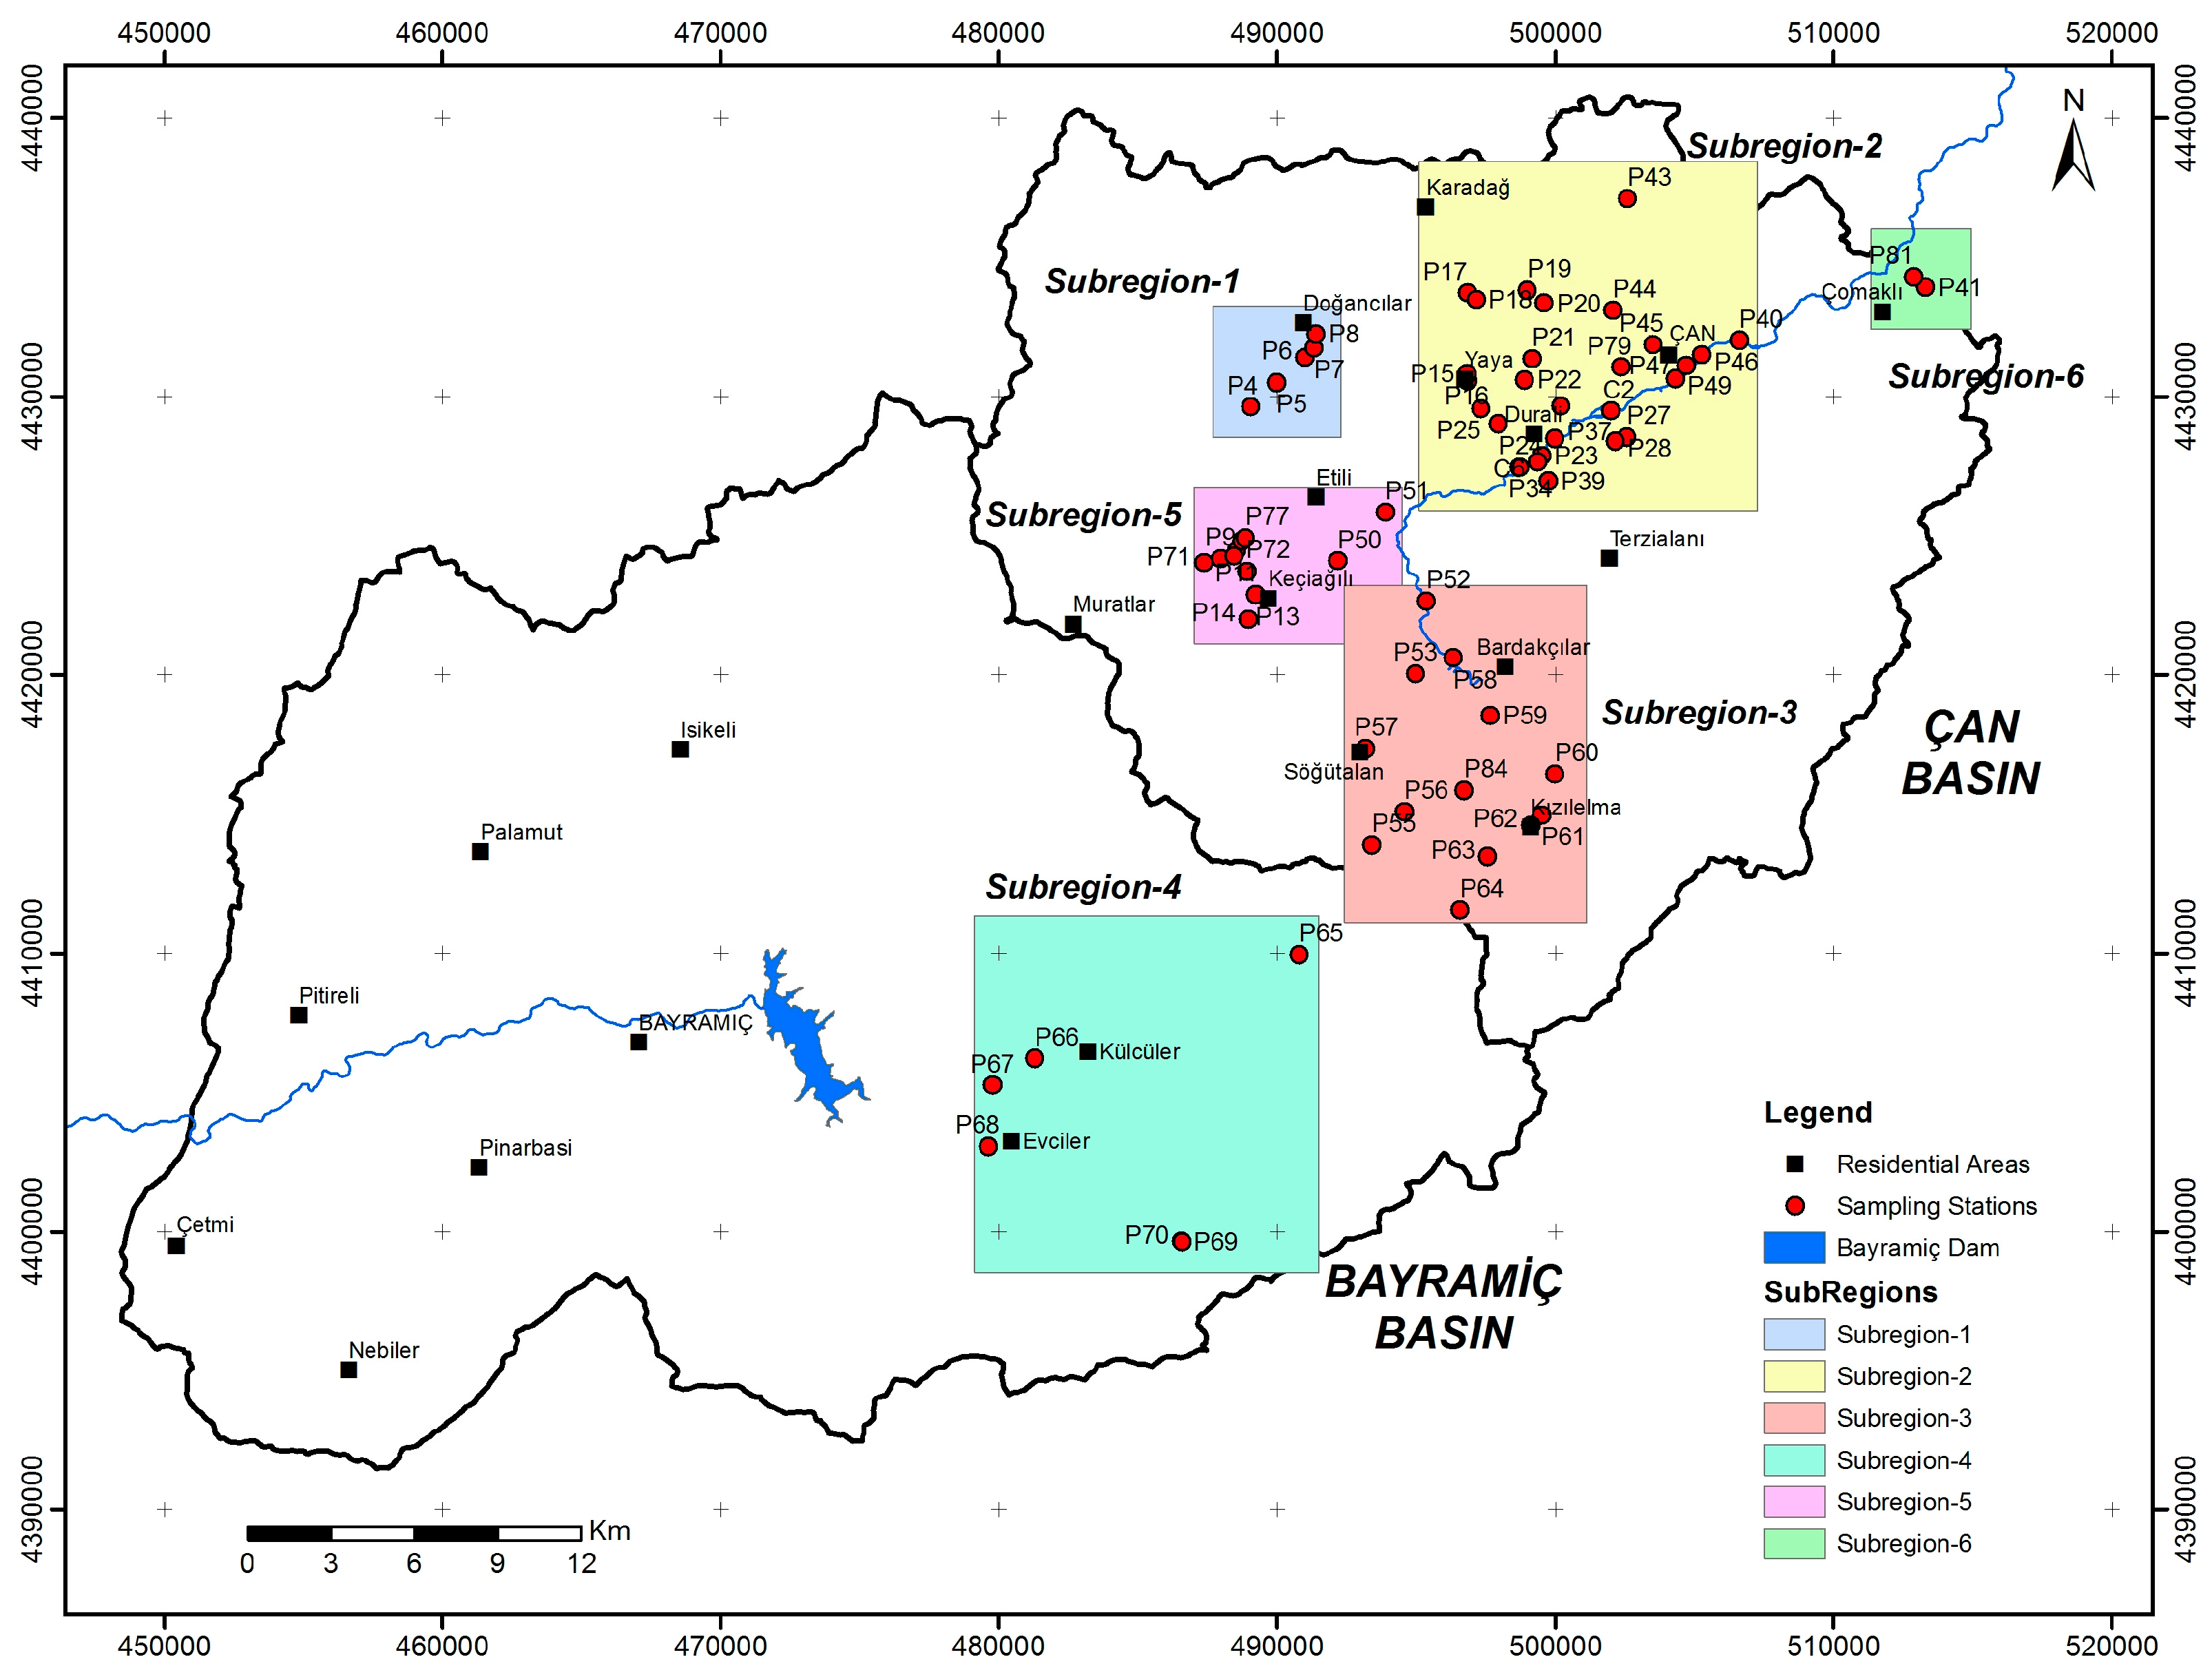
3. Materials and Methods

A comprehensive water quality monitoring study was conducted and a total of 189 samples were collected from 63 monitoring stations that characterize distinct water resources and diverse spatial locations (Figure 3). Of the total 63 sampling points, 45 of them represented groundwater resources whereas 18 of them represented surface water resources including streams and acidic lakes that were formed in abandoned mine sites. The results of this monitoring effort were then used to assess the spatial and temporal variations of hydrogeochemical properties of water resources in Mount Ida and its environs. These results were later associated with the dominant geology and hydrogeology of the region. The results were finally linked with human health status of local inhabitants.
As a part of the field studies, a sampling campaign was conducted on ground and surface water resources of the study area. Within the scope of the hydrogeochemical sampling program, water samples were obtained from six different sub-regions (Figure 3) that have distinct geological properties and are spatially isolated from each other:
(1)
Ahlatlıburun sub-region
(2)
Çan sub-region
(3)
Ağı Mountain sub-region
(4)
Evciler sub-region
(5)
Acidic mining lakes sub-region-1
(6)
Acidic mining lakes sub-region-2
The samples were collected in three different hydrological periods representing wet, dry and semi-dry seasons. All samples were analyzed for physical properties, major ions, heavy metals and trace elements through field and laboratory techniques. The physicochemical analysis for these water resources included primary field parameters (i.e., temperature, pH, and electrical conductivity), major anions and cations (i.e., sodium, potassium, calcium, magnesium, chloride, bicarbonate, and sulfate), and heavy metals and trace elements (including but not limited to aluminum, arsenic, boron, iron, manganese, nickel and zinc). Two sets of samples were collected from each monitoring station at each sampling period and about 5% blind and blank samples were included in the laboratory analysis. Although more than 60 elements were analyzed within the scope of this study, only the ones related to local geology are presented herein. For water-quality monitoring, two sets of samples were taken from each sampling point: a 1000-mL sample for major anions and cations; and a 100-mL sample for heavy metals and trace elements. Field parameters were measured in situ with a multiparameter probe. All water samples were filtered through a 0.45-micron filter and stored in polyethylene bottles at 4 °C. The analysis of major anions and cations were conducted in Hacettepe University Water Quality Laboratory using standard chromatographic and titrimetric methods. The heavy metals and trace elements were acidified to pH = 2 conditions by adding 0.5 N HNO3 to prevent complex formation of trace elements and were later analyzed by inductively coupled plasma–mass spectroscopy (ICP-MS) at Canadian ACME Laboratories.
The results of the water quality monitoring program were compiled in a spatial database and analyzed in geographical information system for spatial assessment. The primary statistics of the results were obtained and grouped according to the regions presented above. The comparison of the results with the pertinent national and international standards is also presented below.

4. Results and Discussion

The quality of surface and subsurface water resources is a function of a number of factors including but not limited to the hydrological, hydrogeological, geological, meteorological properties as well as anthropogenic stresses that are effective in the study area. In particular, water–rock interactions are among the primary factors that create local and temporal changes in the overall quality of water resources. The duration of stay within the soil–rock matrix, abundance of minerals, physicochemistry of the system including temperature, pressure and redox conditions are all influential in the general quality pattern of the water resource. The results of the water quality monitoring campaign from all three sampling periods are obtained and later averaged to reach a time-averaged quality pattern in the sampling points as shown in Table 1. These time-averaged results are further summarized and presented according to the different sub-regions as shown in Table 2. The physicochemical properties of water resources in the study are discussed in the following sections.

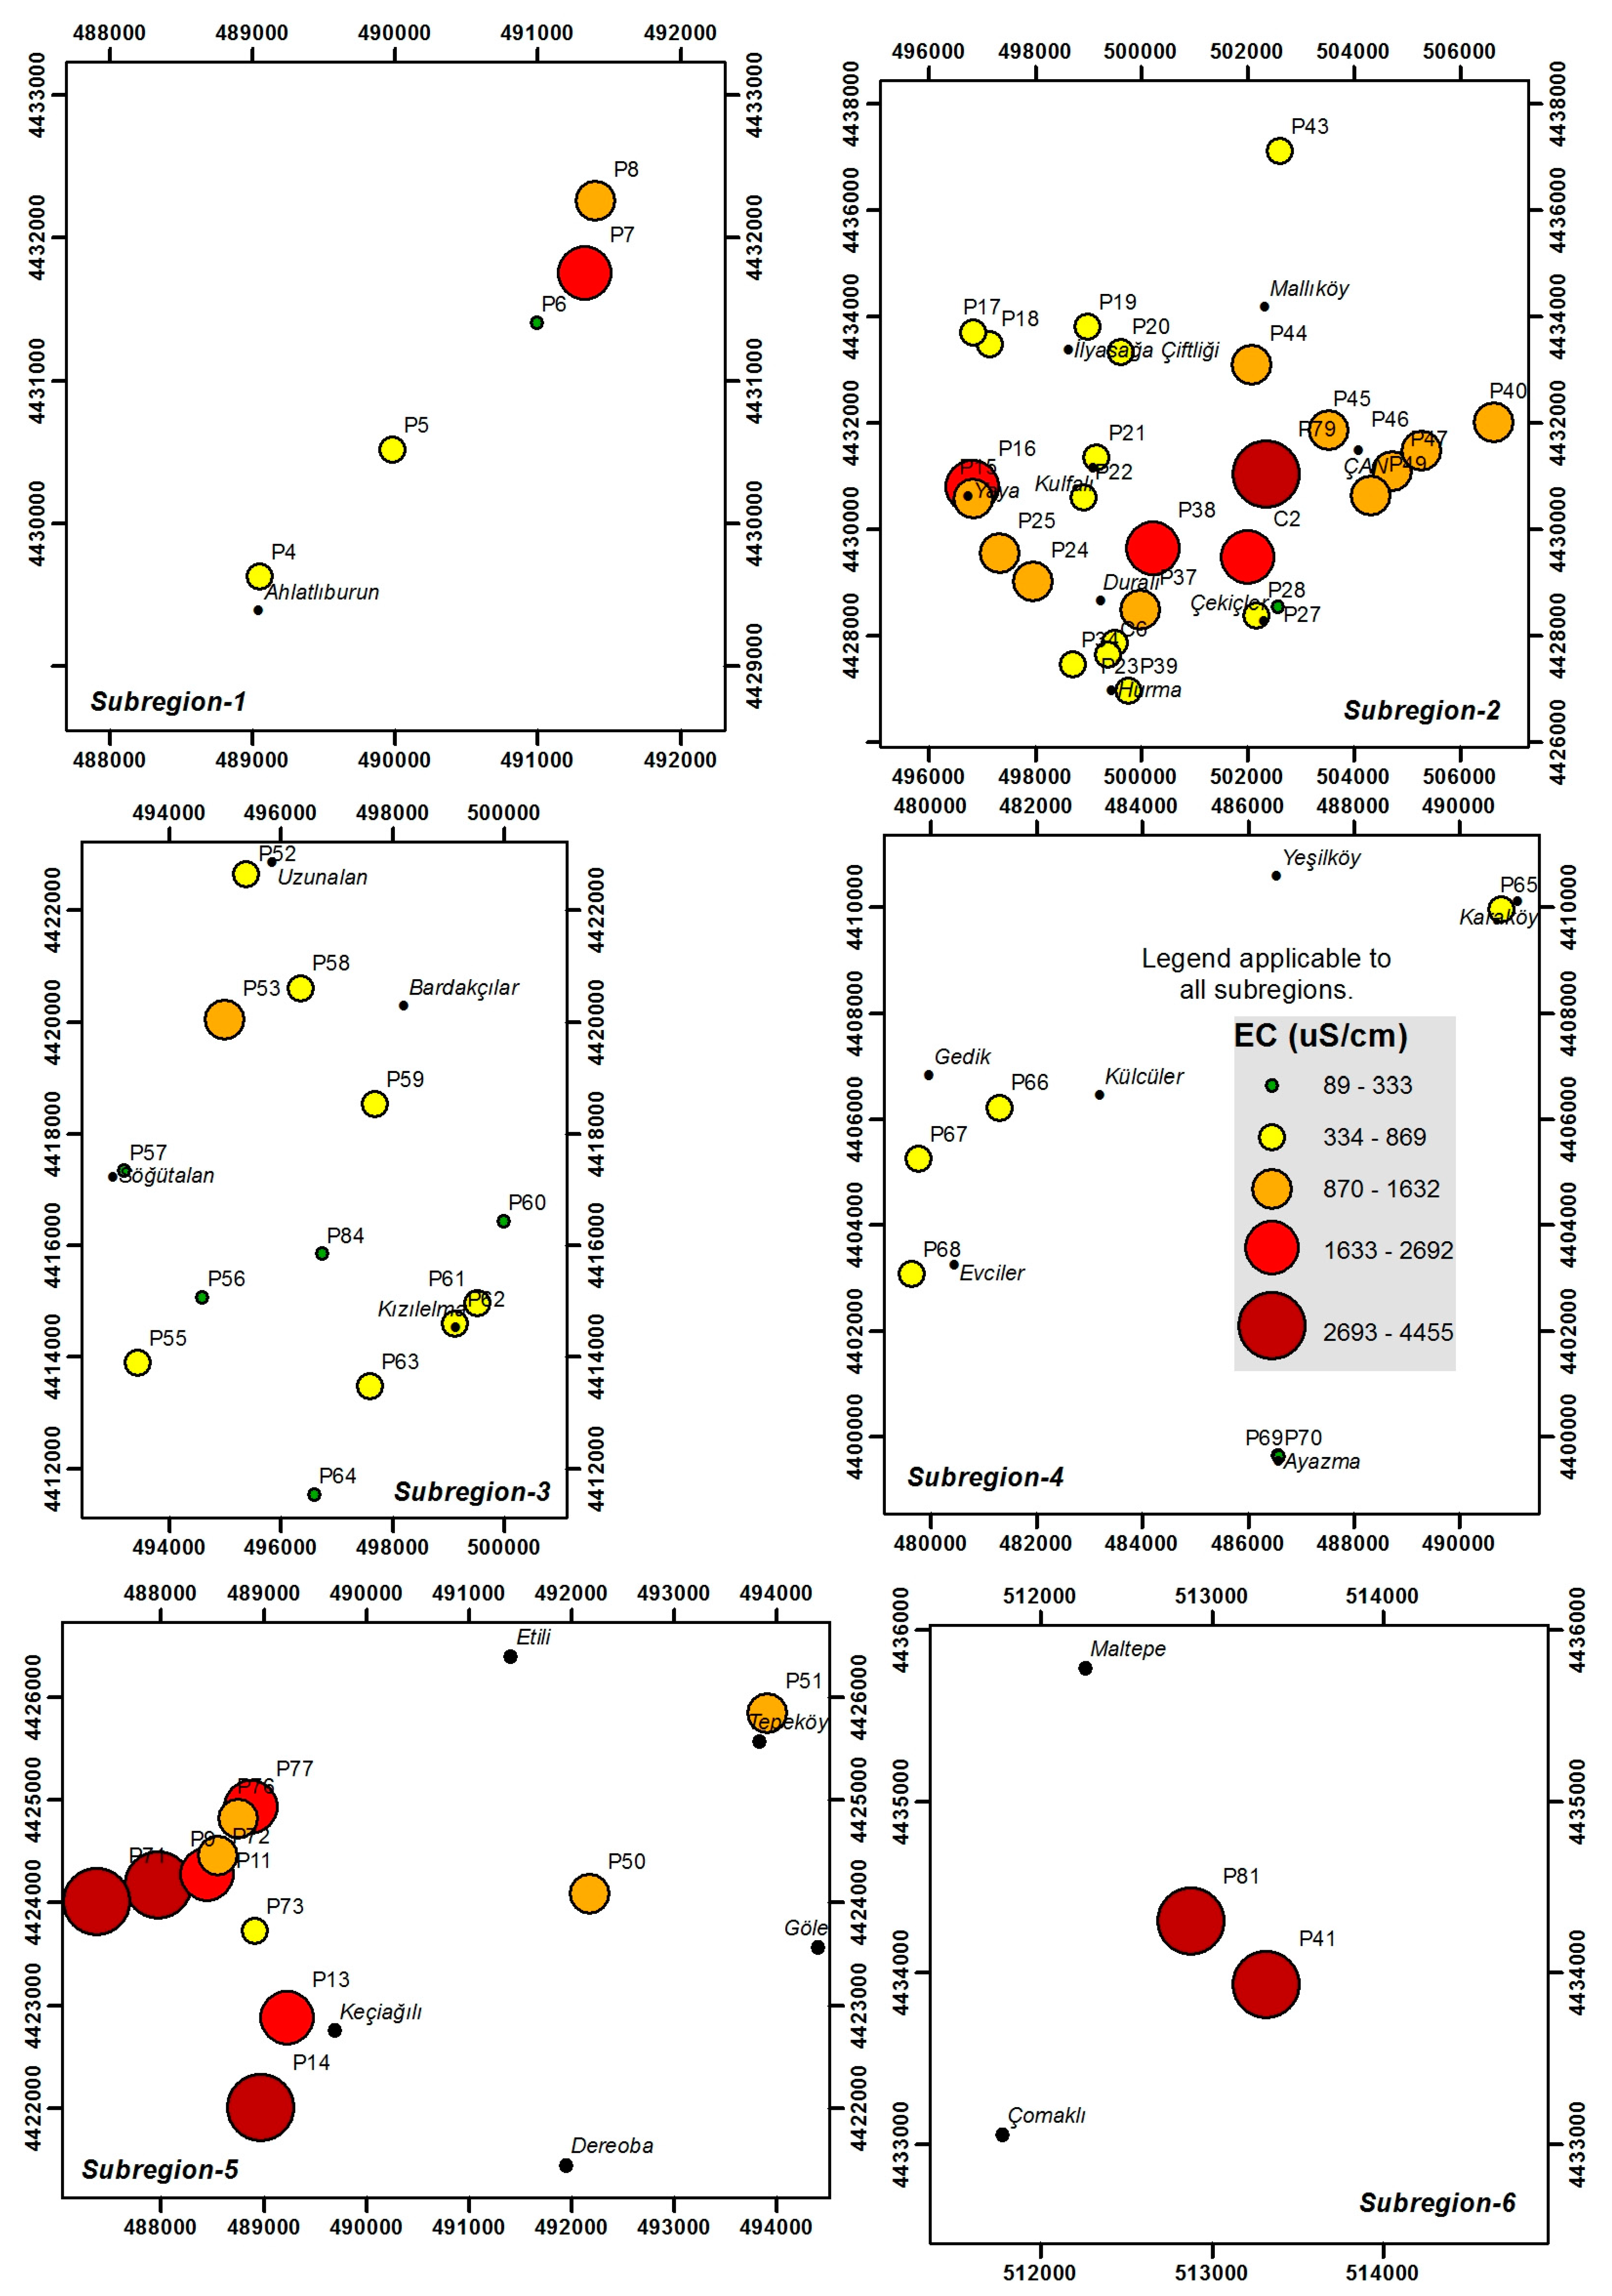
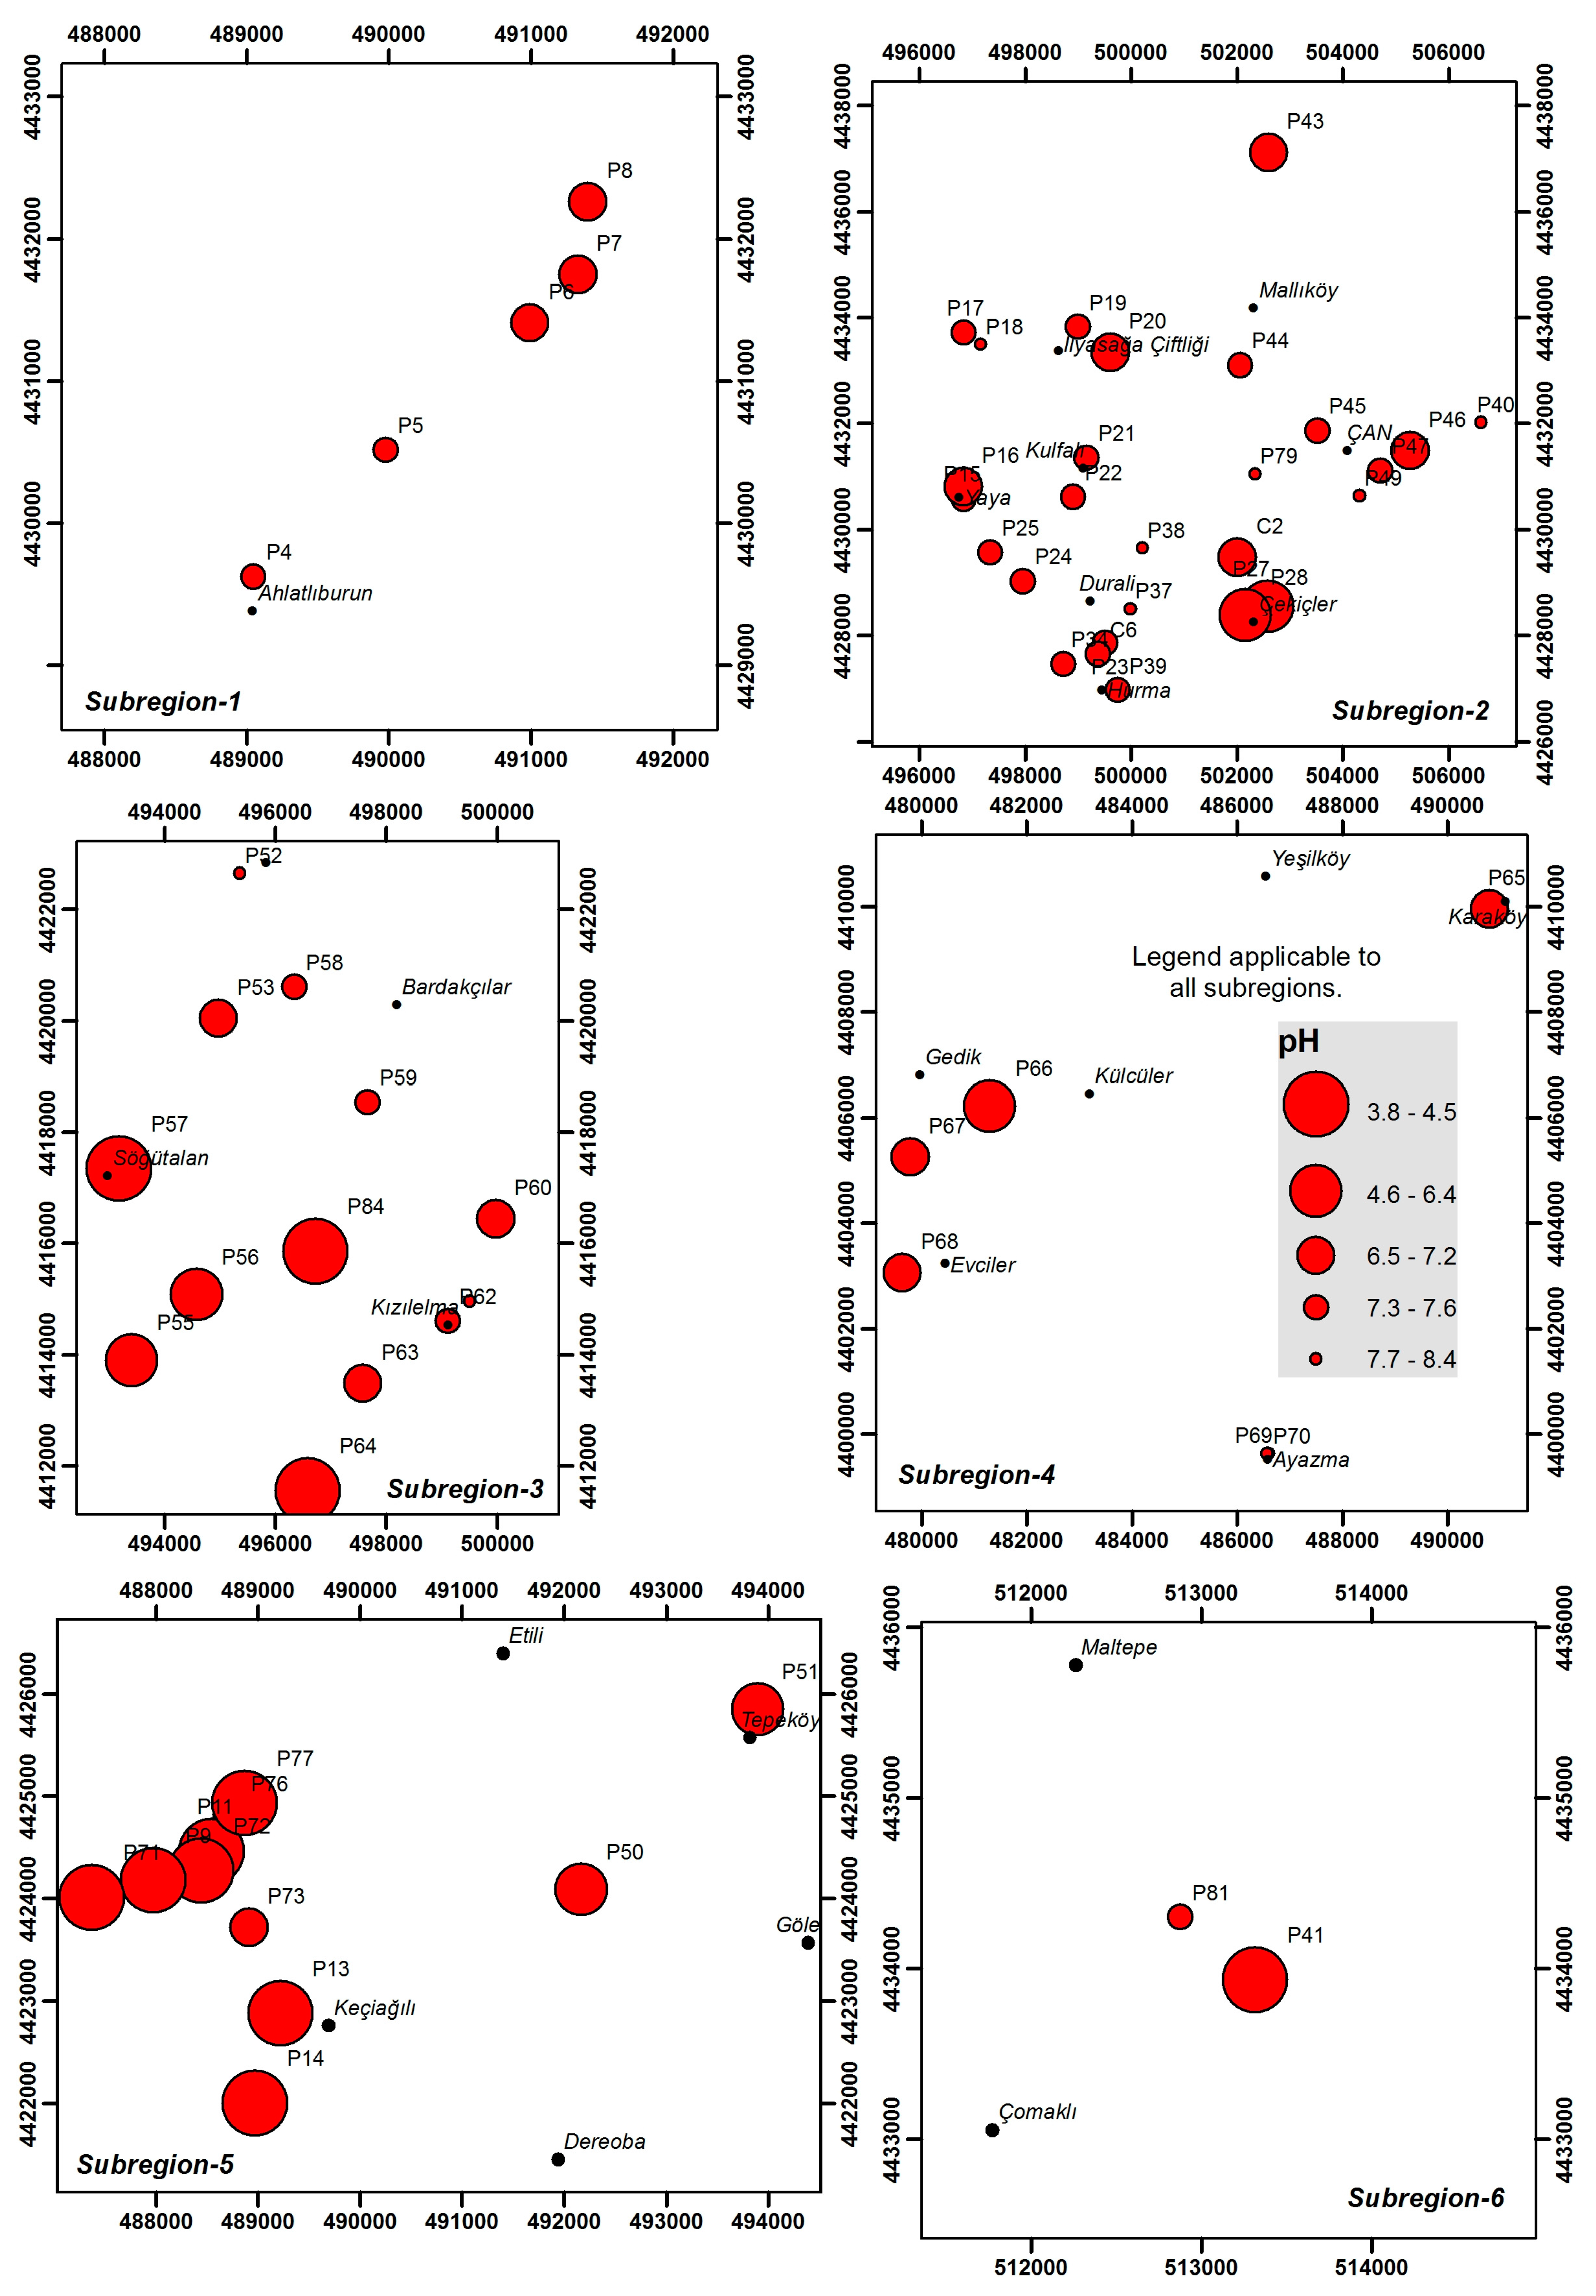
4.1. Physical Properties
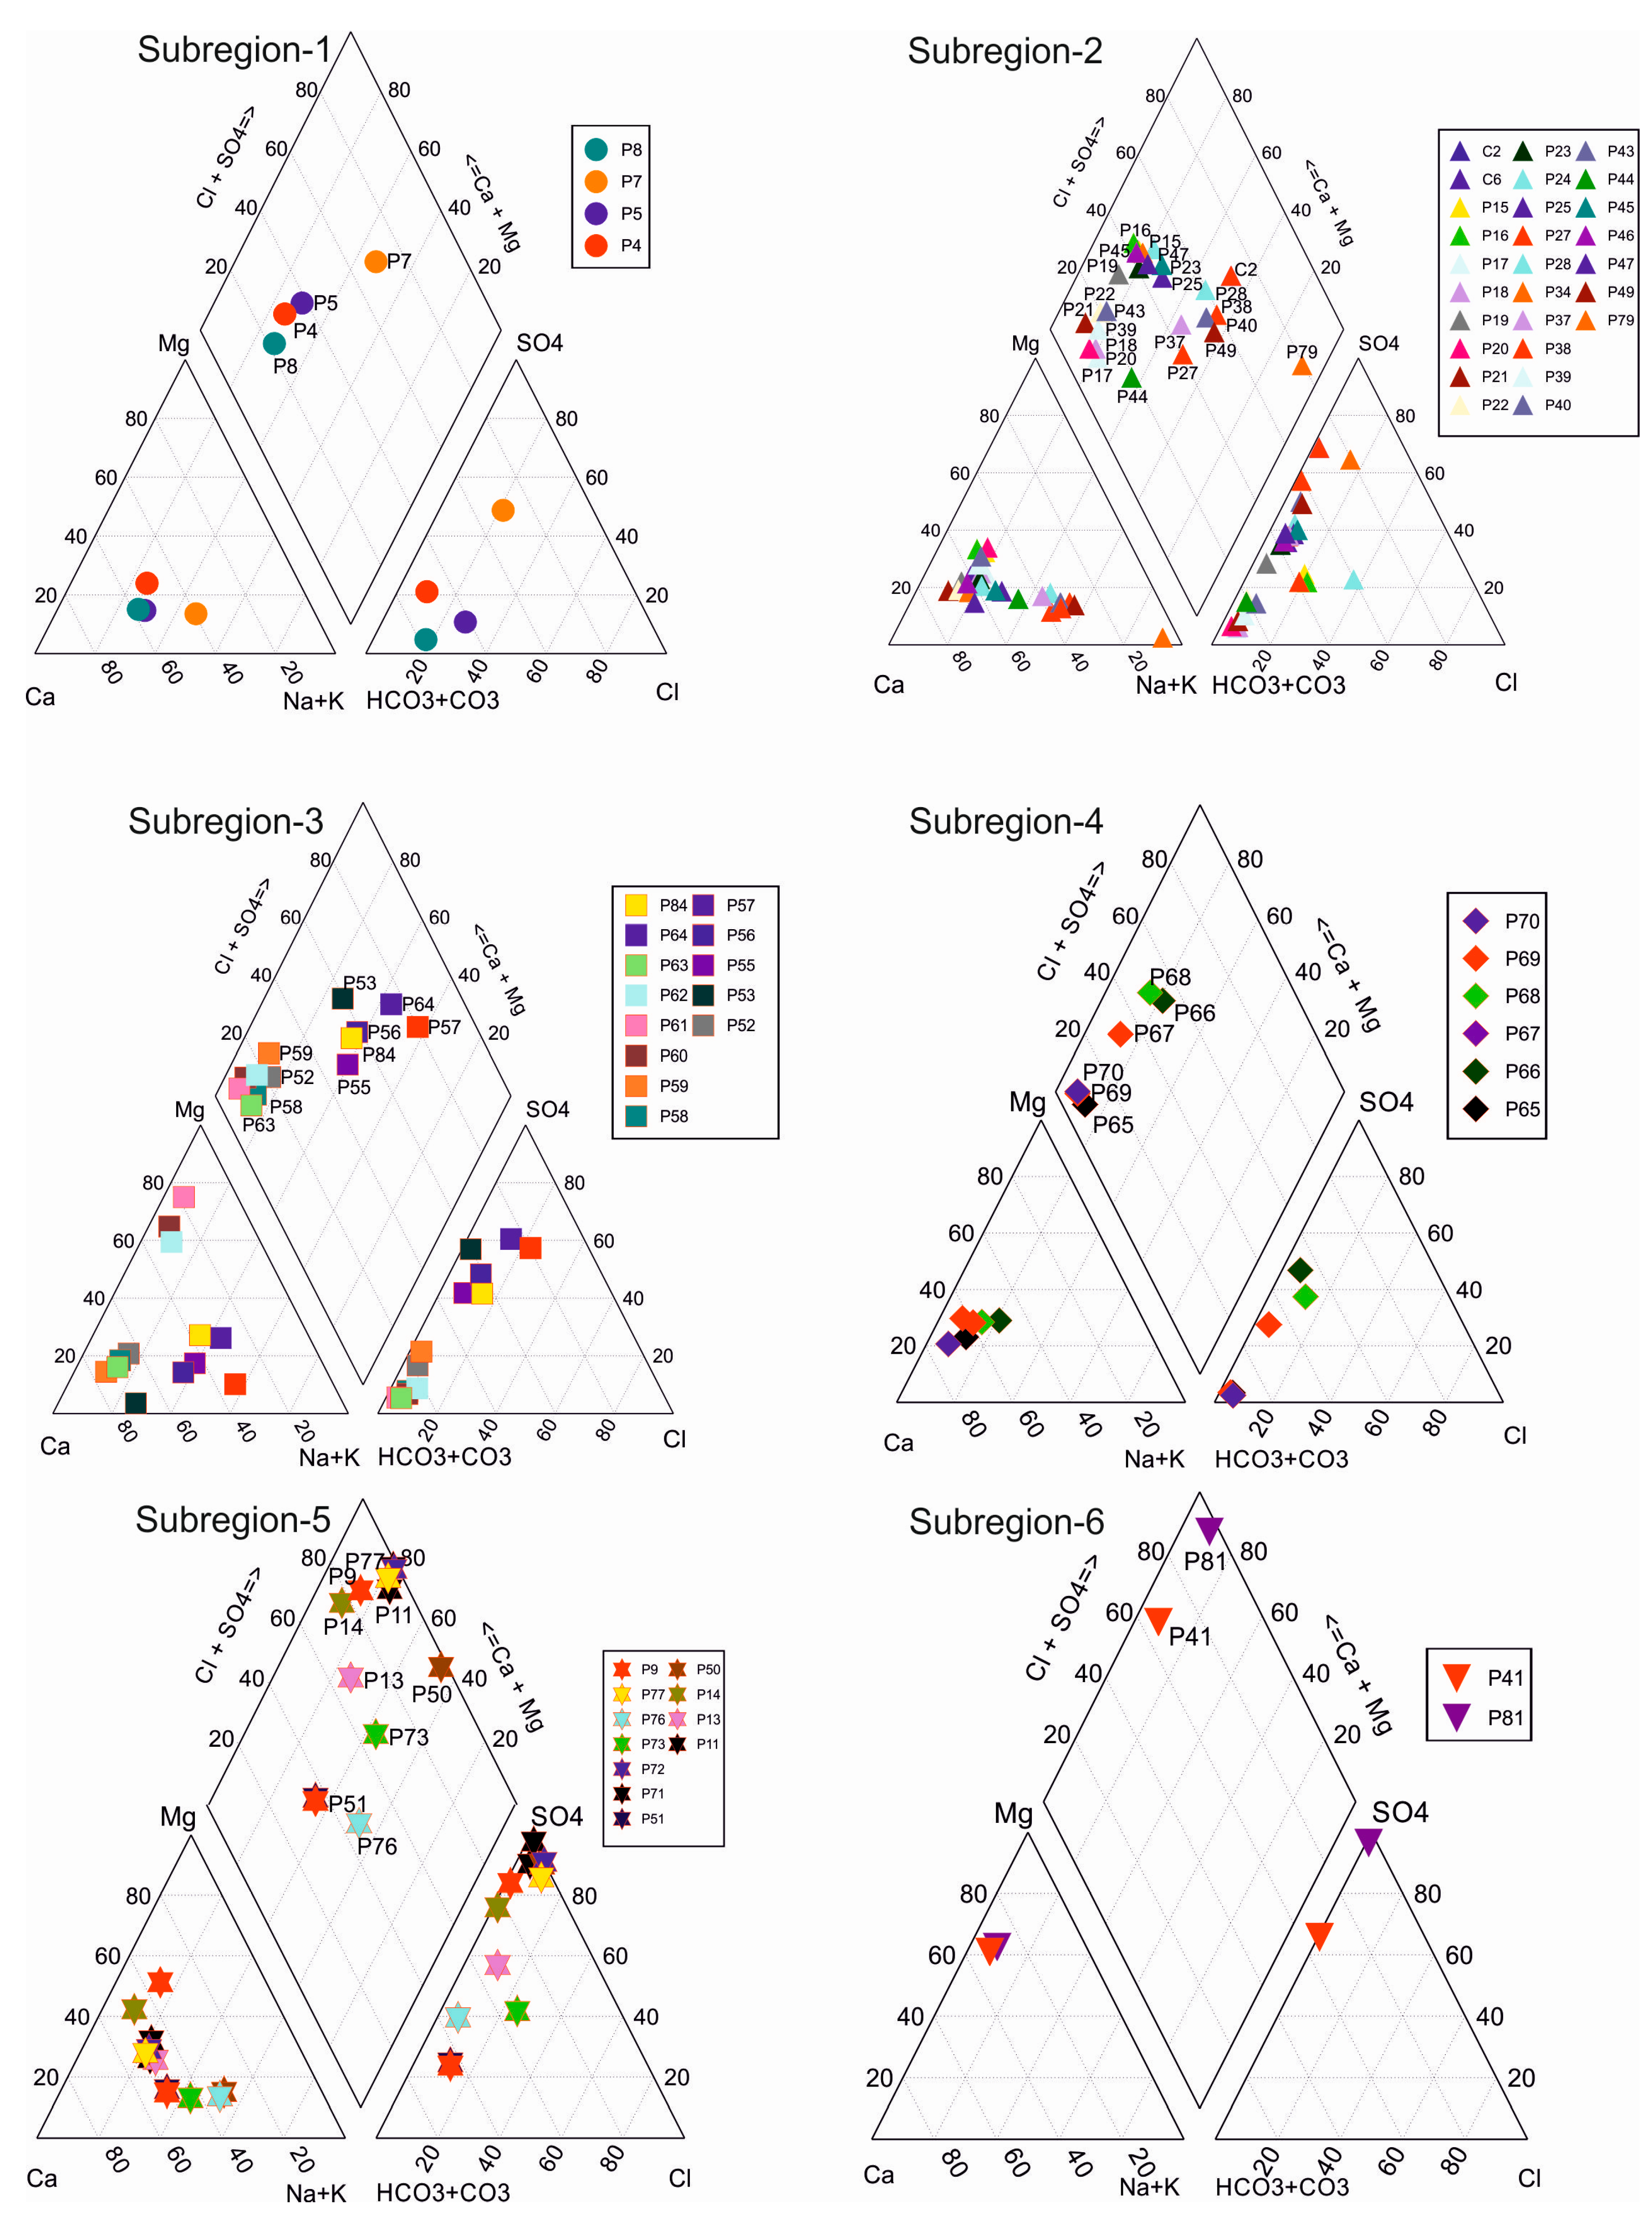
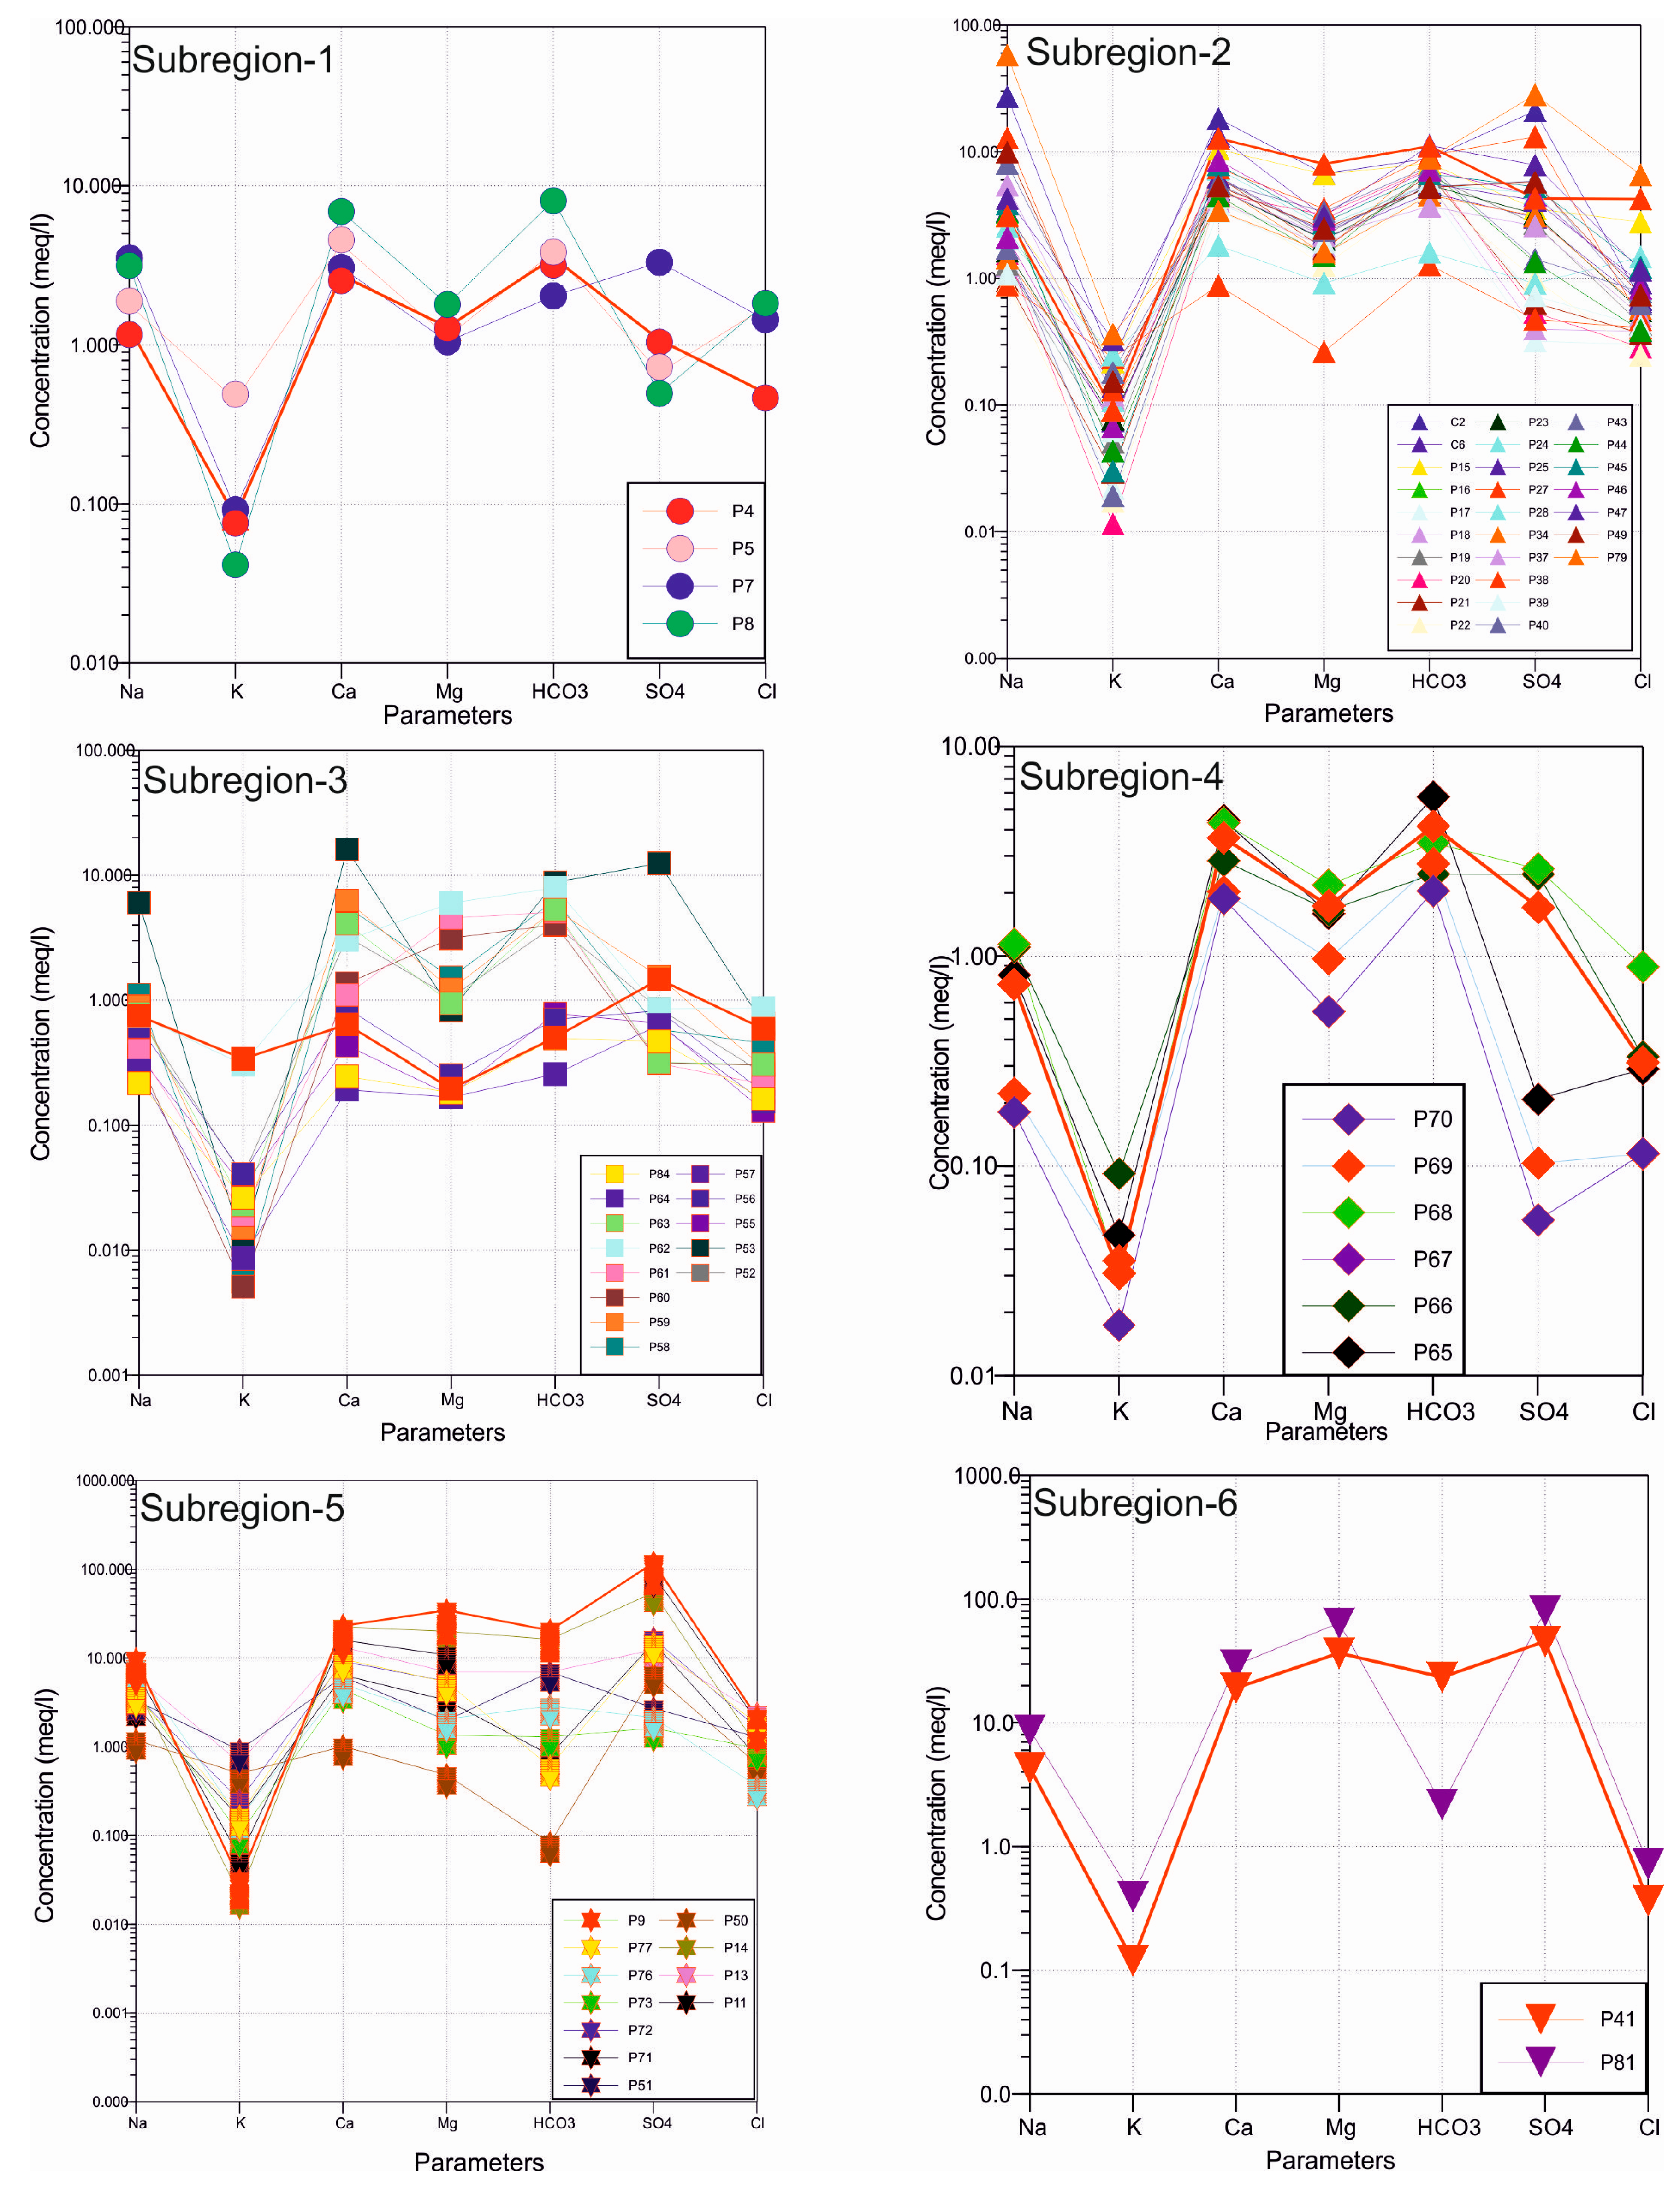
The temperature values of samples ranged from 9.9 to 24.2 °C in all sub-regions (Table 1). The distribution of the results reveal the fact that groundwater samples had an average temperature of 16.0 °C with a standard deviation of 2.3 °C whereas surface water samples had a slightly higher average temperature of 18.4 °C with a standard deviation of 3.2 °C. This finding was consistent with the general pattern of uniform groundwater temperatures when compared to the more variable surface water temperatures. The pH values of samples ranged from 2.6 to 8.4 in all sub-regions (Figure 4) with an overall average value of 6.6 that represented the slightly acidic nature of the water resources in the study area (Table 1). According to the results, the average pH values of samples located in sub-regions 5 and 6 were 4.3 and 5.2, respectively (Table 2). The majority of sampling points in these two regions were acidic mining lakes (AMLs) that were formed in the abandoned coal mine sites. The pH values measured in some of these lakes were as low as 2.6 that were associated with the oxidation of pyrite mineral present in low quality lignites [28]. The pH values of AMLs varied over a narrow range and were attributed to sulfide oxidation primarily of pyrite and low bicarbonate buffering capacity similar to their counterparts in the rest of world [29,30]. The low pH values can also be seen in samples collected from sub-region 3 (Figure 4). These values were the result of increased solubility of pyrite and other acidic minerals that occur in the altered volcanic rocks and the soils originating from these rocks [28,29]. While the type of alterations observed in these rocks were silicified, propylitic, and argillic in general, these low pH waters mostly originated from argillic and propylitic alteration zones. Despite the fact that the waters originating from this region serve the domestic water requirements of 23 local villages in the area, the pH of these waters were beyond the accepted minimum threshold values depicted in national and international quality standards for drinking water (Table 1).
The electrical conductivity (EC) values of samples ranged from 89 to 7040 μS/cm in all sub-regions as shown in Figure 5. The EC values of samples collected from the volcanic and granitic regions located in southern parts of the study area were typically below 500 μS/cm. The samples from the alluvial aquifer and samples from the Kocaçay stream had relatively higher EC values. Despite the fact that these were short-circulated waters that were annually recharged from precipitation and infiltration from local creeks, the anthropogenic influence (i.e., mining wastes and domestic wastewater discharges to drainage network) increased their EC values. The EC values measured in acidic mine lakes, on the other hand, were the highest in the study area and reached up to 7000 μS/cm in sub-region 5 (Table 2). The average EC values of samples located in acidic lake sub-regions 5 and 6 were 2418 and 4105 μS/cm, respectively (Figure 5). These values characterized the high conductivity nature of acidic lakes [28,31,32].
Both the pH and the EC values of samples revealed the fact that the water quality in the study area was under the influence of geogenic and anthropogenic factors. Decommissioned mining activities in the area were the primary source of water pollution. In this regard, abandoned mine sites were quickly transformed into acidic lakes and the local geology favored this transformation. The average pH values in these mining lake regions (Regions 5 and 6) were mostly below 3, and the corresponding EC values were typically above 3000 μS/cm, representing beyond-normal mineral dissolution.

4.2. Major Ions

The major ions of analysis included the primary cations (sodium, calcium, magnesium and potassium) and anions (sulfate, chloride, fluoride and bicarbonate) that are commonly found in surface and subsurface waters of the study area. The relative levels of these ions were associated with the geogenic and anthropogenic factors that were influential on the quality of these waters. The sodium values of samples ranged from 4.2 to 1333.2 mg/L with an overall average of 94.9 mg/L in all sub-regions (Table 1). Sodium concentrations were fairly high in sub-region 2 where human intervention was at this peak with heavy industries and mining activities. Similarly, sodium levels in sub-regions 5 and 6 were also high, which was consistent with elevated mineral dissolution in acidic waters. The calcium values also demonstrated a pattern similar to sodium and were relatively higher in sub-regions 2, 5 and 6. The calcium values were in the range 3.9–587.0 mg/L and had an average of 132.6 mg/L (Table 1). The highest calcium levels were observed in sub-region 6 and the lowest values were detected in sub-region 4 (Table 2). Among these two regions, sub-region 6 was the acidic mining lakes with high mineral dissolution from local geological formations and the sub-region 4 was a forested, high-elevation mountainous region at the outskirts of Mount Ida where anthropogenic impact was minimum. The magnesium values changed between 2.1 and 778.6 mg/L in all sub-regions (Table 1). The average and standard deviation of magnesium was 57.8 and 120.7 mg/L, respectively. The high variation in magnesium values was associated with the high measurements in the acidic lakes. Magnesium levels were also found to be high in sub-regions 5 and 6 with average values of 101.8 and 611.6 mg/L, respectively. On the other hand, sub-regions 1 and 4 had the lowest average magnesium levels where sampling stations were situated at higher elevation and less anthropogenic influence (Table 2). The potassium values ranged between 0.2 and 35.6 mg/L with an average of 5.3 mg/L (Table 1). Highest average values were measured in sub-regions 1, 5 and 6 (Table 2). While regions 5 and 6 were mostly associated with enhanced mineral dissolution due to low pH values, the sub-region 1 was a rural area with extensive agriculture. Thus, high potassium in this region was most likely to be associated with potassium containing fertilizers applied to the fields.
When the anions are concerned, sulfate and bicarbonate were found to be the dominant anions in the study. While sulfate was predominantly high in acidic mining lakes as an end product of pyrite oxidation, bicarbonate was mostly dominant in samples collected from alluvial and karstic aquifers. The sulfate values of samples have a range of 2.7–5669.3 mg/L with an overall average of 473.0 mg/L in all sub-regions (Table 1). The fairly high standard deviation in sulfate values (1039.6 mg/L) was associated with approximately a two orders of magnitude difference in sulfate levels measured in acidic mining lake samples and the remaining fairly neutral samples. In this regard, the average sulfate levels in sub-regions 5 and 6 were 1439.6 and 3024.2 mg/L, respectively (Table 2). On the opposite extreme, the average sulfate level in sub-region 4 was 57.1 mg/L where geogenic and anthropogenic impact was minimum. The bicarbonate levels in all samples ranged from below detection level (b.d.l.) to 1425.0 mg/L with an overall average of 329.5 mg/L (Table 1). Although the level of alkalinity was supposed to be zero at a completely formed acidic lake, some samples in acidic mining lakes sub-regions 5 and 6 had bicarbonate alkalinity values higher than zero, representing external influence on the lake (i.e., domestic waste discharge or basic fly-ash addition to neutralize the lake waters). The chloride concentrations, on the other hand, ranged from 4.1 to 232.4 mg/L with an overall average of 32.0 mg/L (Table 1). Highest levels were measured in sub-region 5 due to mineral dissolution from chlorine containing rocks (Table 2). On the opposite extreme, the fluoride levels in the region were fairly low and ranged between 0.03 and 3.7 mg/L with an overall average of 0.56 mg/L.
The results reveal that most of the drinking water for the rural communities comes from the outcropping volcanic rocks in Ağı Mountain sub-region. They demonstrate typical characteristics of water resources, which originate from highly fractured volcanic formations where water seeps through cracks and faults and surface out from lower elevations. On the basis of major ion chemistry, the Piper and Schoeller diagrams of the study area are drawn and shown in Figure 6 and Figure 7. These plots are used to understand the processes affecting the groundwater of Mount Ida Region. According to the Piper diagram, water samples demonstrated distinct characteristics based on local geology. The majority of surface water resources excluding the acidic mining lakes were typically of Ca-HCO3 type (Figure 6). However, the Kocaçay stream that flows from Mount Ida towards the Sea of Marmara was found to be enriched with other ions such as sulfate while passing through the highly populated and industrialized Çan region. In particular, the drainage waters of the mine pits included elevated levels of sulfate ions that were strongly related to the high sulfur content of the local lignites.
The acidic lakes of the study area were found to be of Mg-SO4 type, which was associated with the sulfur in pyrite and magnesium in clay minerals that were commonly seen in local lignites and volcanic formations. The waters originating from the Ağı Mountain sub-region mainly came from the altered volcanic rocks and were typically of Na-SO4 type. On the other hand, unaltered volcanic rocks such as basalts and agglomerates were typically Ca-Na-HCO3. Similarly, a significant portion of spring waters on the Evciler sub-region at the outskirts of Mount Ida was of Ca-HCO3 type that mostly originated from marble, serpentine and granite formations (Figure 6).
The semi-logarithmic Schoeller diagram, on the other hand, is a suitable indicator for determining waters of similar origins that have the same reservoir and recharge from the same area. The diagram revealed that the waters of the study area were enriched with different ions in different locations (Figure 7). Accordingly, the samples can be classified into three main groups. The first group contained the samples collected from the Acidic Mining Lakes sub-regions and the contaminated surface waters in the vicinity of Çan district center. These samples were rich in magnesium, sodium and sulfate ions. The second group contained the samples collected from Evciler sub-region at the outskirts of Mount Ida, which were rich in calcium and bicarbonate ions that were mostly associated with karstic units. The third group, on the other hand, contained the samples collected from Ağı Mountain sub-region and were rich in sodium, calcium, and bicarbonate ions and were associated with altered volcanic rocks.

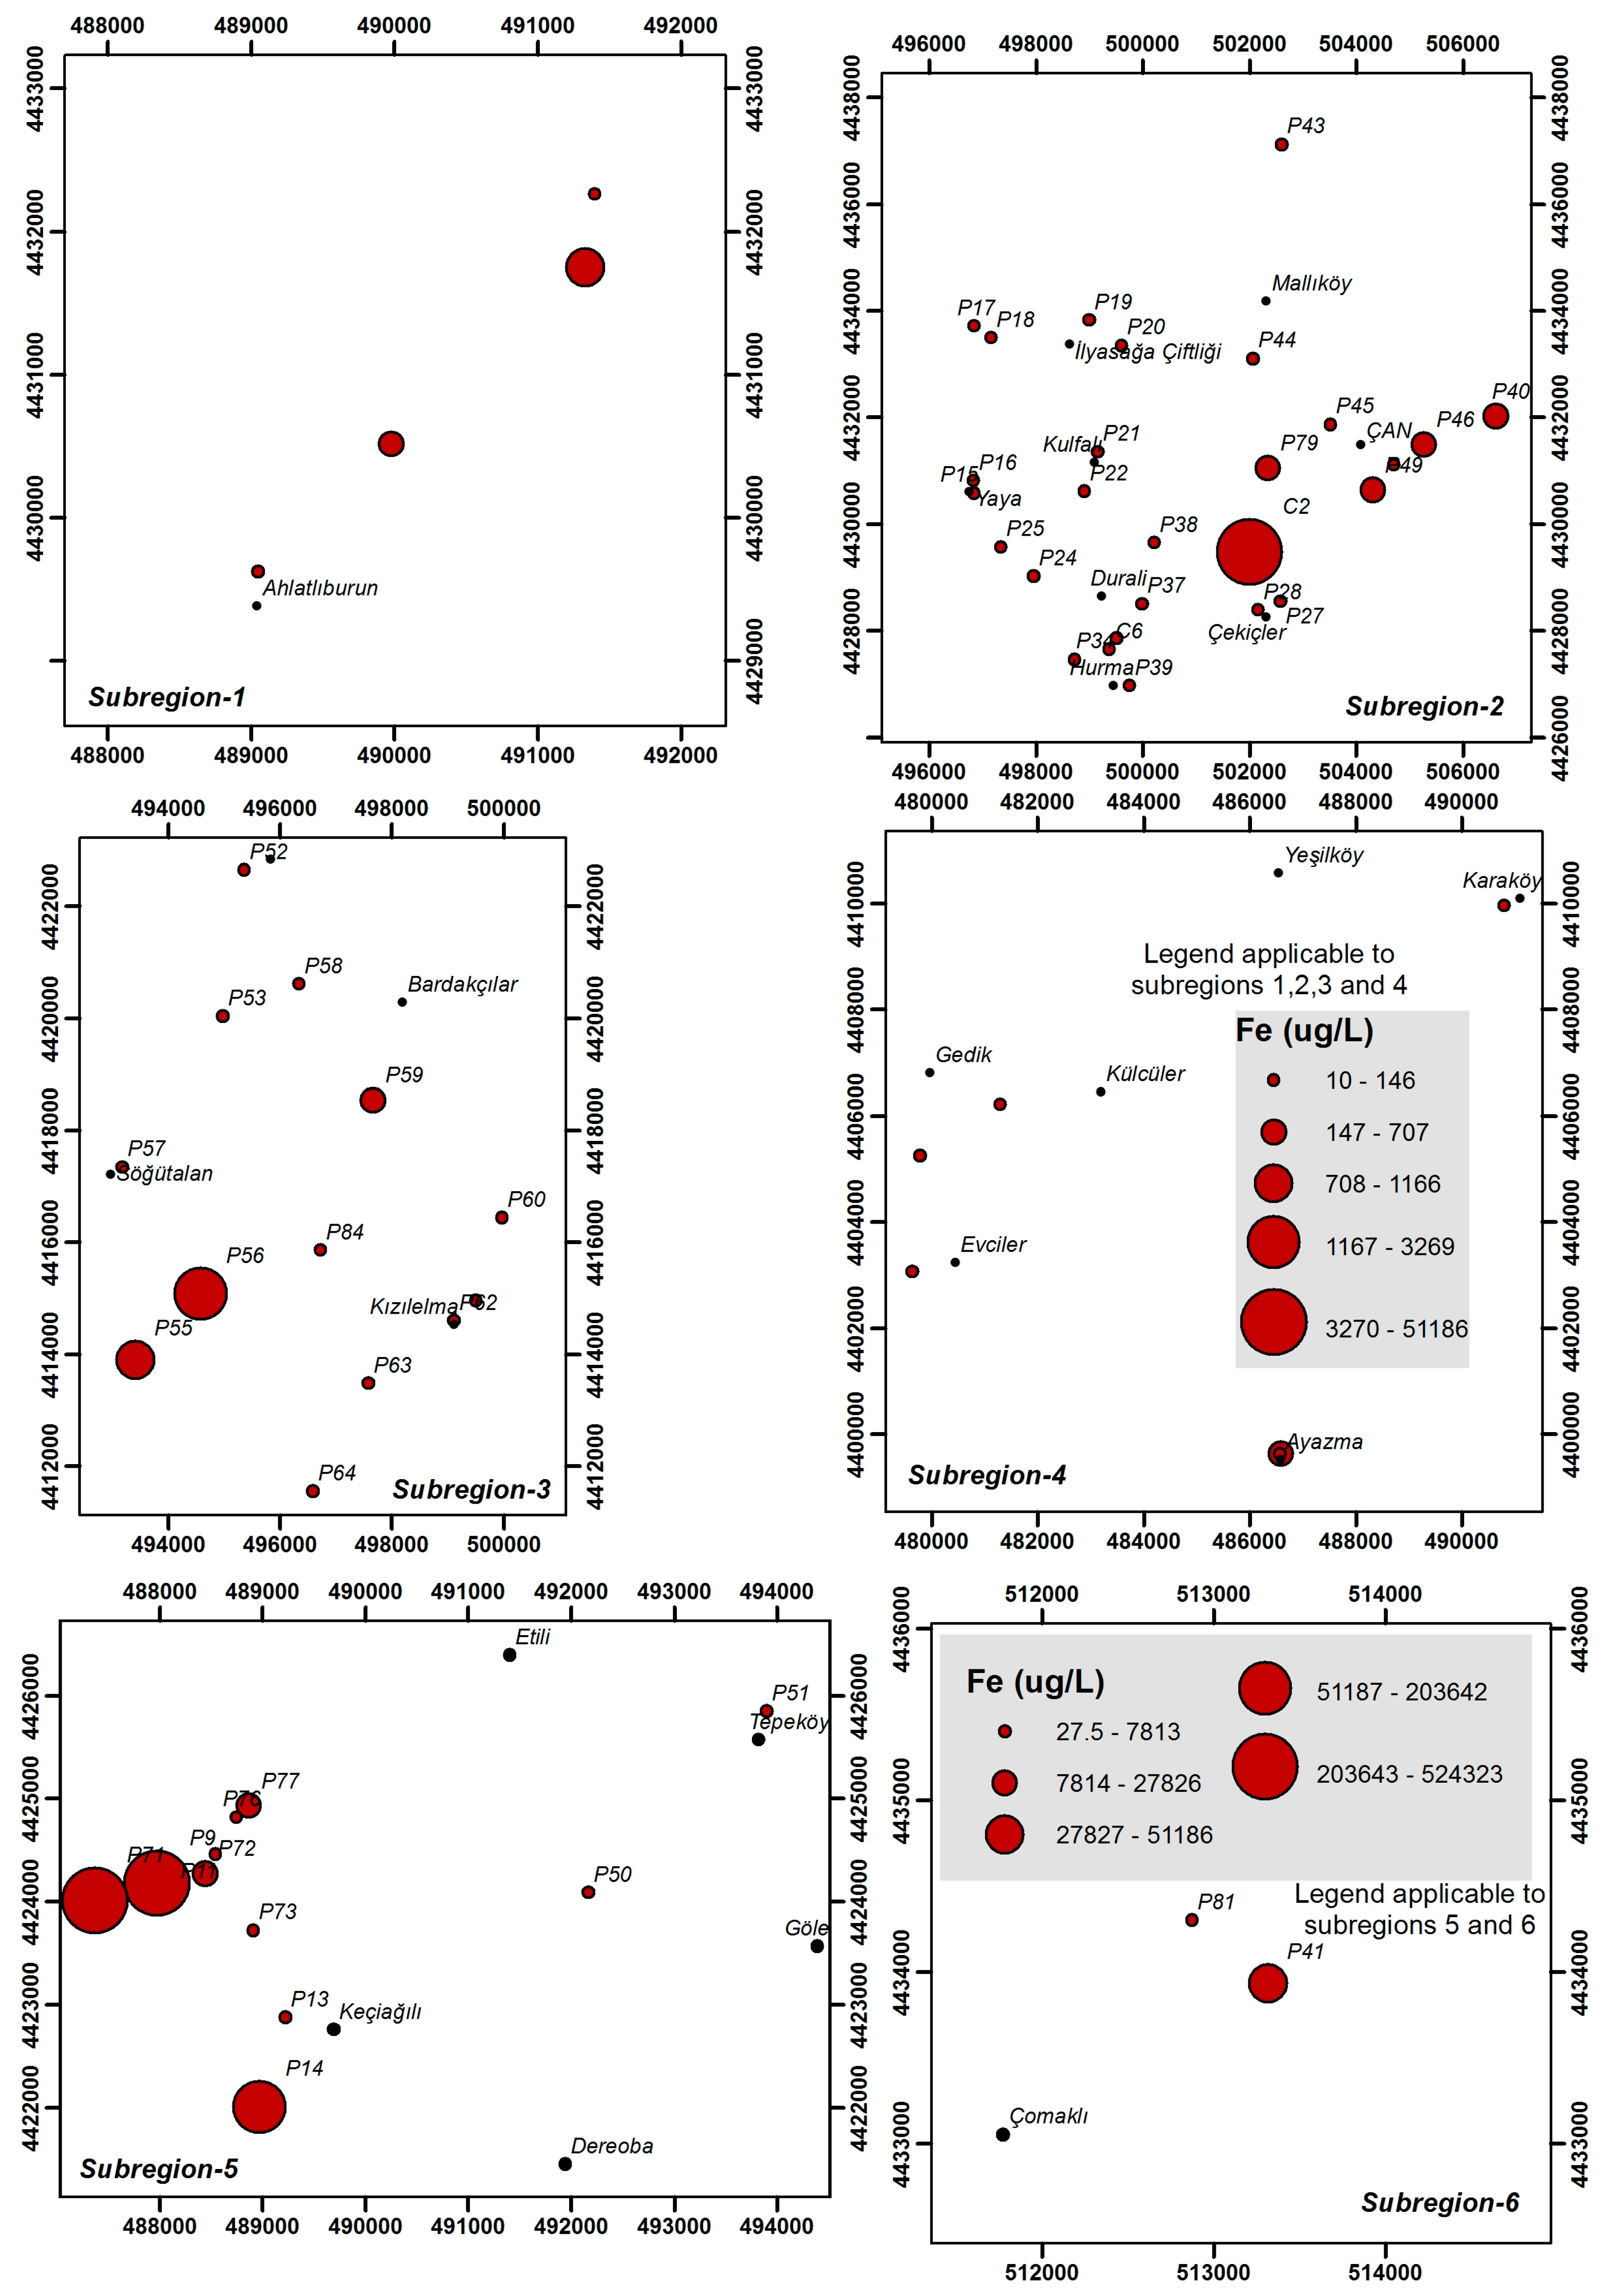
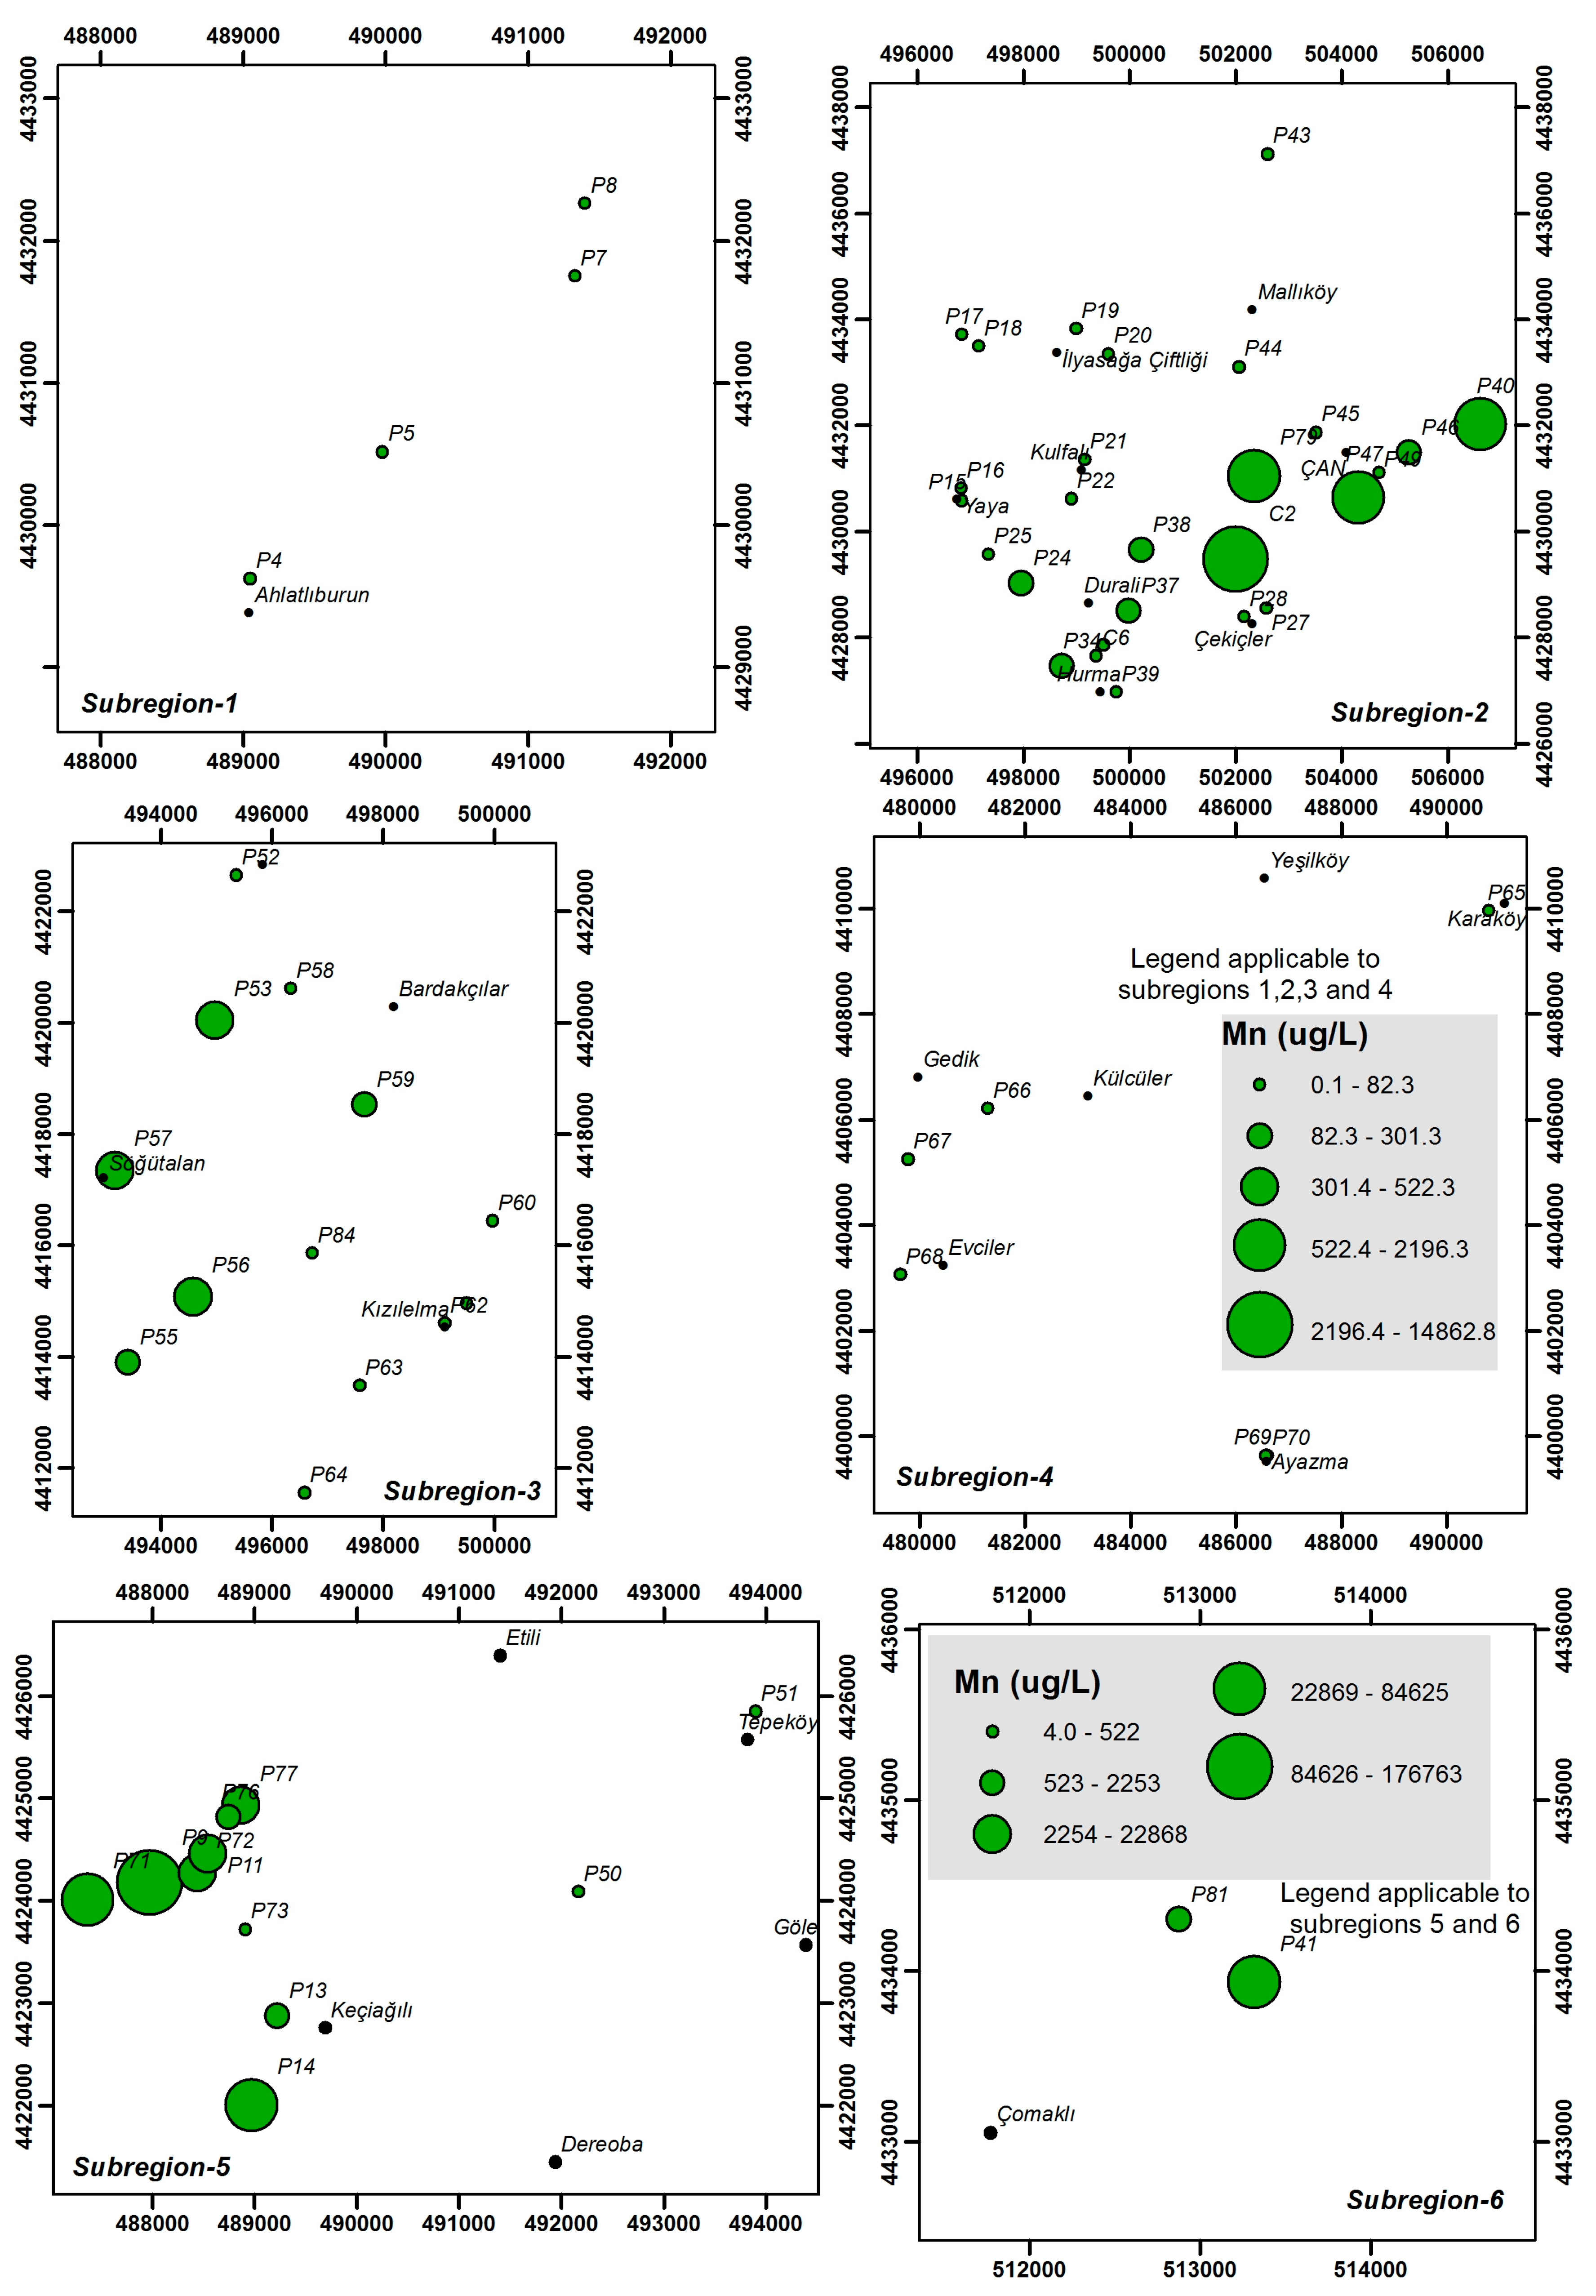
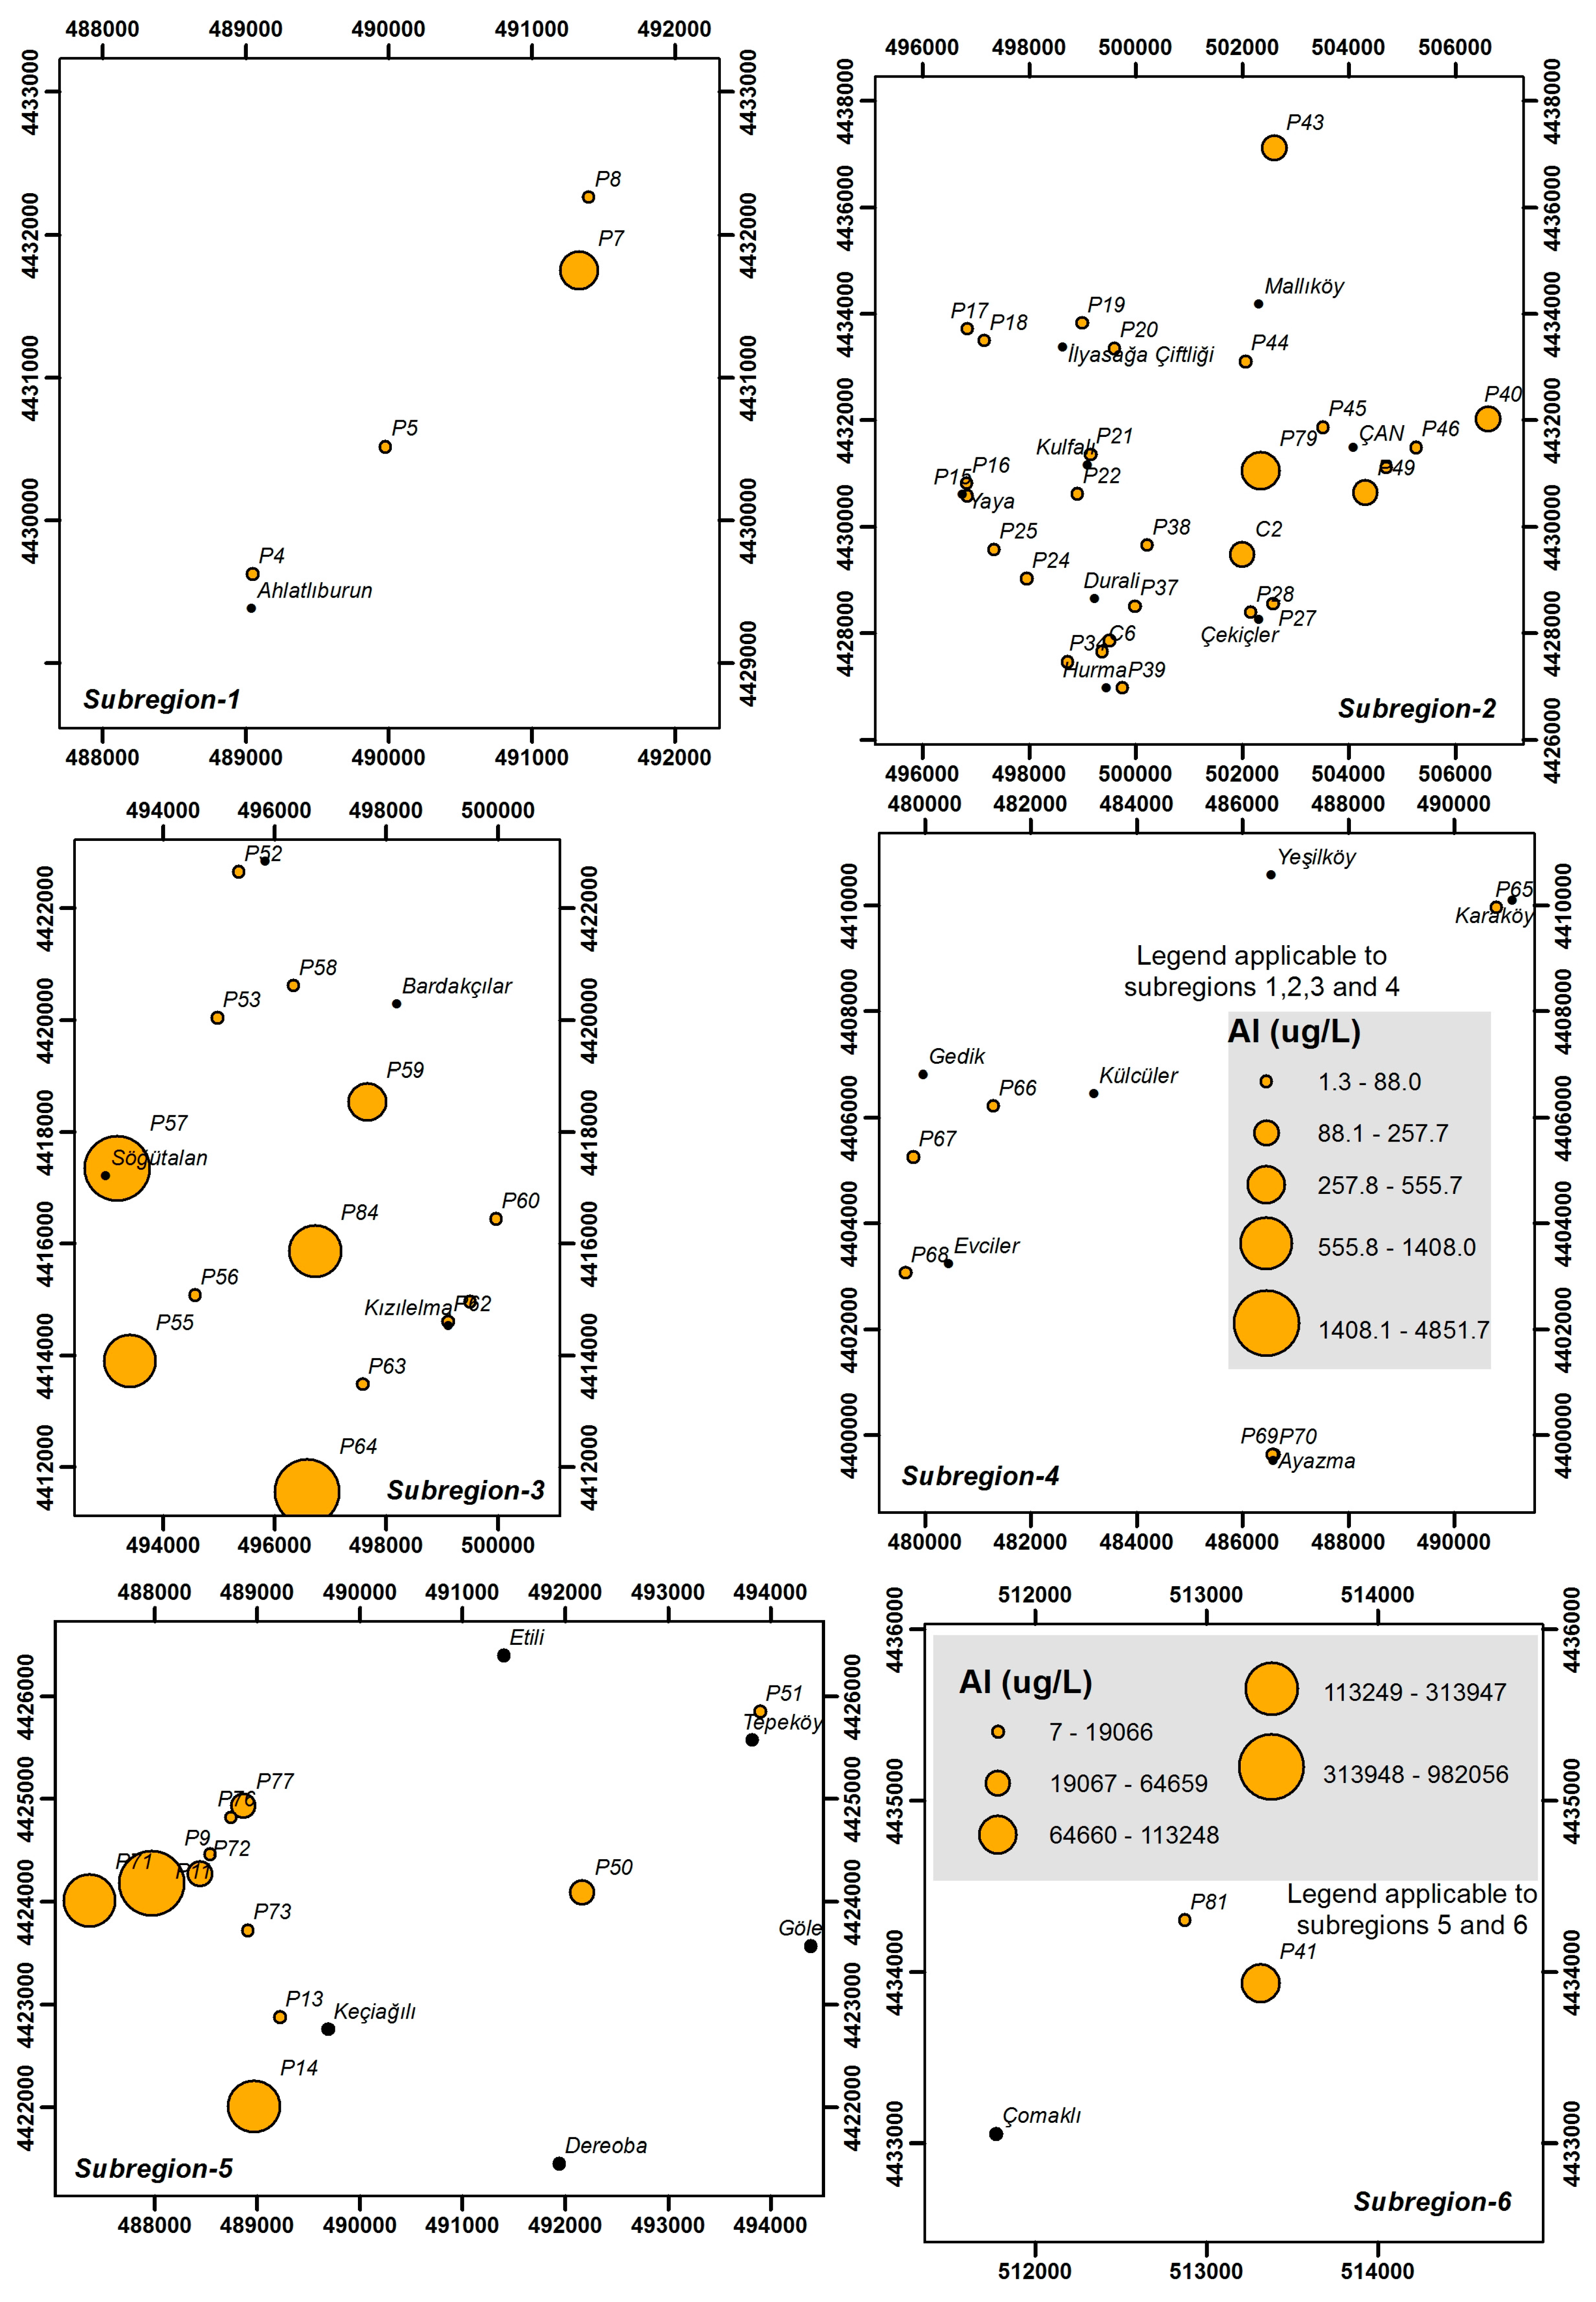
4.3. Heavy Metals and Trace Elements

In general, the heavy metal and trace element concentrations in the study area were found to be high (Table 1). Widespread and intense zones of silicified, argillic, and propylitic alterations in the study area can be observed in volcanic rocks. These alteration zones give rise to distinct mineral forms. In general, Al and Fe as well as Mg, Ca, Mn and K were enriched in argillic and propylitic alteration, respectively. Ca, Mg, and Fe were leached during argillic alteration, whereas Na leaching was evident in all alteration types. The alteration system in the study area displayed all porphyry-related alterations, including epithermal and skarn systems, containing porphyry-related high-sulphidation mineralization. This finding was mostly associated with the fairly low pH values and the associated increased solubility of metal cations. In particular, the altered geology of the study area was the primary reason for very high values of aluminum, iron and manganese. This alteration preserves the texture with feldspars altering to kaolinites and smectites, with the groundmass being replaced by varying degrees of silica [33]. A surficial argillic alteration zone has developed on weathered outcrops of the region due to the oxidation of FeS2 which is the most abundant primary sulfide mineral in the study area. FeS2 is also a common mineral in abandoned coal mines of the area. In particular, aluminum values ranged from 1.3 to 982,056 μg/L with an overall average value of 29,321 μg/L (Table 1). The highest value was in the order of 1 g/L, which was considered to be an exceptionally high value for aluminum in natural water samples. Such high values were mostly observed in sub-regions 5 and 6 (Table 2) in samples collected from acidic mining lakes and were mostly associated with dissolution of the clayey minerals underlying these lakes in acidic pH conditions (Figure 8). In other sub-regions, the aluminum values were all below 5000 μg/L. In sub-region 4, for example, the aluminum levels in samples were all less than 73.7 μg/L, where minerals containing aluminum were scarce. Unfortunately, the majority of samples obtained from the study area were above the national and international drinking water standard level of 200 μg/L. The geochemical behaviors of Fe and Al are mainly controlled by the mobility of metals though adsorption and co-precipitation in the acidic sulfate waters [34,35,36,37]. Iron is the second most dominant metal ion for the study area waters. This was mostly associated with the pyrite (FeS2), a common sulfur mineral present in the local geological formations of the region. Being highly widespread in local coal veins, pyritic oxidation not only reduces the pH of waters but also introduces dissolved iron into local water resources, which was the main reason for high iron levels found in acidic mining lake waters. Overall, the iron levels in the study area ranged from 10.0 to 524,323 μg/L with an overall average of 20,687 μg/L (Table 1). The spatial distribution of iron in the study area is given in Figure 9. Similar to aluminum, iron levels were also detected to be highest in sub-regions 5 and 6 (Table 2). While these regions can be considered as brown fields that have no direct use and require strict rehabilitation, iron levels were also one order of magnitude higher than the national and international drinking water standards in samples collected from sub-regions 2 and 3, which were used for domestic water supply purposes. In particular, samples collected from Ağı Mountain, which were obtained from altered volcanic rocks, contained beyond-standard iron levels that inhibited their use for human consumption. Manganese is another element that was found in high levels in samples collected from the study area. Manganese levels ranged between 0.1 and 176,763 μg/L with an overall average of 7077 μg/L (Table 1). Similar to iron, manganese levels were also found to be high in sub-regions 2, 5 and 6 (Figure 10), where average levels were 719.3, 33,763 and 26,574 μg/L, respectively (Table 2). All three of these values were several orders of magnitude higher than the national and international drinking water standard values for manganese, thereby making the majority of these waters unsuitable for human consumption. Being one of the most carcinogenic trace elements for humans, arsenic was also found in moderate levels in the study area. Arsenic values ranged from 0.5 to 58.0 μg/L with an overall average value of 5.4 μg/L (Table 1). The average arsenic level was found to be high compared to the standard level of 10 μg/L only in sub-region 1 with a value of 20.3 μg/L (Table 2). In all other sub-regions, including the highly acidic mining lakes, arsenic levels were, on average, below the standard level. This finding was related to the fairly low arsenic content of local geological units excluding some arseno-pyritic alteration zones and a few silisitic kaolinite reserves with relatively higher arsenic levels. Boron, on the other hand, was found to be quite high in the region with values ranging from 5.0 to 5621.5 μg/L, with an overall average value of 505.7 μg/L (Table 1). It showed comparably higher values in sub-regions 2, 5 and 6 as a result of high mineral dissolution due to low pH values (Table 2). The values exceeding 1000 μg/L were considered to be unsuitable for human consumption. Furthermore, the same limit was also considered to be detrimental for agricultural crops and thus limited the use of some of the water resources in the region for agricultural irrigation. Finally, nickel and zinc were also found to be high, particularly in the groundwaters of the region with overall average values of 103.8 and 657 μg/L, respectively (Table 1). Both elements had their highest values in the acidic mining regions of 5 and 6 due to acidic dissolution from local geological units (Table 2).

4.4. Human Health Consequences

Some epidemiological studies mention that high aluminum concentrations in drinking water are likely to create negative effects on human health [38,39,40,41,42]. A public health survey conducted in the study area revealed that local people have been affected from high aluminum-containing water sources coming from densely altered volcanic rocks [43]. Argilic alteration was associated with the formation process of vuggy silica, which is composed of quartz, pyrite, and minor rutile. Altered rocks have a reddish-yellow-white color. The process of argillisation represents hydrolytic base leaching from all aluminous phases and under acid sulfate water. Many springs were detected in the vicinity of the alteration zones. In general, Al, K and Fe were enriched in the argillic and propylitic alteration types, respectively. The influence of alteration and the duration of contact in Kirazlı and Balaban springs in the NW study area are clearly observed when the heavy metal and trace element results are assessed. In particular, mean aluminum concentrations reached 13,813 μg/L in one of these springs [44].
A total of 273 people aged above 18 years of age who inhabit the study area were selected as the research group. The results showed that neuropathy histories were significantly higher in some parts of region [43]. Considering the fact that the majority of samples from groundwater resources obtained from volcanic rocks exceeded the national and international drinking water standard level of 200 μg/L, Bakar et al. [43] concluded that there was a significant aluminum exposure for humans in the study area. Although this study did not present objective evidence demonstrating that the people living in the study area were directly affected from high aluminum levels, findings regarding the high rate of cognitive disorders and neuropathy histories in local inhabitants were detected to be comparably higher in some parts of the study area. In addition, a medical geology study was also conducted in the study area to detect the effects of geogenic factors on human health [24]. This study compared arsenic and lead levels in blood and hair samples collected from local people living in Çan Region with that of a non-exposed group in Bayramiç Region; and investigated the correlation of arsenic and lead in groundwater with hair and blood levels.
For this particular study, 674 nonsmoker women over the age of 40 were randomly selected from two regions and venous blood and hair samples were taken from the participants. All blood and hair samples were analyzed with atomic absorption spectrophotometry. The results showed that the highest prevalence of diseases was found in Bayramiç and Çan district centers whereas relatively lower values were observed in the villages. Blood and hair arsenic levels were measured to be higher in Çan region where intense mining activities were present when compared to Bayramiç region where no mining activity was essentially present. This study found out that the overall arsenic concentration in hair samples was higher in Çan Region (median: 0.27 μg·g−1, range: 0.12 to 1.92 μg·g−1) when compared with Bayramiç region (median: 0.15 μg·g−1, range: 0.07 to 0.46 μg·g−1). While a statistically significant difference in hair arsenic levels was observed between the groups (p < 0.05), the values did not exceed the toxic level. A reverse association was found for blood arsenic levels and Bayramiç region had higher levels of arsenic compared with those living in Çan Region. Similarly, the median value of blood–lead levels in Çan region (i.e., mining area) was significantly (p < 0.005) higher than that for the control area (i.e., Bayramiç Region). These results also indicated that geological formation can have a considerable impact on human health when high blood–lead levels in individuals living in close proximity to coal mining areas and volcanic alteration sites are taken into consideration. Geologically altered zones are predominant in Çan region of the study area. Groundwater samples originating from these alteration zones were found to contain elevated levels (more than the standard value of 10 ppb) of arsenic in the villages of Ahlatlıburun, Tepeköy, Mallıköy and Çekiçler. Similarly, blood–arsenic levels were found to be comparably high in these areas.

5. Conclusions

The complexity and variety of geological units create waters with distinct characteristics within a small spatial coverage. In particular, altered rocks further increase this influence and result in waters with high chemical content. Mount Ida situated in western Anatolia is one such area where different quality waters surface out and influence human and environmental well-being. Anthropogenic effects further complicate the issue and decrease the overall water quality. When such degraded quality waters are consumed, toxic chemicals enter the body through direct and indirect exposure routes and alter the physiological health by creating various diseases.
Strong water–rock interaction in altered geological units typically results in a change in physical and chemical properties of water resources. One important example is observed in Mount Ida region where waters originating from highly altered and jointed volcanic rocks created low pH and high element contents. As altered rocks are typical locations for mineral reserves, mining activities further accelerate this interaction and result in highly distorted conditions. As an example, open pits of these mine sites create suitable locations for the formation of acidic mining lakes. These lakes are highly acidic and contain heavy metals and trace elements such as iron and aluminum due to the oxidation of pyrite and weathering of some aluminosilicate minerals that are present in clay-containing coal veins and altered volcanic rocks. Surface drainage and subsurface infiltration from these lakes influence not only the quality of water resources in the area but also the local ecosystem well-being from micro to macro scale.
These degraded quality waters are used by locals for their drinking water supply and create some health-related problems, which may be seen as an indicator for Alzheimer’s disease and cancers of internal organs. Consequently, the continuous monitoring of water resources that are used for human consumption is extremely important and additional monitoring of human health through public health surveys needs to be conducted on a regular basis in areas with similar water quality problems.

Acknowledgments

The authors would like thank the Turkish Academy Sciences (TUBA) and the Scientific and Technological Research Council of Turkey (TUBITAK-106Y041) for their support.

Author Contributions

Alper Baba and Orhan Gündüz did the preliminary studies, selected the sampling locations, conducted field studies, analyzed the data and wrote the paper.

Conflicts of Interest

The authors declare no conflict of interest.

References

  1. Martin, C.W. Heavy Metal trends in floodplain sediments and valley fill, River Lahn, Germany. Catena 2000, 39, 53–68. [Google Scholar] [CrossRef]
  2. Gwalteney-Brant, S.M. Heavy metals. In Handbook of Toxicologic Pathology; Haschek, W.M., Rosseaux, C.G., Wallig, A.M., Eds.; Academic Press: New York, NY, USA, 2002; pp. 701–732. [Google Scholar]
  3. Jarup, L.J. Hazards of heavy metal contamination. Br. Med. Bull. 2003, 68, 167–182. [Google Scholar] [CrossRef] [PubMed]
  4. Kakkar, P.; Jaffery, F. Biological markers for metal toxicity. Environ. Toxicol. Pharmacol. 2005, 19, 335–349. [Google Scholar] [CrossRef] [PubMed]
  5. Nouri, J.; Mahvi, A.H.; Jahed, G.R.; Babaei, A.A. Regional distribution pattern of groundwater heavy metals resulting from agricultural activities. Environ. Geol. 2008, 55, 1337–1343. [Google Scholar] [CrossRef]
  6. Kaaden, G. Geology and Ore Deposit Report around Çanakkale-Biga-Edremit Peninsula; MTA Report Number 2661; General Directorate of Mineral Research and Exploration (MTA): Ankara, Turkey, 1957. [Google Scholar]
  7. Ketin, I. Geological Report of Kapıdağ Peninsula, Marmara Island and Bandırma Region; MTA Report Number 1931; General Directorate of Mineral Research and exploration (MTA): İstanbul, Turkey, 1974. [Google Scholar]
  8. Okay, I.A.; Siyako, M.; Bürkan, K.A. Geology and tectonic evaluation of Biga Peninsula, Northwest Turkey. Bull. Tech. Univ. Istanb. 1991, 44, 191–256. [Google Scholar]
  9. Okay, I.A.; Satır, M.; Maluski, H.; Siyako, M.; Metzger, R.; Akyüz, S. Paleo and Neo—Tethyan Events in Northwest Turkey: Geological and Geochrological constraints. In Tectonics of Asia; An, Y., Harrison, M., Eds.; Cambridge University Press: Cambridge, UK, 1996; pp. 420–441. [Google Scholar]
  10. Okay, A.I.; Satir, M. Coeval plutonism and metamorphism in a latest Oligocene metamorphic core complex in Northwest Turkey. Geol. Mag. 2000, 137, 495–516. [Google Scholar] [CrossRef]
  11. Yılmaz, Y. Comparisons of the young volcanic associations of western and eastern Anatolia under the compressional regime: A review. J. Volcanol. Geother. Res. 1990, 44, 69–87. [Google Scholar] [CrossRef]
  12. Yilmaz, H. Exploration at the Kuscayiri Au (Cu) prospect and its implications for porphyry-related mineralization in western Turkey. J. Geochem. Explor. 2003, 77, 133–150. [Google Scholar] [CrossRef]
  13. Yılmaz, Y.; Genç, Ş.C.; Gürer, F.Ö.; Bozcu, M.; Yılmaz, K.; Karacık, Z.; Altunkaynak, Ş.; Elmas, A. When did the western Anatolian grabens begin to develop? Geol. Soc. Lond. Spec. Publ. 2000, 173, 353–384. [Google Scholar] [CrossRef]
  14. Houssa, C.E. Talking Turkey—An update on the Turkish minerals industry. Ind. Miner. 1999, 379, 21–47. [Google Scholar]
  15. Erdogan, E. Geothermal Energy Possibility of Survey and Tectonic Mapping of Tuzla Hot Springs and Surrounding; MTA Report; General Directorate of Mineral Research and Exploration (MTA): Ankara, Turkey, 1966; Unpublished. [Google Scholar]
  16. General Directorate of Mineral Research and Exploration (MTA). Hot and Mineral Water Inventory; MTA Report; General Directorate of Mineral Research and Exploration (MTA): Ankara, Turkey, 1980; Unpublished. [Google Scholar]
  17. General Directorate of Mineral Research and Exploration (MTA). Gold and Silver Deposit in Turkey; General Directorate of Mineral Research and Exploration (MTA): Ankara, Turkey, 1993; p. 46. [Google Scholar]
  18. Erler, A.; Larson, L.T. Genetic classification of gold occurrences for the Aegean region of Turkey. In Proceedings of the International Earth Science Colloquium on the Aegean Region, Izmir, Turkey, 1–6 October 1990.
  19. Agdemir, N.; Kirikoglu, M.S.; Lehmann, B.; Tietze, J. Petrology and alteration geochemistry of the epithermal Balya Pb-Zn-Ag deposit, NW Turkey. Miner. Depos. 1994, 29, 366–371. [Google Scholar] [CrossRef]
  20. Pirajno, F. Volcanic-hosted epithermal systems in Northwest Turkey. S. Afr. J. Geol. 1995, 98, 13–24. [Google Scholar]
  21. Oygur, V. Anatomy of an epithermal mineralization: Mumcu (Balikesir-Sindirgi), inner-western Anatolia, Turkey. Miner. Res. Explor. Bull. 1997, 119, 29–39. [Google Scholar]
  22. Jankovic, S. The Carpatho-Balkanides and adjacent area: A sector of the Tethyan Eurasian metallogenic belt. Miner. Depos. 1997, 32, 426–433. [Google Scholar] [CrossRef]
  23. Yılmaz, Y.; Tüysüz, O.; Yiğitbaş, E.; Genç, Ş.; Şengör, A.M.C. Geology and tectonic evolution of the Pontides. In Regional and Petroleum Geology of the Black Sea and Surrounding Region; Robinson, A.G., Ed.; American Association of Petroleum Geologists (AAPG): Tulsa, OK, USA, 1997; Volume 68, pp. 183–226. [Google Scholar]
  24. Baba, A.; Save, D.; Gündüz, O.; Gürdal, G.; Bozcu, M.; Sülün, S.; Özcan, H.; Hayran, O.; İkiışık, H.; Bakırcı, L. The Assessment of the Mining Activities in Çan Coal Basin from a Medical Geology Perspective; Final Report; Project No. ÇAYDAG-106Y041; The Scientific and Technological Research Council of Turkey (TÜBİTAK): Ankara, Turkey, 2009. (In Turkish)
  25. World Health Organization (WHO). World Health Organization Guidelines for Drinking Water Quality; World Health Organization: Geneva, Switzerland, 2004. [Google Scholar]
  26. United States Environmental Protection Agency (USEPA). Environmental Protection Agency Office of Water National Primary Drinking Water Standards; EPA 816-F-03-016; United States Environmental Protection Agency: Washington, DC, USA, 2003.
  27. Regulation on Waters Intended for Human Consumption (ITASHY), Official Gazette, Number 25730, 2005. Available online: http://www.ecolex.org/details/legislation/regulation-on-water-intended-for-human-consumption-lex-faoc151039/? (accessed on 20 January 2017).
  28. Sanliyuksel, Y.D.; Balci, N.; Baba, A. Generation of Acid Mine Lakes Associated with Abandoned Coal Mines in Northwest Turkey. Arch. Environ. Contam. Toxicol. 2016, 70, 757–782. [Google Scholar] [CrossRef] [PubMed]
  29. Sanliyuksel, Y.D.; Baba, A. Geochemical characterization of acid mine lakes and their effect on the environment, NW of Turkey. Arch. Environ. Contam. Toxicol. 2013, 64, 357–376. [Google Scholar]
  30. Bachmann, T.M.; Friese, K.; Zachmann, D.W. Redox and pH conditions in the water column and in the sediments of an acidic mining lake. J. Geochem. Explor. 2001, 73, 75–86. [Google Scholar] [CrossRef]
  31. Lessmann, D.; Deneke, R.; Ender, R.; Hemm, M.; Kapfer, M.; Krumbeck, H. Lake Plessa 107 (Lusatia, Germany)—An extremely acidic shallow mining lake. Hydrobiologia 1999, 408, 293–299. [Google Scholar] [CrossRef]
  32. Espana, J.S.; Pamo, E.L.; Pastor, E.S.; Ercilla, M.D. The acidic mine pit lakes of the Iberian Pyrite Belt: An approach to their physical limnology and hydrogeochemistry. Appl. Geochem. 2008, 23, 1260–1287. [Google Scholar] [CrossRef]
  33. Nordstrom, D.K. Aqueous pyrite oxidation and the consequent formation of secondary iron minerals. In Acid Sulfate Weathering; Kittrick, J.A., Fanning, D.S., Hossner, L.R., Eds.; Soil Science Society of America Special Publication 10; Soil Science Society of America: Madison, WI, USA, 1982; pp. 37–55. [Google Scholar]
  34. Bigham, J.M.; Nordstrom, D.K. Iron and aluminum hydroxysulfates from acid sulfate water. In Review in Mineralogy and Geochemistry: Sulfate Minerals: Crystallography, Geochemistry, and Environmental Significance, 40th ed.; Alpers, C.N., Jambor, J.L., Nordstrom, D.K., Eds.; The Mineralogical Society of America: Washington, DC, USA, 2000; pp. 351–403. [Google Scholar]
  35. Lee, G.; Bigham, J.M.; Faure, G. Removal of trace metals by coprecipitation with Fe, Al and Mn from natural waters contaminated with acid mine drainage in the Ducktown Mining District, Tennessee. Appl. Geochem. 2002, 17, 569–581. [Google Scholar] [CrossRef]
  36. Lee, J.S.; Chon, H.T. Hydrogeochemical characteristics of acid mine drainage in the vicinity of an abandoned mine, Daduk Creek, Korea. J. Geochem. Explor. 2006, 88, 37–40. [Google Scholar] [CrossRef]
  37. Equeenuddin, S.M.; Tripathy, S.; Sahoo, P.K.; Panigrahi, M.K. Hydrogeochemical characteristics of acid mine drainage and water pollution at Makum Coalfield, India. J. Geochem. Explor. 2010, 105, 75–82. [Google Scholar] [CrossRef]
  38. Morris, J.C.; Storandt, M.; Miller, P.; McKeel, D.W.; Price, J.L.; Rubin, E.H.; Berg, L.M. Cognitive impairment represents early-stage Alzheimer disease. Arch. Neurol. 2001, 58, 397–405. [Google Scholar] [CrossRef] [PubMed]
  39. Flaten, T.P. Aluminum as a risk factor in Alzheimer’s disease, with emphasis on drinking water. Brain Res. Bull. 2001, 55, 187–196. [Google Scholar] [CrossRef]
  40. Solfrizzi, V.; Panza, F.; Capurso, A. The role of diet in cognitive decline. J. Neural. Transm. 2003, 110, 95–110. [Google Scholar] [PubMed]
  41. Molloy, D.W.; Standish, T.I.; Nieboer, E.; Turnbull, J.D.; Smith, S.D.; Dubois, S. Effects of acute exposure to aluminum on cognition in humans. J. Toxicol. Environ. Health A 2007, 70, 2011–2019. [Google Scholar] [CrossRef] [PubMed]
  42. Meyer-Baron, M.; Schaper, M.; Knapp, G.; van Thriel, C. Occupational aluminum exposure: Evidence in support of its neurobehavioral impact. Neurotoxicology 2007, 28, 1068–1078. [Google Scholar] [CrossRef] [PubMed]
  43. Bakar, C.; Karaman, H.I.Ö.; Baba, A.; Sengünalp, F. Effect of high aluminum concentration in water resources on human health, case study: Biga Peninsula, Northwest part of Turkey. Arch. Environ. Contam. Toxicol. 2010, 58, 935–944. [Google Scholar] [CrossRef] [PubMed]
  44. Baba, A.; Gunduz, O. Effect of alteration zones on water quality: A case study from Biga Peninsula, Turkey. Arch. Environ. Contam. Toxicol. 2010, 58, 499–513. [Google Scholar] [CrossRef] [PubMed]
Figure 1. Location of study area.
Water 09 00066 g001
Figure 2. Geology of study area.
Water 09 00066 g002
Figure 3. Sample location map.
Water 09 00066 g003
Figure 4. Spatial distribution of pH.
Water 09 00066 g004
Figure 5. Spatial distribution of electrical conductivity.
Water 09 00066 g005
Figure 6. Classification of hydrochemical facies using the Piper diagram.
Water 09 00066 g006
Figure 7. Schoeller diagram of the average concentrations of anions and cations.
Water 09 00066 g007
Figure 8. Spatial distribution of aluminum.
Water 09 00066 g008
Figure 9. Spatial distribution of iron.
Water 09 00066 g009
Figure 10. Spatial distribution of manganese.
Water 09 00066 g010
Table 1. General summary of the quality of water resources in the study area.
ParameterUnitMinMaxAverageStd. Dev.WHO [25]EPA [26]ITASHY [27]
Temp°C9.924.216.72.8--25
pH-2.68.46.61.66.5–8.56.5–8.56.5–9.5
ECμS/cm89.37040.01248.21293.7--2500
Na+mg/L4.21333.294.9183.3200-200
Ca2+mg/L3.9587.0132.6118.5--200
Mg2+mg/L2.1778.757.8120.7--50
K+mg/L0.235.65.36.5---
SO42−mg/L2.75669.3473.01040.0250250250
Clmg/L4.1232.432.036.4250250250
Fmg/L0.033.70.560.601.521.5
HCO3mg/Lb.d.l.1425.0329.5266.1---
Alμg/L1.3982,05629,321131,668200200200
Asμg/L0.558.05.410.9101010
Bμg/L5.05621.5505.71135.4500-1000
Feμg/L10.0524,32320,68785,354200300200
Mnμg/L0.1176,763707725,6944005050
Niμg/L0.22615.8103.8388.120-20
Znμg/L0.920,8316572881500050005000
Table 2. Summary of statistics (min. max. and avg. ± std. dev.) of water quality with respect to sub-regions.
ParameterUnitSub-Region 1 (N = 4)Sub-Region 2 (N = 27)Sub-Region 3 (N = 13)Sub-Region 4 (N = 6)Sub-Region 5 (N = 11)Sub-Region 6 (N = 2)
Temp°C15.2–19.712.2–24.210.8–17.39.9–20.615.4–20.419.8–21.6
(17.1 ± 1.8)(17.4 ± 2.3)(14.3 ± 2.1)(14.7 ± 3.8)(18.3 ± 1.5)(20.7 ± 0.9)
pH-7.0–7.45.8–8.43.8–8.06.4–8.42.6–7.03.1–7.4
(7.2 ± 0.2)(7.4 ± 0.6)(6.4 ± 1.4)(7.2 ± 0.7)(4.3 ± 1.6)(5.2 ± 2.1)
ECμS/cm455–2692209–445589–1568193–563813–70403817–4395
(1210.5 ± 875.1)(1105.6 ± 826.2)(513.2 ± 368.4)(409.5 ± 137.0)(2418.7 ± 1876.0)(4105.8 ± 289.2)
Na+mg/L29.5–80.920.4–1333.25.0–139.04.2–26.227.4–221.099.1–201.0
(56.0 ± 21.3)(140.3 ± 264.3)(23.5 ± 33.9)(16.1 ± 8.8)(114.7 ± 53.6)(150.1 ± 50.9)
Ca2+mg/L54.9–138.317.7–366.93.9–324.137.6–89.020.2–461.2383.0–587.0
(85.1 ± 32.8)(128.4 ± 72.8)(66.7 ± 84.2)(64.1 ± 20.5)(211.7 ± 138.3)(485.0 ± 102.0)
Mg2+mg/L12.7–21.83.2–97.42.1–73.16.6–26.55.8–418.2444.7–778.6
(16.0 ± 3.5)(32.6 ± 21.2)(18.9 ± 21.8)(17.6 ± 6.5)(101.8 ± 119.0)(611.6 ± 167.0)
K+mg/L1.6–17.70.5–14.20.2–13.30.7–3.60.8–35.64.7–15.4
(6.5 ± 6.5)(4.7 ± 3.7)(2.6 ± 4.3)(1.7 ± 0.9)(10.7 ± 10.8)(10.0 ± 5.4)
SO42−mg/L23.8–158.815.4–1356.415.1–600.32.7–125.277.4–5669.32183.1–3865.3
(66.6 ± 54.2)(232.6 ± 303.4)(78.8 ± 151.6)(57.1 ± 53.0)(1439.6 ± 1791.0)(3024.2 ± 841.1)
Clmg/L17.7–64.78.7–232.44.7–30.64.1–31.612.7–83.612.9–25.6
(48.7 ± 18.6)(37.9 ± 48.2)(12.4 ± 7.6)(12.1 ± 9.2)(47.8 ± 22.3)(19.2 ± 6.3)
Fmg/L0.2–0.70.2–1.00.03–0.90.2–0.30.2–3.71.1–1.6
(0.4 ± 0.2)(0.5 ± 0.2)(0.3 ± 0.2)(0.3 ± 0.1)(1.2 ± 1.1)(1.4 ± 0.3)
HCO3mg/L123.9–492.177.8–683.815.8–537.8124.8–350.5b.d.l.–1240.0133.0–1425.0
(266.3 ± 136.8)(386.0 ± 141.6)(233.0 ± 176.2)(209.9 ± 75.6)(311.3 ± 410.7)(779.0 ± 646.0)
Alμg/L2.3–4631.7–377.01.3–4851.72.0–73.77.0–982,056110.0–113,248
(127.9 ± 193.7)(51.1 ± 92.0)(841.4 ± 1429.2)(16.1 ± 25.8)(156,449 ± 280,302)(56,679 ± 56,569)
Asμg/L2.0–54.50.5–58.00.5–5.40.5–4.50.7–36.90.5–4.7
(20.3 ± 20.6)(5.2 ± 10.8)(1.5 ± 1.5)(1.3 ± 1.5)(7.7 ± 10.8)(2.6 ± 2.1)
Bμg/L40.3–68.08.0–5063.55.3–1222.05.0–10.080.5–4029.32529.7–5621.5
(48.5–11.4)(478.6 ± 1057.0)(111.6 ± 320.8)(7.1 ± 1.9)(827.3 ± 1125.9)(4075.6 ± 1545.9)
Feμg/L10.0–937.010.0–51,18610.0–326910.0–518.027.5–524,323317.0–48,499
(369.9 ± 378.3)(1997.5 ± 9647.8)(420.5 ± 888.3)(99.1 ± 187.5)(108,455 ± 178,774)(24,408 ± 24,091)
Mnμg/L0.4–9.90.1–14,862.80.8–522.30.4–25.74.0–176,7632253–50,896
(5.1 ± 4.2)(719.3 ± 2795.4)(139.5 ± 183.1)(7.0 ± 8.9)(33,764 ± 51,686)(26,575 ± 24,321)
Niμg/L0.2–0.90.2–20.70.2–26.20.2–31.10.2–2615.819.0–1205.6
(0.6 ± 0.3)(2.6 ± 4.2)(5.3 ± 8.1)(8.4 ± 11.4)(465.6 ± 758.5)(612.3 ± 593.3)
Znμg/L1.4–47.41.1–113.40.9–1160.9–10.825.9–20,83181.4–2052.5
(19.2 ± 17.3)(14.2 ± 21.9)(21.6 ± 32.4)(3.9 ± 3.7)(3498.4 ± 6114.3)(1067.0 ± 985.6)

