1. Introduction
The hydrologic regime, which is crucial to riverine ecosystems, sets a template for ecological processes, evolutionary adaptations, and native biodiversity maintenance [
1]. The concept of “natural flow regime,” which has emerged as a paradigm for river conservation and restoration [
2], recognizes the full range of natural flow variability as a primary driving force for sustaining the ecological health of a river. The hydrologic regime is influenced by both climate and anthropogenic activities, and many studies of worldwide hydrologic changes have considered these two factors [
3,
4,
5,
6,
7,
8]. Anthropogenic activities that influence the hydrologic regime include land use [
9], water diversion [
10], and especially dam construction [
11]. Dams provide numerous socio-economic benefits in terms of flood control, power generation, water supply, navigation, and recreation; however, dams disrupt river continuity and influence river hydrology, primarily by changing the timing, magnitude, and frequency of low and high flows. Ultimately, dams produce a hydrologic regime that differs significantly from the natural flow regime [
6]. The altered hydrologic regime may influence riverine ecosystems by changing the natural habitat of native aquatic organisms, thereby affecting species structure and biodiversity; over time, these factors can influence the sustainable development of human society [
12].
The Yangtze River, an important source of water, hydropower, and biological resources, plays a vital role in China’s economic development and ecological environmental conservation. Hydrologic changes in the Yangtze River and their associated ecological implications have attracted considerable attention from hydrologists, geomorphologists, and policy-makers. Huang et al. [
13] documented flow complexity loss in the upper Yangtze River, attributing it to underlying surface condition changes influenced by human activities, especially reservoir construction. Yu et al. [
14] analyzed the influence of the Gezhouba Reservoir and Three Gorges Reservoir, considering alterations in annual, seasonal, monthly, and daily flow. Gao et al. [
15] further investigated the impact of the Three Gorges Reservoir on the flow regime in the middle and lower Yangtze River based on the Indicators of Hydrologic Alteration (IHA). The years when the reservoir began to store water were artificially designated as change points, and subsequent hydrologic changes were analyzed by comparing the regimes between the pre- and post-dam periods. Zhang et al. [
16] applied scanning
t-test to detect change points in monthly streamflow, ignoring variations in other hydrologic components like the magnitude, duration, and timing of annual extreme water conditions; the frequency and duration of high and low pulses; and the rate and frequency of water condition changes.
Based on these previous studies, the present study aims to accomplish the following objectives: (1) to investigate abrupt changes at different time scales in the hydrologic regime of the Yangtze River and discuss the implications of these changes; and (2) to investigate the possible impacts of reservoirs. One improvement over previous studies is the systematic analysis of multiple changes in the hydrologic regime, as characterized by the IHA. This study identifies spatial variations in the hydrologic changes by analyzing the streamflow in the upper, middle, and lower reaches. Common changes in the hydrologic regimes of the different reaches are then investigated using an improved coherency analysis method. The impacts of reservoirs are revealed through the changing features of hydrologic indicators and the coherency between related hydrologic indicators. The novelty of this study is embodied in the improved coherency analysis method, which can detect common changes in different hydrologic indicators and different reaches, thereby revealing possible impacts of reservoirs.
2. Study Area and Data
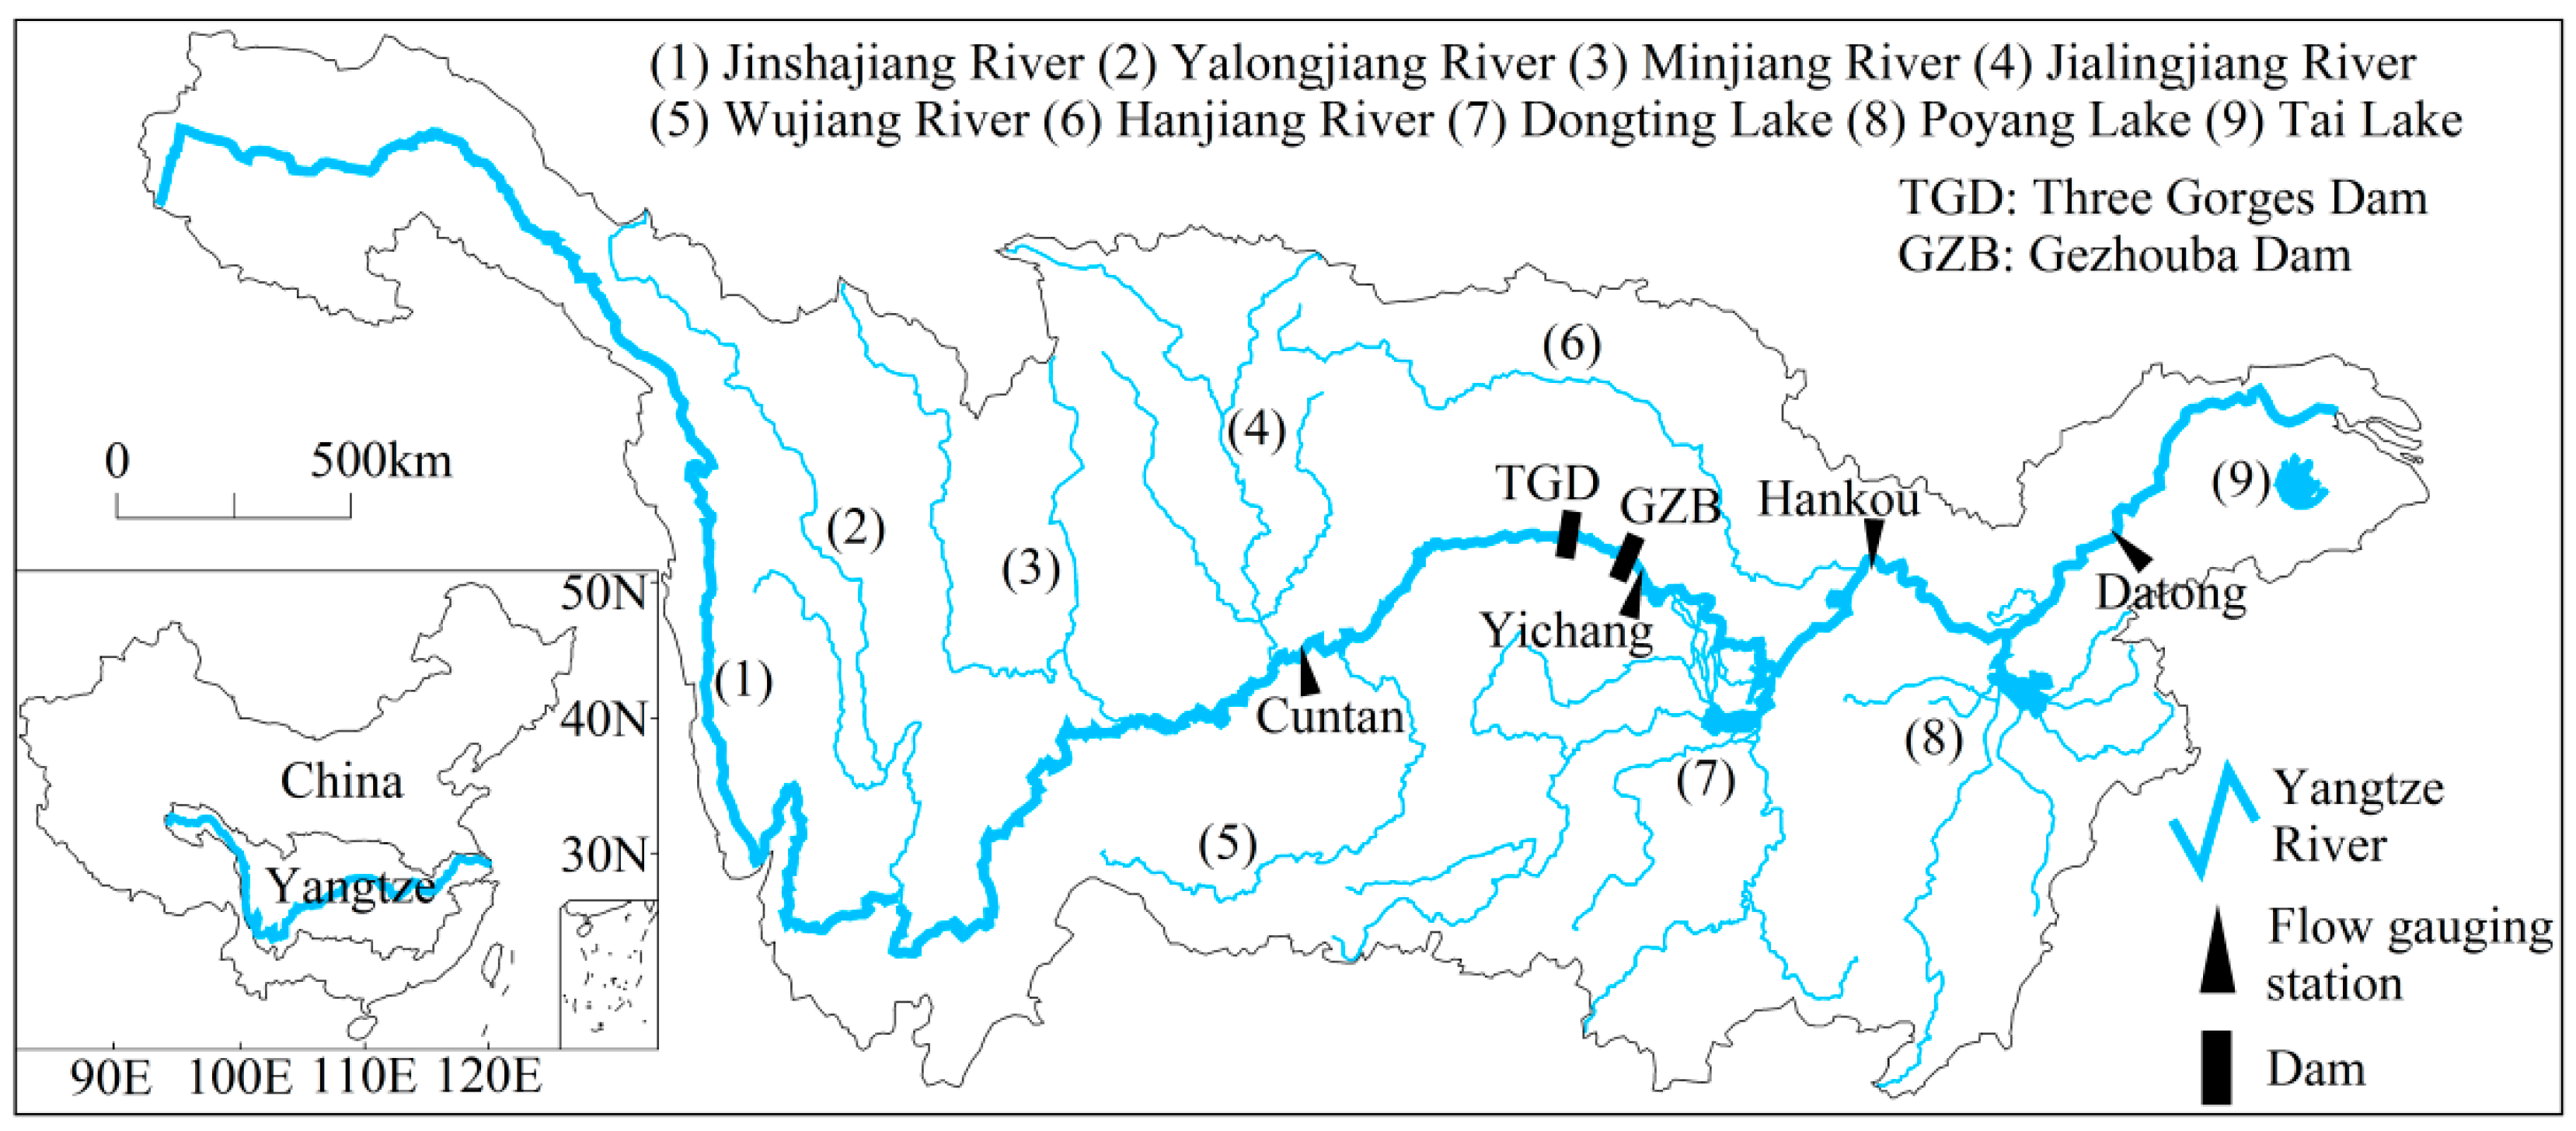
The Yangtze River (
Figure 1), located from 91° E to 122° E and 25° N to 35° N, is the longest river in China and the third longest river in the world. It originates in the Qinghai-Tibet Plateau, flows about 6300 km eastwards to the East China Sea, and drains an area of approximately 1.8 million km
2. The Yangtze River basin lies in the monsoon region of East Asia’s subtropical zone, and it experiences mean annual precipitation of approximately 1090 mm [
17]. Generally, spring lasts from March to May, summer lasts from June to August, autumn lasts from September to November, and winter lasts from December to February of the following year. Over 50,000 dams have been constructed in the Yangtze River basin, with many located in the upper reaches [
18]. The dams’ total storage capacity is almost 180 billion m
3, representing approximately 20% of the river’s annual runoff. The total reservoir volume has transitioned through four clear stages since the 1950s: (1) Total volume increased slowly until 1970; (2) Volume increased rapidly from 1970 to 1980; (3) Volume increased slowly from 1980 to 1995; and (4) Volume increased rapidly after 1995 [
19]. Noticeably, the Three Gorges Reservoir, with a total storage capacity of 39.3 billion m
3, began to operate in 2003. For more information about the distribution of major reservoirs in the Yangtze River basin, refer to Wang et al. [
20].
This study selected four flow gauging stations (
Table 1), namely Cuntan, Yichang, Hankou, and Datong, as data-gathering points for analyzing hydrologic changes. The Cuntan station is located upstream from the Gezhouba Dam and the Three Gorges Dam. Located at the confluence of the upper and middle reaches of the Yangtze River, the Yichang station is located 44 km downstream from the Three Gorges Dam and 6 km downstream from the Gezhouba Dam, at a point where the hydrologic regime is directly affected by the cascade reservoirs. The Hankou station is located in the middle reaches, 1.2 km below the confluence of the Yangtze River and its largest tributary, the Hanjiang River. The Datong station is located in the lower reaches, and it occupies a position at which it can monitor the runoff and sediment load from the Yangtze River to the East China Sea. Daily streamflow data for the four stations from 1 January 1955, to 31 December 2013, were collected from the Changjiang Water Resources Commission (China). No data is missing from the streamflow series.
3. Methods
3.1. Indicators of Hydrologic Alteration
The widely used Indicators of Hydrologic Alteration (IHA) contain a total of 33 hydrologic parameters (
Table 2), which are categorized into five groups of hydrologic features [
21]. The five groups consist of the magnitude of monthly water conditions, magnitude and duration of annual extreme water conditions, timing of annual extreme water conditions, frequency and duration of high and low pulses, and rate and frequency of water condition changes. The parameter “number of zero-flow days” is not used in this study because no zero-flow event occurred in the Yangtze River during the study period. Periods during which the daily flow is above the 75th and below the 25th percentile are labeled high and low pulses, respectively. The IHA parameters are calculated using non-parametric (median/percentile) statistics, which are useful because of the skewed (non-normal) nature of many hydrologic datasets. The hydrologic year is defined as lasting from April to March of the following year, according to the hydrologic features of the Yangtze River where the rainy season begins in April. Each IHA parameter is calculated for every hydrologic year and the results are further analyzed by scanning
t-test to reveal multi-scale abrupt behaviors.
3.2. Scanning t-Test
Conventional methods such as the Mann-Kendall and Pettitt tests search for a single abrupt change in a time series. In contrast, the scanning
t-test, which is the Student’s
t-test grafted by the wavelet technique, can detect significant changes in sub-series averages on different time scales within a long time series [
22]. The Student’s
t-test assumes that the time series has a normal distribution; therefore, the IHA data are log-transformed to be normally distributed before the scanning
t-test is applied.
Statistic
is defined as the difference in the sub-sample averages between every two adjoining sub-series with equal sub-series size
, expressed as follows:
where:
where:
serves as the reference time point. The sub-sample size may vary as
, or it may be selected at suitable intervals. The significance level is set as 0.05
. Since the significance level varies with
and
, the test statistic is normalized as follows to make values comparable:
when
, the abrupt change is significant at the 95% confidence level. Meanwhile,
denotes significant increases, and
denotes significant decreases.
3.3. Coherency Analysis
The coherency of abrupt changes between two series is originally defined as follows [
23]:
The coherency of abrupt changes between more than two series
is improved as
Equation (5) yields the same results as Equation (4) when . The series have significant changes in the same direction when , and they have significant changes in opposite (increasing or decreasing) directions when .
4. Results
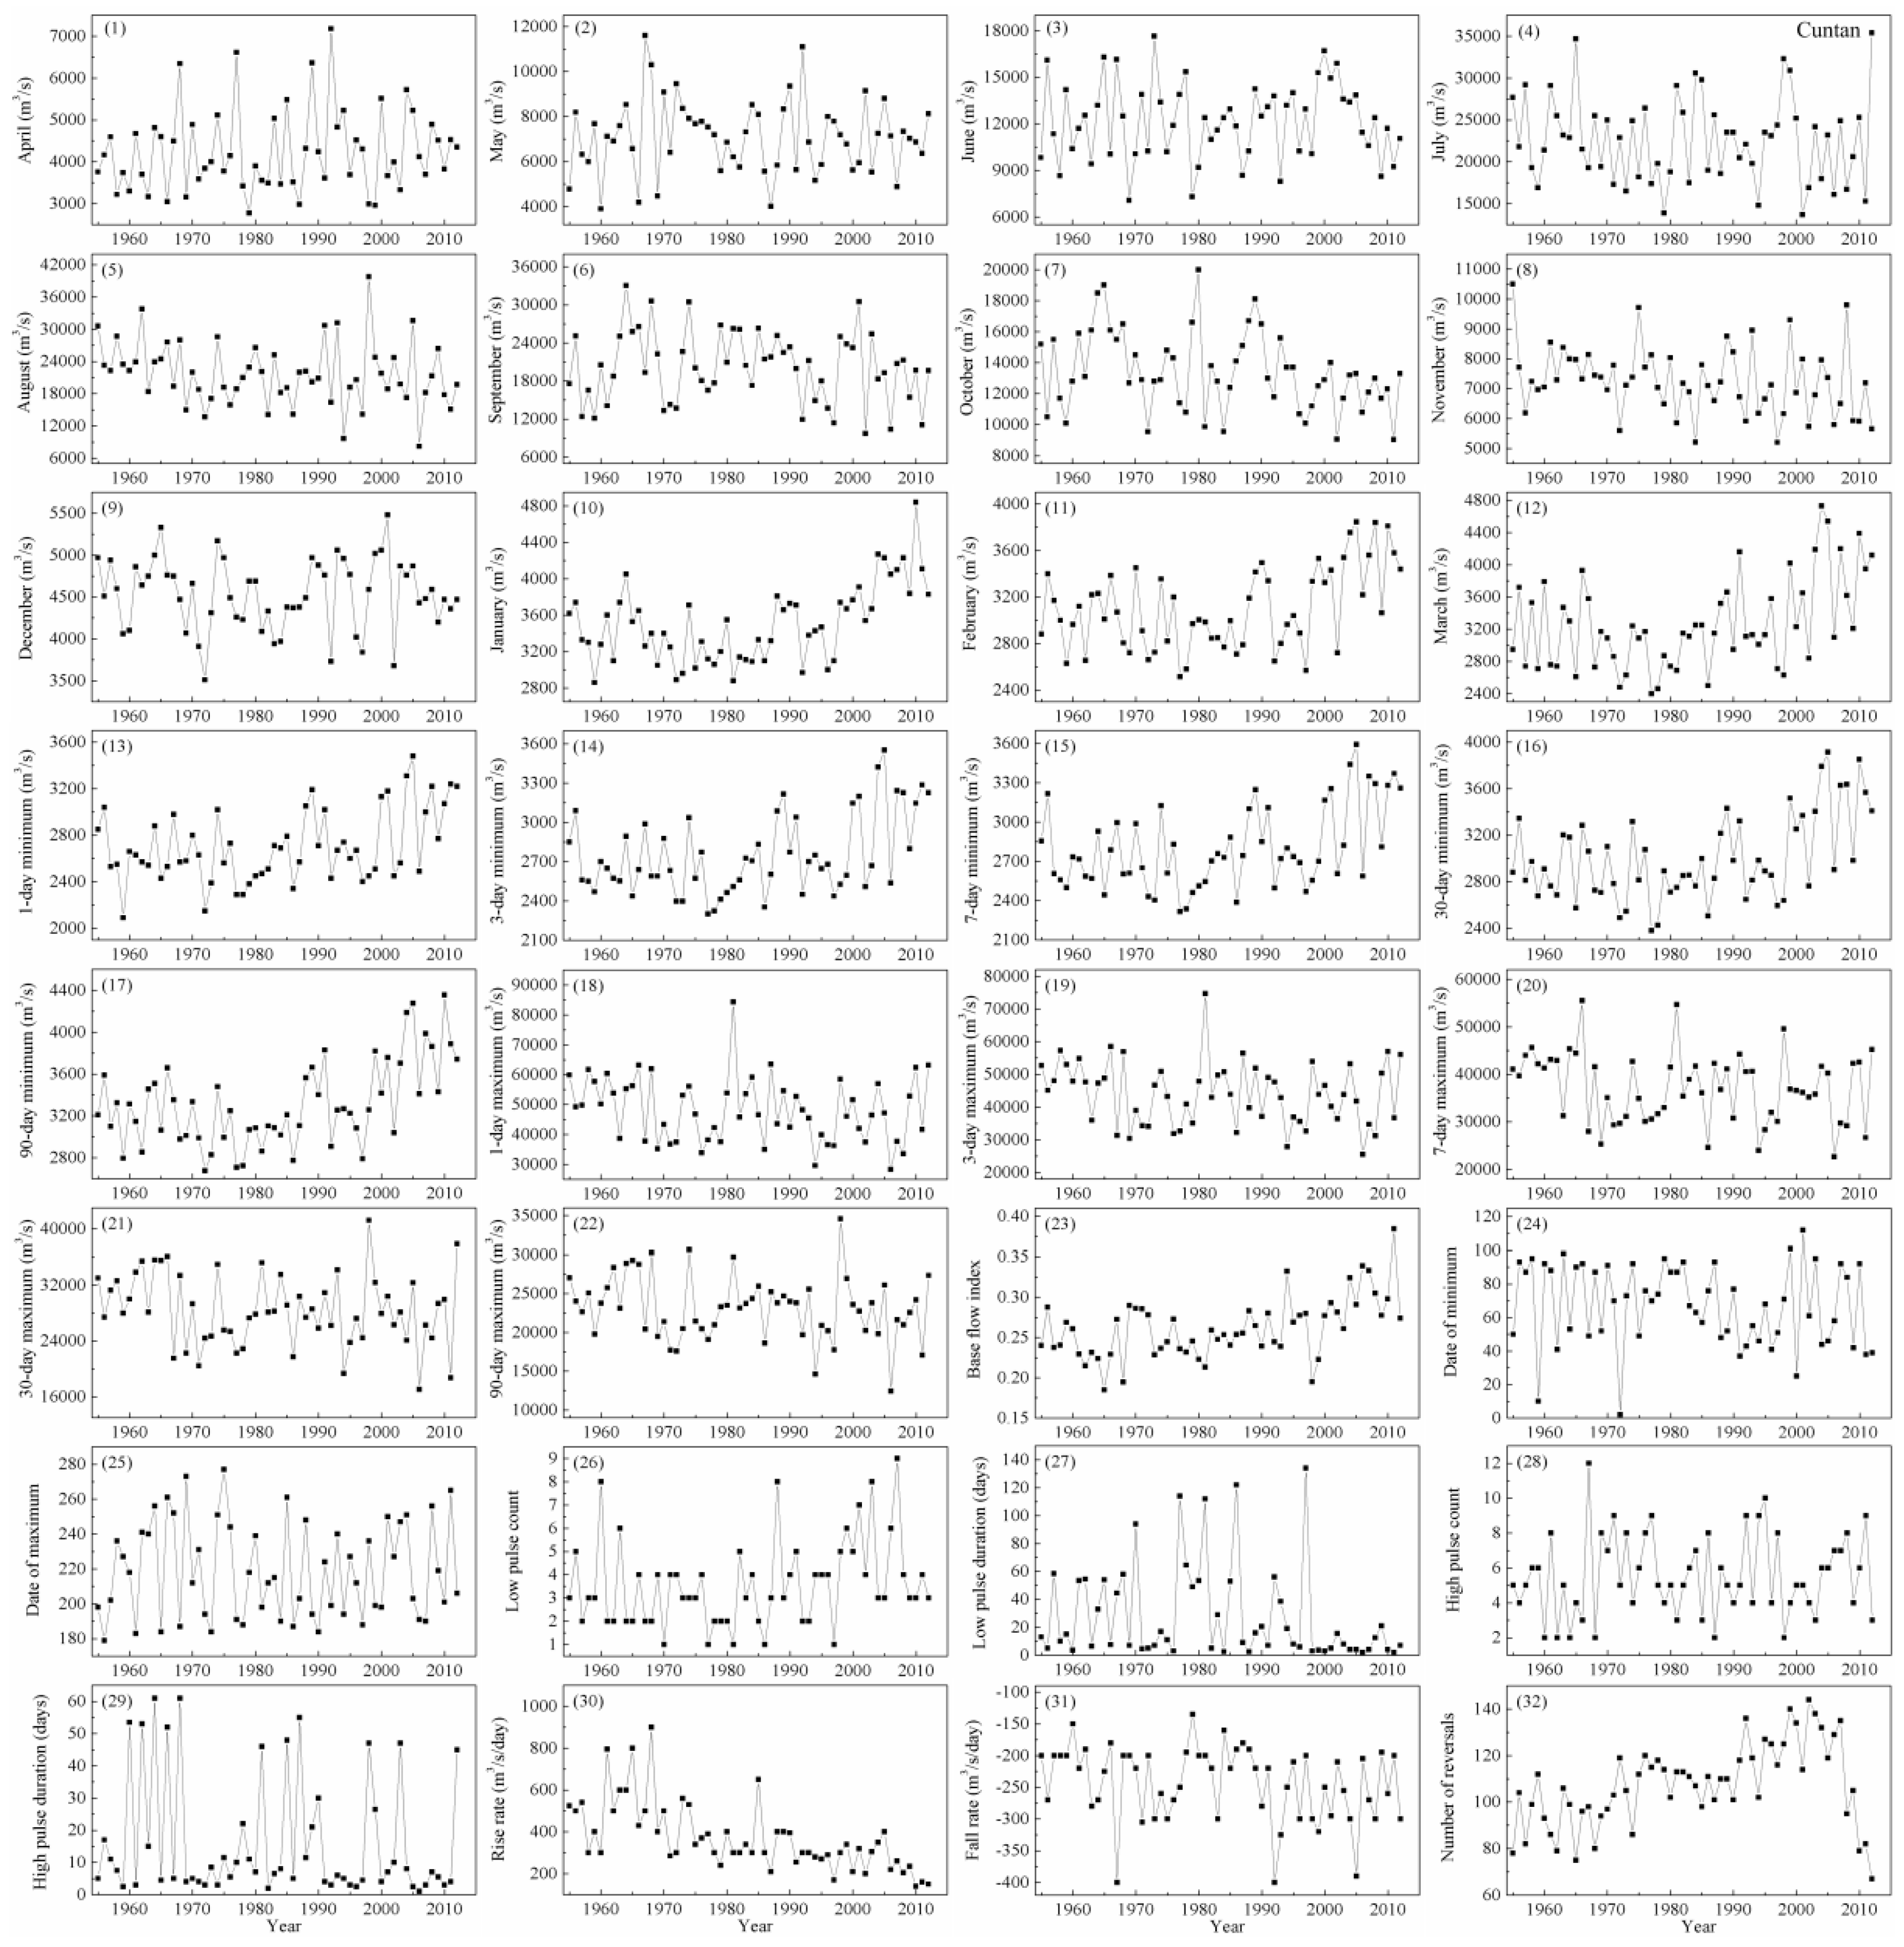
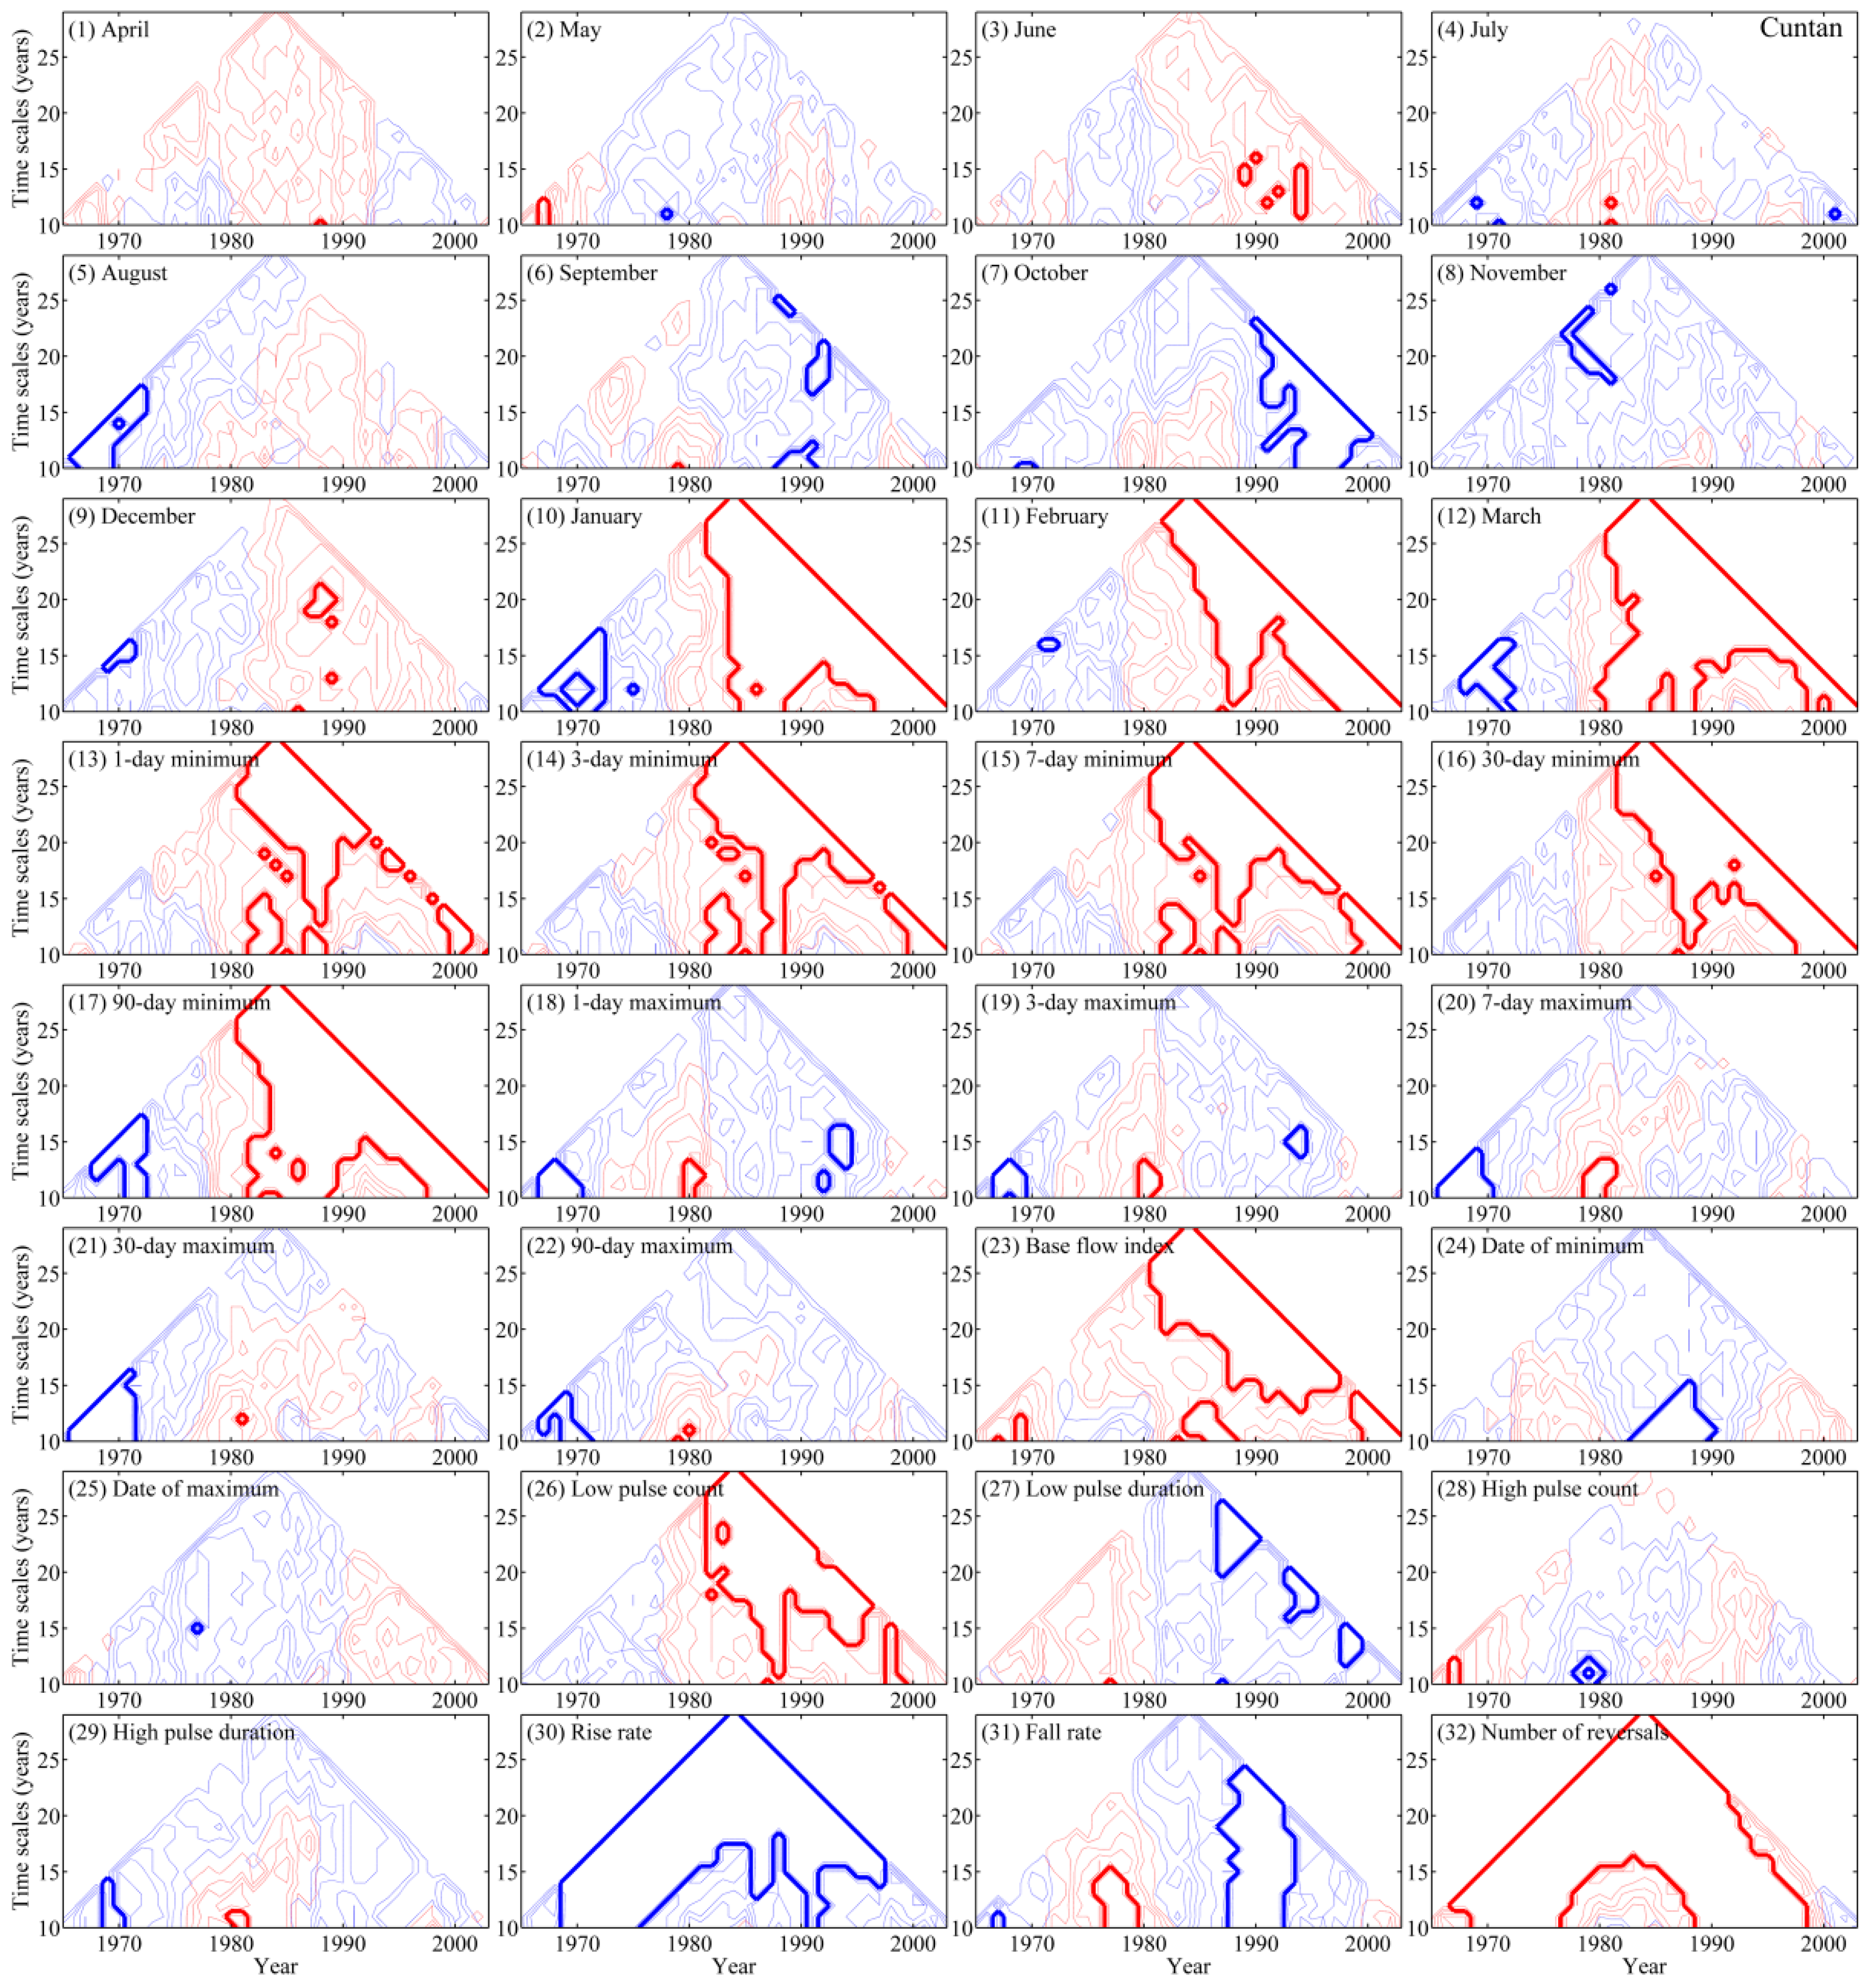
4.1. Changes in Hydrologic Regime at the Cuntan Station
Figure 2 shows the IHA results at the Cuntan station, which are further analyzed by scanning
t-test to reveal multi-scale changes.
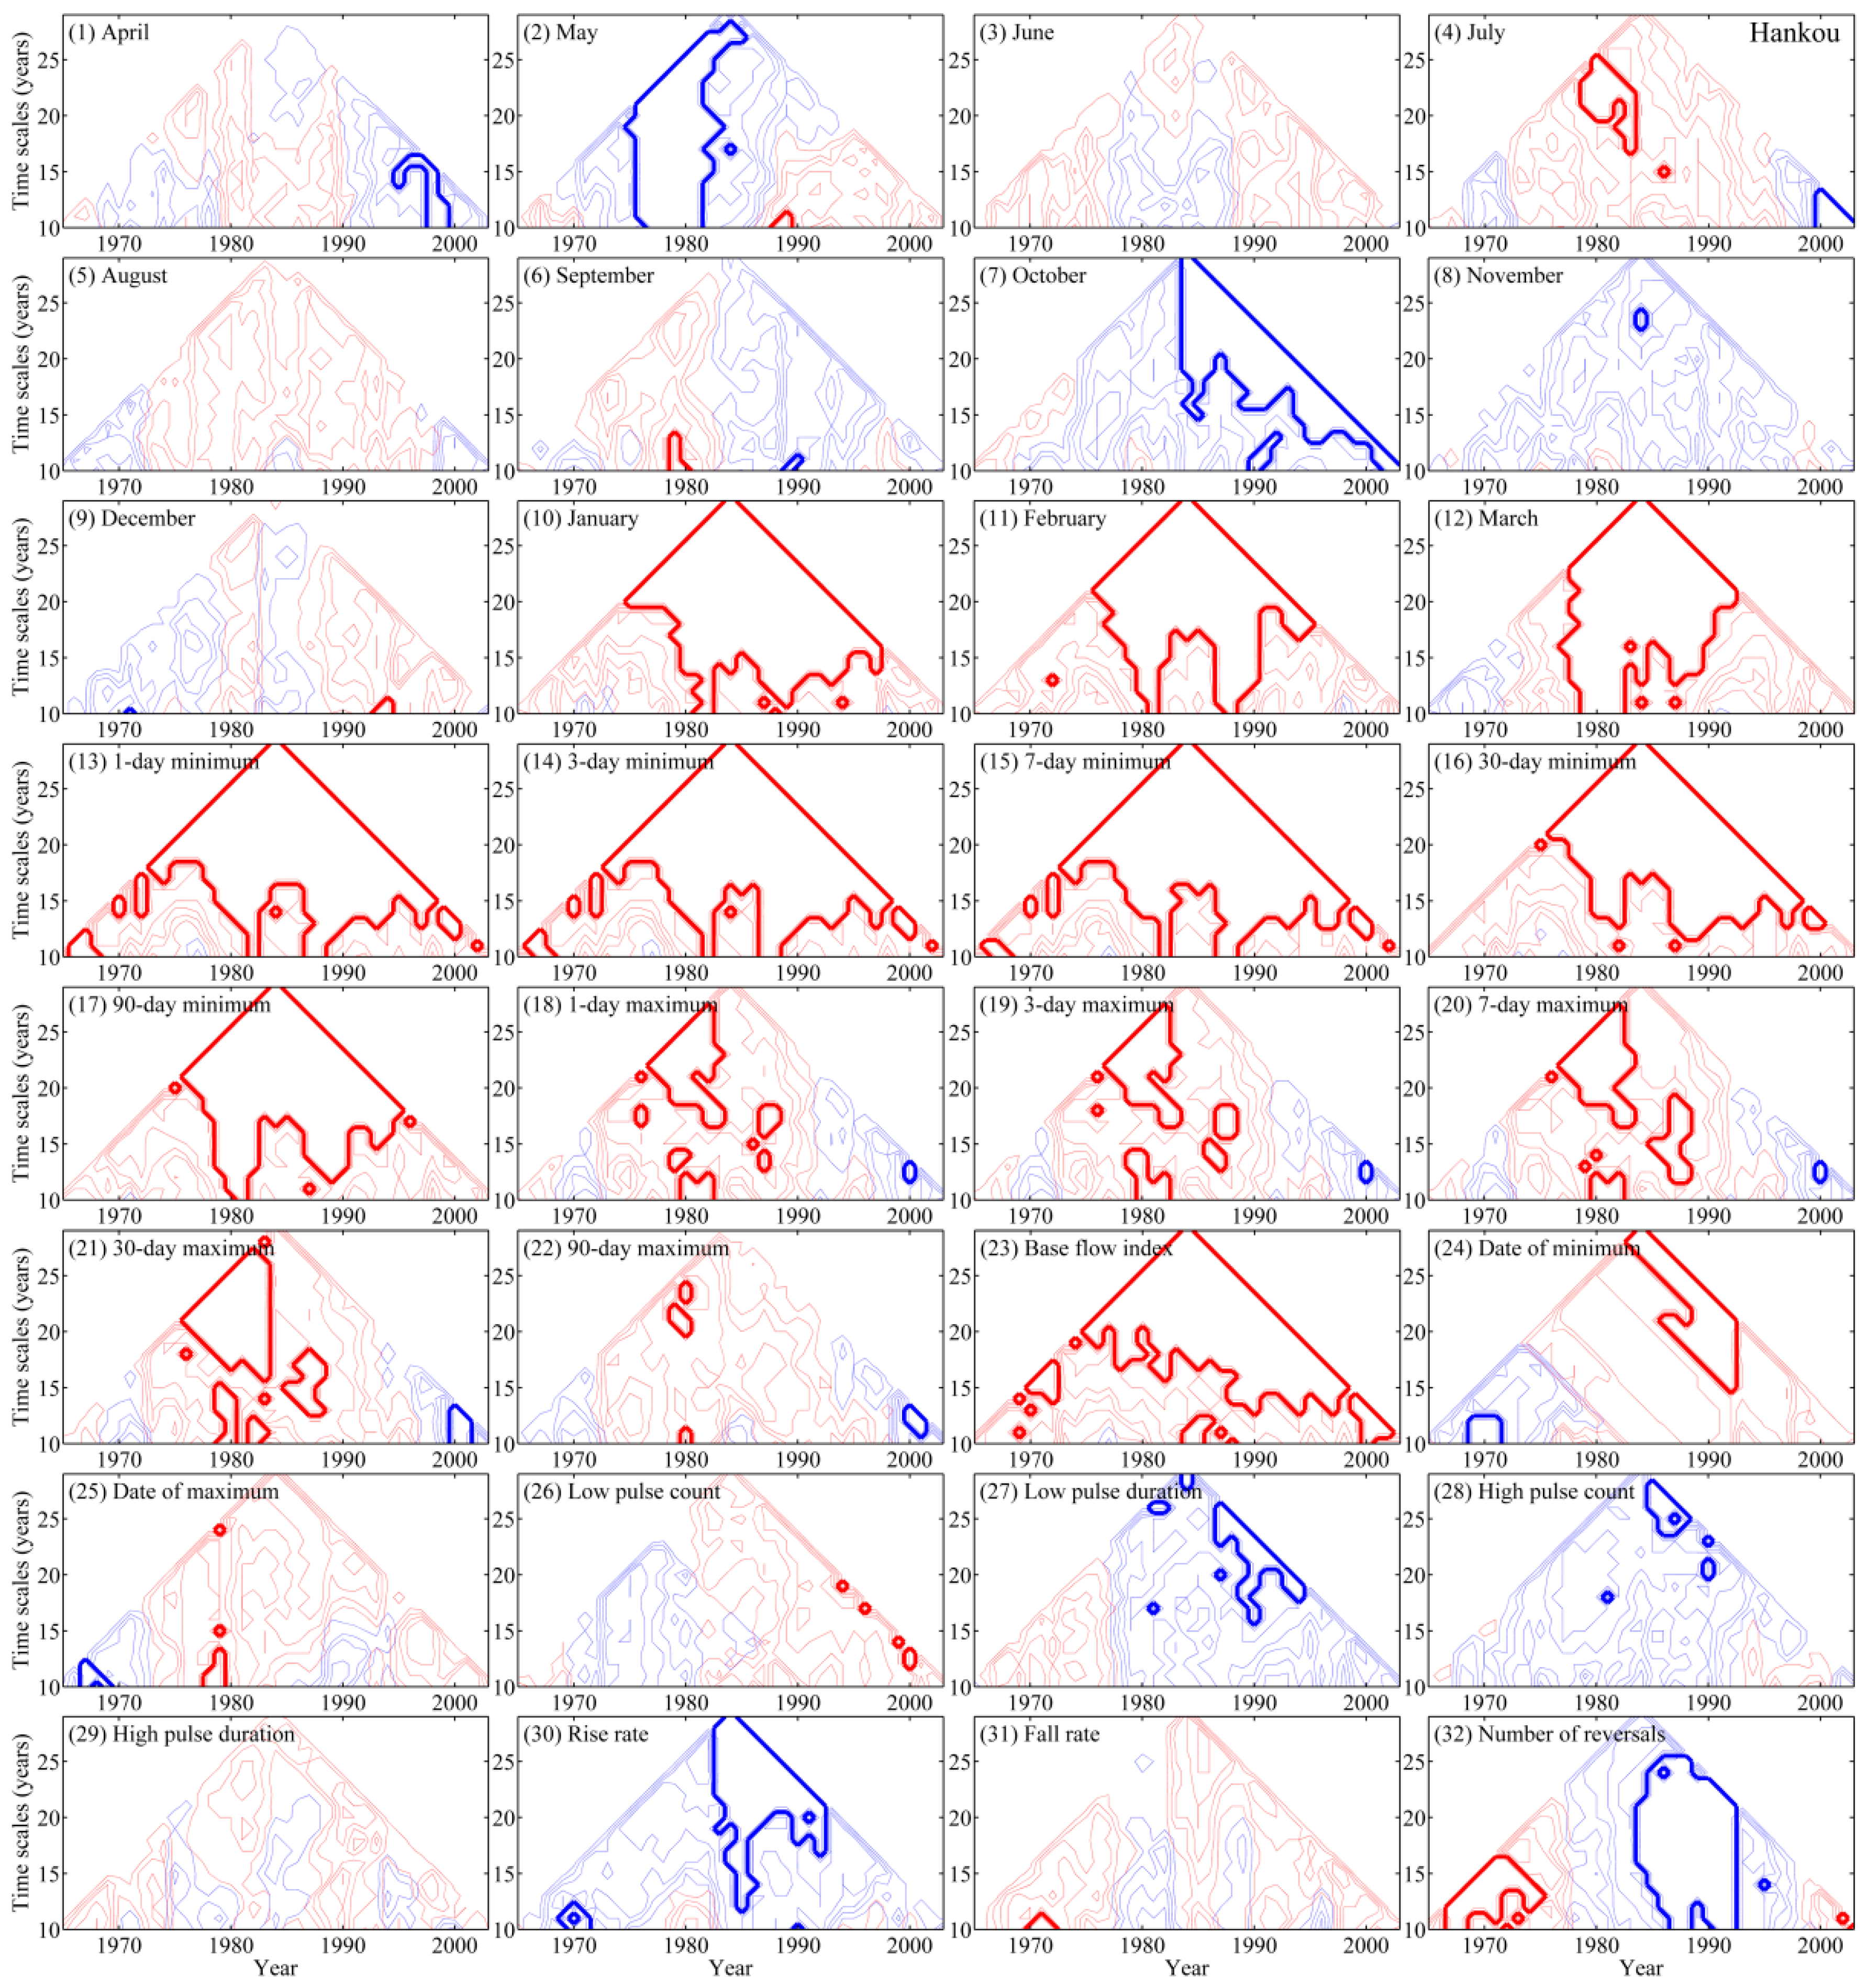
Figure 3 shows multiple changes on different time scales in the hydrologic regime at the Cuntan station. Red lines indicate increasing trends after change points, and blue lines indicate decreasing trends after change points. Thick red and blue lines denote significant change points. The meanings of the line styles are the same for all subsequent figures. The
x-axis denotes the year, and the
y-axis denotes the time scales, in units of years. The time scales and the time at which the change point occurs can be identified by the regions circled with thick red or blue contours.
The change patterns are different across different hydrologic indicators.
Figure 3(1)–(12) display change points for the magnitude of monthly flows. Different change properties for monthly flow can be identified during different time intervals. The tendency of the monthly flow in October is dominated by a decreasing trend. A significant decrease can be detected around 1970 on a short time scale of 10 years. Another significant decrease can be identified around the mid-1990s at all time scales, implying reduced streamflow in October after the change points. Meanwhile, change patterns for monthly flows in January, February, and March are similar. A decreasing tendency dominates before 1980, and an increasing tendency dominates after 1980. For January’s monthly flow, a significant reduction can be detected around 1970 at all time scales. Significant increases appear in both the mid-1980s and 2000, at time scales below 15 years. Regions at time scales above 15 years after the mid-1980s are characterized by a significant increasing trend. For the monthly flows of the remaining months, including April through September as well as November and December, significant change points are distributed sporadically within time scales versus time space.
Figure 3(13)–(23) portray multiple abrupt behaviors in the magnitude and duration of annual extreme water conditions at the Cuntan station. Change patterns of the low-flow indicators are similar, including the 1-day minimum, 3-day minimum, 7-day minimum, 30-day minimum, 90-day minimum, and base flow index. The low-flow indicators increase significantly after 1980 at time scales greater than 20 years. Change characteristics at time scales of less than 15 years are relatively complicated, and two significant increases can be detected around 1985 and 2000. For the high-flow indicators, including the 1-day maximum, 3-day maximum, 7-day maximum, 30-day maximum, and 90-day maximum, no significant change point emerges at time scales greater than 20 years. Increasing and decreasing changes are intermittent in different years at time scales of less than 15 years.
Figure 3(24),(25) show changes in the timing of annual extreme water conditions at the Cuntan station. Change points are distributed sparsely at time scales of less than 15 years, and no significant change is detectable at longer time scales.
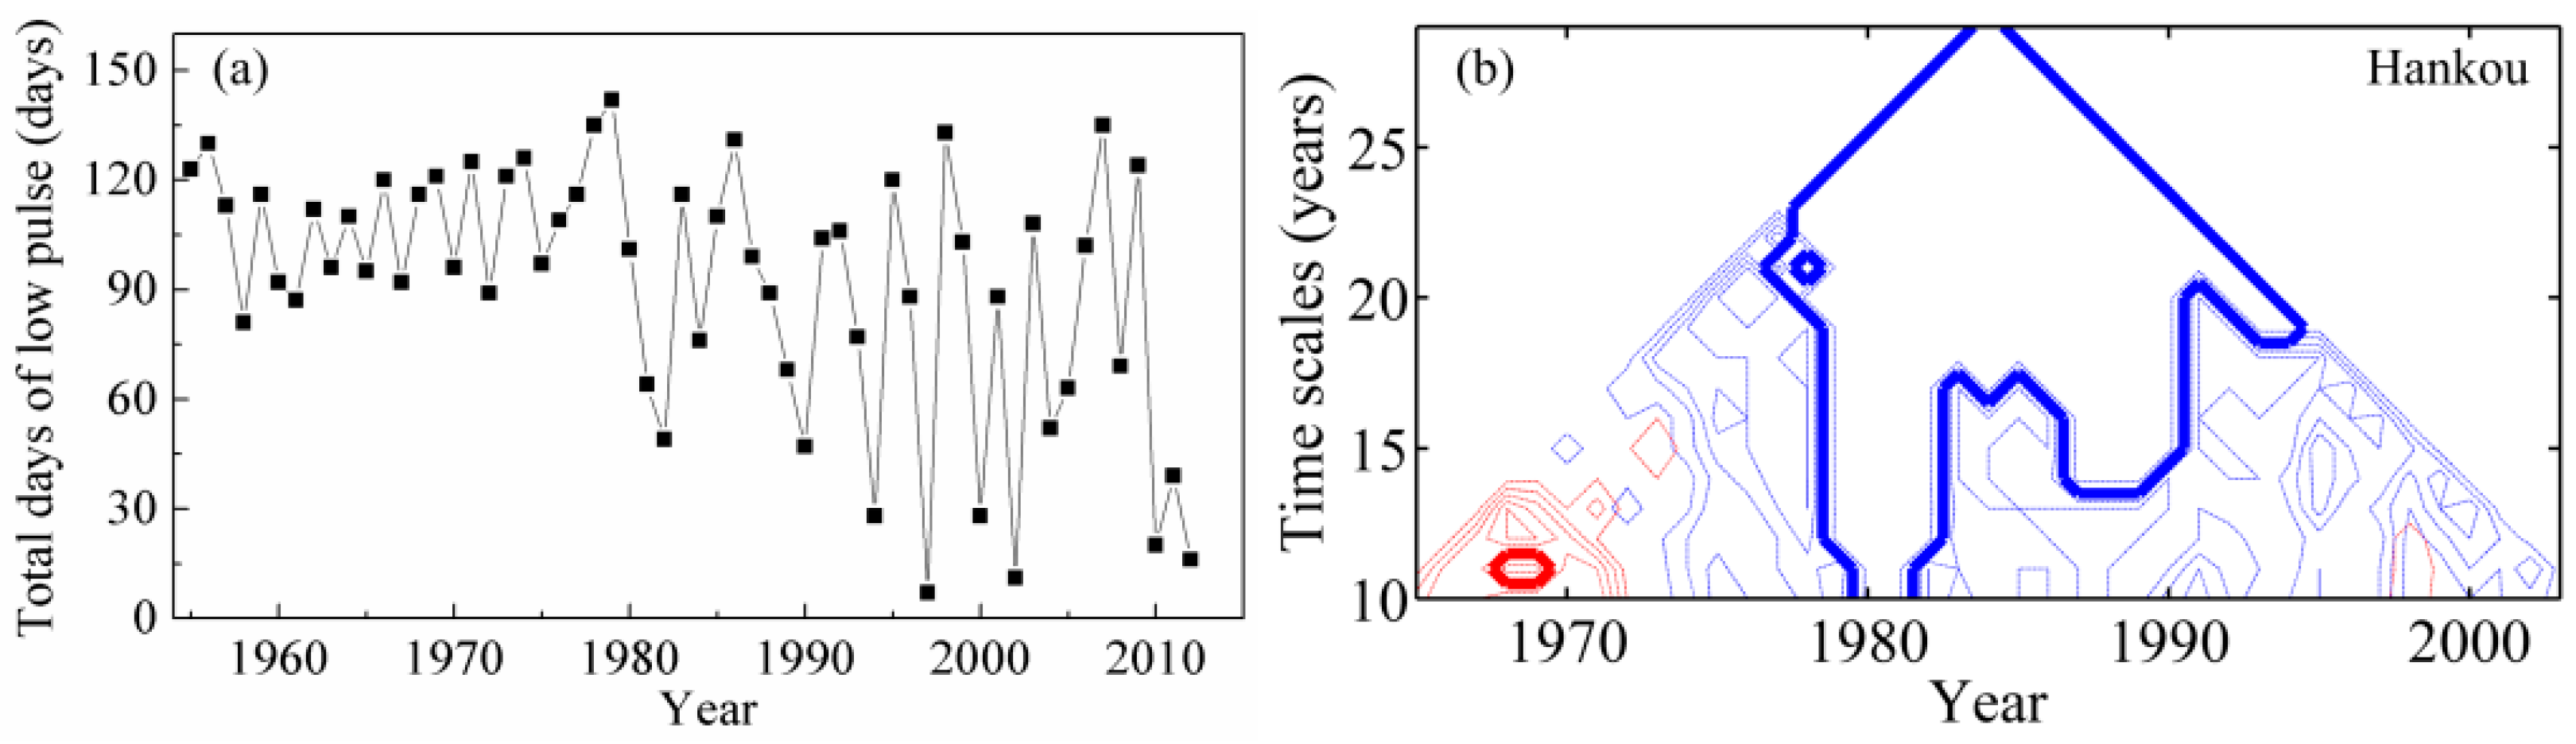
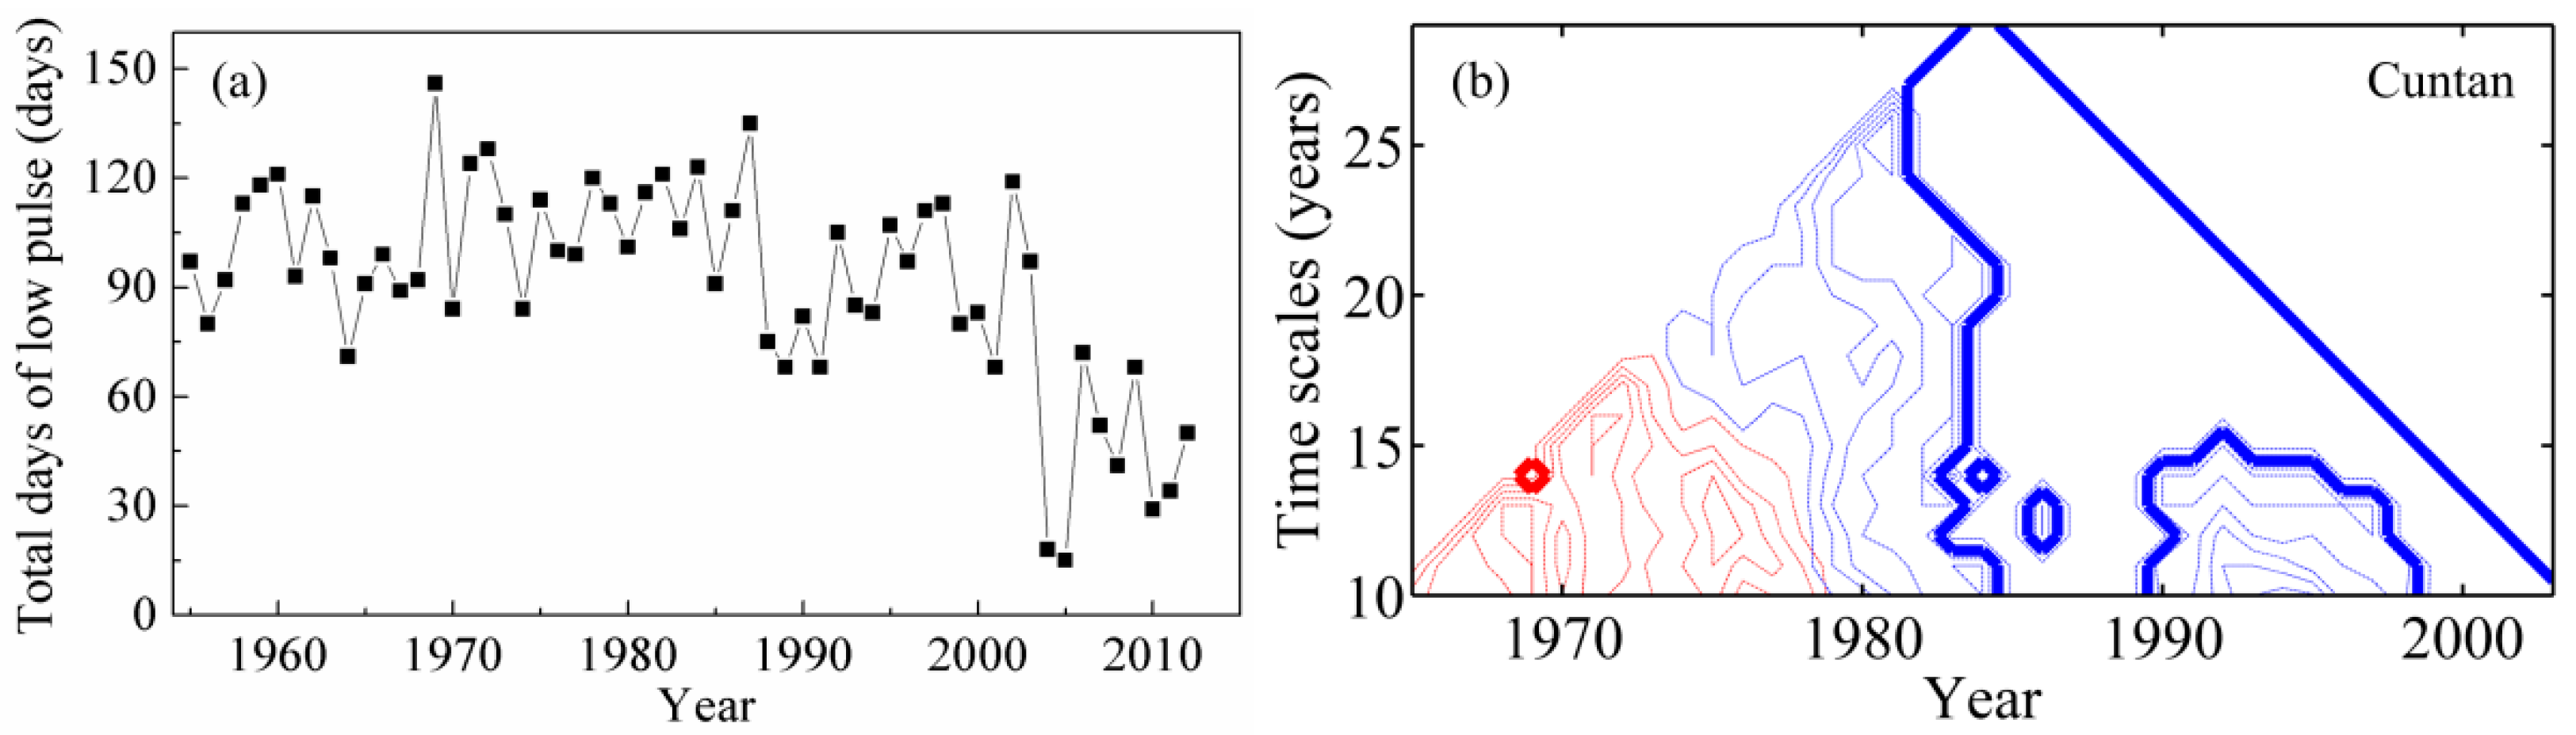
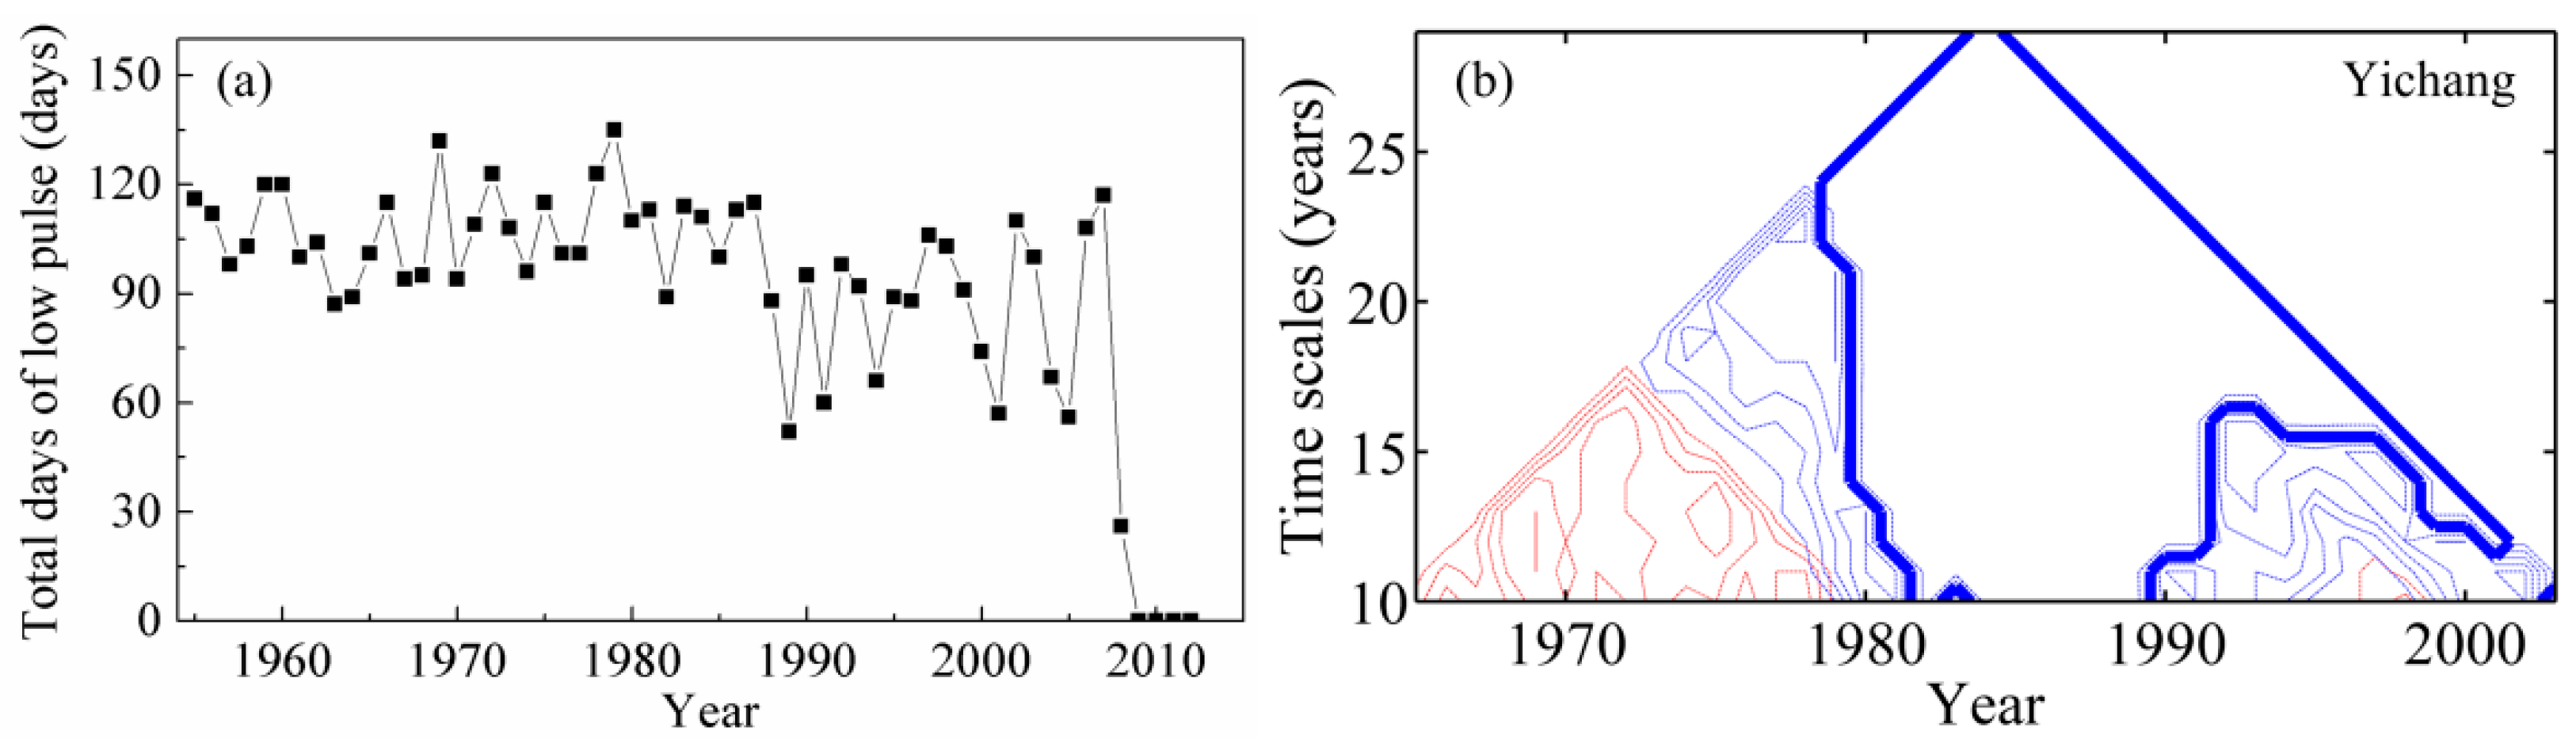
Figure 3(26)–(29) show multi-scale changes in the frequency and duration of high and low pulses. Low pulse count and low pulse duration are also low-flow indicators. After the mid-1980s, the low pulse count experiences an increasing trend, while low pulse duration is characterized by a decreasing trend. A low pulse with a long duration can be disrupted to form several low pulses with short durations, and this may result in a reduction in the total days of low pulses, as shown in
Figure 4. The total days of low pulses decreases after the late 1980s and further decrease after the late 1990s at short time scales of less than 15 years. Regions with longer time scales are dominated by decreasing change points after the late 1980s. High pulse count and high pulse duration are high-flow indicators, which do not dramatically change. Only a few intermittent significant change points can be identified at short time scales.
The last three sub-figures in
Figure 3 show different trends in the rate and frequency of water condition changes. The rise rate is characterized by decreasing changes, and the number of reversals is characterized by increasing changes. The fall rate features intermittent downward and upward trends. Factors affecting the rate and frequency of changes in water conditions are complex, including the intensity and duration of precipitation, land surface, the regulation of river channels, and the influence of reservoirs.
4.2. Changes in Hydrologic Regime at the Yichang Station
The Gezhouba Reservoir is a run-of-river reservoir, and its influences on downstream sediment and flow regimes are limited; in contrast, the effects of the Three Gorges Reservoir are prominent due to its large storage capacity [
14,
24]. Any differences between the changes in hydrologic regimes at the Yichang and Cuntan stations should be mainly attributable to the streamflow from the tributaries located between the two stations, the storage capacity of the river channel between the two stations, and the influence of the Three Gorges Reservoir.
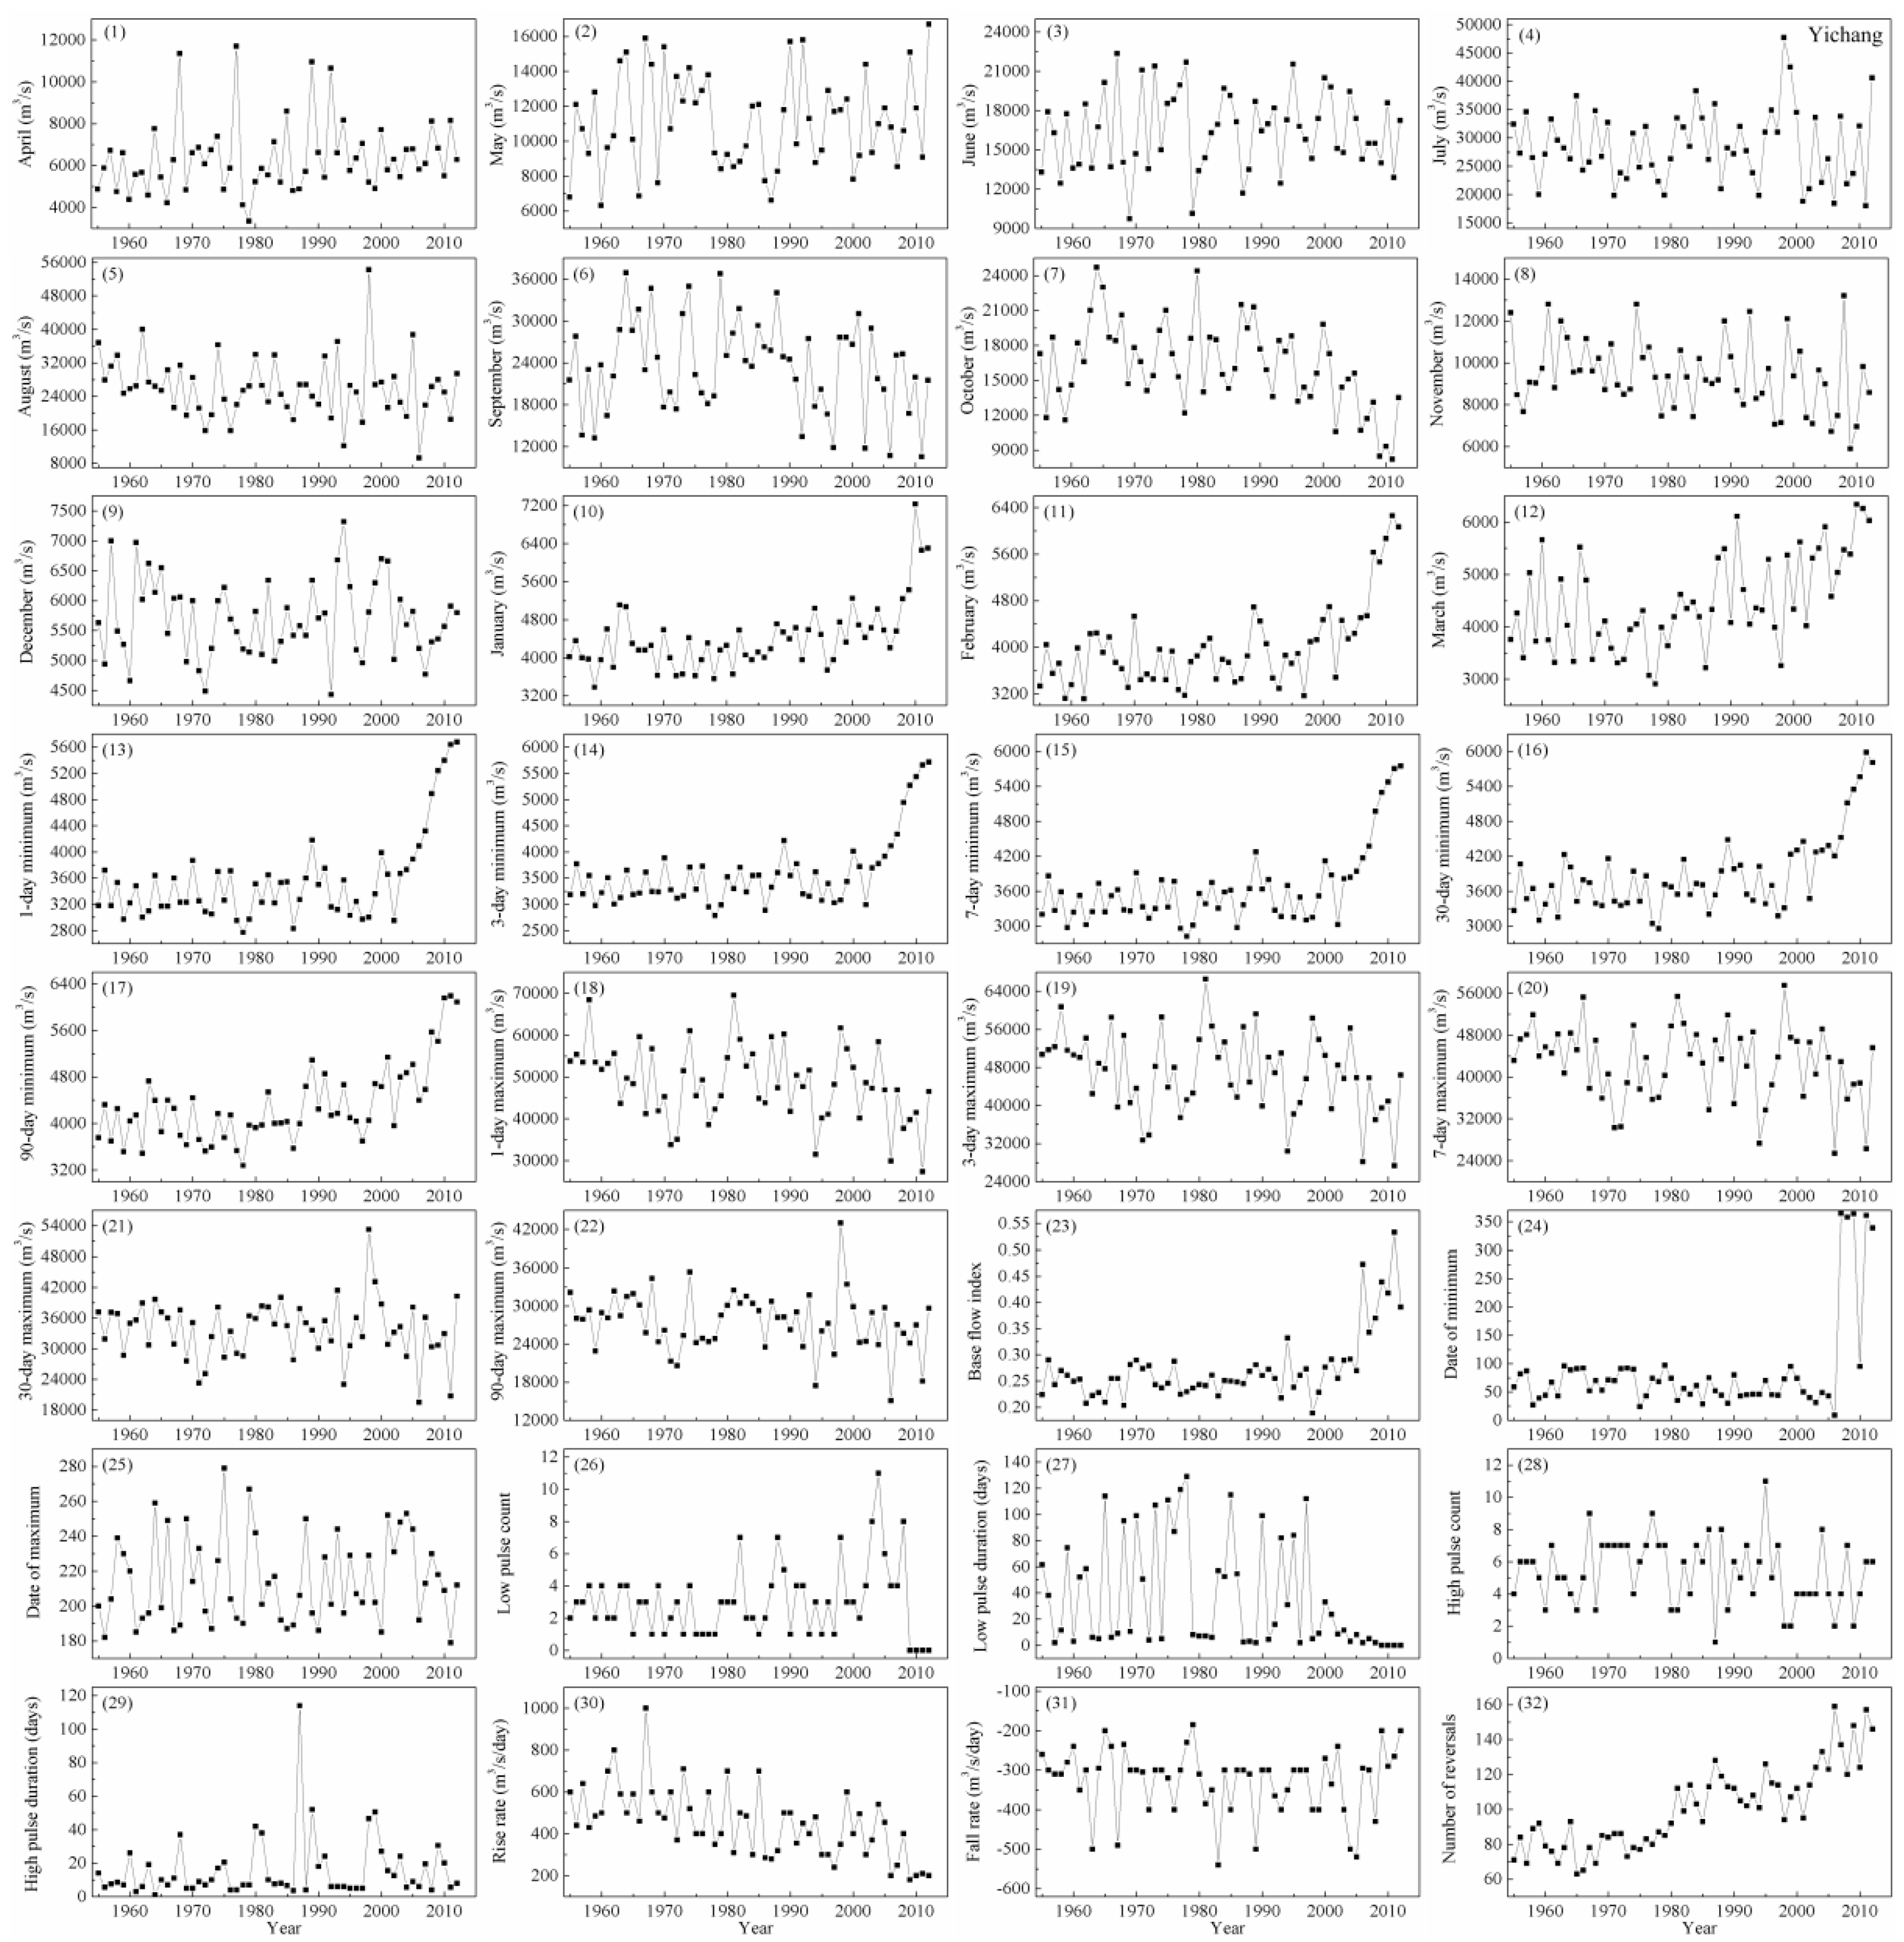
IHA results for the Yichang station are shown in
Figure 5, and the change points of the hydrologic regime on different time scales are shown in
Figure 6. Some obvious changes can be observed in the monthly flow series. The monthly flow in September exhibits a significant reduction after 1990. Similarly, the monthly flow in October shows signs of a significant reduction after the late 1990s. No significant change point is identifiable after 2000 in the monthly flow for October at the Cuntan station. Therefore, any streamflow reduction after 2000 at the Yichang station can be attributed to the impoundment of the Three Gorges Reservoir. Comparatively, patterns in the distribution of change points for the monthly flows from January through March at the Yichang station are in approximate agreement with those at the Cuntan station.
The low-flow indicators for the magnitude and duration of annual extreme water conditions are characterized by an increasing trend, especially after 2000. No significant change is detected in the date of maximum, while an obvious change can be found in the date of minimum. Both decreases and increases in the date of minimum imply that the 1-day annual minimum flow occurs earlier. The data show that the 1-day annual minimum flow usually occurs between January and March in years before 2006, while it occurs in December in the last year after 2006, implying an earlier date than in previous years (
Figure 5(24)). Low pulse count and low pulse duration are characterized by upward and downward trends, respectively, after 1980.
Figure 7 shows the changes in the total days of low pulses at the Yichang station. The total low-pulse days decrease after the late 1980s and further decrease after 2000. The rise rate is characterized by a downward change, and the number of reversals is characterized by an upward change. The fall rate remains relatively stable, and sparse change points can be detected.
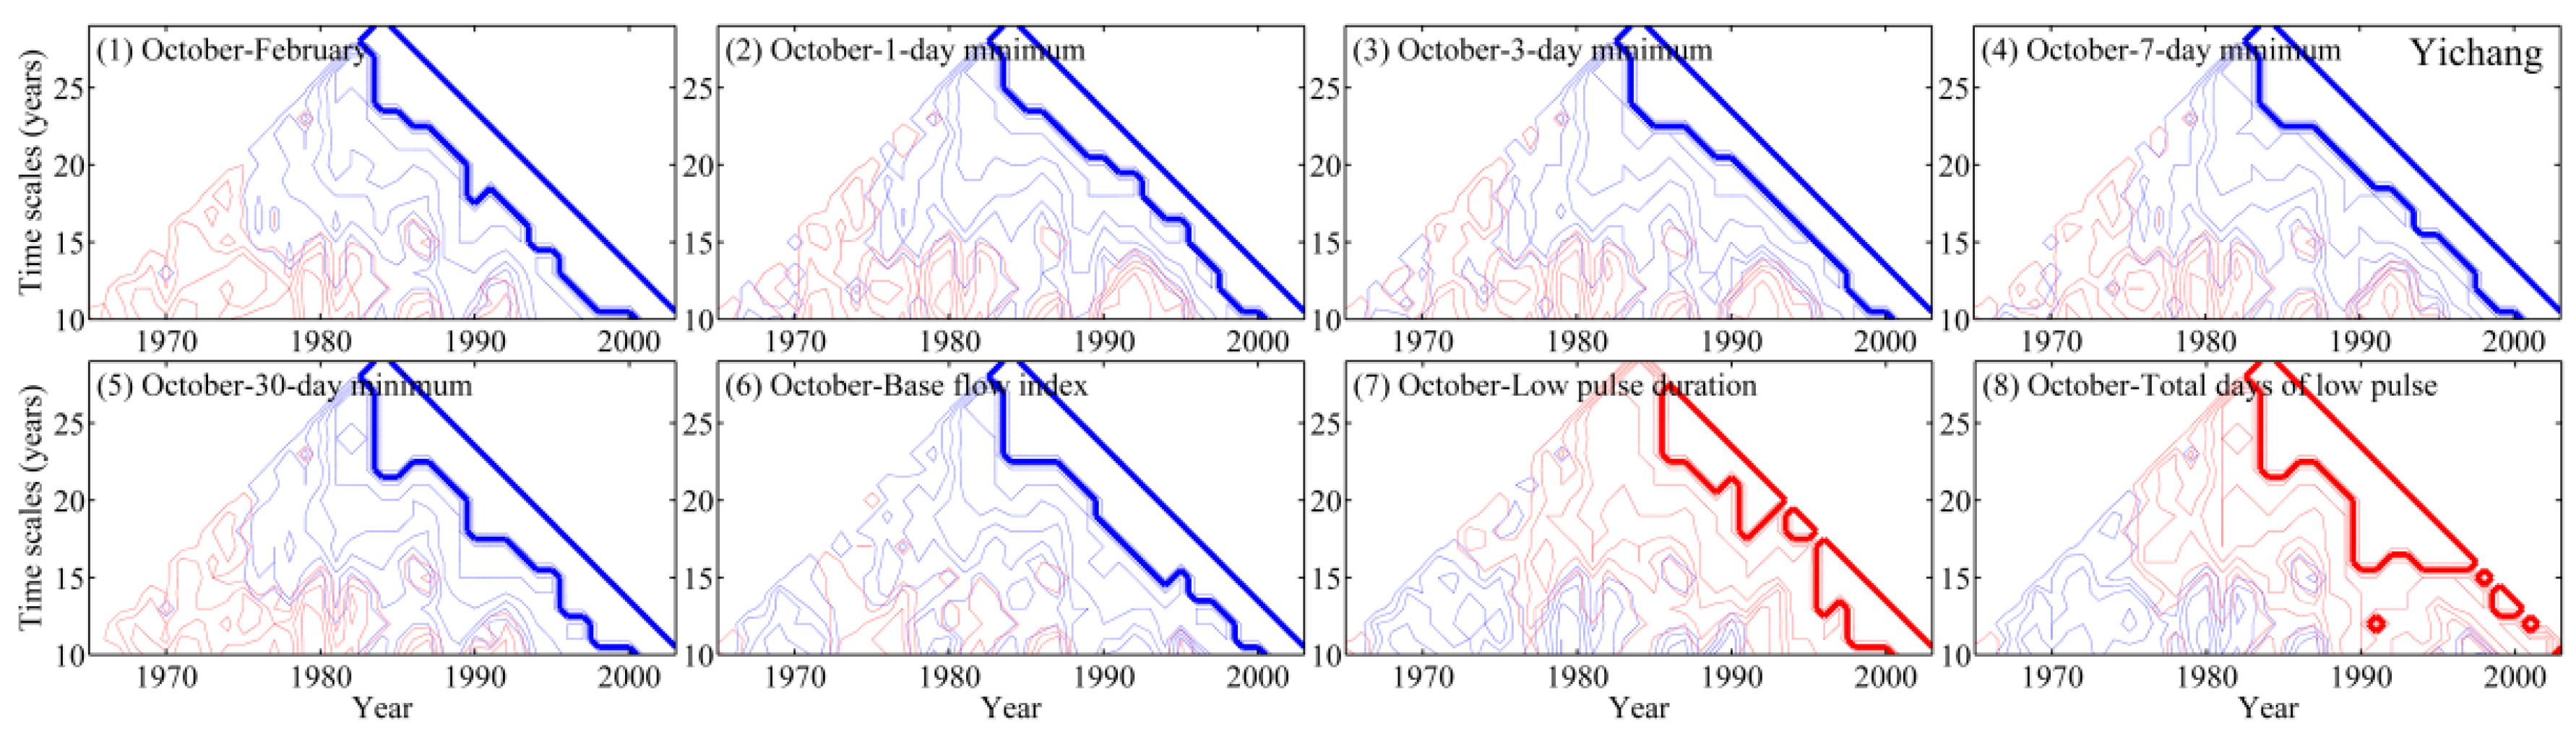
The distribution of significant change points for October’s monthly flow is similar to that of the low-flow indicators, like the monthly flow in February, annual extreme low water conditions, base flow index, low pulse duration, and total days of low pulses.
Figure 8 displays the coherency between October’s monthly flow and the low-flow indicators. Red lines show positive correlations, and blue lines indicate negative correlations. Thick lines denote significance. The coherency analysis reveals significant negative correlations between the monthly flow in October and the monthly flow in February, 1-day minimum flow, 3-day minimum flow, 7-day minimum flow, 30-day minimum flow, and base flow index after 2000 at time scales of less than 15 years. The coherency analysis also reveals significant positive correlations between the monthly flow in October and both low pulse duration and total days of low pulses at time scales of less than 15 years. The hydrologic regime at the Yichang station is affected directly by the Three Gorges Reservoir, which stores water in October and supplies water in the dry season. The coherency analysis reveals the influence of the Three Gorges Reservoir on the downstream hydrologic regime.
4.3. Changes in Hydrologic Regime at the Hankou Station
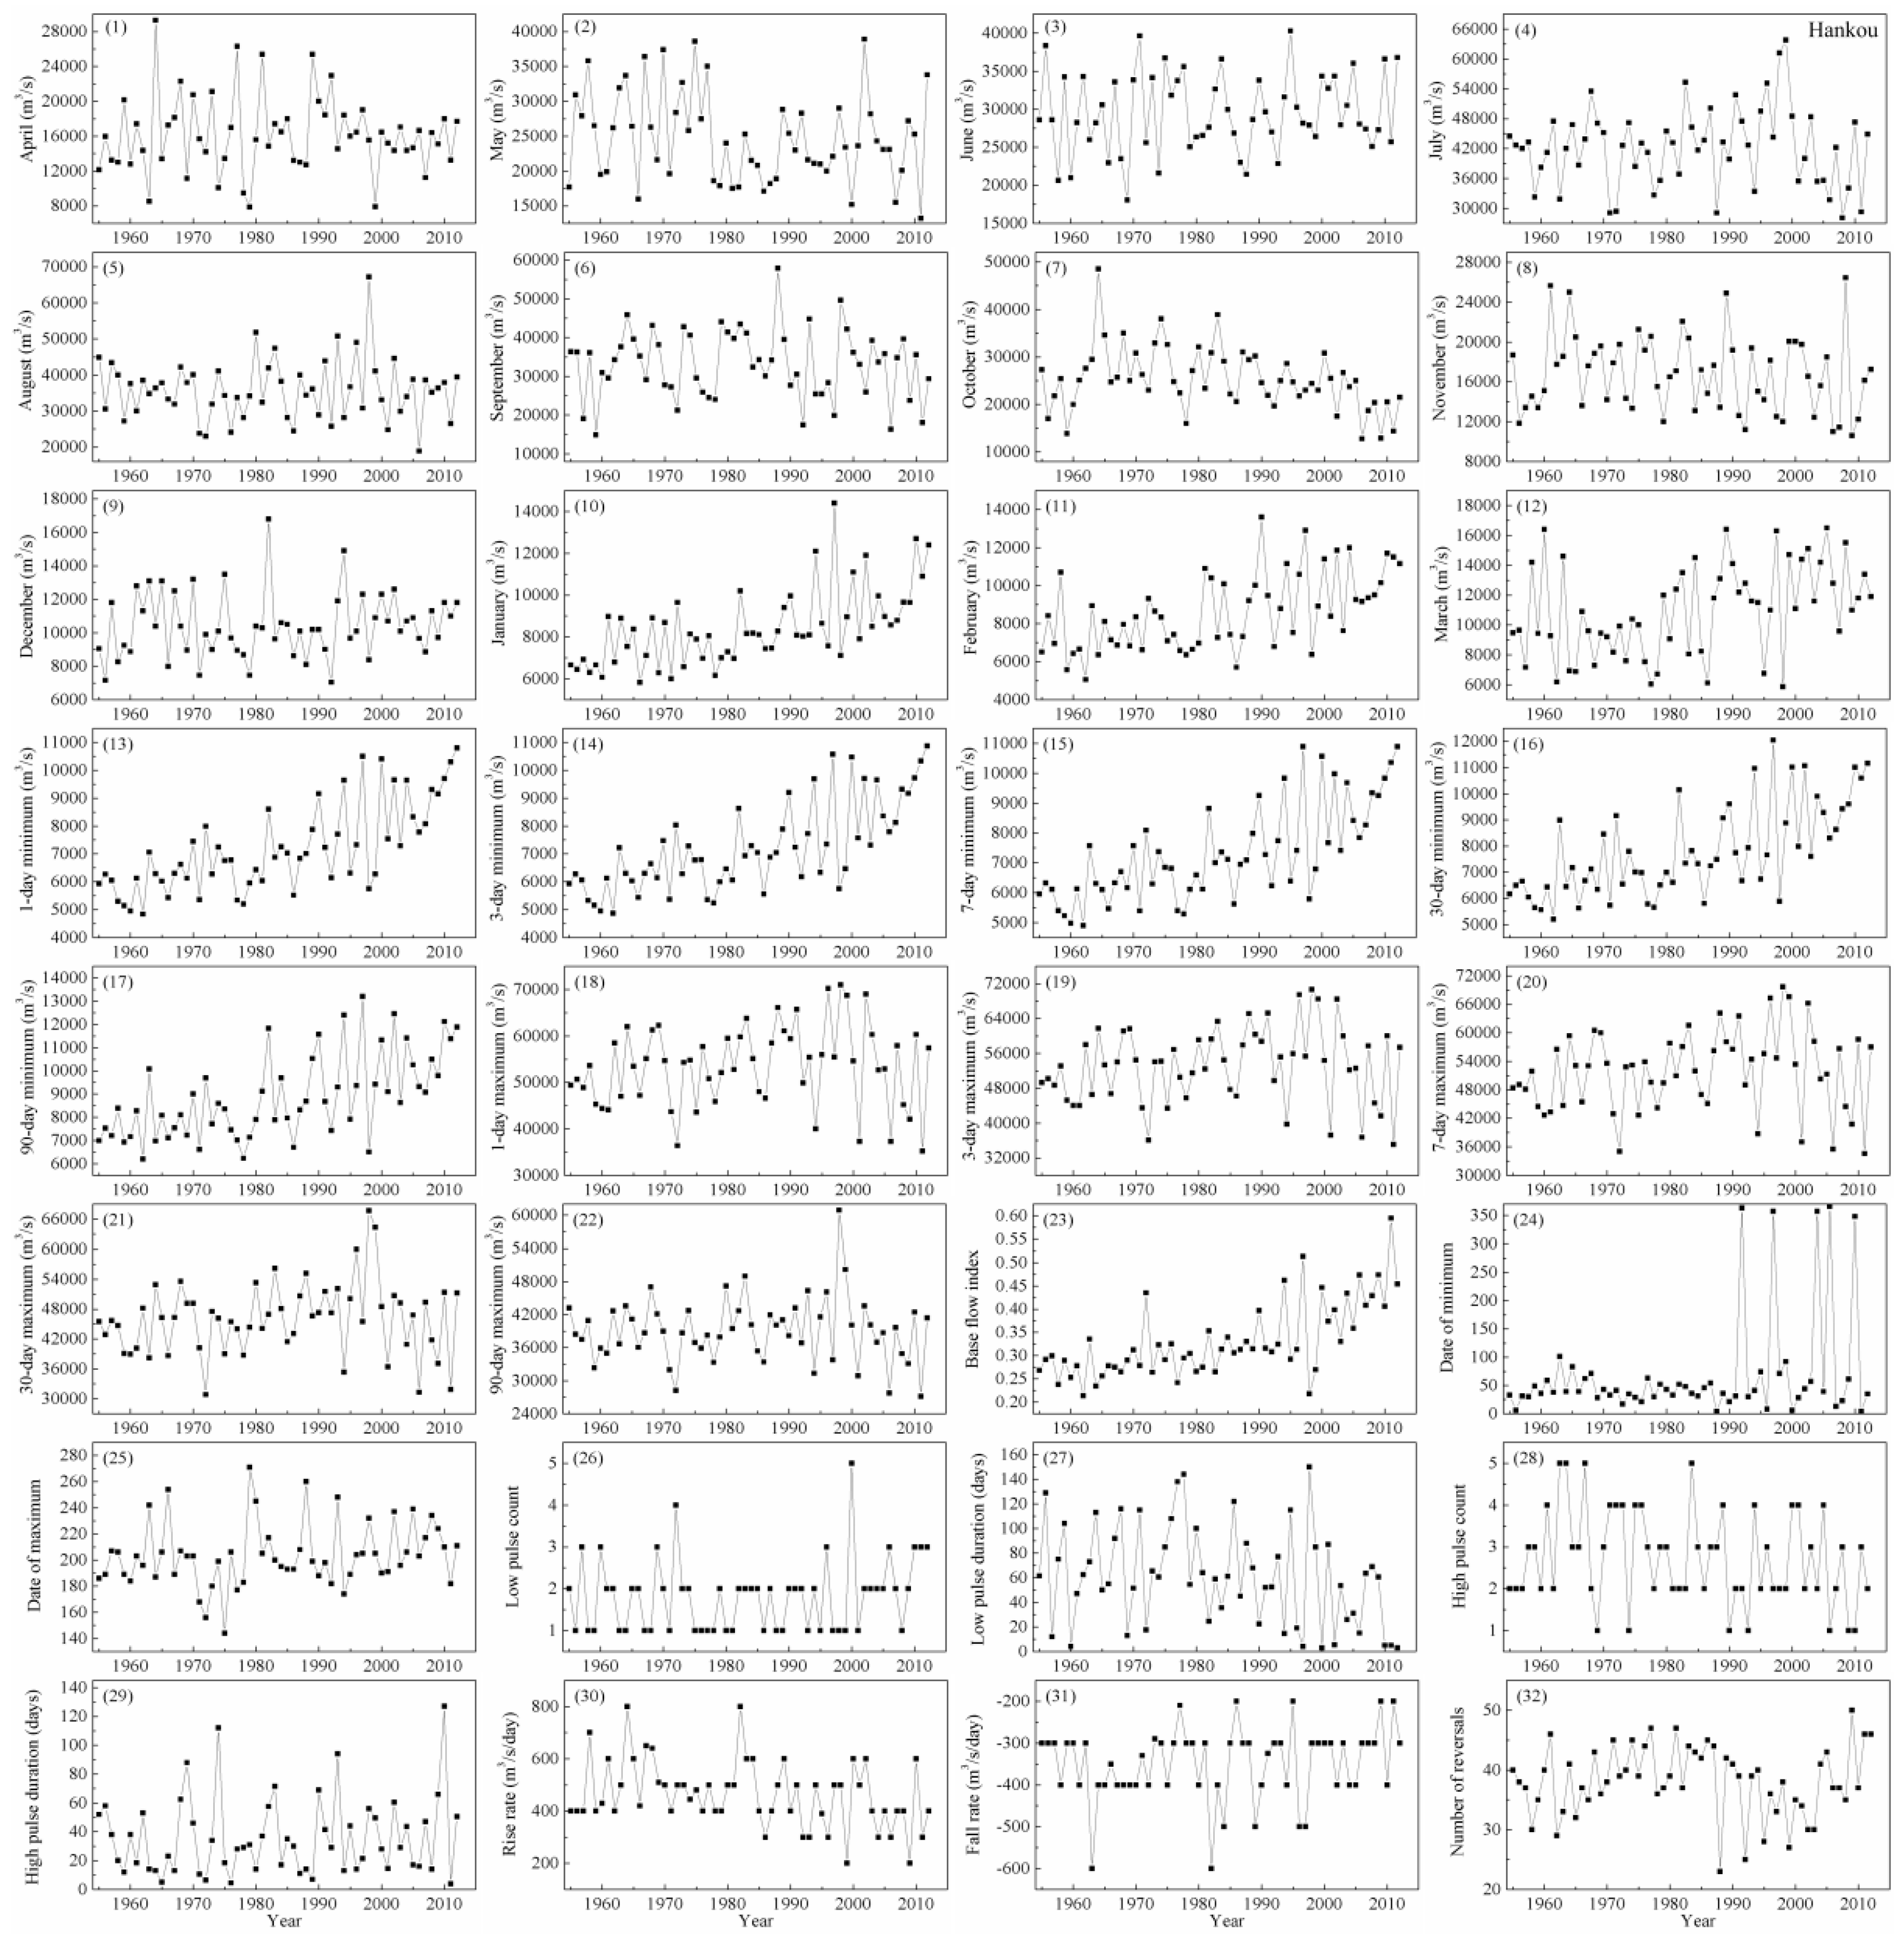
Differences in patterns of hydrologic changes at the Hankou station, in contrast to those at the Yichang station, are mainly caused by the streamflow from the Hanjiang River, runoff regulation at the Dongting Lake, and the river channels between the Yichang and Hankou stations. IHA results for the Hankou station are shown in
Figure 9, and multiple changes in the hydrologic regime on different time scales are shown in
Figure 10. A significant reduction in April’s monthly flow can be detected in the late 1990s at all time scales. For the monthly flow in May, significant decreases can be detected around 1980 at all time scales, and significant increases can be detected in the late 1980s at a time scale of 10 years. No significant change point is identifiable in the monthly flows for June and August. For July’s monthly flow, a significant increase is identified around 1980 at time scales exceeding 15 years, and a significant decrease is identified after 2000 at shorter time scales. The tendency of the monthly flow in October is dominated by a downward trend, while the tendency of the monthly flow between January and March is characterized by an upward trend. Some sporadic significant change points can also be detected in the monthly flow of the other months, implying flow fluctuations at different time scales.
For the magnitude and duration of annual extreme water conditions, the low-flow indicators are characterized by increasing trends. For the high-flow indicators, significant increasing change points are detected in the 1980s at different time scales, and significant decreasing change points are detected in 2000 at a time scale of about 12 years. For the date of minimum, a significant decrease at time scales of less than 12 years is detected around 1970, while a significant increase at time scales exceeding 15 years is found around 1990. As stated in
Section 4.2, both the decrease and increase of the date of minimum imply that the 1-day annual minimum flow occurs earlier. The 1-day annual minimum flow usually occurs between January and March before 1990 and sometimes occurs in December of the last year after 1990, indicating an earlier date than in previous years (
Figure 9(24)). For the date of maximum, positive changes imply that the 1-day annual maximum flow occurs earlier, while negative changes imply that the 1-day annual maximum flow occurs later. The late 1960s and 1970s feature a significant decrease and increase, respectively, at time scales of less than 12 years.
Some significant positive changes appear in low pulse count, and some significant negative changes are found in low pulse duration.
Figure 11 charts the changes in total days of low pulses at the Hankou station. A significant reduction in the total days of low pulses can be detected in 1980 at all time scales. High pulse count is characterized by a decreasing trend in the late 1980s at time scales larger than 20 years, and no significant change affects high pulse duration. The tendency of the rise rate is dominated by a decreasing trend. For the fall rate, a significant positive change point at time scales of 10 years is only detected in 1970, with no change point occurring after that time. Two primary changes are detected in the number of reversals, a significant increase after 1970 and a significant decrease after 1990.
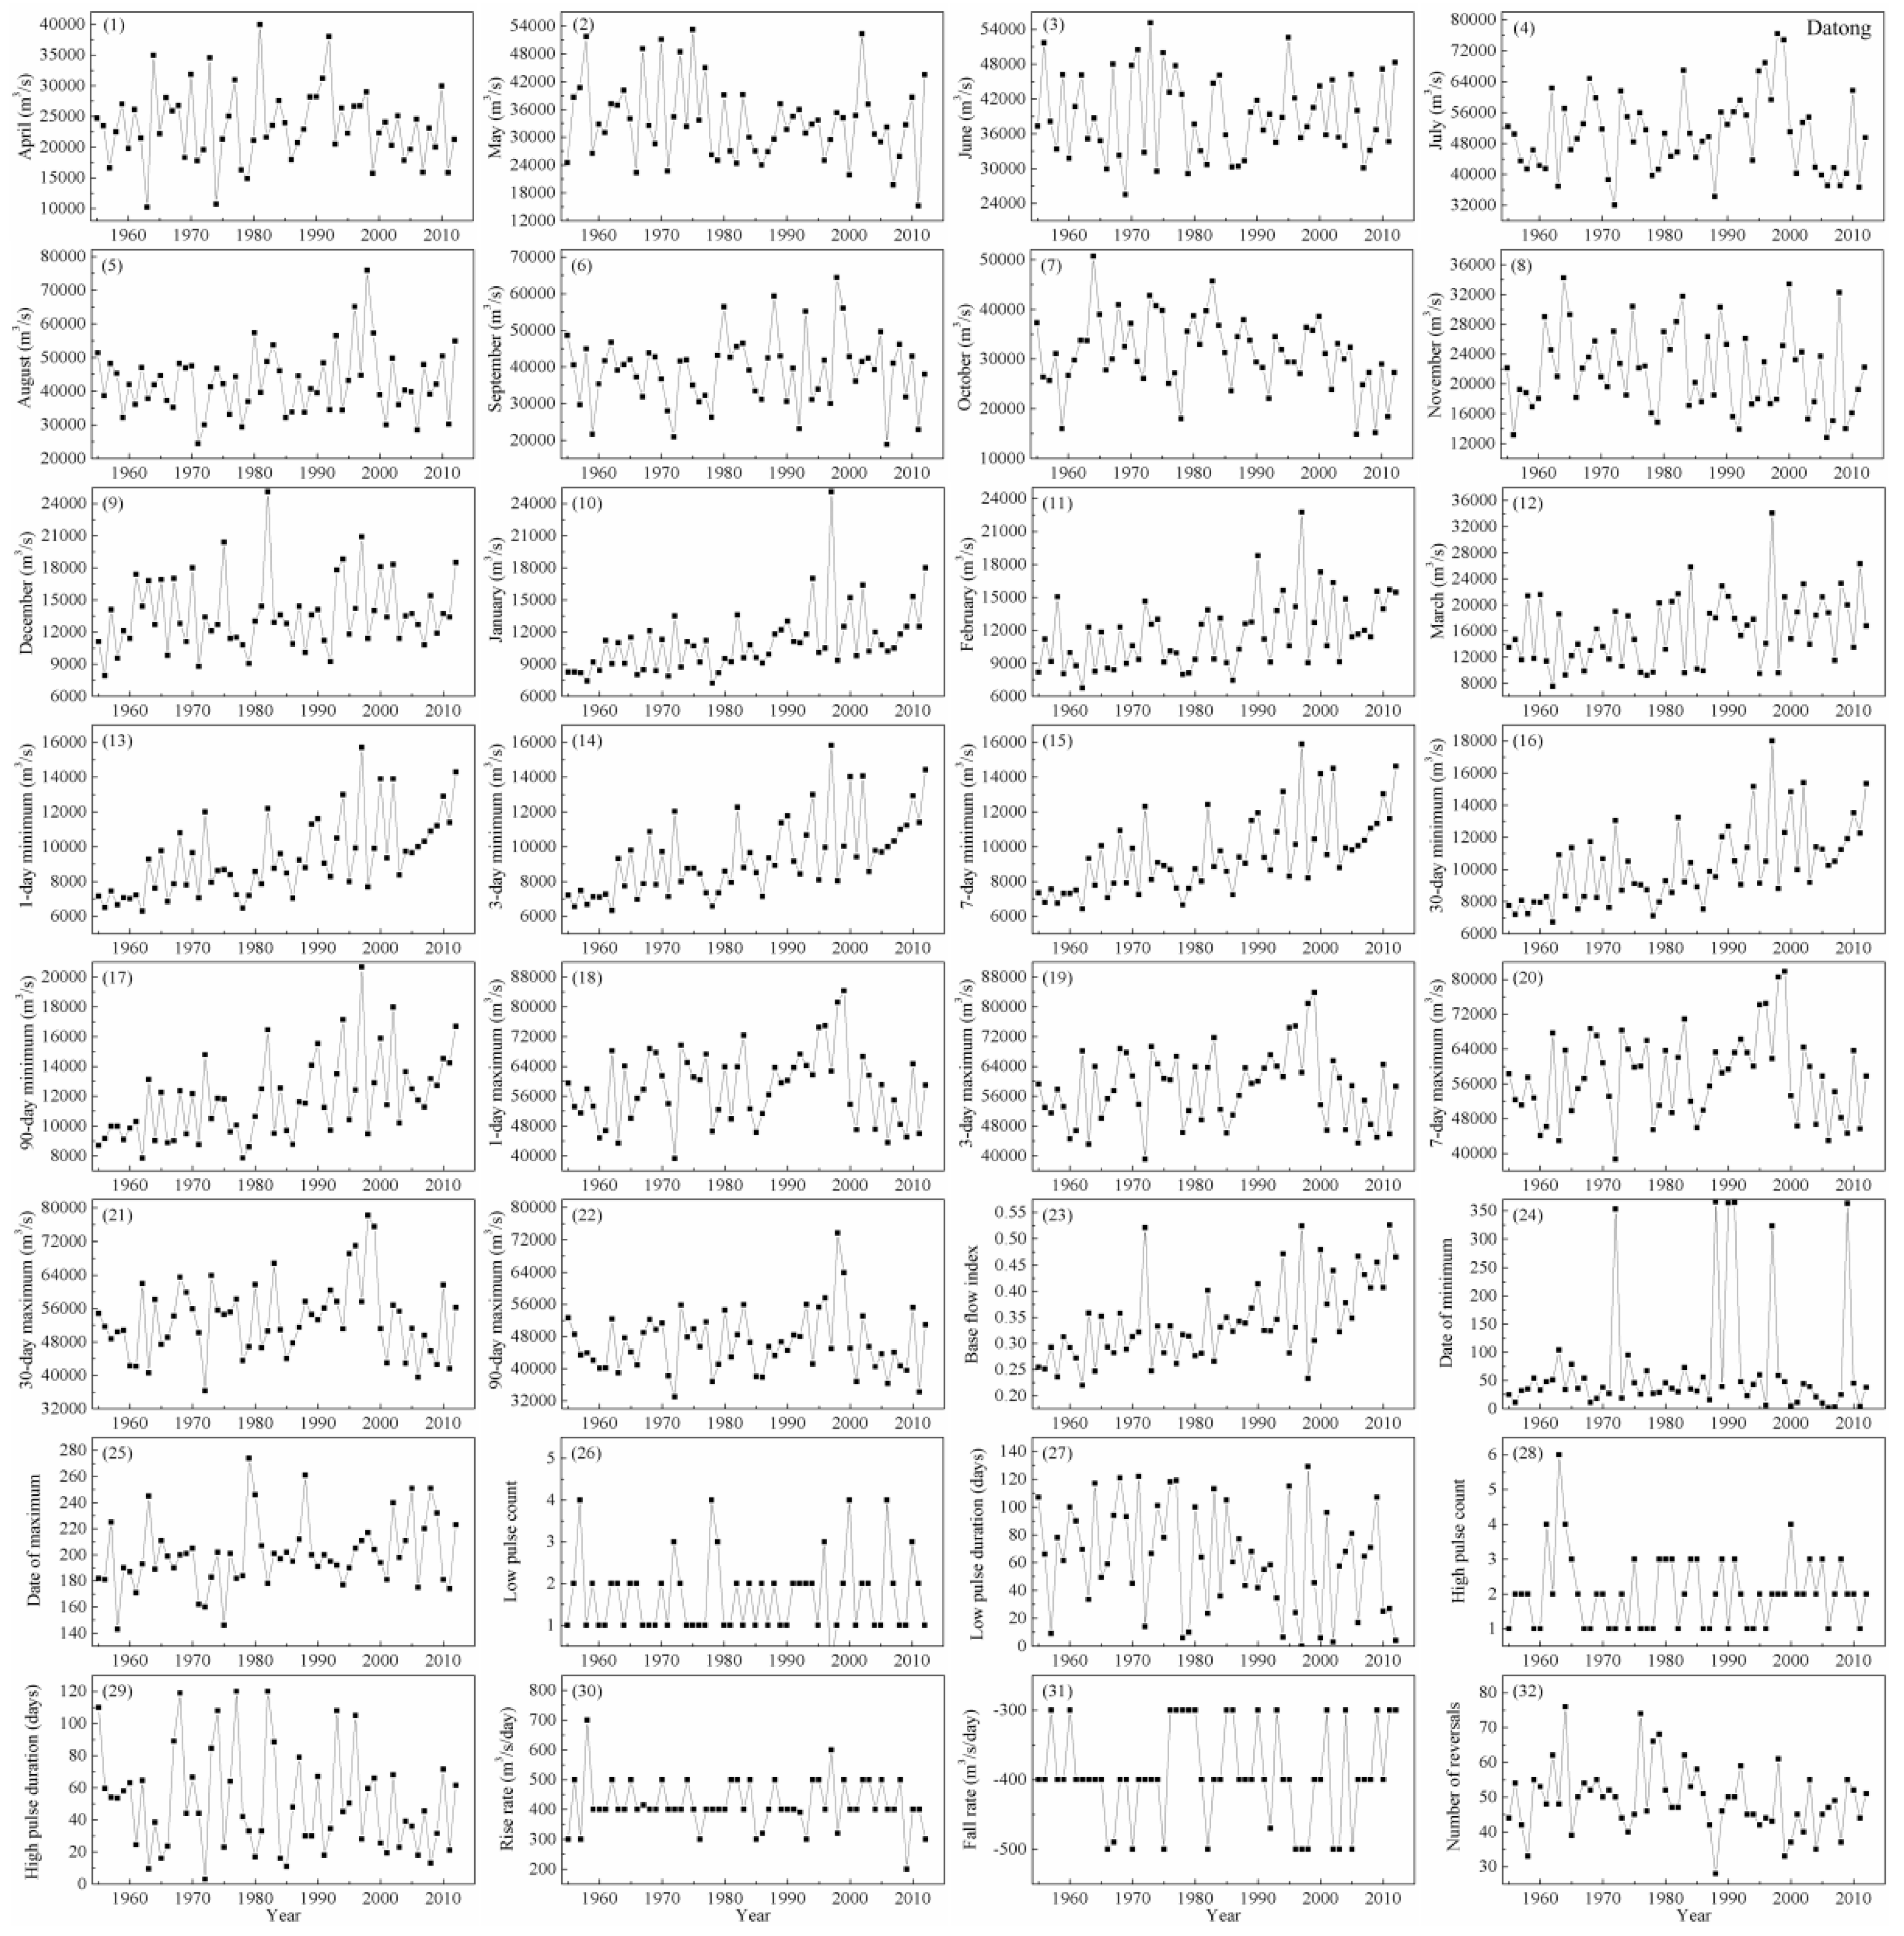
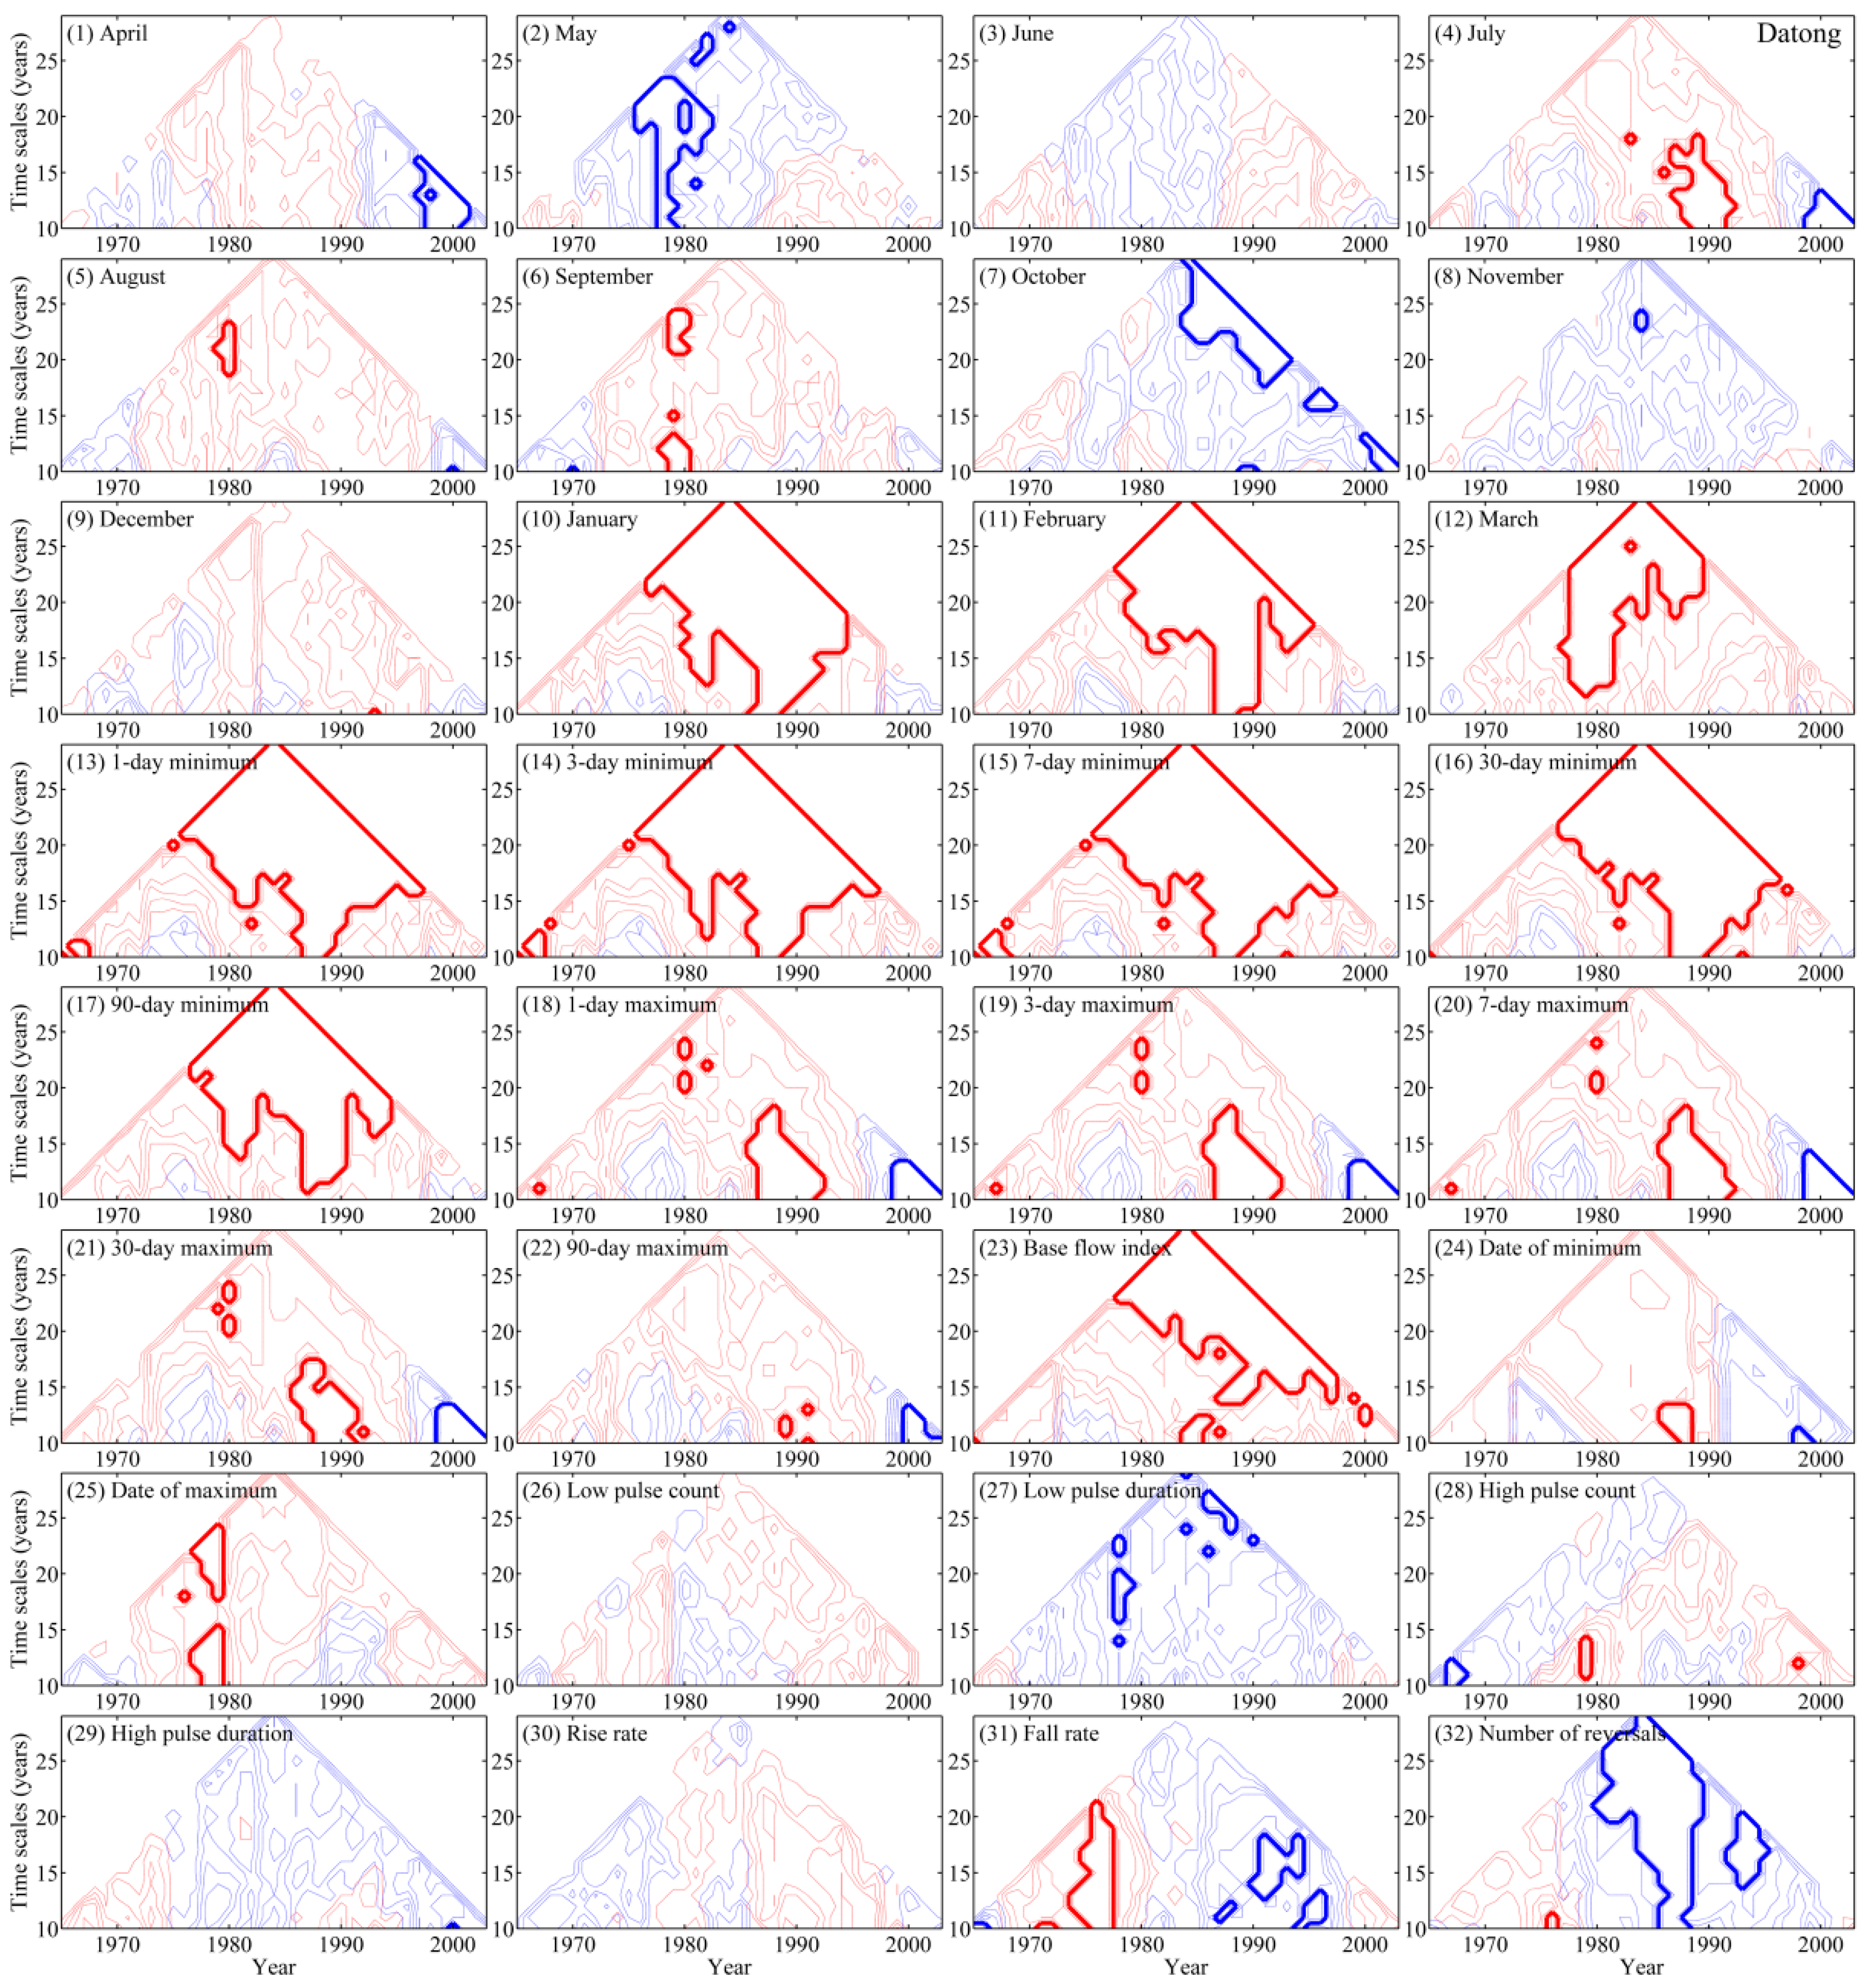
4.4. Changes in Hydrologic Regime at the Datong Station
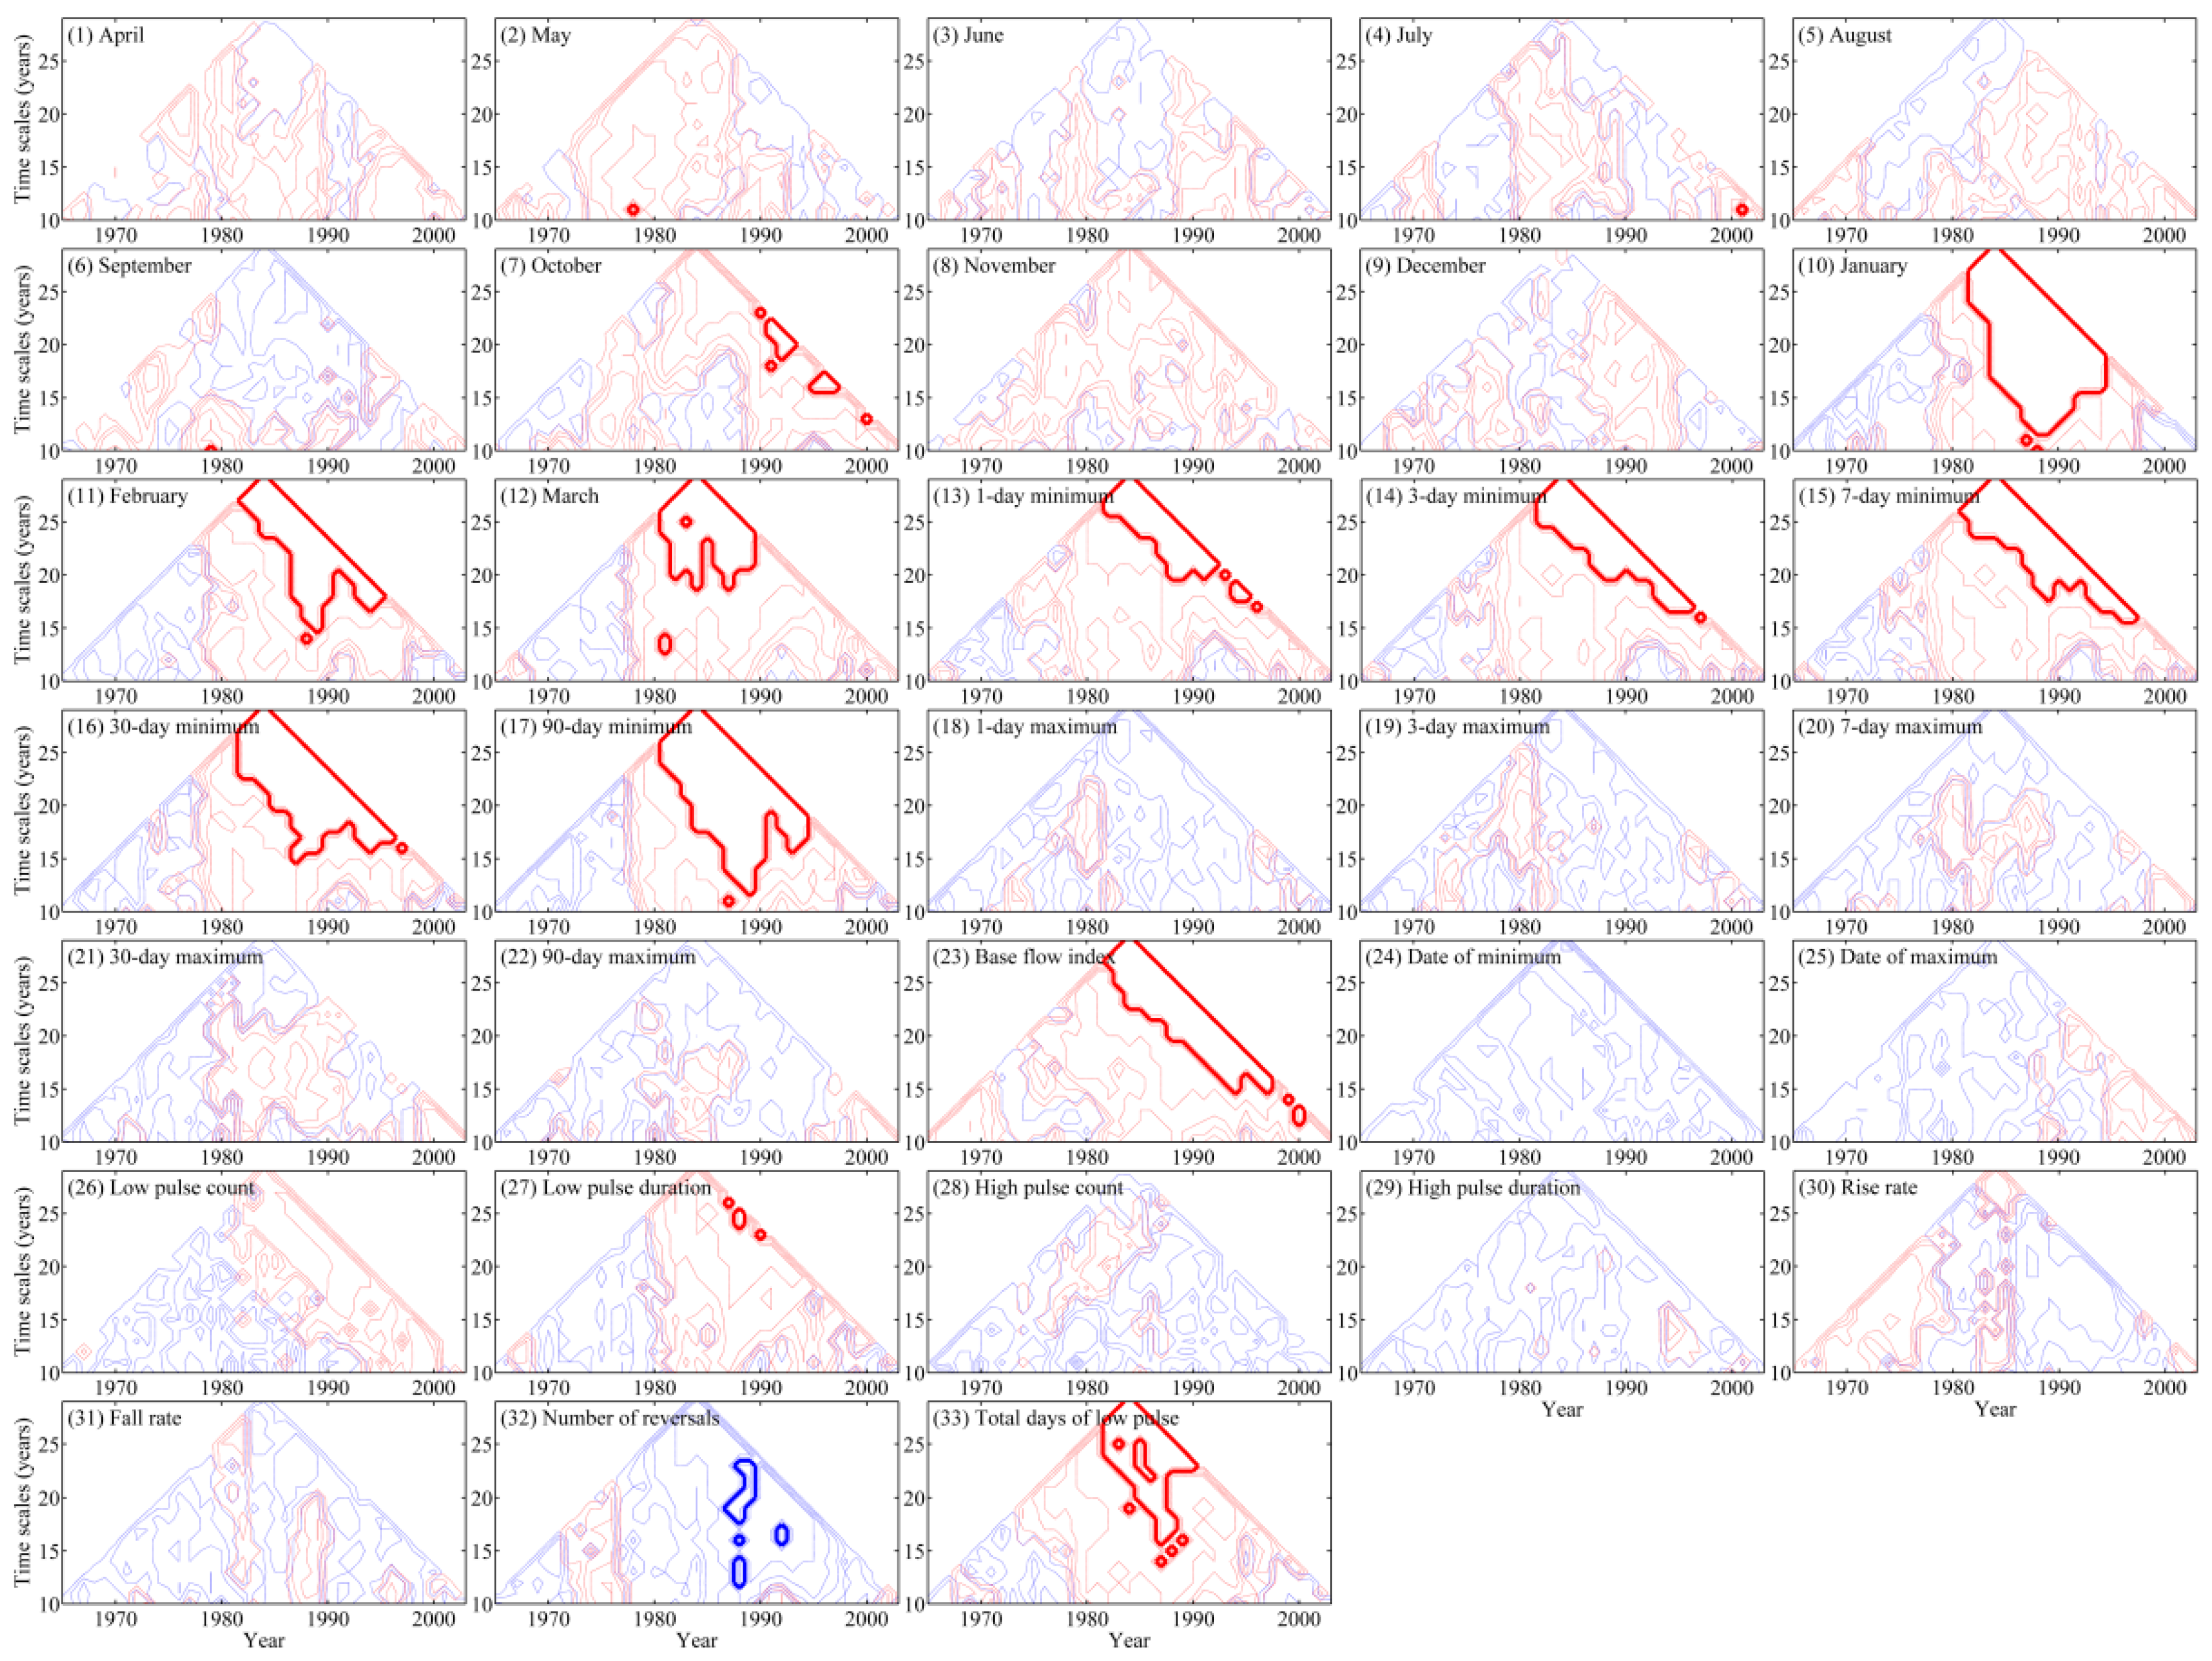
The IHA results for the Datong station are displayed in
Figure 12, and the multi-scale change features are shown in
Figure 13. Significant decreases are detected around 2000 and 1980 in the monthly flows of April and May, respectively. No significant change can be found in June’s monthly flow. The monthly flow in July first increases after 1990 and then decreases after 2000. Intermittent significant increases and decreases can be identified at different time scales in the monthly flows of August through September and November through December. The tendency of the monthly flow in October is dominated by a downward trend, while the tendency of the monthly flows between January and March is dominated by an upward trend.
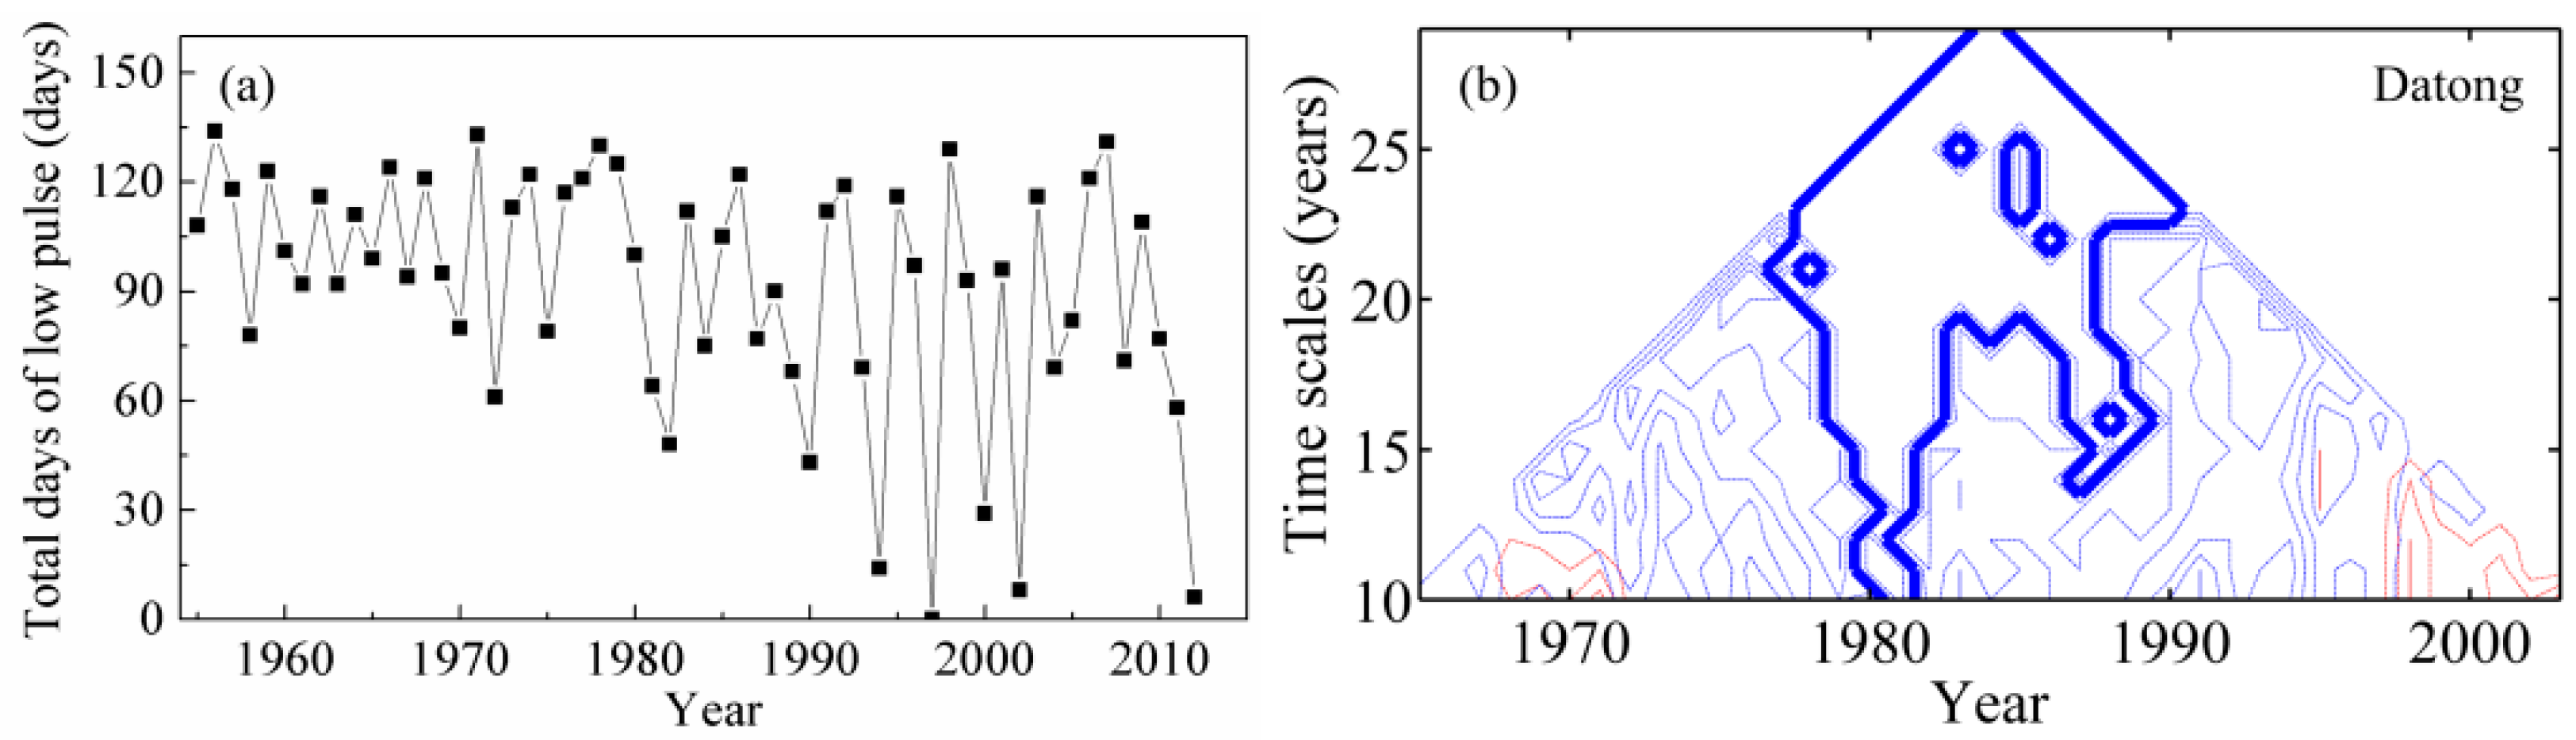
For the magnitude and duration of annual extreme water conditions, all of the low-flow indicators are characterized by significant positive changes. For all of the high-flow indicators, significant increases are detected around 1990 and significant decreases are detected around 2000. At time scales of less than 13 years, a significant increase in the date of minimum is detected in the late 1980s, and a significant decrease is detected in the late 1990s; this finding implies that the 1-day annual minimum flow occurs earlier. A significant increase in the date of maximum can be identified in the late 1970s, indicating that the 1-day annual maximum flow occurs later. No significant change is detected in low pulse count, but a significant decrease can be found in low pulse duration. The change in low pulse duration is approximately in line with that of the total days of low pulses, with a significant reduction appearing after 1980 (
Figure 14). Sparse significant change points can be detected in high pulse count and high pulse duration. The rise rate remains relatively stable, but the fall rate obviously fluctuates with significant positive and negative changes. The number of reversals is characterized by a significant reduction after the mid-1980s.
4.5. Common Changes in Hydrologic Regimes of the Four Stations
Some anthropogenic activities like reservoir construction may result in common changes in the hydrologic regimes of the upper, middle, and lower Yangtze River. Coherency analysis of the results displayed in
Figure 2 through
Figure 14 reveals common changes in the hydrologic regimes of the Cuntan, Yichang, Hankou, and Datong stations (
Figure 15). Significant positive relationships at various time scales among the four stations are primarily evident in the monthly flow in October and in the low-flow indicators, including the monthly flows between January and March, annual minimum 1/3/7/30/90-day flows, base flow index, low pulse duration, and total days of low pulses. The monthly flow in October and the low-flow indicators follow opposite change patterns; the monthly flow in October is characterized by a decreasing trend, but the low-flow indicators are characterized by an increasing trend. These change patterns are the expected results of reservoir regulation. Most of the reservoirs in the Yangtze River basin store water at the end of the flood season with low flood risk and release water in the dry season. Climate change is another important factor affecting the hydrologic regime. The flows in October from the Dongting Lake and the Poyang Lake also decrease, mainly as a result of reduced precipitation caused by climate change [
15].
Negative coherency can only be detected in the number of reversals, implying different change properties among the four stations in terms of this indicator. Significant increases can be identified after the late 1980s in the Cuntan and Yichang stations, while significant decreases can be found after the late 1980s in the Hankou and Datong stations. The factors affecting the number of reversals are relatively complex, including the characteristics of precipitation, the regulations of river channels, the influence of reservoirs, and the buffering effect of lake systems.
5. Discussion
This study demonstrates that the strategy of coupling IHA data and scanning t-test is effective in analyzing various changes to the hydrologic regime of the Yangtze River at different time scales. The improved coherency analysis method is effective in detecting common changes across different hydrologic series, like the coherency among the hydrologic regimes of the upper, middle, and lower reaches of the Yangtze River. This method resolves the limitation of the original algorithm, which can only detect common changes between two hydrologic series. Combining the IHA method, scanning t-test and improved coherency analysis can also help to analyze multiple changes in the hydrologic regimes of other large rivers.
The different patterns of hydrologic changes at the Cuntan, Yichang, Hankou, and Datong stations may be a result of the uneven spatial distribution of precipitation changes, as well as the hydraulic regulation of river channels and lakes like the Dongting Lake and the Poyang Lake. Analysis of precipitation trends for the upper, middle, and lower Yangtze River basin and of runoff trends for the Yichang, Hankou, and Datong stations indicates that the runoff trends are strongly correlated with the precipitation trends [
25]. Both climate change and anthropogenic activities, such as reservoir construction, water withdrawal, and inter-basin water transfer, may also affect the hydrologic regime of the Yangtze River [
26,
27]. The individual roles that climate change and anthropogenic activities play in hydrologic alteration need to be further analyzed in future research.
The common changes identified in the hydrologic regimes of the upper, middle, and lower Yangtze River are decreased monthly flow in October and increased low-flow indicators, both of which are strongly affected by reservoir regulation. Reservoirs function by impounding water to create a supply for the dry season, and this process unavoidably reduces flow during impoundment. Maintaining a water supply during the dry season is beneficial for socio-economic development and ecological environmental protection. The impacts of reservoir regulation on the hydrologic regime will become more significant as more reservoirs are constructed in the Yangtze River basin. The indicators that characterize the hydrologic regime during the seasons of reservoir impoundment and water supply may also experience more significant alterations. Furthermore, the high-flow indicators, including the monthly flows during flood seasons, annual maximum 1/3/7/30/90-day flows, and high pulse count and duration may experience significant changes because of the increased flood-control capacity of reservoirs.
Reservoir-induced alterations in the hydrologic regime of the Yangtze River unavoidably influence water allocation among different water users. In stream ecological water requirements may not be guaranteed during some months, particularly during the time in which reservoirs store water [
28]. One example of the ecological challenges posed by reservoir construction is the dilemma of
Acipensersinensis, or the Chinese sturgeon, an anatropous species of fish that spawns in the Yangtze River and the Pearl River in China. Historically, the species’ spawning habitats were distributed in the lower reaches of the Jinsha River and the upper reaches of the Yangtze River [
29]. However, the migration route of the adult fish is now blocked by the Gezhouba Dam; as a result, Chinese sturgeon are forced to propagate in a new spawning ground less than 7 km long, located in the main stem of the Yangtze River, downstream from the Gezhouba Dam. The species’ population has declined dramatically since the construction of the Gezhouba Dam in 1981, and it experienced a further decline with the 2003 impoundment of the Three Gorges Reservoir, which stores water and changes the downstream hydrologic regime during the spawning period [
30]. These changes in hydrologic conditions negatively influence the Chinese sturgeon’s spawning and hatching conditions [
31]. Adjusting the impoundment schedule of the Three Gorges Reservoir to restore the hydrologic regime over the spawning habitat in October is a crucial step that can be taken to improve habitat suitability for the Chinese sturgeon, particularly in dry years [
29,
32].
6. Conclusions
This paper’s analysis of daily streamflow data from four flow gauging stations along the main stem of the Yangtze River reveals multiple changes over time to the hydrologic regime. These findings indicate the effectiveness of coupling the IHA method and scanning t-test. The following conclusions can be drawn from this analysis:
(1) Various change patterns can be identified in the five components of the hydrologic regime, which are the magnitude of monthly water conditions, magnitude and duration of annual extreme water conditions, timing of annual extreme water conditions, frequency and duration of high and low pulses, and rate and frequency of water condition changes. The 32 hydrologic indicators are characterized by different changes in different time scales. Spatial variations can be observed in the hydrologic changes across the Cuntan, Yichang, Hankou, and Datong stations.
1a. At the Cuntan station, the monthly flow in October decreased around 1970 at a time scale of 10 years and in the mid-1990s at all time scales. The monthly flows in January, February, and March increased after 1980. The low-flow indicators increased after 1980 at time scales exceeding 20 years. For the high-flow indicators, increasing and decreasing changes occurred intermittently during different years at time scales of less than 15 years. After the mid-1980s, low pulse count increased and low pulse duration decreased. The total days of low pulses decreased after the late 1980s, and they were further reduced after the late 1990s at time scales of less than 15 years. The rise rate was characterized by decreasing changes, and the number of reversals was characterized by increasing changes. The fall rate featured intermittent downward and upward trends.
1b. At the Yichang station, September’s monthly flow experienced a significant reduction after 1990, and October’s monthly flow experienced a significant reduction after the late 1990s. The magnitude and duration of annual extreme water conditions increased, especially after 2000. After 1980, low pulse count and low pulse duration were characterized by upward and downward trends, respectively. The total days of low pulses decreased after the late 1980s and decreased further after 2000. The rise rate was characterized by a downward change, and the number of reversals was dominated by an upward change. The fall rate remained relatively stable, and few change points were detected.
1c. At the Hankou station, the monthly flow in April decreased in the late 1990s at all time scales, while the monthly flow in May decreased around 1980 at all time scales and increased in the late 1980s at a time scale of 10 years. The monthly flow in July increased around 1980 at time scales exceeding 15 years and decreased after 2000 at shorter time scales. The monthly flow tendency in October was dominated by a downward trend, while the monthly flow tendencies between January and March were characterized by upward trends. The low-flow indicators showed increasing trends. The high-flow indicators increased during the 1980s at different time scales and decreased in 2000 at a time scale of about 12 years. The total days of low pulses decreased in 1980 at all time scales, and high pulse count decreased in the late 1980s at time scales exceeding 20 years. The tendency of the rise rate was dominated by a decreasing trend.
1d. At the Datong station, significant decreases were detected around 2000 and 1980 in the monthly flows of April and May, respectively. The monthly flow in July increased after 1990 and decreased after 2000. The tendency of the monthly flow in October was dominated by a downward trend, while the tendencies of the monthly flows between January and March were dominated by upward trends. The low-flow indicators were characterized by significant positive changes, and the high-flow indicators increased around 1990 and decreased around 2000. The change in low pulse duration approximately aligned with that of total days of low pulses, with a significant reduction occurring after 1980. The number of reversals decreased after the mid-1980s.
(2) The improved coherency analysis method is effective in detecting common changes across different hydrologic series. Some common changes in the hydrologic regimes of the upper, middle, and lower reaches of a river can be revealed through coherency analysis. This study identified similar change patterns at different points in the Yangtze River in hydrologic indicators including the monthly flow in October and the low-flow indicators, which comprise the monthly flows between January and March, annual minimum 1/3/7/30/90-day flows, base flow index, low pulse duration, and total days of low pulses. The monthly flow in October decreased, but the low-flow indicators increased.
(3) The influence of reservoirs represents an important factor behind hydrologic changes. The monthly flow in October and the low-flow indicators followed opposite change patterns due to reservoir regulation. The reservoirs store water in October, reducing downstream runoff. The impounded water is then supplied in the dry season, leading to the increased base flow and the decreased low pulse duration.
Acknowledgments
This work is supported by the National Natural Science Foundation Projects of China (grant numbers 41401011, 41401010, 51309107, 41371098 and 51409091); Science and Technology Projects of Water Resources Department of Jiangxi Province (grant number KT201538); Major Program of National Social Science Foundation of China (grant number 11&ZD168); and Program for Changjiang Scholars and Innovative Research Team in University (grant number IRT13062). The authors acknowledge constructive comments from the editor and anonymous reviewers, which lead to improvement of the paper.
Author Contributions
The authors designed and performed the research together. Feng Huang wrote the draft of the paper. Nan Zhang, Xirong Ma, Dayong Zhao, Lidan Guo, Li Ren, Yao Wu and Ziqiang Xia made some comments and corrections.
Conflicts of Interest
The authors declare no conflict of interest.
References
- Poff, N.L.; Zimmerman, J.K.H. Ecological responses to altered flow regimes: A literature review to inform the science and management of environmental flows. Freshw. Biol. 2010, 55, 194–205. [Google Scholar] [CrossRef]
- Poff, N.L.; Allan, J.D.; Bain, M.B.; Karr, J.R.; Prestegaard, K.L.; Richter, B.D.; Sparks, R.E.; Stromberg, J.C. The natural flow regime. Bioscience 1997, 47, 769–784. [Google Scholar] [CrossRef]
- Huang, F.; Xia, Z.Q.; Li, F.; Guo, L.D.; Yang, F.C. Hydrological Changes of the Irtysh River and the Possible Causes. Water Resour. Manag. 2012, 26, 3195–3208. [Google Scholar] [CrossRef]
- Yang, T.; Chen, X.; Xu, C.Y.; Zhang, Z.C. Spatio-temporal changes of hydrological processes and underlying driving forces in Guizhou region, Southwest China. Stoch. Environ. Res. Risk Assess. 2009, 23, 1071–1087. [Google Scholar] [CrossRef]
- Doll, P.; Fiedler, K.; Zhang, J. Global-scale analysis of river flow alterations due to water withdrawals and reservoirs. Hydrol. Earth Syst. Sci. 2009, 13, 2413–2432. [Google Scholar] [CrossRef]
- Magilligan, F.J.; Nislow, K.H. Changes in hydrologic regime by dams. Geomorphology 2005, 71, 61–78. [Google Scholar] [CrossRef]
- Costigan, K.H.; Daniels, M.D. Damming the prairie: Human alteration of Great Plains river regimes. J. Hydrol. 2012, 444, 90–99. [Google Scholar] [CrossRef]
- Schneider, C.; Laize, C.L.R.; Acreman, M.C.; Florke, M. How will climate change modify river flow regimes in Europe? Hydrol. Earth Syst. Sci. 2013, 17, 325–339. [Google Scholar] [CrossRef] [Green Version]
- Li, G.F.; Xiang, X.Y.; Tong, Y.Y.; Wang, H.M. Impact assessment of urbanization on flood risk in the Yangtze River Delta. Stoch. Environ. Res. Risk Assess. 2013, 27, 1683–1693. [Google Scholar] [CrossRef]
- He, S.; Hipel, K.W.; Kilgour, D.M. Water diversion conflicts in China: A hierarchical perspective. Water Resour. Manag. 2014, 28, 1823–1837. [Google Scholar] [CrossRef]
- Bonacci, O.; Oskorus, D. The changes in the lower Drava River water level, discharge and suspended sediment regime. Environ. Earth Sci. 2010, 59, 1661–1670. [Google Scholar] [CrossRef]
- Yi, Y.J.; Wang, Z.Y.; Yang, Z.F. Impact of the Gezhouba and Three Gorges Dams on habitat suitability of carps in the Yangtze River. J. Hydrol. 2010, 387, 283–291. [Google Scholar] [CrossRef]
- Huang, F.; Xia, Z.Q.; Zhang, N.; Zhang, Y.D.; Li, J. Flow-complexity analysis of the upper reaches of the Yangtze River, China. J. Hydrol. Eng. 2011, 16, 914–919. [Google Scholar] [CrossRef]
- Yu, M.X.; Li, Q.F.; Lu, G.B.; Cai, T.; Xie, W.; Bai, X. Investigation into the impacts of the Gezhouba and the Three Gorges Reservoirs on the flow regime of the Yangtze River. J. Hydrol. Eng. 2013, 18, 1098–1106. [Google Scholar] [CrossRef]
- Gao, B.; Yang, D.; Yang, H. Impact of the Three Gorges Dam on flow regime in the middle and lower Yangtze River. Quat. Int. 2013, 304, 43–50. [Google Scholar] [CrossRef]
- Zhang, Q.; Singh, V.P.; Xu, C.Y.; Chen, X.H. Abrupt behaviours of streamflow and sediment load variations of the Yangtze River basin, China. Hydrol. Process. 2013, 27, 444–452. [Google Scholar] [CrossRef]
- Jiang, T.; Zhang, Q.; Zhu, D.M.; Wu, Y.J. Yangtze floods and droughts (China) and teleconnections with ENSO activities (1470–2003). Quat. Int. 2006, 144, 29–37. [Google Scholar]
- Yang, S.L.; Milliman, J.D.; Li, P.; Xu, K. 50,000 dams later: Erosion of the Yangtze River and its delta. Glob. Planet. Chang. 2011, 75, 14–20. [Google Scholar] [CrossRef]
- Wei, W.; Chang, Y.; Dai, Z. Streamflow changes of the Changjiang (Yangtze) River in the recent 60 years: Impacts of the East Asian summer monsoon, ENSO, and human activities. Quat. Int. 2014, 336, 98–107. [Google Scholar] [CrossRef]
- Wang, Y.G.; Shi, H.L.; Liu, X. Influence of sediment trapping in reservoirs on runoff and sediment discharge variations in Yangtze River. Adv. Water Sci. 2014, 25, 467–476. [Google Scholar]
- Richter, B.D.; Baumgartner, J.V.; Powell, J.; Braun, D.P. A method for assessing hydrologic alteration within ecosystems. Conserv. Biol. 1996, 10, 1163–1174. [Google Scholar] [CrossRef]
- Zhang, Q.; Xu, C.Y.; Singh, V.P.; Yang, T. Multiscale variability of sediment load and streamflow of the lower Yangtze River basin: Possible causes and implications. J. Hydrol. 2009, 368, 96–104. [Google Scholar] [CrossRef]
- Jiang, J.M.; Mendelssohn, R.; Schwing, F.; Fraedrich, K. Coherency detection of multiscale abrupt changes in historic Nile flood levels. Geophys. Res. Lett. 2002, 29. [Google Scholar] [CrossRef]
- Li, Q.F.; Yu, M.X.; Lu, G.B.; Cai, T.; Bai, X.; Xia, Z.Q. Impacts of the Gezhouba and Three Gorges reservoirs on the sediment regime in the Yangtze River, China. J. Hydrol. 2011, 403, 224–233. [Google Scholar] [CrossRef]
- Zhang, Q.; Jiang, T.; Gemmer, M.; Becker, S. Precipitation, temperature and runoff analysis from 1950 to 2002 in the Yangtze basin, China. Hydrol. Sci. J. 2005, 50, 65–80. [Google Scholar]
- Zhang, X.L.; Fan, D.J.; Wang, H.J.; Yang, Z.S. Water discharge variability of Changjiang (Yangtze) and Huanghe (Yellow) Rivers and its response to climatic changes. Chin. J. Oceanol. Limnol. 2014, 32, 1392–1405. [Google Scholar] [CrossRef]
- Chen, J.; Wu, X.D.; Finlayson, B.L.; Webber, M.; Wei, T.Y.; Li, M.T.; Chen, Z.Y. Variability and trend in the hydrology of the Yangtze River, China: Annual precipitation and runoff. J. Hydrol. 2014, 513, 403–412. [Google Scholar] [CrossRef]
- Li, Q.F.; Yu, M.X.; Zhao, J.H.; Cai, T.; Lu, G.B.; Xie, W.; Bai, X. Impact of the Three Gorges reservoir operation on downstream ecological water requirements. Hydrol. Res. 2012, 43, 48–53. [Google Scholar] [CrossRef]
- Zhou, J.Z.; Zhao, Y.; Song, L.X.; Bi, S.; Zhang, H.J. Assessing the effect of the Three Gorges reservoir impoundment on spawning habitat suitability of Chinese sturgeon (Acipenser sinensis) in Yangtze River, China. Ecol. Inform. 2014, 20, 33–46. [Google Scholar] [CrossRef]
- Ban, X.; Du, Y.; Liu, H.Z.; Ling, F. Applying instream flow incremental method for the spawning habitat protection of Chinese Sturgeon (Acipenser sinensis). River Res. Appl. 2011, 27, 87–98. [Google Scholar] [CrossRef]
- Li, J.; Xia, Z.Q.; Wang, Y.K. Impact of the Three Gorges and Gezhouba Reservoirs on Ecohydrological Conditions for Sturgeon in the Yangtze River, China. J. Hydrol. Eng. 2013, 18, 1563–1570. [Google Scholar] [CrossRef]
- Chen, Y.B.; Wu, B.F. Impact analysis of the Three-Gorges Project on the spawning of Chinese sturgeon Acipenser sinensis. J. Appl. Ichthyol. 2011, 27, 383–386. [Google Scholar] [CrossRef]
© 2016 by the authors; licensee MDPI, Basel, Switzerland. This article is an open access article distributed under the terms and conditions of the Creative Commons Attribution (CC-BY) license (http://creativecommons.org/licenses/by/4.0/).


