Article

Web-Based BFlow System for the Assessment of Streamflow Characteristics at National Level

1
Water Resources Research Center, K-Water Institute, 125, Yuseong-daero, 1698 beon-gil, Yuseong-gu, Daejeon 34045, Korea
2
Department of Agricultural Civil Engineering, Kyungpook National University, 80 Daehak-ro, Buk-gu, Daegu 41566, Korea
3
Department of Regional Infrastructures Engineering, Kangwon National University, 1 Kangwondaehak Street, Chuncheon 200-701, Korea
*
Author to whom correspondence should be addressed.
Water 2016, 8(9), 384; https://doi.org/10.3390/w8090384
Submission received: 16 May 2016 / Revised: 16 August 2016 / Accepted: 29 August 2016 / Published: 6 September 2016

Abstract

:
Distinct seasonal characteristics of monsoon climate significantly affect river streamflow in South Korea. The roles of direct runoff and baseflow on streamflow have become more important to ecosystems and human communities in various watersheds of South Korea. Understanding river characteristics, including direct runoff and baseflow, is the first step of river management and can make a significant contribution to maintaining a sustainable and effective river environment. In this regard, this study involves twin objectives: (1) developing the web-based BFlow system to gain advantages in the time and effort required relative to the DOS (Disk Operation System)-based BFlow program; and (2) assessing the contributions of baseflow and direct runoff to streamflow for river management at the national level. For this, we investigated all streamflow gauge stations in South Korea and, then, used the BFlow program to separate baseflow from the available streamflow data. The results showed that baseflow index for 254 streamflow gauge stations ranged from 0.28 to 0.89. Gauge stations with a baseflow index greater than 0.5 accounted for 64% of total stations. The web-based system developed in this study is a more MS (Microsoft) user-friendly version of BFlow. Furthermore, this study illustrated that high baseflow indexes were generally found at gauge stations with a low coefficient of variation of streamflow. The web-based BFlow system will provide understanding to strategically control rivers and improve the efficiency and safety of river management at the national level.

1. Introduction

This study developed the web-based BFlow system to save time and effort over the DOS (Disk Operation System)-based BFlow program and to assess the contributions of baseflow and direct runoff to streamflow in order to promote sustainable and effective river management at the national level. In river management, streamflow data is fundamental for analyzing the characteristics of river regime. For this reason, many governments and institutions have installed gauging stations to periodically measure streamflow. Baseflow and direct runoff, which are the main components of streamflow, provide seasonally different contributions to river flow [1,2]. For example, the intensification of direct runoff during the wet season can cause soil erosion and deposition and water pollution (e.g., non-point pollution and suspended sediment). Whereas baseflow, which typically represents streamflow conditions in the absence of event-based runoff such as precipitation and snowmelt, represents the main supply of river water that is required to maintain hydro-ecosystems during the dry season. Furthermore, a decline in groundwater storage and increase in direct runoff can increase the vulnerability of the river depletion and flood. Sequentially, these negative phenomena, along with human activities, have potential to disorder hydro-ecosystem health. In this regard, it is necessary to understand the characteristics of hydrologic responses, including baseflow, direct runoff, and streamflow, for effective river management.
Due to the spatial heterogeneity and seasonal variations in river regimes, South Korea has attempted to establish an integrated system for river management at the national level. Thus, many studies have performed investigations and analyses of these river regimes in South Korea (e.g., [3,4,5]). However, most studies focused on regional patterns of streamflow in rivers. Lack of the integrated information on baseflow and direct runoff at the national scale can prove difficult to decision makers controlling river-related policy development in central and local governments including water resources development, flood control, drought prevention, water rights, watershed management, and city planning. Furthermore, many studies have supported the need for Korean river management to build the adaptation capacity to cope with impact of the changes in climate and land cover on river conditions in South Korea [6,7,8,9]. Thus, analysis of streamflow characteristics at the national level is necessary to improve the systematization, standardization, and efficiency of river management.
Understanding the role of baseflow in the streamflow processes is critical for identification and quantification of groundwater storage and direct runoff [10,11,12,13]. For this reason, many studies associated with the analyses of the characteristics of baseflow in watersheds have been conducted by using various methods: the recession curve displacement method [14,15,16,17,18], the curve-fitting method [19,20,21], and the water-table fluctuation method [22,23]. In addition, HYSEP (Hydrograph Separation Program) [24,25], PART [16,26], RORA [16,27], BFlow [17,28], and WHAT (Web Geographic Information System-Based Hydrograph Analysis Tool) [29,30,31] have been developed and widely employed for hydrograph analysis on a long-term basis.
The BFlow program [17], which uses a digital filtering method, was developed to provide consistent baseflow separation results. Recently, BFlow has become commonplace in hydrograph separation [29,32]. However, consideration of aquifer characteristics is difficult in baseflow separation using the BFLOW program. Thus, the digital filter method by Lyne and Hollick [33] was initially used in signal analysis and processing to separate high frequency signal (direct runoff) from low frequency signal (baseflow) [12,34]. In this context, the digital filter method has no physical meaning in baseflow separation. However, despite the weaknesses of BFLOW, the program can alleviate subjectivity in manual baseflow separation that the filtered baseflow should be less than total streamflow, and be greater than or equal to zero [17]. Such reduction of subjectivity in baseflow separation led to fast, consistent and reproducible filtering of continuous baseflow [34]. This allows high applicability of the BFlow program in many studies associated with baseflow separation [35,36,37,38]. Furthermore, the efforts to alleviate the inconvenience of the DOS-based systems are shown by the development of web-based systems such as WHAT [29] and RECESS [39]. Similarly, the development of web-based BFlow is also expected to extend the applicability of the existing BFlow program.

2. Materials and Methods

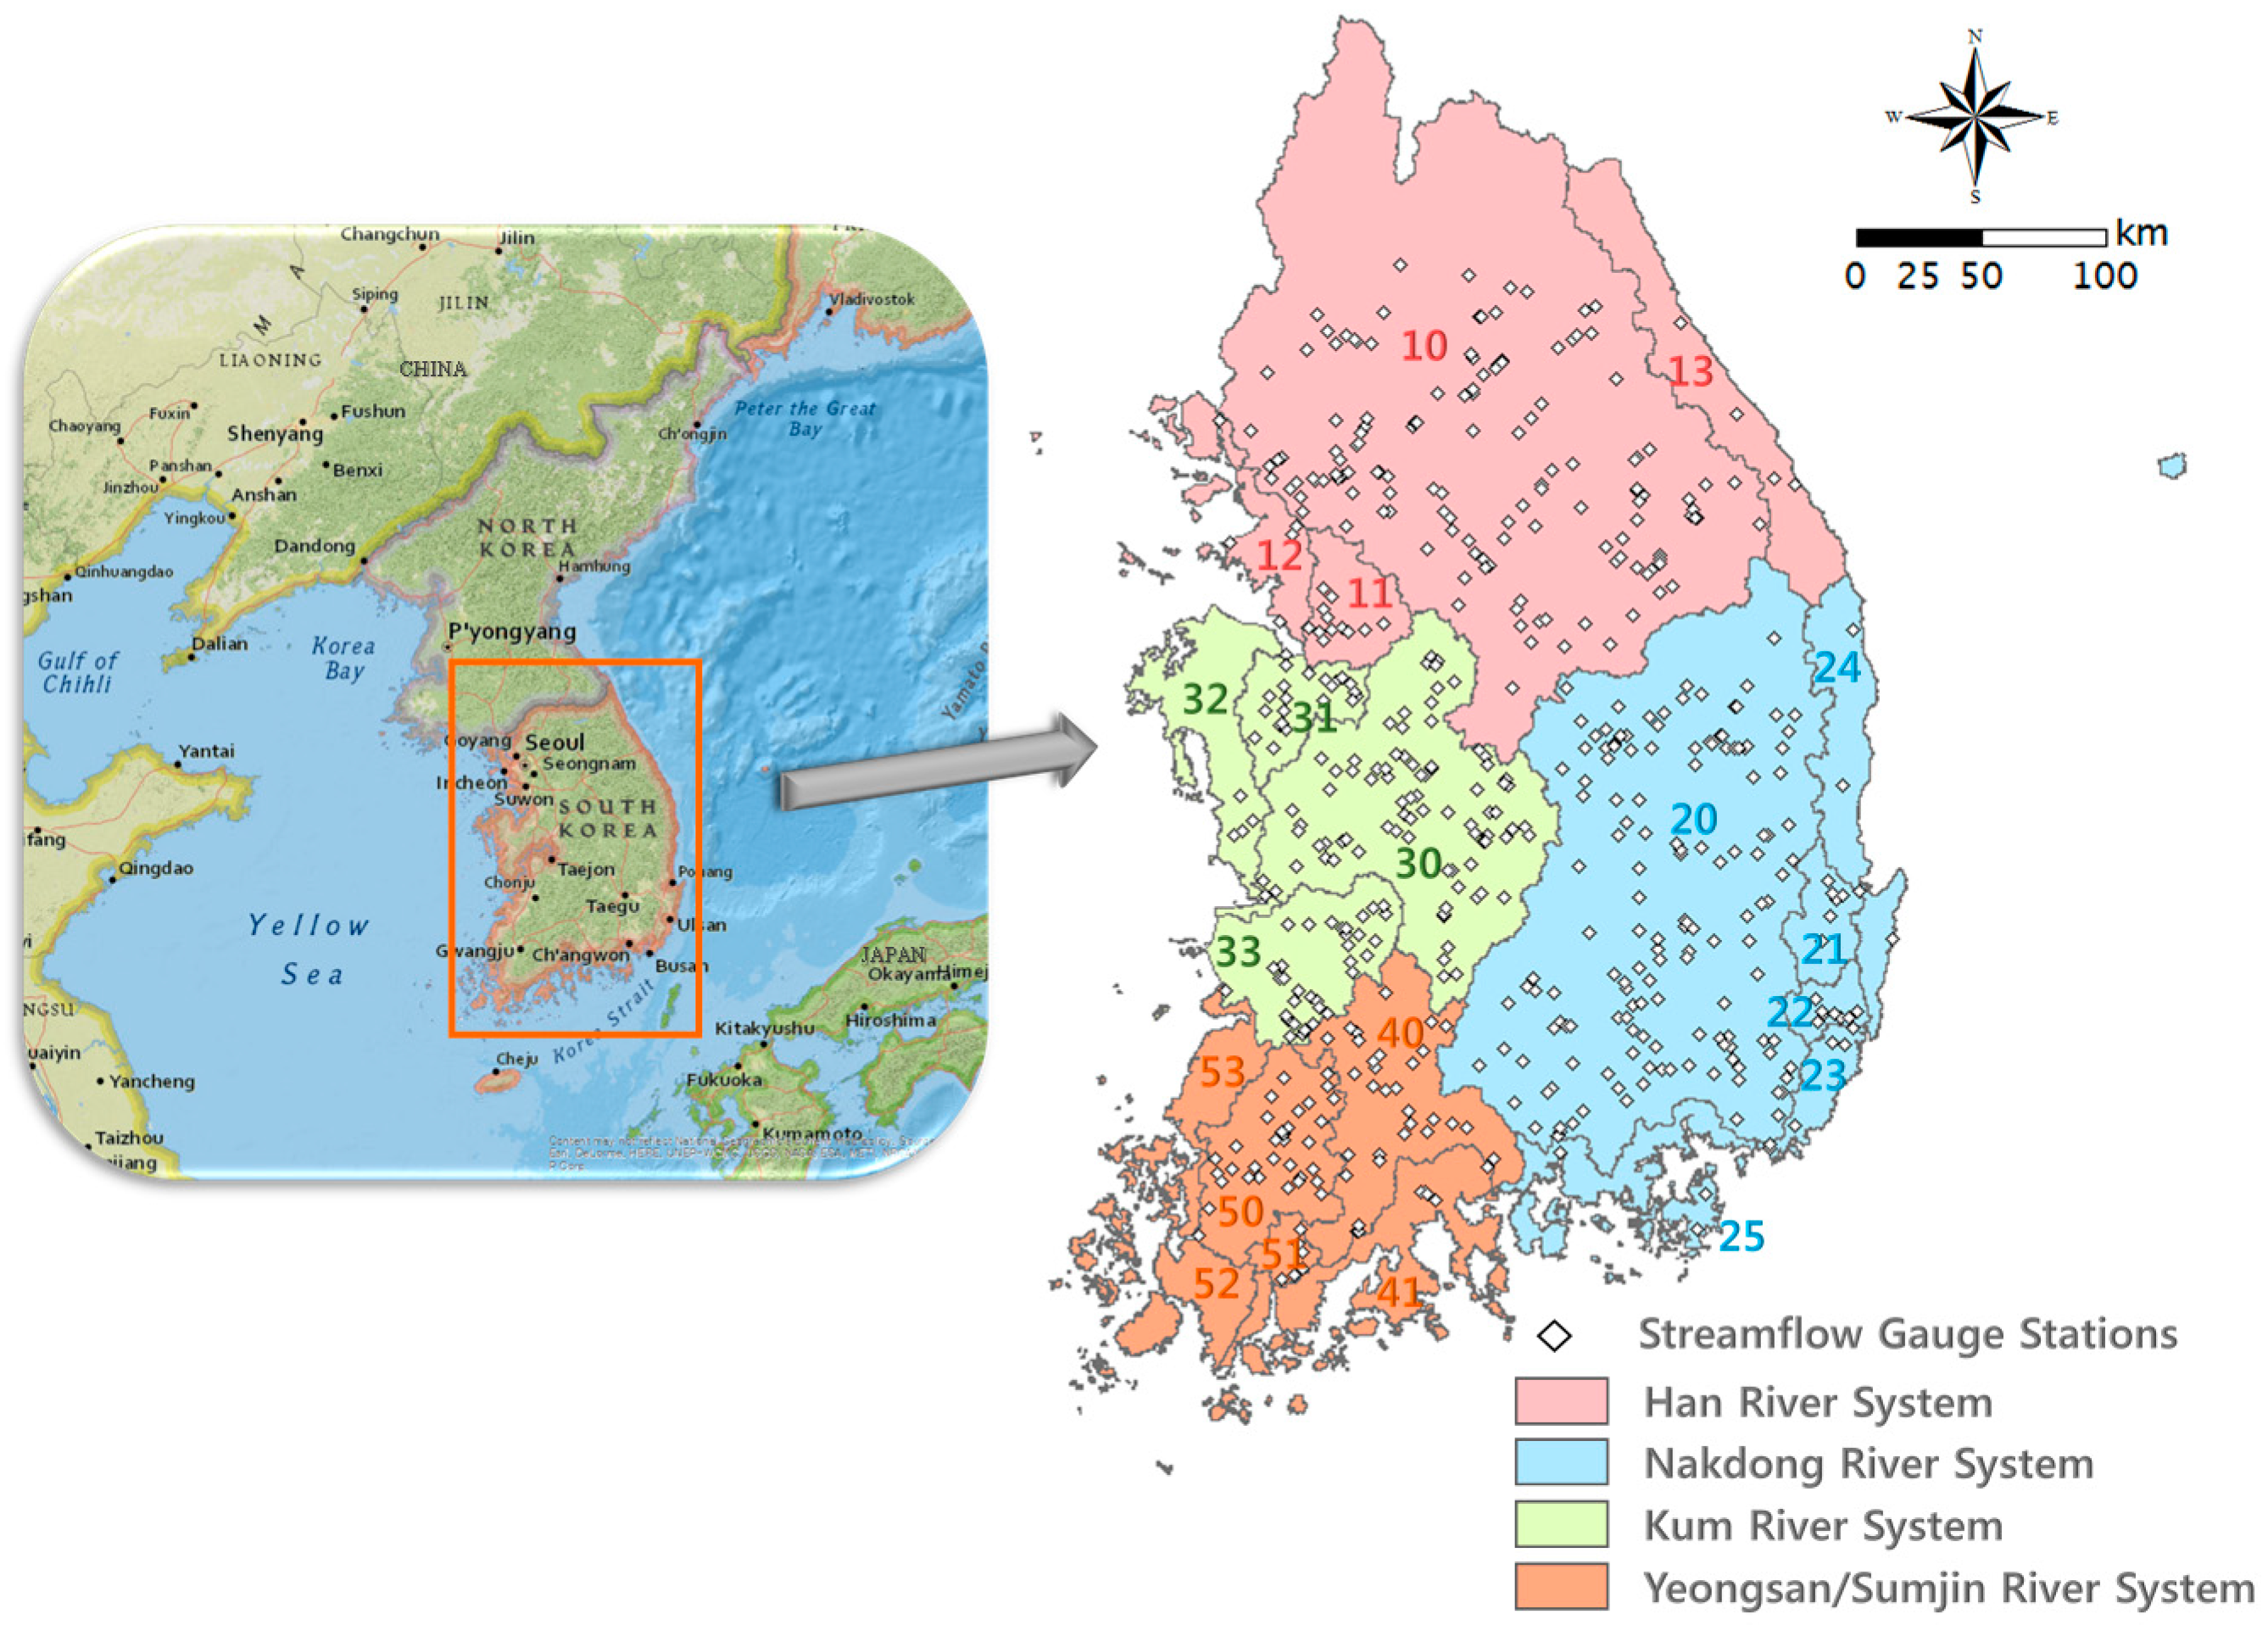
2.1. Study Area and Data

South Korea consists of four major river systems: Han River (HR), Nakdong River (NR), Gum River (GR), and Yeongsan/Sumjin Rivers (YSR) (Figure 1). Table 1 shows the characteristics of the watersheds for the four major river systems. Due to the of lack baseflow measurements, this study performed hydrograph separations from the observed streamflow in order to improve the understanding of river characteristics at the national level. In this regard, we investigated all streamflow stations included in the Water Management Information System (WAMIS) [40] due to availability of continuous daily streamflow data, which is required for baseflow separation using the BFlow program. In South Korea, WAMIS provides daily streamflow data retrieved from 632 gauge stations that are managed by K-Water, Ministry of Land, Infrastructure and Transport (MOLIT), and Ministry of Environment (MOE) (Figure 1). In this study, 254 out of 632 streamflow gauge stations which have available continuous daily streamflow data during a five-year period (2009–2013) were selected.
Figure 2 shows the results of spatially plotting the mean daily streamflow for the five-year study period. Location information on the gauge stations in this study is available in the Supplementary Materials (Figure S1). The maximum streamflow (1100 m3/s), was observed at Kupo gauge station located in the NR system, and the minimum streamflow (0.02 m3/s) was observed at Bangdong gauge station located in the GR system. Specifically, the mean daily streamflow for the HR system was observed to be the greatest at the Haengjukyo gauge station and the lowest at the Wooi gauge station. The NR system had a maximum mean daily streamflow at Kupo gauge station and a minimum at Kigge gauge station. In the GR system, mean daily streamflow was observed to be maximum at Kanggyeong gauge station and minimum at Bandong gauge station. Lastly, in the YSR system, mean daily streamflow was observed to be maximum at Hadong gauge station and the minimum at Orye gauge station. As was the general expectation, the greatest streamflow for all river systems was observed in the main stream of rivers. Gauge stations in the NR system showed high spatial heterogeneity based on the gap between the maximum and minimum mean daily streamflow, and gauge stations distributed in the YSR system showed the smallest difference between the maximum and minimum mean daily streamflow. However, for all gauge stations in the YSR system, it is apparent that the mean daily streamflow was relatively and significantly low when compared to other large river systems. Thus, evaluating the soundness of river functions for water resource availability for the YSR system needs to consider groundwater pumping systems or flow regulated by hydraulic structures.

2.2. Digital Filter Method

The digital filter method, which was first suggested by Lyne and Hollick [33], is the basis of the BFlow program [17]. The digital filter method is an algorithm originally used in signal processing to divide the signals into two groups (high and low frequencies). Streamflow consists of direct runoff and baseflow. Typically, direct runoff is dominated by rainfall events or snowmelt runoff, and baseflow depends on discharge from groundwater storage. Here, direct runoff leads to higher frequency variability for streamflow than baseflow [12,41]. In this regard, baseflow separation from hydrograph can be conducted by signal analysis and processing because direct runoff is associated with the high frequency spectrum of hydrographs, and baseflow is associated with the low frequency spectrum [12]. Although baseflow separation using the digital filter method is performed by signal processing without physical meaning, the digital filter method has been used in many applications of baseflow separation (e.g., [17,20,31,34,42]) due to its speed, consistency, and reproducibility [17]. Direct runoff and baseflow using the digital filter method can be estimated by Equations (1) and (2).
q t = β · q t 1 + ( 1 + β ) 2 ( Q t Q t 1 )
b t = Q t q t
where qt is the filtered direct runoff (m3/s) at time t, bt is the filtered baseflow (m3/s) at time t, β is the filter parameter, and Qt is streamflow (m3/s) at time t.
Determination of the filter parameter value is a main subjectivity in digital filter method. To reduce the subjectivity, Nathan and McMahon [34] suggested the optimal value 0.925 for the filter parameter, and the BFlow program implements the value. Also, BFlow conducts baseflow separation by passing the filter over the continuous streamflow data three times (Pass1, Pass2, and Pass3). Here, three passes produce different reductions in baseflow as a percent of total streamflow.

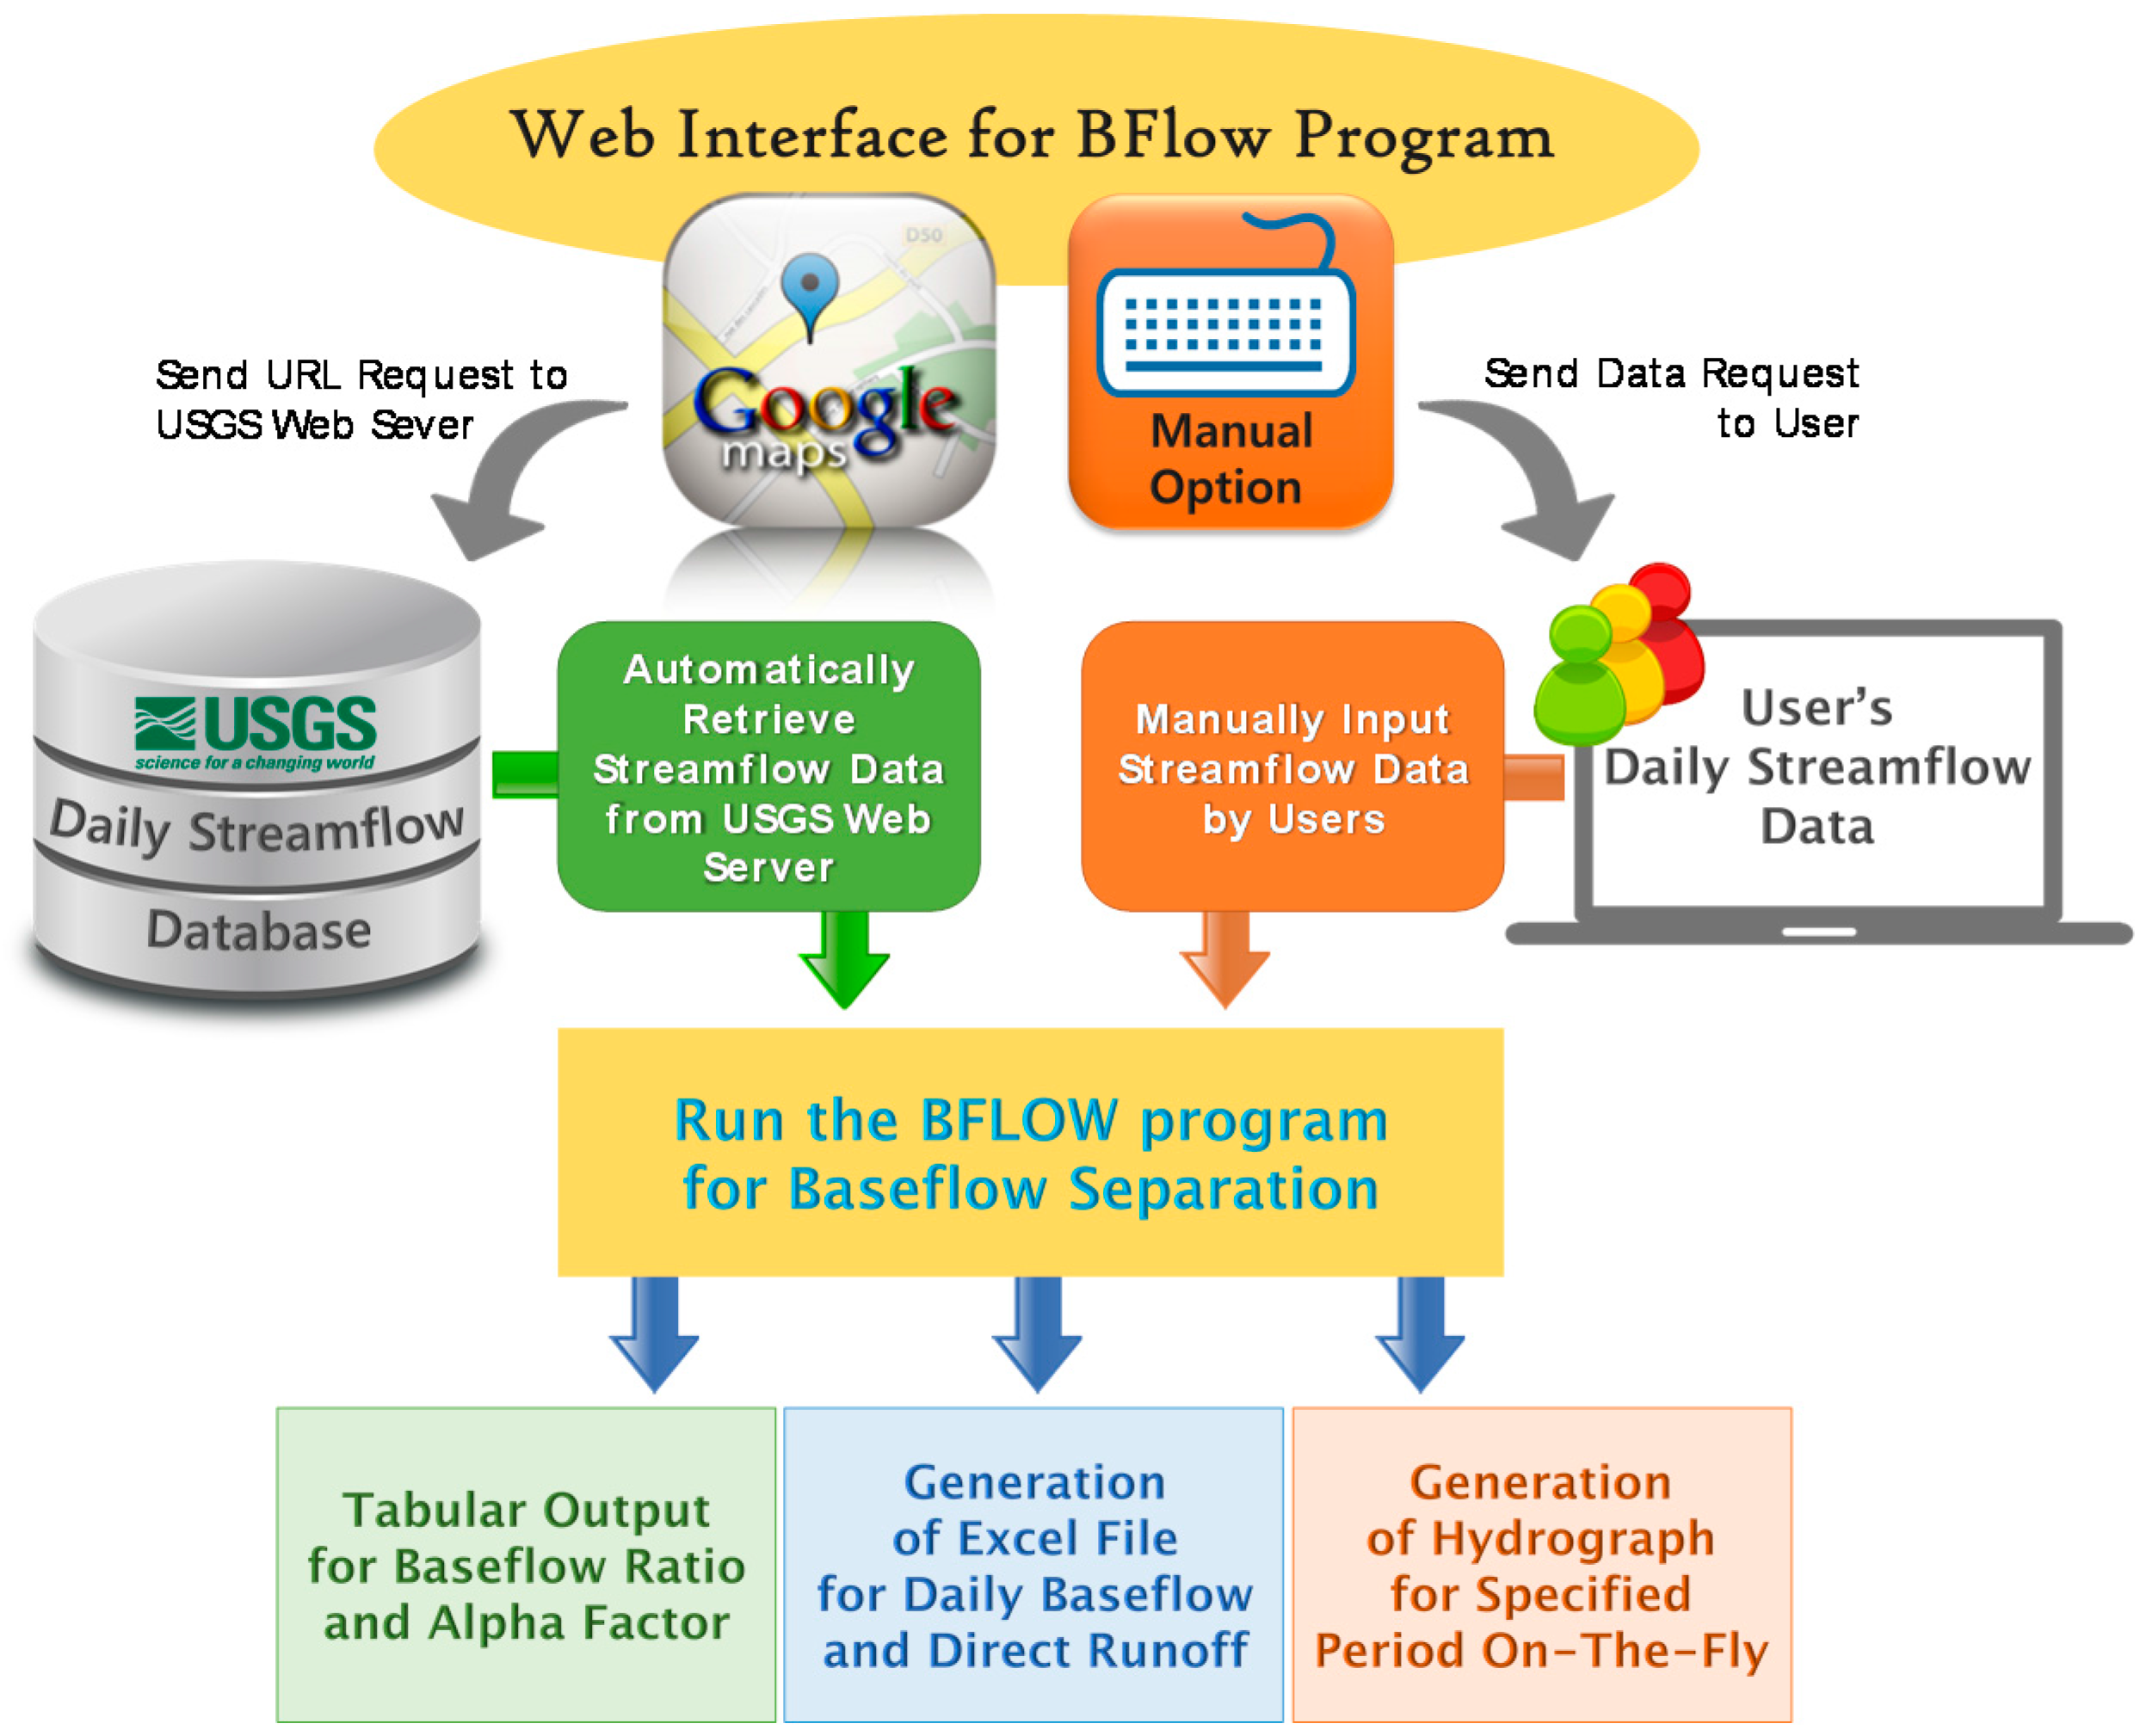
2.3. Development of the Web-Based BFlow System

The BFlow program developed by Arnold and Allen [17] has been widely employed to analyze baseflow contribution using long-term watershed runoff. To run the original BFlow program based on the MS-DOS system, users were required to manually input commands and data. For better convenience in using the BFlow program, we developed a web-based BFlow model to automate such conventional manual input by using web-programming languages such as Practical Extraction and Report Language (PERL) and Common Gateway Interface (GCI). By adding several additional functions, we extended the accessibility, availability, and applicability of the BFlow program. For example, we adopted Google Maps as a web-based interface and added an option for users to manually input the data. Specifically, the web-based BFlow system provides a function to automatically download daily streamflow data for the selected gauge station from the USGS National Water Information System (NWIS) website by selecting a gauge station marked on Google Maps, allowing for the instantaneous baseflow separation using the downloaded data. Furthermore, users can manually upload their own daily streamflow data through the web and immediately obtain the results estimated from BFlow calculations. Figure 3 shows a schematic diagram of the web-based BFlow system.
In this study, river characteristics were assessed by estimating the baseflow index (BFI), which indicates the ratio of baseflow to the total streamflow, and the coefficient of variation (CV) for daily streamflow. In addition to BFI and CV, baseflow and direct runoff were quantified to identify their contributions to rivers. In this study, BFI was estimated by applying the suggested web-based BFlow program to continuous daily streamflow data. The BFlow program has been employed in many applications to estimate BFI (e.g., [31,32,36,43]). For example, Arnold et al. [44] showed that the means of baseflow filtered by Pass2, and Pass3 are 10% and 20% less than Pass1, respectively. In such aspects, the selection of the pass provides flexible baseflow separation for the given condition, but depends on a user’s subjective decision. In this regard, Arnold and Allen [17] compared the baseflow filtered by three passes with other baseflow separation methods for eleven watersheds located in the states of Georgia (GA), Maryland (MD), Pennsylvania (PA), and Virginia, USA. They obtained the result that Pass1 leads to the consistent filtered baseflow within ±11%, compared to baseflow estimated using other methods. For this reason, Eckhardt [32] and Ahlablame et al. [36] estimated baseflow and BFI using Pass1. In this study, Pass1 was also used to estimate baseflow, direct runoff, and BFI at all gauge stations in South Korea that have continuous daily streamflow during a recent five-year period. In addition, the CVs of daily streamflow were calculated to determine the relationship between variation of daily streamflow and BFI. The CV at each gauge station can be calculated by Equation (3).
CV = σ μ
where σ is the standard deviation of daily streamflow and μ is the mean of daily streamflow.

3. Results

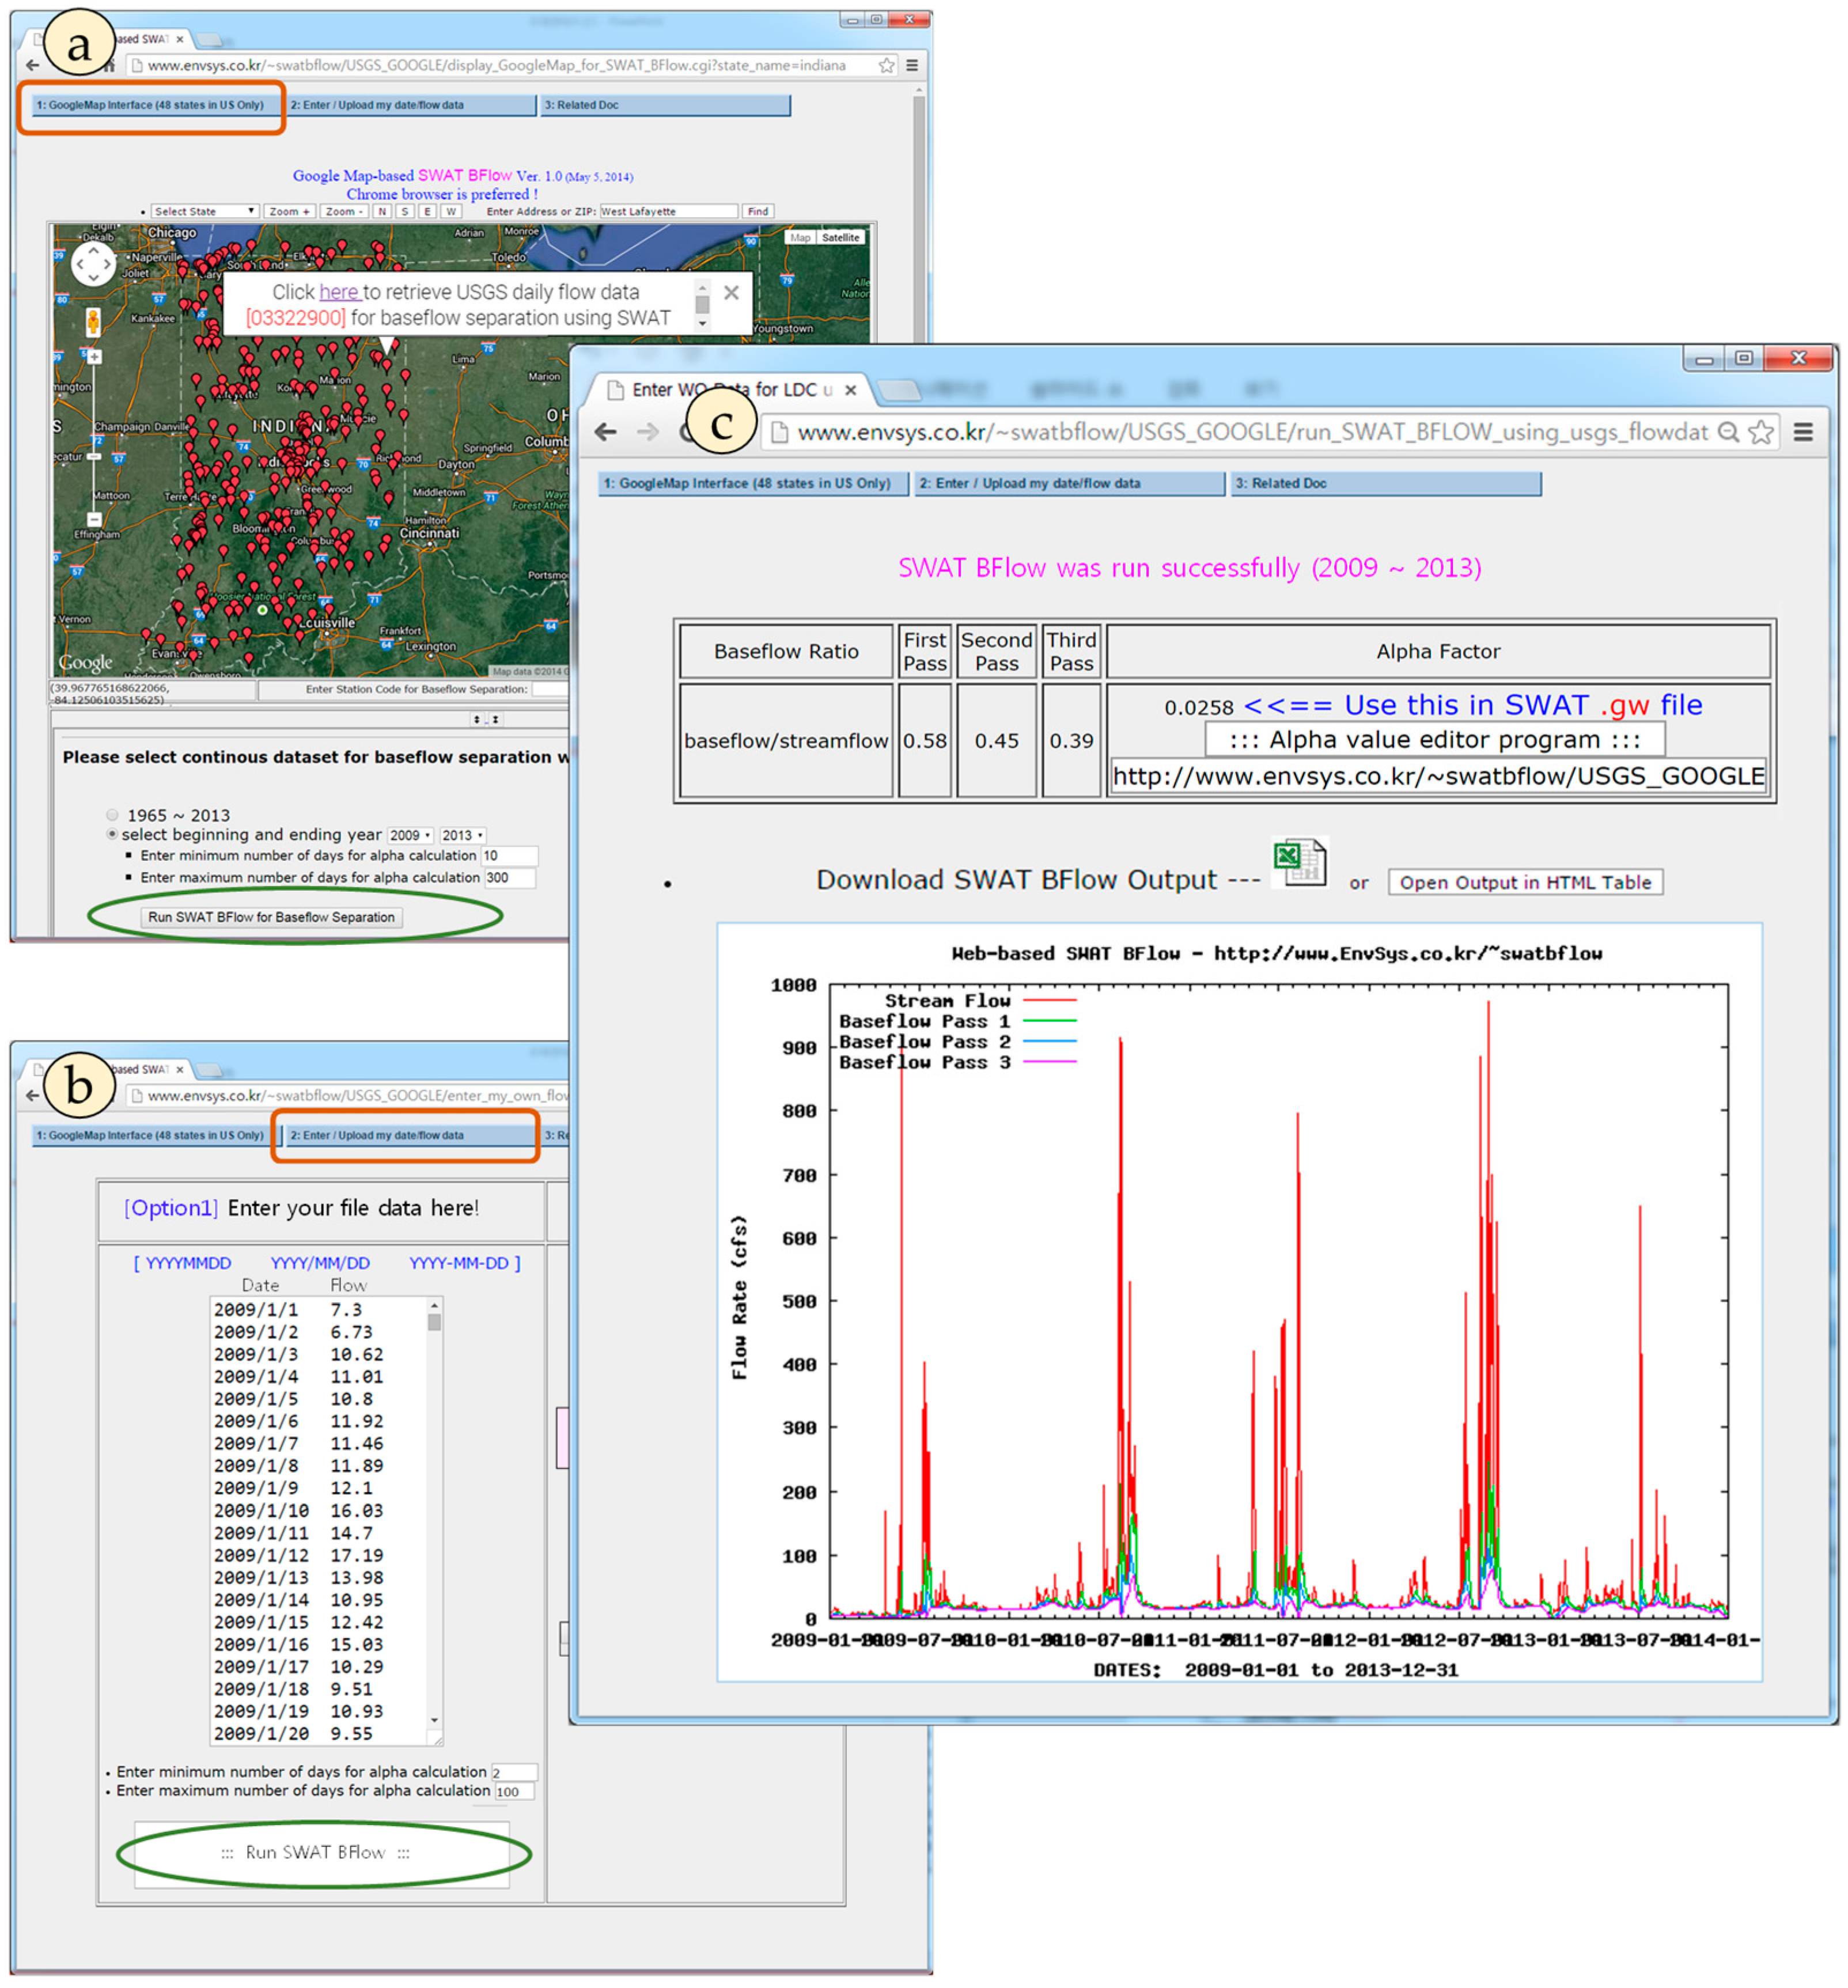
3.1. The Developed Web-Based BFlow System

To promote the accessibility, applicability, and availability of the existing BFlow program, we automated user-access and output processes of the BFlow program through a web-based interface in order to assess streamflow characteristics at a national level (Figure 4). Furthermore, by mounting the interface on Google Maps (Figure 4a), daily streamflow data at the USGS gauge stations selected by users can be used almost instantaneously. The USGS gauge stations for the U.S. are linked by bullet points (e.g., Indiana State in Figure 4a). For data in countries other than the U.S. or users’ own data, the interface offers a function that allows the users to manually upload and process streamflow data (Figure 4b). For example, Figure 4b shows a screenshot of the web-based BFlow system while uploading daily streamflow data from the Okcheon gauge station. Furthermore, Figure 4c shows the tabular output for BFI and alpha factor (baseflow recession constant), the generated EXCEL file for baseflow separation, the generated hydrograph for streamflow, and the baseflow calculated by the web-based BFlow system. Here, the estimated alpha factor can be employed as a parameter of the Soil (SWAT) model. We acknowledge that the web-based BFlow system developed in this study is not scientifically innovate. However, we expect that this web-based BFlow system will significantly contribute to savings in the time and effort required in the assessment of streamflow characteristics for water resources management and flood risk management. The web-based BFlow system is available at the GIS-based environment system laboratory webpage [45] from the Kangwon National University, South Korea.

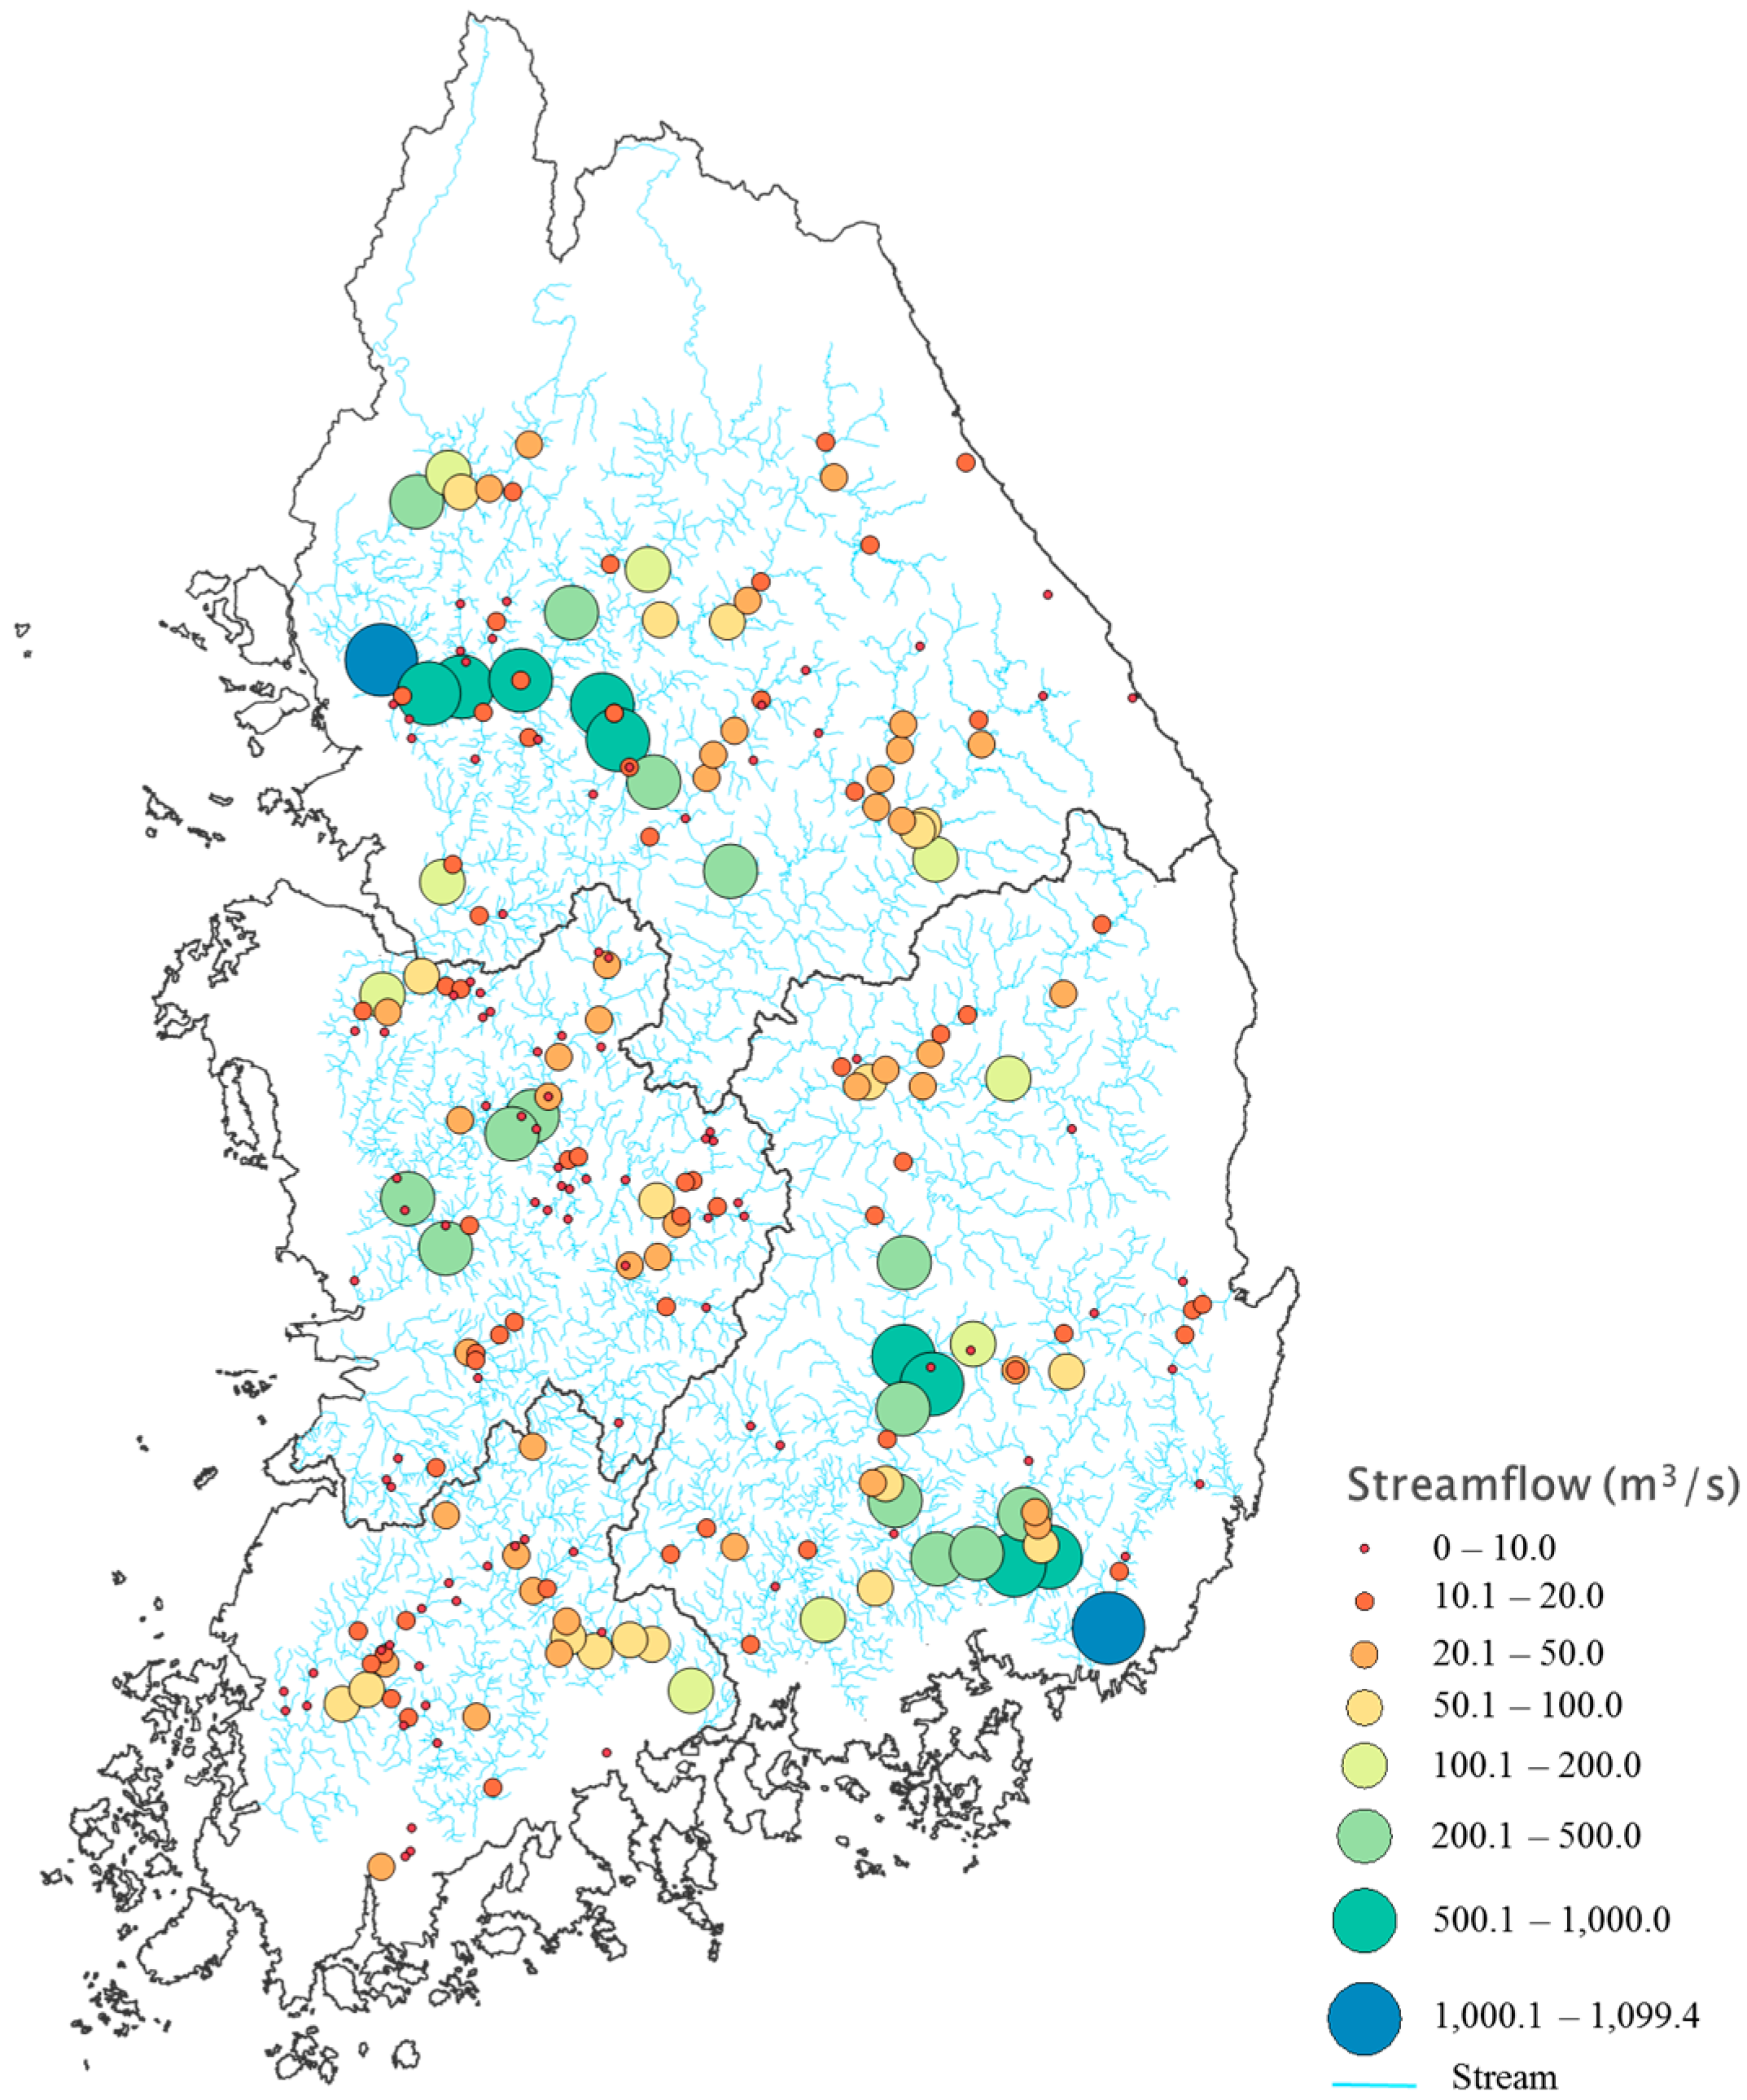
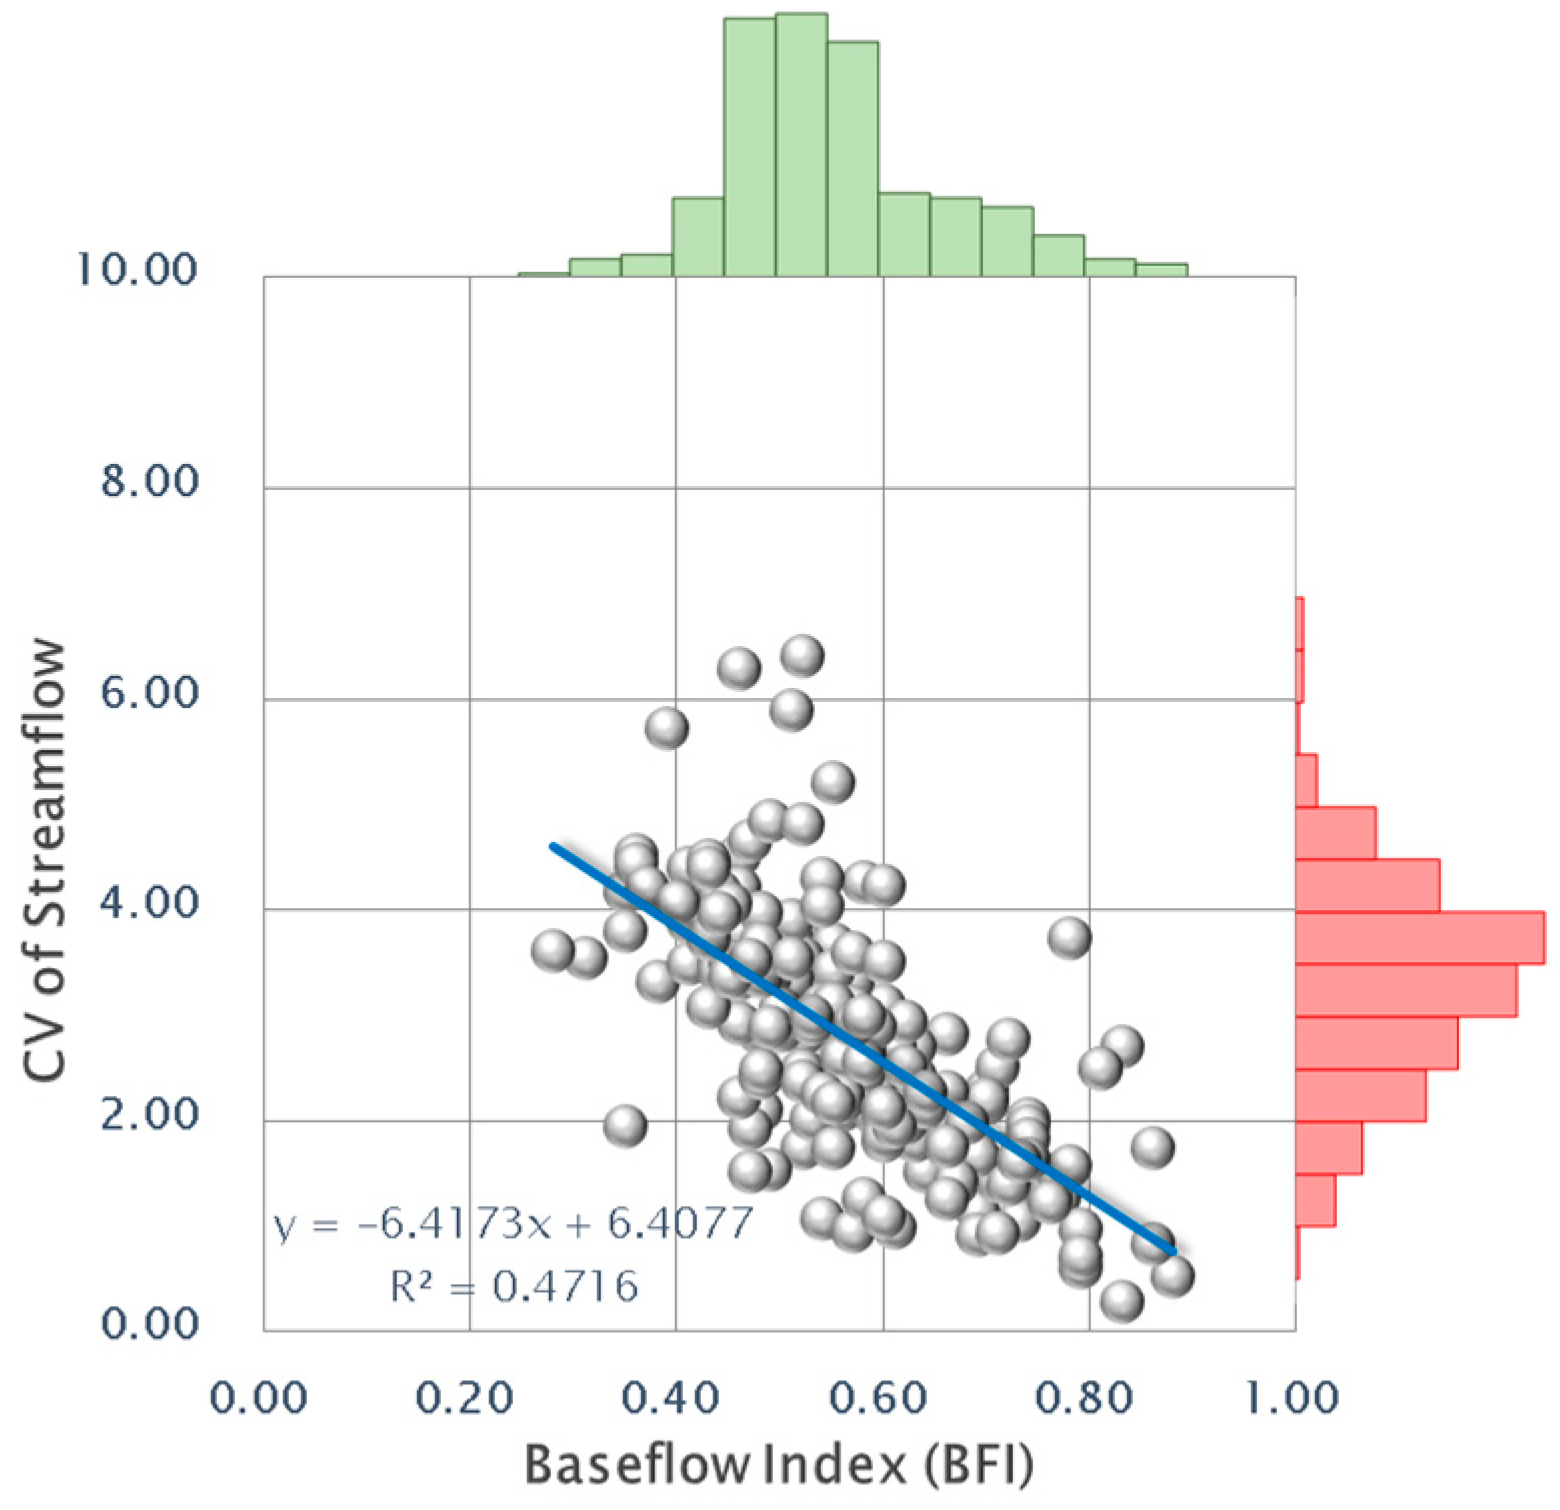
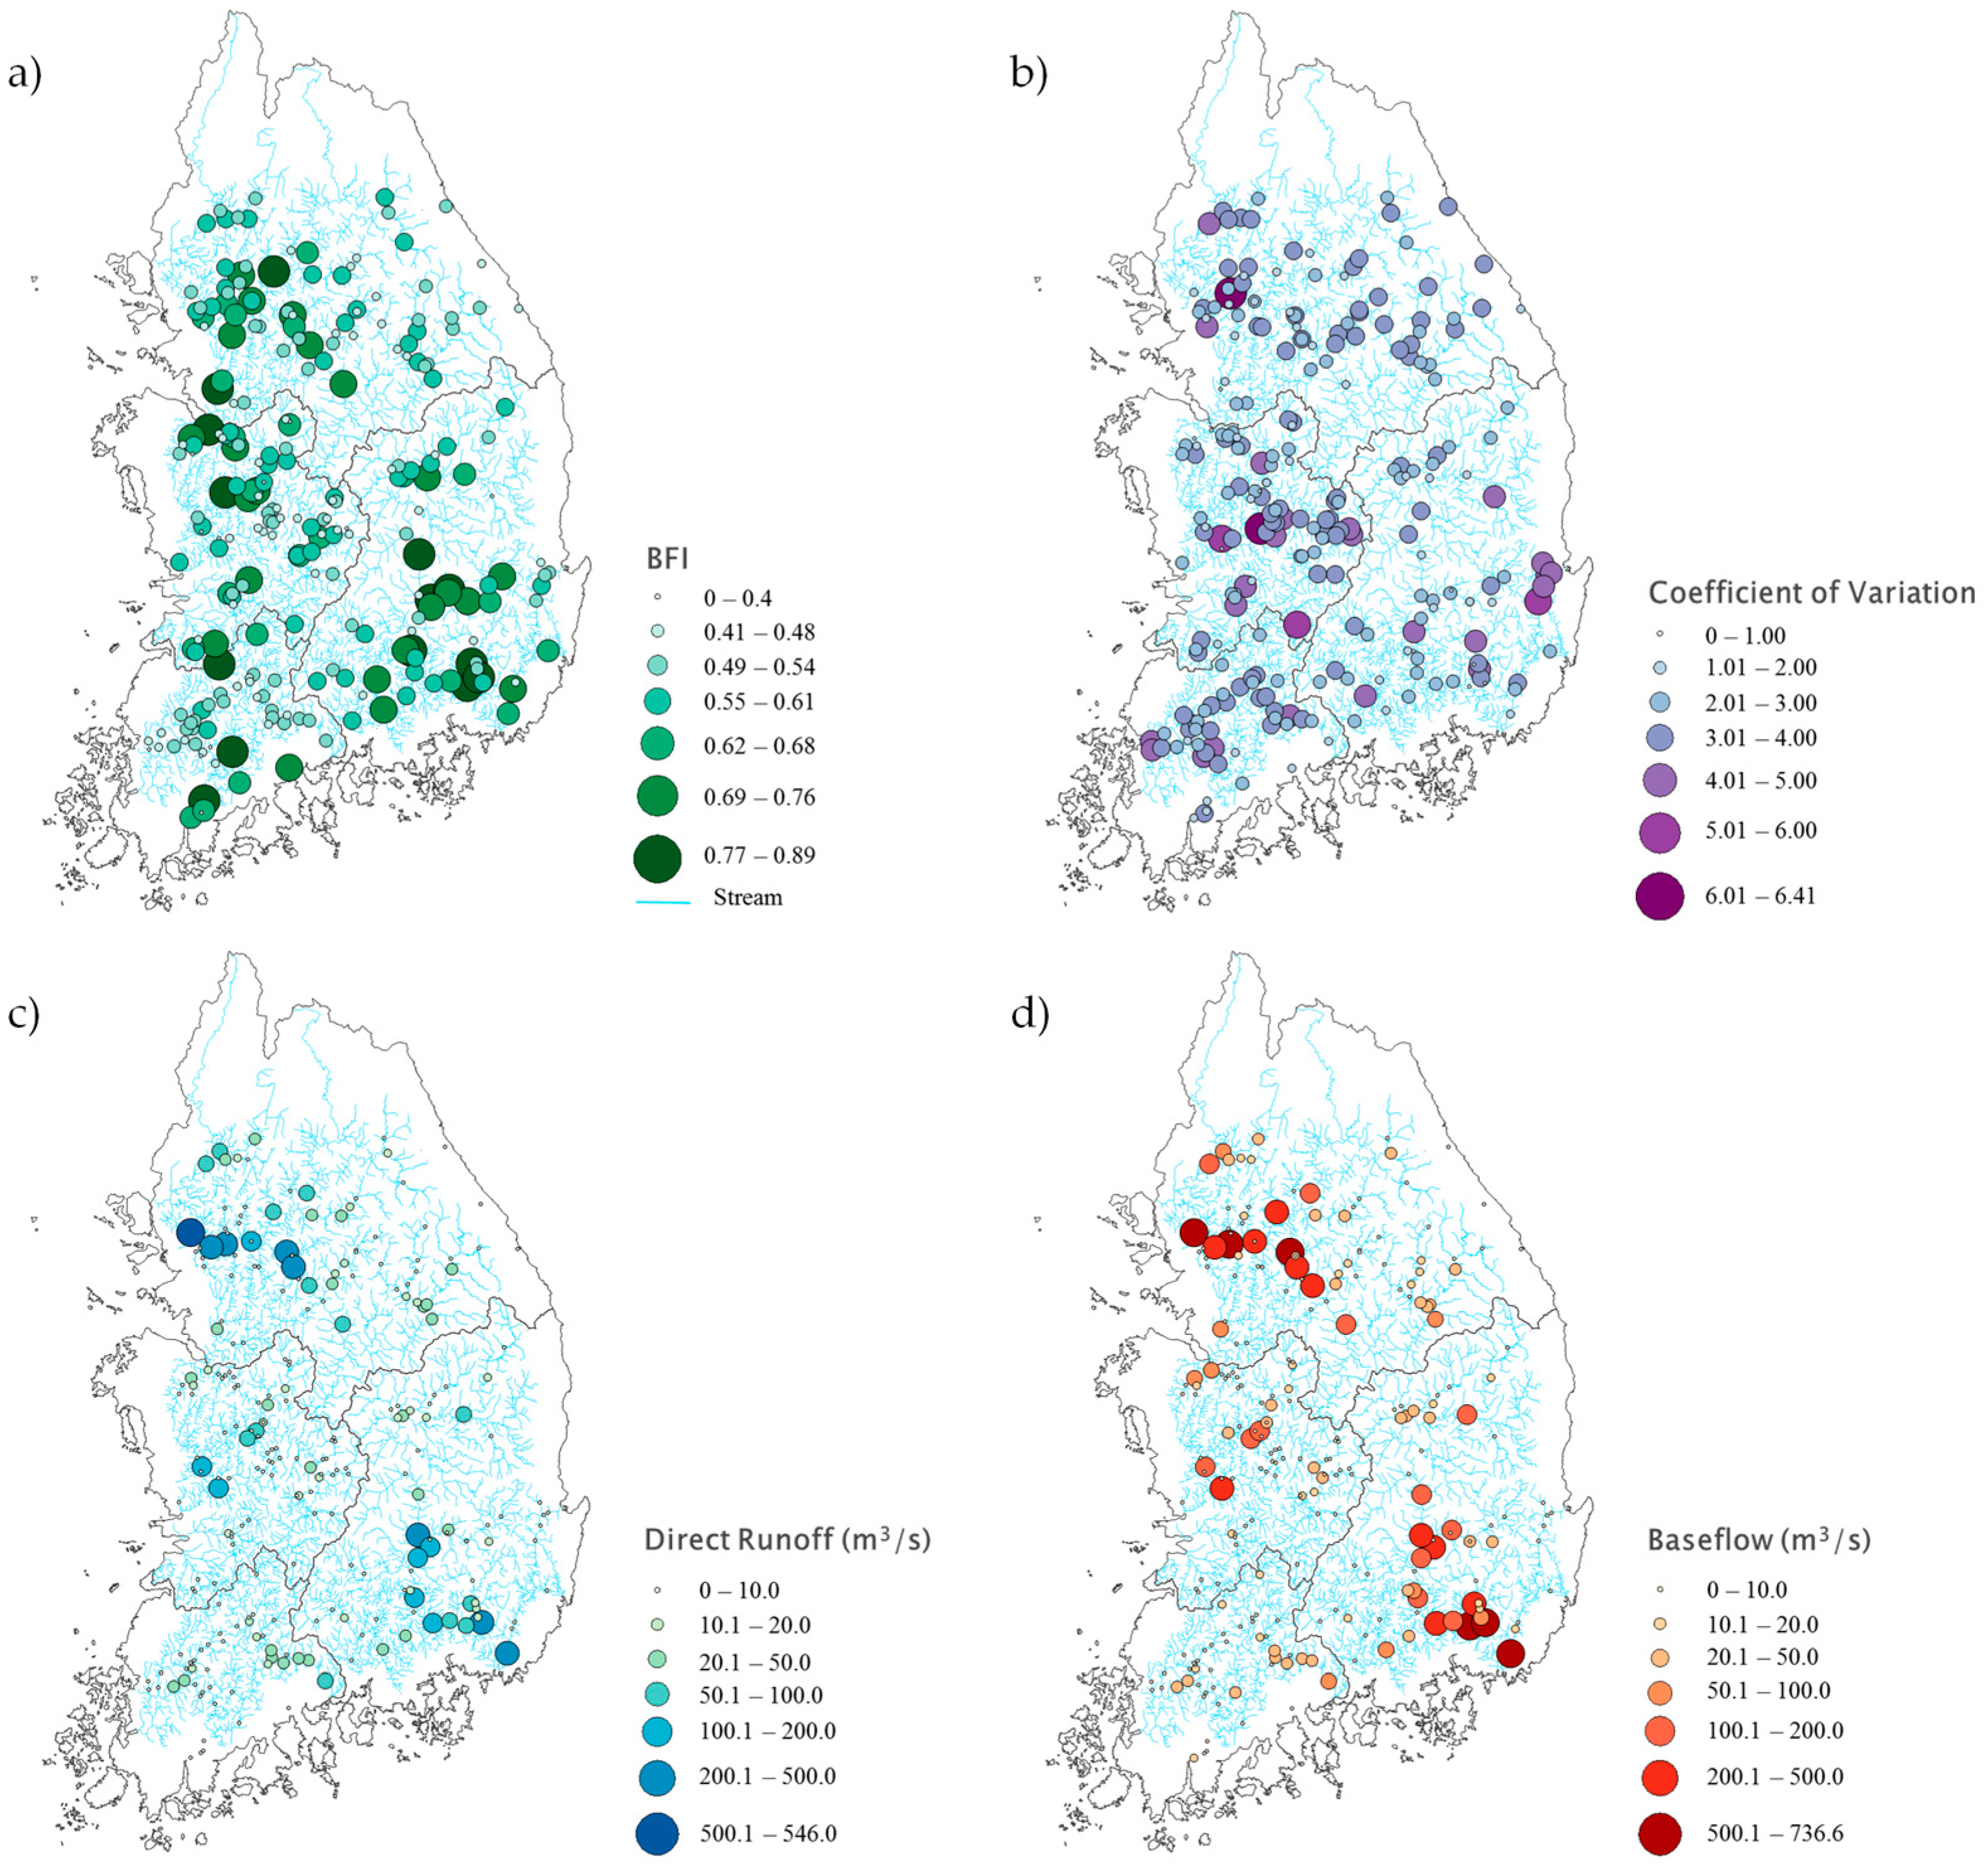
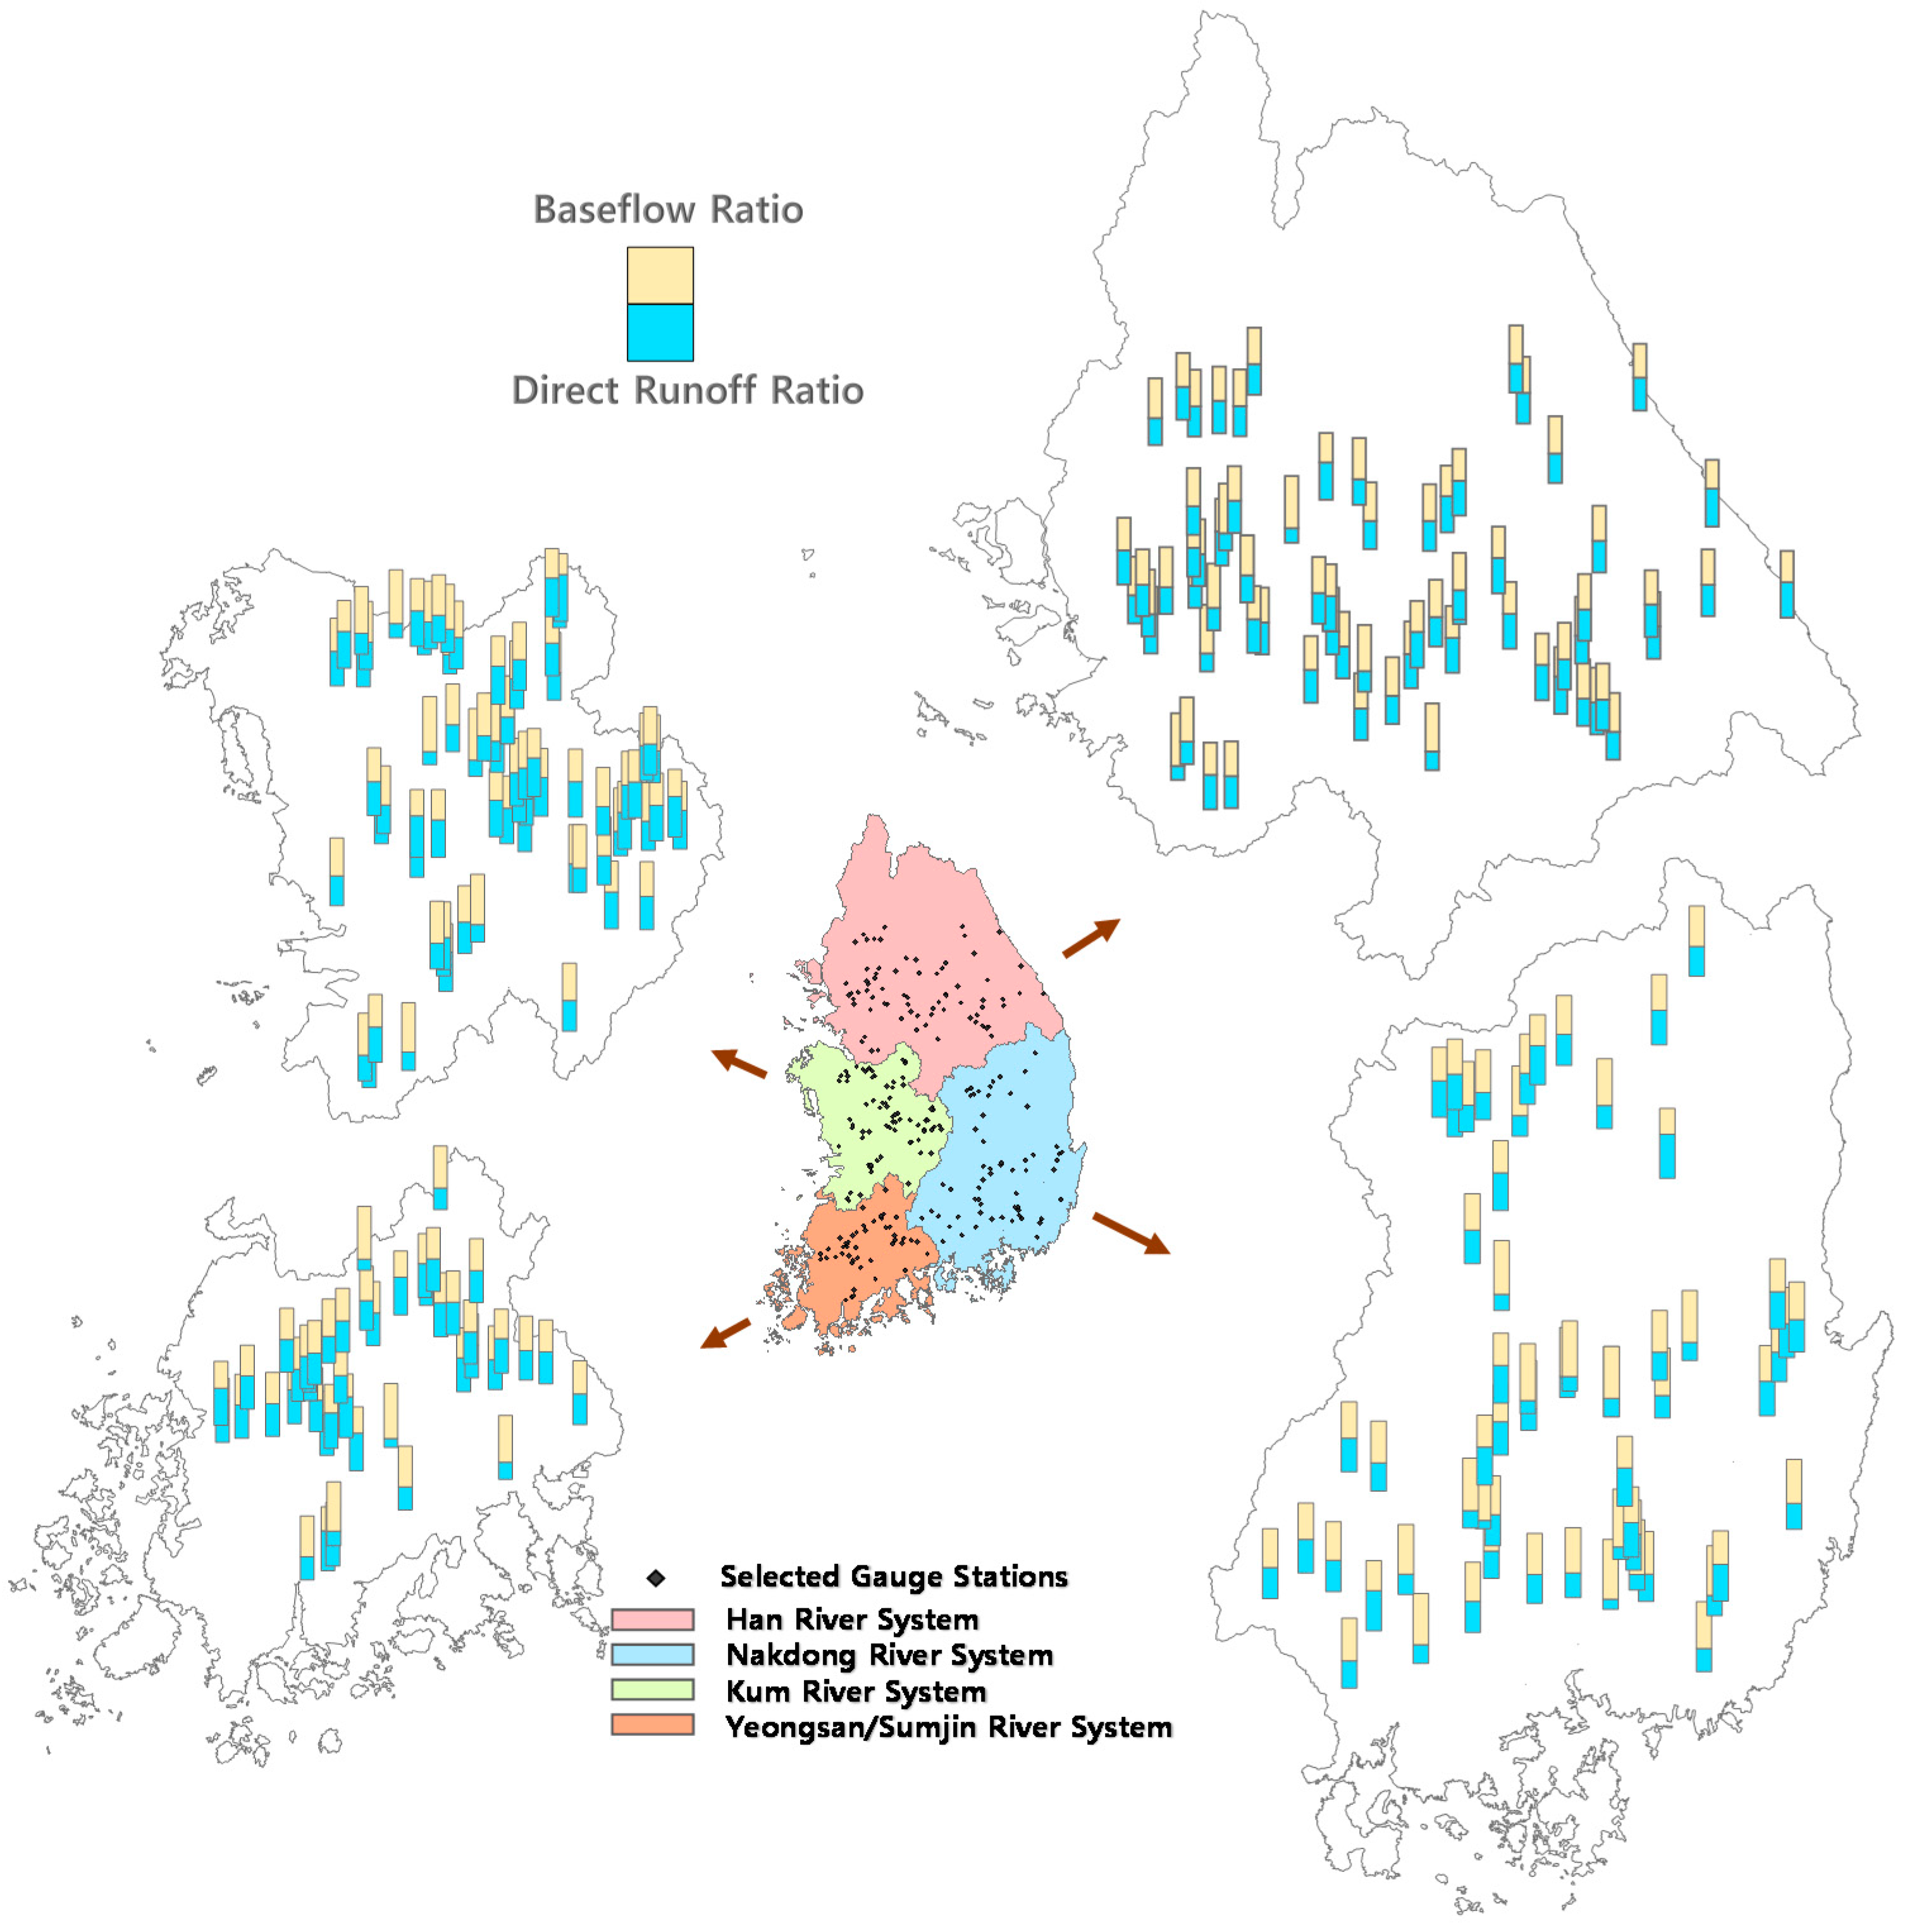
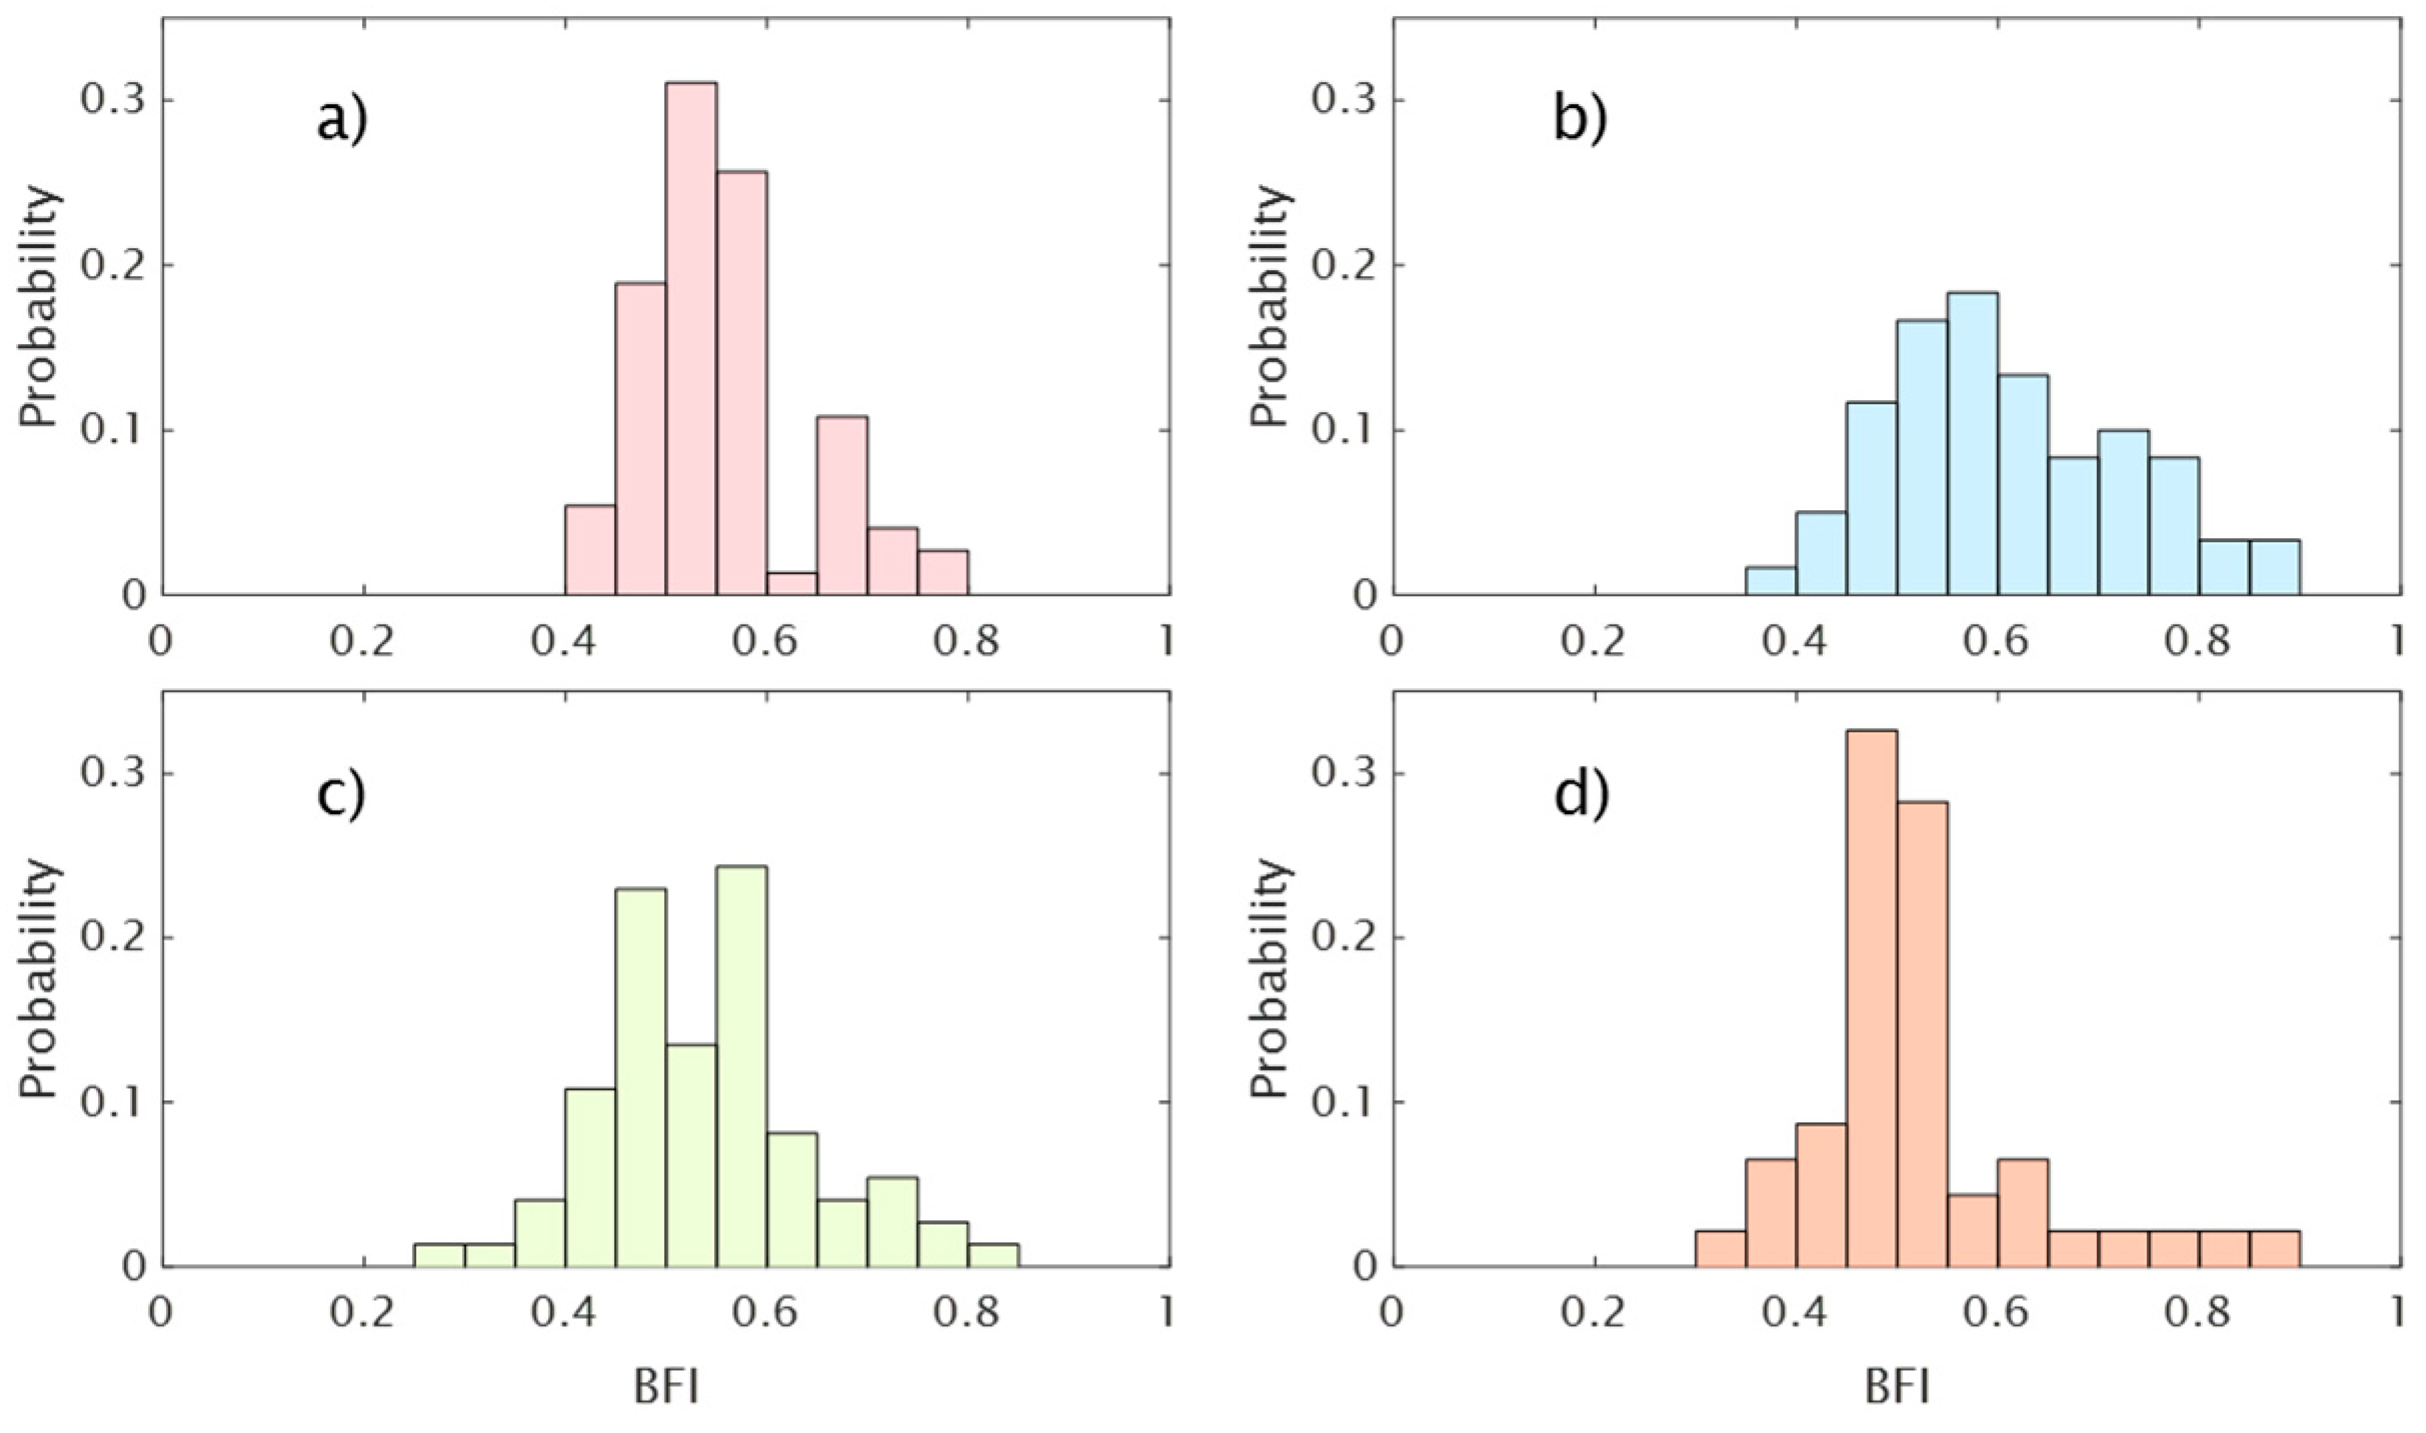
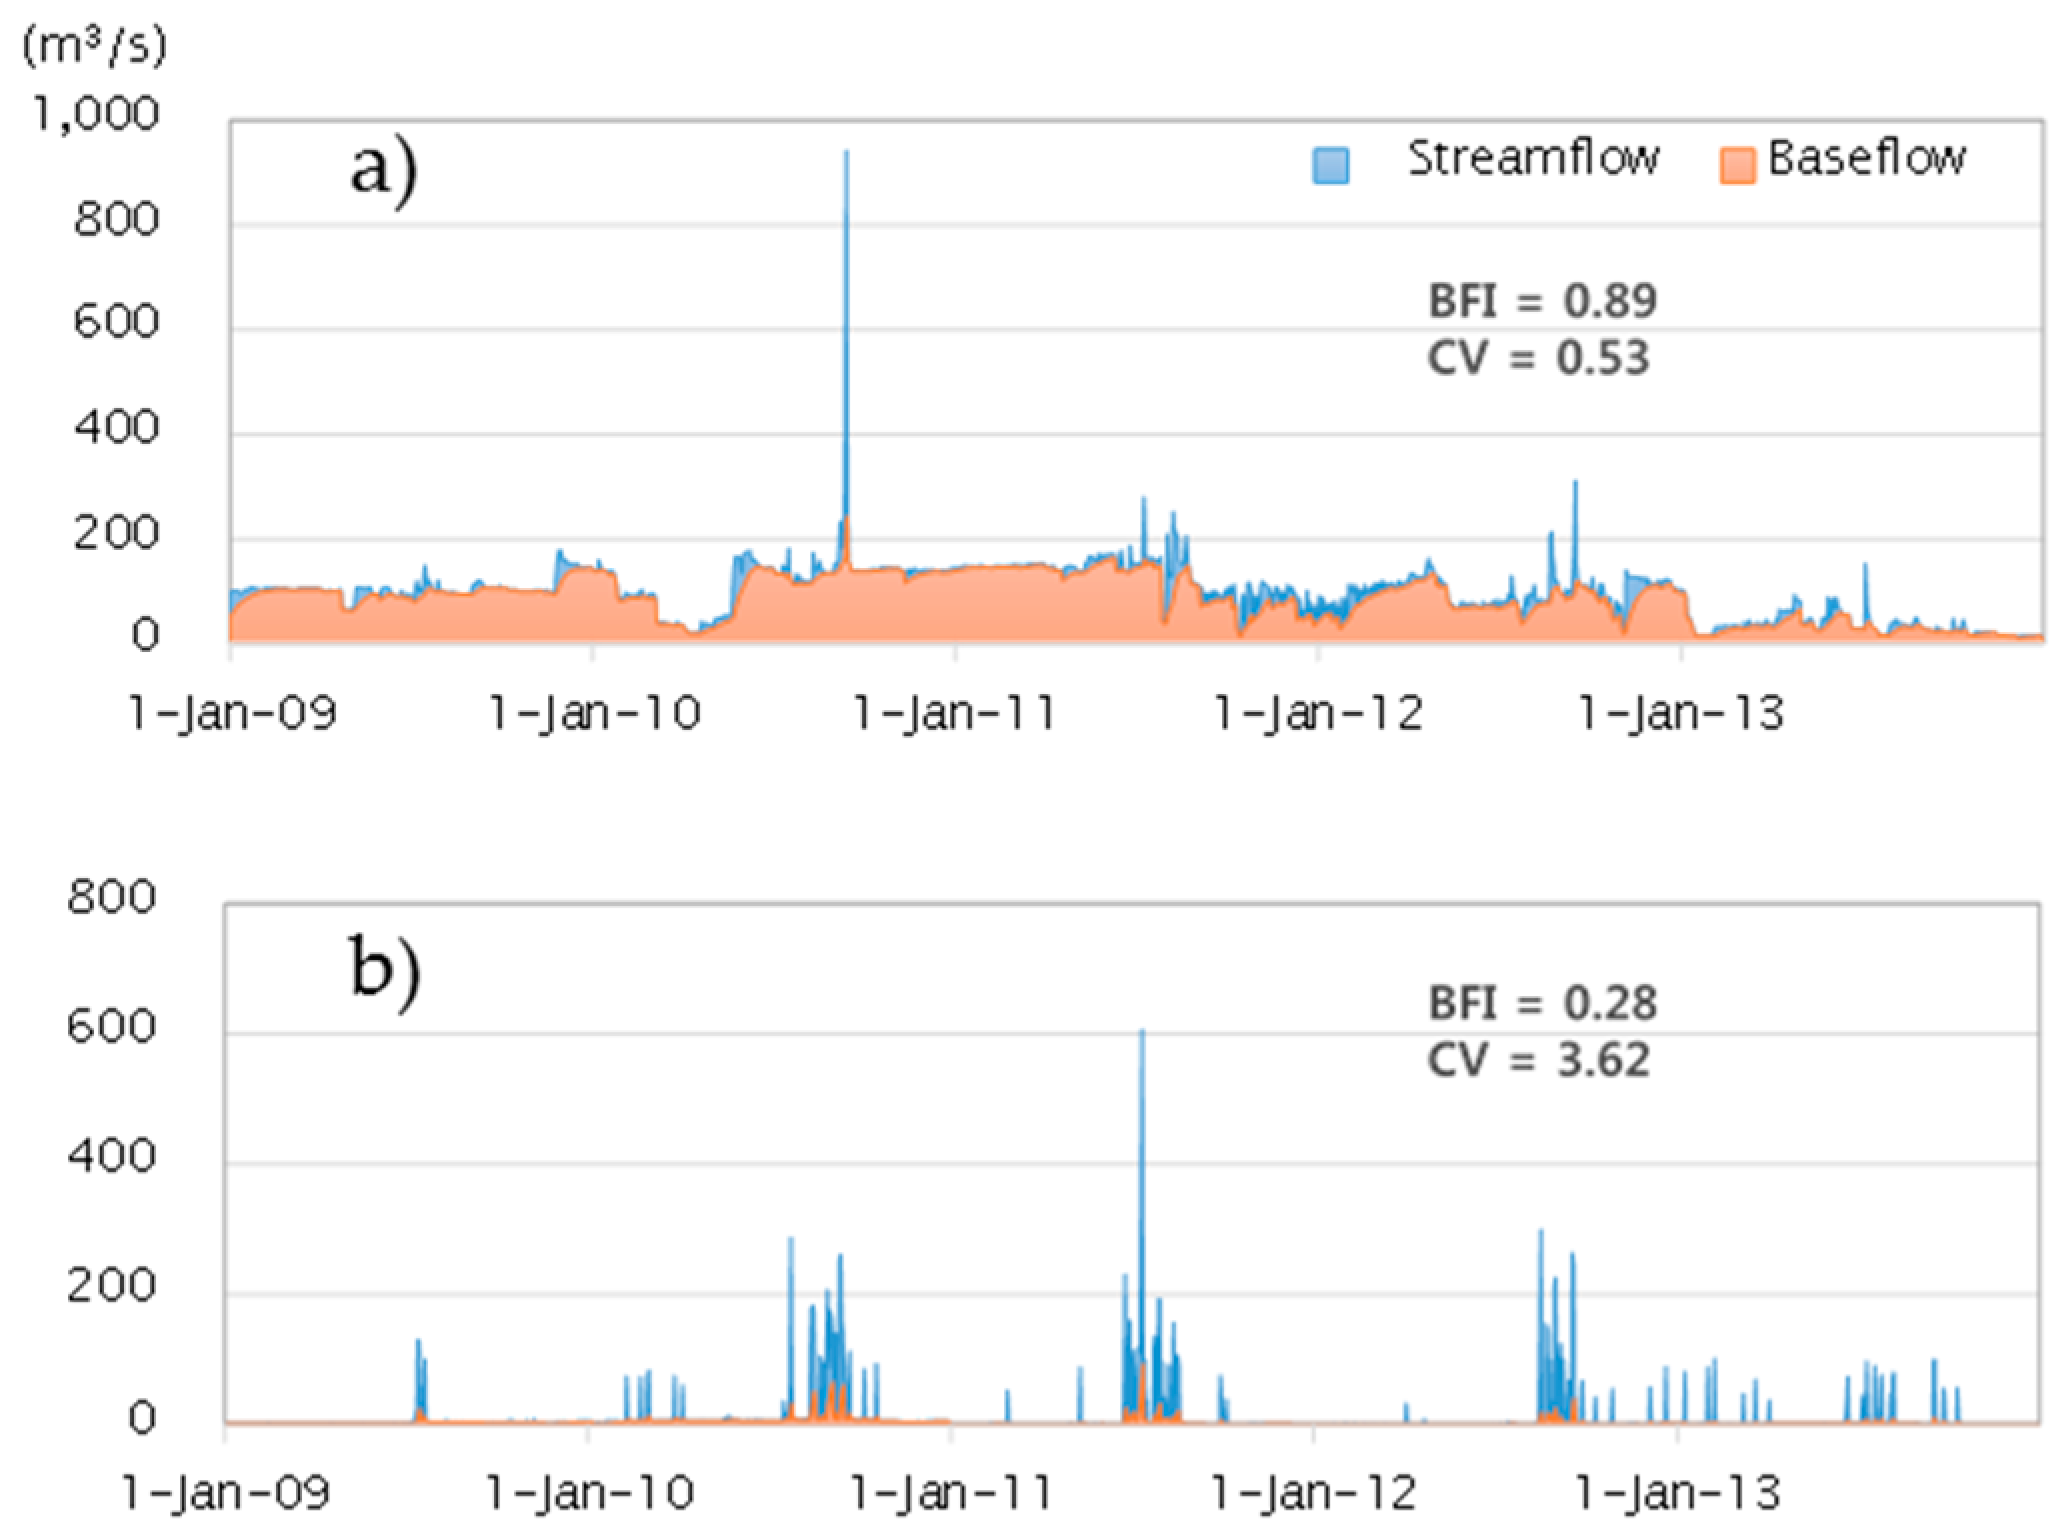
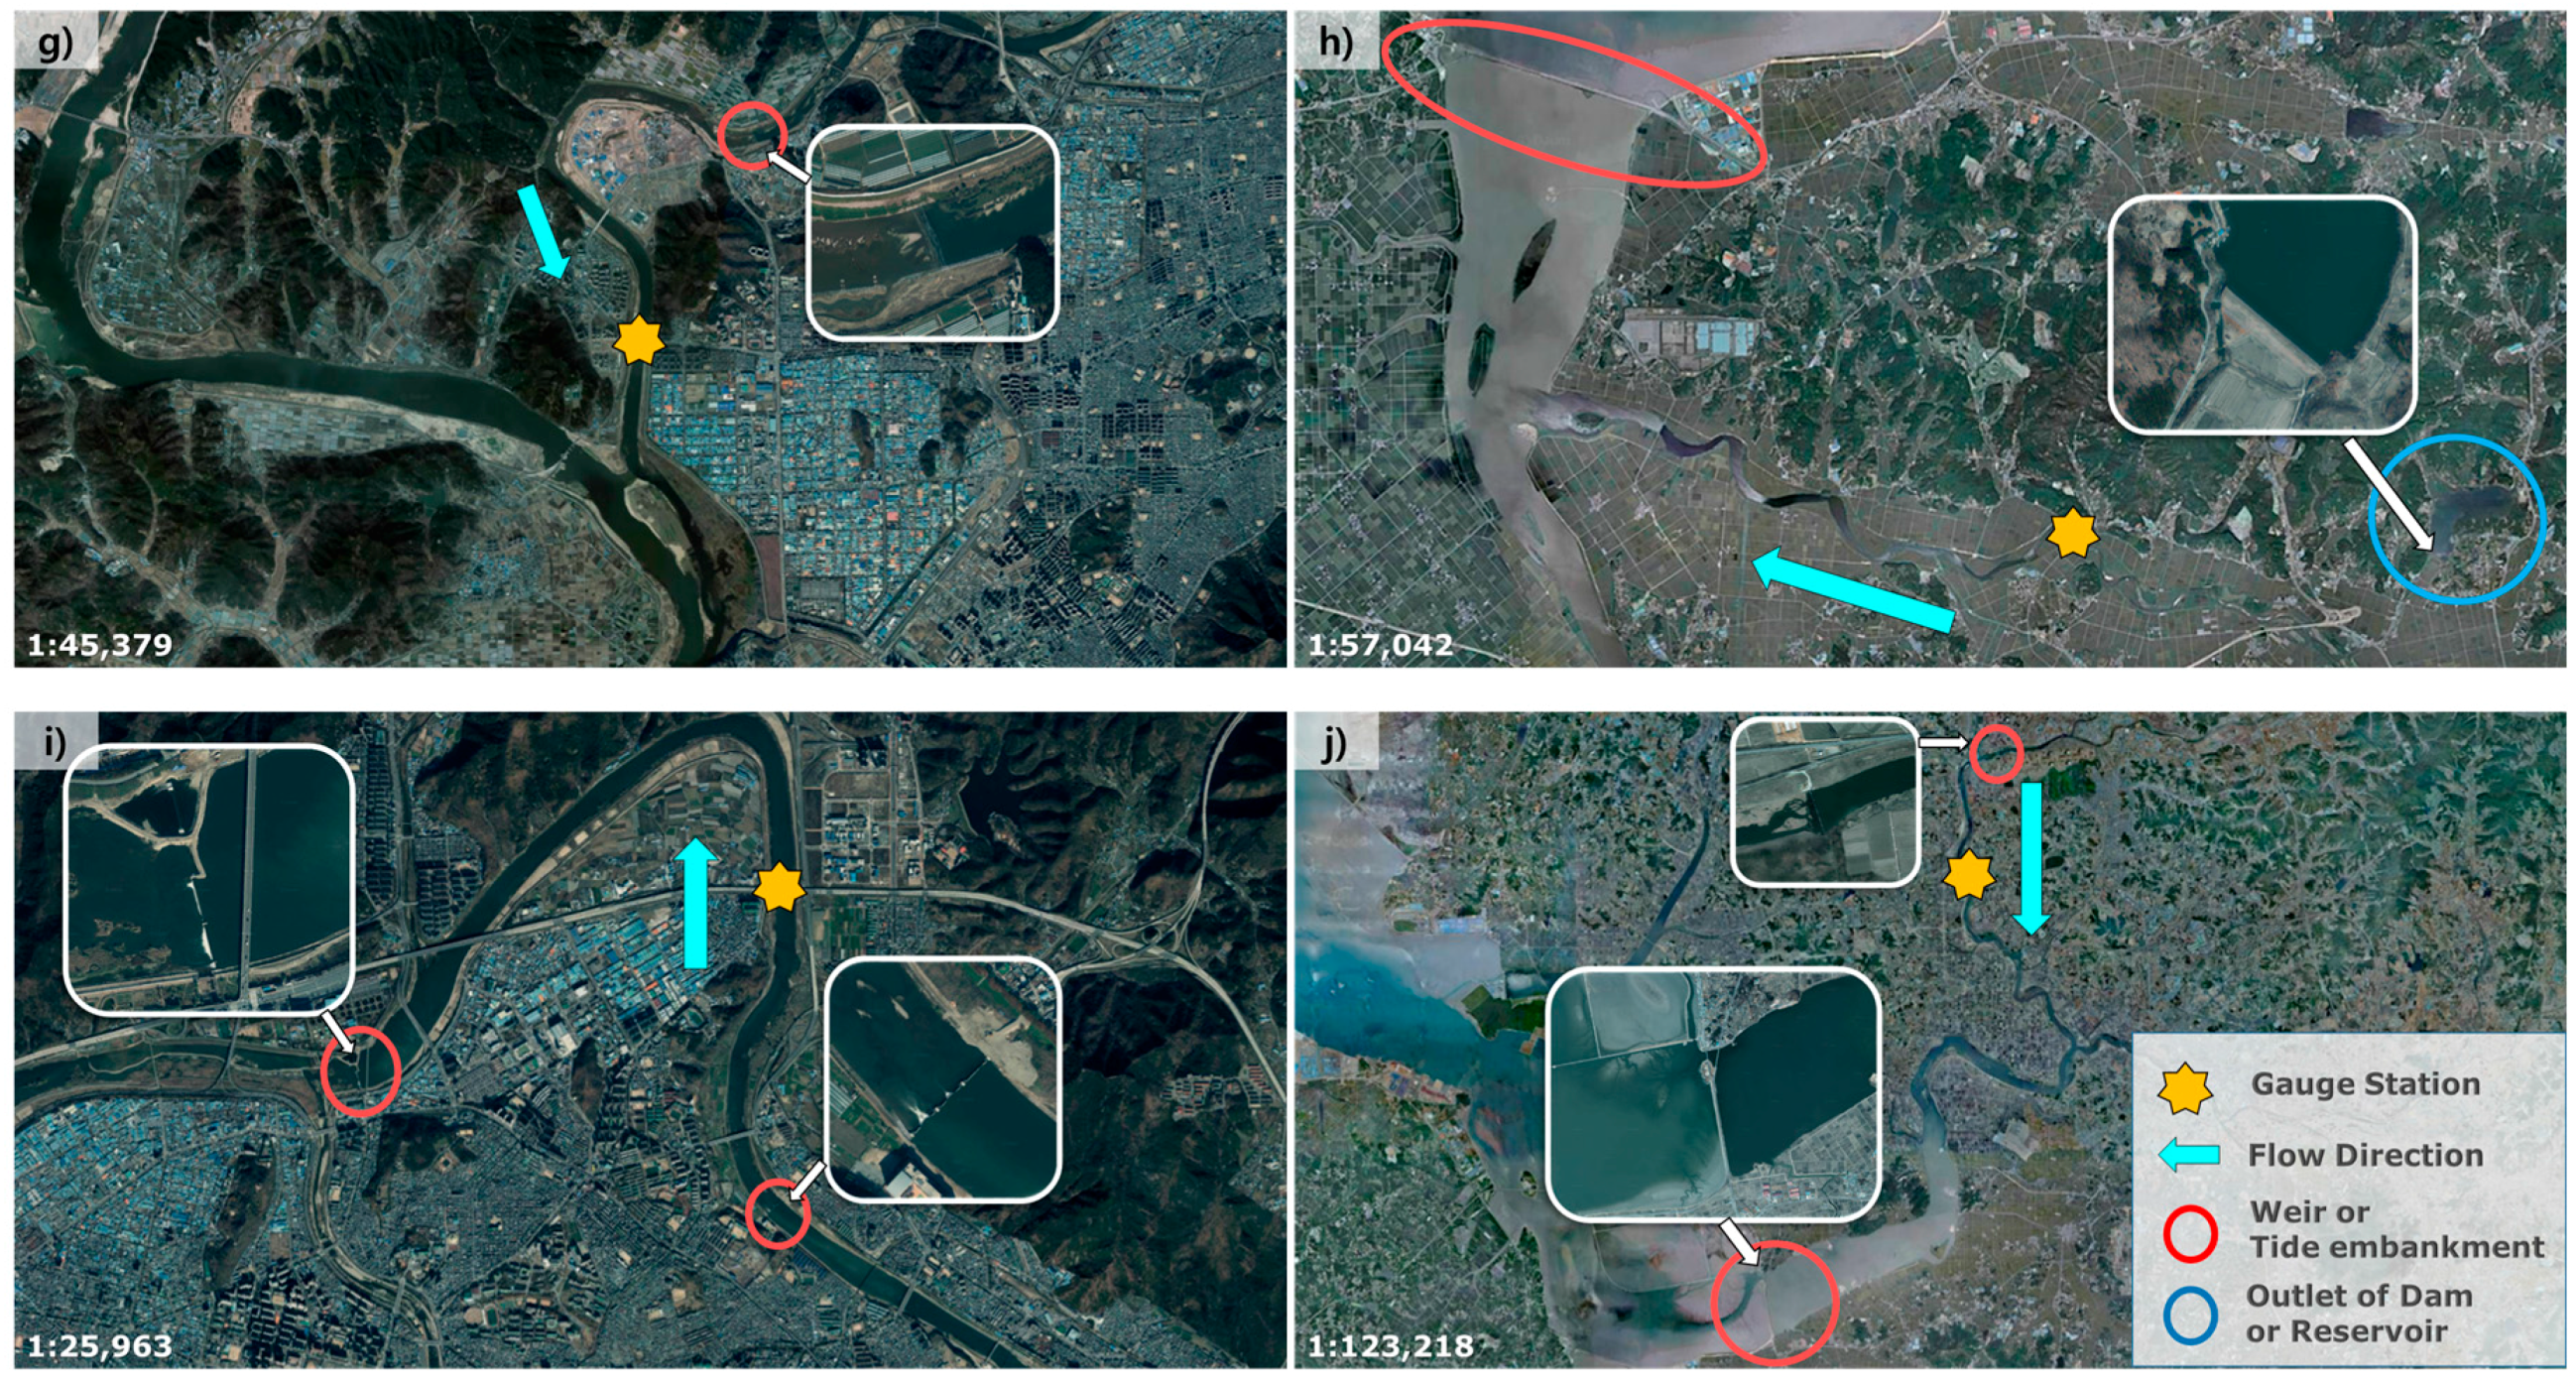
3.2. Analysis of River Characteristics

Among various hydrologic indices [47], this study estimated baseflow, direct runoff, BFI, and CV to quantify the contributions of baseflow and direct runoff to streamflow and to assess the impact of baseflow on variation of daily streamflow (Figure 5 and Table 2). Figure 5a shows the spatial distribution of BFI estimated by applying the BFlow program to daily streamflow for each gauge station. The estimated BFI ranged between 0.28 and 0.89 and showed a maximum value at Hapcheon gauge station located in the NR system and a minimum value at Wonpyeong gauge station located in the GR system. In addition, in order to quantify the variability of daily streamflow, the CV showing the ratio of the standard deviation for the mean value of daily streamflow was calculated for each gauge station. Figure 5b shows the distribution of calculated CV, which ranged from 0.29 (Sammun gauge station in the NR system) to 6.41 (Joongryang gauge station in the HR system). In the case of direct runoff (Figure 5c), the maximum value was estimated to be 546.0 m3/s at Haengjukyo gauge station located in the HR system, and the minimum value was estimated to be 0.4 m3/s at Bangdong gauge station located in the GR system. On the other hand, baseflow (Figure 5d) was estimated to be greatest (362.8 m3/s) at Kupo gauge station located in the NR system and lowest (0.3 m3/s) at Bangdong gauge station located in the Geum River Basin, which is similar to the mean daily streamflow (Figure 2). These results show that baseflow greatly contributes to maintaining rivers. In Korea, however, many projects for river maintenance and water resources have been carried out to maintain flows by constructing hydraulic structures and, therefore, the contribution of baseflow calculated in this study is likely to be artificially inflated depending on regional characteristics.
Figure 6 shows the relative ratio of the contribution of baseflow and direct runoff to streamflow. This study found that the baseflow contributed more than 50% of river streamflow at 163 gauge stations (64%). In addition, BFIs of greater than 50% were estimated to constitute 54 out of 74 gauge stations for the HR system (75%), 48 out of 60 gauge stations for the NR system (80%), 42 out of 74 gauge stations for the GR system (57%), and 19 out of 46 gauge stations for the YSR system (41%). Hence, the contribution of baseflow to streamflow at gauge stations belonging to the NR system was higher than for other river systems. The distributions of BFI by river system are represented with a histogram (Figure 7). From the results, it is evident that Korean rivers have different characteristics in direct runoff and baseflow per river system.
Both maximum and minimum BFIs occurred in the NR system. Figure 8 shows the baseflow separation results of applying BFlow to streamflow at Hapcheon gauge station with maximum BFI (Figure 8a) and Wonpyeong gauge station with minimum BFI (Figure 8b). In Figure 8a,b different contribution of baseflow can be clearly seen in each hydrograph. Here, the mean was calculated to be 96.3 m3/s with a standard deviation of 51.1 m3/s for 1826 daily streamflow data points collected between 2009 and 2013 at Hapcheon gauge station, which had the maximum BFI of all gauge stations (0.89). Accordingly, the CV for Hapcheon gauge station was calculated to be 0.53. On the other hand, in the case of Wonpyeong gauge station with the minimum value of BFI (0.28), the mean daily streamflow was estimated to be 9.2 m3/s with a standard deviation of 33.4 m3/s, resulting in a CV of streamflow of 3.62, which is about eight times greater than for Hapcheon gauge station. Given these points, it is considered that there is a correlation between CV and BFI. For all gauge stations, the relationship between CV and BFI was analyzed, and Figure 9 illustrates that the greater the BFI, the smaller the CV. The trend of streamflow can be directly influenced by climatic/human impacts such as climate change and land use change [48,49]. In particular, if climatic impacts on streamflow occur in the river environments of Korea with more distinct seasonal characteristics, the contribution of baseflow to streamflow will decrease more during the dry season and direct runoff will increase more during wet season.
According to WAMIS, 85 dams are operated in South Korea. These dams can affects the results of the streamflow characteristics analysis conducted in this study because the dams were conducted to regulate the flow regime of rivers. In order to validate this, satellite photos provided by Naver Map [50] were analyzed for gauge stations with the top ten BFI values: Hapcheon (NR system), Soosan (NR system), Jangeon (YSR system), Sammun (NR system), SSangchi (YSR system), Woosung (GR system), Sungseo (NR system), Kangcheong (NR system), Dongyeonkyo (HR system), and Sankyuk (NR system). The analysis results showed that high BFI areas are highly affected by artificiality and are therefore controlled by discharge regulations through dams and not by natural baseflow (Figure 10). At Hapcheon gauge station, for example, the high estimate for the BFI of streamflow was likely caused by the impact of discharge flow from Hapcheon Dam upstream and the construction of a reservoir affecting the estimation downstream (Figure 10a). In addition, the baseflow ratio of Susan gauge station located in the Nakdong River mainstream is considered to have been estimated to be high because Changnyeonghaman Weir was constructed upstream by the four-river project (Figure 10b). Moreover, at the remaining gauge stations (Figure 10c–j), BFI is considered to have been high due to anthropogenic influences such as hydraulic structures. Therefore, the definition of direct runoff separation may be more accurate than that of baseflow separation because most rivers and streams in Korea are greatly influenced by artificial elements. Based on this definition, streamflow needs to be classified into direct runoff and runoff other than direct runoff (baseflow + artificially driven baseflow).

4. Discussions and Conclusions

In order to generally evaluate the characteristics of rivers or streams in South Korea, this study estimated BFI and CV and quantified direct runoff and baseflow. To this end, gauge stations with available streamflow data for the most recent five years were investigated, and baseflow separation was carried out by applying BFlow. BFI derived from this study ranged from 0.28 to 0.89 and BFIs greater than 0.5 were found for 172 out of 254 total gauge stations (67%). Smaller BFI values were related to greater influences of direct runoff, so efforts to reduce damage caused by direct runoff, such as flooding and soil loss, are needed during the wet season in watersheds that contain gauge stations with small BFIs. However, it is also noted that a river with high BFI can rapidly reach flood peaks depending on the river’s conveyance capacity [51]. In addition, in urban areas, measures to reduce impervious surfaces are required in order to prevent the increase of direct runoff [52,53,54].
We estimated and compared the CV of river daily streamflow for gauge stations with the greatest domestic BFI and gauge stations with the smallest BFI. As a result, the CV of the river was estimated to be about eight times greater for the gauge station with the minimum BFI than for the gauge station with the maximum BFI. This study illustrated the results of analyzing the relationship between CV and BFI of streamflow for 254 gauge stations. Based on these results, Korean river management needs to consider regional contributions of baseflow and direct runoff to streamflow for each river system.
Due to Korea’s river environment showing an increase in both impervious surfaces due to urbanization and intensive rainfall caused by climate change [4,55,56], the contribution of direct runoff to river streamflow was expected to be relatively greater than that of baseflow, but the results were the opposite. In this regard, the BFI of Korean rivers is likely to be higher because of anthropogenic influences such as dams, reservoirs, and weirs as well as natural baseflow. The results of investigating the area surrounding the gauge stations with the top ten BFI values were supported by the possibility that BFI is increasing due to hydraulic structures located upstream and downstream of gauge stations. Therefore, due to the impact of artificially derived baseflow, the use of BFlow on Korean rivers is closer to direct runoff separation than the definition of baseflow separation, and streamflow components need to be classified in further detail into “direct runoff” and “not direct runoff” (baseflow + artificially driven baseflow).

Supplementary Materials

The following are available online at https://www.mdpi.com/2073-4441/8/9/384/s1, Figure S1: Locations of the gauge stations.

Acknowledgments

This research was supported by the GeoAdvanced Innovative Action (GAIA) Project (No. 201400054003, Surface Soil Resources Inventory and Integration: SSORII Research Group) in the Republic of Korea.

Author Contributions

The manuscript was primarily written by Younghun Jung. Each one of the authors contributed to this work, Nam-Il Won collected the required data in the field works/measurements and the data analysis. Younghun Jung and Yongchul Shin developed the structure of the study, the manuscript, results, discussion and concluding remarks. Kyoung Jae Lim supervised and guided this work. All authors contributed to the development of the approach, editing multiple drafts, and offering comments and corrections.

Conflicts of Interest

The authors declare no conflict of interest.

References

  1. Wilby, R.L.; Whitehead, P.G.; Wade, A.J.; Butterfield, D.; Davis, R.J.; Watts, G. Integrated modelling of climate change impacts on water resources and quality in a lowland catchment: River Kennet, UK. J. Hydrol. 2006, 330, 204–220. [Google Scholar] [CrossRef]
  2. Corsi, S.R.; Borchardt, M.A.; Spencer, S.K.; Hughes, P.E.; Baldwin, A.K. Human and bovine viruses in the Milwaukee River watershed: Hydrologically relevant representation and relations with environmental variables. Sci. Total Environ. 2014, 490, 849–860. [Google Scholar] [CrossRef] [PubMed]
  3. Kim, J.S.; Jain, S.; Yoon, S.K. Warm season streamflow variability in the Korean Han River Basin: Links with atmospheric teleconnections. Int. J. Climatol. 2012, 32, 635–640. [Google Scholar] [CrossRef]
  4. Jung, I.W.; Bae, D.H.; Lee, B.J. Possible change in Korean streamflow seasonality based on multi-model climate projections. Hydrol. Process. 2013, 27, 1033–1045. [Google Scholar] [CrossRef]
  5. Jeong, C.; Lee, T. Copula-based modeling and stochastic simulation of seasonal intermittent streamflows for arid regions. J. Hydro-Environ. Res. 2015, 9, 604–613. [Google Scholar] [CrossRef]
  6. Kim, S.J.; Kwon, H.J.; Park, G.; Lee, M.S. Assessment of land-use impact on streamflow via a grid-based modelling approach including paddy fields. Hydrol. Process. 2005, 19, 3801–3817. [Google Scholar] [CrossRef]
  7. Chang, H.; Franczyk, F. Climate change, land-use change, and floods: Toward an integrated assessment. Geogr. Compass 2008, 2, 1549–1579. [Google Scholar] [CrossRef]
  8. Kim, Y.; Chung, E.S. Integrated assessment of climate change and urbanization impact on adaptation strategies: A case study in two small Korean watersheds. Clim. Chang. 2012, 115, 853–872. [Google Scholar] [CrossRef]
  9. Kim, J.; Choi, J.; Choi, C.; Park, S. Impacts of changes in climate and land use/land cover under IPCC RCP scenarios on streamflow in the Hoeya River Basin, Korea. Sci. Total Environ. 2013, 452, 181–195. [Google Scholar] [CrossRef] [PubMed]
  10. Freeze, R.A. Role of subsurface flow in generating surface runoff. 2. Upstream source areas. Water Resour. Res. 1972, 8, 1272–1283. [Google Scholar] [CrossRef]
  11. Brutsaert, W.; Nieber, J.L. Regionalized drought flow hydrographs from a mature glaciated plateau. Water Resour. Res. 1977, 13, 637–643. [Google Scholar] [CrossRef]
  12. Eckhardt, K. How to construct recursive digital filters for baseflow separation. Hydrol. Process. 2005, 19, 507–515. [Google Scholar] [CrossRef]
  13. Stewart, M.; Cimino, J.; Ross, M. Calibration of base flow separation methods with streamflow conductivity. Ground Water 2007, 45, 17–27. [Google Scholar] [CrossRef] [PubMed]
  14. Barnes, B. The structure of discharge-recession curves. Trans. Am. Geophys. Union 1939, 20, 721–725. [Google Scholar] [CrossRef]
  15. Meyboom, P. Estimating ground-water recharge from stream hydrographs. J. Geophys. Res. 1961, 66, 1203–1214. [Google Scholar] [CrossRef]
  16. Rutledge, A.T. Computer Programs for Describing the Recession of Groundwater Discharge and for Estimating Mean Ground-Water Recharge and Discharge from Streamflow Records—Update; U.S. Geological Survey Water-Resources Investigations Report 98-4148; U.S. Geological Survey: Denver, CO, USA, 1993.
  17. Arnold, J.G.; Allen, P.M. Automated methods for estimating baseflow and ground water recharge from streamflow records. J. Am. Water Resour. Assoc. 1999, 35, 411–424. [Google Scholar] [CrossRef]
  18. Fetter, C.W. Applied Hydrogeology; Prentice Hall: Upper Saddle River, NJ, USA, 1994. [Google Scholar]
  19. Pettyjohn, W.A.; Henning, R. Preliminary Estimate of Ground-Water Recharge Rates, Related Streamflow and Water Quality in Ohio; Project Completion Report 553, Technical Report; Water Resources Centre, Ohio State University: Columbus, OH, USA, 1979. [Google Scholar]
  20. Linsley, R.K.; Kohler, M.A.; Paulhus, J.L.H. Hydrology for Engineers; McGraw Hill Book Company: London, UK, 1982. [Google Scholar]
  21. Sawaske, S.R.; Freyberg, D.L. An analysis of trends in baseflow recession and low-flows in rain-dominated coastal streams of the pacific coast. J. Hydrol. 2014, 519, 599–610. [Google Scholar] [CrossRef]
  22. Theis, C.V. Amount of ground-water recharge in the southern high plains. Trans. Am. Geophys. Union 1937, 18, 564–568. [Google Scholar] [CrossRef]
  23. Varni, M.; Comas, R.; Weinzettel, P.; Dietrich, S. Application of the water table fluctuation method to characterize groundwater recharge in the Pampa plain, Argentina. Hydrol. Sci. J. 2013, 58, 1445–1455. [Google Scholar] [CrossRef]
  24. Sloto, R.; Crouse, M. HYSEP: A Computer Program for Streamflow Hydrograph Separation and Analysis; U.S. Geological Survey, Water Resources Investigations, Report 96-4040; U.S. Geological Survey: Denver, CO, USA, 1996.
  25. Dai, Z.J.; Chu, A.; Du, J.Z.; Stive, M.; Hong, Y. Assessment of extreme drought and human interference on baseflow of the Yangtze River. Hydrol. Process. 2010, 24, 749–757. [Google Scholar] [CrossRef]
  26. Moreno, M.A.; Vieux, B.E. Estimation of spatio-temporally variable groundwater recharge using a rainfall-runoff model. J. Hydrol. Eng. 2011, 18, 237–249. [Google Scholar] [CrossRef]
  27. Kung, W.J.; Yeh, H.F.; Lin, H.I.; Chen, W.P.; Lee, C.H. An approach to evaluate groundwater recharge from streamflow and groundwater records. Geosci. J. 2013, 17, 353–362. [Google Scholar] [CrossRef]
  28. Partington, D.; Brunner, P.; Simmons, C.T.; Werner, A.D.; Therrien, R.; Maier, H.R.; Dandy, G.C. Evaluation of outputs from automated baseflow separation methods against simulated baseflow from a physically based, surface water-groundwater flow model. J. Hydrol. 2012, 458, 28–39. [Google Scholar] [CrossRef]
  29. Lim, K.J.; Engel, B.A.; Tang, Z.; Choi, J.; Kim, K.; Muthukrishnan, S.; Tripathy, D. Automated web GIS based hydrograph analysis tool, WHAT1. J. Am. Water Resour. Assoc. 2005, 41, 1407–1416. [Google Scholar] [CrossRef]
  30. Mondal, P.; Srivastava, P.; Kalin, L.; Panda, S.N. Ecologically sustainable surface water withdrawal for cropland irrigation through incorporation of climate variability. J. Soil Water Conserv. 2011, 66, 221–232. [Google Scholar] [CrossRef]
  31. Zhang, Y.; Ahiablame, L.; Engel, B.; Liu, J. Regression Modeling of Baseflow and Baseflow Index for Michigan USA. Water 2013, 5, 1797–1815. [Google Scholar] [CrossRef]
  32. Eckhardt, K. A comparison of baseflow indices, which were calculated with seven different baseflow separation methods. J. Hydrol. 2008, 352, 168–173. [Google Scholar] [CrossRef]
  33. Lyne, V.; Hollick, M. Stochastic time-variable rainfall–runoff modelling. In Hydrology and Water Resources Symposium; Institution of Engineers: Perth, Australia, 1979. [Google Scholar]
  34. Nathan, R.J.; McMahon, T.A. Evaluation of automated techniques for base-flow and recession analyses. Water Resour. Res. 1990, 26, 1465–1473. [Google Scholar] [CrossRef]
  35. Shi, X.; Wood, A.W.; Lettenmaier, D.P. How essential is hydrologic model calibration to seasonal streamflow forecasting? J. Hydrometeorol. 2008, 9, 1350–1363. [Google Scholar] [CrossRef]
  36. Ahiablame, L.; Chaubey, I.; Engel, B.; Cherkauer, K.; Merwade, V. Estimation of annual baseflow at ungauged sites in Indiana USA. J. Hydrol. 2013, 476, 13–27. [Google Scholar] [CrossRef]
  37. Ahiablame, L.; Engel, B.; Chaubey, I. An optimization method for estimating constituent mean concentrations in base flow-dominated flow. J. Am. Water Resour. Assoc. 2013, 49, 1167–1178. [Google Scholar] [CrossRef]
  38. Guo, J.; Li, H.Y.; Leung, L.R.; Guo, S.; Liu, P.; Sivapalan, M. Links between flood frequency and annual water balance behaviors: A basis for similarity and regionalization. Water Resour. Res. 2014, 50, 937–953. [Google Scholar] [CrossRef]
  39. Lee, G.; Shin, Y.; Jung, Y. Development of web-based RECESS model for estimating baseflow using SWAT. Sustainability 2014, 6, 2357–2378. [Google Scholar] [CrossRef]
  40. WAMIS Home Page. Available online: http://www.wamis.go.kr/ (accessed on 10 July 2016).
  41. Stewart, M.K. Promising new Baseflow separation and recession analysis methods applied to streamflow at Glendhu Catchment, New Zealand. Hydrol. Earth Syst. Sci. 2015, 19, 2587–2603. [Google Scholar] [CrossRef]
  42. Arnold, J.G.; Muttiah, R.S.; Srinivasan, R.; Allen, P.M. Regional estimation of base flow and groundwater recharge in the Upper Mississippi river basin. J. Hydrol. 2000, 227, 21–40. [Google Scholar] [CrossRef]
  43. Rouhani, H.; Malekian, A. Automated methods for estimating baseflow from streamflow records in a semi arid watershed. Desert 2013, 17, 203–209. [Google Scholar]
  44. Arnold, J.G.; Allen, P.M.; Muttiah, R.; Bernhardt, G. Automated base flow separation and recession analysis techniques. Ground Water 1995, 33, 1010–1018. [Google Scholar] [CrossRef]
  45. The Web-Based BFlow System. Available online: http://www.envsys.co.kr/~swatbflow (accessed on 30 April 2016).
  46. Google Map Home Page. Available online: https://www.google.co.kr/maps (accessed on 30 April 2016).
  47. Olden, J.D.; Kennard, M.J.; Pusey, B.J. A framework for hydrologic classification with a review of methodologies and applications in ecohydrology. Ecohydrology 2012, 5, 503–518. [Google Scholar] [CrossRef]
  48. Piao, S.; Friedlingstein, P.; Ciais, P.; de Noblet-Ducoudré, N.; Labat, D.; Zaehle, S. Changes in climate and land use have a larger direct impact than rising CO2 on global river runoff trends. Proc. Natl. Acad. Sci. USA 2007, 104, 15242–15247. [Google Scholar] [CrossRef] [PubMed]
  49. Beguería, S.; López-Moreno, J.I.; Lorente, A.; Seeger, M.; García-Ruiz, J.M. Assessing the effect of climate oscillations and land-use changes on streamflow in the central Spanish Pyrenees. AMBIO 2003, 32, 283–286. [Google Scholar] [CrossRef] [PubMed]
  50. Naver Map Home Page. Available online: http://map.naver.com (accessed on 30 April 2016).
  51. Australian Rainfall & Runoff. Available online: http://www.arr.org.au/revision-projects/project-list/project-7/ (accessed on 10 July 2016).
  52. Ahiablame, L.; Shakya, R. Modeling flood reduction effects of low impact development at a watershed scale. J. Environ. Manag. 2016, 171, 81–91. [Google Scholar] [CrossRef] [PubMed]
  53. Du, S.; Shi, P.; Van Rompaey, A.; Wen, J. Quantifying the impact of impervious surface location on flood peak discharge in urban areas. Nat. Hazards 2015, 76, 1457–1471. [Google Scholar] [CrossRef]
  54. Berghuijs, W.R.; Sivapalan, M.; Woods, R.A.; Savenije, H.H. Patterns of similarity of seasonal water balances: A window into streamflow variability over a range of time scales. Water Resour. Res. 2014, 50, 5638–5661. [Google Scholar] [CrossRef]
  55. Lee, J.H.; Bang, K.W. Characterization of urban stormwater runoff. Water Res. 2000, 34, 1773–1780. [Google Scholar] [CrossRef]
  56. Jang, C.; Kum, D.; Jung, Y.; Kim, K.; Shin, D.S.; Engel, B.A.; Shin, Y.; Lim, K.J. Development of a Web-Based L-THIA 2012 Direct Runoff and Pollutant Auto-Calibration Module Using a Genetic Algorithm. Water 2013, 5, 1952–1966. [Google Scholar] [CrossRef]
Figure 1. Study Area: four major river systems in South Korea. Numbers in the map indicate watershed codes in Table 1.
Water 08 00384 g001
Figure 2. Distribution of the average daily streamflow.
Water 08 00384 g002
Figure 3. Overview of the web-based BFlow System.
Water 08 00384 g003
Figure 4. The web-based BFlow system reprinted with permission from Google Maps [46]. Copyright 2016 Google; (a) Googlemap Interface Option; (b) Manual Upload Option; (c) Output.
Water 08 00384 g004
Figure 5. Spatial distribution of streamflow components and characteristics; (a) BFI; (b) Coefficient of Variation; (c) Direct Runoff; (d) Baseflow.
Water 08 00384 g005
Figure 6. Relative ratios between baseflow and direct runoff to total streamflow.
Water 08 00384 g006
Figure 7. Histogram of BFI by river system. (a) HR; (b) NR; (c) GR; (d) YSR.
Water 08 00384 g007
Figure 8. Comparison of baseflow separations at gauge stations with the maximum and minimum BFIs (2009–2013); (a) Hapcheon gauge station in NR system; (b) Wonpyeong gauge station in GR system.
Water 08 00384 g008
Figure 9. Relationship between BFI and CV of streamflow in Korea (2009–2013). Red and green bar charts indicate the histograms of CV and BFI, respectively.
Water 08 00384 g009
Figure 10. Hydraulic structures around gauge stations with high BFI reprinted with permission from NAVER [50]. Copyright 2016 NAVER; (a)Hapcheon; (b) Soosan; (c) Jangeon; (d) Sammun; (e) Ssangchi; (f) Woosung; (g) Sungseo; (h) Kangcheong; (i) Sankyuk; (j) Dongyeonkyo.
Water 08 00384 g010aWater 08 00384 g010b
Table 1. Characteristics of four major river systems in South Korea.
SystemsWatershedsDrainage Area (km2)Perimeter (km)Average Elevation (m)Average Slope (%)Highest Elevation (m)
CodeName
HR10Han River34,4281335407391688
11Ansung Stream16592407015571
12E.S. Han River197110593012472
13W.S. Han River3890680372471705
NR20Nakdong River23,6901097291371915
21Hyungsan River114022617631846
22Taehwa River661162187311233
23Heoya, Suyeong River86534212827902
24E.S. Nadong River2968795238441139
25W.S. Nadong River2460210212134873
GR30Gum River9914738224321611
31Sapgyo Stream16682698520698
32W.S. Gum River297510075417904
33Mangkyeong, Dongjin River336761980181112
YSR40Sumjin River4914671301381650
41S.S. Sumjin River33852284119301223
50Yeongsan River3470435111241177
51Tamjin River50613416734802
52S.S. Yeongsan River15077685420699
53S.S. Yeongsan River212318234919740
Notes: Where, Han River (HR); Nakdong River (NR); Gum River (GR); and Yeongsan/Sumjin Rivers (YSR). Also, E.S. is East sea, W.S. is West sea, and S.S. is South sea.
Table 2. Streamflow characteristics by river systems.
SystemsIndexBFICVADDFADBF
HRMin0.410.620.70.9
Max0.796.41546.0526.8
Avg.0.552.8040.061.1
NRMin0.370.290.60.6
Max0.895.89378.9736.6
Avg.0.612.6440.978.9
GRMin0.280.710.40.3
Max0.816.29162.1214.9
Avg.0.542.9410.617.6
YSRMin0.351.280.50.5
Max0.864.5375.181.3
Avg.0.523.0210.612.0
Total (Korea)Min0.280.290.40.3
Max0.896.41546.0736.6
Avg.0.562.8426.443.7
Notes: Where, ADDF is the average daily direct runoff (m3/s) and ADBF is the average daily baseflow (m3/s).

