Article

ResilSIM—A Decision Support Tool for Estimating Resilience of Urban Systems

1
Department of Civil and Environmental Engineering, The University of Western Ontario, 1151 Richmond St., London, ON N6A 3K7, Canada
2
Disaster and Emergency Management, Faculty of Liberal Arts and Professional Studies, York University, 4700 Keele St, Toronto, ON M37 1P3, Canada
*
Author to whom correspondence should be addressed.
Water 2016, 8(9), 377; https://doi.org/10.3390/w8090377
Submission received: 21 June 2016 / Revised: 10 August 2016 / Accepted: 25 August 2016 / Published: 2 September 2016
(This article belongs to the Special Issue Hydroinformatics and Urban Water Systems)

Abstract

:
Damages to urban systems as a result of water-related natural disasters have escalated in recent years. The observed trend is expected to increase in the future as the impacts of population growth, rapid urbanization and climate change persist. To alleviate the damages associated with these impacts, it is recommended to integrate disaster management methods into planning, design and operational policies under all levels of government. This manuscript proposes the concept of ResilSIM: A decision support tool that rapidly estimates the resilience (a modern disaster management measure that is dynamic in time and space) of an urban system to the consequences of natural disasters. The web-based tool (with mobile access) operates in near real-time. It is designed to assist decision makers in selecting the best options for integrating adaptive capacity into their communities to protect against the negative impacts of a hazard. ResilSIM is developed for application in Toronto and London, Ontario, Canada; however, it is only demonstrated for use in the city of London, which is susceptible to riverine flooding. It is observed how the incorporation of different combinations of adaptation options maintain or strengthen London’s basic structures and functions in the event of a flood.

1. Introduction

The frequency and severity of water-related natural disasters have escalated in recent decades causing devastating impacts to urban systems. The World Bank reports that in the last 30 years approximately $4 trillion of economic damages have been attributed to natural disasters globally, in addition to the loss of human lives, wellbeing and their cultural assets that are considered invaluable [1,2]. From the 1980s to the last decade the annual economic losses caused by natural disasters have increased from $50 billion to $180 billion and, of these losses, 75% are linked to extreme weather events that are primarily hydro-meteorological [1].
The rising number of water-related natural disasters may be attributed to three driving factors including: (i) climate change; (ii) population growth; and (iii) land use change, especially mass urbanization. Climate change increases the frequency and intensifies the magnitude of precipitation extremes. Strong scientific evidence suggests that the climate is changing due to natural and human-induced causes. The average global temperature is projected to rise, disrupting the balance of the global climate system and causing unprecedented extreme hydro-meteorological events that will overwhelm critical infrastructure and endanger vulnerable populations in certain regions [3,4].
Population growth and urbanization increase the number of people and infrastructure development densely located in urban systems, thereby increasing their exposure and vulnerability to natural hazards such as floods. Significant development increases the proportion of impervious surfaces, conveying runoff to river systems more quickly. As a result water levels of the receiving streams, creeks and rivers rise rapidly, leading to a higher number of flooding events provided that adequate stormwater management infrastructure is not in place. Critical infrastructure supplies people with essential services such as water, sanitation, transportation, shelter, power and flood protection. Damage to the structures and disruption to the services they provide can have severe social and economic implications to the overall system. For a disaster resilient community to be achieved, people and the critical infrastructure they rely on (buildings, businesses, and engineering infrastructure) must be adapted to withstand the future dynamic consequences of climate change, population growth and urbanization [2,5].
To mitigate the significant damages associated with natural hazards, it is recommended to integrate disaster management methods into various planning, design and operational policies and procedures [1]. Resilience is a modern approach to disaster management that (in the context of this work) is a measure of a systems ability to resist, cope with, recover from and evolve to accommodate the impacts of a hazardous event as rapidly as possible. Resilience can be defined quantitatively as a dynamic and deterministic value that changes over the duration of the hazardous event. One way in which disaster management techniques have been integrated into community development is through the use of decision support systems; computer-based tools that provide for informed decision-making [6,7].
A well-known Decision Support System (DSS) with application in disaster management is the Hazus tool developed by the United States’ Federal Emergency Management Agency (FEMA). Hazus, like other DSSs used in disaster management, uses geographical information system technology to visualize the interaction between the spatial extent of the hazard and physical, social, economic components of an urban system. Hazus is used to estimate potential losses of buildings and infrastructure, and impacts to populations as a consequence of the natural disaster (earthquake, flood, hurricane) [8]. The Disaster Decision Support Tool [9] is another example of a web-based disaster management DSS that is designed for application in Puerto Rico. It provides access to geo-referenced demographic and economic data for all municipalities across the country as well as physical (infrastructure and natural features) data in a geographic information system (GIS) environment. The tool aims to provide accurate, freely accessible data to its users in order to visualize the social vulnerabilities of a municipality to hazardous impacts.
At this time, a DSS that uses resilience as a disaster management measure does not exist, to the best of the authors’ knowledge. A resilience-based decision making tool may be used to prioritize infrastructure upgrades and develop plans for emergency response to adapt to changing external forces. It may also be used during an emergency to provide for informed decision making regarding the allocation of material, equipment, human and financial resources to recover from the impacts of hazardous events as quickly as possible.
The objective of this manuscript is to introduce the pilot model of ResilSIM: a web-based decision support tool (with mobile access) used to estimate the resilience of an urban system to flooding events that is based on a metric developed by Simonovic and Peck [10,11,12,13]. The tool uses spatial programming techniques and publicly available data to calculate the value of the resilience metric. The users are then able to virtually employ different measures of adaptive capacity to assess how they improve or degrade the resilience of an urban system. The outcomes assist decision makers in selecting and prioritizing community upgrades to protect against the impacts of a hydro-meteorological hazard and transform the system to accommodate basic functions during the disruption. The initial, pilot ResilSIM tool is developed for application in London and Toronto, Ontario, Canada. Both cities are susceptible to climate change-caused flooding events; however, only London is selected to demonstrate the use of the tool through a case study.
The remainder of the manuscript is organized as follows: background on the resilience concept and its application in disaster management is provided in Section 2; objectives for the ResilSIM tool are identified in Section 3; Section 4 describes the methodology used to develop ResilSIM’s internal structure and interface; a demonstration of the ResilSIM tool in London, Ontario is provided in Section 5; and, finally, recommendations for future work are offered in Section 6.

2. Resilience Background

In this section, the transition from risk to resilience as a primary disaster management approach is explained and the concept of resilience is defined qualitatively and quantitatively.

2.1. From Risk to Resilience

Traditional disaster risk management is defined as the combination of three elements: (i) the hazard which, in the context of this work, is the probability of occurrence of a flood; (ii) exposure, i.e., the location of people, property, infrastructure and industry relative to the hazard; and (iii) vulnerability, i.e., the susceptibility of people, property, infrastructure and industry to damage caused by the hazard [1]. In order to manage disaster risk, measures are taken to reduce the vulnerability of the system components exposed to the hazards. More recently, however, there has been a shift from the traditional, vulnerability-driven risk approach to disaster resilience that is the foundation of the presented research [10].
Disaster resilience is defined by the International Panel on Climate Change (IPCC) as “the ability of a system and its component parts to anticipate, absorb, accommodate or recover from the effects of a hazardous event in a timely and efficient manner, including through ensuring the preservation, restoration or improvement of its essential basic structures and functions” [2]. Vulnerability of the risk definition describes the susceptibility of system components to damage resulting from the hazard. It is a static value that is determined before the hazardous event has occurred. Disaster resilience is a dynamic value that changes over the course of the event. A resilient system may be achieved by introducing several different measures of adaptive capacity [10,14]. For example, certain measures may be integrated to resist the impacts of a flood, thereby reducing pre-hazard vulnerabilities, similar to the disaster risk approach. Other measures enable the system to cope with, rapidly recover from and transform in the event of a hazard, such as the allocation of resources (material, equipment, personnel, and financial) or the reconstruction of critical infrastructure that is designed to accommodate changing, extreme conditions.

2.2. Conception of Resilience

Resilience is traditionally defined as a system’s capacity to rebound or return to a state of equilibrium following an external disturbance [15]. Holling [16] defined resilience as “... the capacity of an ecosystem to respond to a perturbation or disturbance by resisting damage and recovering quickly”. The definition emerged from his research in the field of ecosystems and ecology. The definition has since evolved into several different facets including: (i) engineering resilience, i.e., estimated as a system’s time to recovery after experiencing a shock, disrupting the state of equilibrium; (ii) ecological/ecosystem resilience, i.e., a system’s capacity to resist, cope with and function in the event of a disruption; and (iii) social-ecological resilience, i.e., a system’s ability to reorganize and continuously develop to accommodate the changing external forces acting on it [15,17]. Based on the social-ecological definition it is evident that resilience can be linked to sustainable development. In order to develop in a way that considers the well-being of current and future generations [18] it is important to ensure structures and functions of an urban system are designed to accommodate increasingly frequent, severe disturbances; e.g., climate change-caused flooding. Otherwise, citizens of the near and distant future will have to pay for the enormous economic and cultural damages incurred as a result of the disaster. This link highlights the political motivation for incorporating resilience into disaster management [15,19].
Several definitions of resilience are discussed in literature for a variety of research fields as presented by Brown [19]. A single definition has not been agreed upon. It is apparent that the IPCC’s definition of disaster resilience that is used as the foundation for ResilSIM development incorporates several views of resilience depending on the measures of adaptive capacity that are selected for implementation (i.e., those that preserve, restore and improve the system’s basic structures and functions) [2].
The options for adaptive capacity can be presented in various ways, from simple direct units of disaster impacts to more integrated measures such as: (i) robustness, the ability of the system to resist hazard-induced stresses (e.g., flood protection measures); (ii) redundancy, the ability of a system to provide uninterrupted services in the event of a disturbance, preserving system performance (e.g., secondary water, power supplies); (iii) resourcefulness, the utilization of materials (monetary, technological, informational, and human resources) to establish, prioritize and achieve goals (e.g., mobilization of disaster management funds; redesign and strengthening of critical infrastructure and emergency response); and (iv) rapidity, the capacity of the system to recover or evolve into a stronger level performance as quickly as possible [13]. As previously noted, measures for adaptive capacity may be implemented in advance of the hazard as well as during the hazard, in an emergency, making the disaster resilience method more versatile and desirable for implementation [10]. Using a resilience-based decision support tool various hydro-meteorological hazards can be simulated and different combinations of adaptation measures can be integrated, virtually, to an urban system and compared in a dynamic fashion using resilience as the decision criterion.

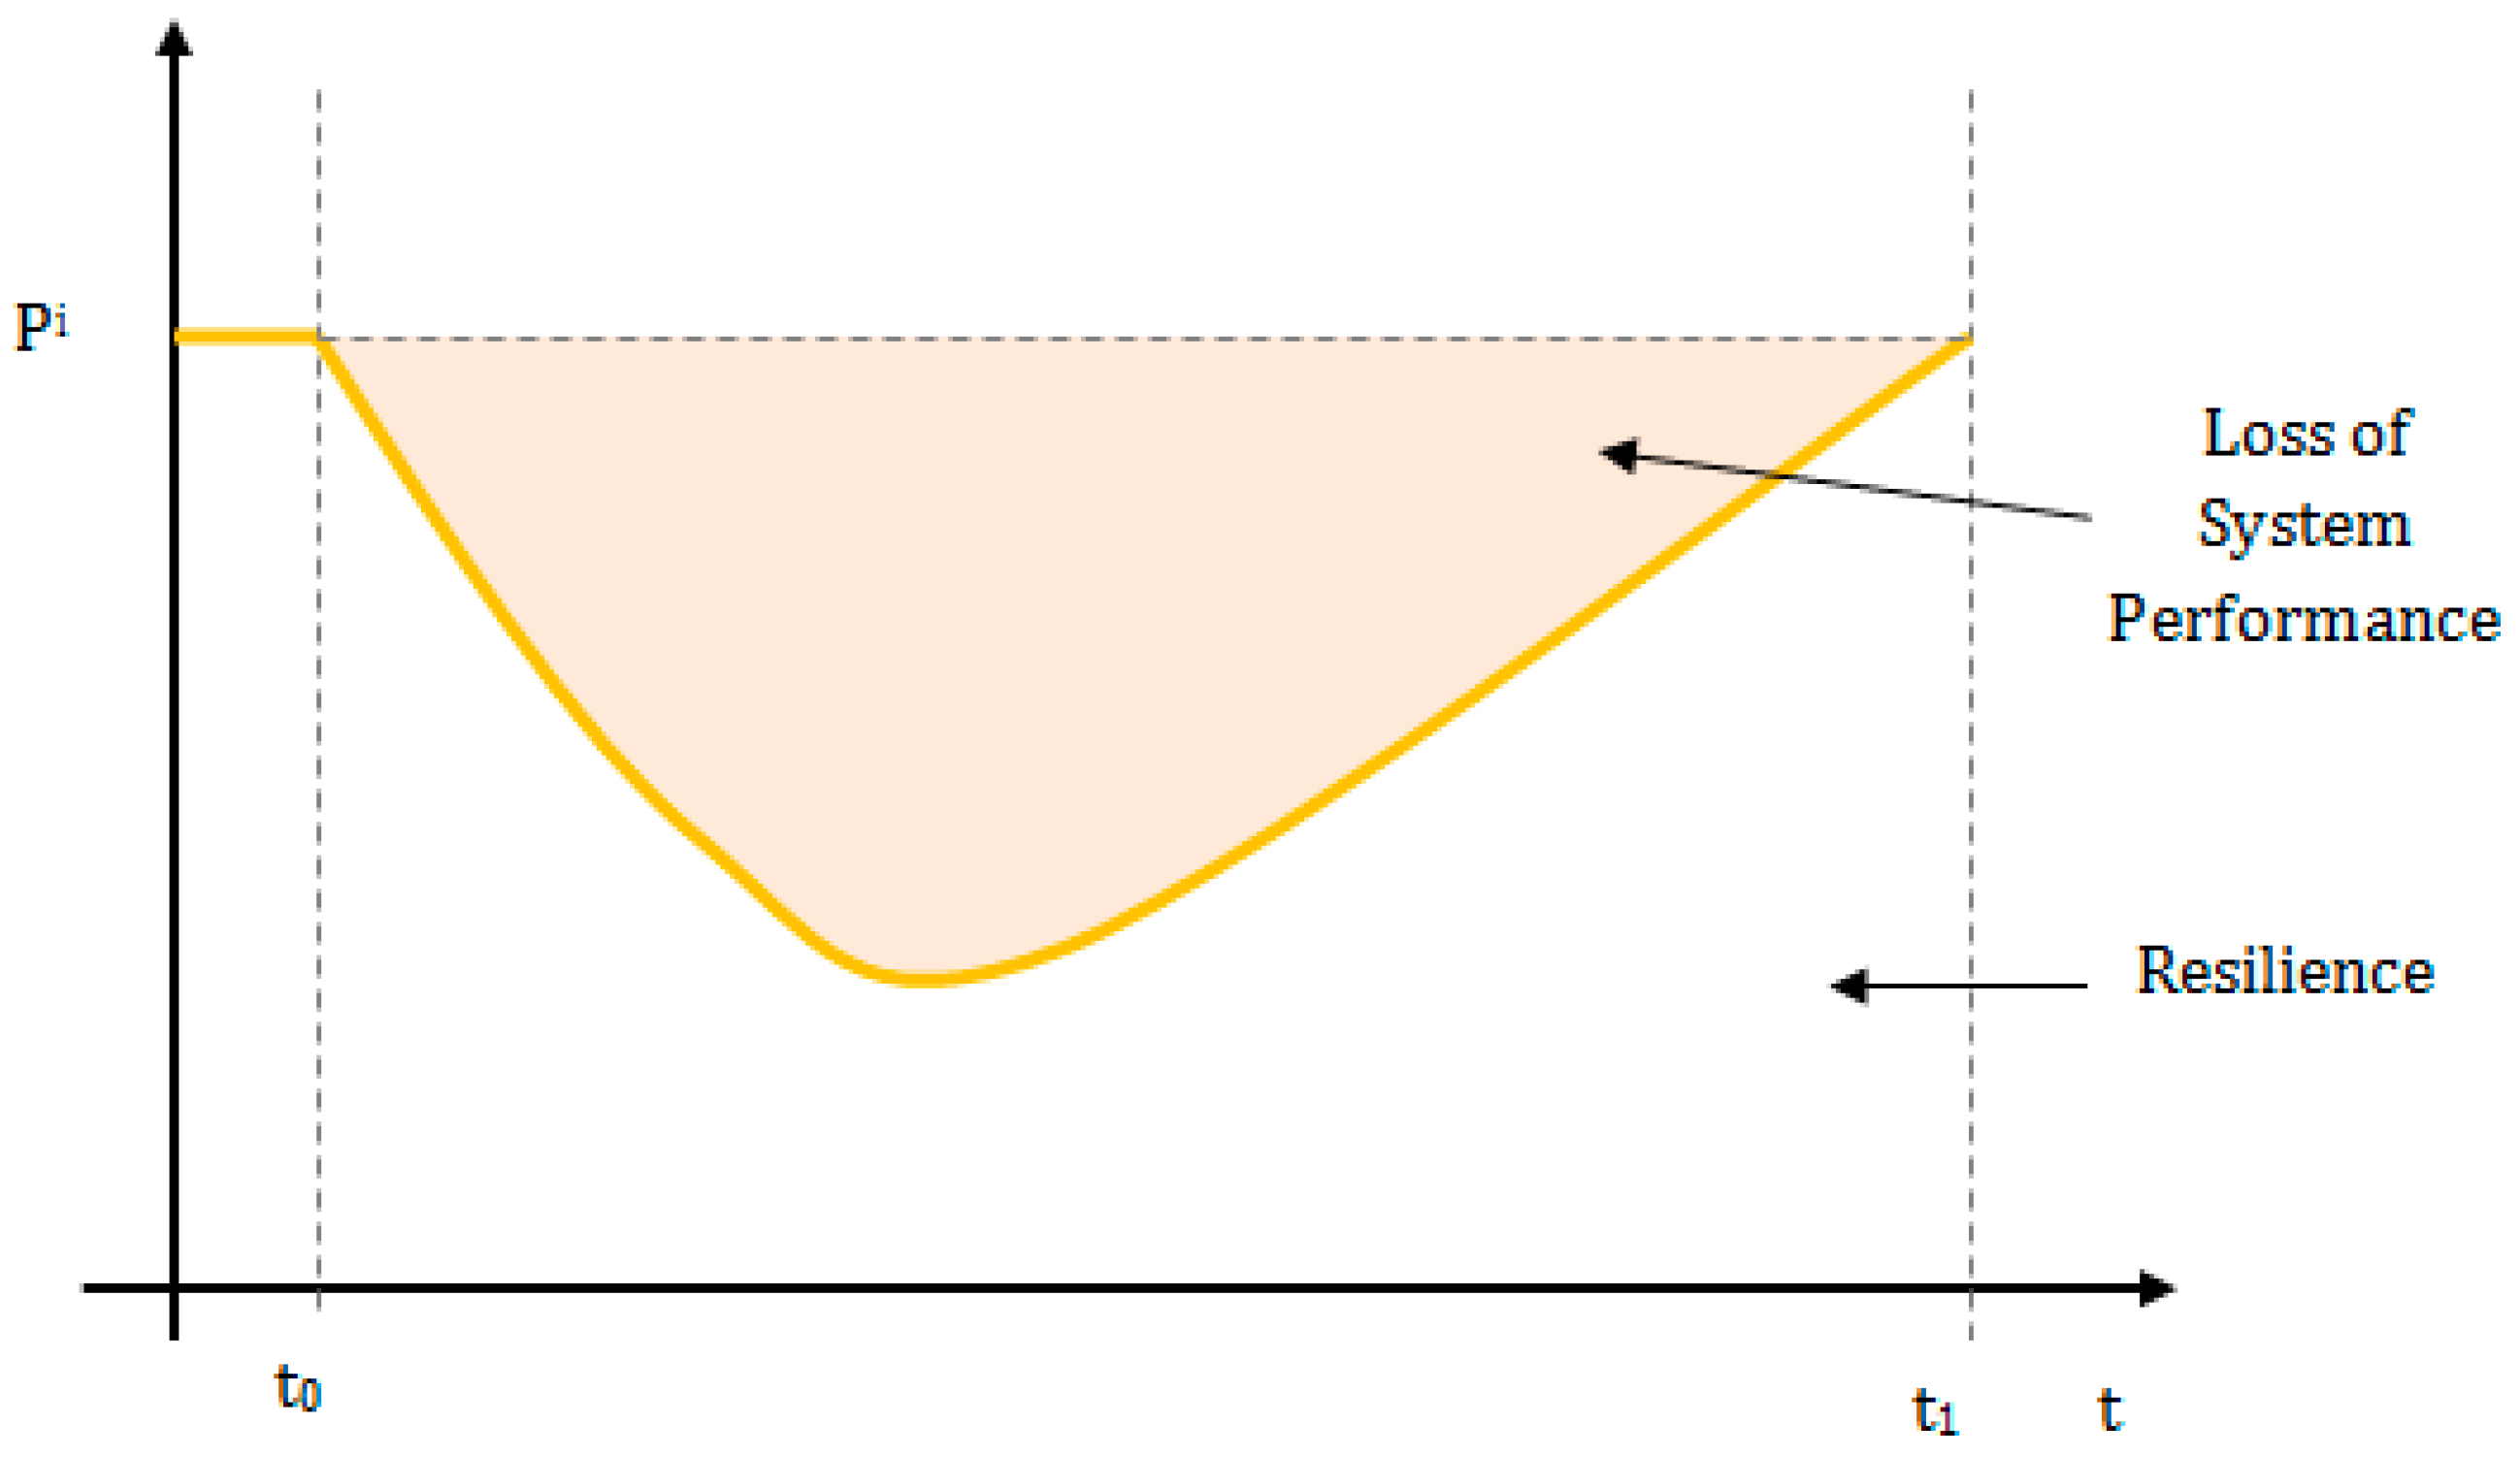
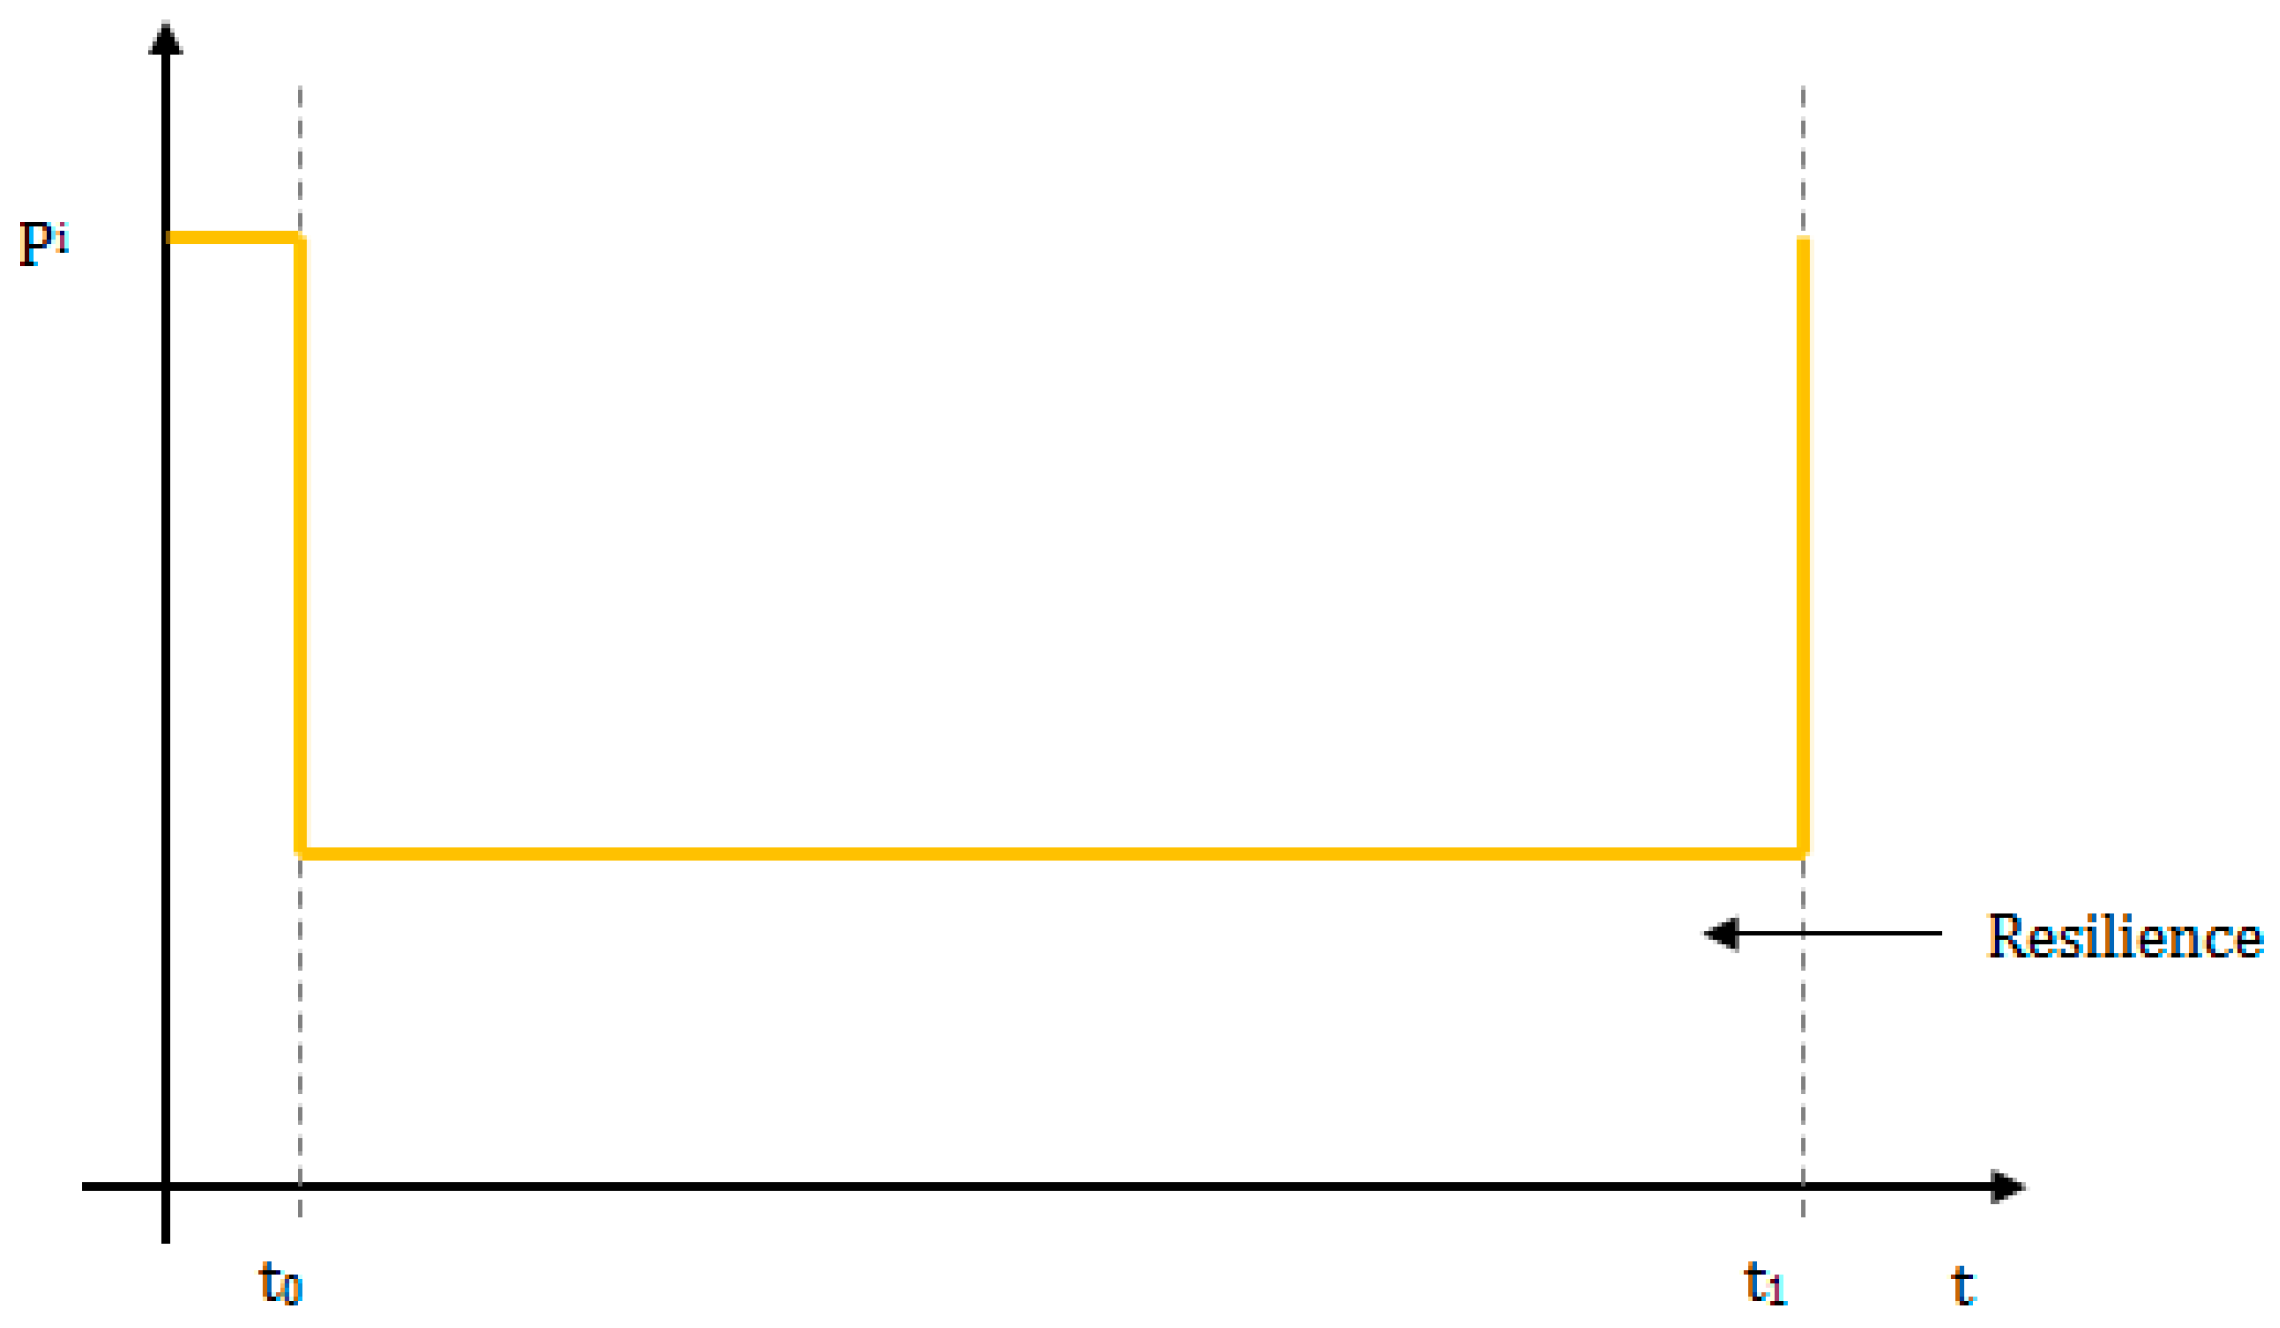
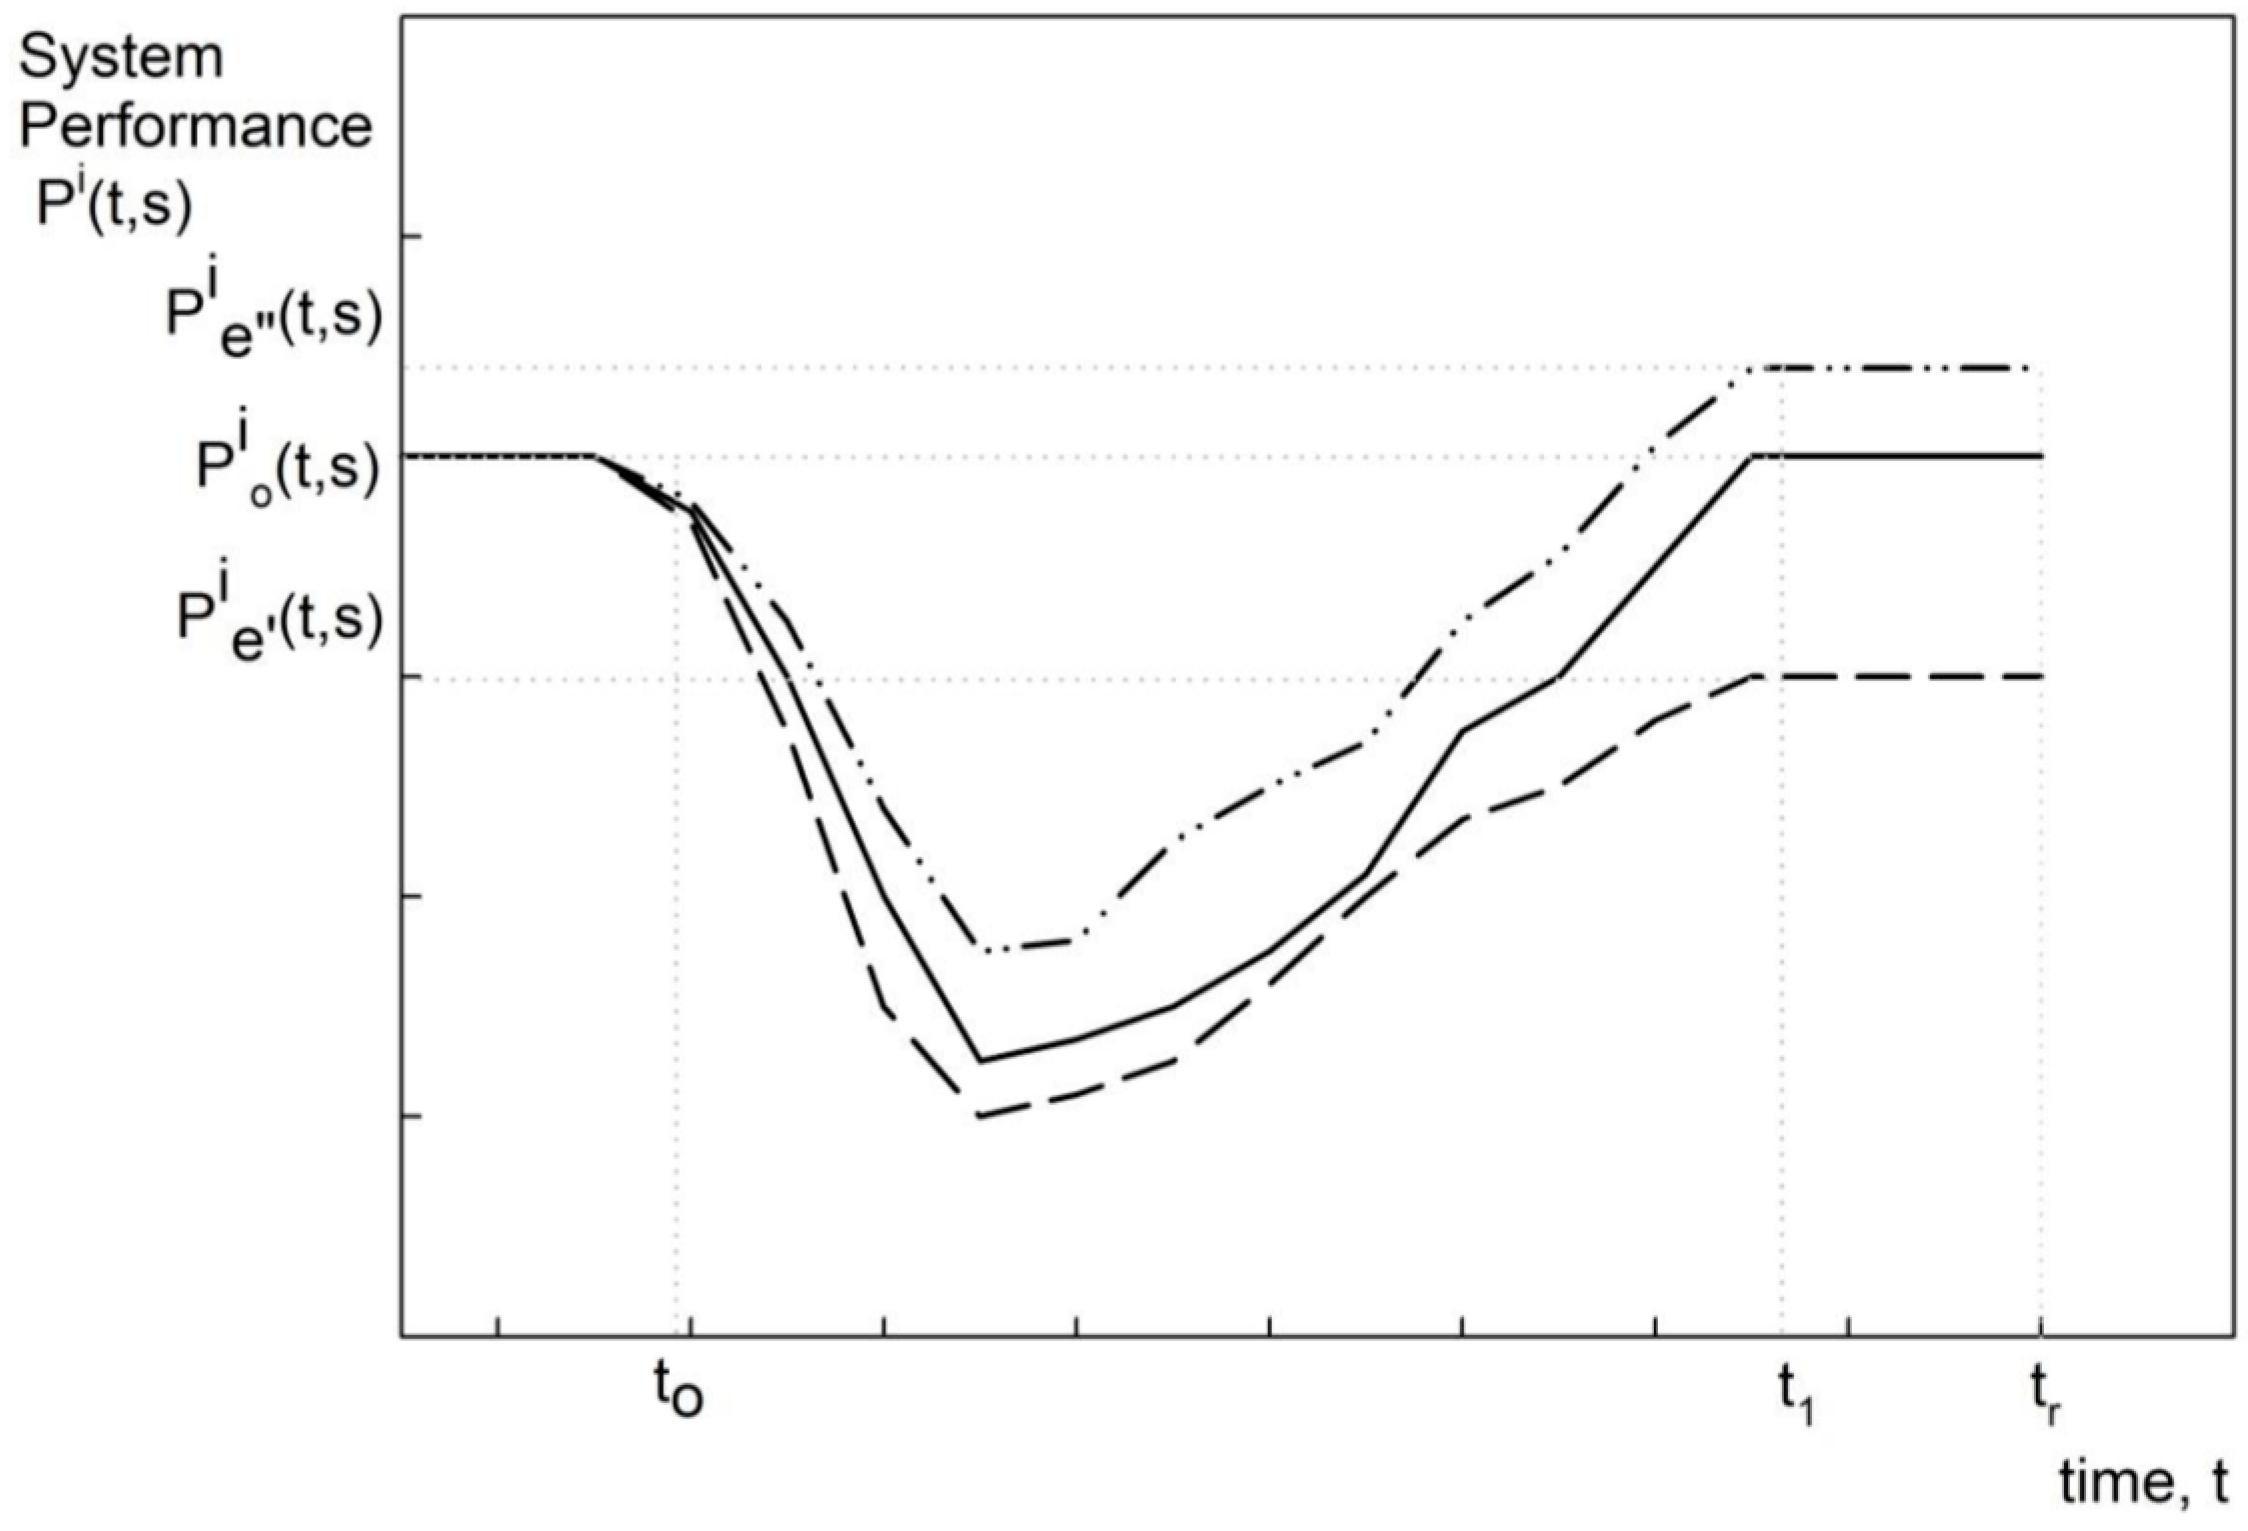
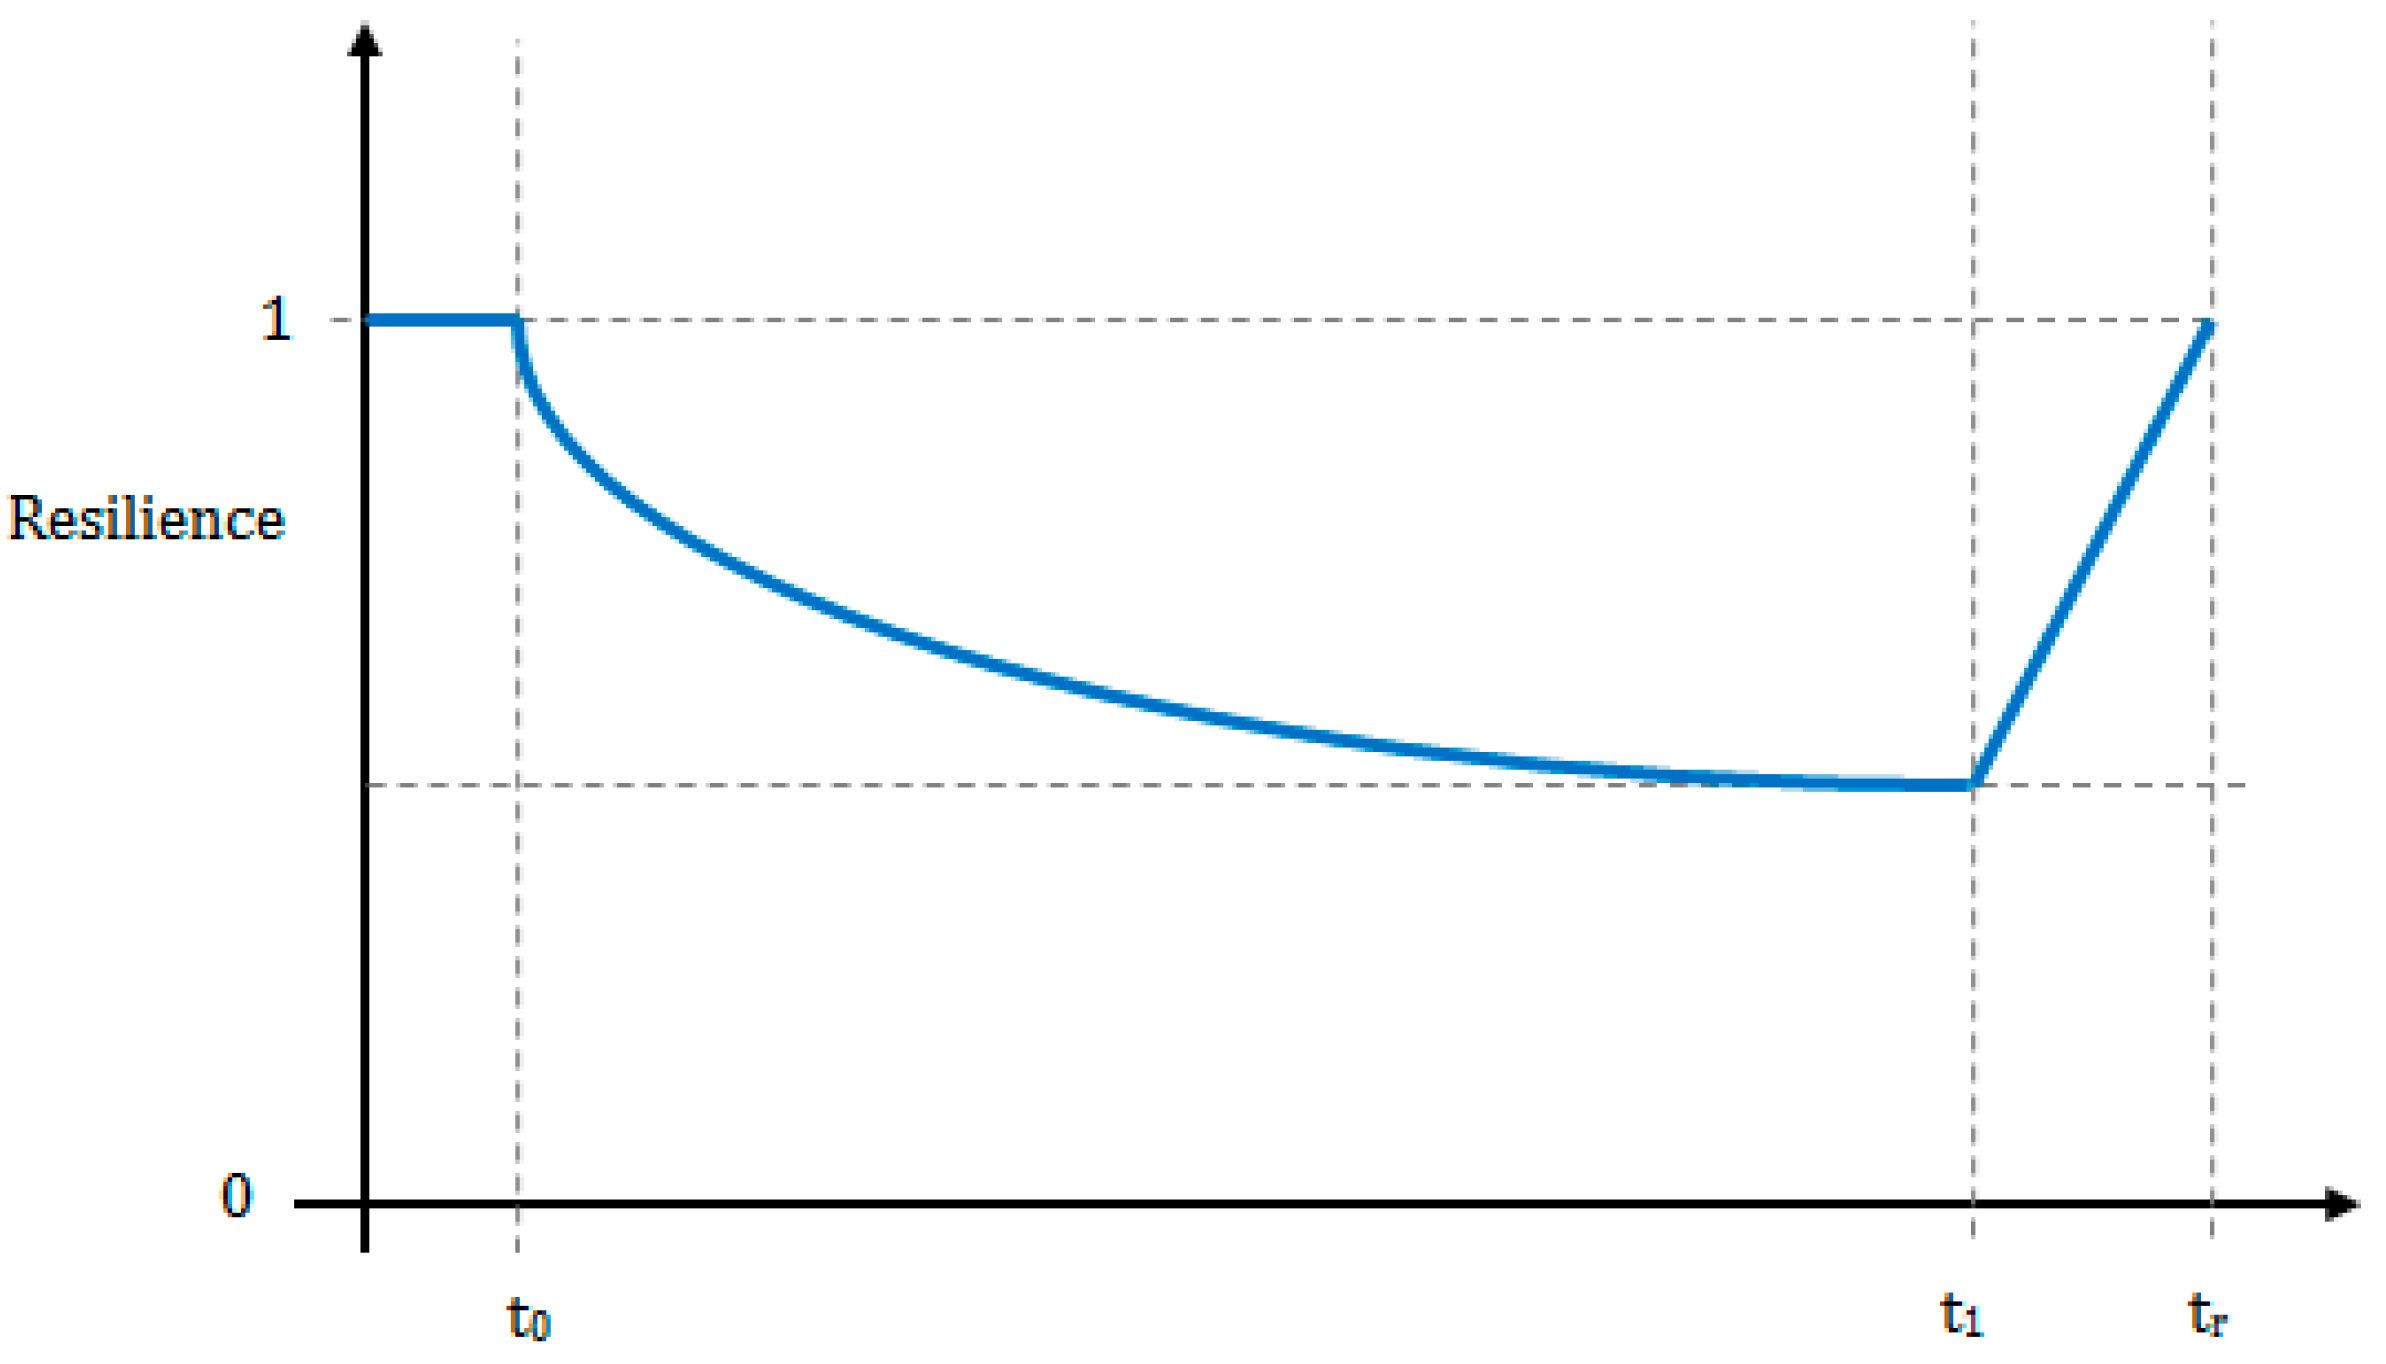
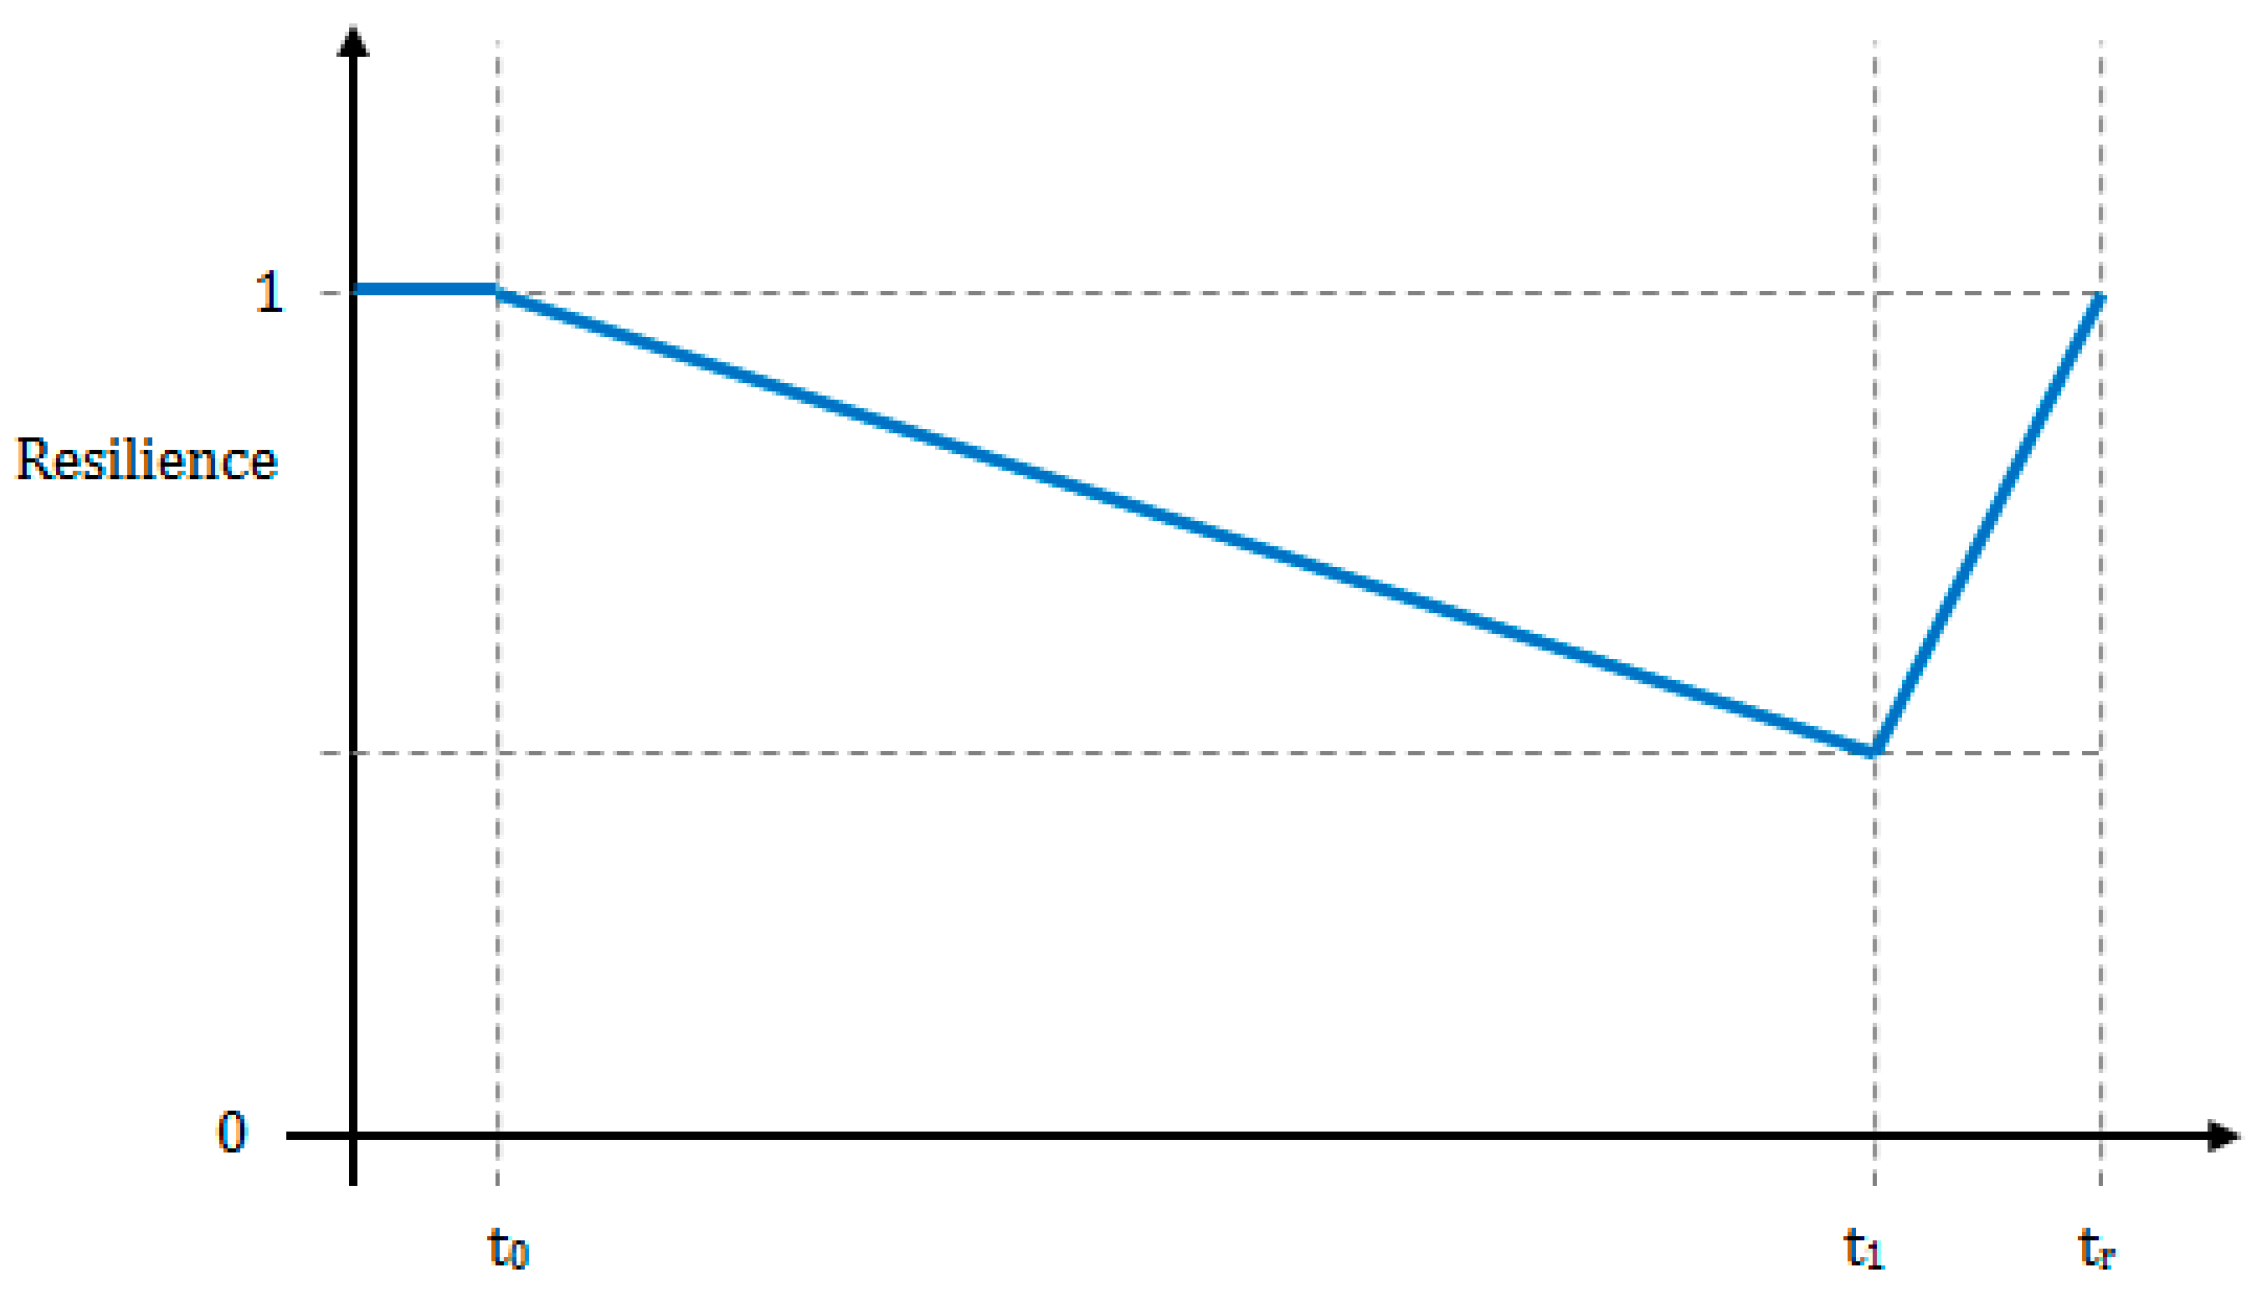
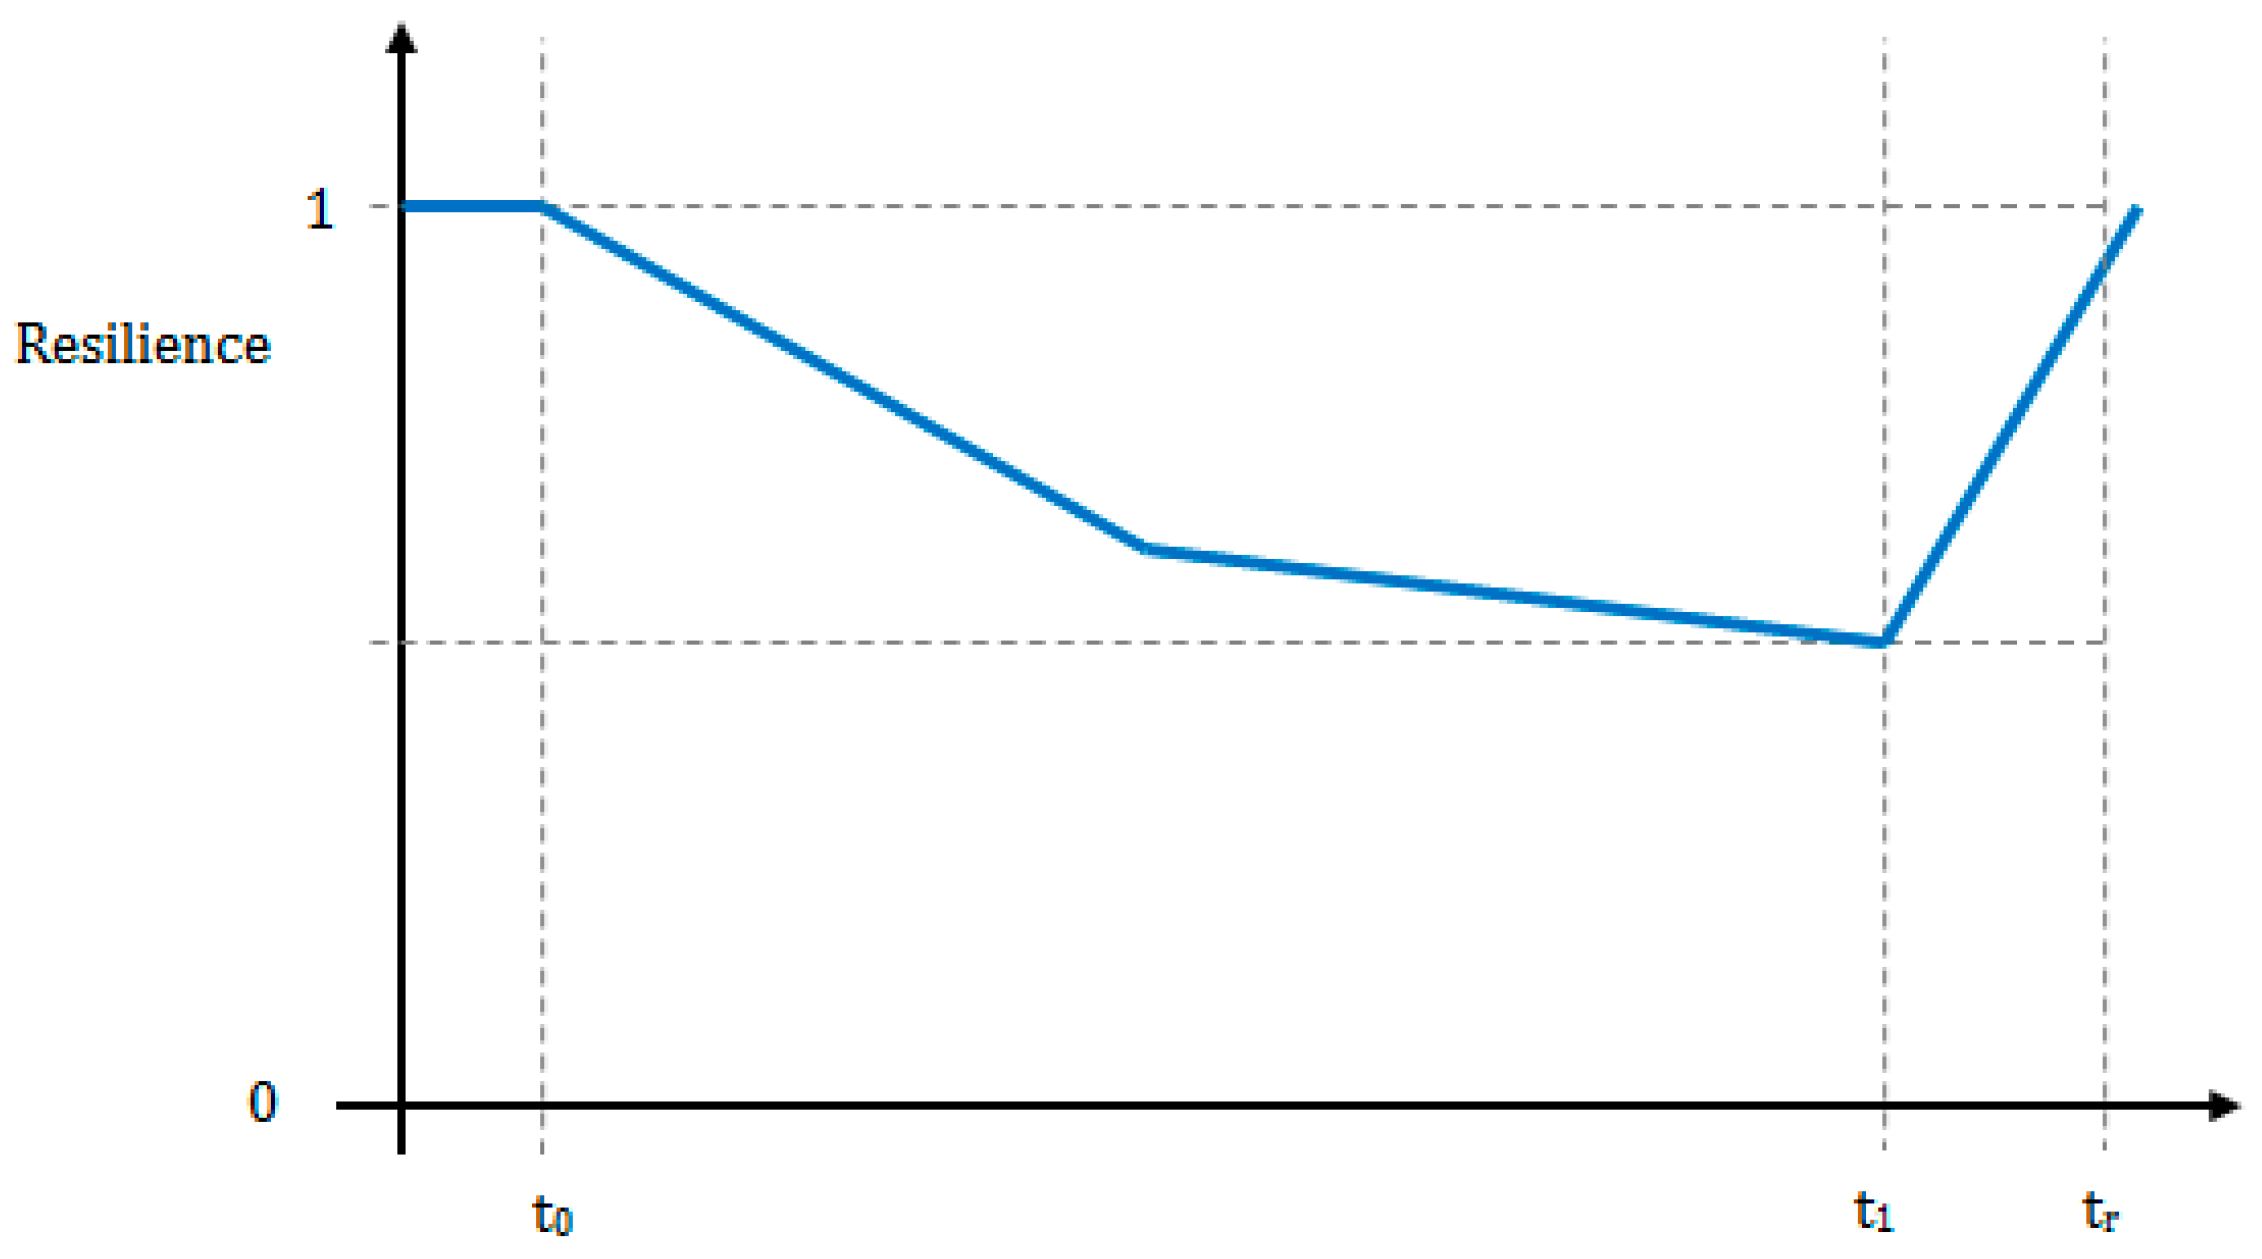
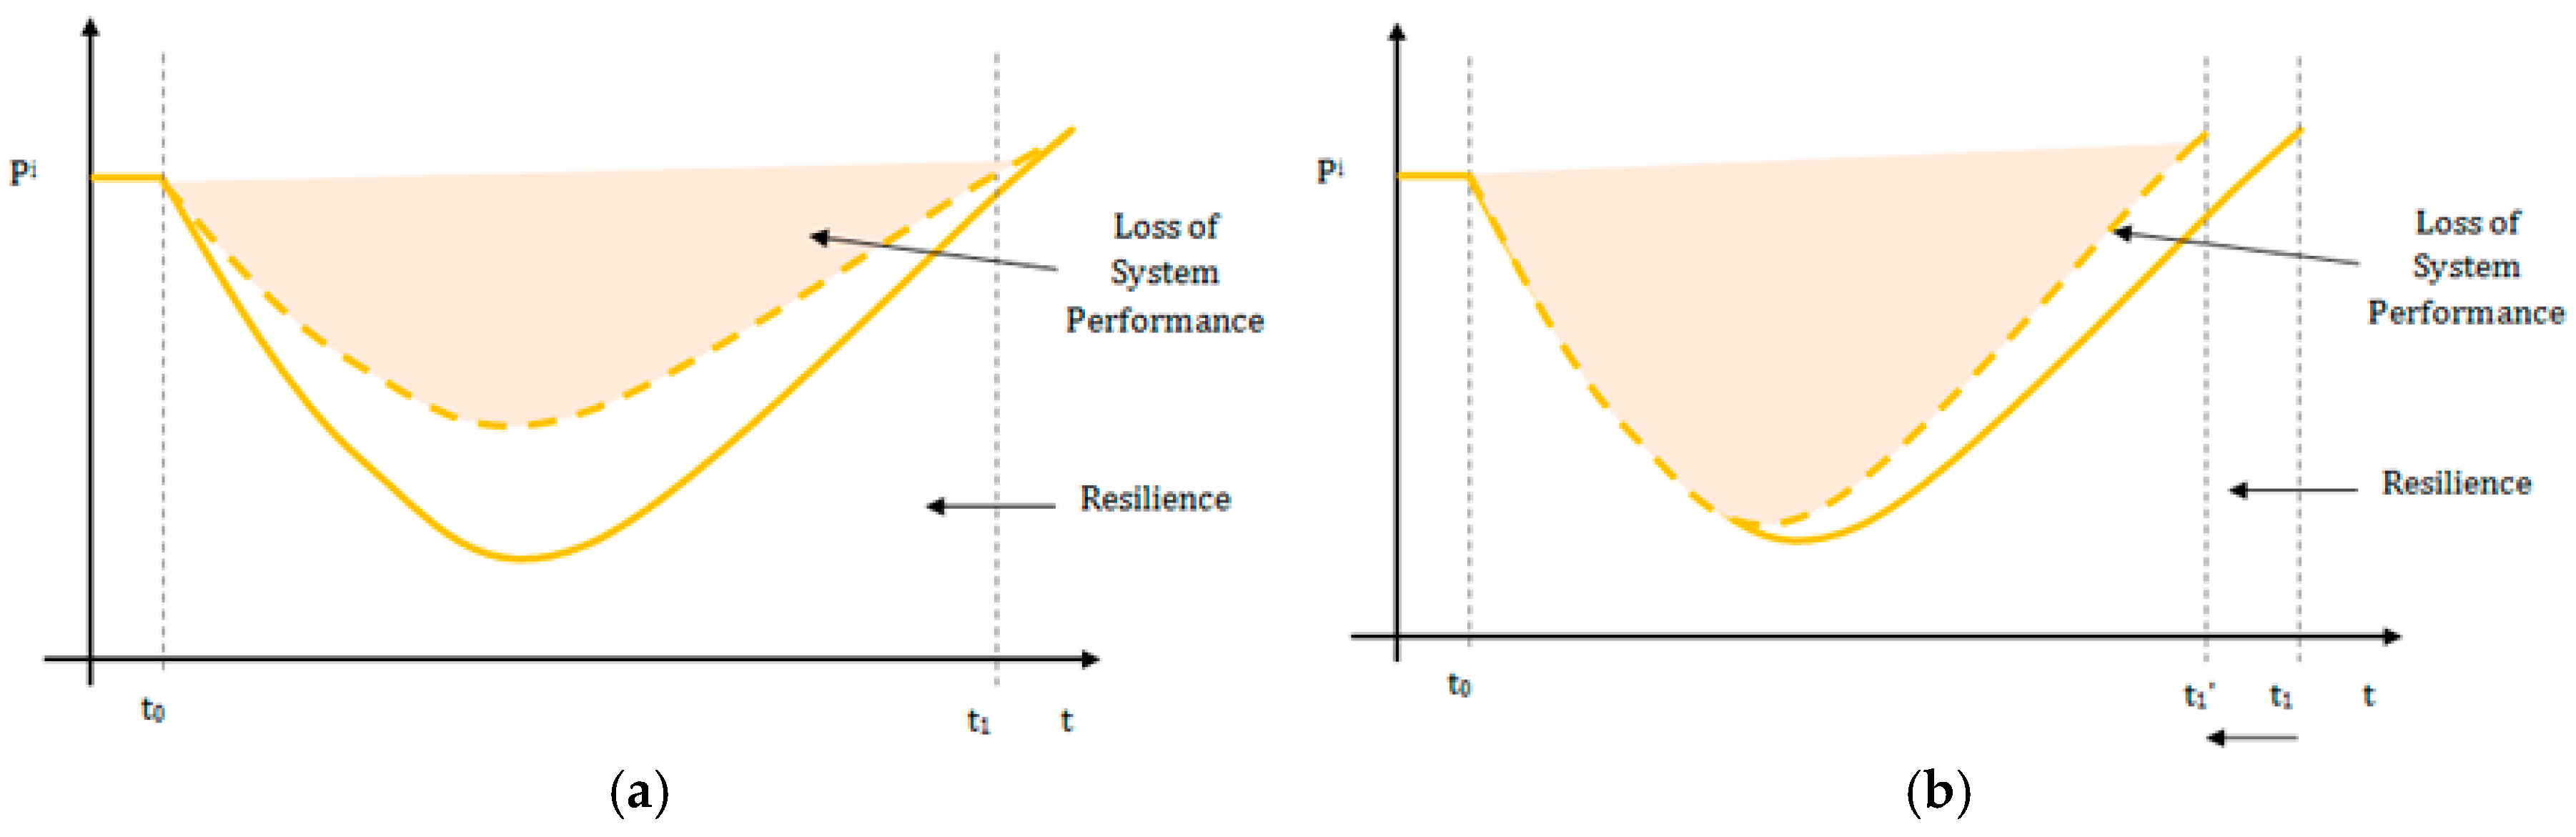
2.3. Defining Resilience Quantitatively

Several papers are available on the conceptualization of disaster resilience [14,20,21]. More recently, however, researchers have found merit in defining resilience quantitatively. To the authors’ knowledge, all work done on the quantification of resilience to date has used a static measure that is a single value calculated over the duration of the disaster [14]. Simonovic and Peck [10] are the first to quantify resilience dynamically in time and space. They calculate the metric using system dynamics simulations for temporal analysis linked to a geographical information system used for spatial analysis. It is a pseudo-dynamic version of the resilience metric that is integrated into the ResilSIM tool. The tool is capable of computing the resilience metric for several time slices over the duration of the flood and for multiple spatial units.

3. Objectives of ResilSIM

ResilSIM estimates resilience with respect to physical and socioeconomic indicators of urban system performance in the event of a hydro-meteorological hazard.
A key feature of the tool is its use of freely available datasets to calculate the resilience metric. To represent the physical component of the urban system, shape-files containing engineering infrastructure, critical facilities (hospitals, schools, ambulance, fire and police stations) and other buildings (commercial, industrial, and residential economic sectors) are used. This type of data is often provided by the local, municipal government. Socioeconomic data include the vulnerable population based on age, marital status, residency, language, education and income as well as certain physical datasets. In Canada (and many other countries), demographic information is available through a census program. It is ideal for datasets to be complete and consistently generated/collected across a large area (such as a country) so that the tool can be more easily transferrable between urban systems. Currently, however, this is not feasible and due to the inconsistencies of engineering and socioeconomic data provided at a local level of government, the tool must be programmed to reflect each system it is applied to. The methodological framework together with the ResilSIM DSS architecture will remain the same for all applications.
ResilSIM operates by simulating a hydro-meteorological hazard in the urban system under investigation using flood inundation maps and subsequently calculates an initial value of resilience in response to the disturbance. The tool offers a sample list of measures for adaptive capacity that can be applied to improve system resilience. The user can select adaptation options to be implemented virtually and observe how the resilience is impacted. After the adaptation option(s) has/have been integrated into the urban system, resilience is rapidly re-calculated and compared to its initial value, serving as a basis for comparison for potential combinations of community upgrades.
Overall, ResilSIM enables users to quickly make decisions that can reduce the physical, socioeconomic consequences of a disturbance. These include damages to the built and natural environments as well as the danger posed to human welfare.

4. Method

In this section, the methodological background is outlined and the decision support tool features are described.

4.1. Methodological Background

The procedure for estimating disaster resilience can be described in two broad steps: (i) simulation of the hazardous (hydro-meteorological) event; and (ii) the computation of the resilience metric. The tool’s methodology is demonstrated in the following sections for a riverine flooding event and flood inundation maps are used to simulate the hazard.

4.1.1. Simulation of the Hazard (Flood Inundation Maps)

Several flood inundation maps representing different snapshots in time over the course of the flood are included in the tool to account for temporal variability. A time series of flood inundation maps can be generated for different combinations of return periods and climate change scenarios. For example, flood inundation maps representing 100- and 250-year return periods for lower and upper bound climate change scenarios are used in the pilot ResilSIM tool. Lower bound scenarios use conservative estimates of precipitation statistics in the modeling procedure, while upper bound scenarios use the most extreme estimates of future precipitation, resulting in greater flood depths.
To produce flood inundation maps, a set of global climate models and downscaling techniques are used to project future precipitation records for hydrologic model input. A hydrologic model uses precipitation and physical watershed characteristics to calculate runoff values and flow rates in the river system. The flow rates are subsequently used as input to a hydraulic model to generate water elevation (flood depth) magnitudes. Hydraulic model output is imported to a geographical information system and flood inundation maps are produced [22].
The resultant flood inundation maps are overlaid with physical and socioeconomic datasets in the geographical information system (PostGIS database management system). It is the values of flood inundation corresponding to the spatial entities that drive the resilience calculation. To compute a dynamic value of disaster resilience, flood inundation maps should be generated for several time slices over the duration of the flood. A sample map is presented in Figure 1. To account for the spatial variation in the resilience calculation, the flood inundation maps are partitioned into smaller units (administrative boundaries) in which the resilience metric is computed.

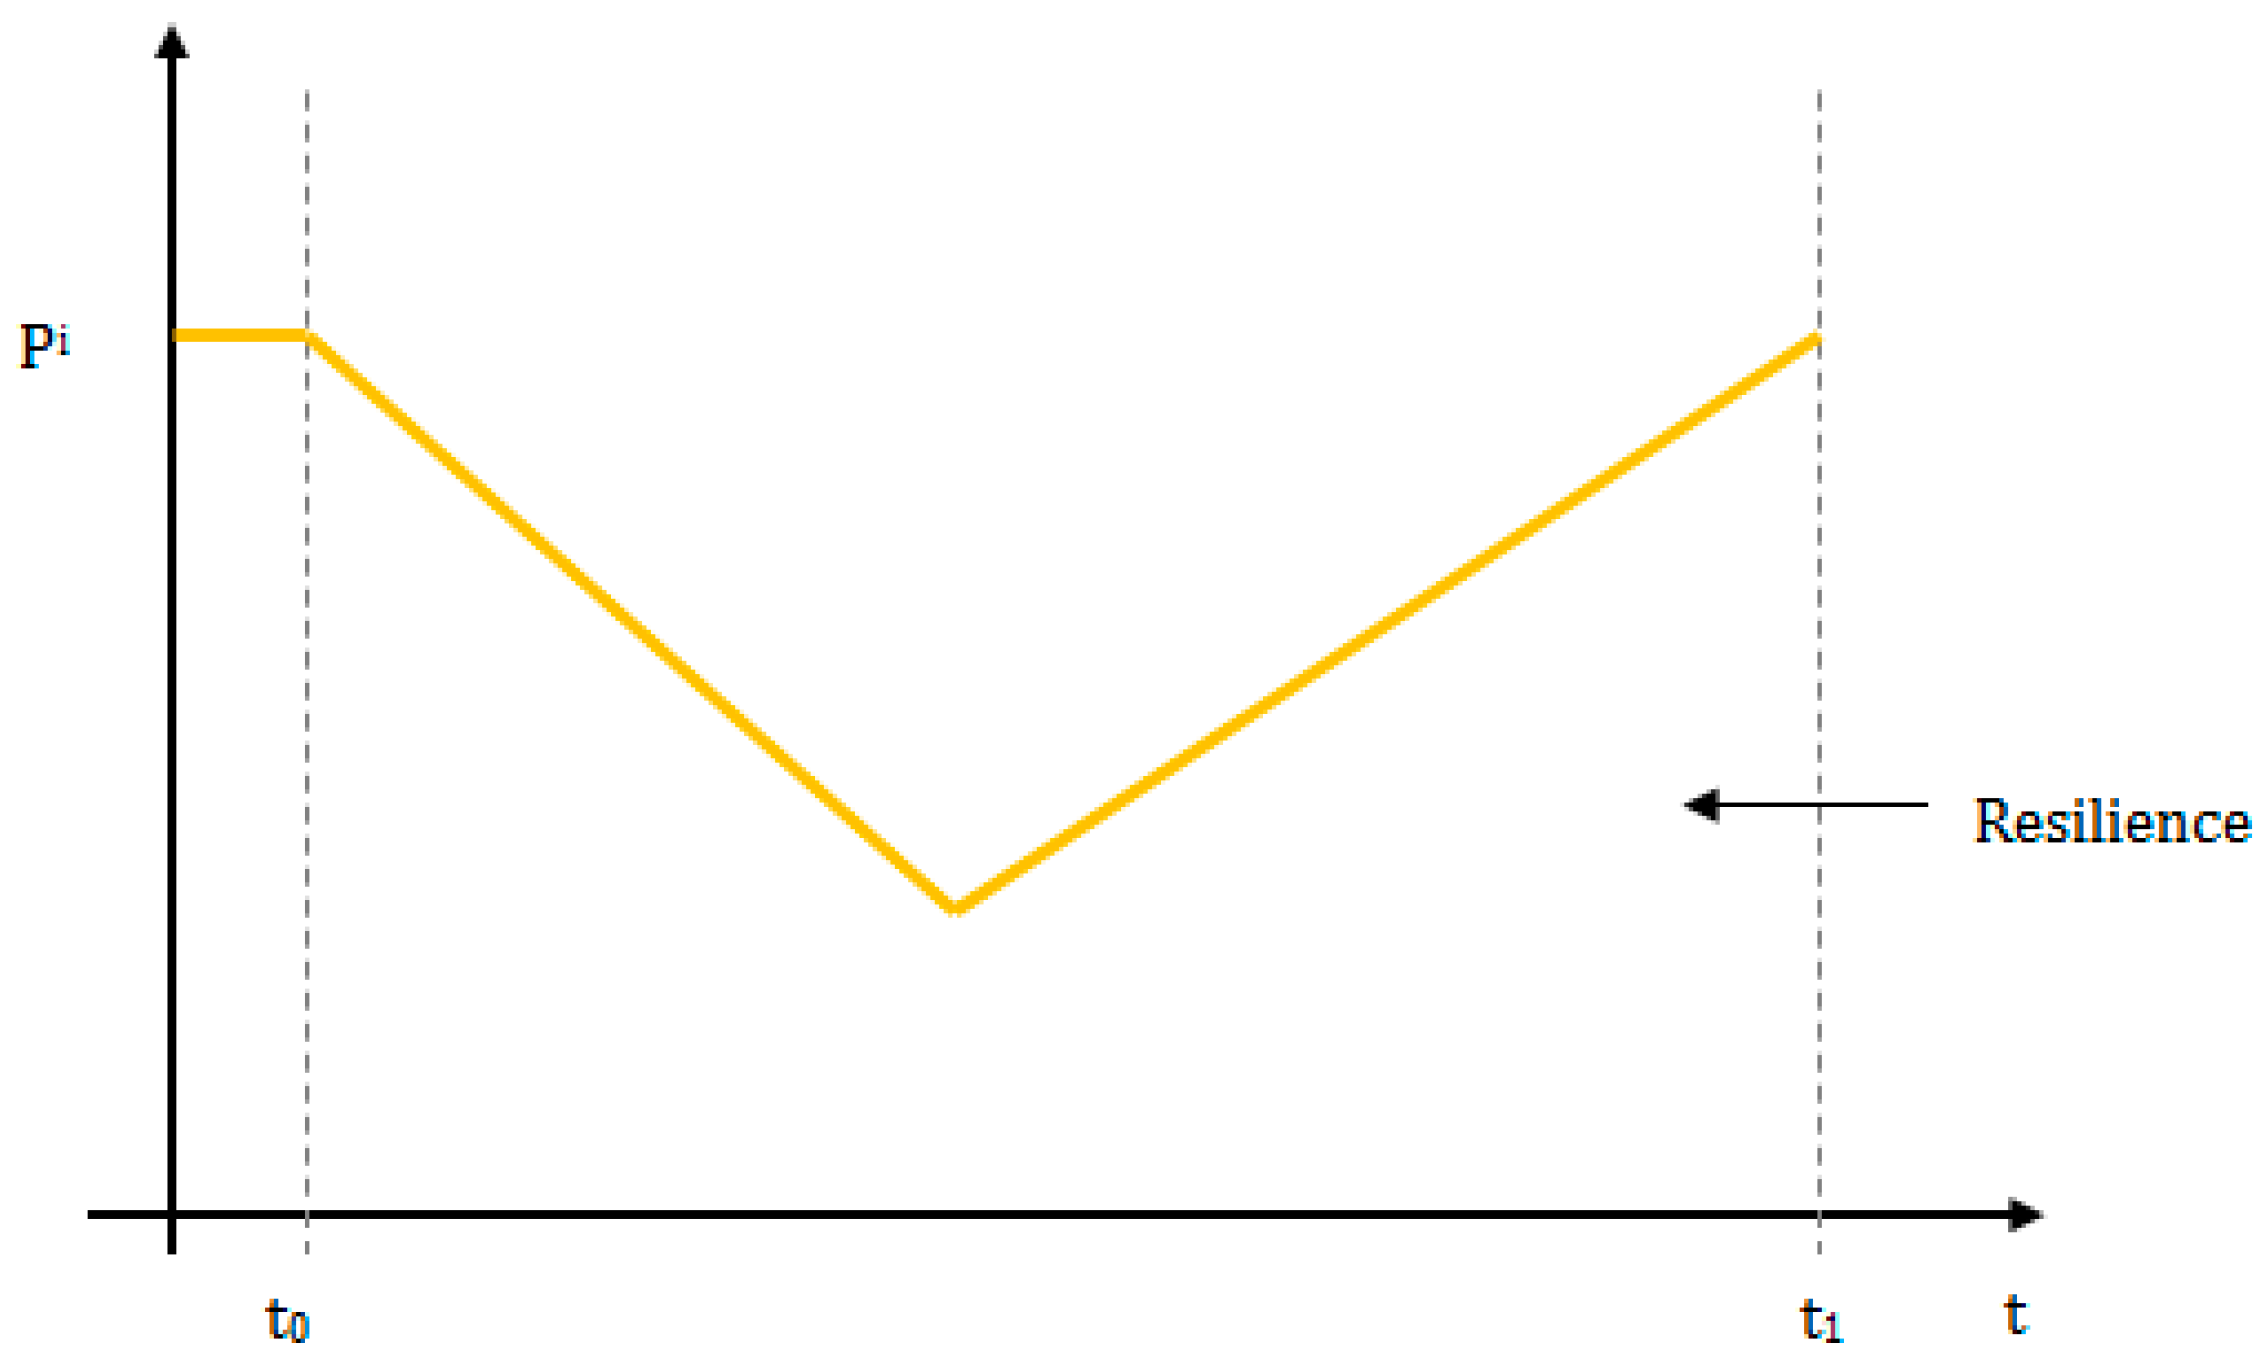
4.1.2. Computation of the Disaster Resilience Metric

ResilSIM integrates several measures of system performance in response to a hydro-meteorological event into a single measure of resilience, R. The procedure for computing the resilience metric is adapted from [10,11,12,23,24].
Step 1: Once the extent of flood inundation is simulated, measures of physical and socioeconomic system performance with respect to impacts of the hazard are determined.
(a) Physical System Performance Measure:
Urban system performance in the event of a hydro-meteorological hazard is measured as the combination of several individual impacts that are classified into the physical and socioeconomic sectors. The following impacts to the physical sector may be considered: (i) the length of the road inundated by the flood (km); and (ii) the number of structures inundated by the flood (no.). These individual measures are calculated using spatial programming techniques.
(b) Socioeconomic System Performance Measure:
Social indicators of system performance in the event of a water-related disaster are calculated as the proportion of the vulnerable population that is exposed to the hazard. In a paper that estimates spatial disaster risk, Armenakis and Nirupama [25] associate social vulnerability with the lack of resources, acquired in advance of a hazard, that would enable mitigation, coping mechanisms or rapid recovery in the event of a disaster on an individual level. Vulnerable demographics are therefore considered to represent the portion of the population who are unlikely to possess the resources and capacity required to reduce their vulnerabilities in the event of a disaster. Vulnerable demographics of the population are based on age, marital status, language, immigration, education, employment status and income [25].
For example, people belonging to the vulnerable age demographic are those below the age of 6 and over the age of 65. In general, people belonging to this demographic are less mobile and therefore, require additional human resources to evacuate and relocate during a severe flooding event. Additionally, people who are unemployed or belong to a low-income family may not have the financial resources to afford a vehicle required for individual evacuation. They may also be less inclined to abandon their homes for fear of stolen or damaged possessions that they cannot afford to replace [26]. These demographics are selected for their availability from the Canadian Census Program.
This definition of social vulnerability can be extended to measure system performance in the disaster resilience approach. Instead of only considering the possession of resources in advance of the hazard, as in the disaster risk approach, the dynamic exchange and acquisition of resources over the duration of the hazard may also be considered in the calculation of disaster resilience through resource allocation.
A sample calculation demonstrating the loss in system performance with respect to a vulnerable social group, age (A), is presented in Equation (1):
P 1 1 ( t , s ) = ( A s I )
The equation calculates the number of people belonging to the vulnerable age group (identified by the Canadian Census program, for spatial unit s) who are exposed to the flood. P 1 1 is the social performance measure that is computed at a particular time (t) and location (s) where each location represents a single spatial unit; A s is the number of people belonging to the vulnerable age category in spatial unit s; and I is the percentage of the spatial unit that is flooded.
Economic losses attributed to service disruption and structural damage represent another set of system performance measures. To calculate the economic damages incurred by various buildings and engineering structures in the event of a flood, the following equation is used:
P 2 i ( t , s ) = ( i = 1 2 ( D i k e × I M i k e ) )
where P 2 i is the system performance measure that is computed at a particular time (t) and location (s); it is measured in units of dollars. The monetary damage incurred as a result of the hazard is represented by D, while the impact multiplier that is the proportion of damage endured by the physical element is represented by IM. Furthermore, e signifies the infrastructure element; k denotes the infrastructure type (each type corresponds to a unique stage-damage curve as explained below); and finally, i stands for the impact category that is either: 1—loss of service/structure; or 2—loss of equipment.
The loss of service/structure impact multiplier (IM1ke) measures the percent loss of the intended function of the infrastructure element; its value ranges from 0 to 1 where a value of 1 is indicative of a complete loss of service. All infrastructure elements including buildings, critical facilities and other engineering structures experience a total loss of service once inundated by the flood and therefore, are assigned a value of IM1ke = 1. Buildings and critical facilities may undergo partial loss of service. This occurs when their access routes are obstructed by the flood; for example, a fire station may have four access routes and if three out of the four routes are inundated, the station has lost 75% of its typical functioning level and therefore, the corresponding impact multiplier is assigned a value of IM1ke = 0.75.
The loss of equipment impact multiplier (IM2ke) estimates the percentage of equipment lost where equipment is defined as the contents or non-structural components of the element. Evidently, most engineering structures (roads, bridges, culverts, power and communications towers, etc.) do not contain equipment and therefore, this measure cannot be applied to these infrastructure types. For buildings and critical facilities, however, it is estimated that in the case that the structure is inundated, the consequential loss of equipment will be equal to 30% of the structural damage.
Both impact multipliers correspond to a damage parameter that is the total economic damage incurred by the structure as a result of the flood (D). Stage-damage curves are used to estimate the monetary damage caused to a structure, or physical entity, for a particular flood depth. A unique curve exists for each infrastructure type (k). More information on stage-damage curves is provided in Section 5.2 [23].
It is important to note that system performance impacts may vary depending on the information that is available for the urban system under investigation.
(c) System Performance Overview:
System performance measures are dynamic. In the case of a flooding event, for example, flood depths change over the duration of the hazard. Since all impacts are directly affected by flood extent and flood depth, the values of the system performance measures also fluctuate over the course of the hazard; refer to Figure 2 for a sample dynamic system performance curve for impact i. The shaded area above the curve represents the total loss of system performance. Parameters t0 and t1 represent the time at the beginning and end of the disruption (disaster or hydro-meteorological event), respectively.
It is observed that system performance decreases once the disruption begins (t0) and recovers over time. For example, for the measure of system performance that calculates the number of critical facilities that are inundated by the flood, as the flooding event begins, an increasing number of structures are flooded and therefore, they lose their normal ability to provide service. As the flood recedes, the facilities may regain their normal level of service.
Alternatively, flood depths may be provided as a single inundation map for the time in which peak flooding has occurred. As a result, the value of system performance is static and does not change over the duration of the hazardous event (see Figure 3). Comparing the performance curves in Figure 2 and Figure 3, it is evident that the static system performance measure significantly overestimates loss of system performance and therefore, it underestimates the value of resilience that is represented by the normalized area under the curve. To alleviate this problem, it may be more reasonable for system performance to decrease at a constant, linear rate from a normal level of performance to a peak loss in performance (coinciding with the time at the peak of the hazard) then increase at another constant rate to the post-hazard performance level (see Figure 4).
Ideally, inundation maps should be included for several time slices of the flood duration in order to dynamically measure system performance, thereby improving the resilience estimation. However, if this information is not available, it is recommended to measure system performance as demonstrated in Figure 4.
The figures presented in this section demonstrate that indicators of system performance return to their pre-hazard level of performance at the end of the disruption. This is not always the case. It is possible for system performance to partially recover or to strengthen into a higher level of system performance than before the hazard occurred, as shown in Figure 5.
Step 2: Loss in system performance over time is represented by the area above the system performance curve from the initial time of disturbance to the time at the end of system recovery and it is calculated using Equation (3) for each physical and socioeconomic system performance measure.
ρ i ( t , s ) = t 0 t [ P 0 i P i ( t , s ) ] d t
Step 3: The resilience unit of each system component, represented by the normalized area below the system performance curve, is computed using Equation (4):
r i ( t , s ) = 1 ( ρ i ( t , s ) P 0 i × ( t t 0 ) )
All system performance measures are normalized or rescaled, otherwise variables that are measured in units of a larger magnitude will have a greater influence on the value of the resilience metric.
Step 4: The resilience unit of each system component is combined into the final, all-encompassing resilience metric in Equation (5):
R ( t , s ) = { i = 1 M r i ( t , s ) } 1 M
Figure 6, Figure 7 and Figure 8 show the relationship between resilience and time in the event of a disturbance (flood). Resilience takes on a value between 0 and 1; t0 is the initial time of disruption; t1 is the end of the disruption or the time at which the system begins to return to a normal level of performance; and tr is the time at the end of the recovery period. The difference between the diagrams is attributed to the way in which system performance is measured. The resilience graph in Figure 6 corresponds to the system performance curve in Figure 2 that is measured for several time slices over the course of the disruption. Figure 2 reveals that the system performance (the shaded area above the curve) decreases, reaches a peak value, and then begins to improve/increase until the end of the disruption t1. This is reflected in the resilience curve: Resilience decreases over the duration of the disaster, however, it decreases at a higher rate at the beginning of the disruption and a lower rate after the peak of the disruption. Recovery (improvement of urban resilience) tends to occur after the disturbance has ceased (after the flood has retreated).
Static system performance curves of Figure 3 and Figure 4 correspond to the resilience curves of Figure 7 and Figure 8.
Disaster risk and resilience share some similarities. Fundamental differences between the two methods of disaster management are the incorporation of adaptive capacity into the resilience metric and its dynamic character. Risk is defined by static, pre-hazard vulnerabilities of the system that are exposed to the hazard. Resilience is affected by the same pre-hazard vulnerabilities in addition to the system’s ability to resist, cope with and rapidly recover (to varying degrees) from hazardous impacts through the implementation of adaptation options.
Step 5: Adaptive capacity is a measure of system performance with respect to the physical and socioeconomic impacts to the urban system after adaptation option(s) have been implemented; for example, in the case of urban flooding, the installation of flood protection measures reduces the magnitude of the loss in system performance (fewer roads, structures and people are inundated, economic damages are reduced) and improves the robustness of the system (Figure 9a). In addition, the allocation of materials such as disaster relief funds increases the rate of recovery of the system performance measures (Figure 9b). To introduce adaptive capacity into the analysis, the appropriate option for adaptation is applied and the resilience metric is re-computed following Steps 1 to 4. Employment of adaptive capacity should mitigate the loss of system performance, thereby improving resilience. The dashed lines in Figure 9a,b represent the system performance post-implementation of adaptive capacity. When compared to Figure 2, the overall loss in system performance has been reduced.
After resilience has been updated to incorporate different measures of adaptive capacity, the user can look at the graph as a whole to observe how it has been improved, degraded or unchanged. ResilSIM does not provide a single value for decision makers to use. If decision makers are interested in rapid recovery, they can use time to the end of the recovery period as their decision criterion. Alternatively, decision makers may prefer a more robust system (improvement to the value of resilience at the peak of the hazard), or a higher level of system performance once the recovery period has ceased.

4.2. Decision Support System Description

In this section, the structure of the ResilSIM tool and its major components are described including: (i) the user interface; (ii) spatial database; and (iii) mathematical module.

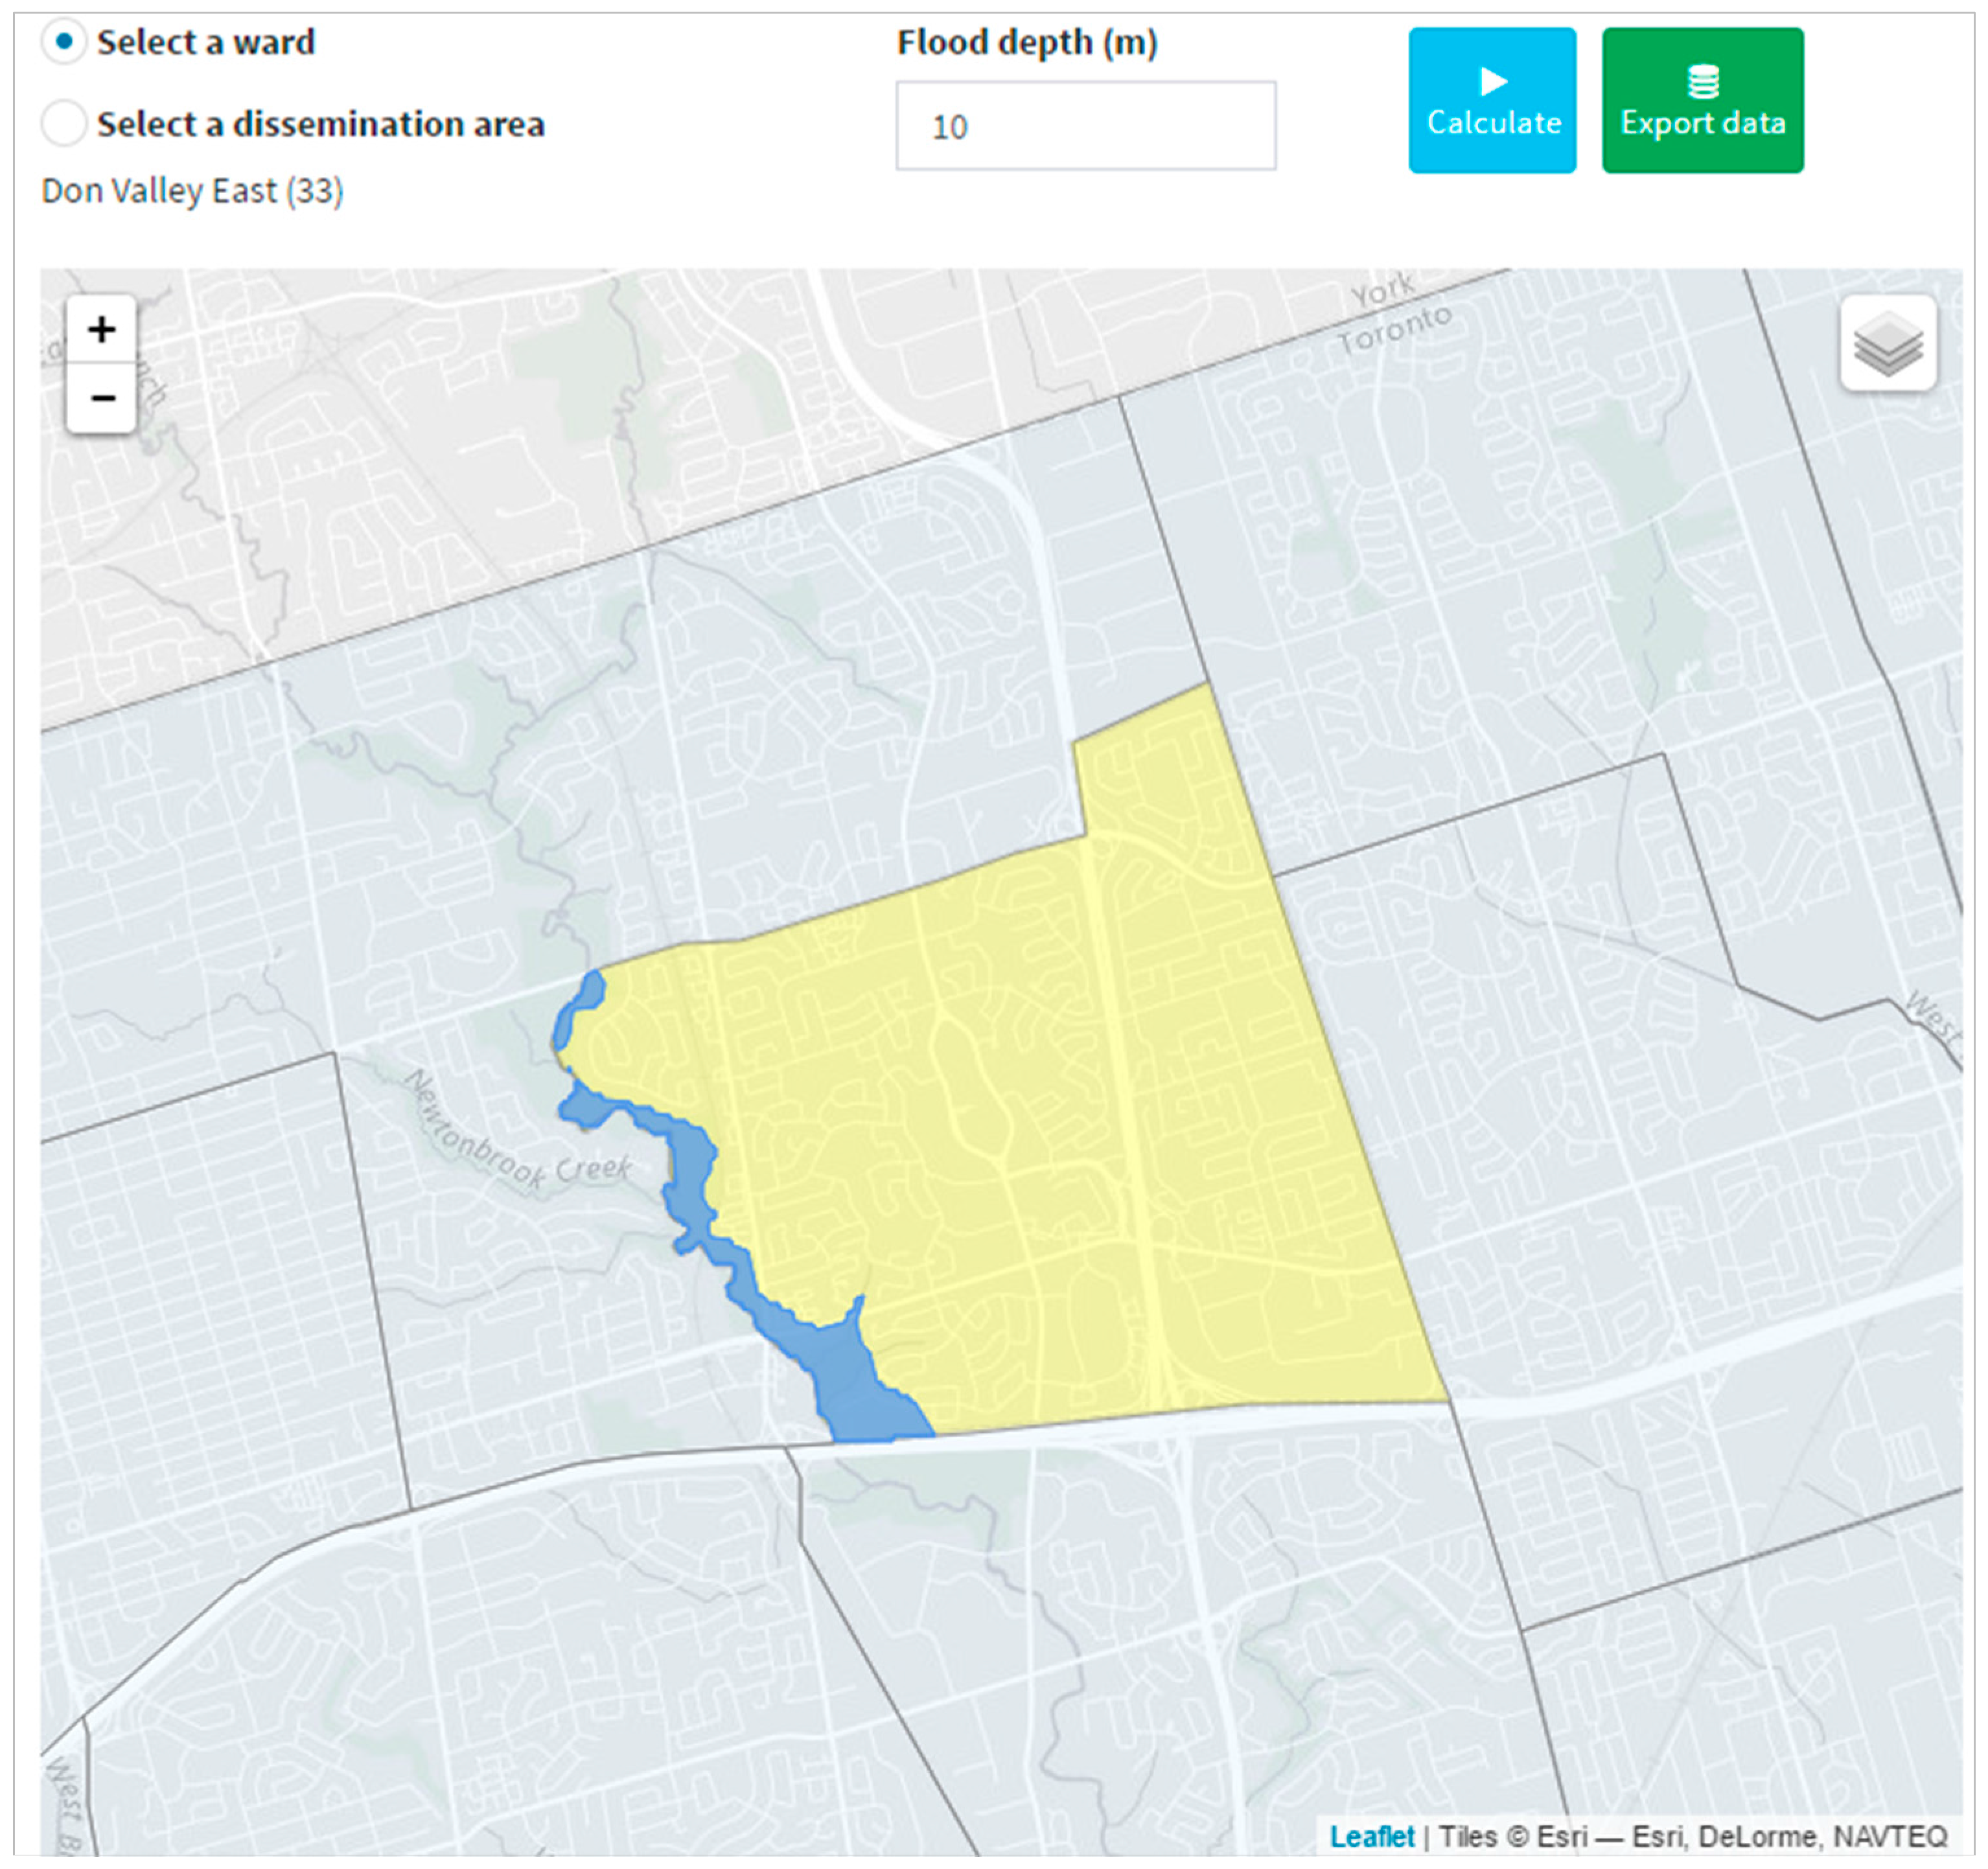
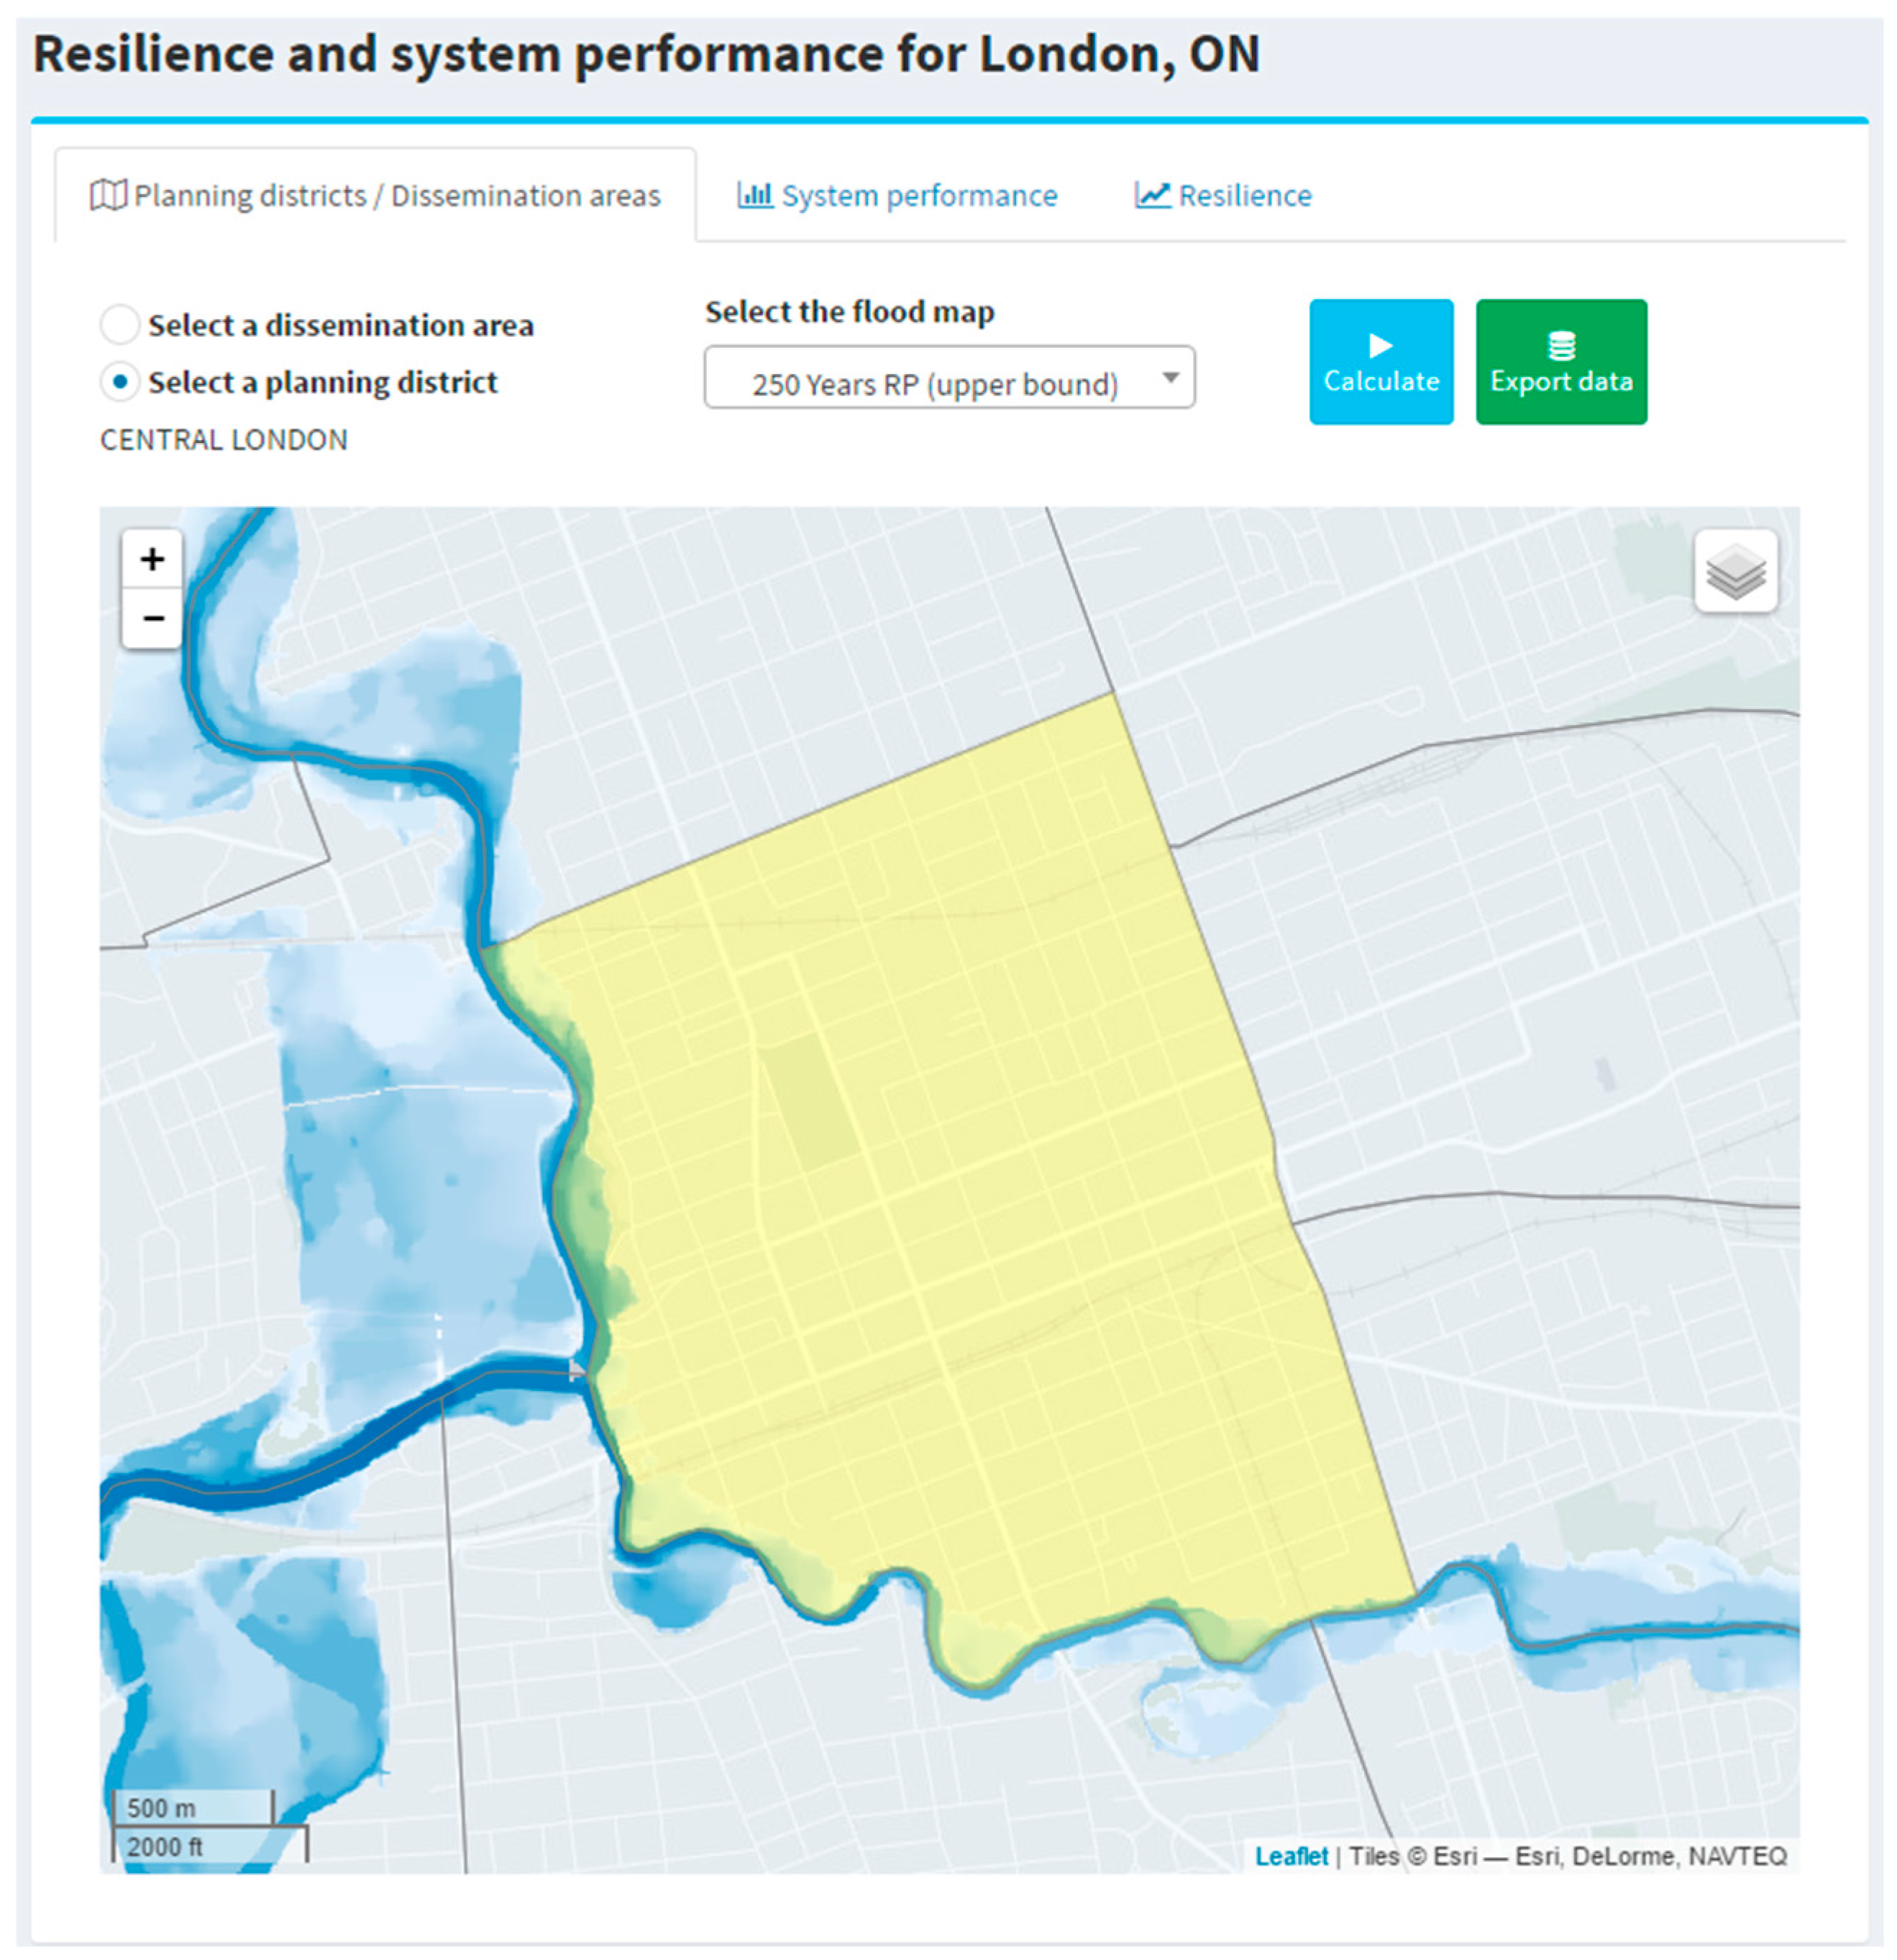
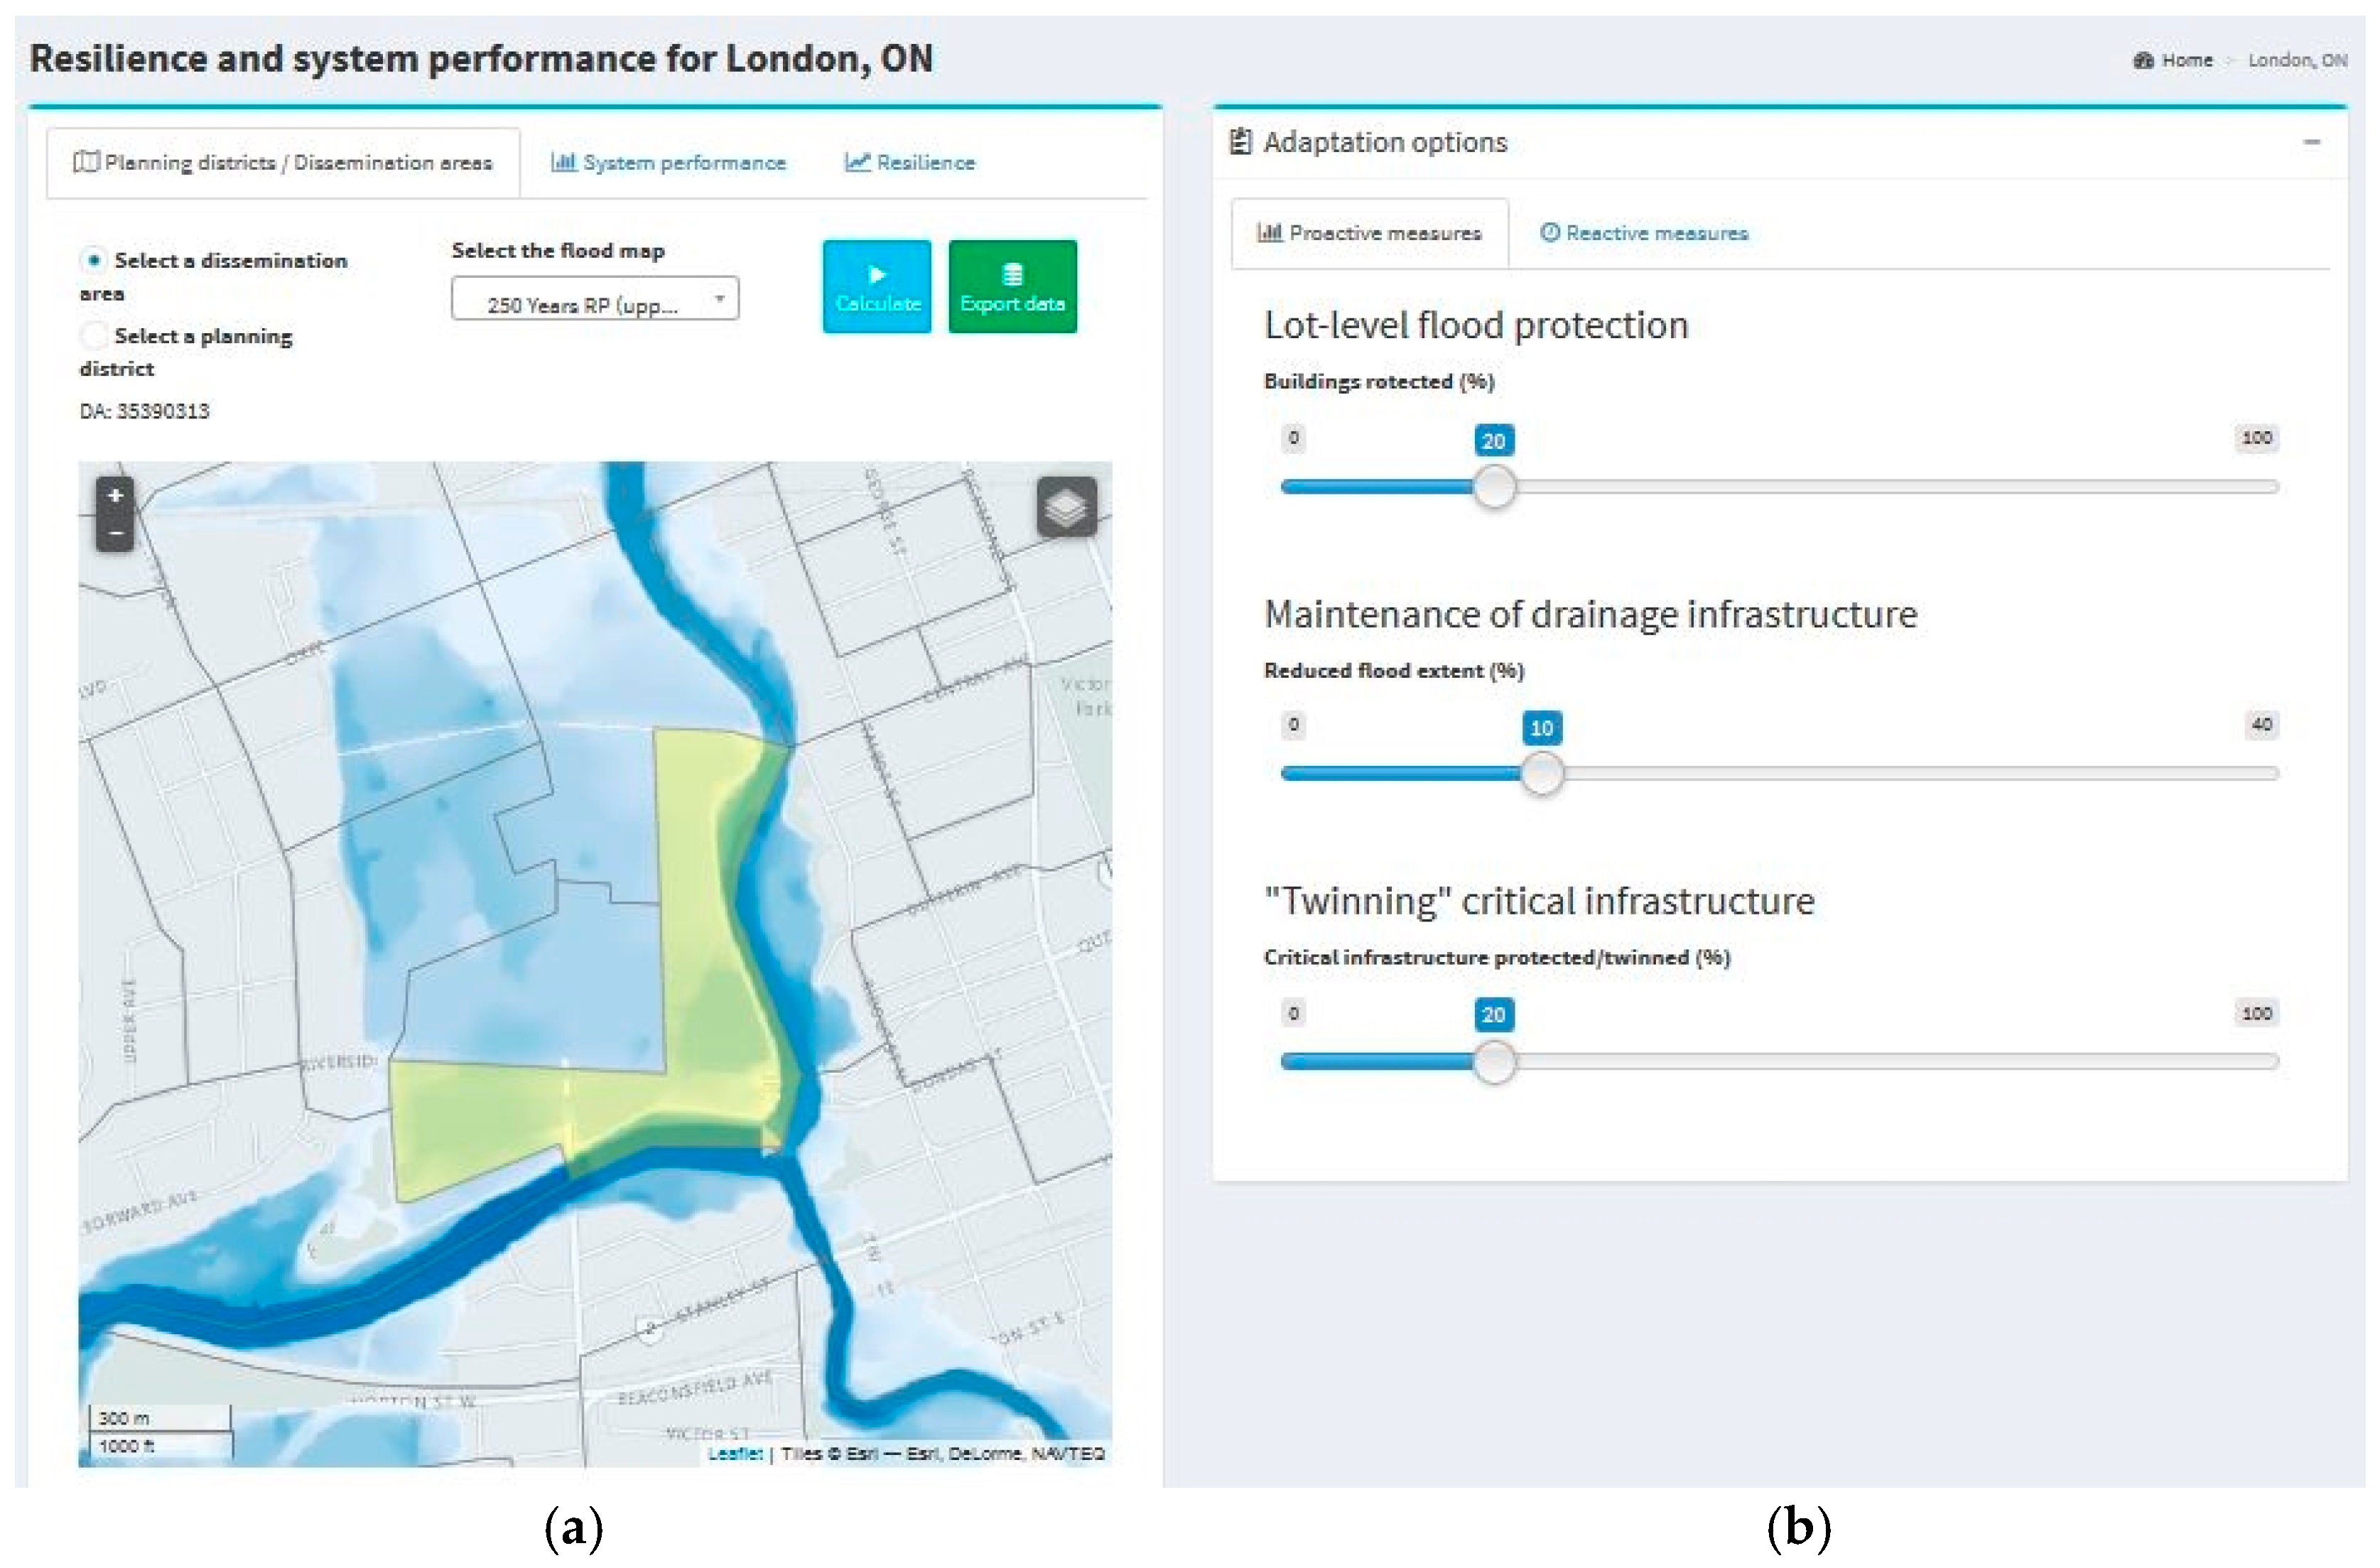
4.2.1. User Interface

A screenshot of the user interface for demonstration in London, Ontario is presented in Figure 10. It is designed to relay the user’s actions to the other tool components including the spatial database and the mathematical module.
Major components of the user interface include: (i) the Leaflet API that is the GIS component used to present the spatial data (in layers), background maps, and options for selection of the spatial unit (administrative boundaries such as planning districts, and wards) for which the metric is computed; (ii) data input functions that allow for users to select different combinations of adaptive capacity (that are added or removed using interactive slider controls); and (iii) results visualization functions that allow for the presentation of system performance and resilience as interactive graphs as well as data tables extracted from the database system (used for export).

4.2.2. Database

The database system stores the maps and other information (such as digital elevation models) that are used to simulate the hazard, as well as the engineering, building and socioeconomic spatial datasets that are used in the resilience calculation. The database also stores the files of the planning districts and political ward boundaries that define the spatial units in which the calculations are performed. The database management system (DBMS) is the latest version of the PostgreSQL with the Post GIS extension.
All datasets are stored in a tabular format. The spatial data are stored with their corresponding geographical location to support the calculation of the system performance and resilience measures in each spatial unit. Other important PostGIS features of the ResilSIM tool (besides the tabular and spatial information) include: (i) views that allow for the combination of several tables using relational operations and returns the aggregated data to the user interface; and (ii) functions that are used to perform calculations and extract data from the database. All GIS operations (overlay, interpolations, and extract flooded areas) are performed using PostGIS internal functions.

4.2.3. Mathematical Module

The ResilSIM tool incorporates a simplified mathematical module that provides support for the computation of system performance and resilience metrics based on the presented methodology. This module also incorporates the codes and logic to extract and process data from the DBMS.

4.2.4. Technical Implementation Details
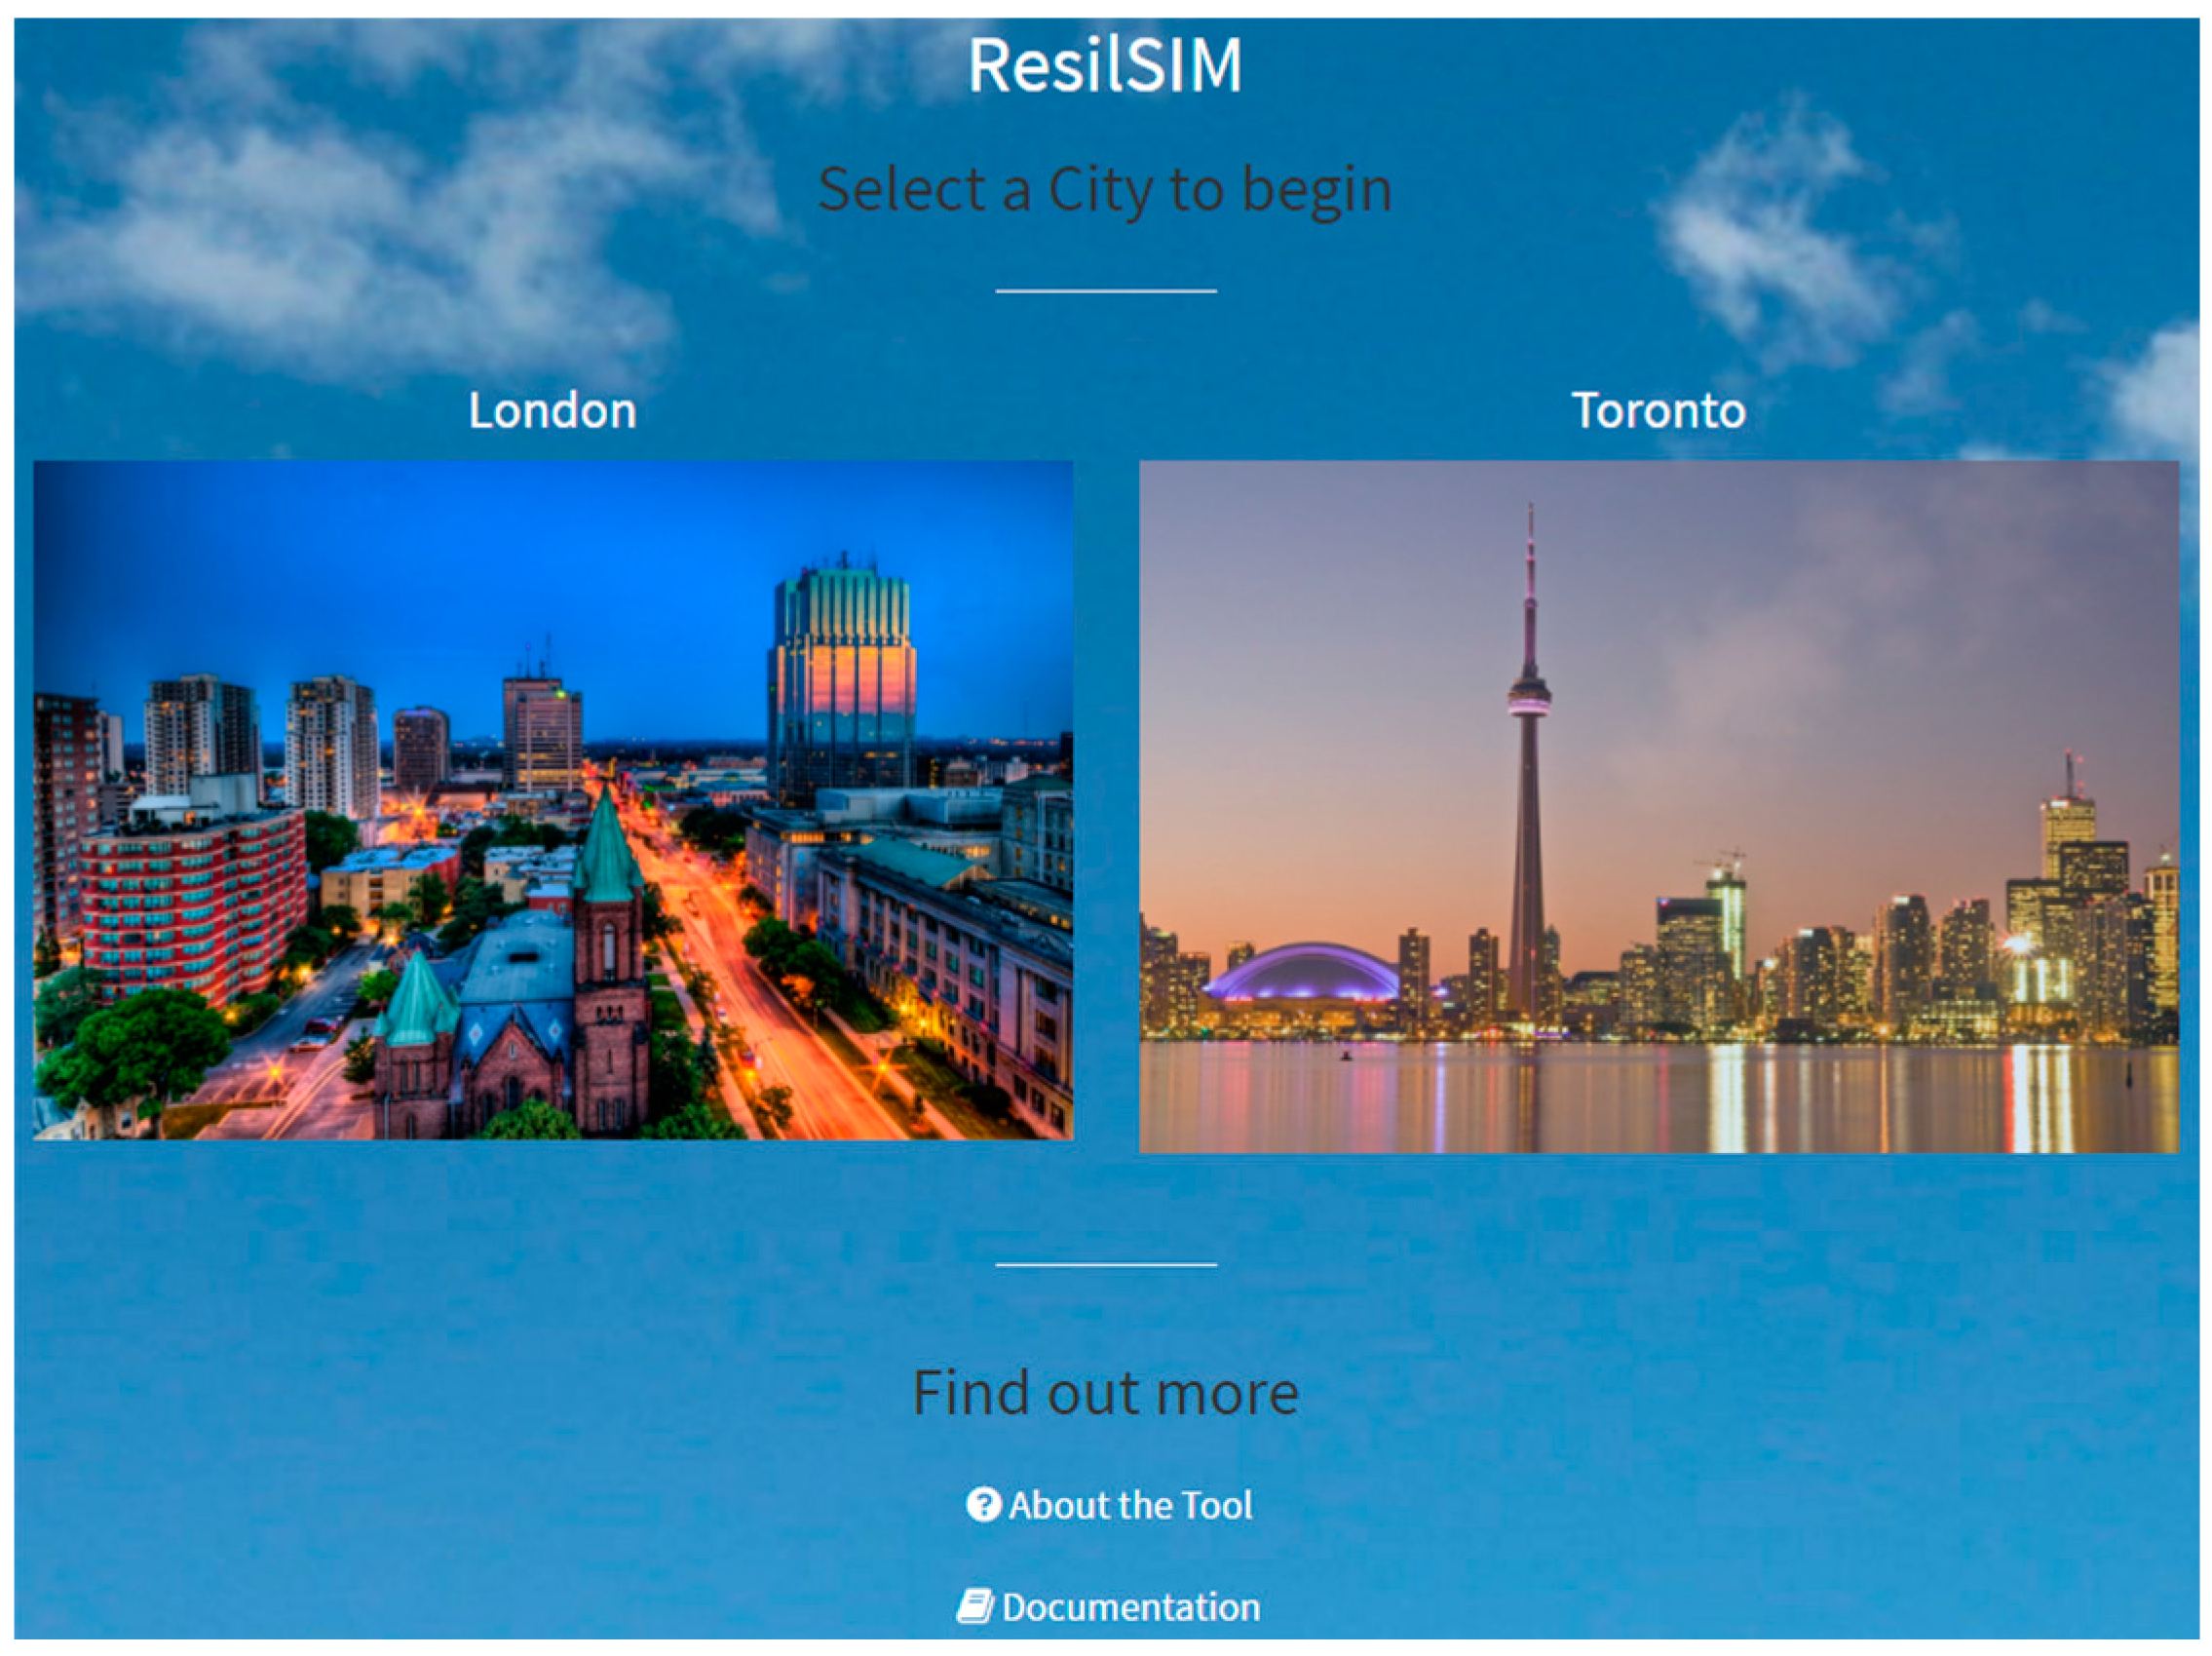
ResilSIM is a web-based decision support system that is not system dependent. It is compatible with modern web browsers and it is mobile friendly. A major technical challenge faced in the development of the tool is the creation of a computationally efficient method for interpolating hazard maps with building, critical facility, engineering infrastructure, and socioeconomic datasets.
The mathematical models and functions of the tool are written in the object oriented C# language, part of the .Net Framework. This programming language provides the features required to code the tool’s structure including the system performance and resilience algorithms. The user interface employs a combination of technologies including: ASP.Net, HMTL5 (HyperText Markup Language version 5), CCS3 (Cascading Style Sheets, version 3), jQuery Framework and Leaflet Maps API to support the GIS capabilities, interactive graph and tables jQuery tools and other components.

5. Case Study

ResilSIM is capable of estimating resilience for water-related natural disasters. The methodology has been presented using riverine flooding as an example of a hazardous event. The tool is demonstrated for application in London, Ontario, which is vulnerable to climate change-caused riverine flooding. This section provides: (i) a description of the flood generation processes in London, Ontario; (ii) a list of the publicly accessible datasets used in DSS tool development including options for adaptive capacity; and (iii) demonstration of DSS tool output for this specific case study.

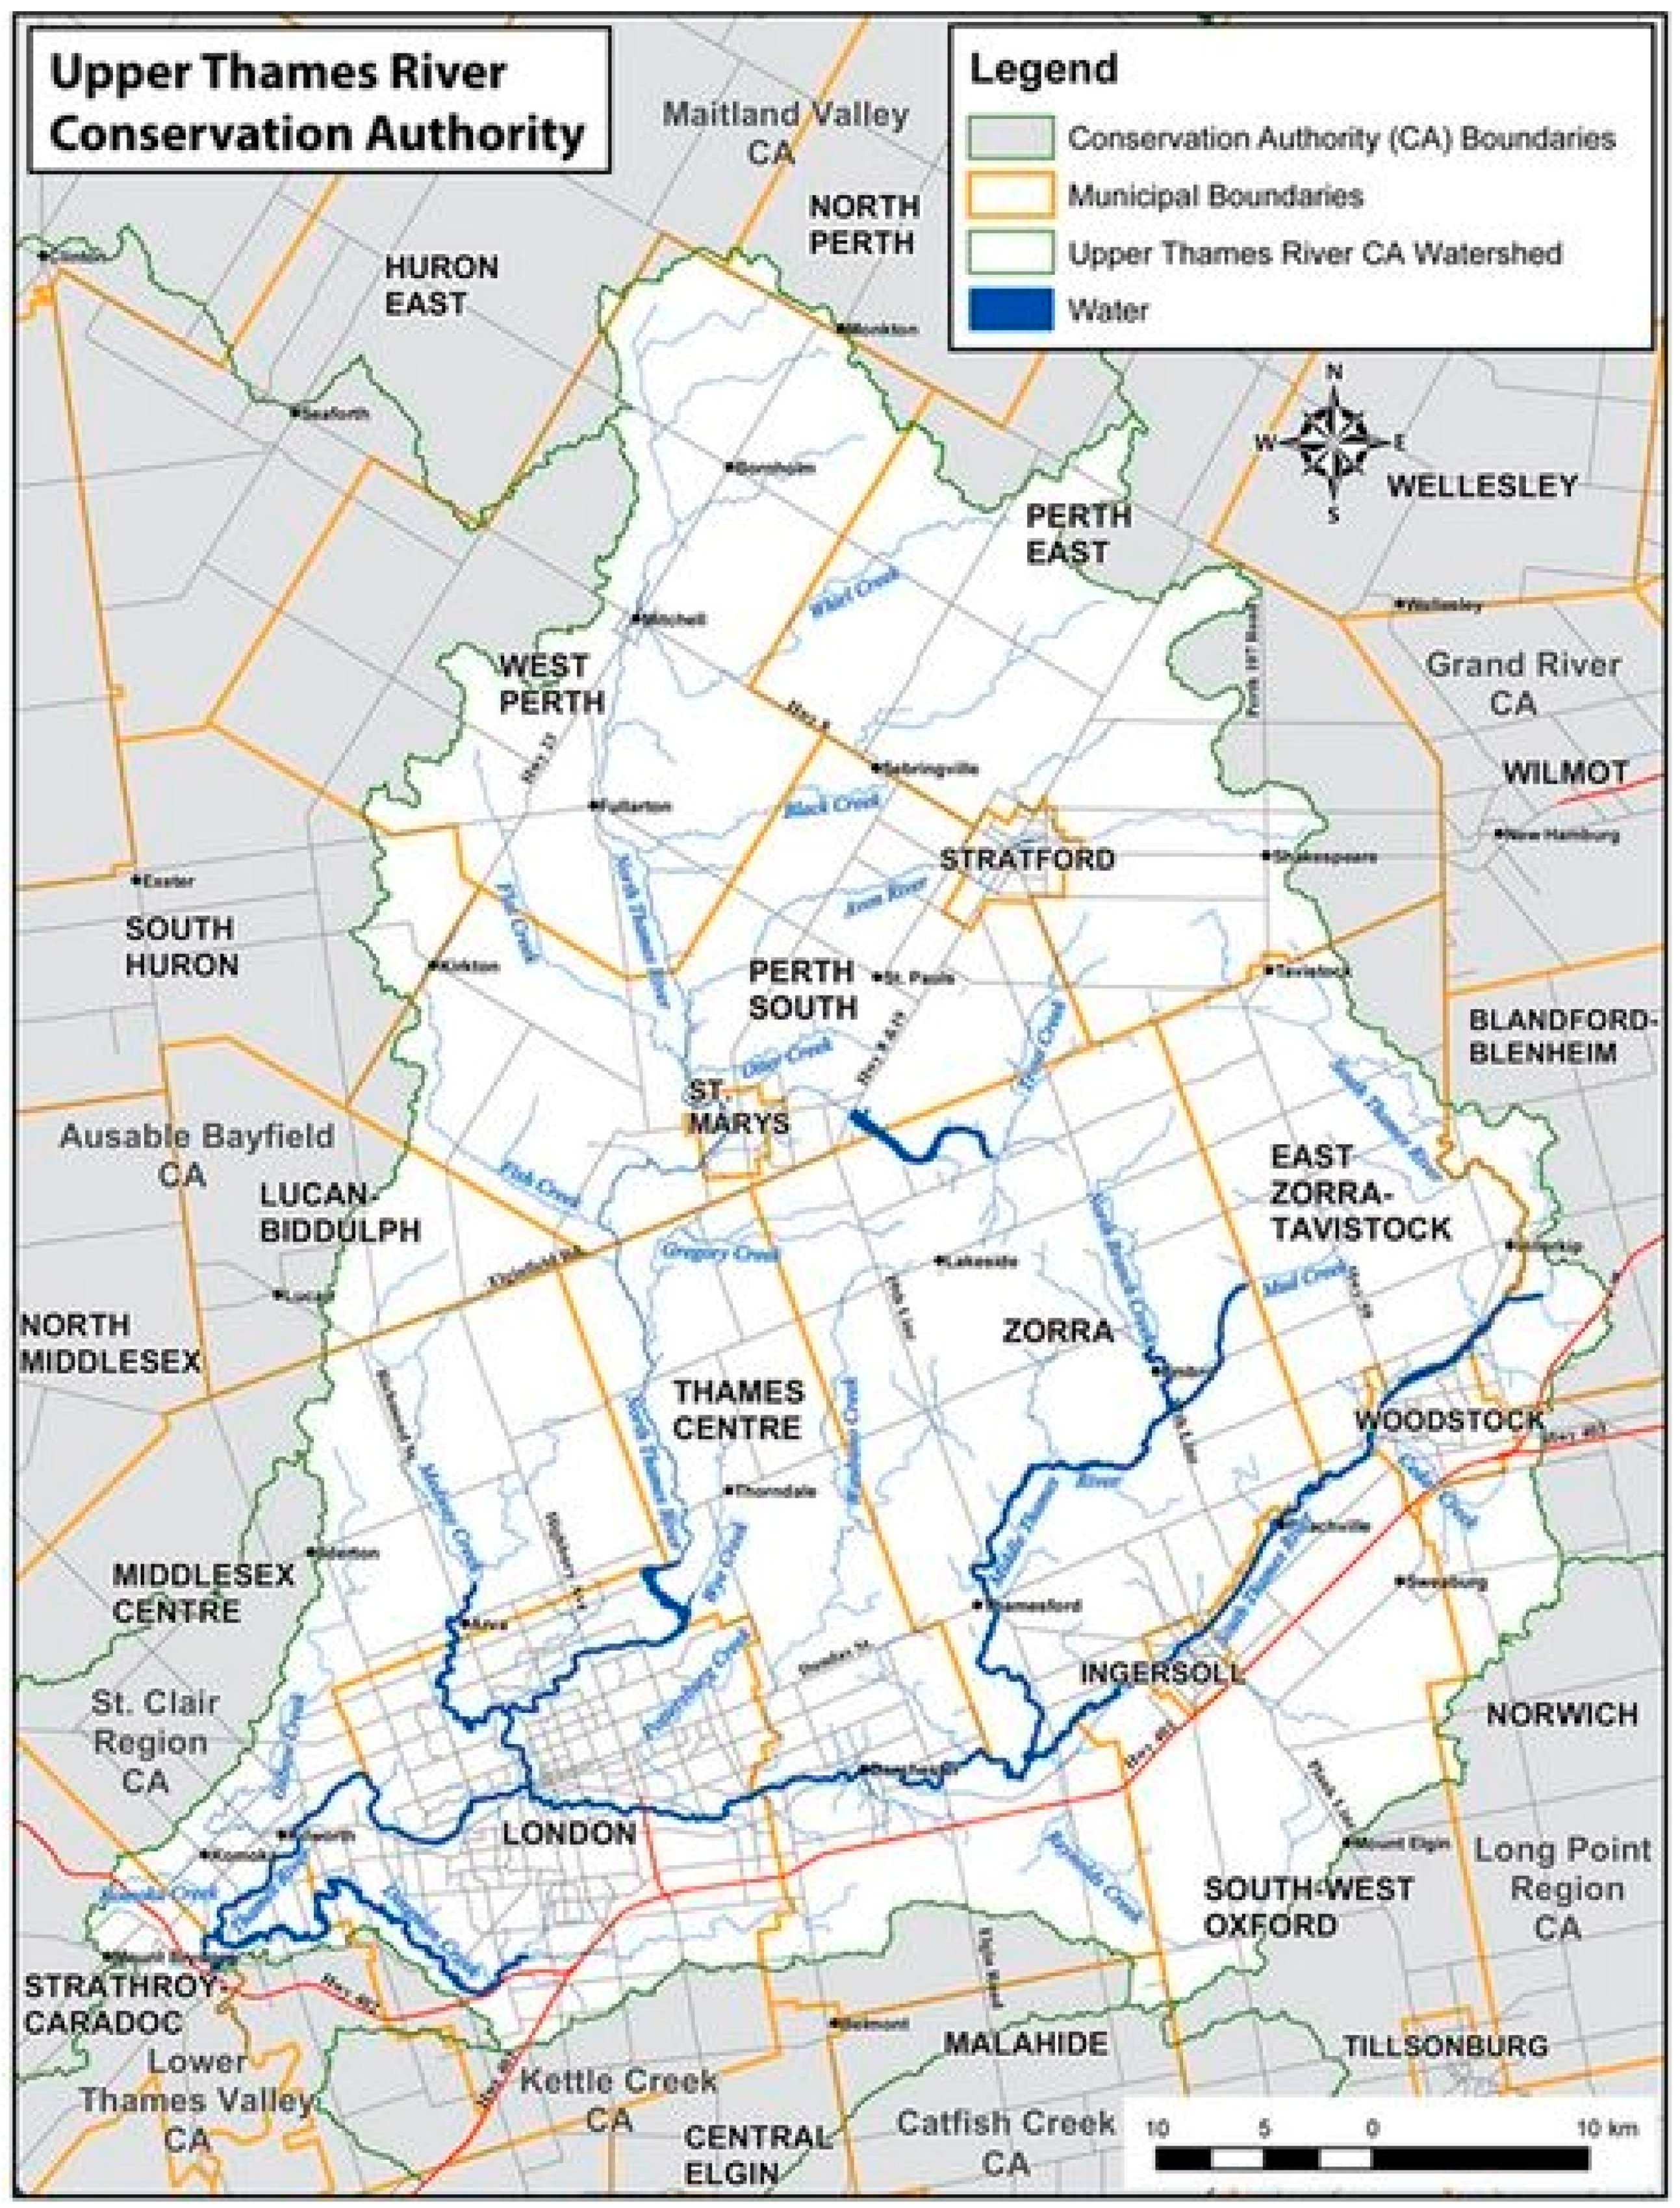
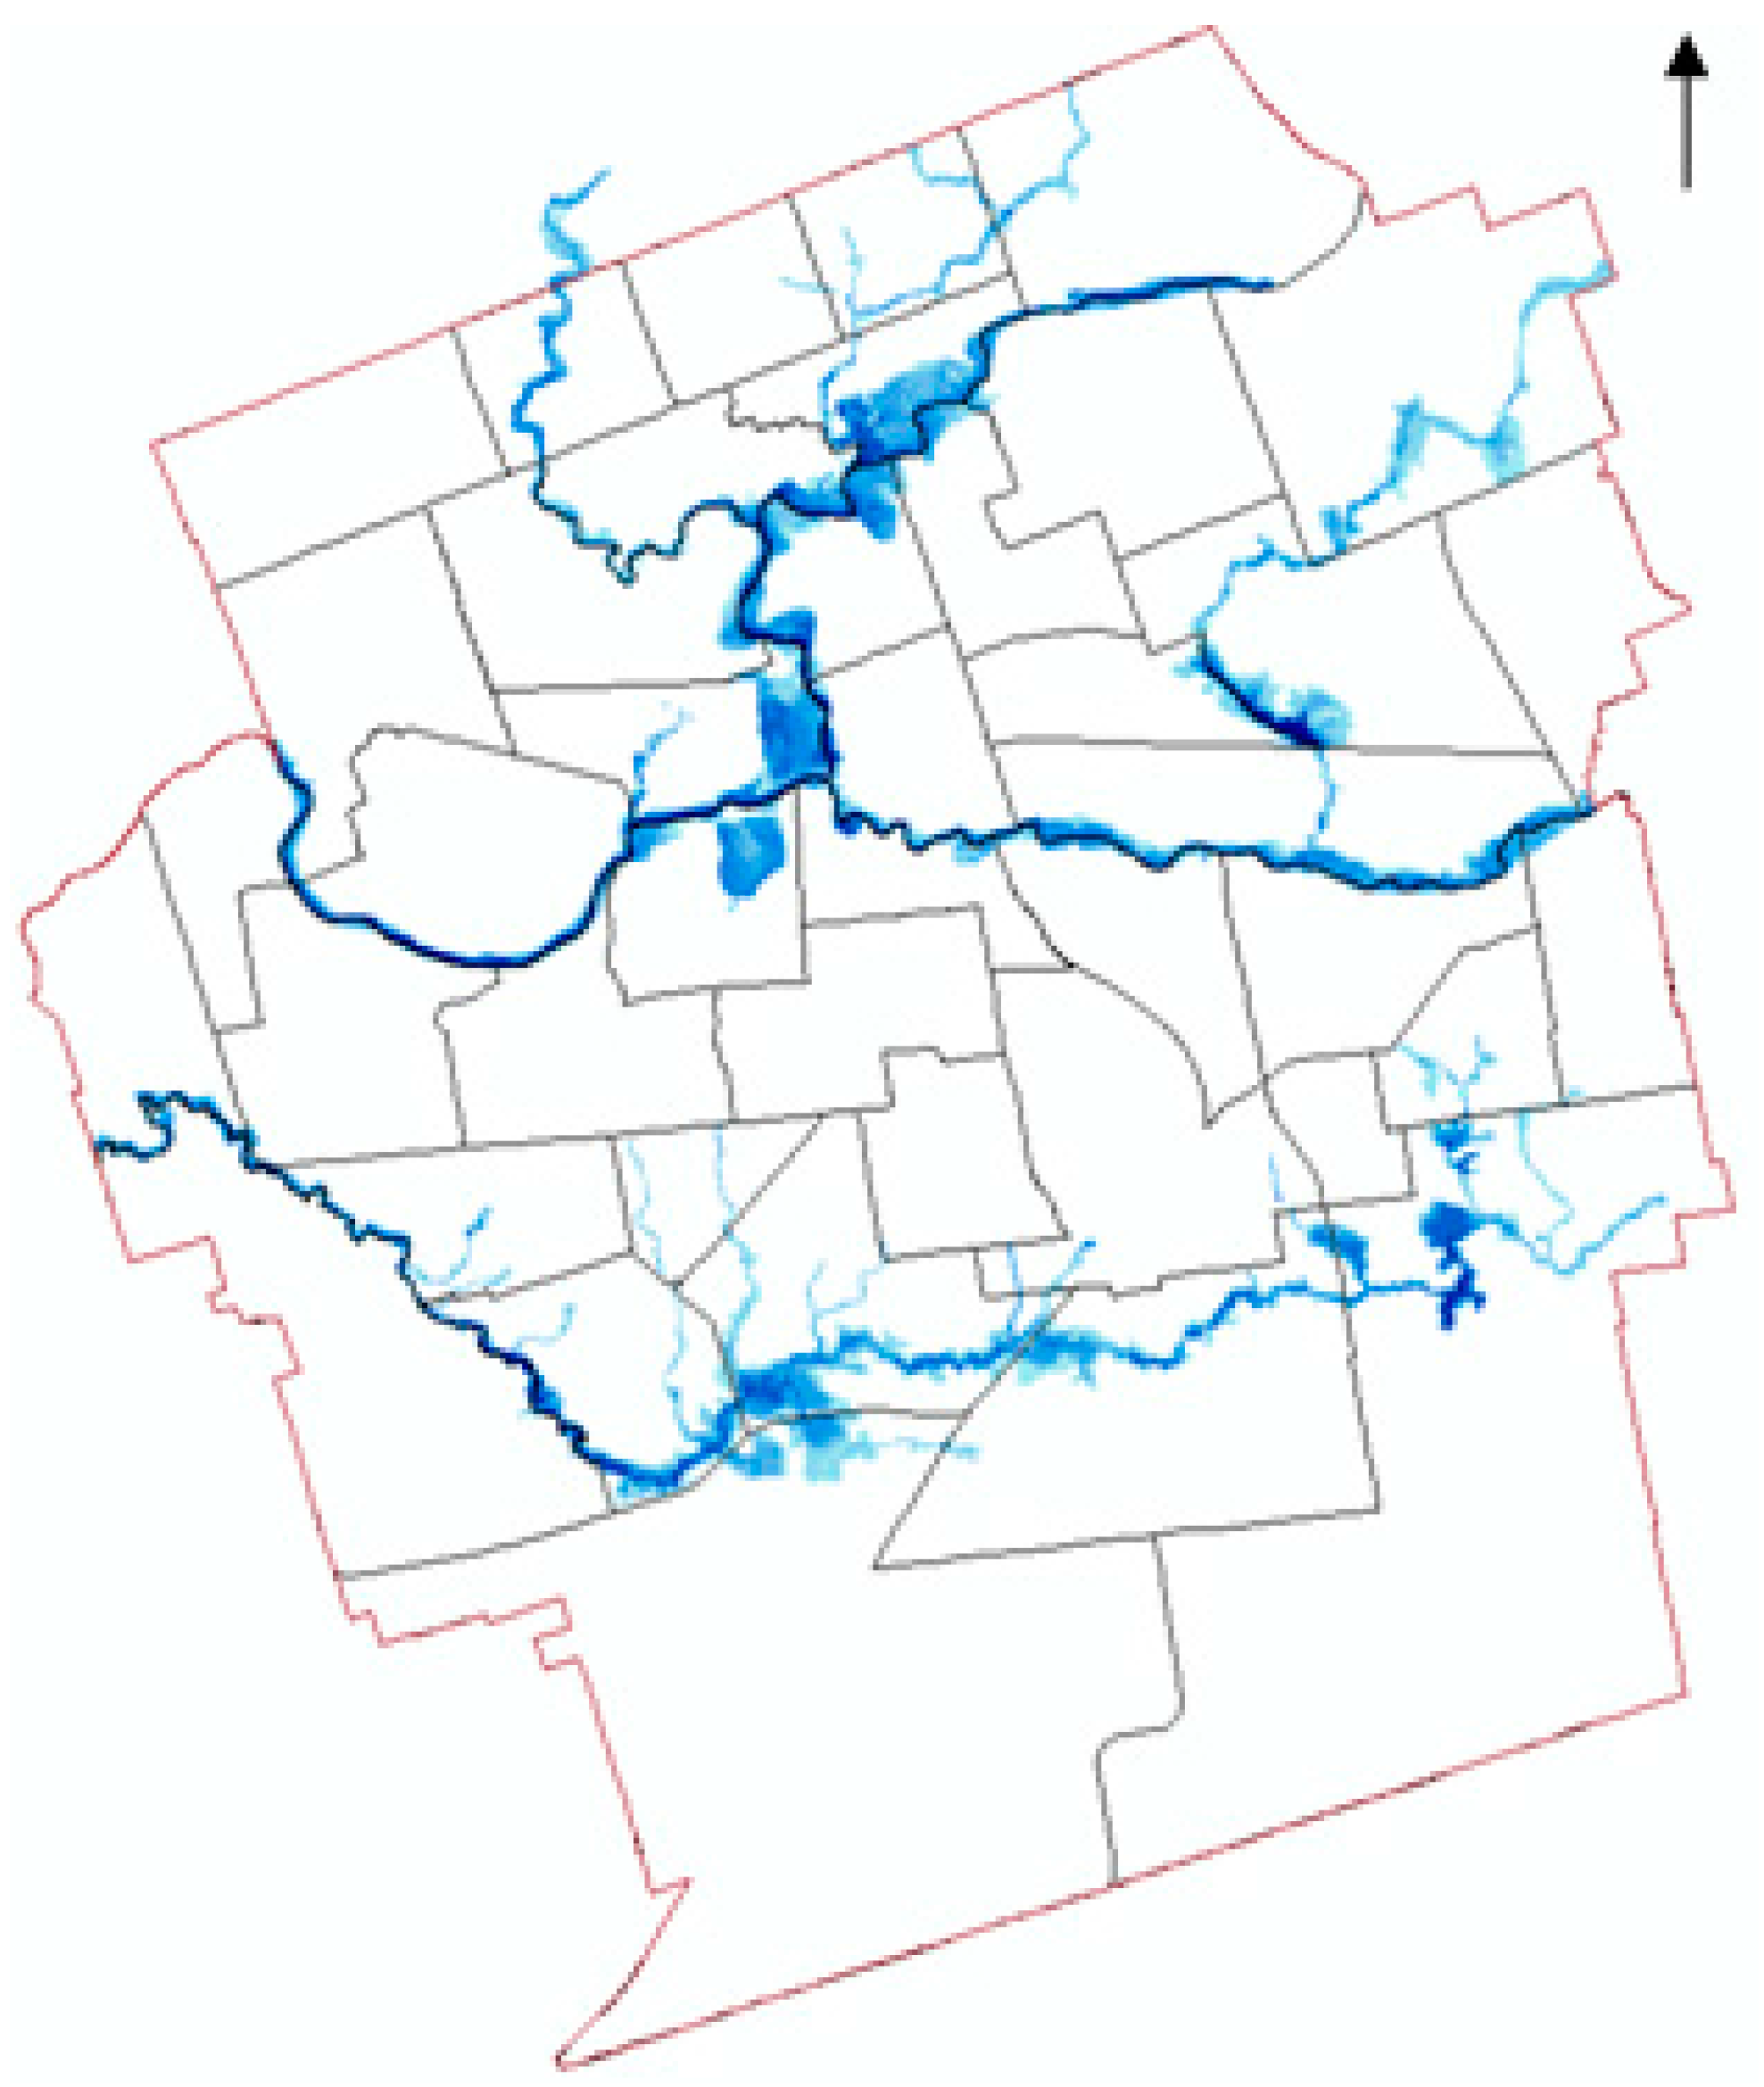
5.1. Study Area Description

The municipality of London, Ontario, Canada is particularly susceptible to riverine flooding of the Thames River. London resides in the Upper Thames River watershed that is managed by the Upper Thames River Conservation Authority. The majority of the watershed’s landscape is rural except for the large urban centres of Stratford, Woodstock, Ingersoll, St. Mary’s, Mitchell and London. Surface water runoff is diverted into streams and creeks that drain into the Thames River. The Thames River is composed of two branches; the north branch flows southward through Mitchell, St. Mary’s and London, and the east branch flows westward through Woodstock, Ingersoll and into London (see Figure 11). The branches converge at the Forks located in downtown London where the river continues to flow westward, exiting the city in the Byron suburb [27].
The transformation of surrounding lands from dense, deciduous forest to urban and agricultural development has contributed to an increase in riverine flooding. Urban and agricultural development has led to the introduction of impervious land surfaces and sewer systems that increase the rate of runoff to the river resulting in uncontrolled, rapidly rising water levels [22,28]. Evidently, the Thames River is susceptible to flooding due to the characteristics of its surrounding environment. The most severe flooding event on record occurred in April 1937 when 130 mm of rainfall fell on the watershed over a six-day period. During this time water levels were already high due to the spring snowmelt. The flood led to one death and 1100 damaged homes and businesses; hundreds of people were left homeless. Fortunately, since then, there have not been any floods nearly as devastating, which may be attributed to the creation of the Ontario Conservation Authority Act of 1946. The act awarded authority to various groups (known as conservation authorities) that are located within major watershed boundaries to undertake natural resource management of their respective areas. The Upper Thames River Conservation Authority has acted to protect the people and properties from flooding within the watershed through the construction of three large dams: (i) Fanshawe (1953); (ii) Wildwood (1965); and (iii) Pittock (1967), [28].
Although the dams have significantly reduced the magnitude of flooding throughout the city, there are still certain low-lying areas along the river that are subject to annual flooding (the north branch and the river forks). As climate change persists, it is expected that regional flooding will increase in depth and areal extent. Figure 12 depicts the extent of the projected flood inundation of the Thames River (and Dingman Creek to the south) under future climate change scenarios and a 250 year return period [22]. The map shown here is one of four included in the ResilSIM structure to simulate the hazard. The other maps (not presented in the manuscript) represent the 100-year flood for lower and upper bound climate change scenarios and the 250-year flood for the lower bound scenario. All maps are generated for the peak of the flooding events.
The City of London can benefit from resilience analysis and the implementation of adaptive capacity to proactively reduce the impacts of future projected flooding of the Thames River.

5.2. Data

The spatial datasets required for model development for application in London, Ontario are described in this subsection. The resilience metric combines several performance measures that represent the physical and socioeconomic impacts of a hazard to an urban system. The data used to compute the physical system performance measures are obtained from a few sources including the City of London (http://www.london.ca/, accessed on January 2016), the Municipal Property Assessment Corporation (https://www.mpac.ca/about/corporate_overview/default.asp, accessed on January 2016) and CanVec+ (http://geogratis.gc.ca/, accessed on January 2016), while the data required to compute the socioeconomic system performance measures are acquired from the Canadian Census Program. These datasets were chosen because they are often available for municipalities across the Province of Ontario. CanVec+ and Canadian Census program data are available across the country; therefore the model is more easily transferrable between sites and less programming is required. Table 1 provides a summary of the required and publicly available datasets.
The Municipal Property Assessment Corporation (MPAC) is a not-for-profit organization funded by Ontario municipalities. Its objective is to assess and classify all properties in compliance with the Ontario government’s Assessment Act. The City of London has derived building “envelopes” (outlines) from topographic information and assigned land use classifications and descriptions supplied by MPAC to all properties within their jurisdiction. In the physical system of the ResilSIM tool, the buildings that are assigned to all commercial, industrial and residential MPAC land use categories are retained for analysis. Critical facilities described as ambulance stations, fire halls, hospitals, police stations and schools are also retained and used in model development.
The engineering infrastructure data that are employed in the physical component of the model are obtained from the CanVec+ catalog that is produced and maintained by Natural Resources Canada (NRCan). CanVec+ is a digital cartographic reference product that is comprised of a variety of topographic entities in a vector format. With CanVec+, NRCan aims to provide uniform topographic data across Canada that is updated frequently to offer the best available resources at the highest resolutions. The entities are available for download from: ftp://ftp2.cits.rncan.gc.ca/pub/canvec+ (accessed on January 2016).
The data used for the calculation of the socioeconomic system performance measures are acquired from the Canadian Census Program administered by Statistics Canada. The Canadian Census Program provides a statistical representation of the country’s socioeconomic environment every five years; the last year being 2011. Canadian census boundaries are available as shape-files for a variety of geographic levels; the smallest of which are the dissemination areas. The census profile datasets are stored in comma separated value files (csv-files) that are accessible from: https://www12.statcan.gc.ca/ (accessed on January 2016). The census profile data are assigned to their respective dissemination areas (or other spatial unit, administrative boundary in which the resilience metric is calculated) by matching identification codes. This function is performed in a GIS environment (https://www.arcgis.com/features/, accessed on January 2016). Currently, resilience is computed using planning districts and political wards as spatial units.
Based on the relevant, publicly available datasets for London, Ontario, the following measures of system performance are used in the resilience calculation:
Physical impacts of system performance:
  • 1—Length of road inundated by the flood (km)
  • Number of structures inundated by the flood (no.):
    2—Critical facilities
    3—Commercial buildings
    4—Industrial buildings
    5—Residential buildings
    6—Engineering infrastructure
Social impacts of system performance:
  • 7—Number of persons younger than 6 or older than 65 (A)
  • 8—Number of people who are divorced or widowed (DW)
  • 9—Number of single parents (SP)
  • 10—Number of migrants (MG)
  • 11—Number of allophones—a resident whose first language is neither English nor French (L)
  • 12—Number of immigrants (IM)
  • 13—Number of visible minorities (VM)
  • 14—Number of persons without a high school education (ED)
  • 25—Number of unemployed persons (UE)
  • 16—Number of families with annual income less than $50,000
Economic impacts of system performance:
  • Economic damages incurred ($):
    17—Critical facilities
    18—Commercial buildings
    19—Industrial buildings
    20—Residential buildings
    21—Engineering infrastructure (unable to compute without stage-damage curves)
Stage-damage curves are used in the system performance measure that calculates the economic damages incurred by the inundated structures (see Section 4.1, Step 1b). The Ontario Ministry of Natural Resources has developed stage-damage curves to represent buildings classified as residential and commercial/industrial/institutional within the province. These curves are used to determine the damage parameter for their respective buildings and critical facilities (that are classified as institutional) [29]. If stage-damage curves are not available for certain physical entities (engineering infrastructure including energy and communications infrastructure), the entities cannot be included in the calculation of this impact. It is strongly recommended to develop stage-damage curves for all infrastructure types to be included in the model.

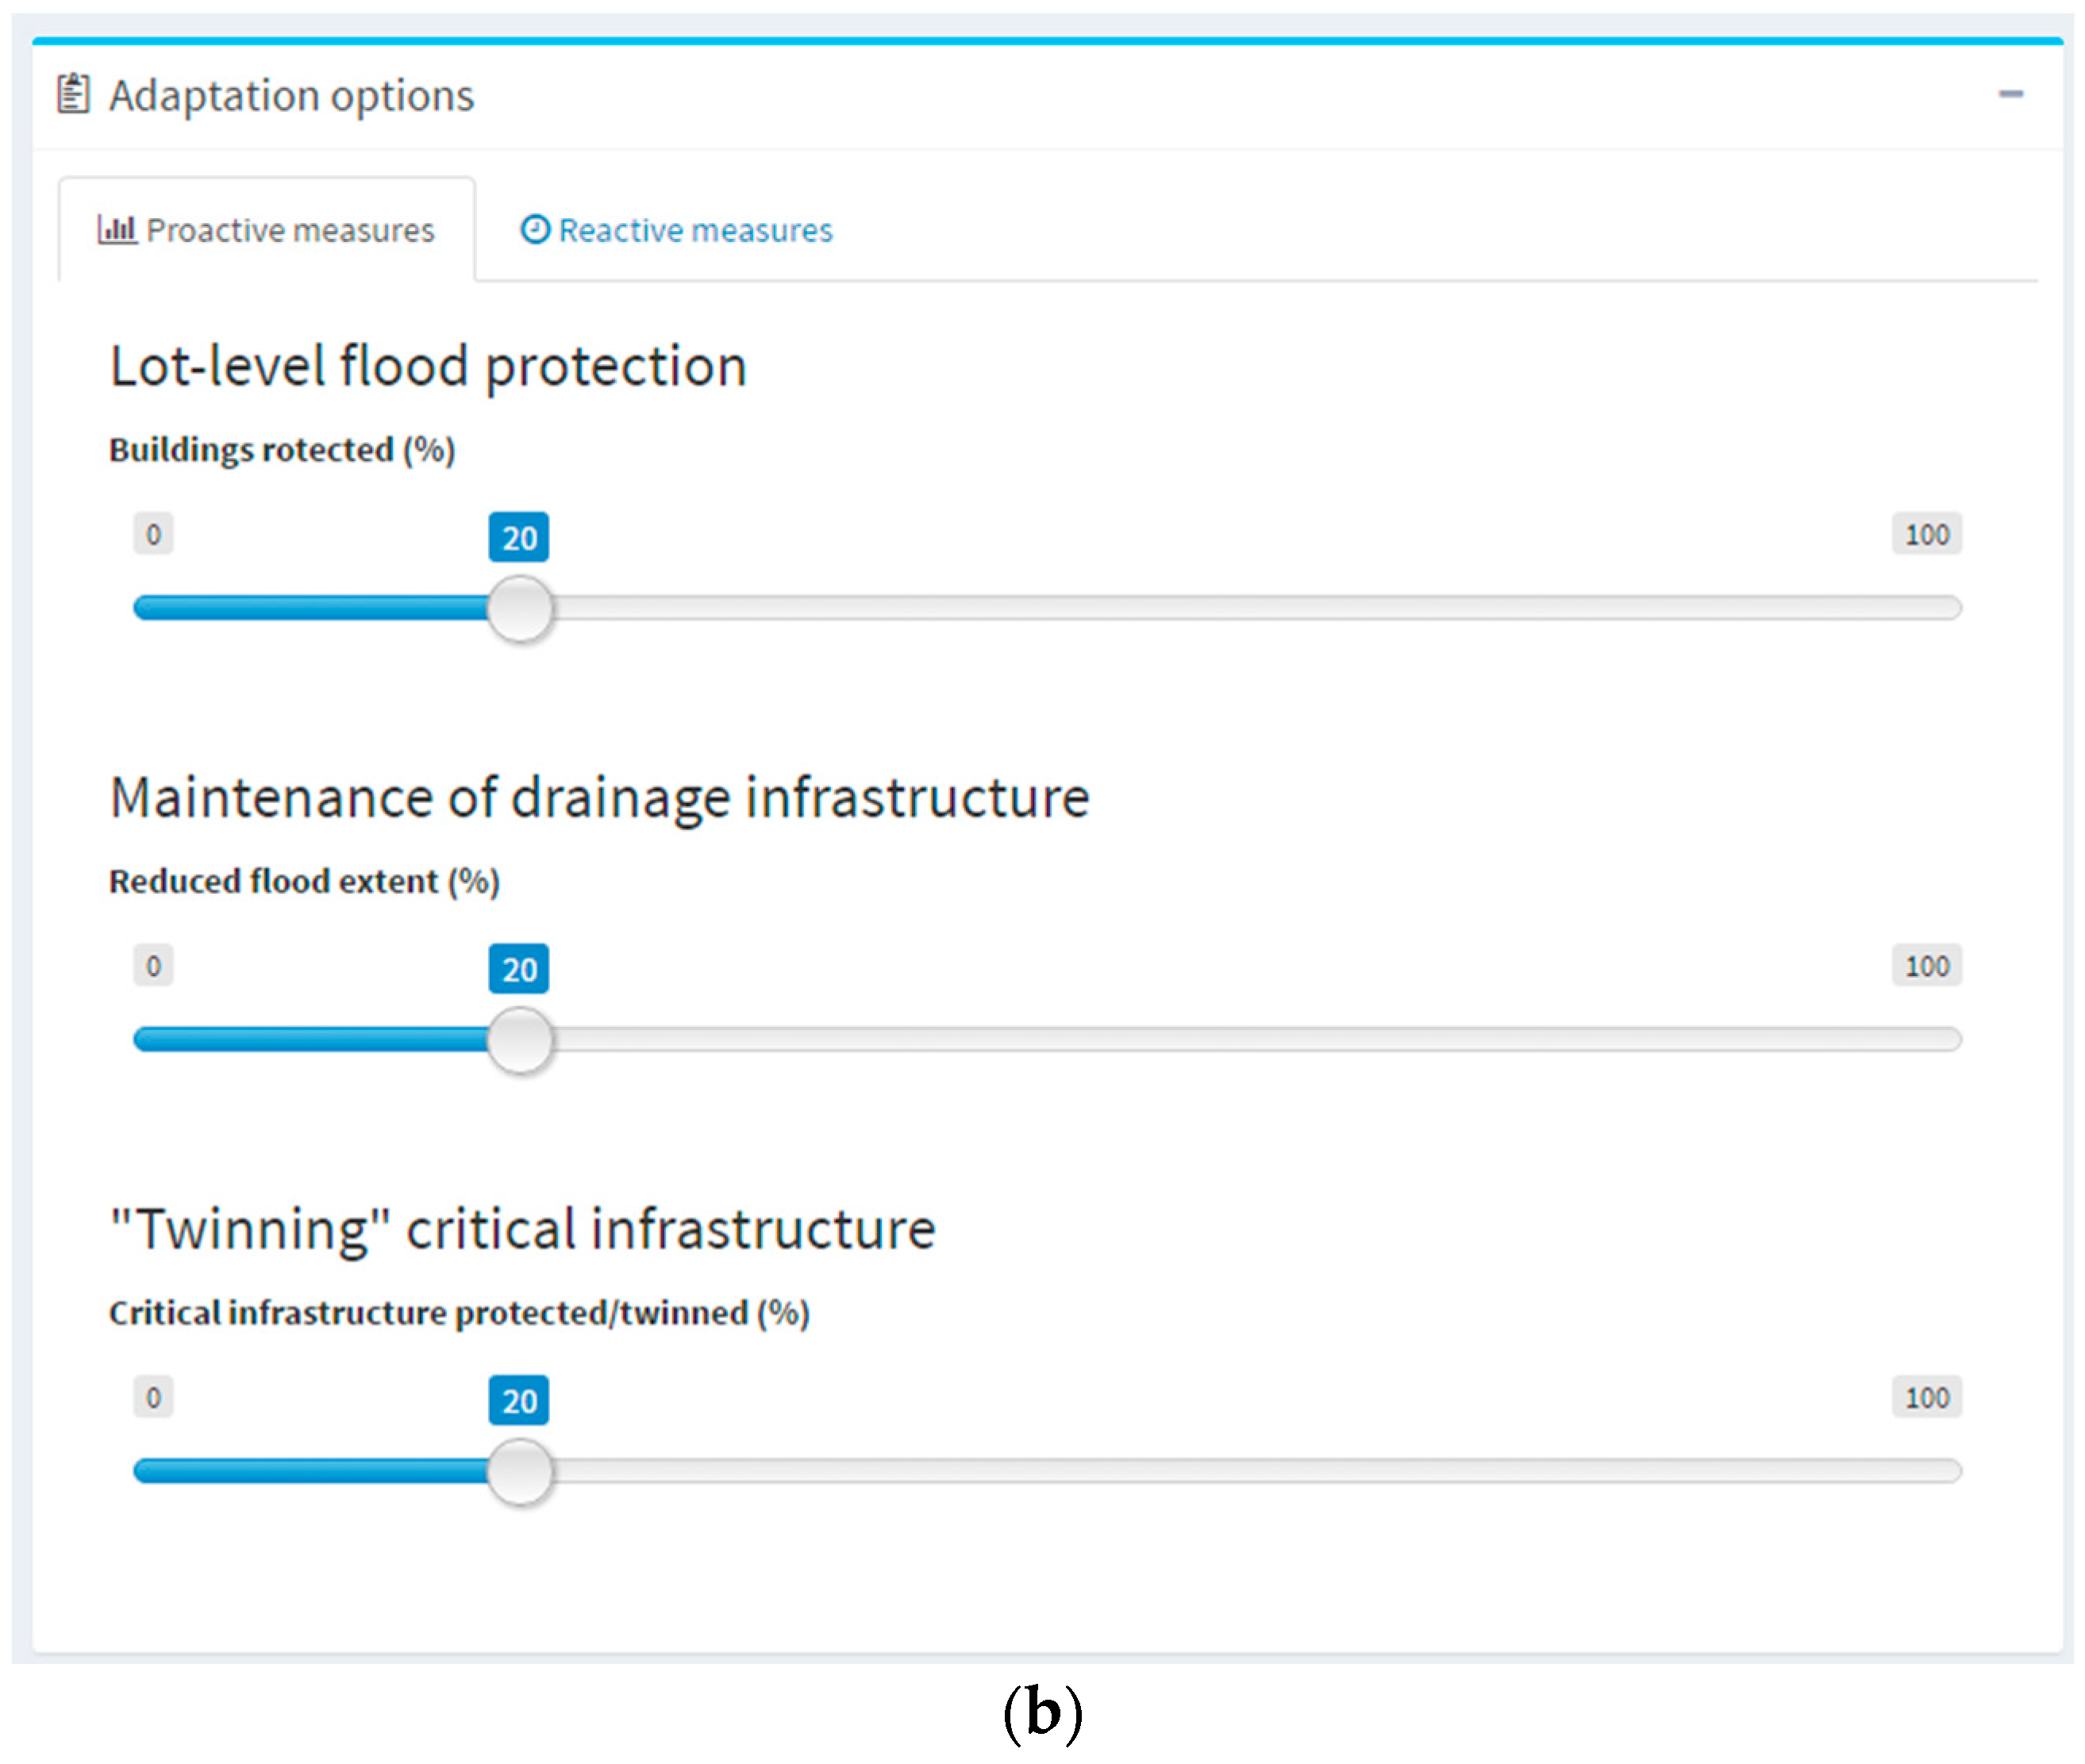
5.3. Adaptation Options

Integrating adaptive capacity into an urban system enhances the performance of its structures and functions. ResilSIM currently provides a sample list of adaptation options that are used to protect against hydro-meteorological events in London, Ontario and improve its systematic functions. They are listed in Table 2 and classified into two groups: (i) reactive adaptation measures that are implemented during the flooding event; and (ii) proactive adaptation measures that are integrated in advance of the flooding event.
Reactive measures of adaptive capacity are applied in response to a flood warning that has been issued by a regional authority. In the province of Ontario, local conservation authorities are responsible for operating flood forecasting models and providing flood alerts to municipalities located within their watershed. Flood forecasting tools use near real-time estimates of precipitation (from rain gauge or radar instruments) as input to hydrologic models to estimate surface water flows and subsequently, accumulated water elevations in drainage basins. Once municipalities are warned of an imminent flooding event, government officials from several groups including communications, fire, paramedic, police, public health and transportation services must be available to act in accordance with their local emergency response plan. Other municipal departments, namely those that are responsible for critical engineering infrastructure such as power, water supply, water treatment and solid waste management are often assigned responsibilities during the recovery phase of the flooding event that typically begins two days after the disaster has ceased [30].
ResilSIM may be employed once a flood alert has been issued in order to select the best reactive adaptation option. For example, if a 100-year flood is projected, predefined hazard maps representing a 100-year flood are used to simulate the hazard. Alternatively, ResilSIM can be used to select from the best proactive adaptation options for a variety of return periods and climate change scenarios.
An explanation of how each measure of adaptive capacity (that is programmed for application in London, Ontario) influences the resilience calculation is provided below:
a. Temporary dyking measures (e.g., earth berms and sand bags) are barriers that protect the structural integrity of buildings, critical facilities and engineering infrastructure from flood inundation, in addition to maintaining roads and access routes to these structures. The protection of structures improves the physical system performance measures related to the number of buildings, critical facilities and engineering infrastructure that are inundated; in addition to the socioeconomic system performance measures corresponding to the economic damages incurred as a result of structural failure. The protection of roads from flood inundation improves the physical system performance measure related to the length of road that is inundated; in addition to the socioeconomic system performance measures of the economic damages incurred as a result of service disruption and road repair.
b. Diversion of floodwater from vulnerable regions to open areas such as parks and stormwater management ponds is an adaptation option that reduces the magnitude of flood extent and inundation over a region. Since all physical socioeconomic measures of system performance are driven by the magnitude of flood extent and inundation, this adaptation option will have a significant effect on the resilience of the system.
c. The allocation of resources (monetary, technological, informational, and human resources) to attend to the flooding event increases the rate and magnitude of recovery of an urban system to a normal level of functioning. When more resources are assigned to a certain activity (e.g., deployment of personnel, equipment and financial support required for the construction of temporary dykes), the rate of improvement to the relevant impacts of system performance are higher and consequently, the system is more resilient. The ResilSIM tool applies different rates of recovery to the system performance measures depending on the proportion of resources that are made available. Alternatively, resources may be used to redesign and rebuild structures with a higher level or service, thereby improving the initial level of system performance.
d. Evacuation and relocation of people belonging to vulnerable socioeconomic groups (i.e., those without the resources required for independent evacuation) requires the establishment of reception centres such as schools and community halls to act as safe and protected shelters for the evacuees to be transported to and reside in during the flood. Evacuating and relocating people who are susceptible to flooding and who do not have the capacity or the resources required to evacuate to reception centres independently, improves the socioeconomic system performance measures counting the number of vulnerable people within the flooded portion of the spatial unit.
e. Lot-level flood protection measures are permanent and cannot necessarily be implemented on command, once a flood warning has been issued (e.g., backwater valves, downspout disconnection, lot re-grading, window sealing). By implementing lot-level flood protection measures, the physical system performance measures related to the number of buildings and critical facilities that are inundated by the flood will be improved; in addition to the socioeconomic system performance measures corresponding to the economic damages incurred as a result of structural failure caused by the flood.
f. Maintenance of drainage infrastructure (through the removal of debris) may be conducted to optimize drainage capacity, reducing the effective flood depth and extent. Municipalities may wish to implement annual programs where drainage infrastructure, particularly structures located in regions that are vulnerable to flooding, are maintained so they can operate at their full potential. This may be accomplished through the ResilSIM tool using fuzzy set theory; a fuzzy membership function is used to represent the level of infrastructure maintenance or alternatively, the proportion of designed infrastructure capacity that is available for conveying stormwater. All physical and socioeconomic system performance measures are driven by the magnitude of the flood extent; therefore, maximizing the capacity of the storm drainage infrastructure to divert more runoff from vulnerable regions can have a significant effect on the overall resilience of the urban system.
g. Twinning of critical infrastructure (water and power supplies) means that there is a backup or secondary source in the event that one infrastructure piece fails as a result of the hazard. It is an example of building redundancy into the urban system. By introducing a secondary piece of critical infrastructure that is outside of the floodplain (or region that is susceptible to flooding), there will be no loss in system performance with respect to the service it provides.

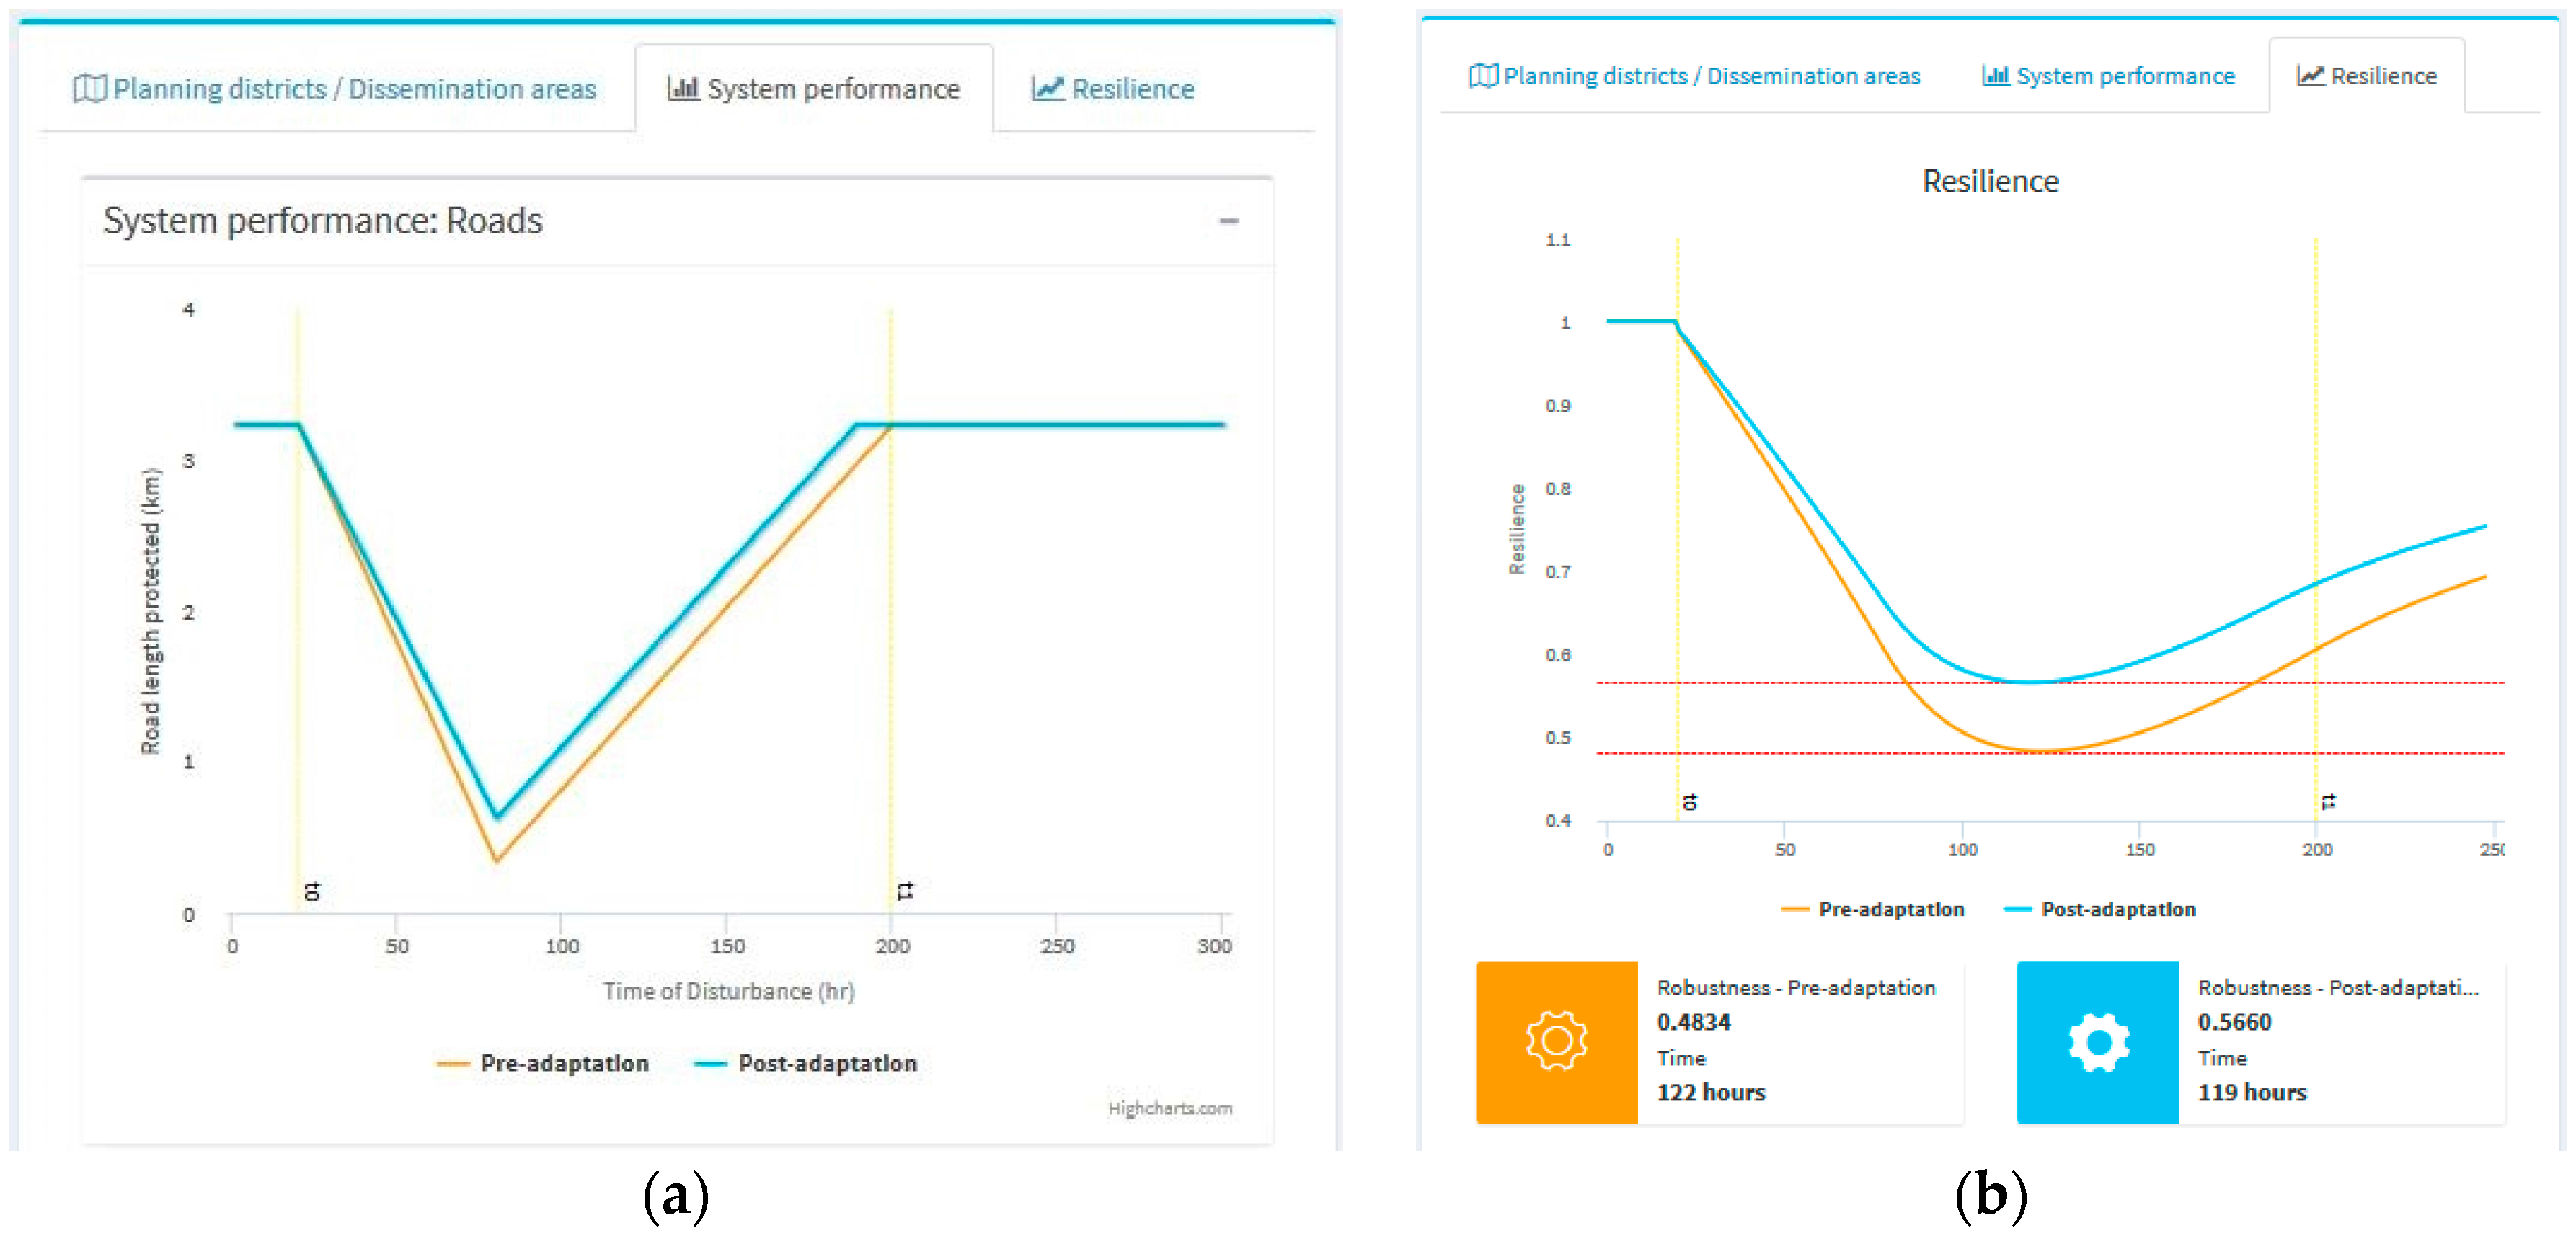
5.4. DSS Demonstration

The pilot model of ResilSIM has been developed for application in London and Toronto, Ontario. The initial screen presents the options for selection of the urban system in which the resilience analysis is performed (as shown in Figure 13). The user’s selection is remembered by the tool and it becomes the default option when the tool’s website is revisited by the same user. For this demonstration the user would select “London”.
In each urban system, the user is prompted to select a spatial unit or region in which system performance and resilience measures are calculated. For the City of London, the spatial units are Planning Districts (Neighbourhood Profiles) that divide the city into 42 administrative regions as presented in Figure 14. The user must also choose from a list of predefined hazard (flood inundation) maps (100-year flood lower and upper bound; 250-year flood lower and upper bound climate change scenarios).
After selecting the spatial unit and the hazard map, the tool calculates the system performance measures (Figure 15a) and the comprehensive resilience metric (Figure 15b) using the presented methodology.
The user’s selections of measures of adaptive capacity are controlled using a set of sliders that are presented in Figure 16. Each time the controls are adjusted by the user, the tool recalculates the system performance and resilience metrics and rapidly updates the graphs shown in Figure 15. This feature allows the user to quickly evaluate system performance in response to the various options for adaptation, with ease, and identify the most effective means of improving resilience in response to a hazardous event.

6. Conclusions

There is a new paradigm in disaster management that is known as Resilience: the capacity for an urban system to resist, function in, recover and transform from the impacts of a hazardous event as rapidly as possible [10,11]. This is achieved through the integration of measures of adaptive capacity.
This manuscript presents a decision support tool named ResilSIM that can estimate the resilience of an urban system to the negative consequences of a water-related natural disaster. It uses flood inundation maps to simulate the hazard and publicly accessible, spatial datasets to represent the physical and socioeconomic components of the urban system. Using spatial programming techniques, a resilience metric is computed as an amalgamation of system performance measures with respect to various impacts of the hazard. In a flooding event, for example, physical measures of system performance include the number of structures and length of road inundated by the flood. Socioeconomic measures of system performance include the economic damages attributed to structural damage and the loss of service. Other measures include the number of people belonging to socially and economically vulnerable groups who are residing in areas that are susceptible to flooding.
The initial value of resilience provides a basis for comparison. The user of the ResilSIM tool can subsequently implement different measures of adaptive capacity (protection measures, evacuation and relocation, allocation of resources, etc.). After these measures have been applied, the tool rapidly recalculates the resilience metric so that the user can easily evaluate different measures of adaptive capacity and identify the best, most cost effective option for implementation.
The current pilot model of ResilSIM is programmed for application in two urban systems including London and Toronto, Ontario, Canada. Both of these systems are most susceptible to flooding events (a resilience analysis of London, Ontario is used to demonstrate the ResilSIM tool in this manuscript). Although ResilSIM is currently only programmed for flooding applications, it may be applied to any type of natural or technological hazard (earth quake, hurricane, chemical spill, fire, explosion, etc.) provided that the hazard can be represented spatially, as a map.
ResilSIM uses resilience, a modern disaster management measure, to assist decision makers in selecting and prioritizing options for community upgrades. The methods and algorithms used in the structure of the tool are quite basic, however, they provide a foundation for other researchers to improve upon. It is recommended for researchers from all different backgrounds (economics, engineering, health, natural, political and social sciences) to collaborate and identify the most meaningful measures of urban system performance in response to a hazard. The outcomes of such analyses may be used to assign weights to the system performance measures in order to indicate their relative level of importance. They must also define measures of adaptive capacity that can make realistic and significant improvements to the resilience of the urban system for the relevant disaster. These extended analyses should take into consideration the datasets that are available in order for their results to be incorporated into tools, such as ResilSIM, that can be used to make informed, economically viable, socially responsible decisions regarding the incorporation of adaptive capacity to protect against the negative consequences of disasters.

Acknowledgments

The authors would like to acknowledge Natural Sciences and Engineering Research Council of Canada for the financial support provided for the research that is awarded to the second author, as well as the City of London for providing the spatial datasets.

Author Contributions

Slobodan P. Simonovic and Niru Nirupama conceived and designed the model. Andre Schardong developed the model. Sarah Irwin collected the data and wrote the paper.

Conflicts of Interest

The authors declare no conflict of interest.

References

  1. World Bank. Disaster Risk Management: Overview. Available online: http://www.worldbank.org/ (accessed on 1 December 2015).
  2. Intergovernmental Panel on Climate Change (IPCC). Summary for Policymakers. In Managing the Risks of Extreme Events and Disasters to Advance Climate Change Adaptation, Special Report of Working Groups I and II of the Intergovernmental Panel on Climate Change; Field, C.B., Barros, V., Stocker, T.F., Qin, D., Dokken, D.J., Ebi, K.L., Mastrandrea, M.D., Mach, K.J., Plattner, G.K., Allen, S.K., Eds.; Cambridge University Press: Cambridge, UK; New York, NY, USA, 2012; pp. 1–19. [Google Scholar]
  3. Intergovernmental Panel on Climate Change (IPCC). 2013: Summary for Policymakers. In The Physical Science Basis, Contributions to Working Group I to the Fifth Assessment Report of the Intergovernmental Panel on Climate Change; Cambridge University Press: Cambridge, UK; New York, NY, USA, 2013; Available online: https://www.ipcc.ch/pdf/assessment-report/ar5/wg1/WGIAR5_SPM_brochure_en.pdf (accessed on 29 August 2016).
  4. Irwin, S.; Sarwar, R.; King, L.; Simonovic, S.P. Assessment of Climatic Vulnerability in the Upper Thames River Basin: Downscaling with LARS-WG; Water Resources Research Report No. 081; Facility of Intelligent Decision Support, Department of Civil and Environmental Engineering: London, ON, Canada, 2012. [Google Scholar]
  5. Infrastructure Canada (INFC). Adapting Infrastructure to Climate Change in Canada’s Cities and Communities. 2006. Available online: http://ipcc-wg2.gov/njlite_download.php?id=6305 (accessed on 7 December 2013). [Google Scholar]
  6. Power, D.J. A Brief History of Decision Support Systems. Version 4.0. 10 March 2007. Available online: http://DSSResources.COM/history/dsshistory.html (accessed on 14 May 2016).
  7. Rolland, E.; Patterson, P.A.; Ward, K.; Dodin, B. Decision support for disaster management. Oper. Manag. Res. 2010, 3, 68–79. [Google Scholar] [CrossRef]
  8. Federal Emergency Management Agency (FEMA). Critical Facilities. Available online: http://www.fema.gov/critical-facility (accessed on 30 April 2016).
  9. Santos-Hernandez, J.; Rodriguez, H.; Diaz, W. Disaster Decision Support Tool (DDST): An Additional Step towards Community Resilience; Disaster Research Centre, University of Delaware Press: Newark, DE, USA, 2008. [Google Scholar]
  10. Simonovic, S.P.; Peck, A. Dynamic Resilience to Climate Change Caused Natural Disasters in Coastal Megacities Quantification Framework. Br. J. Environ. Clim. Chang. 2013, 3, 378–401. [Google Scholar] [CrossRef]
  11. Simonovic, S.P. From risk management to quantitative disaster resilience: A paradigm shift. Int. J. Saf. Secur. Eng. 2016, 6, 85–95. [Google Scholar]
  12. Simonovic, S.P.; Arunkumar, R. Quantification of resilience to water scarcity, a dynamic measure in time and space. In Proceedings of the 7th International Water Resources Management Conference of IAHS ICWRS, Bochum, Germany, 18–20 May 2016; Volume 373, pp. 13–17.
  13. Kong, J.; Simonovic, S.P. An original model of infrastructure system resilience. In Proceedings of the CSCE Annual Meeting: Resilient Infrastructure, London, ON, Canada, 1–4 June 2016.
  14. Bruneau, M.; Chang, S.E.; Eguchi, R.T.; Lee, G.C.; O’Rourke, T.D.; Reinhorn, A.M.; Shinozuka, M.; Tierney, K.; Wallace, W.A.; von Winterfeldt, D. A Framework to Quantitatively Assess and Enhance the Seismic Resilience of Communities. Earthq. Spectra 2003, 19, 733–752. [Google Scholar] [CrossRef]
  15. Folke, C. Resilience: The emergence of a perspective for social-ecological systems analysis. Glob. Environ. Chang. 2006, 16, 253–267. [Google Scholar] [CrossRef]
  16. Holling, C.S. Resilience and stability of ecological systems. Annu. Rev. Ecol. Syst. 1973, 4, 1–23. [Google Scholar] [CrossRef]
  17. Pimm, S.L. The Balance of Nature? Ecological Issues in the Conservation of Species and Communities; University of Chicago Press: Chicago, IL, USA, 1991. [Google Scholar]
  18. World Commission on Environment and Development (WCED). Our Common Future; Oxford University Press: Oxford, UK, 1987. [Google Scholar]
  19. Brown, K. Global environmental change I: A social turn for resilience? Prog. Hum. Geogr. 2014, 38, 107–117. [Google Scholar] [CrossRef] [Green Version]
  20. Chang, S.E.; Shinozuka, M. Measuring improvements in the disaster resilience of communities. Earthq. Spectra 2004, 20, 739–755. [Google Scholar] [CrossRef]
  21. Cutter, S.L.; Barnes, L.; Berry, M.; Burton, C.; Evans, E.; Tate, E. A place-based model for understanding community resilience to natural disasters. Glob. Environ. Chang. 2008, 18, 598–606. [Google Scholar] [CrossRef]
  22. Sredojevic, D.; Simonovic, S.P. City of London: Vulnerability of Infrastructure to Climate Change. Background Report #2: Hydraulic Modeling and Floodplain Mapping; Water Resources Research Report No. 069; Facility of Intelligent Decision Support, Department of Civil and Environmental Engineering: London, ON, Canada, 2009. [Google Scholar]
  23. Peck, A.; Bowering, E.; Simonovic, S.P. City of London: Vulnerability of Infrastructure to Climate Change Final Report; Water Resources Research Report No. 074; Facility for Intelligent Decision Support, Department of Civil and Environmental Engineering: London, ON, Canada, 2011. [Google Scholar]
  24. Peck, A.; Simonovic, S.P. Coastal Cities at Risk (CCaR): Generic System Dynamics Simulation Models for Use with City Resilience Simulator Final Report; Water Resources Research Report No. 083; Facility for Intelligent Decision Support, Department of Civil and Environmental Engineering: London, ON, Canada, 2013. [Google Scholar]
  25. Armenakis, C.; Nirupama, N. Estimating spatial disaster risk in urban environments. Geomat. Nat. Hazards Risk 2013, 4, 289–298. [Google Scholar] [CrossRef]
  26. Mijalkovic, S.; Cvetkovic, V. Vulnerability of Critical Infrastructure by Natural Disasters; The Academy of Criminalistic and Police Studies: Belgrade, Serbia, 2010. [Google Scholar]
  27. Prodanovic, P.; Simonovic, S.P. Development of Rainfall Intensity Duration Frequency Curves for the City of London under the Change Climate; Water Resources Report No. 058; Facility for Intelligent Decision Support, Department of Civil and Environmental Engineering: London, ON, Canada, 2007. [Google Scholar]
  28. Upper Thames River Conservation Authority. Flooding on the Thames River. Available online: http://thamesriver.on.ca/water-management/flooding-on-the-thames-river/ (accessed on 28 August 2016).
  29. Water’s Edge Environmental Solutions Team Ltd. Flood Damage Estimation Guide 2007 Update and Software Guide; Ministry of Natural Resources: Peterborough, ON, Canada, 2007.
  30. City of Toronto. Wet Weather Flow Management Guidelines. Available online: http://www1.toronto.ca/wps/portal/ (accessed on 1 December 2015).
Figure 1. Sample of flood inundation within the ResilSIM tool.
Water 08 00377 g001
Figure 2. Sample of a dynamic measure of system performance.
Water 08 00377 g002
Figure 3. Sample of a static performance measure—Option 1.
Water 08 00377 g003
Figure 4. Sample of static performance measure—Option 2.
Water 08 00377 g004
Figure 5. Various responses of system performance to a disturbance (partial recovery, recovery to pre-hazard system performance, and strengthening of system performance) (adapted from Peck et al. [24]).
Water 08 00377 g005
Figure 6. Resilience curve corresponding to a dynamic system performance curve.
Water 08 00377 g006
Figure 7. Resilience curve corresponding to a static system performance measure—Option 1.
Water 08 00377 g007
Figure 8. Resilience curve corresponding to a static performance measure—Option 2.
Water 08 00377 g008
Figure 9. (a) Impact of a proactive adaptation option on the value of resilience; and (b) the impact of reactive adaptation option on the value of resilience.
Water 08 00377 g009
Figure 10. The ResilSIM tool user interface: the interactive map with spatial unit selection (a); and measures of adaptive capacity with interactive control sliders (b).
Water 08 00377 g010
Figure 11. Map of the Upper Thames River Watershed (http://thamesriver.on.ca/, accessed on January 2016).
Water 08 00377 g011
Figure 12. Map of the extent of projected flood inundation of the Thames River (north) and Dingman Creek (south) within the municipal boundary of the City of London [22].
Water 08 00377 g012
Figure 13. Selection of the urban system (London or Toronto, Ontario, Canada).
Water 08 00377 g013
Figure 14. Planning District and flood inundation map selection for the city of London.
Water 08 00377 g014
Figure 15. System performance graphs for each sector; (a) interactive resilience graph (green line); and (b) resilience combining real time and pro-active adaptation measures (orange line).
Water 08 00377 g015
Figure 16. Interactive adaptation measures options: (a) reactive measures; and (b) pro-active measures.
Water 08 00377 g016aWater 08 00377 g016b
Table 1. Summary of data used in the development of ResilSIM.
DatasetFormatSource
BUILDINGS (land use)
Commercialshape-fileMPAC, City of London
Industrialshape-fileMPAC, City of London
Residentialshape-fileMPAC, City of London
CRITICAL FACILITIES (description)
Ambulance Stationshape-fileMPAC, City of London
Fire Hallshape-fileMPAC, City of London
Hospital, private or publicshape-fileMPAC, City of London
Police Stationshape-fileMPAC, City of London
School (elementary or secondary, including private)shape-fileMPAC, City of London
ENGINEERING INFRASTRUCTURE
Domestic waste facilitiesshape-fileCanVec+
Gas and oil facilitiesshape-fileCanVec+
Industrial solid waste facilitiesshape-fileCanVec+
Pipelineshape-fileCanVec+
Pipeline (sewage/liquid waste)shape-fileCanVec+
Power transmission lineshape-fileCanVec+
Railwayshape-fileCanVec+
Road segmentsshape-fileCanVec+
Transmission stations/linesshape-fileCanVec+
VULNERABLE SOCIAL GROUPS
Unemployed personsshape, csv-fileStatsCan
Families w/ annual income <$50,000shape, csv-fileStatsCan
Age (<6; >65)shape, csv-fileStatsCan
Single (divorced/widowed)shape, csv-fileStatsCan
Single Parentshape, csv-fileStatsCan
Migrantsshape, csv-fileStatsCan
Allophoneshape, csv-fileStatsCan
Immigrantsshape, csv-fileStatsCan
Visible Minoritiesshape, csv-fileStatsCan
Persons w/o highschool educationshape, csv-fileStatsCan
Table 2. Adaptation options available on ResilSIM.
CategoryAdaptation Option
Reactivea. Implementation of temporary dyking measures (e.g., sand bags) to maintain roads and access routes to buildings and critical facilities.
b. Pumping out of flooded area—divert floodwater to adjacent open areas such as parks.
c. Allocation of resources (monetary, technological, informational, and human resources) to relocate vulnerable people; protect, restore and rebuild vulnerable infrastructure.
d. Evacuation and relocation of people belonging to vulnerable social and economic groups.
Proactivee. Implementation of lot-level flood protection measures to prevent floodwater from entering buildings, thereby maintaining structural function.
f. Maintenance of drainage infrastructure (through the removal of debris) in order to optimize drainage capacity and reduce the effective flood depth.
g. Twinning of critical infrastructure (water and power supplies) such that if one infrastructure piece fails in the event of a hazard, there is a secondary source.

