Article

Causes of Domestic Water Consumption Trends in the City of Alicante: Exploring the Links between the Housing Bubble, the Types of Housing and the Socio-Economic Factors

by
Álvaro-Francisco Morote
1,*,
María Hernández
2 and
Antonio-Manuel Rico
1
1
Interuniversity Institute of Geography, University of Alicante, Carretera de Sant Vicent del Raspeig, s/n—Apartado de Correos 99, Alicante 03080, Spain
2
Department of Regional Geographic Analysis and Physical Geography, University of Alicante, Carretera de Sant Vicent del Raspeig, s/n—Apartado de Correos 99, Alicante 03080, Spain
*
Author to whom correspondence should be addressed.
Water 2016, 8(9), 374; https://doi.org/10.3390/w8090374
Submission received: 15 May 2016 / Revised: 22 August 2016 / Accepted: 24 August 2016 / Published: 31 August 2016
(This article belongs to the Special Issue Sustainable Water Consumption)

Abstract

:
The European Mediterranean coastline has experienced major tourism-related urbanization since 1960. This is a dynamic that has led to increased spending on water consumption for urban and tourism-related uses. The objective of this paper is to define and to analyze how domestic water consumption in the city of Alicante evolved between 2000 and 2013. Real billing figures for individual households were analyzed according to the type of housing and the income level of the occupants. The conclusions drawn show that consumption fell over the period studied, and that there are different patterns in water expenditure depending on the type of housing and the inhabitants.

1. Introduction

The notable increase in water consumption for urban and tourism-related uses on the European Mediterranean coast mainly began in the 1960s and 1970s, reaching its highest peaks in the late 1990s and early 2000s [1]. This rise in water consumption can be explained by the increase in homes and population numbers recorded for this coastal region, which is linked to the growth of tourism, as well as residential and service activities [2,3]. To a great extent, the increase in the urban and residential surface area is based on expansive urbanization and the creation of new urban spaces, such as gardens and swimming pools [4,5]. This process is typical of the majority of the Mediterranean coastline in France, Italy [6], and Spain, including the Balearic Islands [7] and the Costa del Sol [8]. Low-density urbanization has also spread into other areas, such as Florida (USA) [9] and Australia [10].
Different types of urbanization are linked to residential activities, and they are based on the building, sale, rental, and the fitting-out of second homes, all of which have been characteristic of the Spanish Mediterranean coastline since the property bubble burst in 2007–2008 [11,12]. In contrast to the concentrated, high-rise model typified by the building of apartment blocks, residential expansion has primarily been based on the spread of new urban residential low-density types of models (single-family homes with a pool and garden) [13], medium-density (semi-detached houses), and high-rise buildings (apartments), both largely integrated into private developments with a shared garden and a pool [14]. Between 1992 and 2000, a total of 1.2 million homes were built on the Spanish Mediterranean coast, with 5 million more built between 2001 and 2011, an increase of 25% [15]. A total of 345,410 new homes were built in the province of Alicante (where the study area is located) between 1997 and 2008, behind only Madrid and Barcelona, and higher than provinces with greater demographic weight, such as Valencia and Malaga [13]. The drop in the pace of construction in Spain has been so marked that between 2009 and 2014 only 1,039,035 homes were built in the country as a whole. With regard to the province of Alicante, only 12,128 new homes were built after the start of the economic crisis [16]. The fall in sales and purchases of homes is reflected in the housing stock figures, which in Spain in 2014 amounted to 439,617 homes, and 29,480 for Alicante (6.7% of the national figure) [17].
Studies conducted in various countries in northern and central Europe [18,19], California (USA) [20], and Mediterranean Europe [21,22,23] show certain differences in their distribution that are linked to social, economic, sociological, and environmental factors. The study carried out by Domene and Saurí [24] in the Metropolitan Area of Barcelona (Spain) showed that internal water use in apartment blocks equated more or less to the following uses: toilets and taps (basin) were a main domestic usage, at 29%–34%, followed in second place (although sometimes in first place) by personal hygiene (bath and shower) at 22%–34%, and with slightly lower percentages for laundry (14%–17%) and washing dishes (6%–12%), which were in third and fourth places, followed by drinking water and food preparation (5%–10%), and other uses (3%–5%). In addition to these, there are also external forms of water use, which vary greatly depending on the type of housing (semi-detached homes with shared gardens and pools, or single-family houses) and the predominant type of garden (Atlantic or Mediterranean), as well as uses included in the concept of others, which would entail leakages, among other elements. A garden is an urban environment that is of great interest to the scientific community, as the presence of green areas stands for a considerable increase in water consumption [25,26,27]. In Australia, for example, Hurd [28] concluded that watering the garden accounted for more than 50% of the total amount of water used in the home. In Spain, the presence of elements outside the home and their repercussion on water usage is also reported, as indicated in studies carried out in the Metropolitan Area of Barcelona [24], Girona [29], and on the coastline of Alicante [14,30,31].
In the last decade, a mistaken perception was commonly held that an increase in the number of homes should be associated with a rise in water consumption, when in fact it led to a drop in the water consumption of most large urban agglomerations in developed countries [32,33]. The drop in domestic water usage from the mid and late 1990s is a general dynamic affecting most European countries. In Germany, for example, consumption levels between 1994 and 2004 dropped by 13%, reaching an average daily consumption per inhabitant of 126 L [18]. Higher amounts have been reported in Denmark, where the drop between 1989 and 2008 reached 22% [19]. According to the latest survey on the Supply and Treatment of Water in Spain, average water consumption in Spanish homes in 2005 was 255 L/inhabitant/day, 23% less than in 2012, at 198 L/inhabitant/day [34]. In the Region of Valencia (Spain), where the province of Alicante is located, in 2012 water consumption per inhabitant/day was 202 L, a fall of 16% compared to 2005. For other Spanish cities, for example, water consumption is 133 L/inhabitant/day in Madrid, 116 L/inhabitant/day in Barcelona, and 119 L/household/day in Valencia. In contrast, these levels are much higher in other cities around the world, such as Jerusalem (650 L/inhabitant/day), Sydney (206 L/inhabitant/day), or London with 154 L/inhabitant/day [35]. This trend can be explained by the combination of diverse factors, which include greater citizen awareness with regard to saving water, episodes of drought that translate into lower usage levels, social and demographic changes, higher water prices, more efficient technologies used in taps, toilets, showers, and kitchen appliances, the effects of the 2007/2008 financial crisis, and the processes of restructuring urban economies over the domestic, industrial, and commercial use of water [36]. In this respect, a study by Deoreo and Mayer [37] in the USA on interior uses in single-family homes concluded that water consumption had fallen since 1995 and that, furthermore, the trend was expected to continue as new technologies for saving water came on to the market. It also showed that one element to take into account was the economic recession that began in 2007/2008, which had contributed to the aforesaid drop in water use.
Exploring the determinants of water consumption requires consideration of the effects of tariffs and income, but also of many other factors, such as weather conditions, geographical or population characteristics, and household features [23]. Beyond the traditional variables analyzed in the literature (e.g., weather, geographical location, household features), scant attention has been dedicated to variables, such as water utilities ownership, that could affect household water consumption [38]. Further research is needed on the role of utility ownership because it remains unclear whether changes in governance toward a larger presence of non-public actors have by themselves led to improved water-conservation practices and, therefore, to reductions in water consumption [32]. This lack of clarity is due to the fact that reductions in water consumption seem to affect cities with different systems of water ownership and management [23].
In Alicante, the political ecological process that has radically transformed the country’s water environments follows the classic modernization path: from the dams and reservoirs that allowed the expansion of irrigation and hydroelectricity in the 1940s and 1950s to the inter-basin water transfers that added water flows for urban and mass tourist growth in the Mediterranean areas of the 1960s and 1970s. After this period, the most recent development is the construction of desalination plants responding to the new water demands linked to an increase of outdoor water use, associated with the real estate bubble of the 1990s and 2000s [39]. It is during this last period that the expansion of new urban environments (gardens and pools) must be placed as perhaps the most recent beacon of urban modernity in the country. However, the collapse of the real estate market from 2007/2008 onwards and recurring climatic hazards such as droughts combine to check water-based urban growth in such a way that threatens the very fabric of urban modernity. Besides, Alicante is one of the fastest growing regions of Southern Europe in terms of residential tourism and also one area subject to periodic water crises due to the combination of recurrent droughts and expanding agricultural, urban, and tourist water demand.
This paper aims to contribute to increase the knowledge about water consumption trends in urban areas and their causes by focusing on the case of Alicante, on the Southeastern Mediterranean coast, and one of the Spanish cities where the development and the implementation of new water technologies is more intense. In this sense, according to the World Bank, in 1953 Alicante became the first international example of a successful water company of mixed (public and private) capital under the name of Aguas de Alicante. Tourist activity, and particularly residential tourism, has led to a change in the urban and demographic model of towns along the European Mediterranean coastline. The city of Alicante is a clear example of this. The climatic characteristics make it one of the most arid places in Spain, the common episodes of droughts [40] and the recent decrease in water consumption [41] explain the interest in this case study. This significance is accentuated by the fact that there are very few studies that analyze the relationships between water consumption trends and their causes in the study area.
The objectives of this research are: (a) to analyze and characterize the trend in domestic water usage in the city of Alicante; (b) to identify the factors affecting the current water consumption trend; and (c) to determine relationships between water consumption and the types of housing, the districts, and the socio-economic factors of householders.
This paper is organized in the following way. After the introduction, the study area and methodology are presented, followed by the results section, which discusses the work methods used in the research, together with the water consumption trends in the city of Alicante. The focus is then narrowed down to analyze the trend in water usage in the city of Alicante, by dividing household consumption figures according to the type of housing and the income level. Finally, the discussions and conclusions sections set out the reasons behind the water consumption levels in different homes in the study area.

2. Study Area and Methodology

Tourist activity, and particularly residential tourism, has led to a change in the urban and demographic model of towns along the European Mediterranean coastline [5]. The province of Alicante, and more specifically its coastline, is a clear example of this. The climatic characteristics make it one of the most arid areas in Spain [42], with an average rainfall of 356 mm/year in the city of Alicante [40]. The avid implementation of expansive housing types since 1960, the predominance of a foreign population from central and northern Europe, which in some of the province’s coastal towns can account for 70% of the total municipal population [43], and the income levels [44] explain the interest in this particular area. The varied economic dynamics accentuate the complexity of the various factors that affect urban demand. The make-up of the city and its varied housing types explain the reason why Alicante was chosen. According to the latest census (2011), the city of Alicante has 329,325 inhabitants (17.02% of the total for the province), and 186,516 households (14.03% of the total for the province).
Consumption trends for the city of Alicante as a whole were identified for the period between 2000 and 2013. A local scale analysis provides for an in-depth study of the relationships that are established between the uses and the levels of income according to the neighborhood and the type of housing. These periods were chosen due to the interest in analyzing the recent evolution of urban usage levels in an area, which in that period, recorded a major increase in urbanized surface area and a spread of expansive housing types, followed by a significant collapse in the urbanizing process. The increase in urbanized surface areas and the types of housing highlight the relationships that exist between both factors and water demand.
The information used in this research was provided by the company Aguas Municipalizadas de Alicante, Empresa Mixta (AMAEM). It analyzed domestic water consumption according to urban typology, because this consumption is different due to the kind of urban model, the presence of urban nature, and socio-economic factors. Four urban typologies have been distinguished:
  • Urban core: compacted houses without outdoor elements
  • Blocks of apartments: houses with a garden and a pool in a condominium
  • Semi-detached houses: houses with a small single-family garden with a garden and a swimming pool in a condominium
  • Detached houses: houses with a single-family garden and a swimming pool
Using real consumption data for homes (2007–2013) divided into each housing type (urban core, apartment blocks, semi-detached and detached houses) in Alicante is an innovative element in the methodology used to analyze usage trends. Unlike studies based on estimates from different national bodies (INE) or results from interviews [45,46], in this study actual empirical data were analyzed, thus enabling a more detailed study to be carried out on the relationships that exist between the types of housing and the socio-economic characteristics of their inhabitants, and of other situational and structural factors that affect the usage of urban water. Due to the difficulty and complexity in accessing real data on water consumption in Spain, this research represents significant progress in the knowledge of water consumption behavior in this part of Mediterranean Europe, as it is based on real supply and billing data, and not on estimates of demand.
In the city of Alicante, consumption units were identified and selected by means of field work carried out to verify the different housing types that were predominant in each neighborhood. Once these housing types were identified, they were subdivided according to the income levels. To obtain this information, the socio-economic study of the city of Alicante [47] was consulted, where the districts are broken down by economic income. Four income thresholds were established: low, lower-middle, middle, and high income, with respective limits of 25,000 €, 50,000 €, 100,000 €, and more than 100,000 €/year. Moreover these districts were analyzed taking into account the inhabitants ratio per house and the average age of the people in these houses according to the data provided by the Council of Alicante.
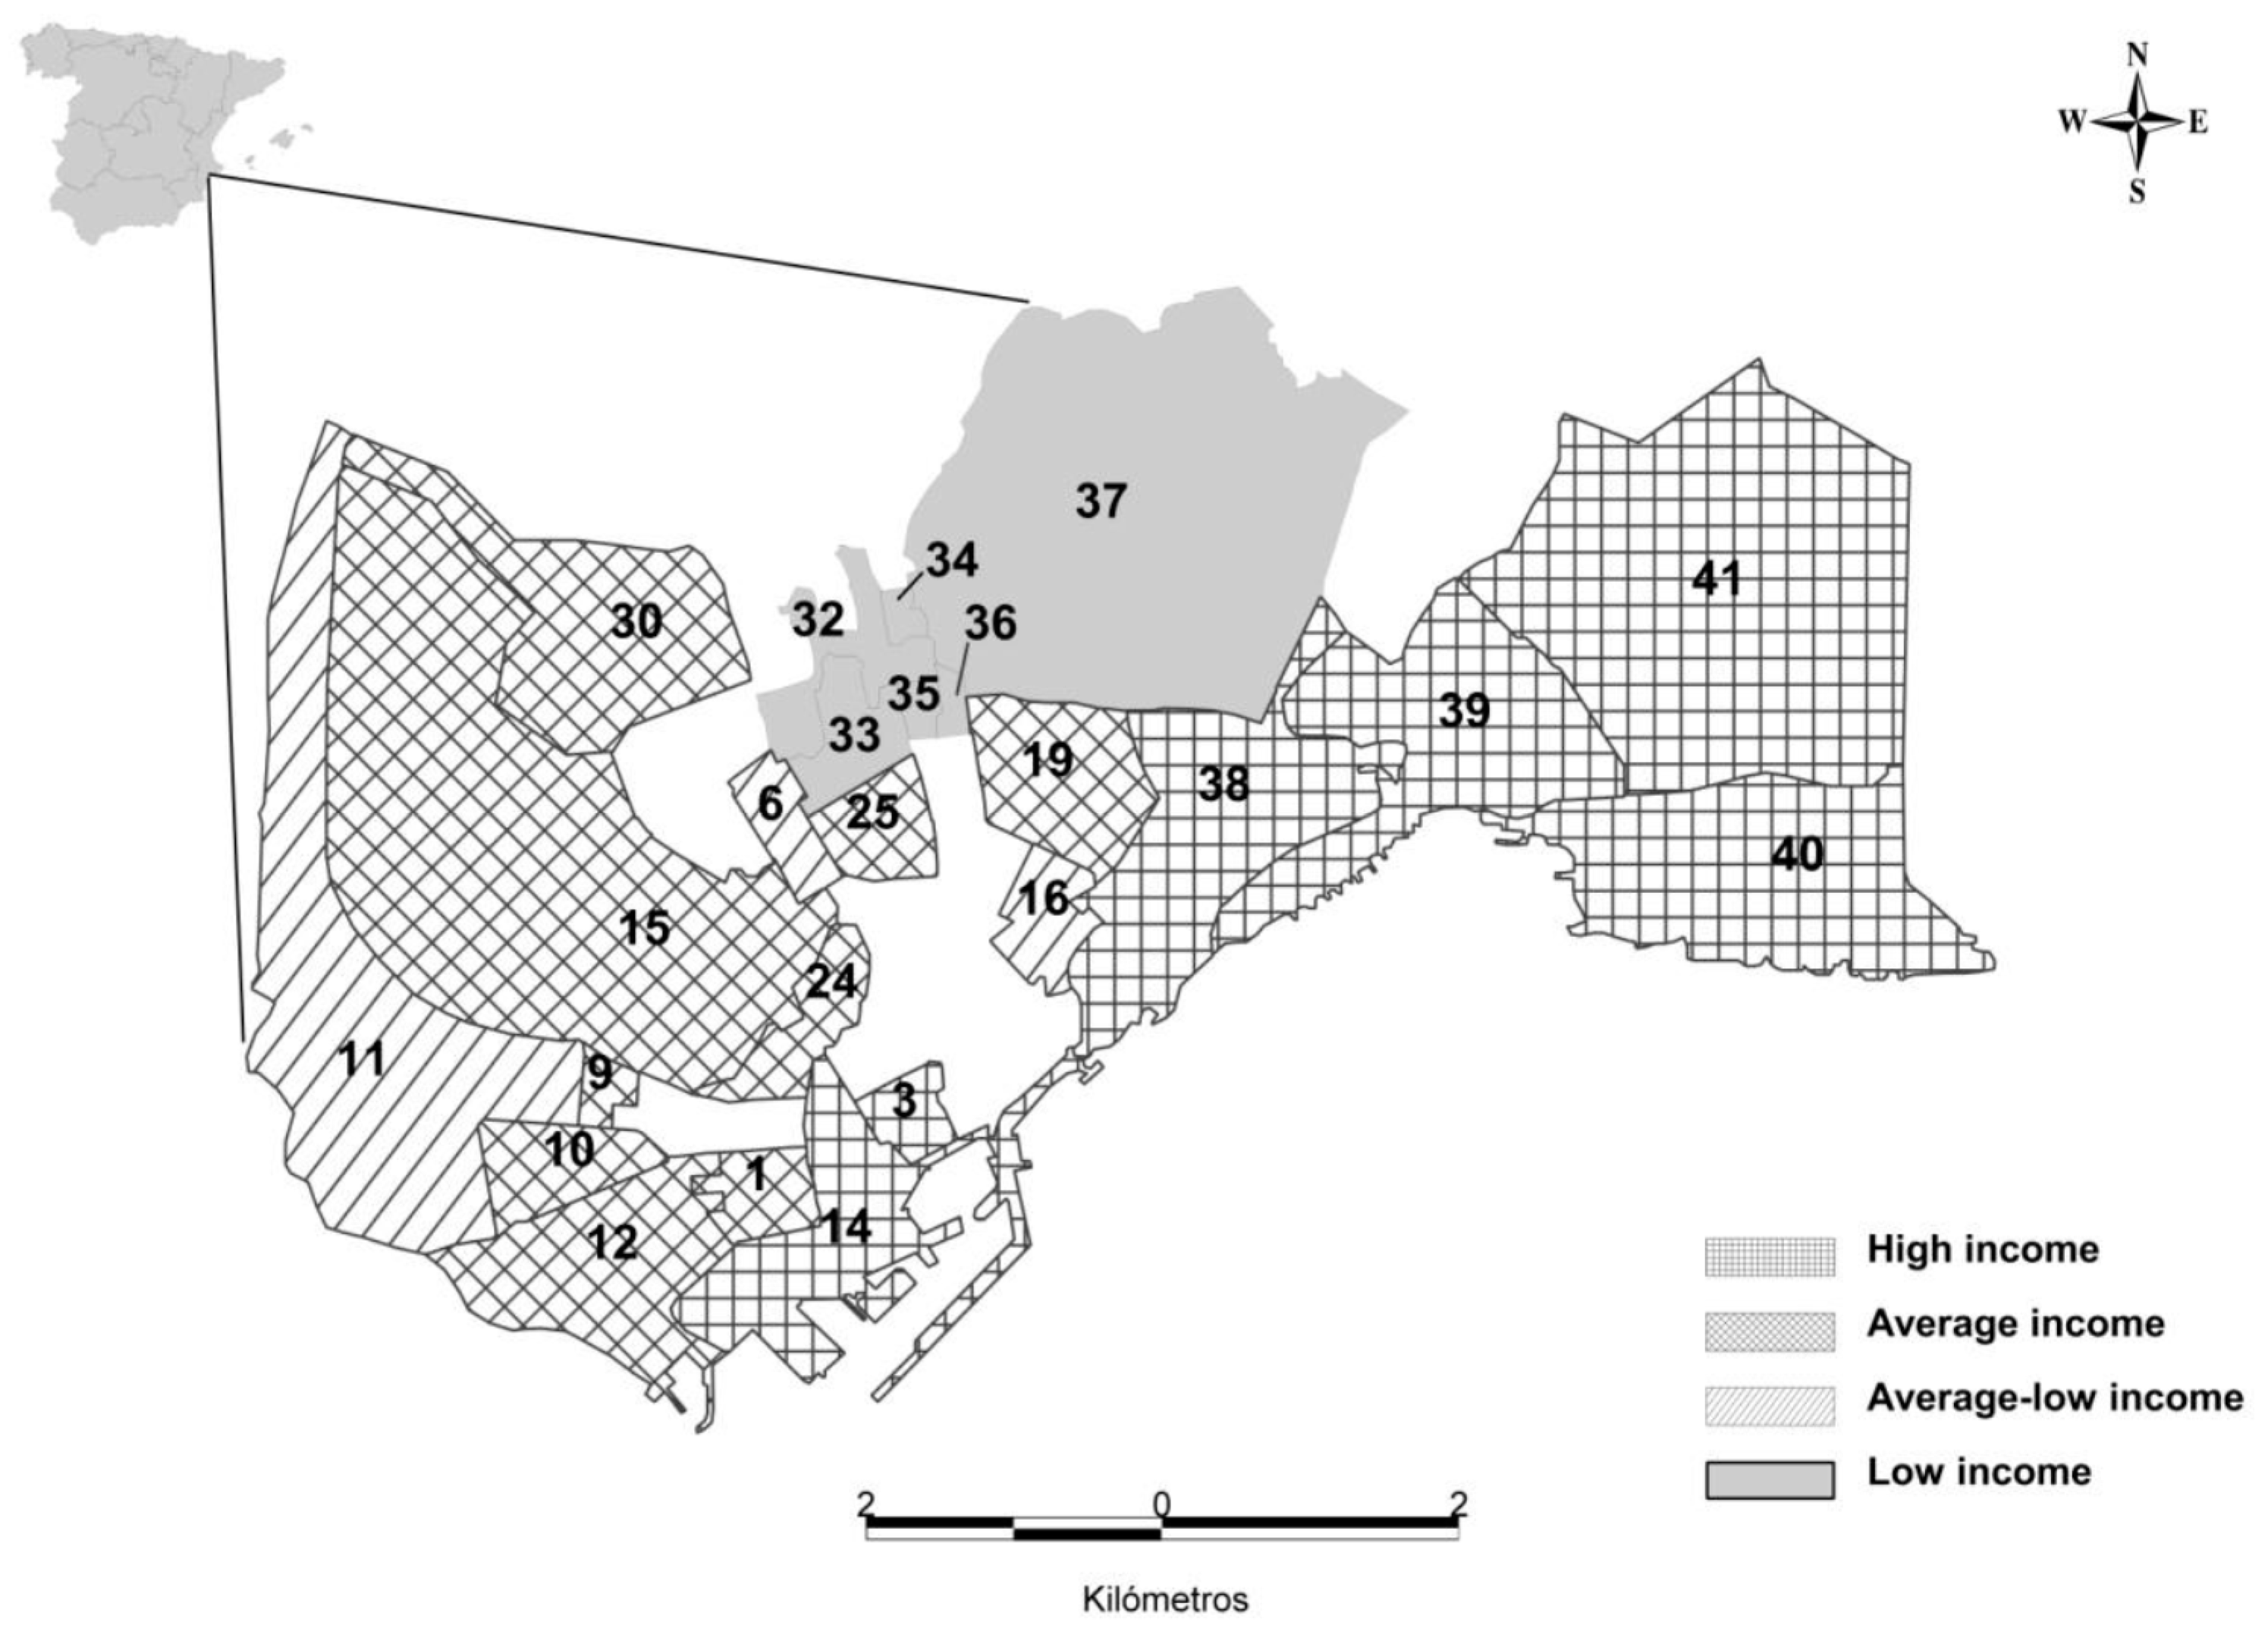
According to these three factors, 2800 real billing figures (households) were compiled from among the city’s 41 districts (Figure 1). Previously, the water company had provided 11,480 real bills, although 8680 bills were rejected because they did not have any representatives due to the changes in owners, the existence of tenants renting houses, etc. In this regard, the technicians of the company selected correct bills for this study. From these districts, housing types were identified and they were differentiated by socio-economic features and differences in income levels in the same housing type (Table 1). The make-up of the population and the housing types means that water consumption can be studied in terms of these urban and socio-economic differences. The choice of analysis units was based on the representation of housing types and different income levels.

3. Results

3.1. Evolution of Domestic Water Consumption in the City of Alicante

As stated in the Introduction, the drop in consumption levels of drinking water is a dynamic process that is widespread across developed countries. In the city of Alicante, annual amounts supplied to the network and the volumes billed reveal similar results to the consumption levels in other towns supplied by the Aquadom group, in the areas of Vinalopó and l’Alacantí [36]. These figures confirm that over the past three decades there has been a series of stages of growth and contraction in water expenditure, which can be correlated to variables of demographics, urban tourist expansion, social and economic dynamism, and the water-saving campaigns triggered off during situations of drought. Therefore, and taking these consumption levels into account, the following stages can be identified: (a) an appreciable and sustained increase in consumption from 1984 to 1991; (b) a notable fall in water expenditure from 1992 to 1996; (c) a recovery in consumption from 1997 to 2004; and (d) a strong fall in water expenditure from 2005 to 2013.
These trends are reproduced in the available series of total volumes of billed water. In contrast, these trends no longer correlate identically with how domestic use has evolved when analyzing the detail of modules in L/inhabitant/day, L/household/day, and L/paid-for/day. In this case, all these models tend to follow a structural trend of sustained reduction, from the end of the 1990s up to the present day, although this evolution has accelerated since 2003. Figure 2 shows how domestic water consumption and the number of water contracts in Alicante evolved between 2000 and 2013, i.e., without taking into account water for other uses, such as in industry. An increase in water consumption up to 2004 can be observed (16,939,819 m3), and it is from 2004 when the trend is significantly reversed. By 2013, consumption had fallen to 14,518,418 m3. In contrast to this downward trend, the number of water contracts has continued to rise since 2000. To a great extent, this is related to the residential bubble and the acquisition of homes that have been released for purchase. In this respect, in 2000, the population of Alicante was 276,886 inhabitants, with 144,202 domestic water contracts, which meant an average of 1.92 inhabitants per contract/household for that year. In 2013, with a population of 336,828 inhabitants and 177,422 domestic water contracts, the ratio fell to 1.89 inhabitants per contract/household. Figure 3 shows the trend in water consumption per inhabitant. It shows how the fall began in the late 1990s. For example, in 2000 consumption was 154 L/inhabitant/day, 150 L in 2004, and then from that time on consumption per inhabitant dropped considerably, reaching 119 L in 2013 (Figure 3).

3.2. Urban Typology and Water Consumption Trend

The aforesaid water consumption trends in the city of Alicante are explained by bearing in mind the links between types of housing, the socio-economic factors, and the housing bubble. When different levels of drinking water consumption are analyzed, it should be taken into account that there is a very broad range of building types in the city [48]. In the case of Alicante, housing ranged from old, deteriorated homes of unimaginable extremes, with minimal facilities, sometimes shared by immigrants or inhabitants with a reduced economic capacity, with very high levels of unemployment, in areas that have been significantly affected by the current economic crisis, through to splendid mansions in the areas where the higher-income population resides. By taking these variables into account and observing the results, in Alicante, it can be seen that consumption according to the housing type and the level of income has fallen in all cases over the past decade [36].
In the case of compact city homes (Table 2), districts associated with four levels of income (low, lower-middle, middle, and high) have been identified. In homes where high-income families live, the total dropped from 336 L/household/day in 2007 to 309 L in 2013. This is a drop of 27 L in seven years (i.e., 8.02%). These are homes located in the city center where the most well-off class in Alicante lives, i.e., in the financial and commercial center of the city, and where the land is the most expensive (923 €/m2) compared to the most degraded area in the city, where property prices are around 411 €/m2 [49]. They tend to be homes with two occupants (2.21 residents/house) [50] (Table 3), and with a high number of domestic appliances that use water [51]. Undoubtedly, the level of income is the main factor that makes the expenditure on water higher. Many studies have been carried out that argue and corroborate that, as economic income rises, so does domestic water consumption [52,53,54].
In middle and lower-middle income homes, for the same period, consumption dropped from 246 to 204 and from 223 to 189 L/household/day, respectively. This is a fall of 42 L in middle income homes, and 34 L in lower-middle income homes, a drop of 17.07% and 18.84% in both cases. It is in these households where the drop in water consumption has been greatest, and where it has dropped even further in recent years. Families in these homes (2.41 and 2.61 residents/house, respectively) [50] have reduced their water consumption by installing water-saving devices to use with taps, baths, toilets, etc., or by using domestic appliances that are more water-efficient. It is in these families where the increase in water and electricity bills has been most acute due to the income reduction as a consequence of crisis of 2007/2008. In this sense, utility bills increased by 77% between 2000 and 2013 [36]. These districts are located around the traditional urban core. They were built between the 1950s and the 1970s to house the population coming from inland Spain who arrived on the coast seeking work in the building and tourism sectors [55]. San Blas, Altozano, La Florida, Los Ángeles, and El Plà del Bon Repós are some of these districts. The age of the residents also comes into play, as they tend to be people over the age of 60 who bought their homes between the 1950s and the 1970s. With regard to income, the study by Renwick and Archibald [56] in California (USA) concluded that an increase in the price of water resulted in a drop in consumption, particularly in homes with lower-middle income levels. Because consumption is affected by the income level, and by extension by the quality of the home, its sanitary facilities, areas of greenery, swimming pool, and other possible amenities are in keeping with the purchasing power of the household. It is an indicator to which more attention should be paid to ensure a better understanding of the social differentiation of the space (Figure 4).
One noteworthy fact is the trend in consumption that has occurred in low-income households, where water usage has dropped from 290 to 273 L/household/day, a fall of only 5.86%. These are, therefore, much higher levels of consumption than those of households with middle and lower-middle incomes, and they are similar to the usage recorded for high-income homes. Furthermore, the drop is not as sharp as in households with middle income levels. These districts are in the most degraded area of the city, known administratively as the “North Area” (Virgen del Remedio, Virgen del Carmen, Colonia Requena, and Juan XXIII). Typically they are districts riven with conflict, with a high percentage of immigrants from North Africa (more than 50%) [57], a population with very few economic resources, and high rates of unemployment (between 30% and 40% of the population) [58]. In these homes it is easy to find various families or big groups of immigrants, so it is hard to accurately determine how many people might really be living in a home. That being the case, the main factor affecting their consumption is the level of occupancy. It is not unusual for these homes to be lived in by several families and big groups of immigrants, which can easily surpass seven or eight people per household. This situation plays a part in the notoriously low consumption level per capita. According to the data from the Council of the city of Alicante [51], in these districts, the average number of residents per house is 2.62. The immigrants represent 22.67% of the people in this area (the global data in Alicante is 9.98%), people without studies is 62% (the global data in the city is 45%), and the unemployment is 21.28% (the global data is 13.6%). Again, this data confirms that water consumption in these dwellings is 104.19 L/resident/day. It is in these houses where water consumption is very similar to the data of 100 L/day confirmed by the UNO for people living in poverty.
Some authors have found that in homes in districts where immigrants from developing countries live, domestic water consumption is lower than in other homes in the city. This is what was pointed out in the research carried out by Nauges and Reynaud [59] in the Départament de la Moselle and the Départament de la Gironde in France, where they show that this type of resident has a more austere behavior in terms of water consumption. Along the same lines is the work done by Smith and Ali [60] in various towns in the United Kingdom, where ethnic and religious influences on water consumption were analyzed. Interesting figures link the drop in the consumption of water in districts where there is a predominantly Muslim population, with the celebration of Ramadan. It is also worth pointing out that it is these districts where fewer measures have been adopted to reduce water consumption, such as installing water-saving devices, buying domestic appliances that are more water-efficient, and having greater environmental awareness, due to the low cultural and educational level of the residents (see Gaudin) [61].
Homes in apartment blocks are divided into those with a high income level and those with a middle income (Table 4). This urban typology is not associated with low income levels. High income households dropped their consumption from 392 to 356 L/household/day between 2007 and 2013 (a fall of 9.18%). In relation to the previous housing type, a decrease can be observed, but not as sharp a drop as in compact city housing. These are homes where families with a high income level live, in developments with a high number of services and facilities (a shared garden and a pool, play areas for children, sports courts, etc.). The developments are located in beach areas, such as La Albufereta, Vistahermosa, and Playa de San Juan. These properties also tend to be second homes, which are occupied in the summer months and at weekends. In this regard, one of the factors that may have had an impact on the drop in water consumption is the lower level of occupancy in the summer during that period due to the economic crisis, according to the water company technicians. For homes in apartment blocks with middle income levels, consumption dropped by 36 L between 2007 and 2013, from 328 to 289 L/household/day (a fall of 11.89%). Unlike high income households, these homes are located in developments that were built on the outskirts of the city during the last property boom. They are typically main residences, with a shared garden and a pool, and they are developments lived in by young families with children (2.57 residents/house) [50]. On this matter, it is important to highlight the fact that in these urban areas, the cost of maintaining the communal areas (gardens and pools) is shared among the neighbors of the residential development.
Semi-detached houses were the third housing type analyzed. Just like apartment blocks, typically these have a shared garden and a pool, they are lived in by young families with children, and they are the main residence. The difference between those of high and middle income is their location. The first are located in the beach area (El Golf and Cabo de la Huerta), whereas the middle income homes are on the outskirts of the city and unlike the blocks of apartments they are the main residence. The drop in consumption in high income homes was almost negligible, namely, 13 L between 2007 and 2013, from 492 to 479 L/household/day (a fall of 2.64%). For semi-detached homes with middle income levels, consumption dropped by 16 L, from 312 to 296 L/household/day (a fall of 5.12%). In this type of housing, consumption is higher than, for example, in the compact city type, as the housing tends to be lived in by young families with children, along with the fact that there are external elements in the home, such as small garden areas. Some authors argue that as the number of people in the home rises, so does the level of water consumption [62,63]. Other authors state that in homes with young families and with children, the average consumption is higher than in households where older people live [64,65]. It can also be observed that older people have better water saving habits, as shown in research carried out by Gregory and Di Leo [66] in Shoalhaven (Australia) and by Gilg and Barr [67] in Devon (Southwest England).
Detached houses in expansive, low-density developments were the last type of housing analyzed. They typically have a private garden and a swimming pool. Unlike the other types of housing, all of these are at the high income level, because to own a home of these characteristics the purchaser must have a high income; the minimum price for a detached house in 2015 was around 400,000 €, and as high as 800,000 € in some cases in the area of Vistahermosa or El Cabo de la Huerta. This is the housing type where the biggest drop in water consumption has been recorded. In 2007, consumption was 2300 L/household/day, dropping to 1052 L/household/day in 2013 (409.33 L/inhabitant/day). This is a fall of 1248 L in less than a decade (a drop of 54.26%). This is due to three main factors. The first is the result of a change and an improvement in water usage outside the home. Water-saving devices have been installed, along with more efficient irrigation systems, Atlantic vegetation (where the main plant species is the turf grass) has been replaced by Mediterranean plants (shrubs and succulent plants), the water in the swimming pool is not changed for several years, etc. The second factor is related to the increase in the water rates, which have risen by 77% in a decade [36]. It is important to highlight the fact that the greatest increase was seen in the bills with high consumption (see Table 5 and Table 6). This has resulted in a change in consumption habits to save water both inside and outside the home. The third factor in recent years in the city of Alicante is the use of treated water that has been put into the distribution network to irrigate private gardens, parks, and public areas of greenery. Accordingly, the distribution of reclaimed water increased in the Vistahermosa area from 43,668 m3 in 2003 to 429,947 m3 in 2012. Such is the commitment to use reclaimed water in Alicante city that the volume supplied in 2012 for private use and for council facilities was 944.129 m3 (6.32% of domestic water consumption).

3.3. Water Pricing and Its Effects on Water Consumption

The impact of water policy changes in relation to the Dublin Principles (1992) that consider water as an economic value, along with the Water Framework Directive (2000/60/EC) affected regulations and tariffs. The increase in water prices is a factor to highlight [68]. In the city of Alicante, a significant increase in the price of a cubic meter of water has been recorded since 2007 (77.64%) (Table 5). The evolution of prices paid for water is complex given the different aspects covered by the overall water bill (consumption fee, sewage treatment, and network tax). A differentiated analysis of each of the aspects covered by the water bill points to a different tendency of the costs associated with each of these aspects. In relation to water, the recorded rises do not reflect a linear increase but instead, they are related to significant diversities according to the consumption blocks. The price paid per cubic meter in the first threshold (up to 9 m3 per quarter) has not increased since 2007. In contrast to this, the increase in the other blocks is progressive (between 23% and 45%) (Table 6). The increase observed in the last block clearly reflects the desire to deter and control consumption as shown in the price of water by owners of houses with outdoor uses. The price increase associated with the Government of Valencia’s sewage treatment tax should also be mentioned, which, for a bill of 30 m3, has resulted in an increase of 36.98% in service charges and 35.07% in consumption charges over the last ten years. Similarly, VAT charges have increased to 26.02% for the same bill during the same period. This increase may have contributed towards shrinking consumption levels.
On the other hand, if the evolution of the Consumer Price Index and the family’s income are compared, it can be concluded that families have lost their purchasing power in relation to the increase of water prices. In this sense, according to the data provided by the INE [69], the CPI of the province of Alicante between 2007 and 2013 was increased 15.3% but the income of families was reduced 10.13% (25,802 € in 2007 and 23,189 € in 2013 in the Region of Valencia) [70]. In this regard, in 2007, 25,802 €, currently, families will need to earn 29,646 € according to the official statistical data [71].

3.4. Water Conservation Measures

Technological advances in devices designed to save water in bathrooms, kitchens, and electrical appliances since the mid-90s are one of the measures to reduce water consumption. Thus, most homes built during the last property boom come with these technological improvements, and these improvements have also spread to other pre-existing homes, and to businesses, industries, and state buildings, whenever refurbishment work is carried out or when new appliances are acquired that are more water and energy efficient.
The strong progression of personal habits is related to water saving and economy, and environmental awareness campaigns which were exacerbated by the droughts of the mid-90s [72]. All this has led to an unstoppable progression of new personal and social habits in drinking water expenditure, which have significantly reduced consumption modules in L/inhabitant/day. In this sense, since the mid-80s this has increased in developed countries and it has given rise to a change in a number of personal and domestic hygiene habits, the repairing of leaks, the prevention of dripping taps, etc., which all favor a reduction in consumption [72]. In general, the creation and consolidation of this greater environmental awareness is due to campaigns that promote water saving and the responsible use of water. They involve both general activities at environmental fairs and other specific action including those aimed at children, in particular. Furthermore, droughts have a great impact on drinking water consumption trends. For this reason, during drought cycles, water saving campaigns are organized, their messages affect consumption habits and these remain after the period of drought is over. For example, in Alicante the last drought periods that had an influence on the decrease in water consumption were those of 1992–1996, 2005–2009, and currently 2014–2016. In particular, this has a bearing on the decrease in water consumption in detached houses to save water in outdoor uses such as in gardens or swimming pools.
Another factor is the use of greywater and rainwater in general to water private gardens and public green areas [73,74]. Although this has not yet been generalized, initiatives are being launched to promote the reuse and use of greywater and rainwater in detached houses and commercial activities. These activities include the introduction of biological wastewater treatment systems and cisterns or tanks to collect rainwater. For example, in detached houses in the city of Alicante, in 2003 the use of this water only stood for 1.19% and nowadays it represents 41.62% of the total domestic water consumption. In this sense, in the same town, in 2003 the council supplied 82,399 m3 (38,731 m3 for the council and 43,668 m3 for detached houses) and 944,129 m3 in 2012 (514,182 m3 for the council and 429,947 m3 for detached houses). The price of greywater is the main reason for the increase in the use of this resource in recent years, because it is five times cheaper than drinking water. In the city of Alicante, greywater cost 0.32 €/m3 and drinking water 1.60 €/m3 (including VAT and the rest of the fees and this is the final cost). As stated before, reclaimed water increased for private and public uses. It should also be pointed out that Alicante is the Spanish city with the greatest irrigated surface area that uses treated water. In fact, 70% of the local areas of greenery in the city are maintained using treated water, a process which entails not only economic, energy, and environmental savings, but it has also meant that the amount of surface area set aside for parks and recreational space has tripled. The area of green spaces in the city went from 3.5 m2 per inhabitant in 2002 to the current figure of 10 m2 [75]. The main argument for using treated water is the cost: the price per cubic meter of this resource is 20% that of drinking water.
These factors are complemented by work carried out by the water company. It has taken various measures to continually improve water performance, including those that highlight the investment made to renew and improve the state of conservation of the distribution network. Nowadays, the efficiency in supplying water in Alicante is above 92% compared to fifteen years ago when it was about 75%–80%. The investment made means that faults in the distribution networks can be reduced to the very minimum. Water efficiency plays a prominent role in attaining a sustainable supply demand balance, with high standards of water efficiency in new dwellings, and water-efficient products and technologies in existing buildings. For example, in the case of England, according to the Government’s water strategy for England (2008), consumption of water per capita will be reduced through cost-effective measures, to an average of 130 L/inhabitant/day by 2030, or possibly even 120 L/inhabitant/day depending on new technological developments and innovation.

4. Discussion

There are several reasons why the consumption of drinking water in the city of Alicante increased up to the mid-2000s. A primary factor was the expansion of new areas of residential and tourist use, and the strong dynamic economic situation recorded in the area from the mid-1990s. Alicante benefited from land development in the Region of Valencia, which was brought about by traditional industries, tourism, commerce, administration and services, export agriculture, and the boom in property development and building houses [76]. In addition to this, there was the demographic growth due to foreign immigration and the major expansion of residential tourism [77]. As a result of this economic and social dynamism, which was highly dependent on water usage, the province of Alicante developed an increasingly central position as a competitive area within the Mediterranean Arc, ranking fourth in Spain, behind Madrid, Barcelona, and Valencia for employment figures, and in fifth place in 2015 for its gross domestic product.
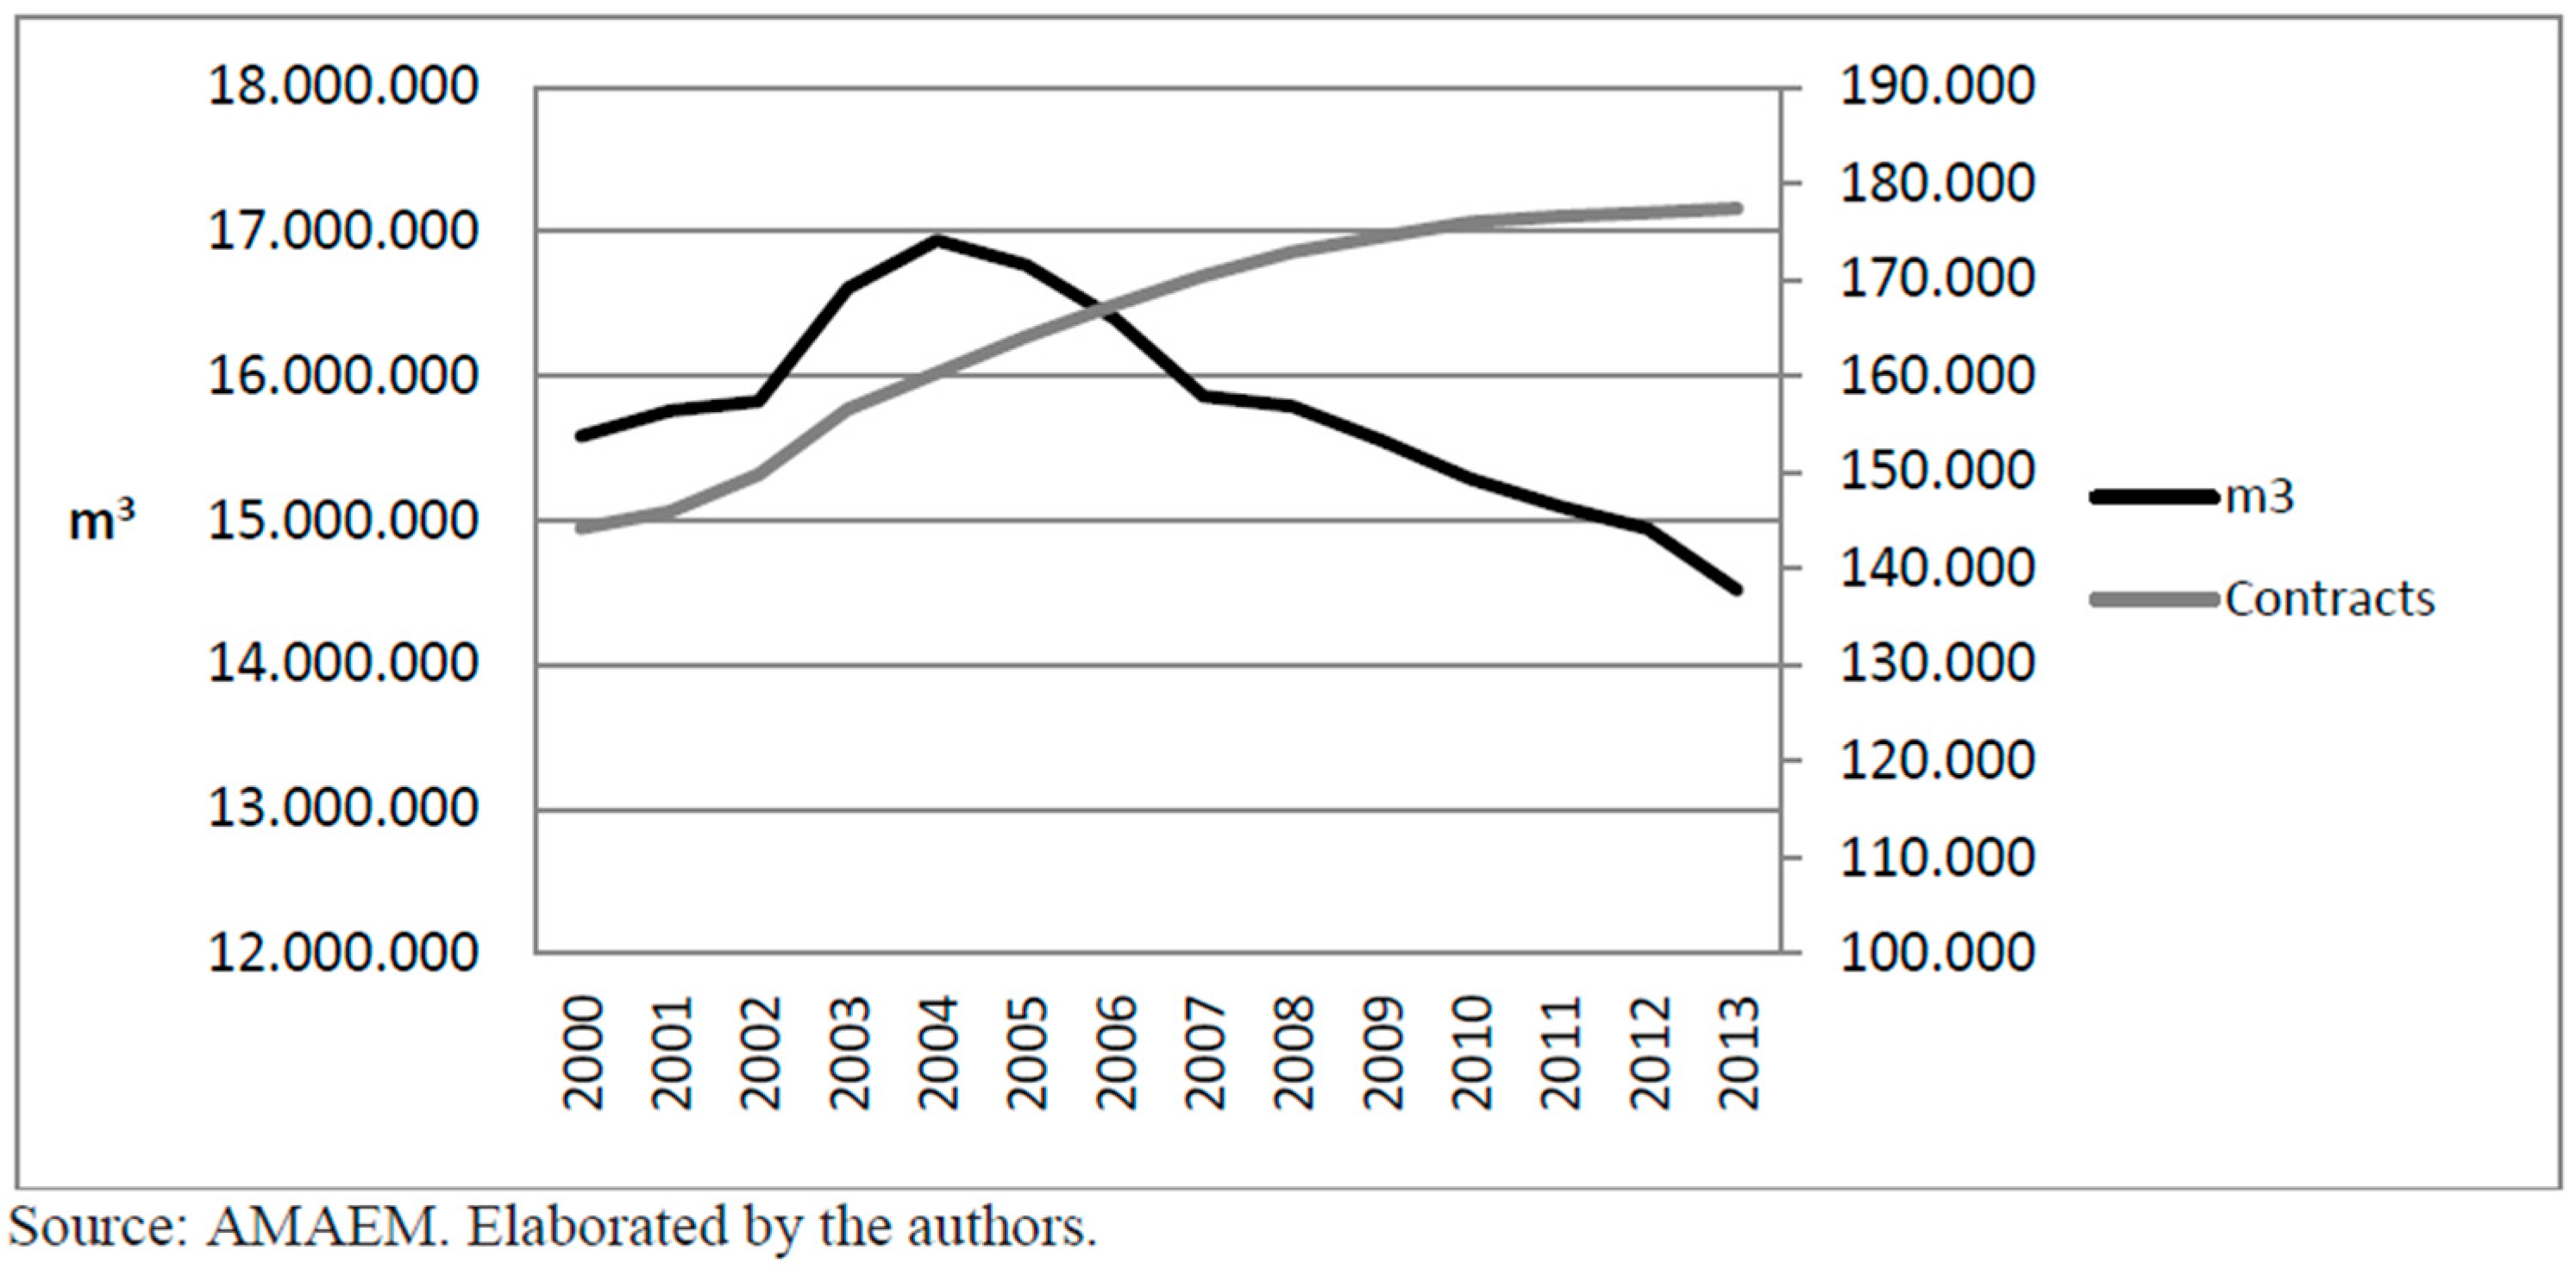
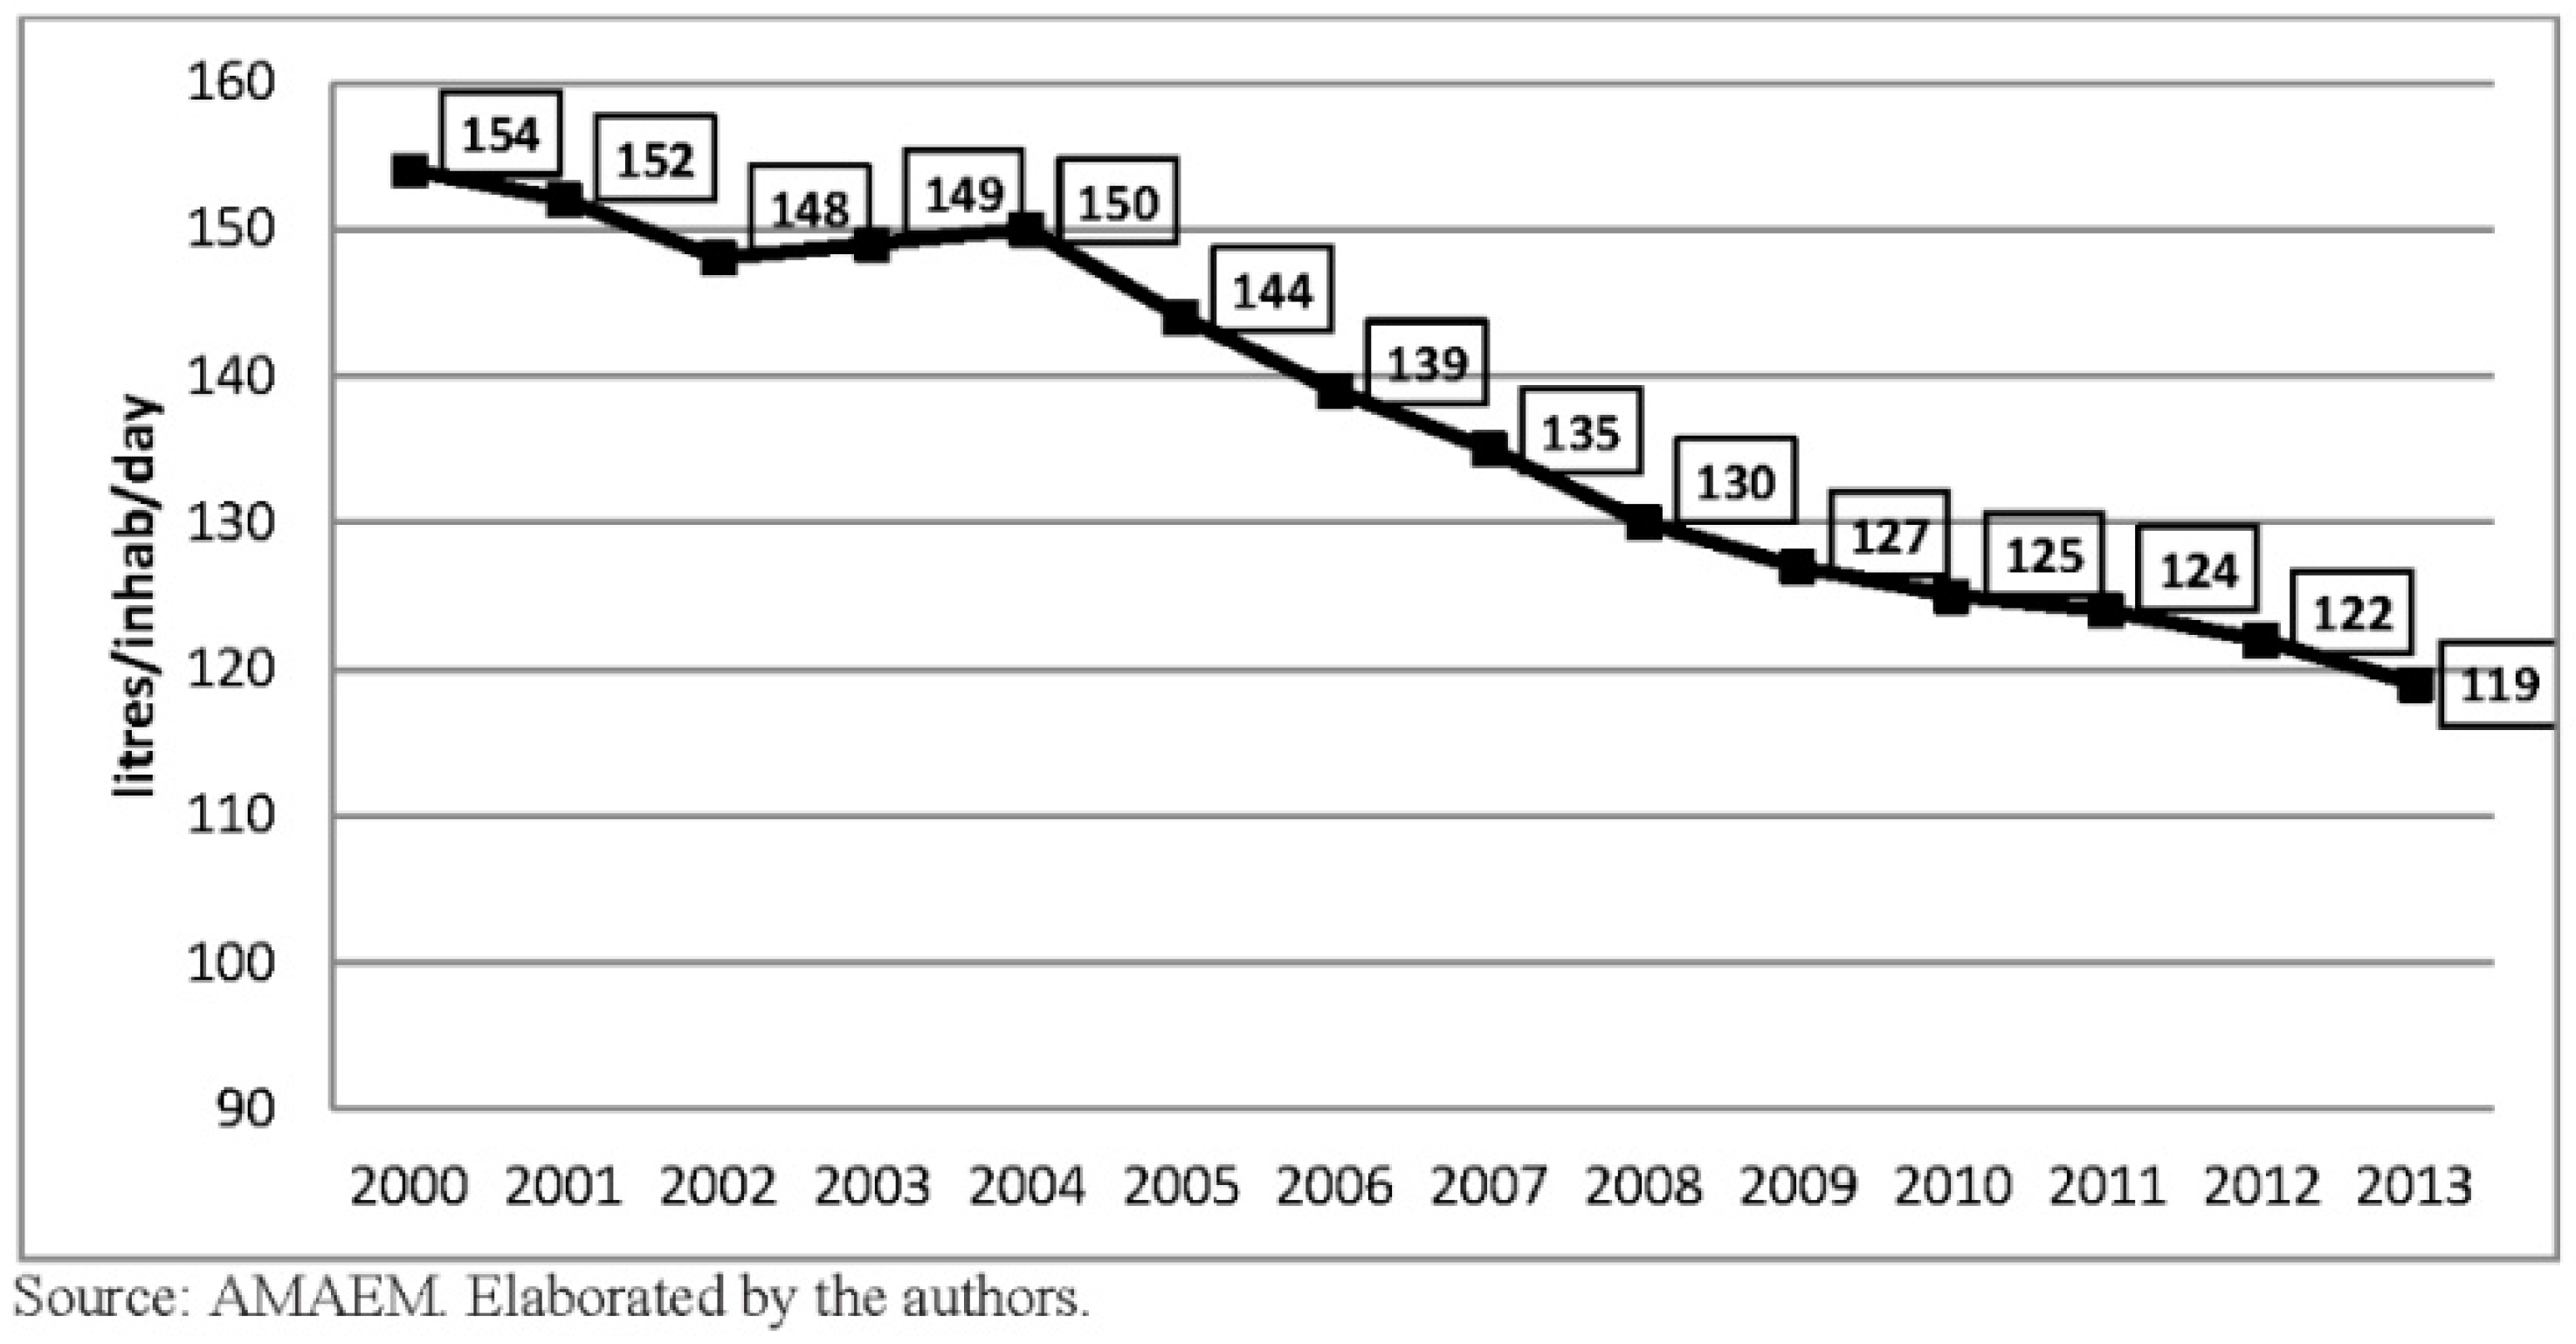
In 2004, the period of growth in water consumption that had begun in 1997 came to an end, once the intense drought of 1992–1996 had been overcome. The general dynamic of the drop in domestic water use since the 1990s can be related to structural factors.
The reduction in water consumption has been one of the measures taken by families to reduce their expenses due to the increase of water pricing and the effect of the economic crisis since 2007. A second consequence of these factors has been the intensification of the inter-relationship between the three aforesaid structural factors. Implementing technical measures and the progress made in new personal water-saving habits began back in the mid-1990s, and were prompted by the intense drought of 1992–1996. Since then, they have become commonplace, although they were intensified further by the related effect of the 2005–2009 drought and the economic and financial crisis that hit in 2007. Technological innovation barely counts when it comes to the reductions in consumption in marginal and degraded districts with a high percentages of immigrants. This is unlike households with middle and high incomes, where these improvements are a structural cause for reduced water expenditure, where traditional taps have been replaced with mixer taps and new models of domestic appliances. It takes time for these innovations in appliances and tap fittings to reach low income households, where the prolonged and intense nature of the current crisis often has traumatic consequences due to the high level of unemployment and severe cutbacks in income, which are undoubtedly the main cause of the drop in drinking water consumption. A third effect is the reduction of the occupancy of dwellings [63,78,79]. On the one hand, this is associated with holiday homes, where the economic crisis has led to a reduction in the traditional holiday periods. On the other hand, many buildings and dwellings built during the last real estate bubble have not taken out the expected contracts for drinking water supplies. This has led to a decrease in water consumption in these dwellings, thus emphasizing their highly seasonal nature, which is concentrated into the summer months, with holidays now being significantly shortened due to economic factors. In turn, the effects of the economic crisis have been felt particularly in non-domestic uses, which on a whole have led to a 25% reduction in water consumption [1]. This trend is more obvious in the commercial, catering, and services sector, and it has forced many businesses to close, and others to take drinking water-saving measures.
Besides, in terms of the socio-demographic agents, one aspect to explain is less demographic growth. During the period 2005–2013, the population in Alicante grew by 15,187 inhabitants, compared with a growth of up to 41,830 inhabitants in the period 2000–2005. This demographic trend is also related to the issue of settlement and more specifically to the slow-down of the urban residential expansion that took place from 2004 and 2005, which was followed by a complete paralysis of the real estate business from the outset of the financial crisis in 2007 [11]. Moreover, it is important to point out that the estimated population loss in the province of Alicante was around 27,673 inhabitants in 2014 [80].
These results could be compared with others in the Mediterranean European Area such as the study conducted by Romano et al. [23]. In this regard, the aim of this study was to estimate the determinants of residential water demand for the chief towns of every Italian province (2007–2009), using the linear mixed-effects model estimated with the restricted-maximum-likelihood method. Results confirmed that the applied tariff had a negative effect on residential water consumption and that it was a relevant driver of domestic water consumption. Moreover, income per capita had a positive effect on water consumption. Among measured climatic and geographical features, precipitation and altitude exerted a strongly significant negative effect on water consumption, while temperature did not influence water demand. Besides, data showed that small towns, in terms of population served, were characterized by lower levels of consumption. Water utilities ownership itself did not have a significant effect on water consumption, but tariffs were significantly lower and residential water consumption was higher in towns where the water service was managed by publicly owned water utilities. Also, another study in Greece conducted by Panagopoulos [22] proposed an innovative approach methodology in the international literature, to handling urban water consumption data in order to analyze statistically the interrelationships among the determinants of urban water use. Factor analysis of demographic, socio-economic, and hydrological variables showed that total water consumption in Mytilene is the combined result of increases in income, population, connections, and climate parameters. On the other hand, the water demand was influenced by variations in water prices but with different consequences in each consumption class. Increases in water prices are faced by large consumers in that they then reduce their consumption rates and transfer to lower consumption blocks. In this sense, these shifts were responsible for the increase in the average consumption values in the lower blocks despite the increase in the marginal prices.

5. Conclusions

The main conclusion drawn is that the installation of new appliances, saving devices, increase of environmental awareness, the price of water, and the use of reclaimed water for watering private outdoor and public areas have had considerable effect on the drop in domestic water consumption in the city of Alicante. Also, the economic crisis has had an effect on the drop in domestic water consumption in the last years, but this has not been the main cause. Perhaps if the current economic situation changes in the next few years, this may result in an increase in water expenditure, or in contrast, usage levels may stabilize as a result of well-established personal saving habits and due to the use of domestic appliances that are more efficient in terms of how they use water. It should also be pointed out that if the building sector recovers, an increase in the supply of municipal water can be expected, due to the increased number of homes connected to the network and the population covered.
A proper understanding of the factors that influence domestic water consumption is essential to develop and implement appropriate policies with regard to this resource. Among these factors, prices and taxes have been paid considerable attention to in the past, whereas demographic and cultural variables are still quite untouched. Economics has traditionally dominated the scientific literature on domestic water consumption. From the economic perspective, water is generally considered to be an inelastic good, since it cannot be substituted, and users do not tend to perceive this resource as being too expensive. A current example of this can be seen in California where its inhabitants have to reduce water consumption by 25%, if not there is the threat of heavy fines, along with an unprecedented state of emergency with the present drought there.
Perhaps the most important lesson to be learnt from the case of Alicante is the repercussion of the improvement of new technologies, the increase of water prices, the use of alternative water resources, and the different urban typologies on water consumption produced by outdoor residential uses. The expansion of the residential and tourist population, encouraged for decades by different administrations, has brought about strong competition with other economic (agriculture) and environmental (wetland) functions for the use of land and water. In low-density developments, i.e., single homes with a single-family garden and swimming pool, water consumption associated with outdoor areas is quite high. This is mainly due to the exclusive nature of its use by their owners. Urban typology that consists in condominium and apartment blocks would therefore stand for a more responsible and sustainable use of water resources associated with leisure. In this sense, it is important to study and analyze the growth of the urban sprawl on the coast of Alicante, due to its impact on water consumption. For this reason, in this dry region, urban typologies are a main element to account for in planning water resources in future scenarios. In this way, Alicante is much like other tourist areas of the world with lack of water resources, such as some regions of Mediterranean Europe, Australia, or the USA. A better understanding of the relationships between water consumption, urbanization, and the measures for reducing water demand would help to improve the knowledge of the changing nature of urbanization in areas where sprawling urbanization has become widespread, and it would help us understand the environmental impacts of this sprawl. Additionally, it is important to increase the knowledge of water consumption to account for the consequences of climate change and the increasing frequency of serious droughts and the general lack of water resources. This is one result that should be taken into account in the planning of future European urban areas.

Acknowledgments

The results presented in this article are part of three research studies. The first, entitled “Urbanisation and water metabolism in the coast of Alicante: Analysis of trends for the 2000–2010 period” was funded by the Spanish MINECO under grant number CSO2012-36997-C02-02. The second, entitled “Uses and management of non-conventional water resources in the coast of Valencia and Murcia as an adaptation strategy to drought” funded by the Spanish MINECO under grant number CSO2015-65182-C2-2-P. The third is part of a Ph.D. research grant funded by the Spanish Ministry of Education. The authors are grateful for the data provided by the company Hidraqua, Gestión Integral de Aguas de Levante S.A. (Asunción Martínez) and Aguas Municipalizadas de Alicante, Empresa Mixta (AMAEM) (Francisco Bartual, Antonio Ivorra, Francisco Agulló, Antonio Sánchez, Vicente Juan, Ignacio Casals, and César Vázquez).

Author Contributions

The three authors analyzed and wrote the paper.

Conflicts of Interest

The authors declare no conflict of interest.

References

  1. Albiol, C.; Agulló, F. La reducción del consumo de agua en España: Causas y tendencias. Aquaepapers 2014, 6, 1–70. [Google Scholar]
  2. Rico, A.M.; Saurí, D.; Olcina, J.; Vera, J.F. Beyond Megaprojects? Water Alternatives for Mass Tourism in Coastal Mediterranean Spain. Water Res. Manag. 2013, 27, 553–565. [Google Scholar] [CrossRef]
  3. Gössling, S. New performance indicators for water management in tourism. Tour. Manag. 2015, 46, 233–244. [Google Scholar] [CrossRef]
  4. Hof, A.; Wolf, N. Estimating potential outdoor water consumption in private urban landscapes by coupling high-resolution image analysis, irrigation water needs and evaporation estimation in Spain. Landsc. Urban Plan. 2014, 123, 61–72. [Google Scholar] [CrossRef]
  5. Morote, A.F.; Saurí, D.; Hernández, M. Residential Tourism, Swimming Pools and Water Demand in the Western Mediterranean. Prof. Geogr. 2016. [Google Scholar] [CrossRef]
  6. Salvati, L.; Sabbi, A. Exploring long term land cover changes in an urban region of Southern Europe. Int. J. Sustain. Dev. World Ecol. 2011, 18, 273–282. [Google Scholar] [CrossRef]
  7. Salvà, P. Foreign Immigration and Tourism Development in Spain’s Balearic Islands. In Tourism and Migration: New Relationships between Production and Consumption; Kluwer Academic Publishers: London, UK, 2002. [Google Scholar]
  8. Raya Mellado, P.; Benítez Rochell, J.J. Concepto y estimación del turismo residencial: Aplicación en Andalucía. Pap. Tur. 2002, 31–32, 67–89. [Google Scholar]
  9. Fernández, S.; Barrado, D.A. El desarrollo turístico-inmobiliario de la España mediterránea e insular frente a sus referentes internacionales (Florida y la Costa Azul): Un análisis comparado. Cuad. Tur. 2011, 27, 373–402. [Google Scholar]
  10. Loh, M.; Coghlan, P. Domestic Water Use Study: Perth, Western Australia 1998–2001; Water Corporation: Perth, Australia, 2003. [Google Scholar]
  11. Burriel, E. La década prodigiosa del urbanismo español (1997–2006). Scr. Nova 2008, 12, 270. [Google Scholar]
  12. Morote, A.F. La planificación y gestión del suministro de agua potable en los municipios urbano-turísticos de Alicante. Cuad. Geogr. 2015, 54, 298–320. [Google Scholar]
  13. Hernández, M.; Morales, A.; Saurí, D. Auge y caída de nuevas naturalezas urbanas: Plantas ornamentales y expansión turístico-residencial en Alicante. Bol. Asoc. Geogr. Esp. 2015, 68, 129–157. [Google Scholar]
  14. Morote, A.F.; Hernández, M. Urban sprawl and its effects on water demand: A case study of Alicante, Spain. Land Use Policy 2016, 50, 352–362. [Google Scholar] [CrossRef]
  15. Ministerio de Fomento. Viviendas Visadas. 2012. Available online: http://www.fomento.gob.es/BE/?nivel=2&orden=09000000 (accessed on 14 March 2016). [Google Scholar]
  16. Colegio Oficial Aparejadores, Arquitectos Técnicos e Ingenieros de Edificación de Alicante. Número de Viviendas Nuevas Visadas Anualmente de Dirección de Ejecución Material. 2015. Available online: http://www.coaatalicante.org/contenido/2014/2014%2012%20Viviendas%20Registradas%20y%20Visadas%20COAATIEA%20por%20años%202014.pdf (accessed on 14 March 2016).
  17. Ministerio de Fomento. Viviendas Visadas. 2015. Available online: http://www.fomento.gob.es/BE/?nivel=2&orden=09000000 (accessed on 14 March 2016). [Google Scholar]
  18. Schleich, J.; Hillenbrand, T. Determinants of Residential Water Demand in Germany; Working Paper Sustainability and Innovation 3; Institute Systems and Innovation Research: Karlsruhe, Germany, 2007. [Google Scholar]
  19. Environment Agency. International Comparisons of Domestic per Capita Consumption; Environment Agency: Bristol, UK, 2008. [Google Scholar]
  20. Cohen, R.; Wolff, G.; Nelson, B. The Hidden Costs of California’s Water Supply; Natural Resources Defense Council & Pacific Institute: San Francisco, CA, USA, 2004. [Google Scholar]
  21. Cubillo, F.; Moreno, T.; Ortega, S. Microcomponentes y Factores Explicativos del Consumo Doméstico de Agua en la Comunidad de Madrid; Colección de Cuadernos de I+D+I, Canal de Isabel II: Madrid, Spain, 2008. [Google Scholar]
  22. Panagopoulos, G.P. Assessing the impacts of socio-economic and hydrological factors on urban water demand: A multivariate statistical approach. J. Hydrol. 2014, 518, 42–48. [Google Scholar] [CrossRef]
  23. Romano, G.; Salvati, N.; Guerrini, A. Estimating the Determinants of Residential Water Demand in Italy. Water 2014, 6, 2929–2945. [Google Scholar] [CrossRef]
  24. Domene, E.; Saurí, D. Urbanization and Water Consumption. Influencing Factors in the Metropolitan Region of Barcelona. Urban Stud. 2006, 43, 1605–1623. [Google Scholar] [CrossRef]
  25. Larsen, L.; Harlan, S.L. Desert dreamscapes: Residential landscapes preference and behavior. Landsc. Urban Plan. 2006, 78, 85–100. [Google Scholar] [CrossRef]
  26. Yabiku, S.T.; Casagrande, D.G.; Farley-Metzger, E. Preferences for Landscape Choice in a Southwestern Desert City. Environ. Behav. 2008, 40, 382–400. [Google Scholar] [CrossRef]
  27. Mustafa, D.; Smucker, T.A.; Ginn, F.; Johns, R.; Connely, S. Xeriscape People and the Cultural Politics of Turfgrass Transformation. Environ. Plan. D 2010, 28, 600–617. [Google Scholar] [CrossRef]
  28. Hurd, B.H. Water Conservation and Residential Landscape: Household Preferences, Household Choices. J. Agric. Res. Econ. 2006, 31, 21–32. [Google Scholar]
  29. García, X. Jardines privados y consumo de agua en las periferias urbanas de la comarca de la Selva (Girona). Investig. Geogr. 2014, 61, 55–69. [Google Scholar] [CrossRef]
  30. Rico, A.M. Tipologías de consumo de agua en abastecimientos urbano-turísticos de la Comunidad Valenciana. Investig. Geogr. 2007, 42, 5–34. [Google Scholar] [CrossRef]
  31. Morote, A.F.; Hernández, M. Jardines y urbanizaciones, nuevas naturalezas urbanas en el litoral de la provincia de Alicante. Doc. d’Anàl. Geogr. 2014, 60, 483–504. [Google Scholar]
  32. Saurì, D. Water Conservation: Theory and Evidence in Urban Areas of the Developed World. Ann. Rev. Environ. Resour. 2013, 38, 227–248. [Google Scholar] [CrossRef]
  33. March, H.; Saurí, D.; Rico, A.M. The end of scarcity? Water desalination as the new cornucopia for Mediterranean Spain. J. Hydrol. 2014, 519, 2642–2651. [Google Scholar] [CrossRef]
  34. Instituto Nacional de Estadística. Encuesta Sobre el Suministro y Saneamiento del Agua. 2015. Available online: http://www.ine.es/jaxi/menu.do?type=pcaxis&path=%2Ft26%2Fp067%2Fp01&file=inebase (accessed on 20 March 2016).
  35. Fundación Aquae. Datos del Agua. 2015. Available online: http://www.fundacionaqUAE.org/wiki/datos-del-agua (accessed on 13 January 2016).
  36. Gil, A.; Hernández, M.; Morote, A.F.; Rico, A.M.; Saurí, D.; March, H. Tendencias del Consumo de Agua Potable en la Ciudad de Alicante y Área Metropolitana de Barcelona, 2007–2013; Universidad de Alicante: Alicante, Spain, 2015. [Google Scholar]
  37. Deoreo, W.B.; Mayer, P.W. Insights into declining single-family residential water demands. J. Am. Water World Assoc. 2012, 104, 383–394. [Google Scholar] [CrossRef]
  38. Barrett, G.; Wallace, M. An Institutional Economics Perspective: The Impact of Water Provider Privatisation on Water Conservation in England and Australia. Water Resour. Manag. 2011, 25, 1325–1340. [Google Scholar] [CrossRef]
  39. Swyngedouw, E. Into the Sea: Desalination as Hydro-Social Fix in Spain. Annu. Assoc. Am. Geogr. 2013, 103, 261–270. [Google Scholar] [CrossRef]
  40. Gil, A.; Rico, A.M. El Problema del Agua en la Comunidad Valenciana; Fundación de la Comunidad Valenciana Agua y Progreso: Valencia, Spain, 2007. [Google Scholar]
  41. Rico, A.M.; Olcina, J.; Saurí, D. Tourist land use patterns and water demand: Evidence from the Western Mediterranean. Land Use Policy 2009, 26, 493–501. [Google Scholar] [CrossRef]
  42. Olcina, J. Riesgos Climáticos en la Península Ibérica; Pentalon: Madrid, Spain, 1994. [Google Scholar]
  43. Instituto Nacional de Estadística. Demografía y Composición del Hogar. Cifras INE. Boletín Informativo del Instituto Nacional de Estadística. 2011. Available online: http://www.ine.es/revistas/cifraine/0309.pdf (accessed on 20 April 2016).
  44. Rovira, A. Atlas Socio-Comercial de la Comunitat Valenciana 2009; Generalitat Valenciana: Valencia, Spain, 2011. [Google Scholar]
  45. García, X. Nous Procesos D’urbanització i Consum D’aigua per a Usos Domèstics. Una Exploració de Relacions a L’àmbit Gironí. Ph.D. Thesis, University of Girona, Girona, Spain, 2012. [Google Scholar]
  46. Domènech, L.; March, H.; Vallés, M.; Saurí, D. Learning processes during regime shifts: Empirical evidence from the diffusion of greywater recycling in Spain. Environ. Innov. Soc. Transit. 2014, 15, 1–16. [Google Scholar] [CrossRef]
  47. Ayuntamiento de Alicante. Estudio Barrios Vulnerables Zona Norte; Ayuntamiento de Alicante: Alicante, Spain, 2011. [Google Scholar]
  48. March, H.; Saurí, D. What lies behind domestic water use? A review essay on the drivers of domestic water consumption. Bol. Asoc. Geogr. Esp. 2009, 50, 297–314. [Google Scholar]
  49. Tecnocasa Group El Precio de la Vivienda en Alicante Acumula un Descenso del 51,03%. 2011. Available online: http://www.grupotecnocasa.es/group/es/saladeprensa/notasdeprensa/2012.html (accessed on 10 March 2016).
  50. Instituto Nacional de Estadística. Censos de Población y Vivienda. 1991, 2001 y 2011. 2012. Available online: http://www.ine.es/inebmenu/mnu_cifraspob.htm (accessed on 20 April 2016).
  51. Ayuntamiento de Alicante. Proyecto Urban, Barrios de la Zona Norte de Alicante; Ayuntamiento de Alicante: Alicante, Spain, 2011. [Google Scholar]
  52. García, S.; Reynaud, A. Estimating the benefits of efficient water pricing in France. J. Res. Energy Econ. 2003, 26, 1–25. [Google Scholar] [CrossRef]
  53. Worthington, A.C.; Hoffman, M. An Empirical Survey of Residential Water Demand Modeling. J. Econ. Surv. 2008, 5, 842–871. [Google Scholar] [CrossRef]
  54. Harlan, S.L.; Yabiku, S.T.; Larsen, L.; Brazel, A.J. Household water consumption in an arid city: Affluence, affordance and attitudes. Soc. Nat. Res. 2009, 22, 691–709. [Google Scholar] [CrossRef]
  55. Piqueras, J. Geografía del Territorio Valenciano. Naturaleza, Economía y Paisaje; Universidad de Valencia: Valencia, Spain, 2012. [Google Scholar]
  56. Renwick, M.; Archibald, S. Demand Side Management Policies for Residential Water Use: Who Bears the Conservation Burden? Land Econ. 1998, 74, 343–359. [Google Scholar] [CrossRef]
  57. Gil, C.G. La Inmigración en Alicante y Algunas de sus Paradojas. Algunas Preguntas y Respuestas Sobre la Situación de los Inmigrantes; Colección los Libros de la Sede, No.1; Universidad de Alicante: Alicante, Spain, 2002. [Google Scholar]
  58. Estudio Socio-Económico del Municipio de Alicante. Contexto Socio-Demográfico 2011; Tomo II; UGT-PV, U.C. L’Alacantí: Alicante, Spain, 2011.
  59. Nauges, C.; Reynaud, A. Estimation de la demande domestique d’eau potable en France. Rev. Écon. 2001, 52, 167–185. [Google Scholar] [CrossRef]
  60. Smith, A.; Ali, M. Understanding the impact of cultural and religious water use. Water Environ. J. 2006, 20, 203–209. [Google Scholar] [CrossRef]
  61. Gaudin, S. Effect of price information on residential water demand. Appl. Econ. 2006, 38, 383–393. [Google Scholar] [CrossRef]
  62. Höglund, L. Household demand for water in Sweden with implications of a potential tax on water use. Water Resour. Res. 1999, 35, 3853–3863. [Google Scholar] [CrossRef]
  63. Kesharvarzi, A.R.; Sharifzadeh, M.; Kamgar, A.A.; Amin, S.; Keshtkar, S.; Bamdad, A. Rural domestic water consumption behavior: A case study in Ramjerd area, Fars province, I.R. Iran. Water Res. 2006, 40, 1173–1178. [Google Scholar] [CrossRef] [PubMed]
  64. Nauges, C.; Thomas, A. Privately Operated Water Utilities, Municipal Price Negotiation and Estimation of Residential Water Demand: The Case of France. Land Econ. 2000, 76, 68–85. [Google Scholar] [CrossRef]
  65. Troy, P.; Holloway, D.; Randolph, A.B. Water Use and the Built Environment: Patterns of Water Consumption in Sydney, City Futures Research; Report n1; City Futures Research Center, Faculty of Built Environment, UNSW: Kensigton, UK, 2005. [Google Scholar]
  66. Gregory, G.D.; Di Leo, M. Repeated Behavior and Environmental Psychology: The Role of Personal Involvement and Habit Formation in Explaining Water Consumption. J. Appl. Soc. Psychol. 2003, 33, 1261–1296. [Google Scholar] [CrossRef]
  67. Gilg, A.; Barr, S. Behavioral attitudes towards water saving? Evidence from a study of environmental actions. Ecol. Econ. 2006, 57, 400–414. [Google Scholar] [CrossRef]
  68. Dalhuisen, J.; Florax, R.; De Groot, H.; Nijkamp, P. Price and Income Elasticities of Residential Water Demand: A Meta-Analysis. Land Econ. 2003, 79, 292–308. [Google Scholar] [CrossRef] [Green Version]
  69. Instituto Nacional de Estadística. Cálculo de Variaciones del Índice de Precios de Consumo. 2016. Available online: http://www.ine.es/varipc/verVariaciones.do;jsessionid=AEBB85F409D6D6A8CEC5DD159E864830.varipc01?idmesini=1&anyoini=2007&idmesfin=12&anyofin=2013&ntipo=3&enviar=Calcular (accessed on 15 July 2016).
  70. Instituto Nacional de Estadística. Renta por Hogar por Comunidades Autónomas. 2016. Available online: http://www.ine.es/jaxiT3/Datos.htm?t=9949 (accessed on 15 July 2016).
  71. Instituto Nacional de Estadística. Actualización de Rentas con el IPC General (Sistema IPC Base 2011) para Periodos Anuales Completos. Available online: http://www.ine.es/calcula/calcula.do;jsessionid=AF2006FC43A4B8D83516D00D3A7116DE.calcula01 (accessed on 15 July 2016).
  72. March, H.; Domènech, L.; Saurí, D. Water conservation campaigns and citizen perceptions: The drought of 2007–2008 in the Metropolitan Area of Barcelona. Nat. Hazards 2013, 65. [Google Scholar] [CrossRef]
  73. Domènech, L.; Saurí, D. A comparative appraisal of the use of rainwater harvesting in single and multifamily buildings of the Metropolitan Area of Barcelona (Spain): Social experience, drinking water savings and economic costs. J. Clean. Prod. 2011, 19, 598–608. [Google Scholar] [CrossRef]
  74. March, H.; Hernández, M.; Saurí, D. Percepción de recursos convencionales y no convencionales en áreas sujetas a estrés hídrico: El caso de Alicante. Rev. Geogr. Norte Gd. 2015, 60, 153–172. [Google Scholar] [CrossRef]
  75. EFE. El 70% de las Zonas Verdes de la Ciudad de Alicante se Riegan con Agua Reutilizada. El País. 28 December 2013. Available online: http://ccaa.elpais.com/ccaa/2013/12/28/valencia/1388233108_080183.html (accessed on 17 September 2014).
  76. Gaja, F. El tsunami urbanizador de la costa mediterránea. Scr. Nova 2008, 12, 66–75. [Google Scholar]
  77. Casado-Díaz, M.A.; Casado-Díaz, A.B.; Casado-Díaz, J.M. Linking tourism, retirement migration and social capital. Tour. Geogr. 2014, 16, 124–140. [Google Scholar] [CrossRef]
  78. Nieswiadomy, M.; Cobb, S. Impact of pricing structure selectivity on urban water demand. Contemp. Policy Issues 1993, 11, 101–113. [Google Scholar] [CrossRef]
  79. Mitchell, J. Urban sprawl. Natl. Geogr. 2001, 200, 48–56. [Google Scholar]
  80. Instituto Nacional de Estadística. Demografía y Composición del Hogar. Padrón de Habitantes. 2015. Available online: http://www.ine.es/inebmenu/mnu_padron.htm (accessed on 15 March 2016).
Figure 1. Districts analyzed in the city of Alicante according to income levels. Source: AMAEM. High income: 3-Centro, 14-Ensanche-Diputación, 38-Vistahermosa, 39-La Albufereta, 40-Cabo de la Huerta, 41-Playa de San Juan; Average income: 1-Benalúa, 9-Florida Alta, 10-Florida Baja, 12-Polígono Babel, 15-Polígono San Blas, 19-Garbinet, 24-San Blás-Santo Domingo, 25-Altozano-Conde Lumiares, 30-Divina Pastora; Low-average income: 6-Los Angeles, 11-Ciudad de Asís, 16-Plà del Bon Repós; Low income: 32-Virgen del Remedio, 33-Lo Morant-San Nicolás de Bari, 34-Colonia Requena, 35-Virgen del Carmen, 36-400 Viviendas, 37-Juan XXIII. Elaborated by the authors.
Water 08 00374 g001
Figure 2. Evolution of domestic water consumption and number of water contracts in the city of Alicante, 2000–2013.
Water 08 00374 g002
Figure 3. Evolution of domestic water consumption in the city of Alicante (L/inhabitant/day), 2000–2013.
Water 08 00374 g003
Figure 4. Evolution of domestic water consumption by economic rent in the urban core of the city of Alicante (L/house/day), 2007–2013.
Water 08 00374 g004
Table 1. Districts of the city of Alicante where the dwellings have been chosen according to the urban typology and level income. Source: Authors.
Urban Core
High incomeCentro
Diputación-Mercado
Average incomeSan Blas
Altozano
La Florida
Benalua
Low-average incomePlà del Bon Repós
Los Ángeles
Ciudad de Asís
Low incomeVirgen del Remedio
Virgen del Carmen
Colonia Requena
Juan XXIII
Blocks of apartments
High incomeLa Albufereta
Vistahermosa
Average incomeGarbinet
Polígono San Blas
Polígono Babel
Semi-detached houses
High incomeCabo de La Huerta
El Golf
Average incomeDivina Pastora
Detached houses
High and average incomeVistahermosa
Cabo de La Huerta
Table 2. Evolution of domestic water consumption by urban typology and economic rent in the city of Alicante (L/house/day), 2007–2013. Source: AMAEM. Elaborated by the authors.
2007200820092010201120122013Trend % (2007–2013)
Urban coreHigh income336293305338305305309−8.02
Average income246217208223223212204−17.07
Average-low income233218215201204200189−18.84
Low income290320325314281287273−5.86
Blocks of apartmentsHigh income392383370366378336356−9.18
Average income328311315322319305289−11.89
Semi-detached housesHigh income492507493488485486479−2.64
Average income312317305318321295296−5.12
Detached housesHigh-average income2300242421461989184216031052−54.26
Table 3. Socio-economic characteristics of the districts of the urban core of Alicante, 2011. Source: INE, 2011.
People with >65 Years (%)Foreigners (%)No. Residents per HouseHouses with One Resident (%)L/Resident/Day
High income26.5414.442.2132.72148.86
Average income17.3713.392.4127.9184.64
Low-average income15.2825.762.6622.2171.52
Low income13.8922.672.6225.40104.14
Table 4. Socio-economic characteristics of the districts of the urban periphery (blocks of apartments and semi-detached houses), 2011. Source: INE, 2011.
People with >65 Years (%)Foreigners (%)No. Residents per HouseHouses with One Resident (%)L/Resident/Day (Blocks of Apartments)L/Resident/Day (Semi-Detached)
High income12.3713.642.5224.86141.26190.07
Average income9.035.162.7517.64105.09107.63
Table 5. Evolution of the water price bill (30 m3/3 months), 2000–2013 (€). Source: AMAEM. Elaborated by the authors.
200020072013% Growth 2013–2000
Consumption fee
Service fee10.9816.1721.96100.00
Consumption (30 m3)9.179.2111.3123.33
Meter conservation fee1.321.591.7129.54
Sewage treatment
Service fee2.363.874.5693.22
Consumption1.621.651.651.85
Network tax
Service fee4.407.229.89124.77
Consumption5.218.6411.67123.99
VAT2.693.424.3160.22
Total37.7551.7767.0677.64
Table 6. Evolution of the water price by consumption blocks (€/m3), 2007–2013. Source: AMAEM. Elaborated by the authors.
FEES2007200920112013% Growth 2013–2007
0–9 m3 (3 months)0.020.020.020.020.00
10–30 m3 (3 months)0.430.490.490.5323.25
31–60 m3 (3 months)1.31.521.631.7635.38
<61 m3 (3 months)1.631.922.182.3644.78

