Article

Heavy Metal Contamination in the Surface Layer of Bottom Sediments in a Flow-Through Lake: A Case Study of Lake Symsar in Northern Poland

by
Angela Kuriata-Potasznik
*,
Sławomir Szymczyk
,
Andrzej Skwierawski
,
Katarzyna Glińska-Lewczuk
and
Ireneusz Cymes
Department of Water Resources, Climatology and Environmental Management, University of Warmia and Mazury in Olsztyn, Plac Łódzki 2, Olsztyn 10-719, Poland
*
Author to whom correspondence should be addressed.
Water 2016, 8(8), 358; https://doi.org/10.3390/w8080358
Submission received: 7 July 2016 / Revised: 12 August 2016 / Accepted: 15 August 2016 / Published: 22 August 2016
(This article belongs to the Special Issue Lake Restoration and Management in a Climate Change Perspective)

Abstract

:
River-lake systems most often behave as hydrographic units, which undergo complex interactions, especially in the contact zone. One such interaction pertains to the role of a river in the dispersal of trace elements carried into and out of a lake. In this study, we aimed to assess the impact of rivers on the accumulation of heavy metals in bottom sediments of natural lakes comprised in postglacial river-lake systems. The results showed that a river flowing through a lake is a key factor responsible for the input of the majority of available fraction of heavy metals (Zn, Mn, Cd and Ni) into the water body and for their accumulation along the flow of river water in the lake. The origin of other accumulated elements were the linear and point sources in catchments. In turn, the Pb content was associated with the location of roads in the direct catchment, while the sediment structure (especially size of fraction and density) could have affected the accumulation of Cr and Zn, which indicated correlations between these metals and fine fraction. Our results suggest that lakes act as filters and contribute to the self-purification of water that flows through them. As a result, the content of most metals in lake sediments showed a decrease by approx. 75% between the upstream (inflow) and downstream (outflow) sections. The increased content of two metals only, such as chromium and cadmium (higher by 2.0 and 2.5 times, respectively, after passing through the lake), was due to the correlation of the metals with fine sand. Both the content and distribution pattern of heavy metals in lake sediments are indicative of the natural response of aquatic ecosystems to environmental stressors, such as pollutant import with river water or climate change. The complex elements creating the water ecosystem of each lake can counteract stress by temporarily removing pollutants such as toxic metals form circulation and depositing them mostly around the delta.

1. Introduction

The influence of water bodies, particularly natural lakes, on rivers has been analyzed by many authors, yet the results have failed to elucidate explicitly their role in heavy metal accumulation [1,2,3]. Metals undergo an array of biogeochemical processes on natural reactive surfaces, including surfaces of clay minerals, metal oxides and oxyhydroxides, humic substances, plant roots and microbes. These processes control the solubility, mobility, bioavailability and toxicity of metals in the environment [4]. Rivers passing through urban and rural areas transport metals, partly dissolved and partly adsorbed on suspended material. This suspended material settles on the bottom of lakes and accumulates in the sediment [5]. The behaviour of metals in natural waters depends on the composition of substrate sediment, composition of suspended sediment and on water chemistry. Sediments composed of fine sand and silt will generally have higher levels of adsorbed metal than quartz, feldspar and detrital carbonate-rich sediment [6,7]. Metals also have high affinity for humic acids, organo-clays and oxides coated with organic matter [8]. Heavy metals entering an aquatic ecosystem can be accumulated at the bottom, subject to the absorptive capacity and textural composition of sediments, the chemical forms of metals and the compounds formed with other substances [9]. Some of them are removed through biosorption [10,11]. Lakes as elements of river-lake systems are expected to act as a filter which inhibits the dispersion of pollutants from the catchment area [9], but this role is associated with the increasing accumulation of heavy metals in water bodies and sediments. Heavy metal concentrations also testify to the natural response of ecosystems to environmental stressors, including the temporary elimination of pollutants such as toxic metals from circulation, and their deposition. There are few reports in literature on the effect of water bodies on the accumulation of allochthonous matter in a river-lake chaining system or on their potential to accumulate the matter, which is an important factor in assessment of the resilience of such systems to excessive loads of pollutants, such asthe lacustrine sediments of the Elqui River studied by Oyarzun et al. [12]. It is worth mentioning that the process of sedimentation of toxic elements can limit their content outside the aquatic ecosystem [13]. Increasing accumulation of allochthonous matter is a proof of the ongoing ecological degradation of fresh water ecosystems. Therefore, an attempt was made in the study to evaluate: (a) the impact of a river on changes in heavy metal accumulation in bottom sediments of a lake as the last element of a river-lake system; and (b) the role of that lake in limiting the transport of heavy metals from the catchment area.

2. Materials and Methods

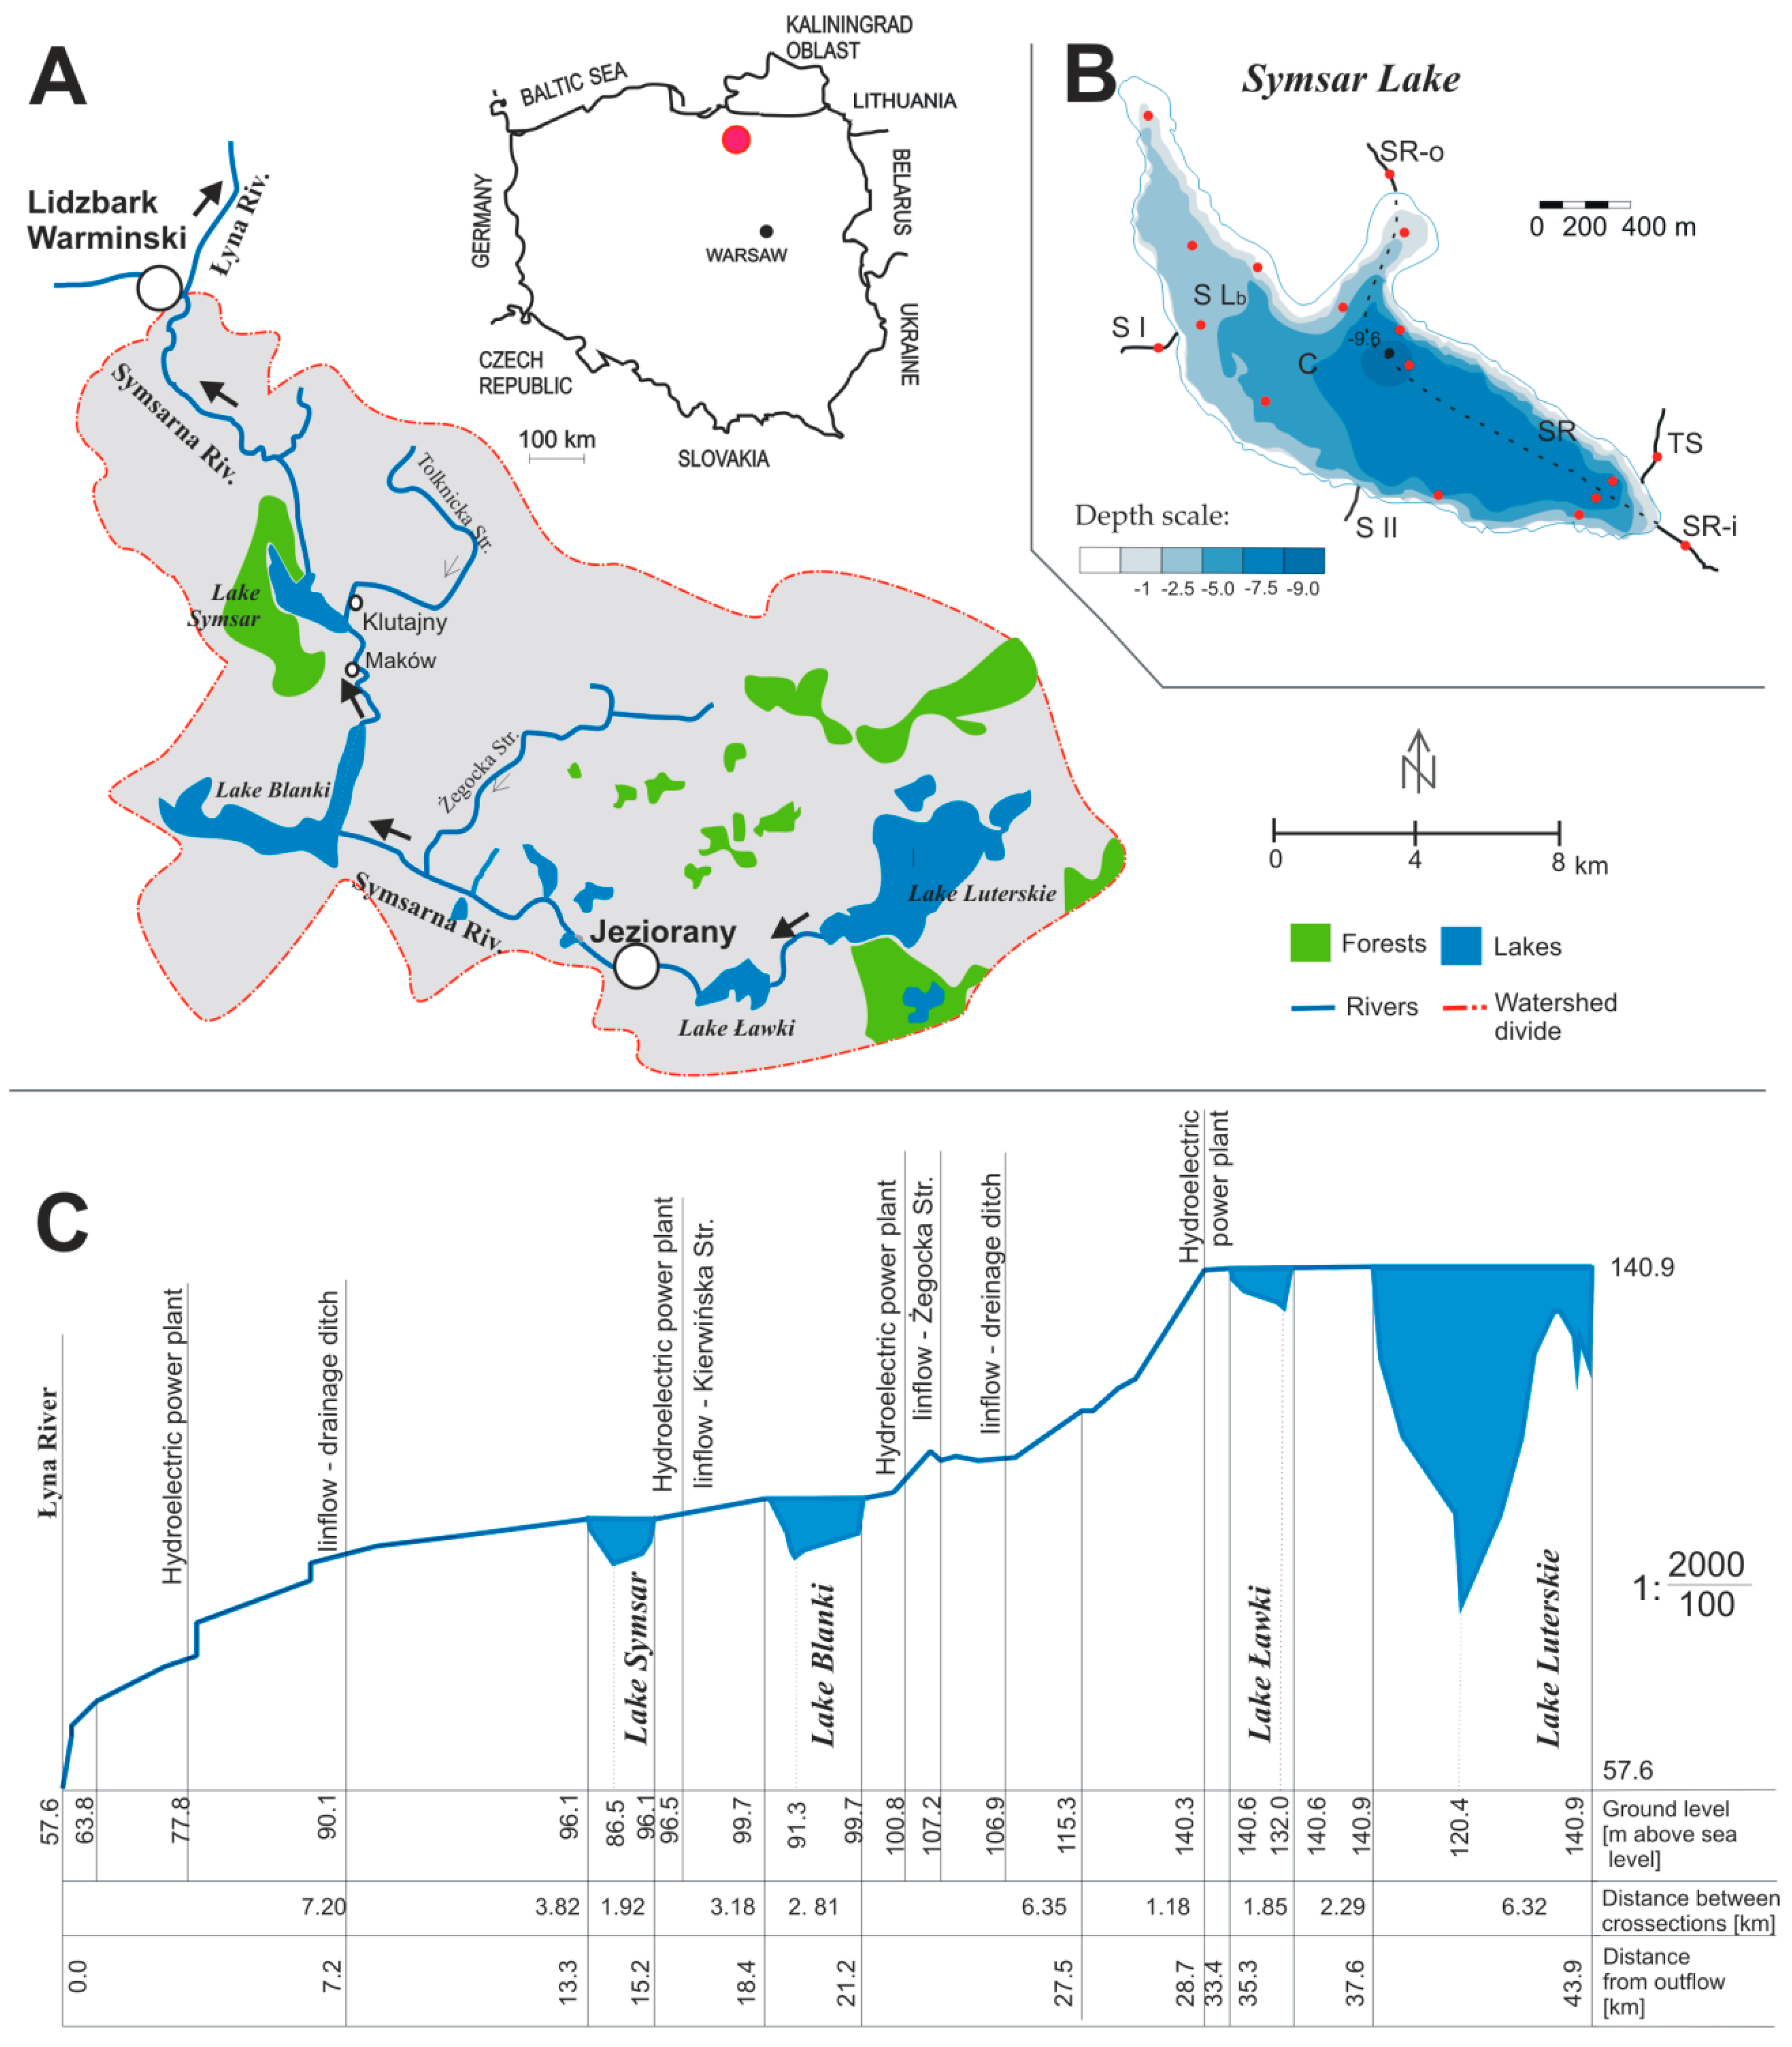
2.1. Study Area and Sampling Sites

A flow-through lake called Symsar Lake was selected to study variations in heavy metal concentrations in bottom sediments. The lake is located in Olsztyn Lakeland (NE Poland). Symsar Lake is of particular ecological importance as its catchment area lies in the Protected Landscape Area of the Symsarna River Valley. The lake has an area of 135.5 ha, average depth of 4.9 m and maximum depth of 9.6 m. Its overall catchment with a total area of 129.1 km2 is occupied mainly by agricultural land, and wetlands account for 10% of its area. The direct catchment has an area of 2.2 km2 and features mostly forests and farmland. The relief of the area was formed by the Warmia ice-sheet lobe of the last glaciation during the Pomeranian phase, and presents diverse landforms and numerous hills. The area is mostly covered by glacial deposits including clays and silts (in the uplands), and fluvioglacial sands and gravels (above the tested lake). Hydrogenic soils prevail in the river floodplain [14]. The main tributary of Symsar Lake is the Symsarna River, which enters the lake in the south and leaves it in the north, in the direction of the Łyna and Pregoła rivers, to the Baltic Sea. The Symsarna River has a length of 57 km. It begins in Luterskie Lake (maximum depth: 20.7 m, average depth: 7.2 m) and intersects the lakes: Ławki (maximum depth: 8.6 m, average depth: 4.1 m), Blanki (maximum depth: 8.4 m, average depth: 5.0 m) and Symsar (see paragraph above). All the lakes are of natural, postglacial origin. The lakes are connected by the Symsarna River, which actively transports deposits between these water bodies, making some of them deeper (like Luterskie Lake) orby contributing to the deposition of the material-shallower (like Ławki Lake). The river flow may lift the matter accumulated at the bottom of successive water bodies and transport it to more remote ones in the system, and the average flow of Symsarna River before inflow to lake was 0.923 m3·s−1 [15]. This feature makes the Symsarna river-lake system peculiar because some of the introduced pollutants undergo transport and deposition in the successive lakes. Symsar Lake, an integral element of the river-lake system in the Symsarna hydrographic network, is the last and lowest-located water body in a cascade of river-fed lakes (Figure 1).
As a result, the accumulation of organic matter of allochthonuous origin in this water body seems insignificant. There are two bays distinguishable in the lake′s morphology: a larger bay in the north and a smaller bay in the north-east where the Symsarna River exits the lake. The analysed lake is also supplied by three smaller watercourses: (1) the Tolknicka Struga ditch; (2) an unnamed stream with a wooded and agricultural catchment (stream I); and (3) and an unnamed stream with an agricultural and forested catchment (stream II). The Tolknicka Struga, flowing out of peatland, is a receptacle of wastewater from the village Klutajny (approx. 295 inhabitants; the village is located on a major traffic route, a regional road). The urban effluents were originally pretreated by a mechanical sewage treatment plant but a new mechanical and biological treatment plant was opened in September 2014.

2.2. Sampling Regime and Analytical Procedure

The study was carried out between November 2012 and October 2014. Samples of the surface layer of bottom sediments were collected from 13 sites located in Symsar Lake. The samples were obtained at a depth of 0–10 cm with an Ekman sampler with a sampling area of 225 cm2. Samples of bottom sediments were also acquired in the Symsarna River at the inflow and outflow from the lake, Tolknicka Struga and stream I. Samples were not collected from stream II due to its rocky bottom.
The samples were dried at room temperature, and their texture was determined with the use of Ø 0.35, Ø 0.30, Ø 0.25, Ø 0.15, Ø 0.12, Ø 0.088, Ø 0.075 and Ø 0.06 mm mesh sieves. The sampled sediment was divided into four grain size fractions: medium sand (Ø 0.25–0.35 mm), fine sand (Ø 0.102–0.015 mm), very fine sand (Ø 0.088–0.06 mm) and silt (Ø < 0.06 mm). The samples (2 g air dry weight) were mineralised in Kjeldahl flasks in a heating block (open system, mineralisation at a temperature of approx. 200 °C). A mixture of nitric acid, 65% analytical grade (HNO3) supplied by CHEMPUR (Poland), and chloric (VI) acid, 70% analytical grade (HClO4) supplied by STANLAB (Poland), in a volume ratio of 1:1, was used for mineralisation. The blank test was performed and certified reference material was analysed using the same reagents. Digestion residues (approx. 1 mL, milky precipitate and pellucid acid above the sediment) were passed through hard filter paper into beakers (500 mL) and replenished with distilled water.
The concentrations of available zinc (Zn), manganese (Mn), iron (Fe), chromium (Cr), copper (Cu), nickel (Ni), cadmium (Cd) and lead (Pb) were determined in triplicates, in the Department of Agricultural Chemistry and Environmental Protection, with the use of an Atomic Absorption Spectrophotometer (AAS-6800 Schimadzu) and an air-acetylene flame. The BGC-D2 (deuterium background correction) was used. Internal standards were applied for analytical quality control. A peak search was performed in the vicinity of the expected analytical lines: Mn—279.5 nm, Cr—357.9 nm, Cu—324.8 nm, Ni—232.0 nm, Cd—228.8 nm, Pb—217.0 nm, Zn—139 nm. The results of the analyses of the certified reference material CRM055-50G (Sewage Sludge Certified Reference Material specified by the ISO Guides 34, 35 and ISO 17025, SIGMA-ALDRICH) were as follows in Table 1.
The geochemical index (Igeo) of sediment samples was calculated with the use of the Müller’s formula [16]:
I g e o = log 2 ( Cm 1.5  GB )
where:
  • Igeo—geochemical index,
  • Cm—concentration of the analysed metal (mg·kg−1),
  • GB—geochemical background (mg·kg−1) [17].
The results were used to divide sediment samples into the following purity classes: Igeo < 0, class 0 (uncontaminated sediments); 0 < Igeo < 1: class I (uncontaminated to moderately contaminated sediments); 1 < Igeo < 2: class II (moderately contaminated sediments); 2 < Igeo < 3:class III (moderately to highly contaminated sediments); 3 < Igeo < 4: class IV (highly contaminated sediments); 4 < Igeo < 5: class V (highly to extremely contaminated sediments); Igeo > 5: class VI (extremely contaminated sediments) [18].
The contamination factor (CF) was calculated with the use of the Müller’s formula [16]:
C F = Cm GB
where:
  • Cm—concentration of the analysed metal (mg·kg−1)
  • GB—geochemical background (mg·kg−1) [17].
The results of CF were used to divide sediment samples into the following purity classes [19]: CF < 1, class I (low contamination); 1 ≤ CF ≤ 3, class II (moderate contamination); 3 < CF < 6: class III (considerable contamination); CF ≥ 6: class IV (very high contamination). The value of the geochemical background, proposed by Bojakiewicz and Sokołowska [17], was determined for samples collected in the investigated area from deeper layers of uncontaminated sediments with a natural content of the studied elements, because the material deposited in the river originated from the same catchment area. In Polish sediments, according to the cited authors, quartz prevails in fractions with >Ø 0.06, whereas carbonates and feldspars occur in smaller amounts. Mineral compounds of the mica/illite group, quartz, kaolinite and chlorites predominate in fine-grained fractions (<Ø 0.06).
The pollution load index (PLI) was calculated from the formula proposed by Bhuiyon et al. [18]:
P L I = ( CF Cu CF Ni CF Cd CF Cr CF Pb ) 1 / 5
The PLI is an experimental index which supports simple comparisons of an average metal content of sediments in a given location [19]. The results of PLI were used to divide sediment samples into the following purity classes [20]: PLI ≥ 1, immediate intervention to ameliorate pollution; 0.5 ≤ PLI ≤ 1, a more detailed study is needed to monitor the site; PLI < 0.5, no drastic rectification measures are needed.

2.3. Statistical Analyses

Significance of differences in heavy metal accumulation and other physical parameters of bottom sediments between different parts of the lake and different watercourses was assessed with a non-parametric analysis of variance: the Kruskal-Wallis’s test (K-W, p ≤ 0.05) followed by the Dunn’s test as a posthoc procedure. Correlations between fractions and heavy metal contents were assessed with the Spearman’s rank correlation analysis. The Euclidean distances were used as a measure of similarity between the sediment sampling sites, while the Ward’s error sum of squares in the hierarchical clustering method was applied to minimise the increase in the within-group variance. The results of the cluster analysis divided sediment samples into three groups based on morphometric indicators (the depth and distance from the inflow of the Symsarna River): SR—sediments in the lake zone intersected by the Symsarna River, C—sediments in the central part of the lake outside the reach of the Symsarna River, SLb—sediments in the northern bay of the lake (Figure 2). Subsequent statistical analyses were based on the classification obtained by the cluster analysis.
The response of the heavy metal accumulation in bottom sediment to environmental conditions was explored using methods of multivariate statistical analysis, such as Principal Component Analysis (PCA). The following environmental factors were considered: (a) the zone of the lake distinguished from the results of the cluster analysis: SR, C, SLb and R—watercourses (see Figure 2); (b) distance from the inflow of the Symsarna River: less than 1 km from the inflow of SR and more than 1 km from the inflow of SR; (c) lake depth with a division into: the littoral zone (up to 3 m deep) and the profundal zone (more than 3 m deep); (d) predominant size fraction responsible for the texture of bottom sediments (medium, fine and very find sand, clay, silt). Denotations in the pie graph illustrating the PCA results; depth: littoral and profundal; fraction: medium sand, fine sand, very fine sand clay, and silt. Data analysis was performed in a Canoco 4.5 software package [21]. The distribution of heavy metals in Symsar Lake was interpolated using the Surfer 8.0 (Golden Software, Inc. Golden, CO, USA) application.

3. Results

3.1. Sediment Texture and Relationships between Fractions and Concentrations of Metals

Sediments in Symsar Lake were composed mainly of medium sand and silt (Table 2), whose average content in bottom sediments was 38.45 and 35.08%, respectively. Fine and very fine sand accounted for 26.47% of bottom deposits (Table 2).
Sediments in the lake zone intersected by the Symsarna River (SR) and in the central part of the lake (C) were characterised by the predominance of medium sand (36.96% ± 7.63%). In the northern bay (SLb), silt was the major fraction, making up 38.71% of bottom sediments. There was a statistically significant difference in the silt content between lake sediments and stream sediments (R, Table 2). The bay’s sediments (SLb) were interpreted separately because the river does not intersect this part of the lake; therefore, the bay's sediments could differ from those deposited in other zones.
Bottom deposits in the watercourses flowing into and out of the lake were characterised by an average content of fine sand at 47.93%, whereas the content of medium sand was slightly lower at 43.92%. Bottom sediments in the Symsarna River (SR) were composed mainly of fine sand whose content in the downstream section (SR-o) was almost twice as high as in the upstream section (I, Table 2). Like in Symsar Lake, medium sand was the main fraction in the bottom sediments of the streams (R), including the Tolknicka Struga and stream I.
A statistically significant correlation was found between the percentage of fine sand fractions and Mn and Cr concentrations in the bottom deposits of Symsar Lake (Table 3). The concentration of Cd was correlated with the content of very fine sand. The silt fraction content was correlated with Cr and Cd concentrations.

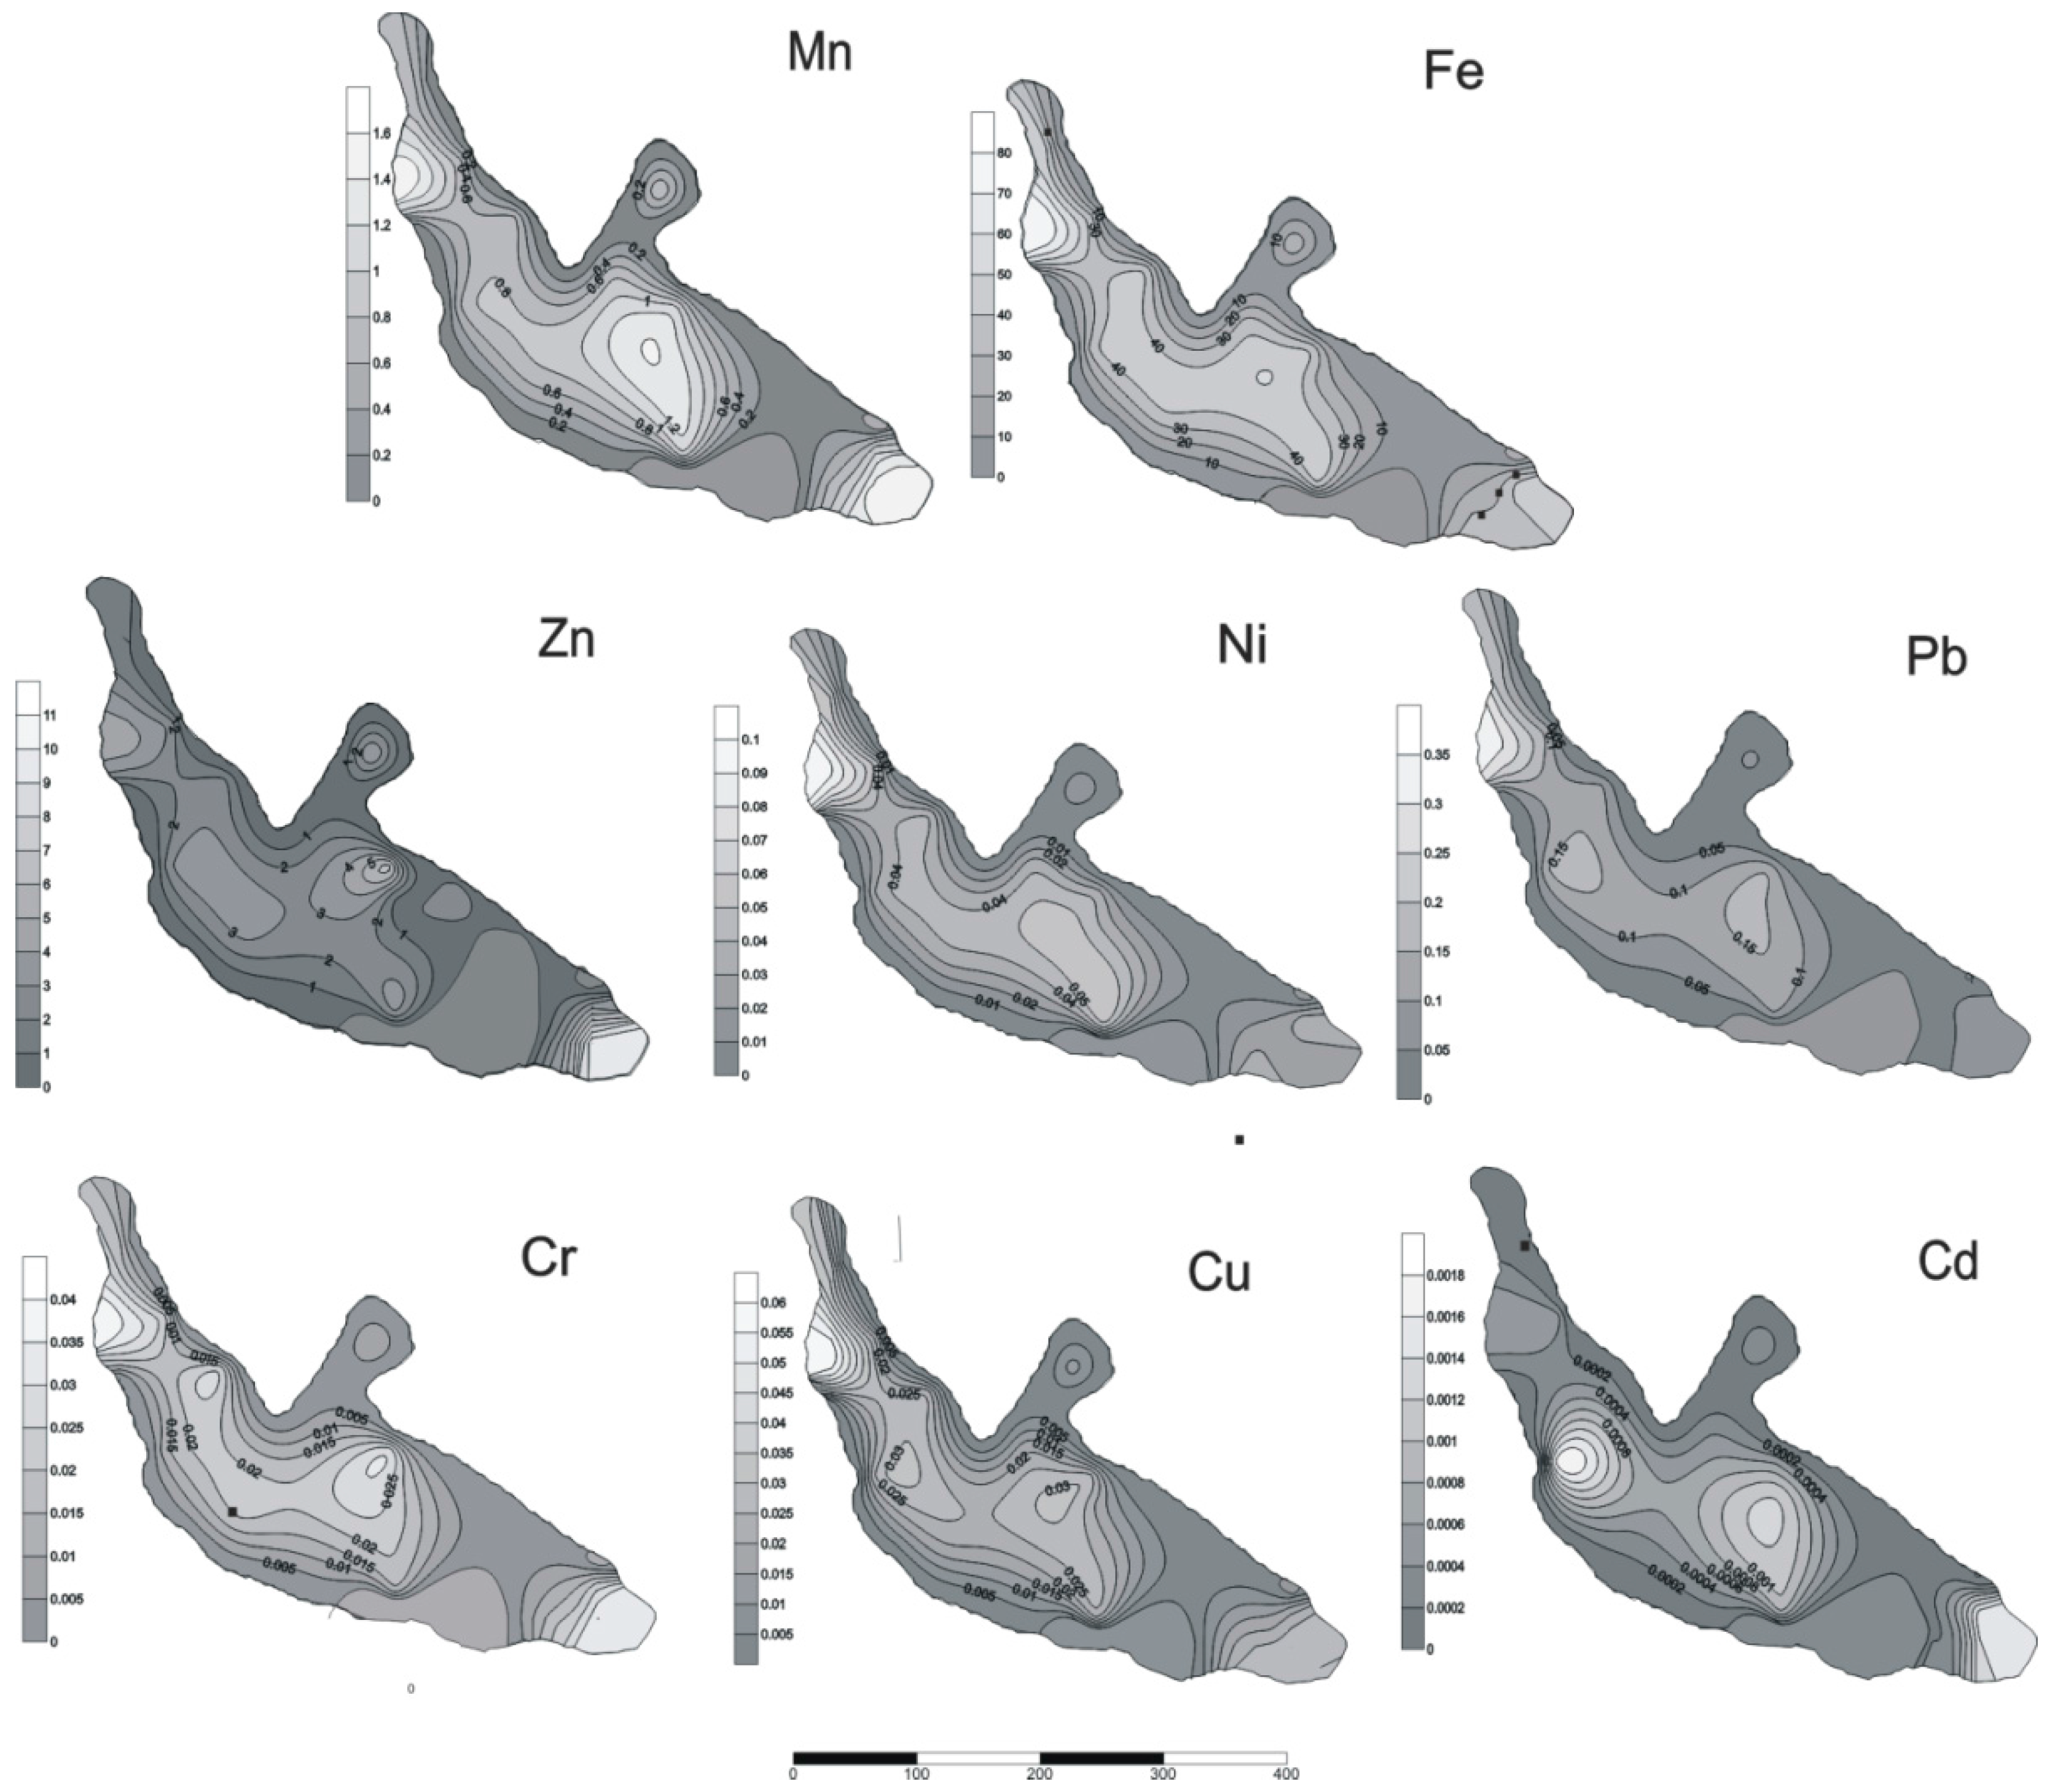
3.2. Heavy Metal Content

The bottom sediments of Symsar Lake were characterised by higher levels of iron, manganese and zinc, and in terms of their contents the heavy metals were ranked as follows: Fe > Mn > Zn > Pb > Ni > Cu > Cr > Cd (Table 4). In turn, iron, manganese and lead dominated in bottom sediments of the Symsarna River, with the metals arranged as follows in respect of their concentrations: Fe > Mn > Pb > Cu > Zn > Ni > Cr > Cd. In the present study, the concentrations of the analysed metals in the bottom sediments of stream I (with a wooded and agricultural catchment) were 24.1% (Fe) to 100% (Cu) higher than in the remaining watercourses (Table 4). The highest accumulation of manganese was noted in the lake zone intersected by the Symsarna River (0.85 ± 0.4 g·kg−1, Table 4).
The results of the Kruskal-Wallis test and the posthoc test revealed a significant difference between the mean Mn concentrations and the distribution of sediments in the lake, in particular between the Mn levels in the lake bay (SLb) and the lake zone intersected by the Symsarna River (SR, at p = 0.048).
Manganese concentrations were lower in the bottom sediments of the watercourses (R) feeding into Symsar Lake than in the lake itself. Similarly to Mn, bottom sediments in the SR zone were characterised by higher average levels of Cd and Cr in comparison with the average values for the entire lake (Figure 3). Bottom sediments in the central part of Symsar Lake, outside of the area affected by the Symsarna River, with an average depth of 5 m, were characterised by lower concentrations of the analysed metals.
The results of the Dunn’s test revealed a statistically significant difference between cadmium levels in the bottom sediments of the watercourses and in the bay (at p = 0.029), where cadmium accumulation in the bottom sediments of the streams was four-fold higher than in the bay. Statistically significant differences were observed in chromium concentrations between the bottom sediments of the watercourses and the SR zone (at p = 0.005): chromium accumulation in the bottom sediments of the streams was approximately 65.8% lower than in the entire lake.
The only exception was nickel, whose concentrations were 31.4% higher in the upstream section of the Symsarna River in comparison with the remaining sites. In the bottom deposits of the downstream section of the Symsarna River, the average content of the analysed metals decreased to 75.0% (Mn), whereas an increase was observed in the concentrations of Cr (×2) and Cd (×2.5).
This resulted from differences in the textural composition of bottom deposits. Chromium and cadmium formed complexes with the finer fractions, and their share increased after flowing through the lake (heavier particles fell to the bottom, Table 4). However, the content of the analysed heavy metals varied: Cr dominated in the lake’s sediments (L) and Cd—in the river’s sediments (R).

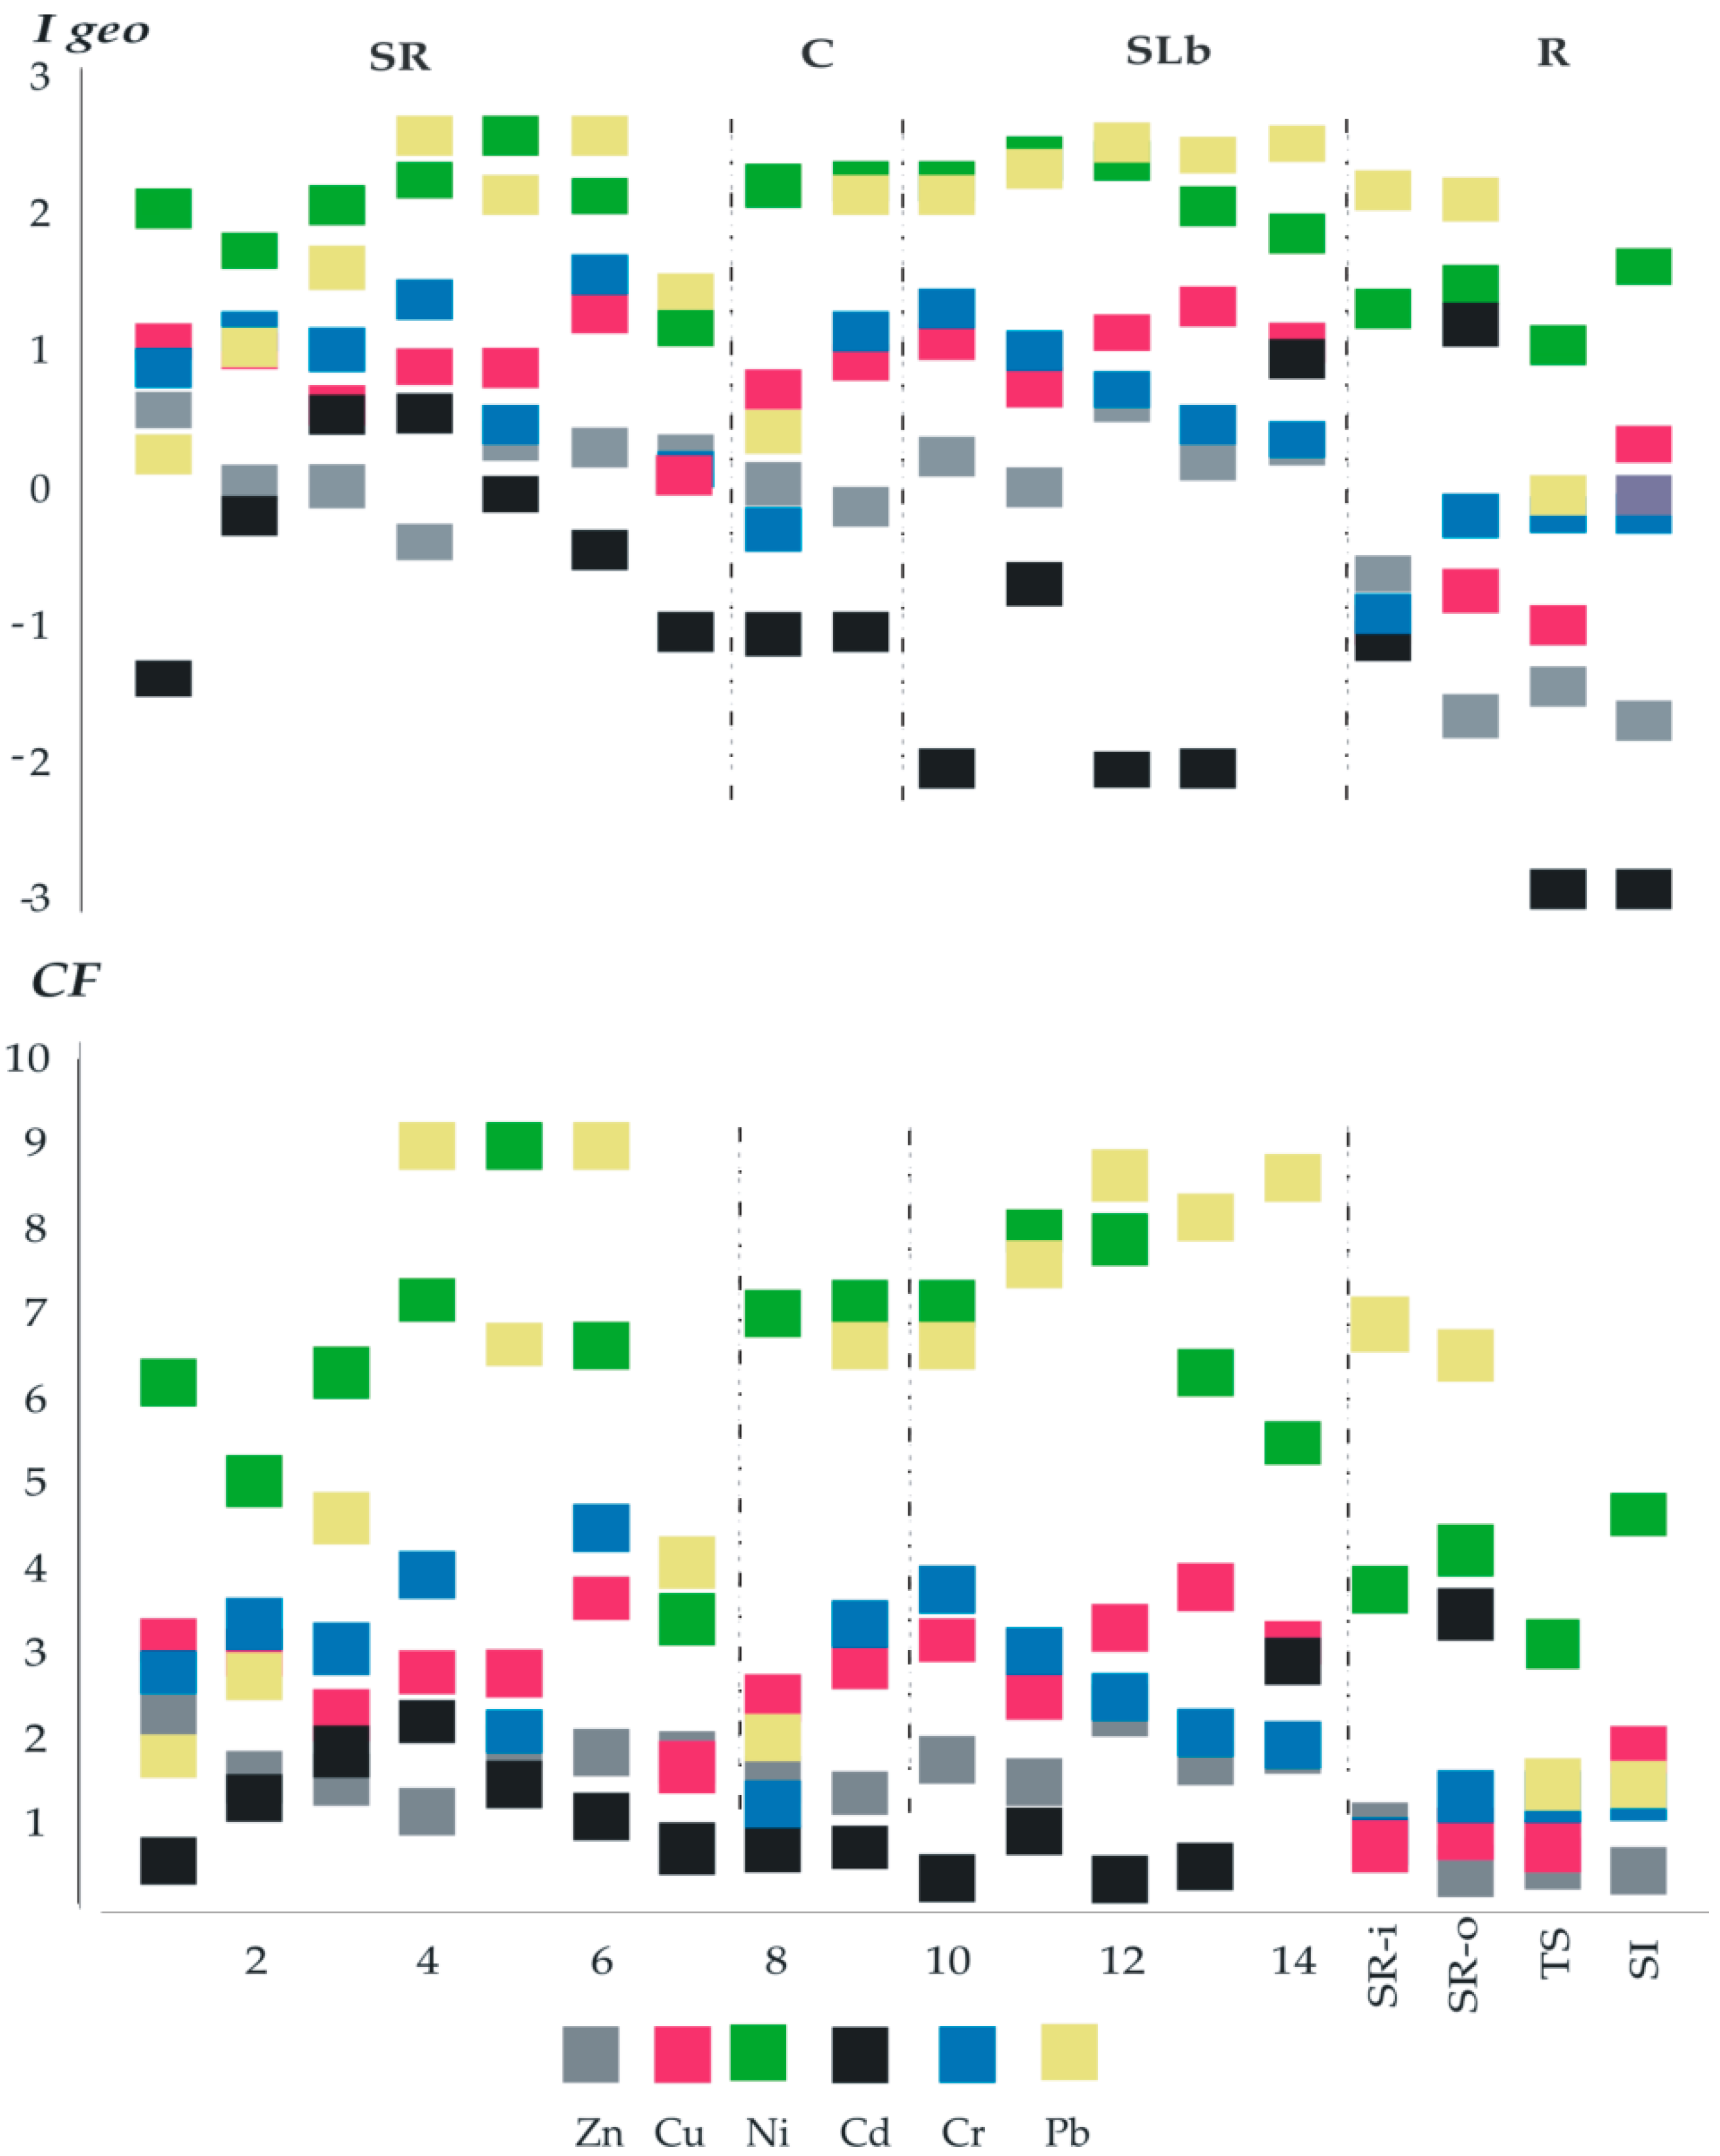
3.3. Contamination Classes of Bottom Sediments (Igeo, CF, PLI)

The bottom sediments of Symsar Lake were classified between uncontaminated to moderately contaminated in the case of most of the metals based on Igeo classification (Igeo < 1, Figure 4). Riverbed sediments were classified as uncontaminated based on values of most metals, and moderately contaminated due to the Cd concentration. Based on the values of CF, the bottom sediments were classified as more contaminated than based in the geochemical index value. The highest CF values were noted for contamination with Pb and Ni; hence, according to this indicator, the evaluated sediments were classified as highly contaminated (class VI), especially based on concentrations of these metals in the bay’s sediments.
Indicator CF is more restrictive in classification of sediments, thus the PLI index may be a decisive indicator, suggesting possible actions. The pollution load index (PLI) was slightly higher in the sediments of Symsar Lake than in the river deposits (L-2.87 vs. R-1.56). This suggests taking immediate action to counteract the degradation of the water body.

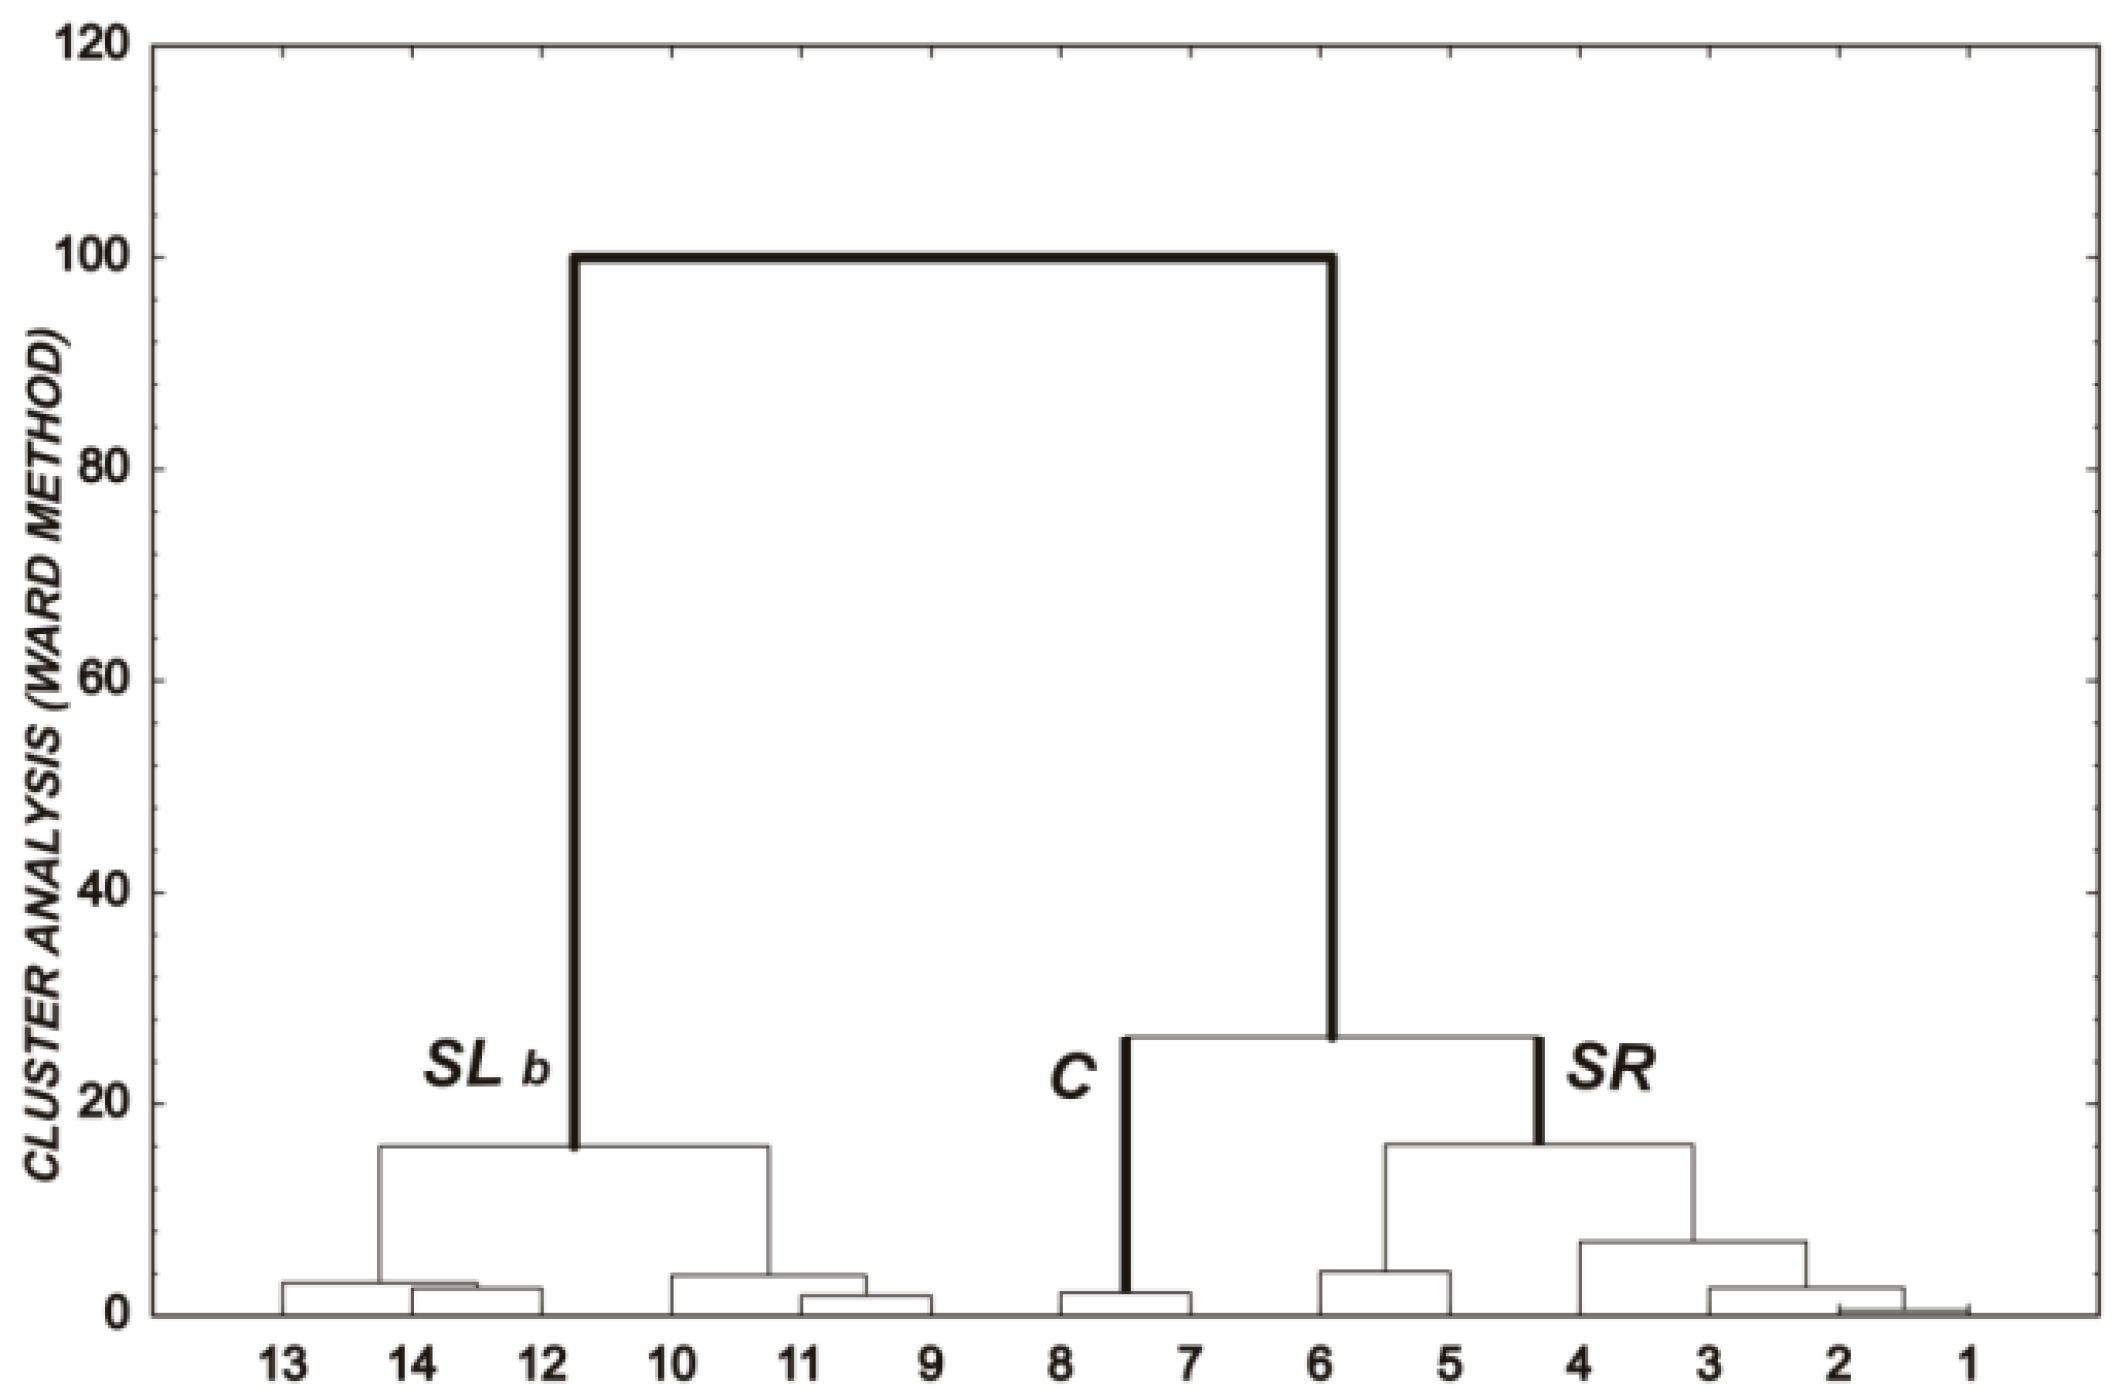
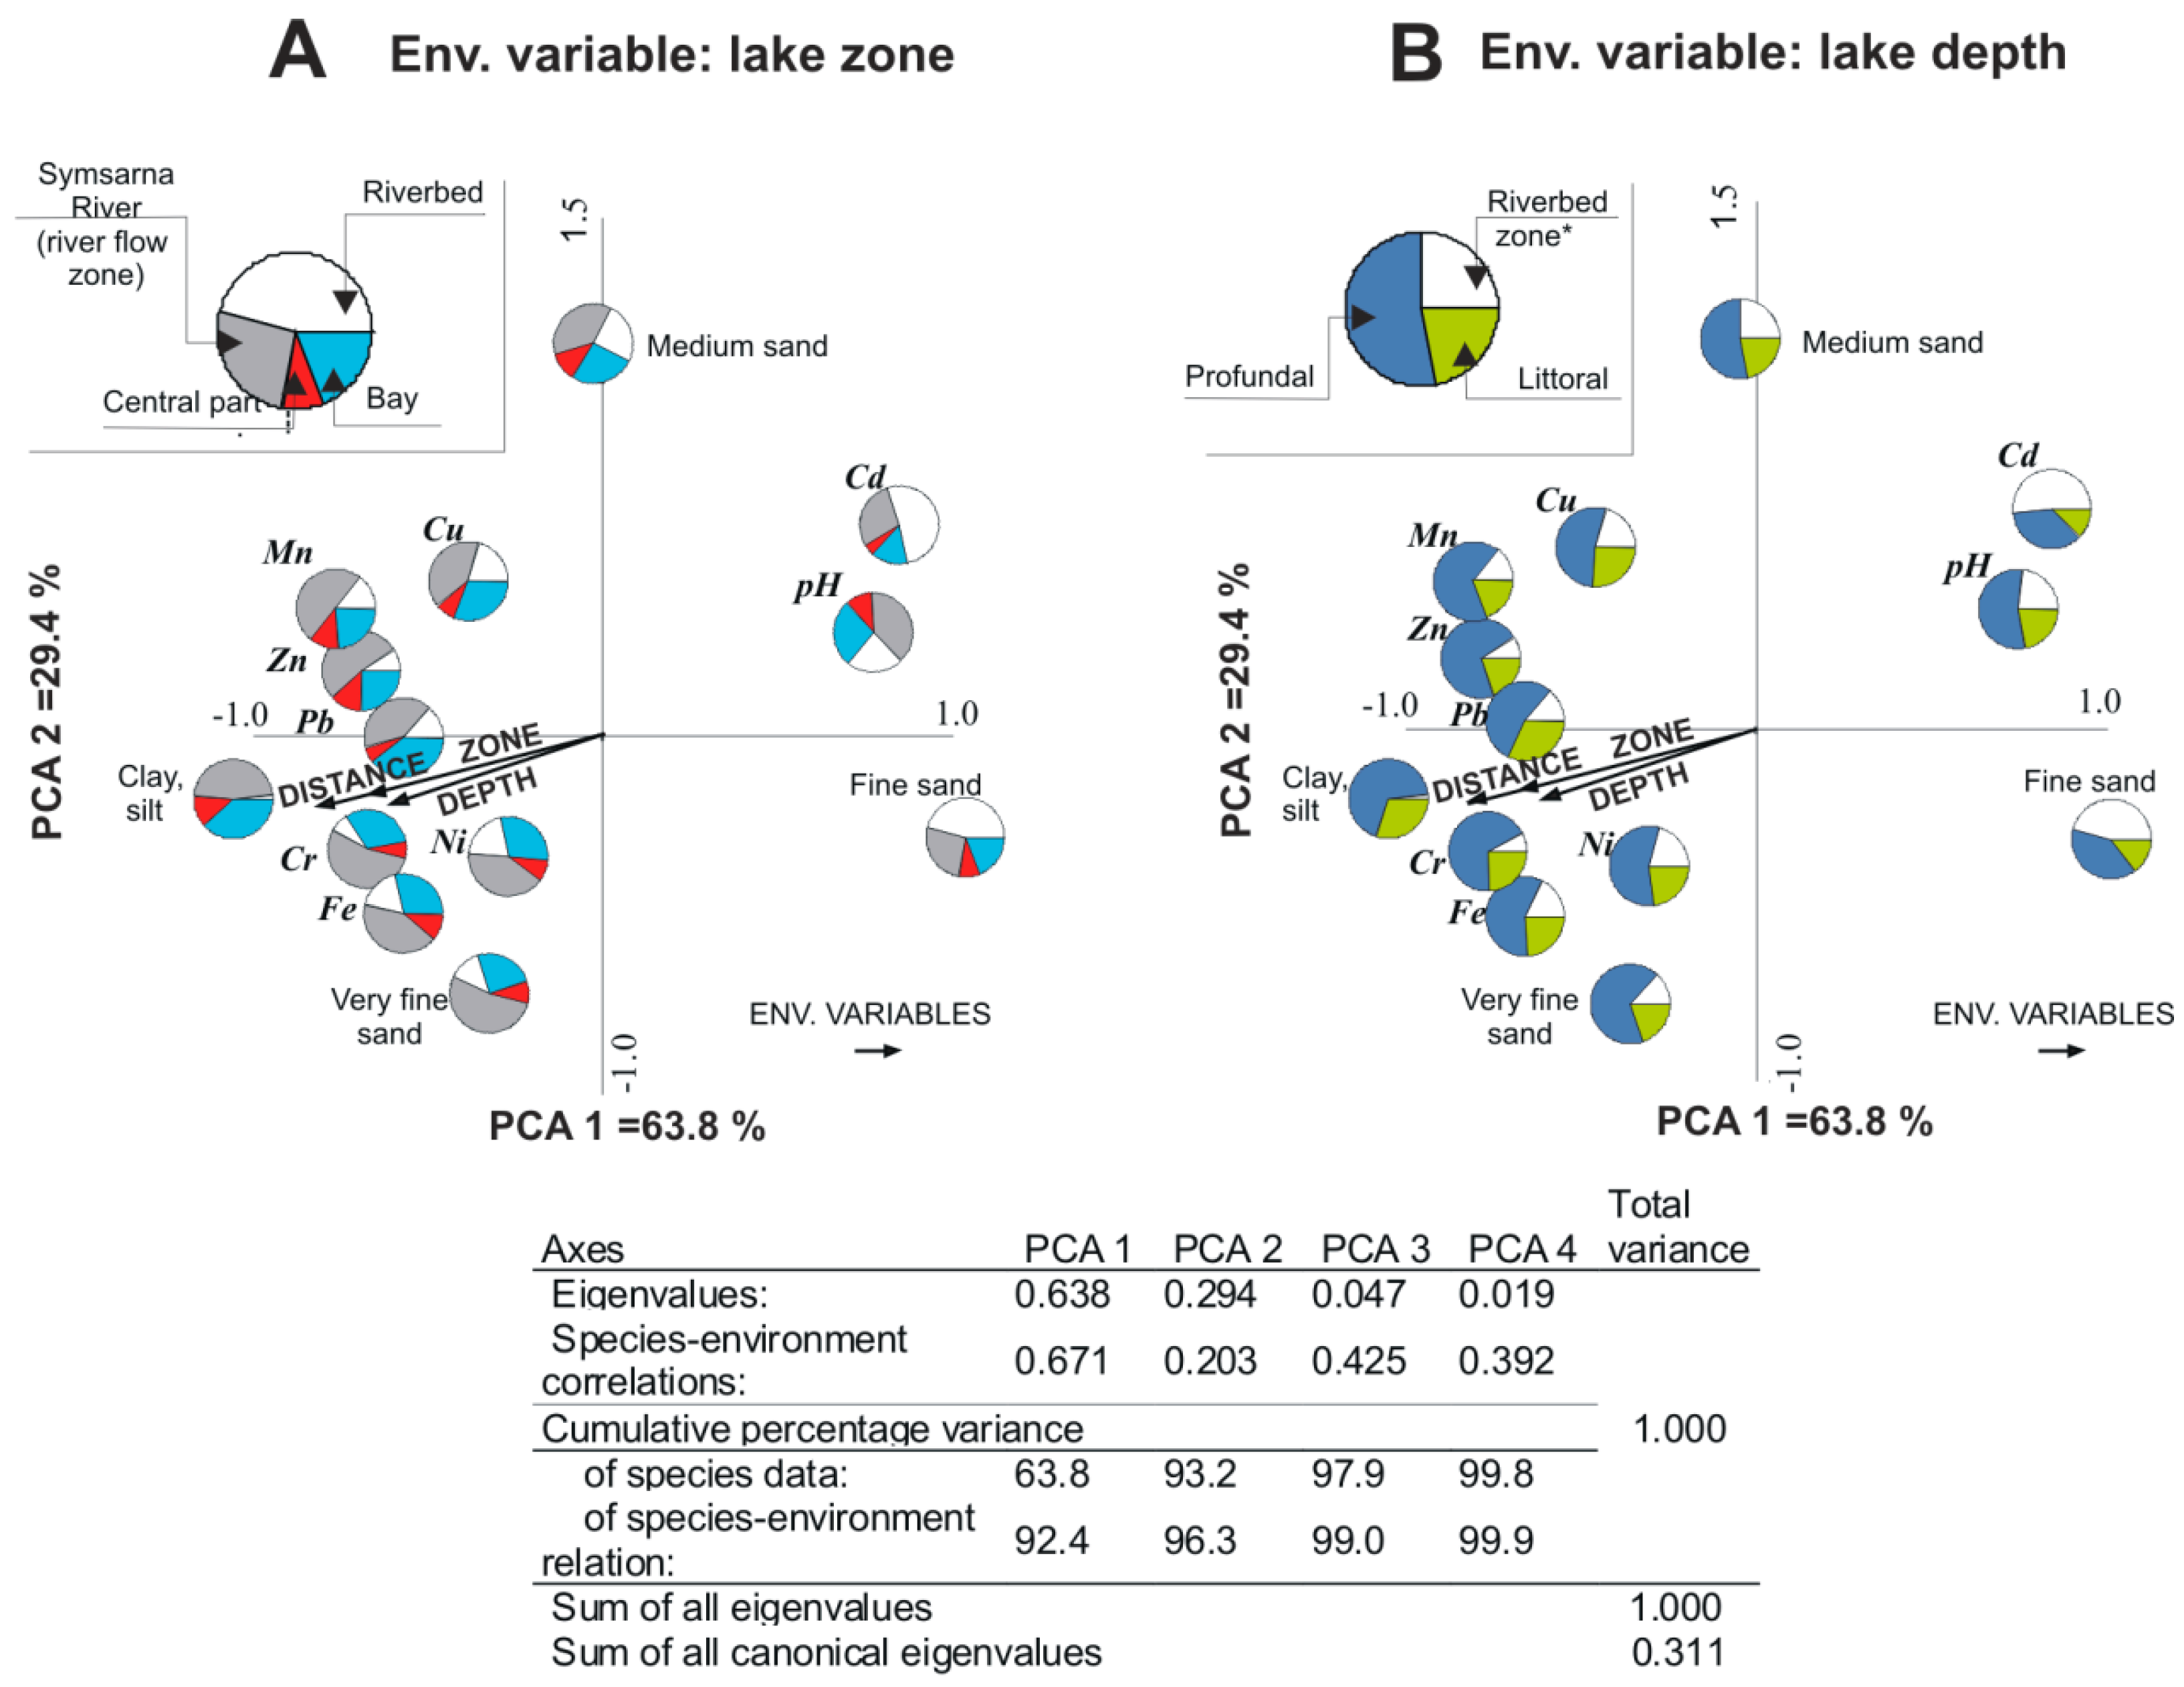
3.4. Multivariate Analyses

Principal component analysis was carried out based on the content of eight metals (Cr, Mn, Fe, Pb, Cu, Ni, Cd and Zn) in bottom sediments and three environmental variables (depth, zone, distance). The two analysed PCA axes explained 93.2% of the variation in the content of the tested metals relative to the environmental factors (Figure 5) such as the zone and distance. The first axis (PCA 1) was highly correlated with the environmental data (63.8%), while the second axis (PCA 2) showed a considerably lower correlation (29.4%).
Based on the principal components analysis (PCA), we observed a positive correlation between the content of manganese, zinc, lead and copper in surface bottom sediment and also between chromium, iron, nickel concentrations and clay fraction. The correlations of these metals could evidence their similar sources. In turn, a negative correlation of cadmium and pH with the three environmental factors was observed. The content of Zn, Mn and Pb (positive correlation) and Cd (negative correlation) depended on the location of sediments in the lake (the zone), and the elements (except Pb) dominated mainly in sediments located along the flow of waters from the Symsarna River. Along with the distance from the inflow of the Symsarna River to Symsar Lake (the distance), a positive correlation with Mn and a negative one with Cd were observed, and also with fine sand and medium sand fraction. The Cr and Zn content increased with the increasing depth.

4. Discussion

Our results confirmed the hypothesis according to which multiple lake systems were limiting the transport of heavy metals from the catchment area. The example of Symsar Lake shows that the lowest location along the river course makes this lake the most important link in a river-lake chain system. The lake’s role is to accumulate a significant portion of pollutants flowing out from the catchment area and thus to protect the recipient river located beneath the lake (the Łyna River) from the excessive load of pollutants discharged by the Symsarna River. At the same time, a question arises about the lake ecosystem’s health, which seems to be gradually deteriorating due to the unbalanced input and output of toxic substances. In consequence, the role of a lake as a biogeochemical barrier for the heavy metals may lead simultaneously to a grave deterioration of the ecosystem. One of the attributes of postglacial lakes is that they often belong to lake-river systems, which ensure free inflow and outflow of water. Such lakes are characterised by diverse morphology and developed shoreline, which affect the grain-size composition of bottom sediments, and this in turn, to some extent, influences the content of heavy metals. Our results supported the data obtained by Thevenon et al. [22] from a study performed on a river feeding Lake Geneva, suggesting that differences in the metal content are related to the distance between sampling sites and the river inflow, lake depth (littoral and profundal zones) as well as the location of sampling points along the river course within the lake or outside the reach of the river. Thus, the spatial distribution of the heavy metals studied depends on the intensity of water exchange in the water body, which is a medium responsible for the substance input and output. Beside the transportation and retention roles, the river is therefore a factor that significantly modifies the bottom structure, including organic and mineral composition, in a cascade of flow-through lakes [2,15].
Bottom sediments of Symsar Lake are built mainly of medium sand and silt, in contrast to the lakes located upstream, whose sediments are more abundant in organic matter [4]. The grain-size structure of the sediments was related to their location, i.e., the shares of very fine sand (by 49.0%) as well as medium sand (by 5%) increase closer to the inflow of the Symsarna River into the lake. We inferred that the river is able to deliver and deposit bigger fractions soon after mouth to the lake, because both the weight of medium sand and the drop in the river energy makes it impossible to transfer them further into the lake. The profundal sediments are characterised by clayey structure, low organic matter content, and anaerobic conditions that eliminate biological life. Waves and variations of the lake’s level do not affect the profundal sediments as strongly as the littoral deposits [23]. The significant increase in the very fine fraction (by 7.3%) was noted along with the distance from the inflow. In other parts of the lake, out of the river trait along the lake, very fine fractions dominated, as well. However, their presence, particularly in the bay zones, should be related to the areal flow from the surrounding catchment area. This explains the presence of loams and gravels close to the river outlet, where the lake is surrounded by morainic hills [24,25]. Similar results were obtained for example by Szalińska et al. [26], who reported more than 25% of coarser grains in the deposits in the Detroit River before the inflow into Huron Lake and Lake St. Clair than in sediments in the downstream sections. Although anthropogenic factors are commonly known as deteriorating aquatic ecosystems, Skwierawski et al. [27] indicated their contribution to the accumulation of heavy metals mainly in the surface layer of bottom deposits. These authors reported that heavy metal content in the sediment reflected the influence of land-use type in the catchment area, while Macintosh et al. [28] indicated the role of soil type in this process.
In this paper we focused on the distribution of heavy metals in a water body as determined by the transport and sedimentation of fine particles carried by external sources [29]. The evidence for the role of a river and a likely groundwater supply as sources of Zn, Mn, Cd and Ni deposited in the lake sediment showed significantly higher values (by 29.2%, 29.8%, and 60.0% respectively) along the course of the river flow than in other parts of the lake, which is in accord with the findings of Leyden et al. [30]. In a study on heavy metal speciation in bottom sediments of the Tsurumi River, characterised by similar catchment conditions (length of river and catchment area) [31], the highest geochemical indices were reported for Zn, Cu, Cd, and also Pb (0 > Igeo > 2).
Although rivers have long been considered as external sources of pollutants (mainly nutrients) in lakes, numerous studies have reported contribution of lake sediments as an internal source of contaminants to overlying waters [32,33]. Lu and Chenga [34] reported that heavy metal accumulation in lake sediments is not always correlated with anthropogenic pollution and is often strongly determined by the local geochemical background. The presence of both Fe and Mn in water and consequently in sediments could be due to their ability to form complexes with humic compounds [35,36]. An increase in the concentration of iron in water depends on the ability of iron ions to precipitate in alkaline and oxidising conditions [37]. Manganese is likely to originate from dissolved bicarbonate and manganese sulphate in peat bogs in the upstream inflow to Symsar Lake, where anaerobic conditions prevail, and then it could be released from the sediments to water. The Symsarna River is responsible for the transport of Mn to the lake, where it could re-accumulate at the bottom, following oxidation [38]. This fact confirms the role of the main river as a key factor responsible for the heavy metal delivery to the lake. Other studies have demonstrated that the mobility of manganese in water is determined by absorption and resorption processes [39]. Under certain conditions, heavy metals are released from sediments and lead to secondary contamination of water.
Particular attention should be paid to Cd, which shows a reverse correlation between its content in the lake sediment and the river sediment. The river sediment was four times more abundant in Cd than the lake sediment. The PCA showed that in the littoral zone, in the site located near the inflow of the river, there was approx. 62% more Cd than further from the inflow. In the case of Mn, approx. 25.8% more of this element was observed in the littoral than in the profundal zone. The sources of Cd are anthropogenic. The high content of bottom deposits was due to the fact that the analysed metal formed complexes with hydrated iron and manganese oxides, as well as with organic matter [40]. The sorption of this metal depends on pH [41]. The cadmium content of bottom sediments in Lake Symsar was below the geochemical background.
The content of Pb in the lake deposits varied across the lake. However, lead concentrations were the highest in samples from the bay, somewhat separated from the main lake, where they exceeded those stated in other parts of the lake by 38.9%. Lead is likely to be delivered to the bay as a result of areal flow from the nearby morainic hills. The increased Pb content in samples taken from the littoral zone, higher by 54.4% than in the profundal zone, can be associated with the proximity of the sampling sites to provincial roads with relatively high traffic, as reported by Skorbiłowicz and Skorbiłowicz [42]. In line with European Union law, leaded gasoline has not been used in Poland since 2005, but lead could have been accumulating in sediments for a long time. The same authors attributed a higher nickel content in the sediments to the location of a municipal waste dump in the vicinity of the Horodnianka River. Similar relations are observed in the Symsarna River, where elevated concentrations of Ni were determined in sediment samples taken from the upstream section of the river, which should be attributed to the location of many waste dump sites in the lake’s direct catchment.
A correlation was observed between the content of Cr and Zn in bottom sediments and the depth of the lake. The chromium content of sediments in streams was similar to its background content. In the profundal zone, approx. 12.7% more Cr and approx. 44.0% more Zn were accumulated than in the littoral, which contradicts the role of Symsarna River in the import of these components: about three-fold less of these metals occurred in the riverbed than in the lake’s bottom sediments. In effect, the concentration of these metals was correlated with fine fraction in the deep zone. In the profundal zone, where clayey sediments dominate, assimilation of heavy metals in finer deposits is generally higher than in sandy sediments [43]. The texture of the bottom sediments in the Ninjing River and Lake Taihu, which is supplied by that river, was correlated with heavy metal concentrations (mostly with the clay fraction and the sand fraction) [44]. The bottom sediments of the lake were moderately contaminated, mostly with Pb and Ni, but the noted heavy metal concentrations did not pose a threat to living organisms, although toxic effects on aquatic organisms is already observed at a concentration of 0.1 ppm [45]. Lake Symsar is undergoing gradual degradation. Arresting heavy metals in the lake’s water and sediments promotes self-cleaning of the river’s water and reduces the transport of harmful substances outside the catchment area. Some quantities of the metals, in addition to being suspended in water or accumulated in the sediment, can be absorbed by macrophytes or water organisms. Therefore, in the long term, it seems necessary to perform examinations of the fish fauna of the tested lake. Skilful management of the basin, through the use of a biogeochemical barrier, e.g., by separating transport routes from the immediate coastline, can reduce the surface runoff of metals. In turn, proper fertilisation practice as well as regulated water and sewage management in the river basin may reduce metal contamination in mid-water rivers and lakes. However, it is expected that lakes in river-lake systems will act as filters, which in the future will limit their recreational use, but this will reduce the cross-border transport of pollutants.

5. Conclusions

The heavy metal content of bottom sediments could be indicative of natural processes in the catchment area, including weathering, as well as of the role played by rivers in the transport and accumulation of sediment substances, but only in the case of some metals: Zn, Mn, Cd and Ni. Heavy metal concentrations also testify to the natural response of ecosystems to environmental stressors, including the temporary elimination of toxic metals from circulation and their deposition. The heavy metal content is also affected by anthropogenic factors, including sewage discharges, the agricultural use of the catchment area and the location of regional roads. Sedimentation can limit the dispersion of heavy metals outside the aquatic ecosystem.
Lakes, as elements of river-lake systems, can act as a filter and contribute to the self-purification of a flowing river. The lake we examined inhibited the dispersion of pollutants outside the catchment area via the Symsarna River, thus contamination levels of manganese, for example, decreased. An increase in the content of some metals such as chromium and cadmium observed after water had passed through the lake depended on the ability of these metals to form stable complexes with fine fractions of bottom sediments.

Acknowledgments

This study was financially supported by the National Scientific Center, Poland, Grant No. 2015/19/N/ST10/01532.

Author Contributions

Angela Kuriata-Potasznik developed the concept of the study, field study design, wrote the manuscript and provided funding for editorial support. She performed hydrochemical analyses, provided interpretation of data and verified laboratory database. Andrzej Skwierawski, Ireneusz Cymes and Sławomir Szymczyk performed field research including data collection and data analysis. Katarzyna Glińska-Lewczuk supported interpretation of statistical analyses and helped in the manuscript draft preparation. All authors approved the final version before submission.

Conflicts of Interest

The authors declare no conflict of interest.

References

  1. Glińska-Lewczuk, K. Effect of land use and lake presence on chemical diversity of the Łyna river system. Pol. J. Environ. Stud. 2006, 15, 259–269. [Google Scholar]
  2. Iwuoha, P.O.; Adiela, P.U.; Nwannah, C.C.; Okeke, O.C. Sediment source and transport in river channels: Implications for river structures. Int. J. Eng. Sci. 2016, 5, 19–26. [Google Scholar]
  3. Obolewski, K.; Glińska-Lewczuk, K. Distribution of heavy metals in bottom sediments of floodplain lakes and their partent river—A case study of the Słupia. J. Elementol. 2013, 18, 673–682. [Google Scholar]
  4. Sparks, D.L. Toxic metals in the environment: the role of surfaces. Elements 2005, 1, 193–197. [Google Scholar] [CrossRef]
  5. Pintilie, S.; Brânză, L.; Bețianu, C.; Pavel, L.V.; Ungureanu, F.; Gavrilescu, M. Modelling and simulation of heavy metals transport in water and sediments. Environ. Eng. Manag. J. 2007, 6, 153–161. [Google Scholar]
  6. Zhang, C.; Yu, Z.; Zeng, G.; Jiang, M.; Yang, Z.; Cui, F.; Zhu, M.; Shen, L.; Hu, L. Effect of sediment geochemical properties on heavy metal bioavailibility. Environ. Int. 2014, 73, 270–281. [Google Scholar] [CrossRef] [PubMed]
  7. Saeedi, M.; Li, L.Y.; Karbassi, A.R.; Zanjani, A.J. Sorbed metals fractionation and assessment of release in river sediment and particulate matter. Environ. Monit. Assess. 2013, 185, 1737–1754. [Google Scholar] [CrossRef] [PubMed]
  8. Connell, D.W.; Miller, G.J. Chemistry and Ecotoxicology of Pollution; John Wiley & Sons: New York, NY, USA, 1984. [Google Scholar]
  9. Selvam, G.G.; Baskaran, R.; Mohen, P.M. Microbial diveristy and bioremediation or distillenes effluent. J. Res. Biol. 2011, 3, 153–162. [Google Scholar]
  10. Branza, L.; Dring, M.; Gavrilescu, M. Biosorption of Cu2+ ions from aqueous solution by Enteromorpha sp. Environ. Eng. Manag. J. 2005, 4, 41–50. [Google Scholar]
  11. Gavrilescu, M. Removal of heavy metals from environment by biosorption. Eng. Life Sci. 2004, 4, 219–232. [Google Scholar] [CrossRef]
  12. Oyarzun, R.; Lillo, J.; Higueras, P.; Oyarzún, J.; Maturana, H. Strong arsenic enrichment in sediments from the Elqui watershed, northern Chile: industrial (gold mining at El Indio-Tambo district) versus geologic processes. J. Geochem. Explor. 2004, 84, 53–64. [Google Scholar] [CrossRef]
  13. Ruhman, M.S.; Saha, N.; Molla, A.H.; Al-Reza, S.M. Assessment of Anthropogenic Influence on Heavy Metal Contamination in the Aquatic Ecosystem Components: Water, Sediment and Fish. Soil Sediment Contam. 2014, 23, 353–373. [Google Scholar] [CrossRef]
  14. Glińska-Lewczuk, K. Komentarz do Mapy Hydrograficznej w Skali 1:50 000 Arkusz Lidzbark Warmiński (N-34-66-C); Główny Urząd Geodezji i Kartografii, GEPOL: Poznań, Poland, 2011. (In Polish) [Google Scholar]
  15. Potasznik, A.; Szymczyk, S. Magnesium and calcium concentrations in the surface water and bottom deposits of a river-lake system. J. Elementol. 2015, 20, 677–692. [Google Scholar] [CrossRef]
  16. Müller, G. Index of geo-accumulation in sediments of Rhine River. Gojound 1969, 2, 108–118. [Google Scholar]
  17. Bojakowska, I.; Sokołowska, G. Geochemiczne klasy czystości osadów wodnych. Prz. Geol. 1998, 46, 49–54. (In Polish) [Google Scholar]
  18. Bhuiyon, M.A.H.; Parvez, L.; Islam, M.A.; Dampare, S.B.; Suzuki, S. Heavy metal pollution of coal mine-affected agricultural soils in the northern part of Bangladesh. J. Hazard. Mater. 2010, 173, 384–392. [Google Scholar] [CrossRef] [PubMed]
  19. Usero, I.; Garcia, A.; Fraidias, J. Calidad de Lasaquas y Sedimentos del Litoral Andaluz, inc Junta de Andalicia; Consejeria del Medio Ambiente: Sevilla, Spain, 2000; p. 164. [Google Scholar]
  20. Likuku, A.S.; Mmolawa, K.B.; Gaboutloeloe, G.K. Assessment of heavy metal enrichment and degree of contamination around the copper-nickel mine in the Selebi Phikwe region, Eastern Botswana. Environ. Ecol. Res. 2013, 1, 32–40. [Google Scholar]
  21. Ter Braak, C.J.F.; Smilauer, P. CANOCO Reference Manual and CanoDraw for Windows User's Guide: Software for Canonical Community Ordination (version 4.5); Microcomputer Power: Ithaca, NY, USA, 2002; p. 500. [Google Scholar]
  22. Thevenon, F.; Graham, N.D.; Chiaradia, M.; Arpagaus, P.; Wildi, W.; Poté, J. Local to regional scale industrial heavy metal pollution recorded in sediments of large freshwater lakes in central Europe (lakes Geneva and Lucerne) over the last centuries. Sci. Total Environ. 2011, 412, 239–247. [Google Scholar] [CrossRef] [PubMed]
  23. Yan, D.; Wunnemann, B. Late Quaternary Water depth changes in Hele Lake, northeastern Tibetan Plateau, delivered from ostracord assemblages and sediment properties in multiple sediment record. Quat. Sci. Rev. 2014, 95, 95–114. [Google Scholar] [CrossRef]
  24. Kondracki, J. Geografia Regionalna Polski; Polish Scientific Publishers (PWN): Warszawa, Poland, 2002; p. 445. [Google Scholar]
  25. Czajkowska, A. Stopień zanieczyszczenia związkami biogennymi płytkich wód podziemnych w zagospodarowanej rolniczo części zlewni Bierawki. Assessment of biogenic compounds pollution of shallow underground water in agricultural managed part of Bierawka river basin. Górnictwo Geol. 2010, 5, 91–103. [Google Scholar]
  26. Szalińska, E.; Graciak-Mannion, A.; Haffner, D.; Droullard, K.G. Assessment of decadal changes in sediment contamination in a large connecting channel (Detroit River, North America). Chemosphere 2013, 93, 1773–1781. [Google Scholar] [CrossRef] [PubMed]
  27. Skwierawski, A.; Sidoruk, M. Heavy metal concentrations in the sediment profiles of the antropogenically transformed Płociduga reservoir. Ecol. Chem. Eng. S 2014, 21, 79–88. [Google Scholar]
  28. Macintosh, K.A.; Griffiths, D. Catchment and in-stream influences on metal concentration and ochre deposit density in upland streams. Environ. Earth Sci. 2013, 70, 3023–3030. [Google Scholar] [CrossRef]
  29. Song, Y.; Ji, J.; Yang, Z.; Mao, C.; Frost, R.L.; Ayoko, G.A. Geochemical behavior assessment and apportionment of heavy metal contaminations in the bottom sediments of lower reach of Changjiang River. Catena 2011, 85, 73–81. [Google Scholar] [CrossRef]
  30. Leyden, E.; Cook, F.; Hamilton, B.; Zammit, B.; Barnett, Z.; Lush, A.M.; Stone, D.; Mosley, L. Near shore groundwater acidification during and after a hydrological drought in the Lower Lakes, South Australia. J. Contam. Hydrol. 2016, 189, 44–57. [Google Scholar] [CrossRef] [PubMed]
  31. Mohiuddin, K.M.; Zakir, H.M.; Otomo, K.; Sharmin, S.; Shikazono, N. Geochemical distribution of trace metal pollutants in water and sediments of downstream of an urban river. Int. J. Environ. Sci. Technol. 2009, 7, 1728–2010. [Google Scholar] [CrossRef]
  32. Sondergaard, M.; Jeppesen, E.; Lauridsen, T.L.; Skov, C.; Van Nes, E.H.; Roijackers, R.; Lammens, E.; Portielje, R. Lake restoration: Successes, failures and long-term effects. J. Appl. Ecol. 2007, 44, 1095–1105. [Google Scholar] [CrossRef]
  33. Madison, A.S.; Tebo, B.M.; Mucci, A.; Sundby, B.; Luther, G.W. Abundant pore water Mn (III) is a major component of the sedimentary redox system. Science 2013, 341, 875–878. [Google Scholar] [CrossRef] [PubMed]
  34. Lu, C.; Cheng, J. Speciation of Heavy Metal in the Sediment from different Eutrophic Lakes of China. Procedia Eng. 2011, 18, 318–323. [Google Scholar]
  35. Canfield, D.E.; Kristensen, E.; Thamdrup, B. The Iron and Manganese Cycles. Adv. Mar. Biol. 2005, 48, 269–312. [Google Scholar]
  36. Abualhaija, M.M.; Whitby, H.; van den Berg, C.M.G. Competition between cooper or iron for humic ligands in estuarine waters. Mar. Chem. 2015, 172, 46–56. [Google Scholar] [CrossRef]
  37. Marin, E.; Vaccaro, C.; Di Giuse, D.; Procesi, M.; Sciarra, A.; Zarlenga, F. Enrichment in Heavy metal (HM) and Rare Earth Element (REE) in fluvial placer deposits: Case study of Zambesi River (Mozambique). Int. J. Sci. Res. 2016, 5, NOV163251. [Google Scholar]
  38. Kabata-Pendias, A.; Szteka, A. Trace Elements in Abiotic and Biotic Environments; CRC Press: Boca Raton, FL, USA, 2015. [Google Scholar]
  39. Ikem, A.; Adisa, S. Runoff effect on eutrophic lake water quality and heavy metal distribution in recent littoral sediment. Chemosphere 2011, 82, 259–267. [Google Scholar] [CrossRef] [PubMed]
  40. Zerbe, J.; Sobczyński, T.; Elbanowska, H.; Siepak, J. Speciation of heavy metals in bottom sediments of lakes. Pol. J. Environ. Stud. 1999, 8, 331–339. [Google Scholar]
  41. Wojtkowska, M.; Karwowska, E.; Chmielewska, I.; Bekenova, K.; Wanot, E. Copper and cadmium in bottom sediments dredged from Wyścigi Pond, Warsaw, Poland—Contamination and bioaccumulation study. Environ. Monit. Assess. 2015, 187, 1–9. [Google Scholar] [CrossRef] [PubMed]
  42. Skorbiłowicz, E.; Skorbiłowicz, M. Metals in grain fractions of bottom sediments from selected rivers in north-eastern Poland. Phys. Chem. Earth A/B/C/ 2011, 36, 567–578. [Google Scholar] [CrossRef]
  43. Hakanson, L. Ecological risk index for aquatic pollutant control, a sedimentalogical approch. Water Res. 1980, 14, 975–1001. [Google Scholar] [CrossRef]
  44. Yuan, X.; Zhang, L.; Wang, C.; Ji, J. Sediment properties and heavy metal pollution assessment in the river, estuary and lake environments of a fluvial plain, China. Catena 2014, 119, 52–60. [Google Scholar] [CrossRef]
  45. Bojakowska, I.; Gliwicz, T.; Szatkowska-Konon, H. Osady Denne w Wodach Powierzchniowych. Biblioteka Monitoringu Środowiska. Available online: http://orka.sejm.gov.pl/druki4ka.nsf/($vAllByUnid)/A0C171F9B88533F1C1256DC60044F9C9/$file/2115_09.pdf (accessed on 16 August 2016).
Figure 1. Location of Symsar Lake in Poland (A) and its catchment (B). The location of the sediment sampling sites is marked on the bathymetric map of Symsar Lake (C). The position of Symsar Lake along the river-lake system longitudinal cross-section. Abbreviations: SR-i—inflow of the Symsarna River; SR-o—outflow of the Symsarna River; TS—the Tolknicka Struga; S I—stream I; S II—stream II; SR—the lake zone intersected by the Symsarna River; C—central part of the lake; SLb—a lake bay.
Water 08 00358 g001
Figure 2. Division of sediment samples into three groups based on lake depth: SR—sediments in lake zone intersected by the Symsarna River, C—sediments in the central part of the lake and SLb—sediments in the northern part of the lake.
Water 08 00358 g002
Figure 3. Distribution of heavy metal concentrations in the bottom sediments of Symsar Lake. Data were interpolated in the Surfer 8.0 application (units: Zn, Fe, Mn: g·kg−1, Cr, Cu, Ni, Cd, Pb: mg·kg−1).
Water 08 00358 g003
Figure 4. The geochemical index (Igeo) and contamination factor (CF) value in Symsar Lake.
Water 08 00358 g004
Figure 5. Ordination diagram of PCA to identify an impact of environmental factors on the heavy metal content. Pie diagrams denote the share of a given metal according to the following factors; (A) lake zone; (B) depth on the composition of metals.
Water 08 00358 g005
Table 1. Content of metals in certified material.
MetalsExtraction in HNO3 + HClO4 [mg·kg−1]Sewage Sludge Certified Reference Material [mg·kg−1]Recovery [%]Acceptable Deviation [%]
Mn677.569397.815.6
Cr310.7289107.310.5
Cu503.3482104.410.4
Ni174.9163107.38.3
Cd63.160.6104.04.9
Pb152.515499.08.1
Zn1076.2124086.814.6
Table 2. Texture of bottom sediments of Symsar Lake Denotations; SR—lake zone intersected by the Symsarna River; C—central part of the lake; SLb—lake bay; L—lake sediments; R—riverbed; AS—inflows of all streams to the lake; SR-i—inflow of the Symsarna River; SR-o—outflow of the Symsarna River; p—significance level in K-W test; *—the results were regarded as statistically significant at p ≤ 0.05; in bold—differences between groups of means statistically significant in the posthoc Dunn’s test.
Fraction (%)Lake’s Bottom Sediment (L)River (R)p
SR (±SD)C (±SD)SLb (±SD)AS (±SD)SR-iSR-o
Medium sand36.96 ± 7.6341.51 ± 4.1036.87 ± 7.1943.92 ± 25.3235.2312.040.812
Fine sand15.54 ± 6.1017.98 ± 0.9115.64 ± 0.9947.93 ± 21.2944.3778.920.007 *
Very fine sand13.46 ± 7.458.02 ± 1.218.78 ± 3.275.84 ± 6.0513.777.360.246
Clay, silt34.04 ± 4.3832.49 ± 3.7938.71 ± 3.942.31 ± 2.946.631.680.008 *
Table 3. Spearman’s rank correlation coefficients between sediment fractions and metal concentrations. Statistically significant correlations at p ≤ 0.05 are marked in bold.
TextureMnFeZnCuNiCdCrPb
Medium sand0.236−0.309−0.0630.040−0.3560.408−0.1250.115
Fine sand−0.717−0.232−0.763−0.174−0.0200.209−0.759−0.385
Very fine sand0.1720.3170.2530.1540.488−0.4960.251−0.079
Clay, silt0.2260.4010.4550.2280.317−0.6330.6230.453
Table 4. Average concentrations of heavy metals in bottom sediments across Symsar Lake. Denotations: see Table 2.
Heavy MetalLake’s Bottom Sediment (L)River (R)p
SR (±SD)C (±SD)SLb (±D)AS (±SD)SR-iSR-o
Mn [g·kg−1]0.85 ± 0.10.74 ± 0.00.57 ± 0.00.44 ± 0.20.520.180.006 *
Fe [g·kg−1]32.83 ± 3.729.09 ± 3.931.65 ± 3.124.61 ± 6.620.3529.940.285
Zn [g·kg−1]0.13 ± 0.00.11 ± 0.00.13 ± 0.00.04 ± 0.00.050.020.122
Cu [mg·kg−1]20.63 ± 2.914.56 ± 4.122.36 ± 3.218.97 ± 14.223.4058.000.354
Ni [mg·kg−1]33.88 ± 6.026.03 ± 12.634.75 ± 5.330.04 ± 8.139.8025.500.618
Cd [mg·kg−1]0.69 ± 0.30.36 ± 0.00.49 ± 0.62.14 ± 1.01.102.100.029 *
Cr [mg·kg−1]19.76 ± 4.68.68 ± 1.915.97 ± 4.55.06 ± 1.73.206.000.005 *
Pb [mg·kg−1]87.32 ± 41.845.65 ± 21.9118.96 ± 12.652.47 ± 28.351.436.200.070

