Article

Hydrogeochemical Characteristics of Groundwater Highly Polluted with Nitrate in an Agricultural Area of Hongseong, Korea

1
Department of Earth and Environmental Sciences, Chonbuk National University, Jeonju, Jeollabuk-do 561-756, Korea
2
The Earth and Environmental Science System Research Center, Chonbuk National University, Jeonju, Jeollabuk-do 561-756, Korea
*
Author to whom correspondence should be addressed.
Water 2016, 8(8), 345; https://doi.org/10.3390/w8080345
Submission received: 27 June 2016 / Revised: 9 August 2016 / Accepted: 11 August 2016 / Published: 15 August 2016

Abstract

:
The hydrogeochemical characteristics of groundwater, in an area where widespread contamination by nitrate ( NO 3 ) was anticipated, were studied using traditional geochemical investigation and multivariate statistical analysis. Widespread NO 3    contamination as high as 67.2 mg/L as NO3–N was observed, and positively correlated with that for chemicals ( Cl , major cations) with surface origin. Principal component analysis (PCA) revealed that three processes affected groundwater chemistry of the area: (1) leaching of pollutants from the ground surface; (2) reduction of NO 3 in areas with low dissolved oxygen (DO); and (3) ingress of low NO 3   deep groundwater. Five sample groups were identified from cluster analysis, and analysis of land use patterns around each group showed that fate and distribution of NO 3   contamination were mainly controlled by surface topography and predominant land use type. The highest NO 3   concentrations were associated with confined livestock feeding operations in hilly terrain areas, where infiltrating water also had high DO. Lower NO 3   concentrations found in the lowland flat areas were thought to be due to either reducing conditions in rice paddies leading to N attenuation or drawing in of deep groundwater by pumping to meet agricultural needs during periods of low rainfall.

Graphical Abstract

1. Introduction

Groundwater is an important water resource that is used as drinking water by more than 20% of the global population, and the share of groundwater in global water use is quickly rising [1,2,3]. Although pristine groundwater, in general, is thought to have had better water quality than surface water sources, such as rivers, streams, and lakes [4], increased impact from human activities has been undermining the quality of groundwater over the past few decades. NO 3    from nonpoint sources has become one of the most widespread pollution problems in many parts of the world. NO 3    contamination of groundwater has also been a serious environmental concern in South Korea over the last three decades. NO 3    contamination is mainly caused by overapplication of organic and inorganic fertilizer and improper disposal of animal wastes. The amount of nitrogen fertilizer applied per area in Korea was the highest in Asian countries, 8th in the world, and four times as much as in the United States [5,6]. Also, the most common form of livestock rearing in Korea is very intensive, where hundreds or thousands of cattle, pigs and poultry are raised in very confined and crowded conditions, and animal waste generated from these facilities are not properly collected or treated in many cases. Therefore, concern about contamination of groundwater in such agricultural areas has been raised for a while, and there have been quite a few independent investigations on contamination status of groundwater in agricultural areas [7,8,9,10]. These research results indicated that groundwater contamination by NO 3    was widespread and serious with the percentages of investigated wells contaminated by NO 3    ranging from 26% to 62%, and contamination sources of NO 3    gave rise to serious deviation of overall groundwater chemistry including NO 3   from that formed by natural mineralization processes.
Characterization of groundwater geochemistry in an area where widespread NO 3    contamination is anticipated is not a trivial matter due to the presence of many controlling factors including, but not limited to, precipitation and pumping patterns, aquifer types and heterogeneity, types of surface soil, types and distribution of nitrogen sources, and biogeochemical condition of groundwater [11,12,13]. Also, characteristic nonlinear and multicollinear relationships between these factors and spatio-temporal distribution of pollutants make the task even more difficult [14,15]. Multivariate statistical analysis has been applied in many studies to identify and evaluate natural and anthropogenic processes governing the fate and distribution of NO 3   from complex interrelationships of many factors involved in the evolution of groundwater chemistry [14,15,16,17,18]. The most commonly applied methods in multivariate analysis are principal component analysis (PCA) and hierarchical cluster analysis (HCA), and they have complemented traditional geochemical investigations to identify groundwater sources, major pollution sources responsible for the degradation of groundwater quality, and natural evolution of groundwater through water-rock interaction [11,17,19].
In this study, hydrogeochemical characteristics of dissolved constituents in groundwater were evaluated in a mid-western area of South Korea, where groundwater is anticipated to be highly contaminated with anthropogenic pollutants, especially NO 3 , due to various agricultural activities, such as rice cultivation and confined animal feeding operations. Despite the presence of multiple contamination sources, no investigation has been made to elucidate overall distribution of NO 3 in the groundwater and to identify the processes that would govern the fate of pollutants. The goal of this study, therefore, was to enhance understanding of processes governing the fate and distribution of NO 3 pollution, which is necessary for setting up proper groundwater management and/or remediation strategies. Multivariate statistical analysis was applied to the data obtained from traditional geochemical investigations to identify the main contamination source in relation to the land use patterns and local topography of the area, and to elucidate hydrogeological and biogeochemical processes that would control the distribution of NO 3   in the groundwater. Variation due to climatic factors is expected to be minimal because the sampling campaign was performed within such a short time period.

2. Materials and Methods
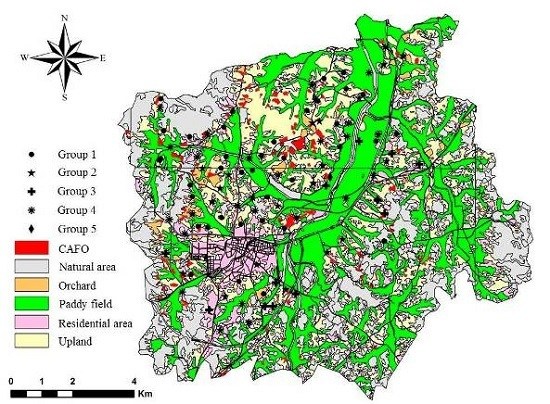
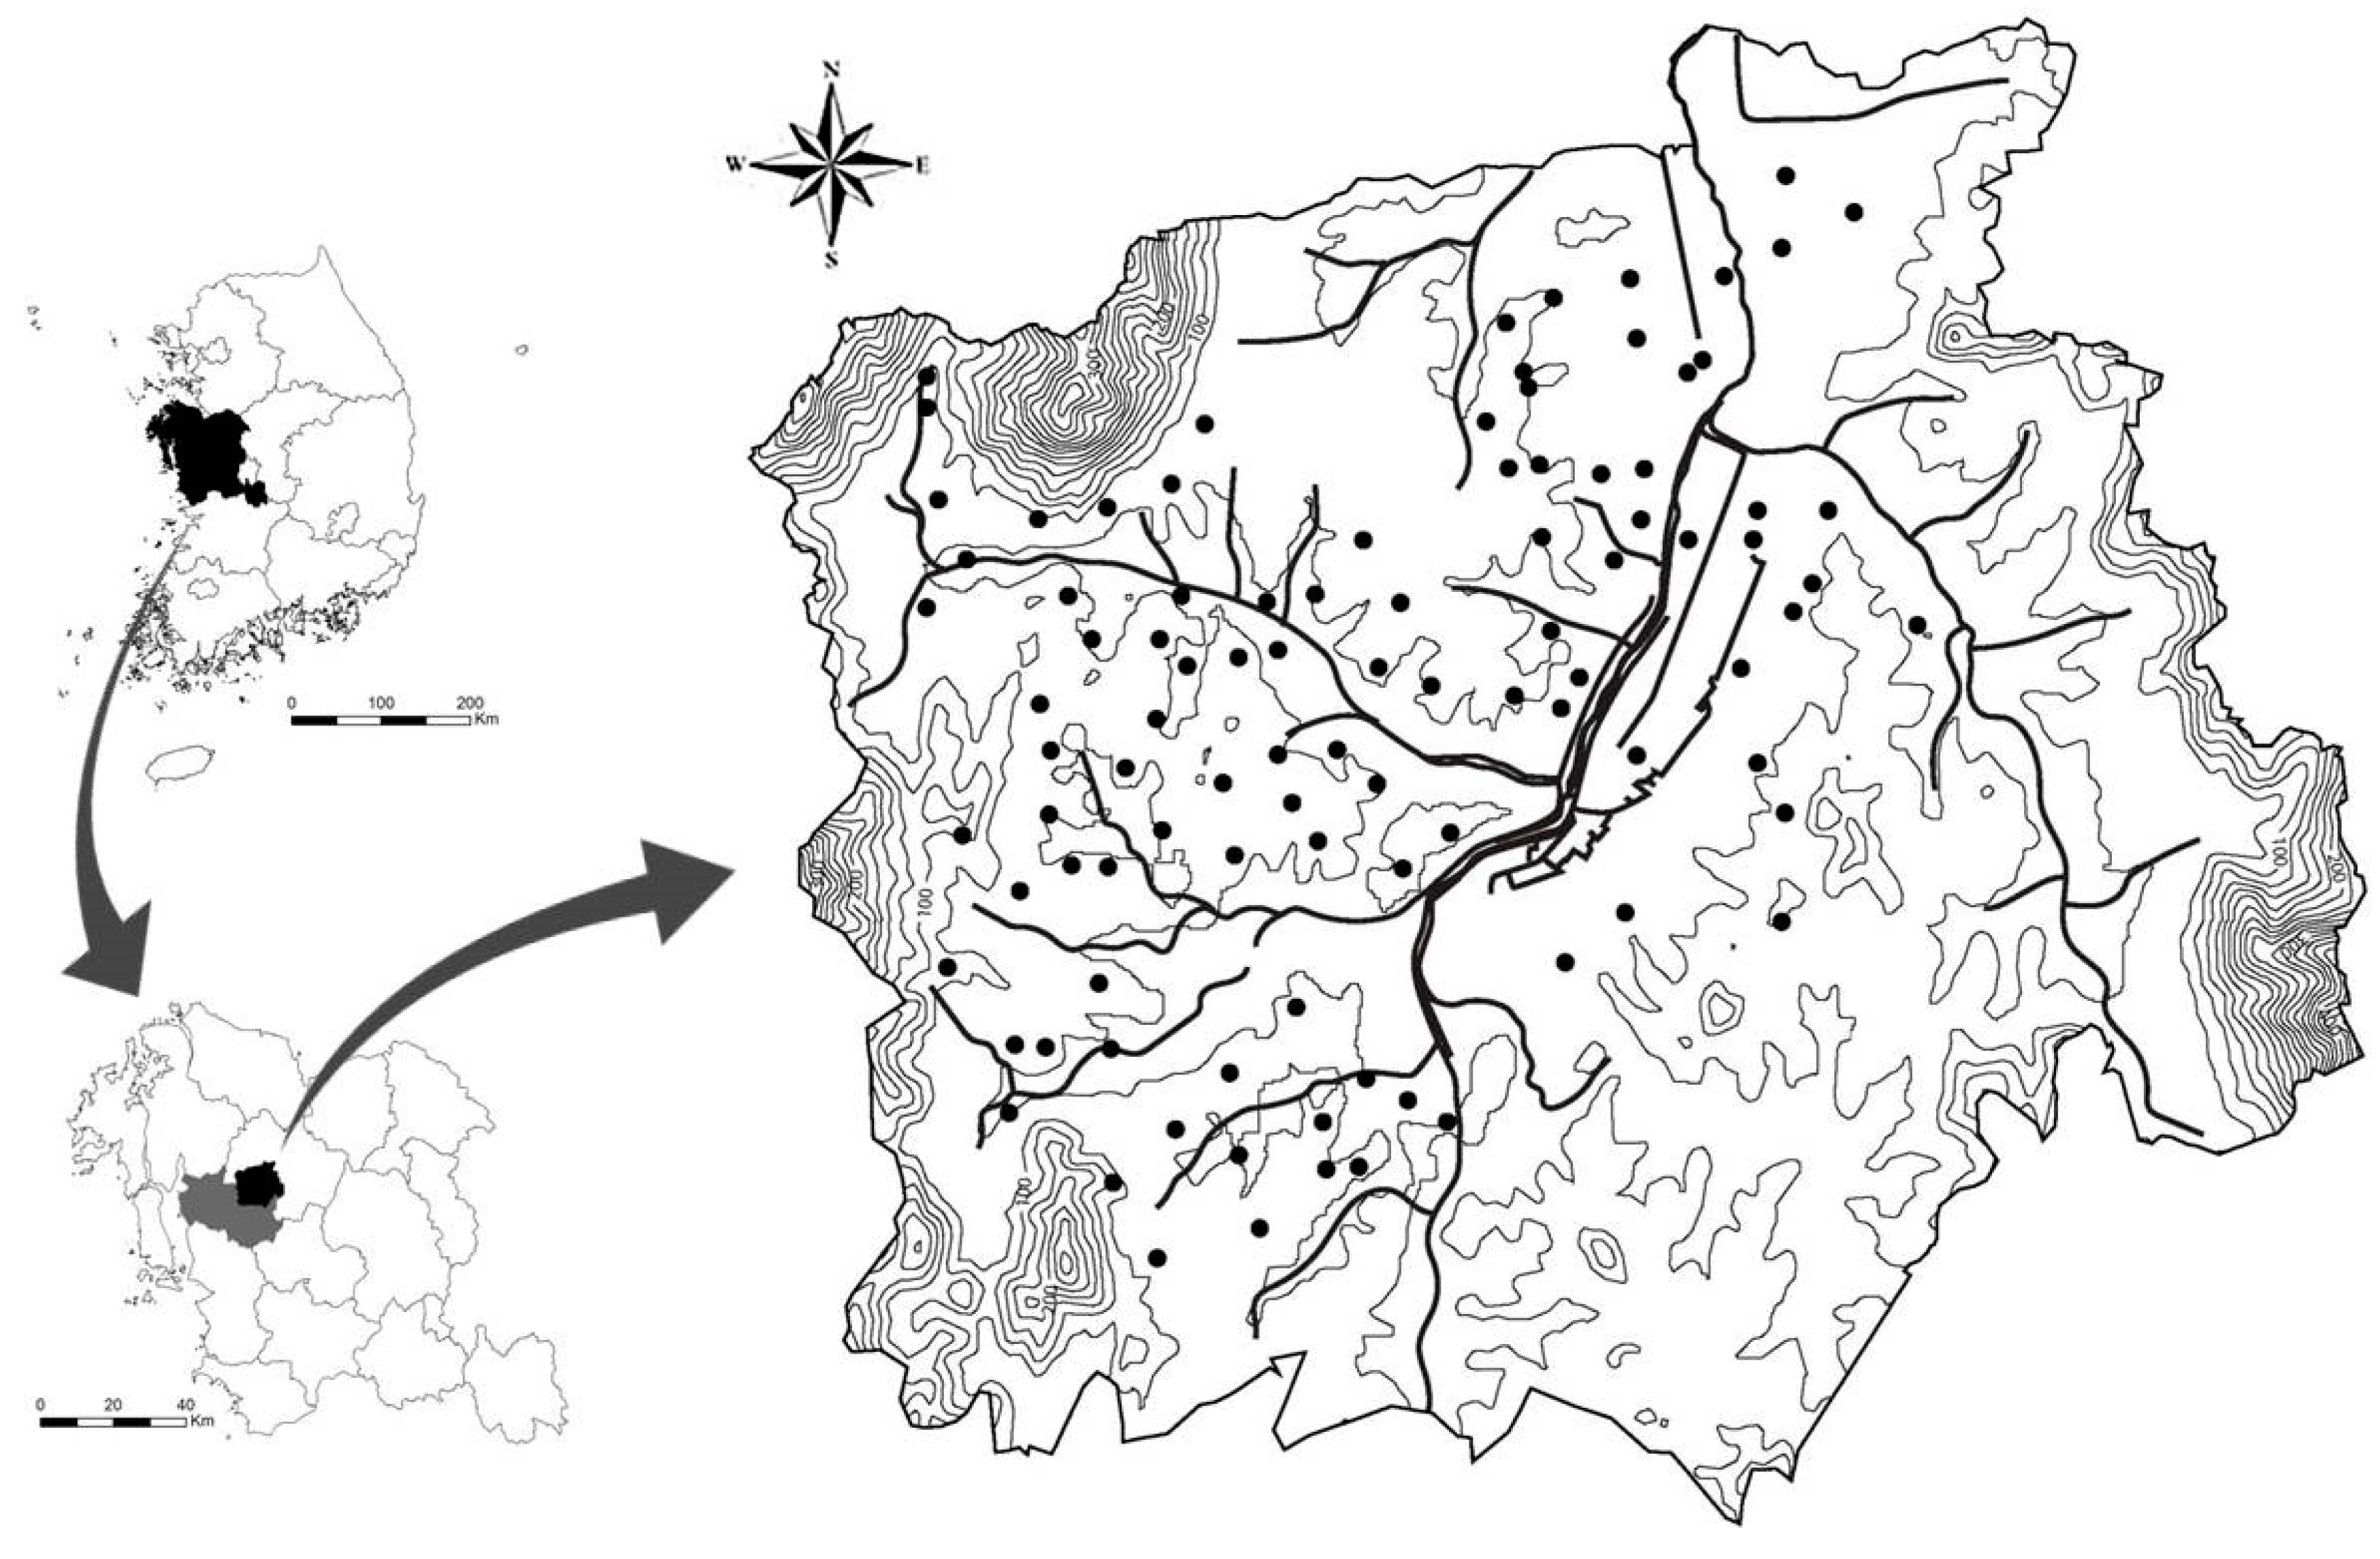
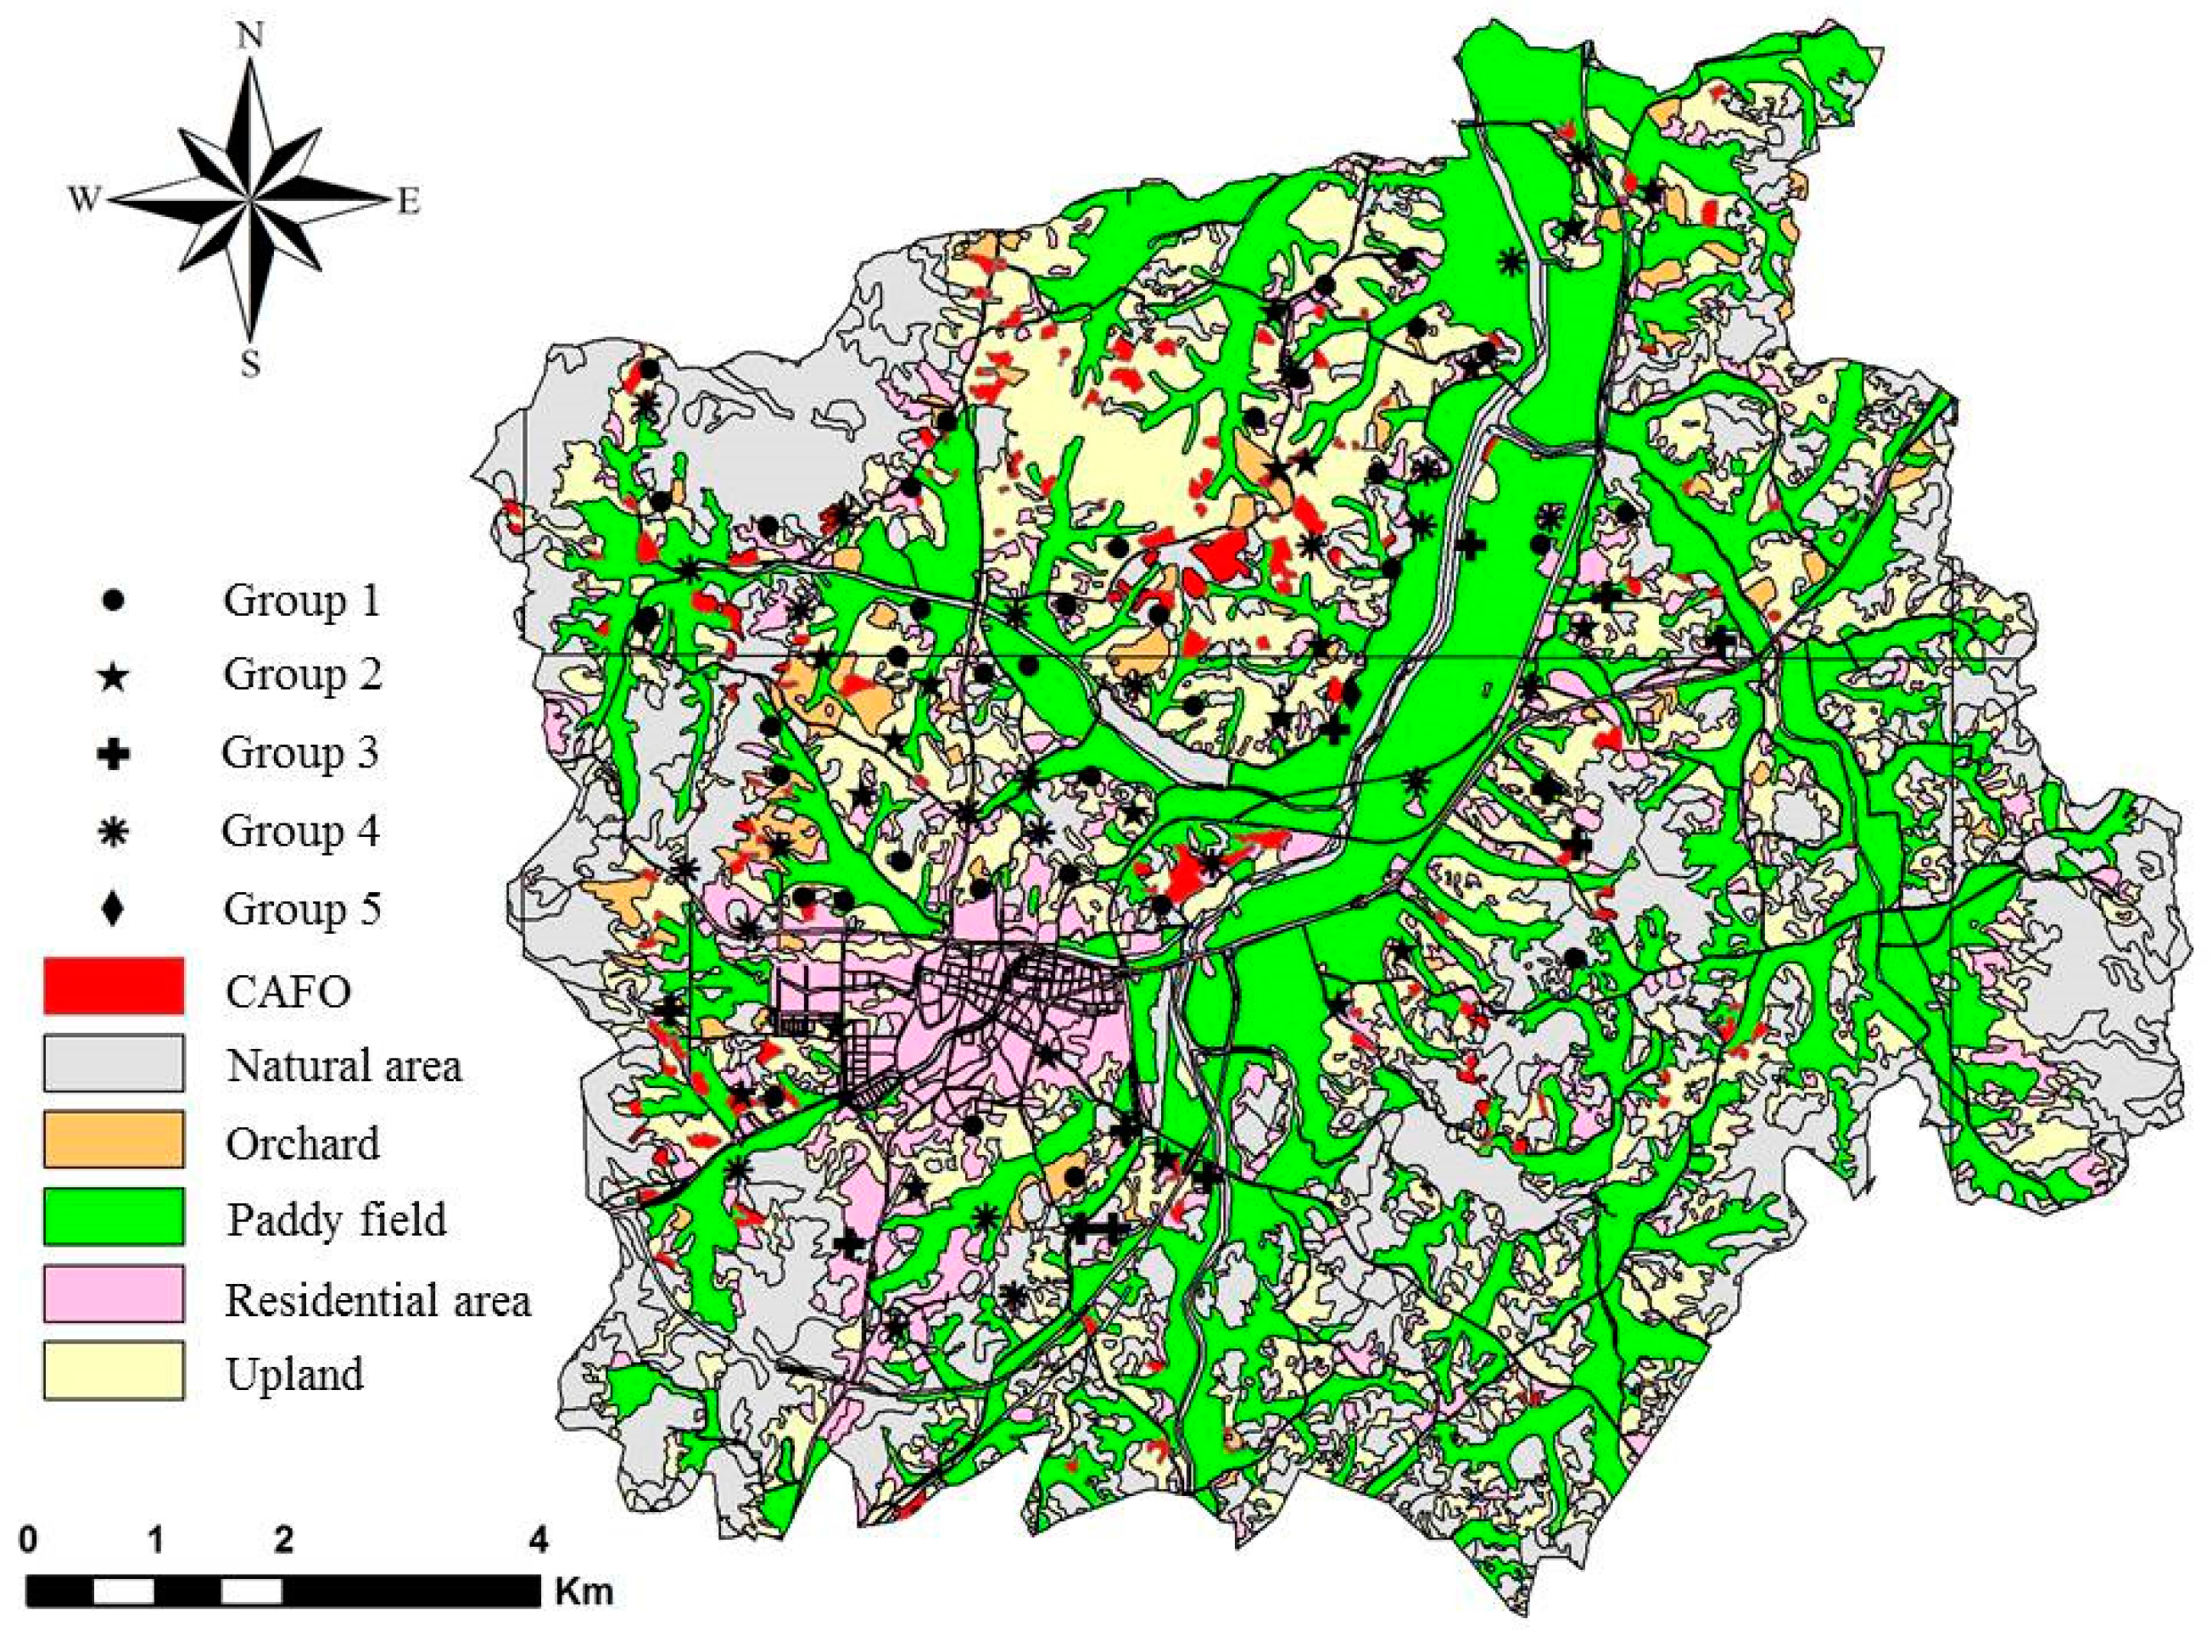
2.1. Study Area

The study area is located in the northeastern part of Hongseong County, a division of Chungnam Province in the mid-western region of South Korea (Figure 1). The area covers latitudes from 36°33′36′′ to 36°40′28′′ N, and longitudes from 126°37′13′′ to 126°46′24′′ E. The total population of Hongseong County in 2013 was 89,704, and 44,420 of which was concentrated in a relatively urbanized southwestern part of the study area, Hongseong-eup. Topographically, much of the study area is occupied by hilly terrain with moderate slopes and elevations generally less than 100 m. Flat lowland areas, mainly used as rice paddy field, developed with the width of about 1 km on both banks of the Gumma-cheon (stream) flowing in the central part of the study area. Flat area can also be found around two tributaries (Whayang-cheon and Yongbong-cheon) with much narrower lateral extent. The area had a rural agricultural landscape with distinct land use patterns in lowlands and hilly terrains. The majority of lowlands were occupied by rice paddies and greenhouses for vegetable cultivation. Non-paddy fields for barley and other crops constituted a small fraction of the land surface. The hilly terrain was mainly occupied by forest with a few orchards of apples, pears and peaches, which were spread irregularly. Concentrated animal feeding operation (CAFO) areas could be found almost exclusively in the hilly part. The main livestock raised in the area were cattle, pigs, and poultry with the densities of 113, 792, and 9050 heads/km2, respectively [20]. These values are much higher than the national average, and Hongseong is one of a few municipalities in Korea that are famous for beef production. Although domestic wastewater generated in urbanized Hongseong-eup is collected by public sewer systems and treated in a local wastewater treatment facility, there were very few treatment facilities for animal waste generated in most of the study area, and large amounts of animal waste were used as manure [21].
The climate of the study area has a typical monsoonal character with hot and humid summers and cold and dry winters. The average annual temperature is 11.5 °C. The highest temperature measured in August was 36 °C, and the lowest in January was −15.1 °C. The average annual precipitation was 1514 mm in 2012, and the rainfall in July (198 mm), August (524 mm), and September (197 mm) constituted approximately 75% of annual precipitation [22]. Basement rocks are composed of Precambrian metamorphic rocks and Cretaceous granites and Quaternary alluvial deposits developed along the streams [23].

2.2. Hydrogeochemical Investigation

Field investigation and groundwater sampling were carried out on 100 wells from March to April, 2013. The wells investigated had depths ranging from 10 to 240 m, and were fully screened. The depth to water table was assumed to be correlated with well depth, and, based on this assumption, wells were classified based on the depth as shallow wells (depth < 30 m), intermediate wells (30 m < depth < 80 m), and deep wells (depth > 80 m). The aquifers from which water samples were taken were in Quaternary alluvial deposits and not in the crystalline rock. According to personal interviews with well owners, 43% of the studied wells were used as drinking water sources on a daily basis, and the other 57% was still used occasionally for drinking although their main uses were irrigation and animal feeding. The amount of rainfall during the field investigation constituted 8% of the annual precipitation.
Measurements were based on 19 hydrogeochemical parameters. Temperature, pH, electrical conductivity (EC), oxidation-reduction potential (ORP) and dissolved oxygen (DO) concentration were measured in-situ (HQ40D multi portable meter, Hach Industry, Inc., Loveland, CO, USA). Groundwater was pumped with well pump for 5–10 min and connected to a flow chamber. With the probes in place, the above-mentioned in-situ parameter values were noted after their values were stabilized. Samples for laboratory measurements were collected by filtration through 0.45 μm membrane filters, and samples for cation analysis were acidified in-situ to pH < 2 using concentrated nitric acid. Samples for alkalinity measurement were collected in bottles that were completely filled to eliminate air in the headspace and tightly sealed. The measurements were done within 2 h from sample collection. Alkalinity was determined as total alkalinity, using an automatic titrator (Orion 950 Titrator, Thermo Scientific, Sunnyvale, CA, USA) with acidimetric titration to the end point of pH 4.5. Anions ( Cl , SO 4 2 , NO 3 , F , and PO 4 3 ) were measured using ion-exchange chromatography (ICS-1500, Dionex, Sunnyvale, CA, USA), and cations (Ca2+, Mg2+, Na+, K+, Fe2+, Mn2+, Sr2+, Ba2+) with inductively coupled plasma optical emission spectrometry (ICP-AES; Optima 7300DV, Perkin Elmer, Akron, OH, USA). Charge balance errors were less than 5% in all the samples measured for this study. A summary of measured parameters is listed in Table 1.

2.3. Statistical Analysis

Spearman’s rank correlation was carried out to identify the one-to-one statistical dependence between hydrogeochemical variables. Major hydrological and biogeochemical processes affecting the chemistry of groundwater were elucidated using principal component analysis (PCA), in which principal components (PCs) that can explain the observed variation of hydrochemical parameters were identified. Correlation matrix of 13 hydrogeochemical variables (pH, DO, Ca2+, Mg2+, Na+, K+, HCO 3 , Cl , SO 4 2 , NO 3 , F, Fe2+, Mn2+) of 100 groundwater samples were used to extract PCs. Input parameters of PCA were measured values from geochemical investigation of groundwater. They were first standardized to z-scores that had the mean of 0 and standard deviation of 1. The standardization was performed to give equal weight to each variable to prevent results from being influenced strongly by variables of great magnitudes [24]. The components with eigenvalues greater than one were selected and rotated iteratively by the varimax method to maximize the variance to find factors that could be easily explained by the hydrogeochemical processes [25]. Hierarchical cluster analysis (HCA) was performed using PCA score values to avoid clustering error from data error and multicollinearity [26]. Ward’s method was used as a linkage rule, and similarity between each pair of objects for HCA was measured with the squared Euclidean distance [24,27]. The statistical analyses were carried out using PASW Statistics 18 software (SPSS Inc., Chicago, IL, USA).

3. Results

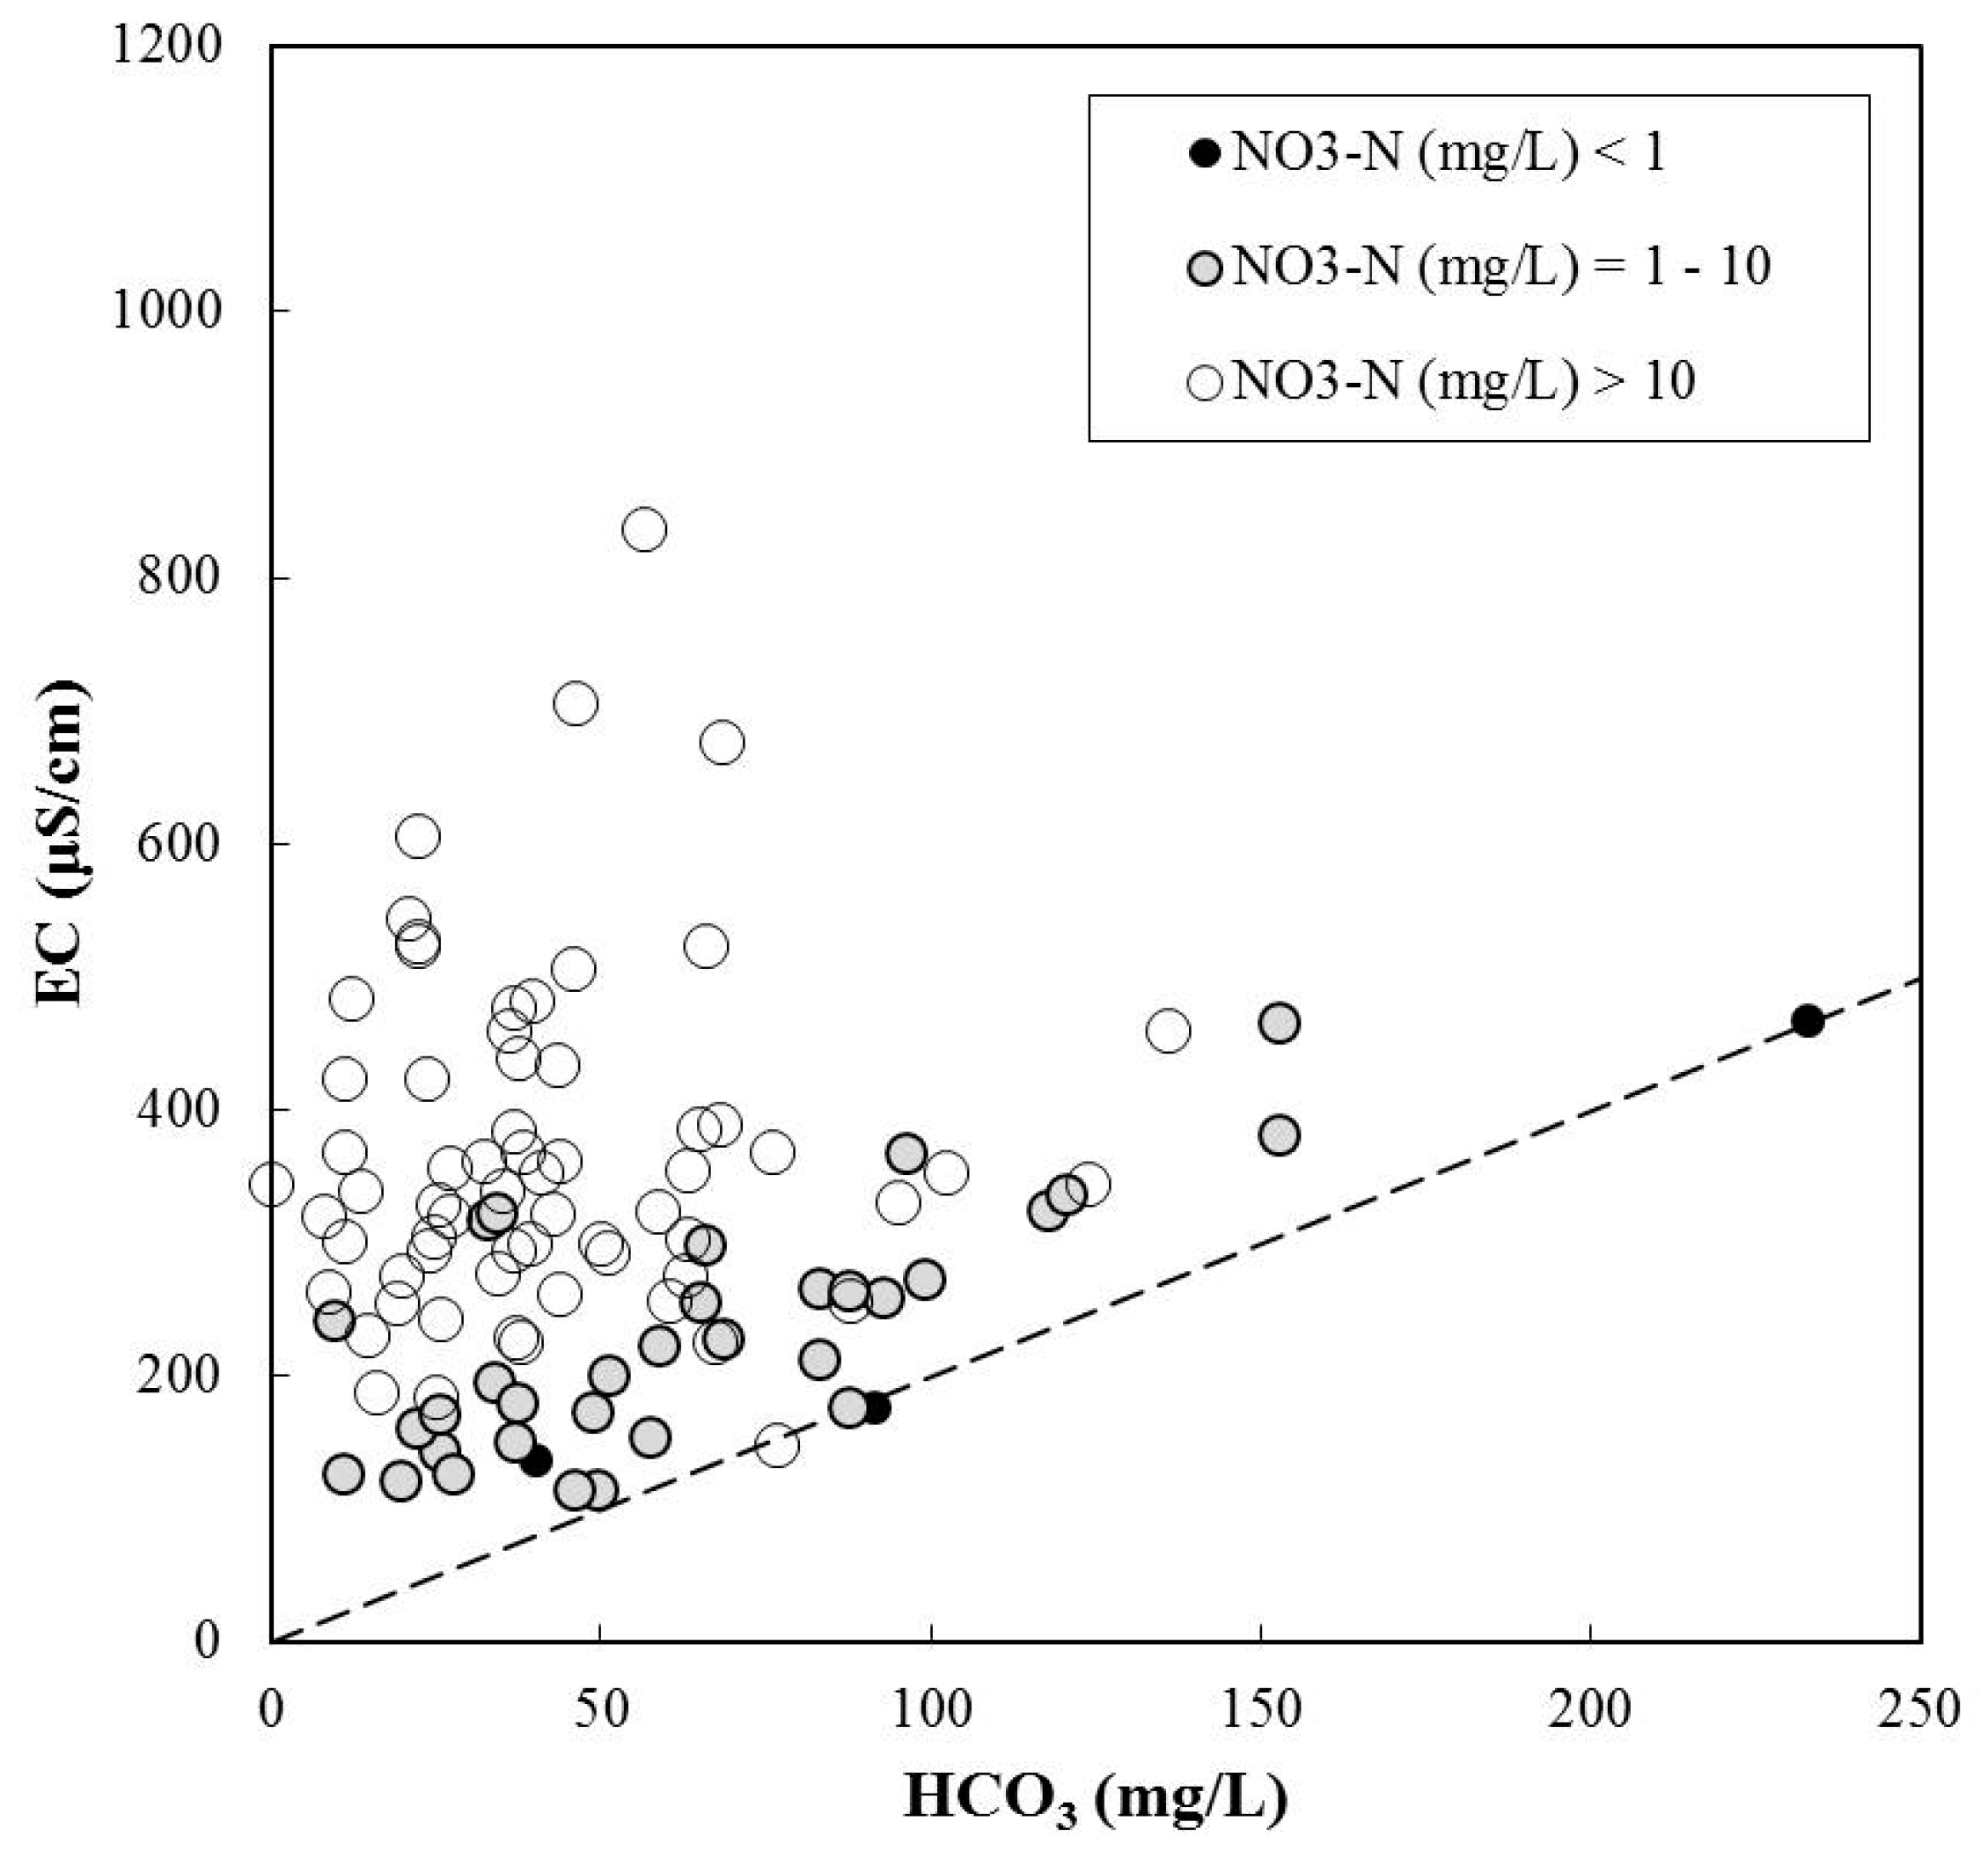
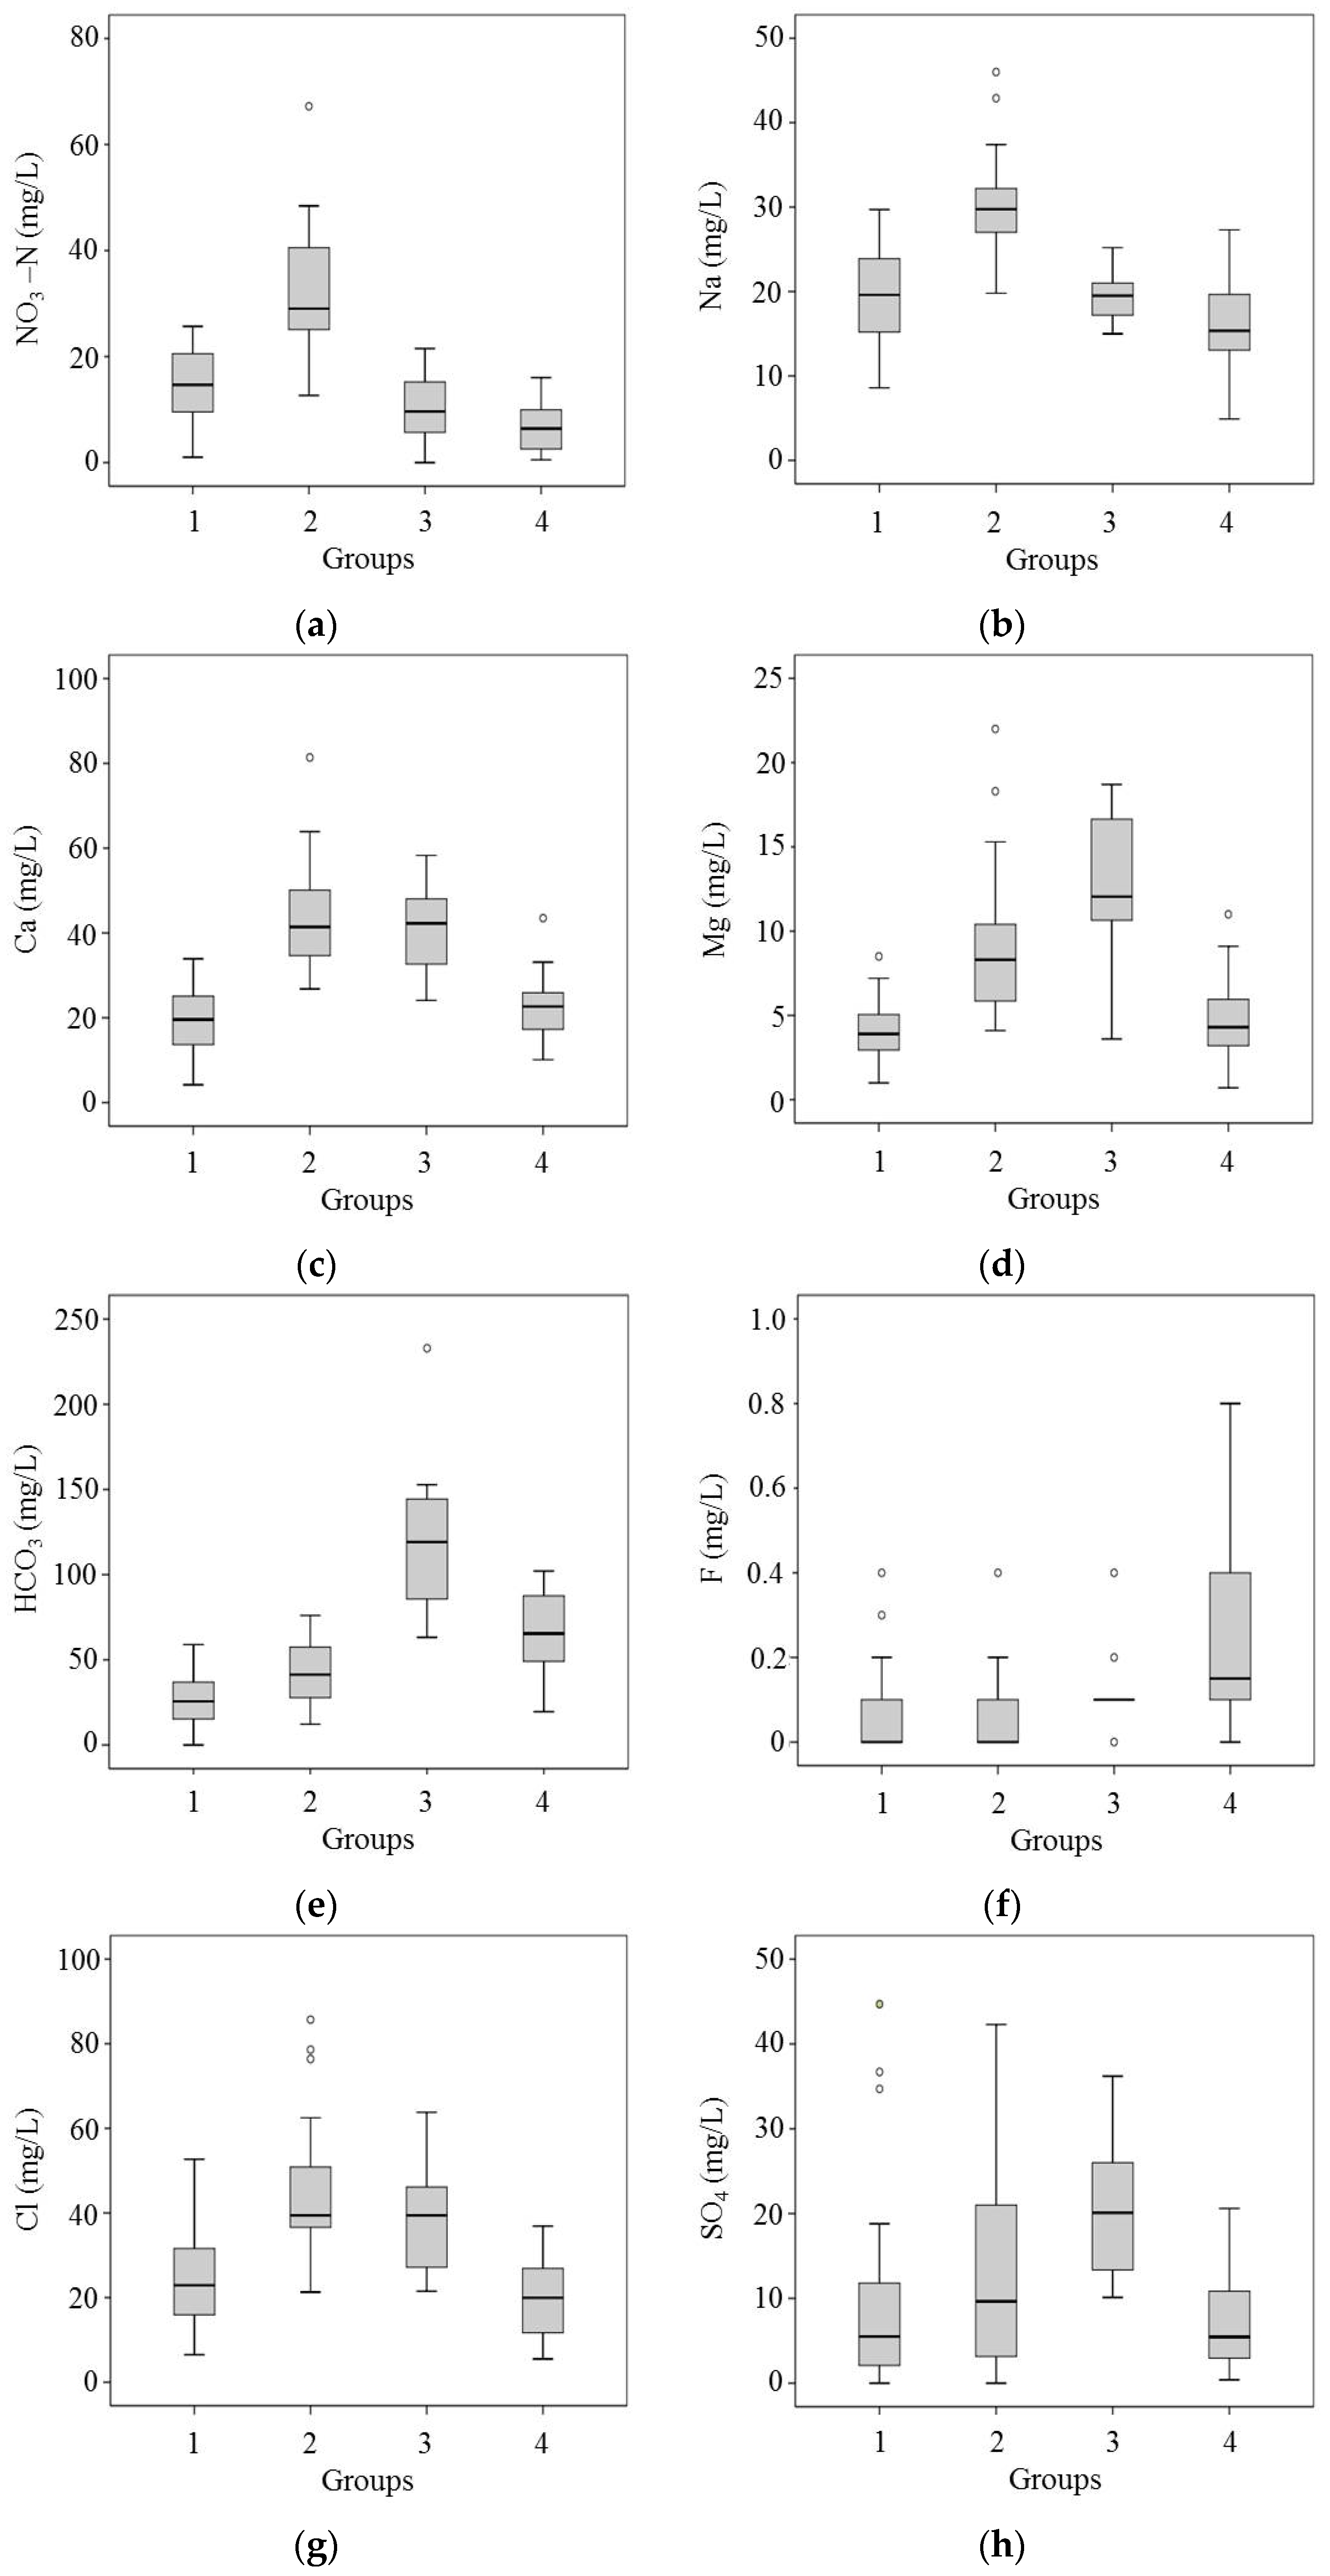
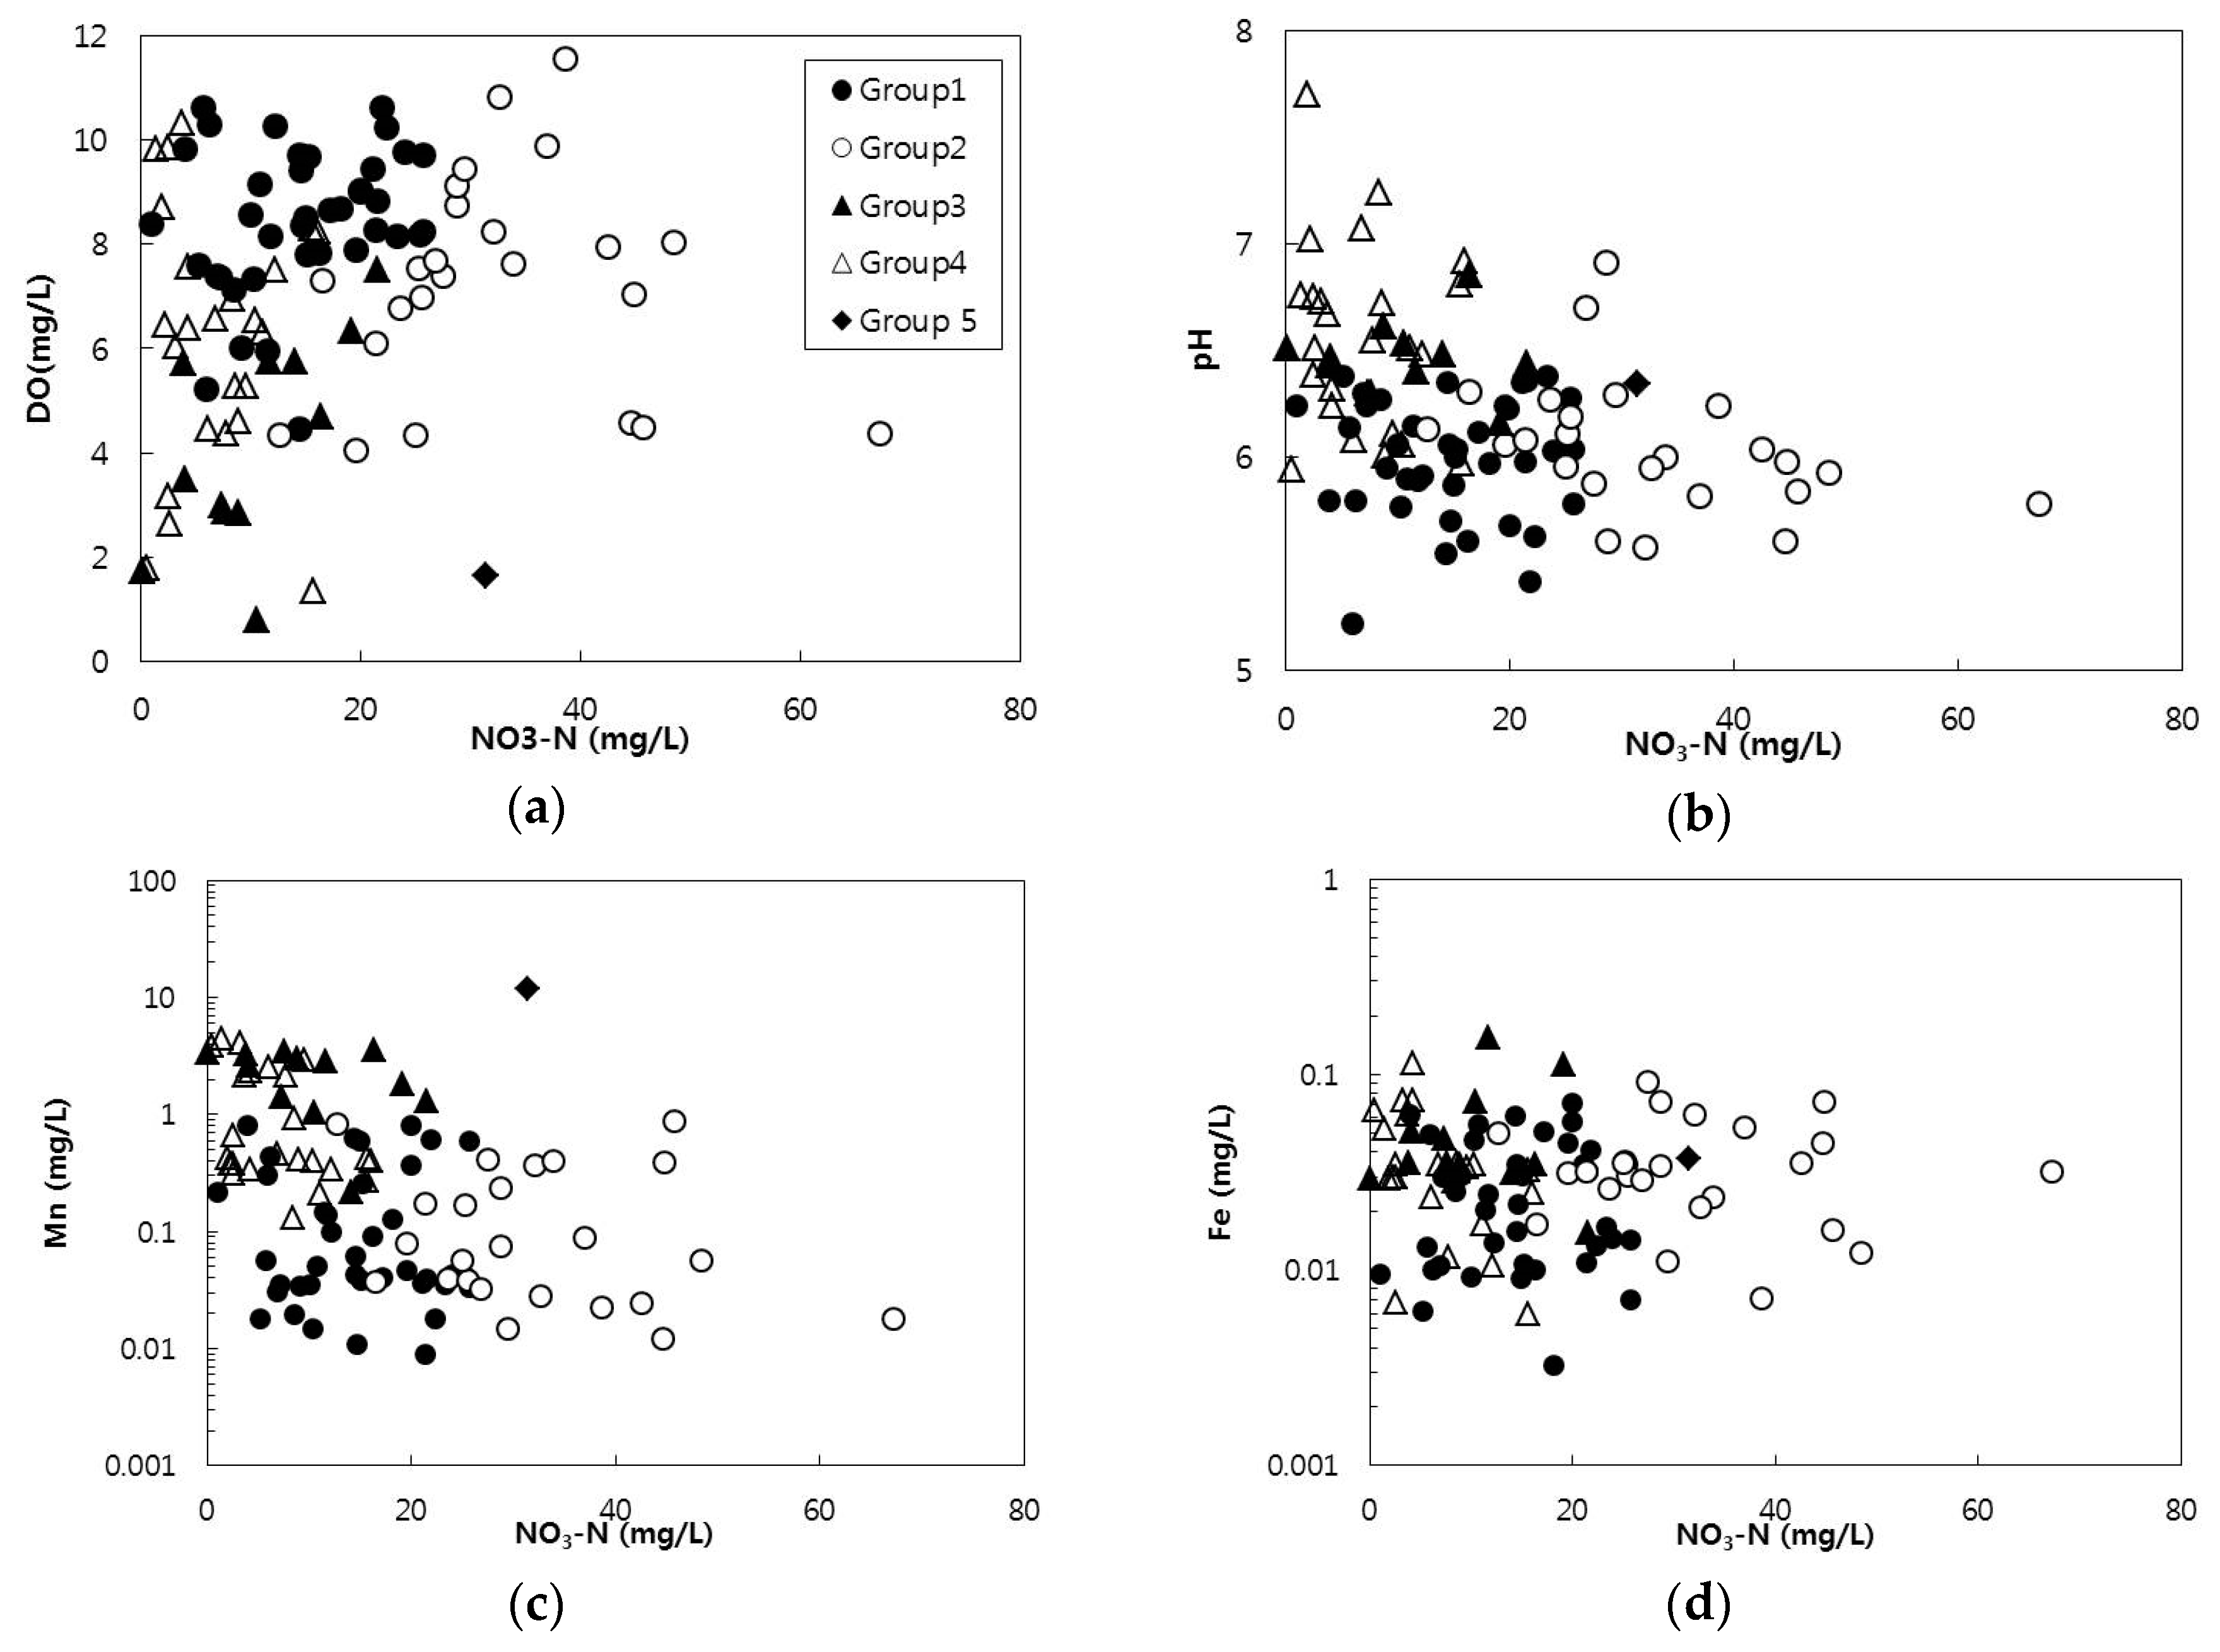
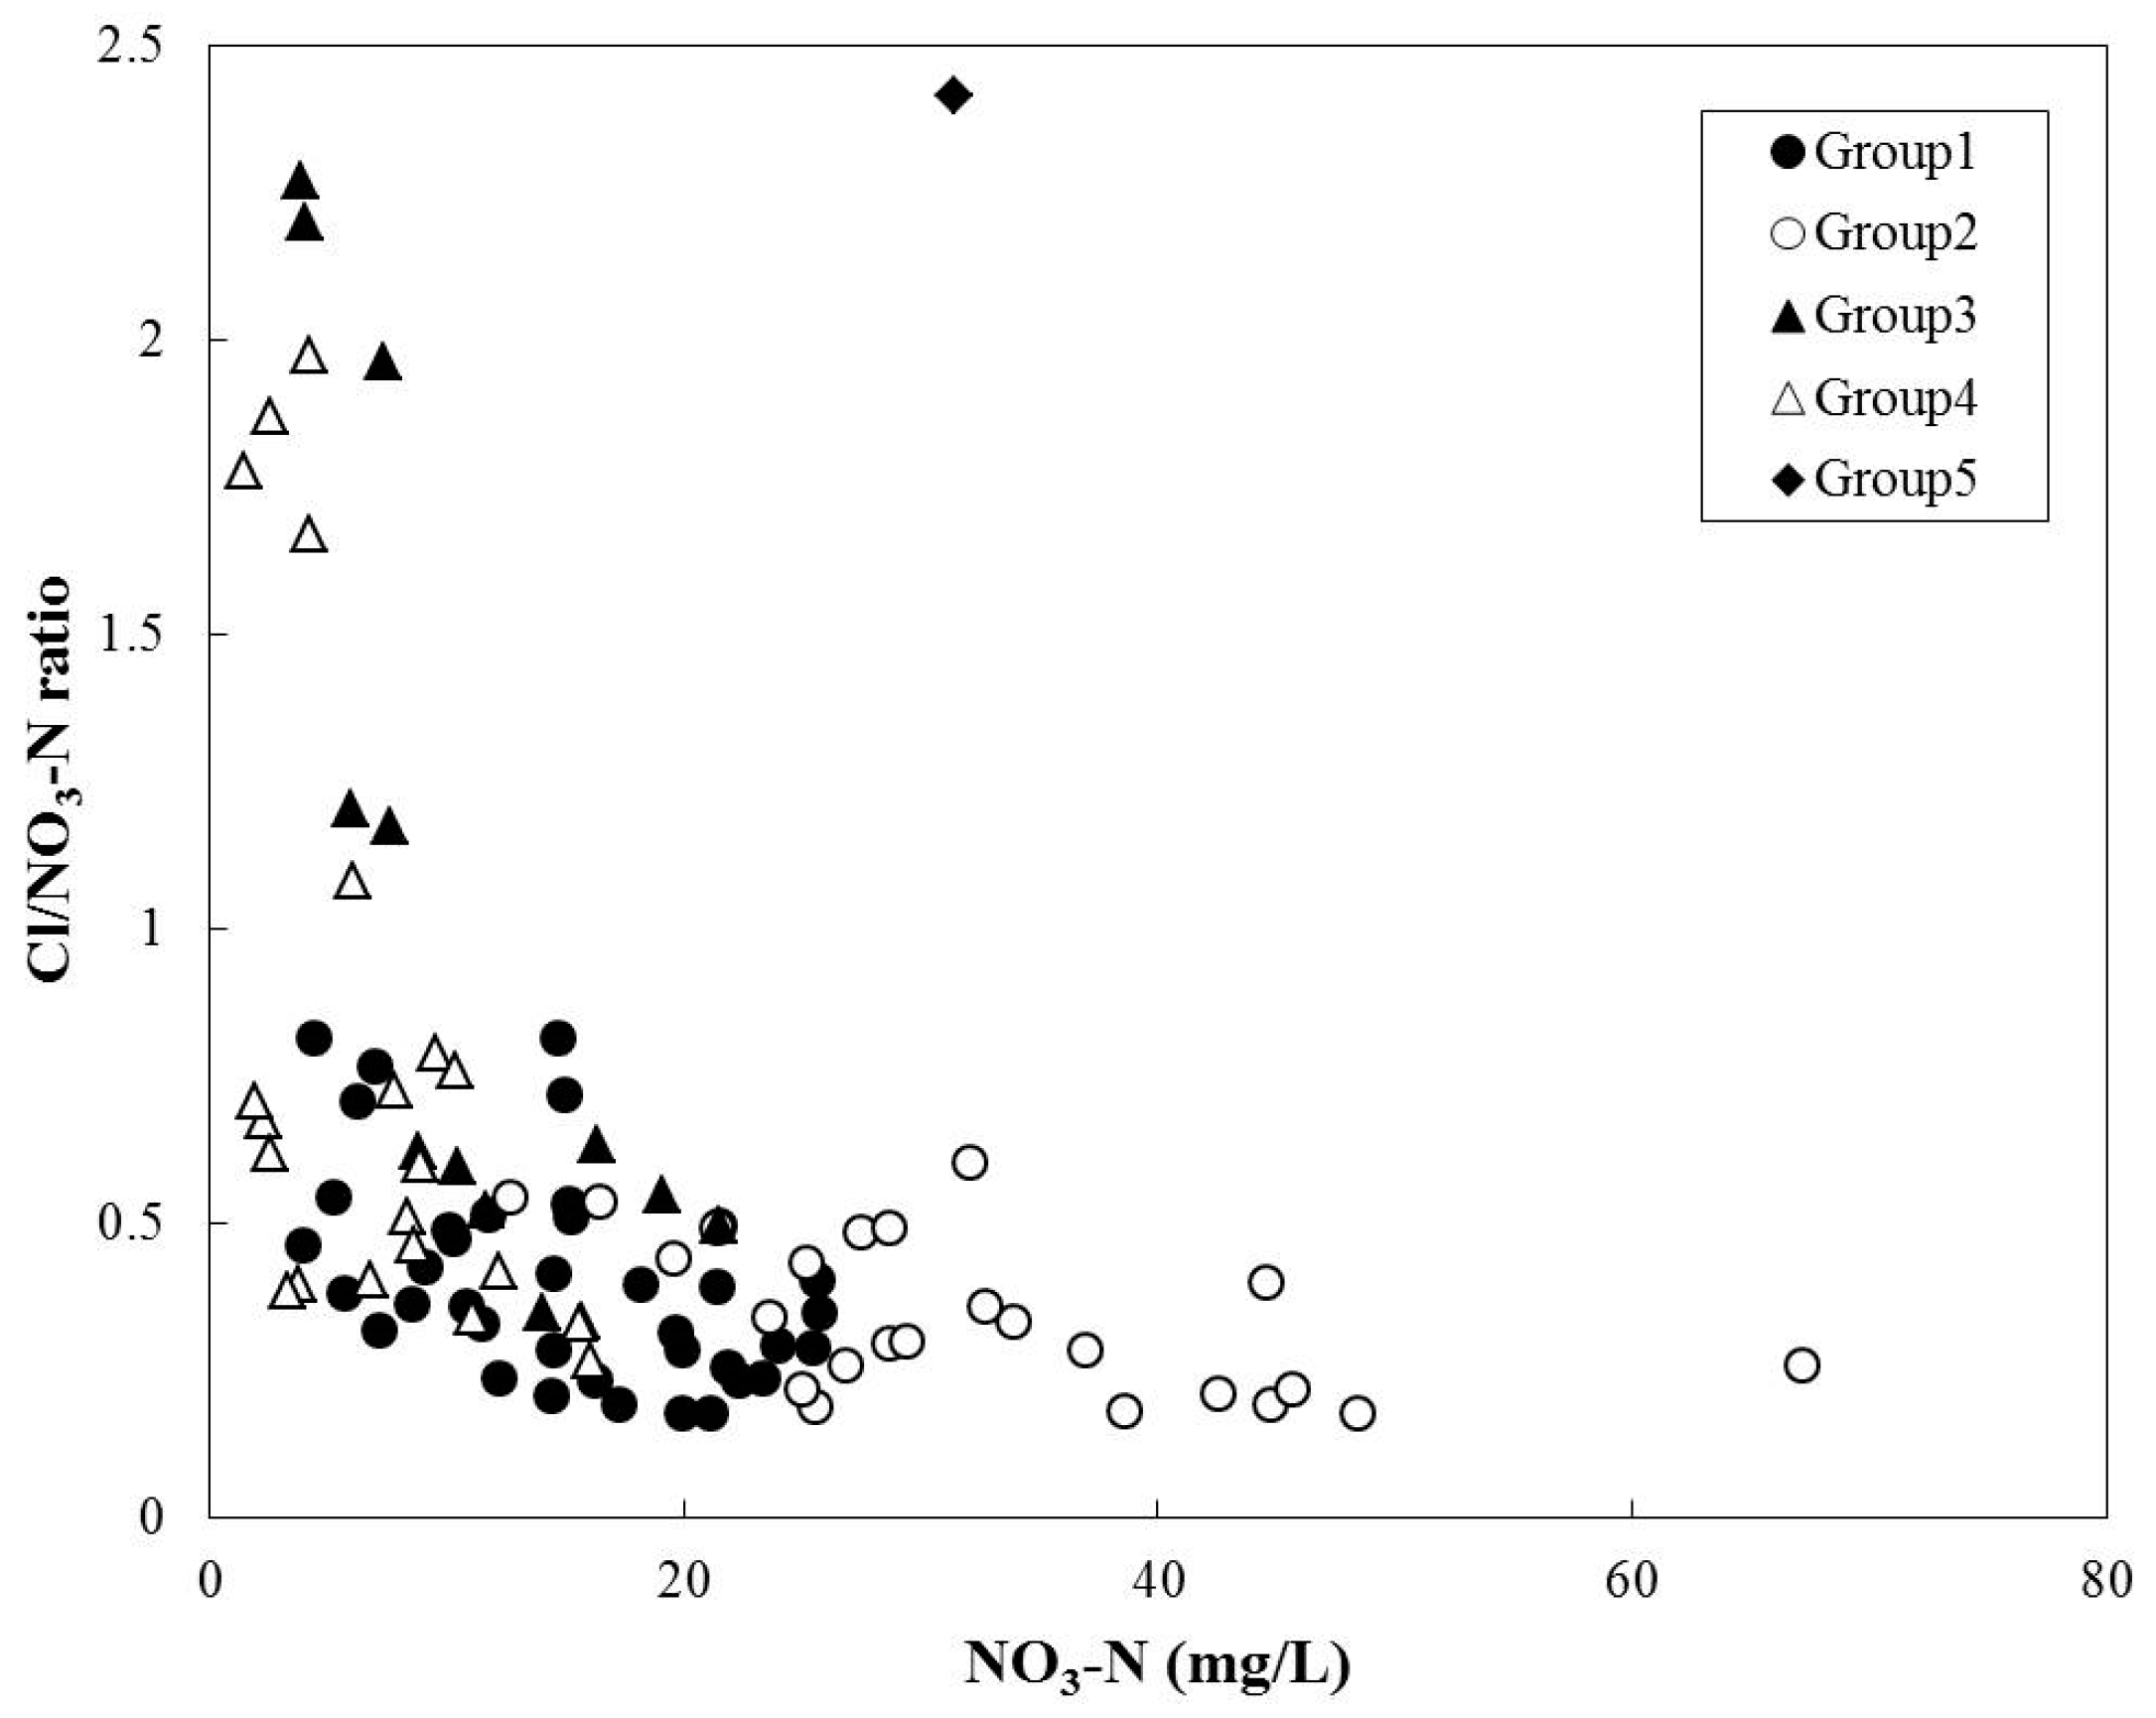
3.1. Hydrogeochemical Characteristics of Groundwater

The concentrations of NO3–N of groundwater samples collected from the study area ranged from 0.01 to 67.21 mg/L, with average value of 17.63 mg/L (median concentration = 15.38 mg/L; Table 1). The percentage of samples whose NO3–N concentrations exceeded drinking water standards (DWS) of Korea (NO3–N concentration = 10 mg/L) was 65%. Application of the threshold concentrations of 1 and 3 mg/L, which were known to indicate the possibility of introduction of anthropogenic contamination with surface origin [28,29,30], revealed that 97% of the samples had concentrations higher than 1 mg/L and 91% higher than 3 mg/L, indicating widespread contamination of regional groundwater by NO 3   . The concentrations of Cl , another commonly used indicator of anthropogenic pollutions with surface origin [31,32] ranging from 5.5 to 335.6 mg/L, with average value of 33.15 mg/L (median concentration = 27.34 mg/L). Nonexistence of chlorine-containing minerals in local lithology seemed to indicate that elevated levels of Cl along with high concentrations of NO3–N resulted from contamination sources on the ground surface in the study area, such as local agricultural and livestock rearing activities, and domestic sewage. Sulfate ( SO 4 2 ) can be introduced to groundwater system through various natural (oxidation of pyrite and atmospheric deposition) and anthropogenic (application of fertilizer) processes [33,34]. Observed concentrations of SO 4 2 , however, did not show any appreciable relationship with other chemical components except for moderate correlation with Mg. Major cations, such as Ca2+, Na+, and Mg2+ occurred in the samples with decreasing order of concentrations. Potassium concentrations were appreciably lower than those for the other major cations. It was reported that the concentrations of K+ in pristine groundwater were less than 5 mg/L, and the value higher than that indicated the possibility that groundwater was affected by contaminants, such as sewage and fertilizer [35]. Only five samples showed K+ concentrations higher than 5 mg/L, and the median value was 1.9 mg/L, which was very close to what was reported for uncontaminated granite aquifer in Korea [36].
Hydrogeochemical evolution of groundwater may be controlled by natural processes, such as dissolution of mineral components through water–rock interaction. In the highly developed aquifer, however, introduction of anthropogenic pollutants can also play a very significant role. Determination of major factors controlling the evolution of groundwater chemistry, especially in relation to NO 3   pollution sources was made successfully by comparing the measured concentrations NO3–N with alkalinity and total cations [8], or alkalinity and EC [30]. Comparison of EC and alkalinity ( HCO 3 concentration) clearly showed distinct distribution patterns depending on NO3–N levels in the groundwater (Figure 2). Most samples with NO3–N concentration lower than DWS remain on or very close to the line that indicates the case when groundwater composition is completely controlled by mineral weathering, while those with higher NO3–N had a tendency to be located further away with increasing concentrations. The slope of the data points in each group also showed a positive correlation with NO3–N level.

3.2. Correlations of Hydrochemical Factors

Many water quality parameters showed strong and moderate one-to-one correlation from Spearman’s rank-order correlation analysis (Table 2). NO 3   distribution was moderately correlated with Cl and moderately to strongly correlated to major cations (Ca2+, Mg2+, Na+, K+). Major cations except for K+ showed strong correlation with Cl , and only Mg2+ showed moderate correlation with SO 4 2 . When there are no external sources, the presence of these cations can be accounted for by introduction to groundwater from clay minerals, such as montmorillonite, illite, and chlorite through water–rock interactions [37]. The correlation analysis of these cations, however, showed that they did not have any appreciable relationship with HCO 3 and a weak negative relationship with F. DO showed strong and moderate negative correlations with HCO 3 and F, respectively.

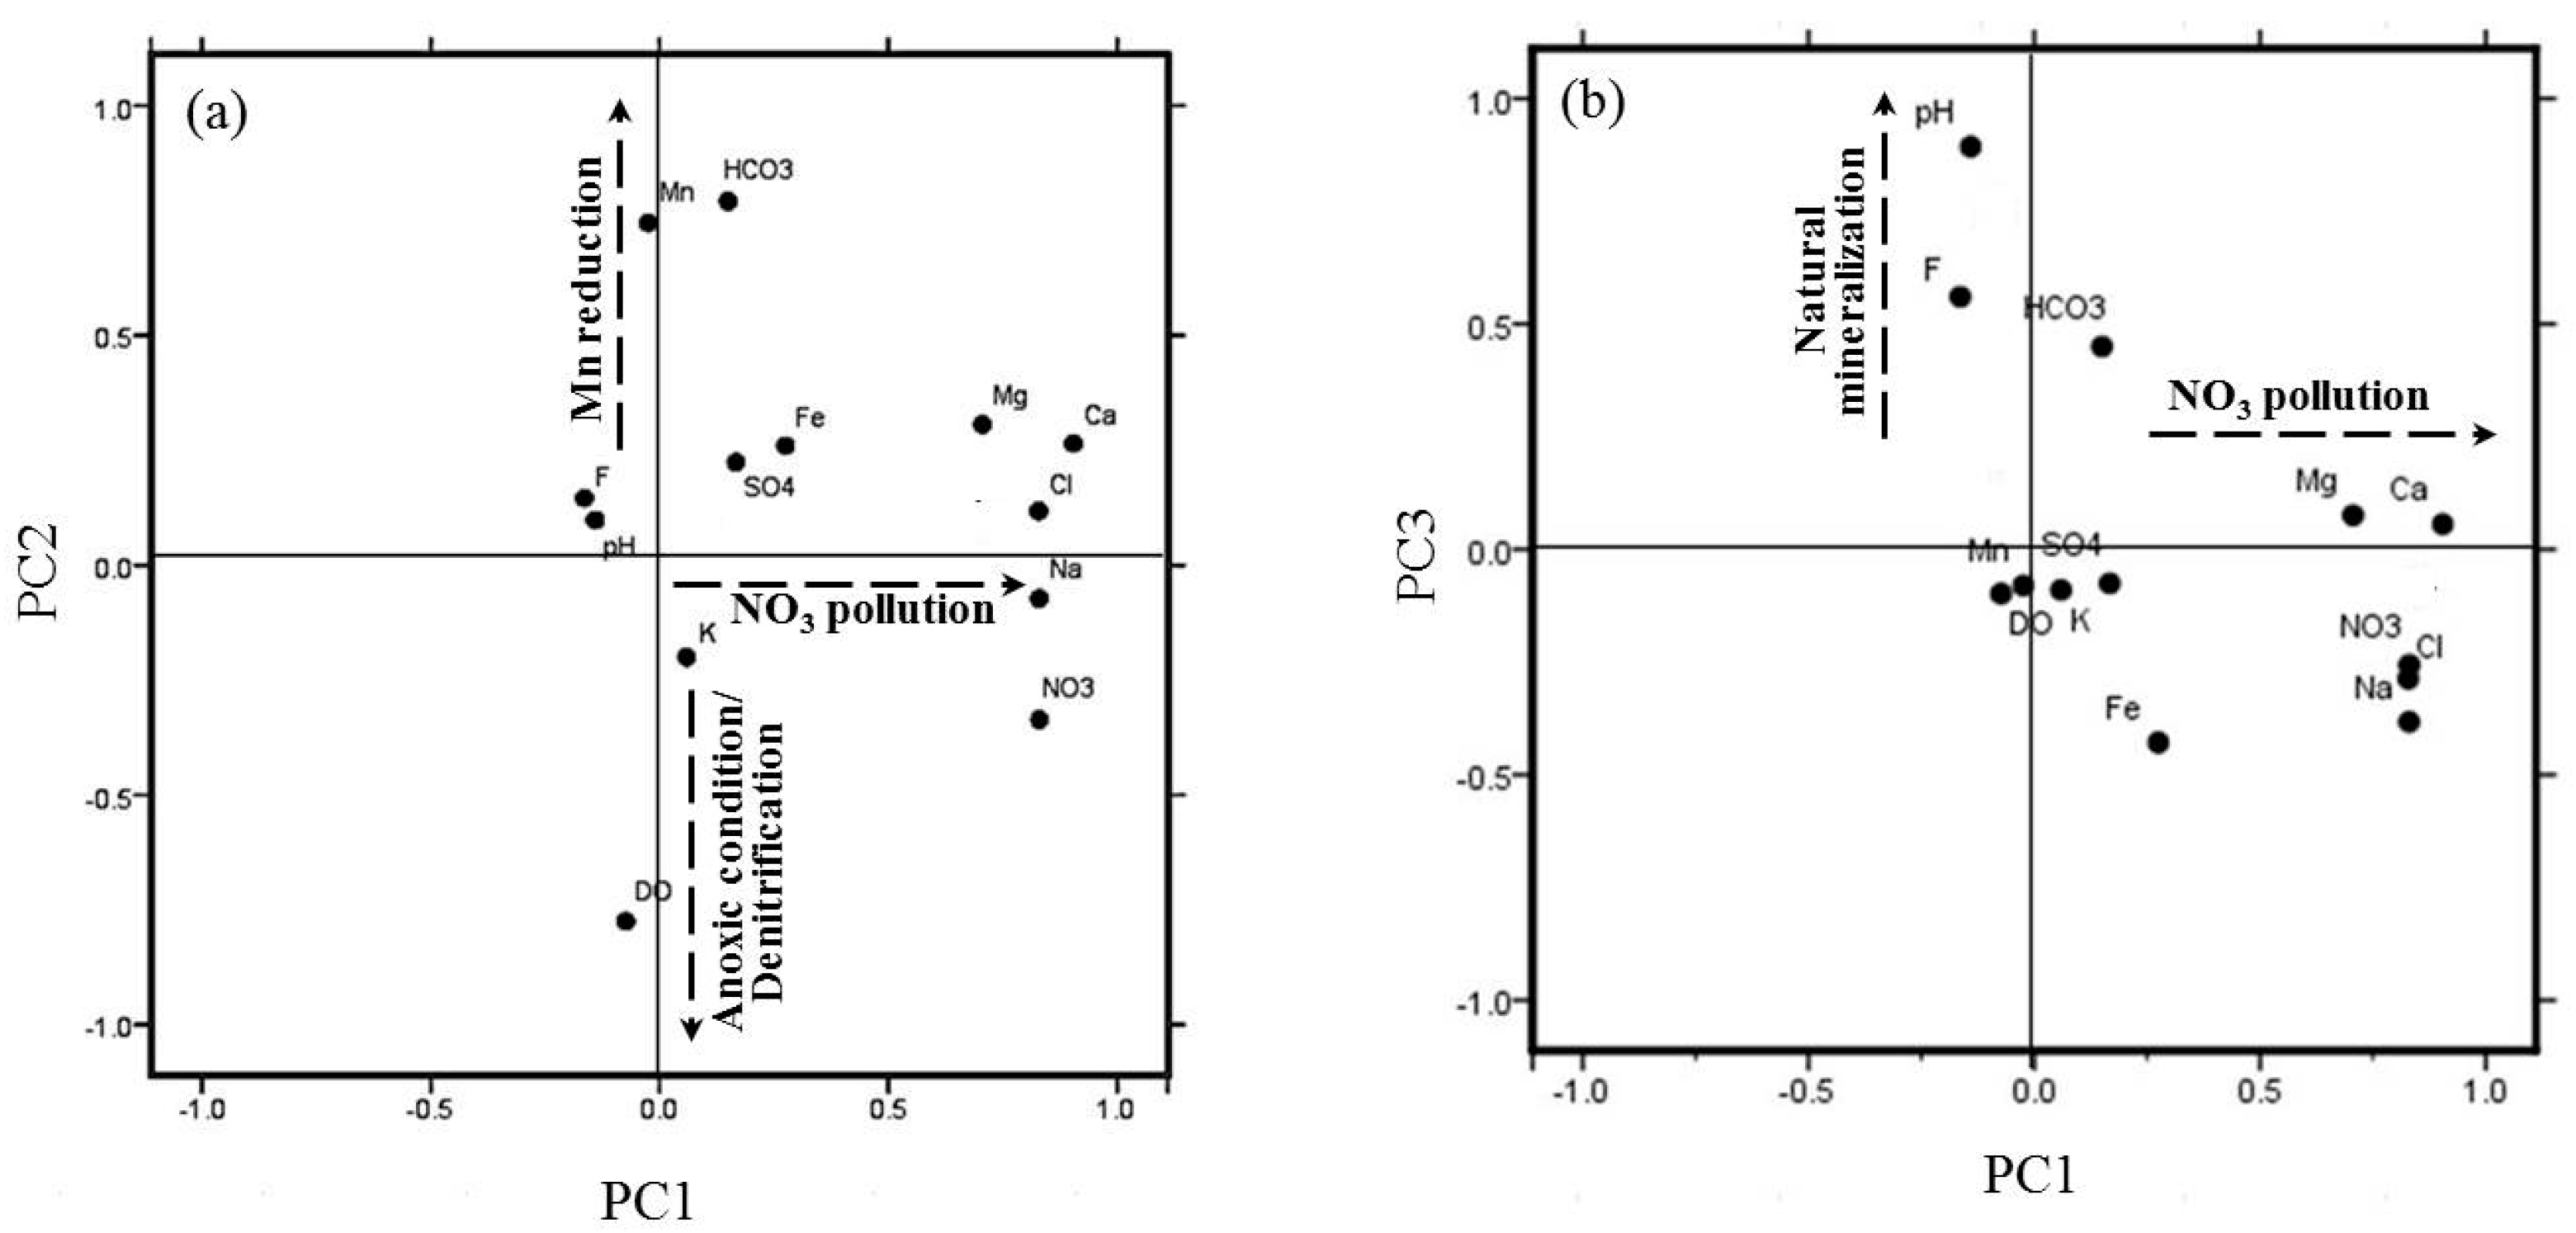
3.3. Principal Component Analysis

Four PCs identified from a scree plot and Kaiser criterion and rotated with the varimax method explained about 71.5% of total variance of samples (Table 3). PC1 showed a strong correlation with Cl and NO 3 , and major cations except for K (Figure 3). PC2 was positively correlated to Mn and HCO 3 and showed significant negative correlation with DO. PC3 was correlated strongly with F and pH, and moderately with HCO 3 . Moderate negative correlations with Cl and NO 3 were also observed. It might be worth noting that PC2 and PC3 had similar negative correlations with NO 3 , while showing opposite correlations with Cl .

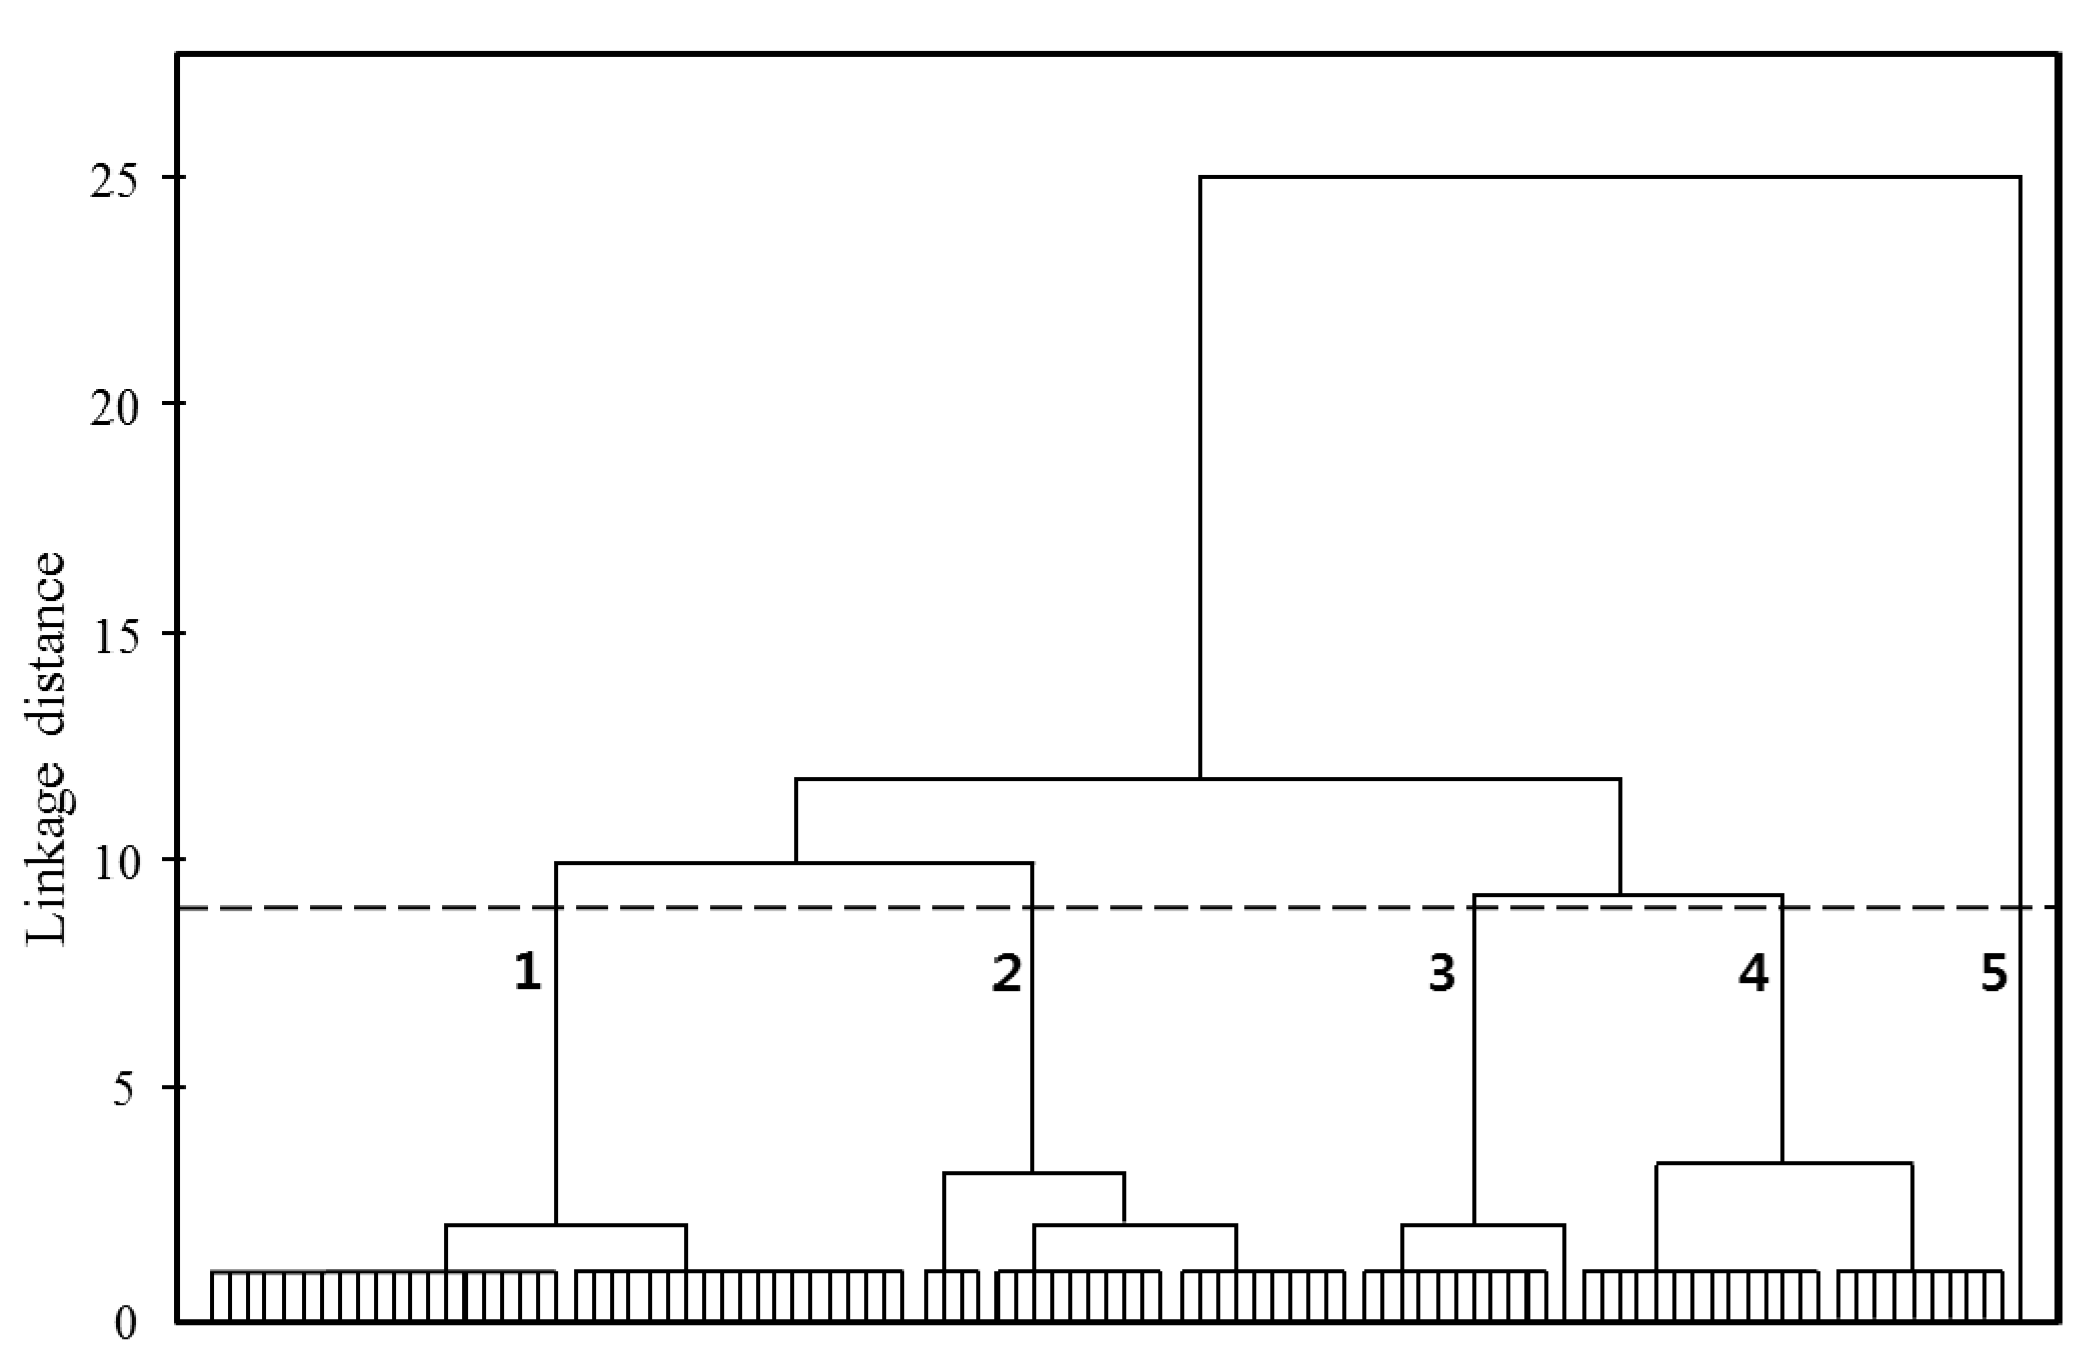
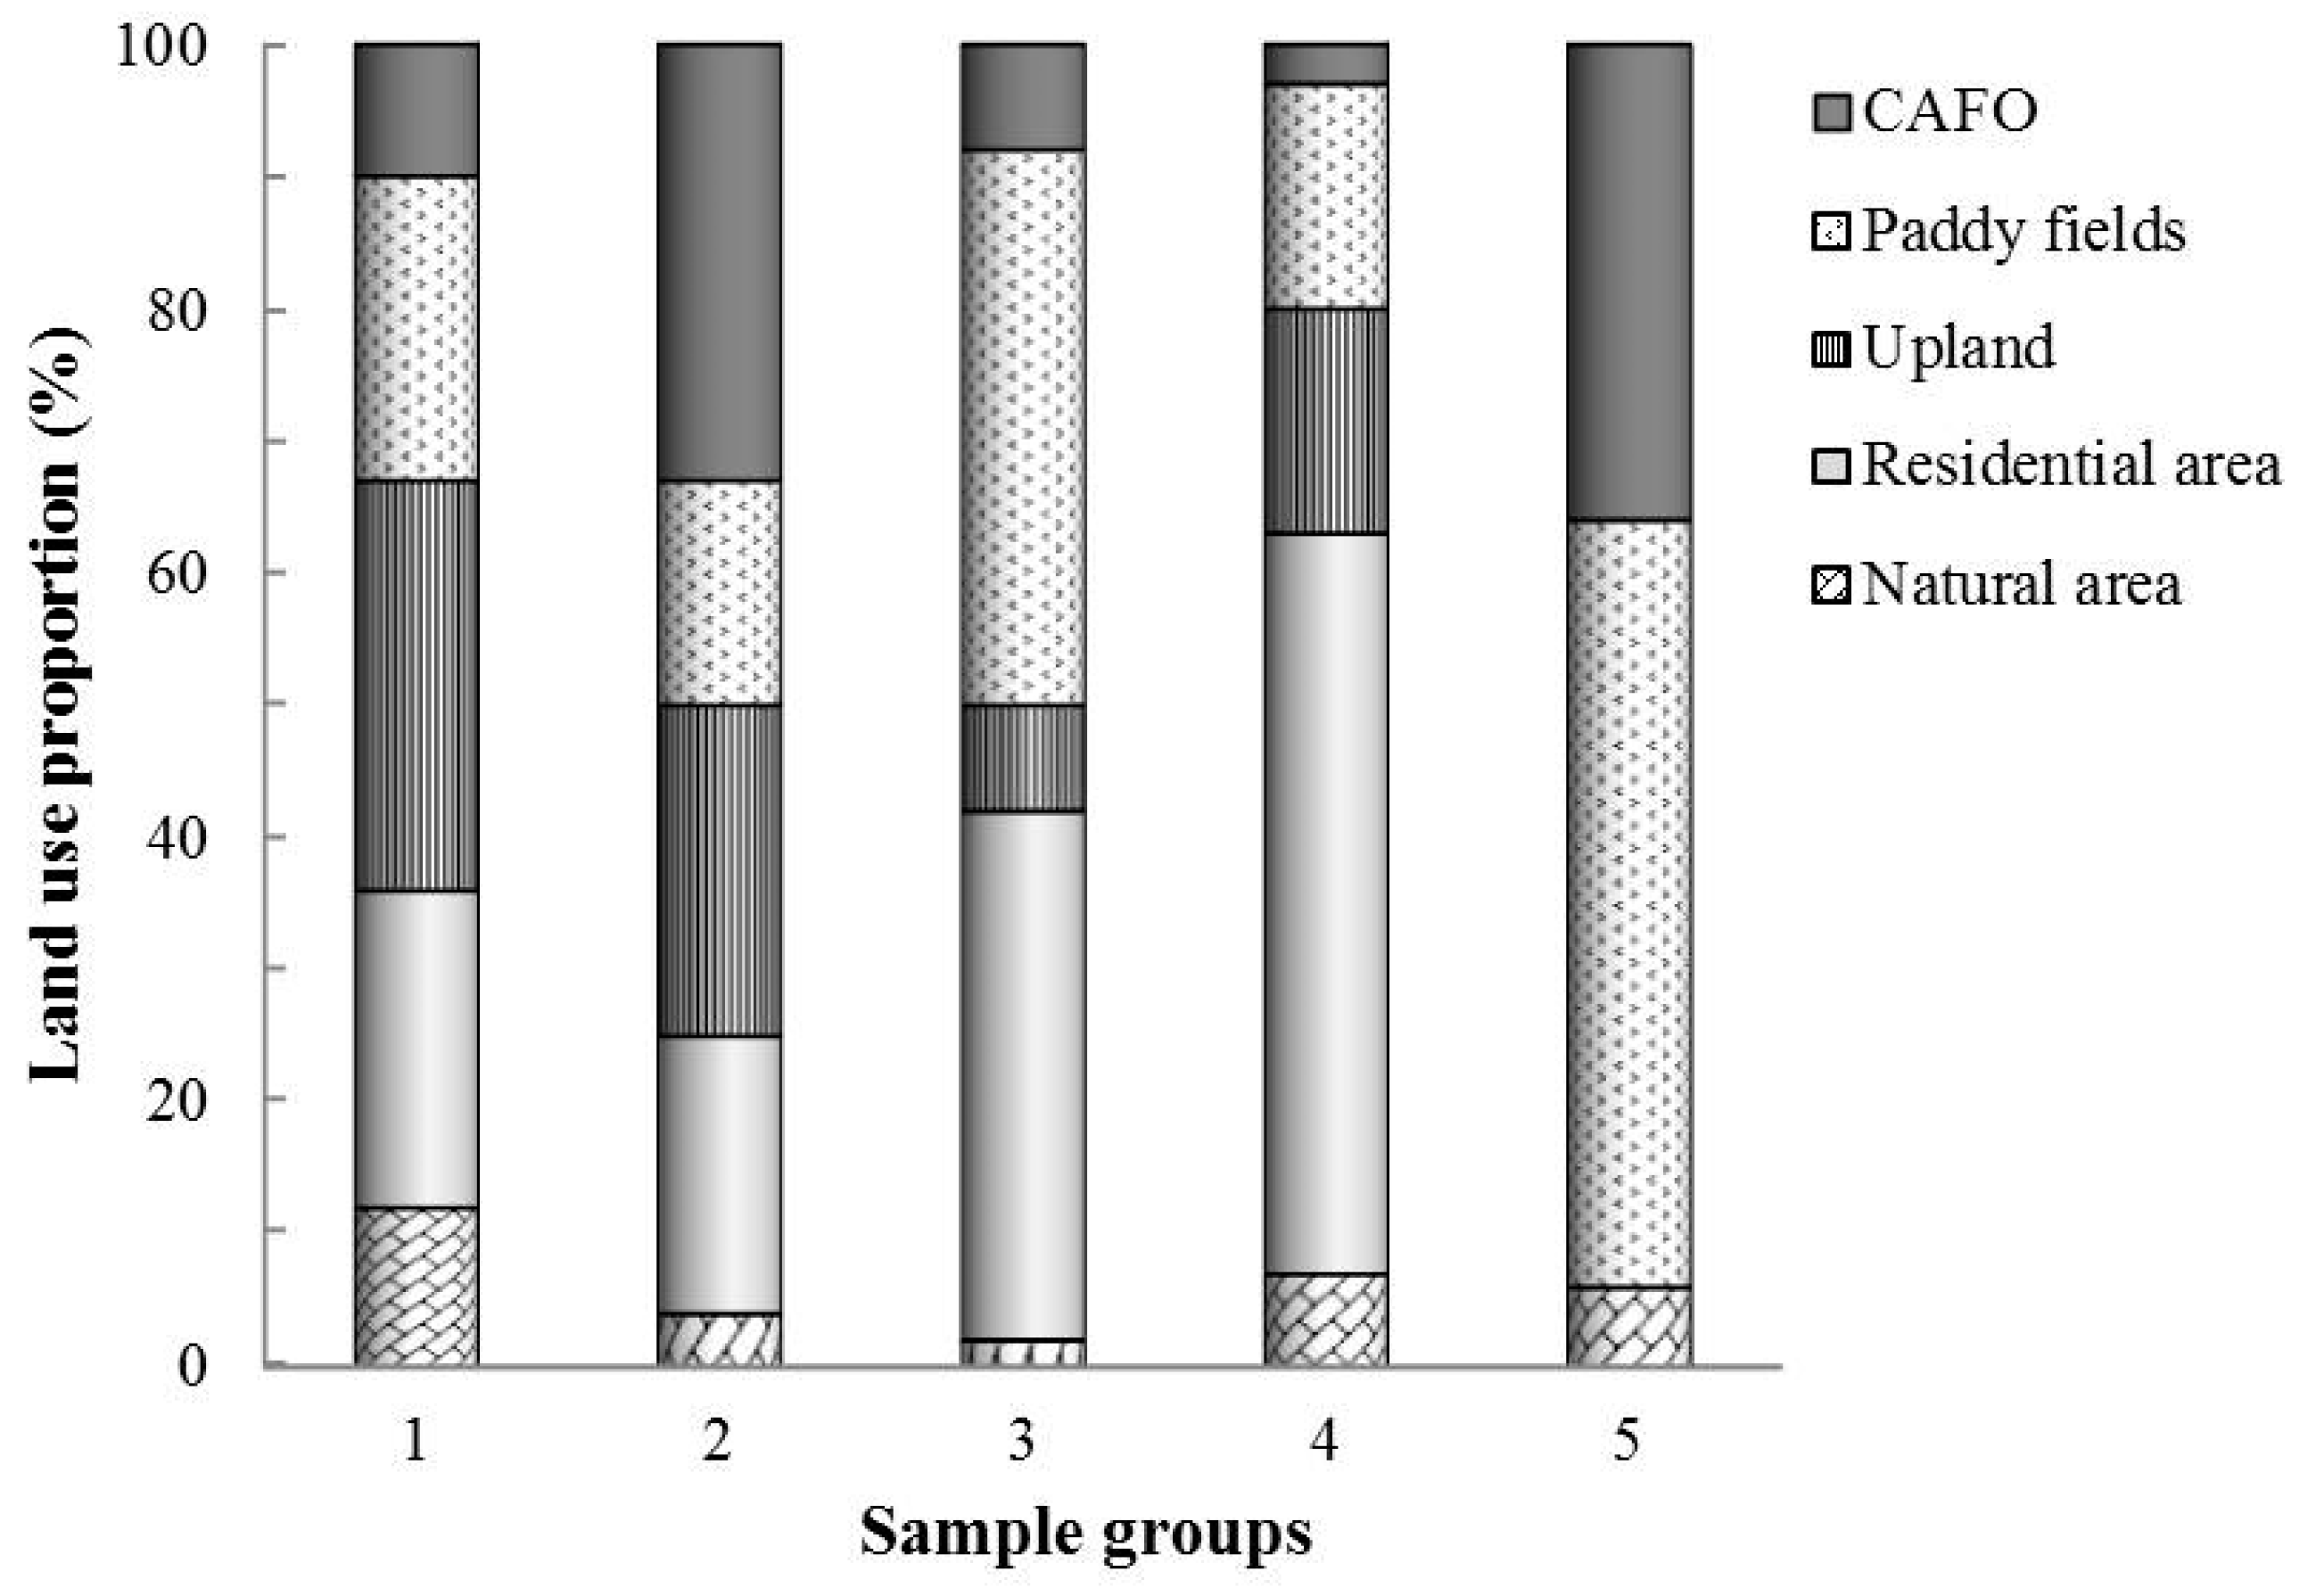
3.4. Hierarchical Cluster Analysis

The application of HCA on the groundwater samples resulted in five groups (Figure 4). Evaluation on linkage distance indicated Groups 3 and 4 had the highest similarity among groups followed by Groups 1 and 2. Group 5, which was composed of a groundwater sample from a single well, was identified to be quite different from the other groups. Comparison of sample groups in terms of topographic features and total well depth showed that Group 1 and 2 wells were relatively shallow with average depths of 48 and 57 m, respectively, while Groups 3 and 4 are composed of wells with average depth deeper than 100 m (113 and 122 m for Groups 3 and 4, respectively). Groups 1 and 2 were mostly located in the hilly terrain where scattered distribution of CAFO complexes and orchards could be found, while many wells in Groups 3 and 4 were found in the area of lowest elevation in terms of average altitude. The well in Group 5 is located at a lowland rice paddy area flanking the hilly terrain of the study area. Located within 20 m from Group 5 well was a pig farm facility, where the largest number (>1000) of pigs was reared in Hongseong area.
Although Group 1 and Group 2 were classified by HCA to be chemically similar, the values of the hydrochemical parameters of each group showed distinct characteristics. Group 2 samples showed the highest concentrations of NO 3 , with median value three times as high as Korean DWS (Figure 5a). EC and other anions also showed high concentrations; EC and Cl were the highest among the four groups and SO 4 2 the second highest (Figure 5g,h). The concentrations of major cations were also the highest in Group 2 except for Mg, which was the second highest (Figure 5b–d). Although Mg concentrations were not the highest in Group 2, they were still higher than those reported in samples with high anthropogenic pollution in other areas in Chungnam province [14]. F and HCO 3 concentrations were the lowest and the second lowest, respectively (Figure 5e,f). DO concentrations were also high, ranging from 4 mg/L to near saturation. Group 1 contained the largest number of samples, and showed nearly identical concentrations of F and pH to those in Group 2. HCO 3 concentrations were also similar in these two groups. Despite similar topographic distribution and well depth, concentrations of NO 3 , Cl , SO 4 2 , and major cations except for K+ were much lower in Group 1 than Group 2 (Figure 5b–d).
Group 3 and Group 4, which were also identified to be similar in HCA, showed differences in some chemical parameters. Group 4 showed characteristics that were quite opposite to those of Group 2 (Figure 5). NO 3 , Cl , and, SO 4 2 concentrations and EC were the lowest among the four groups. The concentrations of monovalent cations are the lowest, and those of divalent cations are the second lowest, although their differences to the lowest group (group 1) are very small. F and pH were the highest among the groups and HCO 3 was the second highest next to Group 3. Group 3 contained only 12 samples. Characteristically, Group 3 samples showed the lowest DO levels and NO 3 concentrations were very close to Group 4. The concentrations of Cl , SO 4 2 , and major cations, however, were much higher than in Group 4 and were comparable to or even higher than those in Group 2.
The chemical analysis on the well that belongs to Group 5 revealed that concentrations of nearly all the hydrochemical parameters were the highest among all the wells investigated in this study. EC (1776 μS/cm) was more than twice as high as the second highest value observed, Cl (335.6 mg/L) about four times, and SO 4 2 (135.4 mg/L) and K+ (154.5 mg/L) three times. NO 3   concentration was also high although it was not the highest among the samples and was approximately a half of the maximum concentration measured. Measured concentration of Mn2+ (11.9 mg/L) was also the highest, which, along with low DO (1.64 mg/L), indicates the presence of reducing conditions.

4. Discussion

4.1. Hydrogeochemical Processes Affecting Groundwater Chemistry

The results in Figure 2 indicate that groundwater mineralization in the study area was driven by two factors, NO 3   contamination and natural process of weathering [14]. Major cations showed high concentrations in many of the samples, which may be introduced to groundwater either through natural water–rock interaction or from contamination sources from the ground surface. Strong correlation with Cl along with weak or no correlation with chemical species ( HCO 3 and F ) commonly used as indicators of water–rock interaction indicate that high concentrations of these cations can be interpreted as a result of input of anthropogenic contaminants rather than natural processes [12].
The results from PCA provided some information on processes that govern the chemistry of groundwater in the study area. Elevated concentrations of Cl , NO 3 and major cations implied that they were introduced to groundwater environment as anthropogenic contaminants of surface origin due to agricultural and livestock feeding activities. Therefore, strong correlations of these chemical species with PC1 can be interpreted that PC1 indicates the process of pollutant input from the surface, which exerted most influence on groundwater chemistry (Table 3; Figure 3a). PC2’s negative correlation with NO 3 , along with positive correlation with Mn2+ and HCO 3 and strong negative correlation with DO, could be due to the formation of reducing conditions, at least locally, in the groundwater environment, such that NO 3   attenuation through denitrification took place. PC3 showed a positive correlation with the aforementioned chemical species indicating water–rock interaction and a negative relationship with of Cl and NO 3 , which seems to indicate that PC3 was related to groundwater chemistry change due to natural mineralization (Table 3; Figure 3b). The fact that PC2 and PC3 had the same negative correlation with NO 3 while showing opposite correlation with Cl may indicate that groundwater NO 3   attenuation in the study area is done in part by denitrification and mixing with the water of deep origin. It is possible that PC4’s strong correlation with SO 4 2 and K was due to introduction of these chemicals from the application of fertilizer (Table 3).
Negative correlations of DO with HCO 3 and F also indicate the possibility that groundwater with sufficient contact time with local lithology in the deep subsurface environment had low DO.

4.2. Nitrate Contamination Source

The major sources of contamination of groundwater that caused widespread NO 3 pollution in the study area can be evaluated by considering the land use patterns around the wells in each group. Distribution of the wells in each clustered group was plotted on a land use map of the study area generated from ArCGIS software (Figure 6). It was shown in a study on the impact of the commonly used vulnerability factors on NO 3   contamination of groundwater that a 50 m radius was most relevant for the correlation of land use and groundwater NO 3   when using circular buffers around the site [38], and the same approach was applied in this study to identify the land use patterns around each well investigated.
Spatial distributions of the wells in Groups 1 and 2 are very similar, mainly on the hilly terrain. Low and comparable concentrations of HCO 3 and F in these two groups, and shallow and similar well depths also indicate that processes that naturally formulated groundwater chemistry can be considered to be similar, if not the same. These groups, however, showed large discrepancies in concentrations of NO 3 , Cl , and major cations, which were remarkable considering the similarities in physicochemical characteristics of the wells. The differences may be explained with land use patterns around the wells. Group 2 wells, which were identified to be most heavily contaminated, were mainly located in areas where CAFO complexes constituted the highest fraction (32%) among the evaluated land use types (Figure 7). The value was at least three times as high as in other groups. This indicates that generation and improper disposal of manure and other animal wastes may have a direct relationship with high concentrations of NO 3 , Cl , and major cations. This argument can be further reinforced by the comparison with the land use pattern of Group 1. Much smaller proportion (9.5%) of the land was occupied by CAFO complexes in Group 1 with uplands, rice paddies and residential areas constituting similar proportions. As CAFO complexes were scattered in the hilly parts of the study area, these differences might be explained by steep groundwater gradients in this type of terrain, which, based on the surface relief pattern of the study area, localize groundwater recharge. The steep downward flow of water might minimize the horizontal radius of impact on the groundwater chemistry of the pollutants released from the contamination sources on the ground surface, especially in shallow groundwater. In this case, hydrochemistry of groundwater in each flow path is affected mostly by what is present on or very close to the surface area directly overlying it. These arguments can be further reinforced by future research on the stable isotope of NO 3 to identify the pollution sources.
Group 3’s characteristic of having low NO 3 concentrations while maintaining high concentrations of Cl and major cations appears to point out that groundwater in this group is under the influence of pollution sources on the ground surface with processes that could selectively alleviate NO 3 pollution. Group 3 contains only 12 wells and many of which are located in lowland areas. Evaluation of land use patterns around Group 3 wells indicated that rice paddies were the most common land use form, which was known to be an agricultural contamination source introducing Cl to groundwater systems along with NO 3   [39,40,41]. The highest concentrations of Mg2+ and SO 4 2 among the groups also support the possibility of contaminant input from paddy fields as these chemicals are the ingredients of commonly applied fertilizers in the area. High concentrations of HCO 3 in this group, however, implies the possibility that overall groundwater chemistry was influenced to some degree by deep groundwater, which could have been especially important during the sampling period due to low precipitation and high pumping rates to contain water on the paddy field in preparation for rice planting.
The land use pattern around Group 4, whose NO 3 concentrations were the lowest among the groups identified in HCA, indicates that the fractions of land that are used for CAFO and rice paddy are the lowest among the groups and residential area constitutes about 60%. This pattern, along with the lowest concentrations of, Cl , and major cations may indicate the possibility of residential area being the least influential contamination sources among the evaluated land use types in the study area. Residential area, however, was identified in a study in Nonsan, another agricultural county in Chungnam province, to be the most important in explaining the NO 3   distribution in groundwater [38], indicating that a significant amount of contaminants could be released from it. As high concentrations of HCO 3 and F and the deepest well depth in Group 4 wells indicate a significant influence from deep groundwater, dilution by relatively uncontaminated deep water might be the process that lowered the concentrations of pollutants if the release of a large amount of pollutants indeed took place. Since DO was negatively correlated with HCO 3 and F (Table 2), it is also possible that introduction of deep groundwater with low DO generated anoxic conditions for denitrification in some locations.
The aforementioned location of Group 5 well and its proximity to the biggest CAFO seemed to contribute a high concentration of hydrochemical compounds. The high concentration of NO 3 in spite of conditions suitable for denitrification might be due to the fact that the amount of NO 3   introduced was too large for complete or near-complete attenuation by denitrification to take place.

4.3. Natural Attenuation of Nitrate

As the results in Figure 5 indicated that high concentrations of chemicals with surface origin exist in some groups with low levels of NO 3 . , the possibility of natural attenuation of NO 3 cannot be completely ruled out. The possibility of natural attenuation can be identified using the data of organic carbon, residence time of groundwater, pH, etc. With the data acquired in this study, no comprehensive evidence was found to support the possibility of denitrification in Groups 1 and 2. Figure 8b shows that pH values of the samples ranged from 5.2 to 7.7 with mean and median values of 6.2 with scattered distribution overall against NO 3 concentrations. The values in each group, however, show clear distinction. All the samples whose pH were less than 6 belong to Groups 1 and 2, and those with values higher than 6.5 are almost entirely composed of samples from Groups 3 and 4. The application of nitrogen compounds, mainly in the form of ammonia and organic nitrogen contained in manure, may lead to nitrification in the vadose zone, a stepwise oxidation of ammonia to NO 3   under aerobic conditions. Stoichiometric evaluation of nitrification indicates that oxidation of ammonia to nitrite by ammonia oxidizing bacteria (AOB) produces hydrogen ion leading to a decrease in pH of the ambient water. Therefore, infiltrating water carrying a large amount of NO 3 is expected to have low pH, and buffer capacity of the vadose zone is not anticipated to be high as the occurrence of carbonate-bearing lithology, which may be because the source material for soil is not pronounced in and near the study area. As the wells in Groups 1 and 2 had high DO concentrations (>4 mg/L; Figure 8a) and shallow well depth, attenuation of NO 3 through a denitrification process in any of the wells in these groups was not feasible, which indicates the possibility that pH in these two groups is low especially in samples with high NO 3 concentrations.
Groups 3–5, however, showed evidence of denitrification in some of the samples. The measured DO concentrations were mostly higher than the threshold concentration of 2 mg/L for denitrification [42]. This concentration, however, is not an absolute criterion, and denitrification at DO as high as 4 mg/L was observed in agricultural fertilizer plumes [43,44]. Dissolved oxygen concentrations lower than 4 mg/L were observed entirely from Groups 3–5 (Figure 8a). Measurement of pH also showed that samples with high pH (pH > 6.5) were almost entirely composed of those from these groups, which might be an indication that the condition suitable for the denitrification process was formed, at least partially, in the groundwater environment (Figure 8b). It was observed that denitrification in the soil sample from a river could increase pH within a very short time period [45]. Denitrification can increase pH because the reduction of NO 3 to N2 with organic substrate as an electron donor results in the production of carbon dioxide and oxygen hydroxide, which may react to form HCO 3 and CO 3 2 [46]. Many of the wells in Groups 3 and 5 were located in rice paddy, whose soil is mainly composed of clayey particles due to the need to retain water on the surface for the most of the growing season, while barley and vegetable field soils are composed of fine sand and silt particles for the efficient drainage of soil water. Retarded downward movement of stagnant water and small pore sizes in the soil make rice paddy an ideal location for depletion of DO and generation of anoxic condition, especially when a sufficient amount of dissolved organic matter is present [47,48,49], and denitrification in groundwater under paddy field was observed in other studies in Korea [14,50]. Although observed pH values were not much higher than ambient pH measured in the Korean National Groundwater Observation Network about 10 km away from the study area, groundwater buffer capacity is not anticipated to be particularly high in the study area with the absence of calcareous rocks, enabling any pH decrease from nitrification to be observed. Development of reducing conditions required for denitrification can be supported further by high concentrations of signature chemicals of reducing conditions, such as Mn2+ especially in samples with low NO 3   concentrations. Fe concentrations, however, did not show a distinct difference among groups. As reduction and dissolution of Fe in groundwater requires the development of highly reducing conditions, it seems that formation of strong reducing conditions did not take place, not even in Group 5, in the study area.
Depending upon biogeochemical processes actually taking place in the vadose zone, the water introduced to the groundwater system will have a certain ratio of concentrations of pollutants released together in agricultural areas, such as NO 3 , Cl , and SO 4 2 . Cl is known to be stable and mobile in the groundwater and NO 3 should be the same as long as aerobic conditions are maintained. Therefore, when the groundwater is aerobic, the initial ratio of these two chemicals is anticipated to remain relatively constant. The ratio will also remain relatively constant when dilution by uncontaminated groundwater takes place. If anoxic condition develops in the groundwater, however, NO 3 and Cl will follow different fates as NO 3 concentration can be reduced by denitrification, whereas Cl concentrations should not be affected, and the ratio of Cl/NO3–N should increase in this case. Comparison with SO 4 2 concentration can also be used to identify highly reducing conditions as SO 4 2 reduction requires strongly reducing conditions. These characteristics have been utilized in many studies to identify the possibility of natural attenuation through denitrification using ionic mass ratios, such as Cl/NO3–N and SO4/Cl [51,52,53,54]. Comparison of Cl/NO3–N ratios showed that they were significantly higher in some samples of Group 3 and Group 5 (Figure 9). As each group was identified in HCA based on similarities of samples in overall groundwater chemistry, it can be assumed that processes that formulate general chemical characteristics of groundwater samples are similar, if not the same, in a group. In other words, Cl/NO3–N ratio should remain relatively constant unless selective reduction in NO 3 concentration takes place. The results in Figure 9 indicate the possibility that nitrogen pollution in rice paddy could be attenuated by at least partial development of anoxic conditions in the groundwater system [49,55]. High Cl/NO3–N ratios were also observed in some samples from Group 4, whose land use pattern indicated minimal contribution from CAFO and rice paddy. The four samples of Group 4 in Figure 9 with Cl/NO3–N > 1.5 were identified to be from very deep wells (depths > 180 m). As the imbalance between water demand and precipitation caused a large amount of groundwater to be pumped during the sampling period, this selective removal of NO 3   could be induced by the introduction of a relatively large amount of deep groundwater under reducing conditions. The fact that samples with high Cl/NO3–N ratios in Group 4 constituted a much smaller fraction than in Group 3, along with low concentrations of Cl , SO 4 2 , and major cations indicated that generation of reducing conditions was mainly caused by the introduction of groundwater of a deep origin rather than top-down process as in Group 3. Much higher concentrations of F in Group 4 may support this argument (Figure 5), and, in this case, high levels of HCO 3 in Group 3 may be the result of a denitrification process due to pollutant input from the surface. Then, the high concentrations of Mn in these groups may not have the same origin.

5. Conclusions

An investigation was performed to characterize the hydrogeochemistry of groundwater with particular emphasis on distribution and attenuation of NO 3   in a region where a variety of pollution sources are present. Contamination of groundwater by NO 3   was significant and widespread with 65% of the samples showing NO 3 concentrations exceeding Korean DWS. Three processes—input of pollutants with surface origin, denitrification or reduction processes, and natural mineralization—were identified from PCA to exert a significant impact on the chemistry of groundwater. Five sample groups were identified from HCA, and land use patterns in each group along with topographic configurations were found to be major factors determining NO 3   contamination. The groups were mainly distributed in the hilly terrain where there is local recharge of water showing extensive impact from chemical compounds with surface origin, and CAFO was identified to be the most significant contributing factor in NO 3   contamination. High DO in infiltrating water seemed to prevent natural attenuation, and steep gradient of downward flow caused groundwater chemistry to be directly impacted by the type of pollution source lying directly above the flow paths. Samples from flat lowland areas, however, showed some evidence of natural attenuation, which, in the case of paddy fields with signatures of pollutant input from the surface, was attributed to denitrification, while dilution due to the introduction of deep groundwater seems to be responsible for reductions of contamination in residential areas. The involvement of deep groundwater in controlling the overall hydrochemistry of NO 3   contamination can differ depending on local water demand and the amount of precipitation, which can change the pumping rate of groundwater.

Acknowledgments

This study was carried out under the financial support of the Jeonbuk Green Environment Center.

Author Contributions

Hyun-su Kim conceived and designed the geochemical investigation; Hyun-su Kim and So-ra Park performed the field investigation and sample measurement, and analyzed the data; Hyun-su Kim wrote the paper.

Conflicts of Interest

The authors declare no conflict of interest. The founding sponsors had no role in the design of the study; in the collection, analyses, or interpretation of data; in the writing of the manuscript, and in the decision to publish the results.

References

  1. World Meteorological Organization (WMO). Comprehensive Assessment of the Freshwater Resources of the World; World Meteorological Organization: Geneva, Switzerland, 1997. [Google Scholar]
  2. Arnell, N.W. Climate change and blobal water resources. Glob. Environ. Chang. 1999, 9 (Suppl. S1), S31–S49. [Google Scholar] [CrossRef]
  3. Alley, W.M.; Healy, R.W.; LaBaugh, J.W.; Reilly, T.E. Flow and storage in groundwater systems. Science 2002, 296, 1985–1990. [Google Scholar] [CrossRef] [PubMed]
  4. Davis, M.L.; Cornwell, D.A. Introduction to Environmental Engineering, 4th ed.; McGraw-Hill: New York, NY, USA, 2008; pp. 226–229. [Google Scholar]
  5. Shindo, J.; Okamoto, K.; Kawashima, H. Prediction of the environmental effects of excess nitrogen caused by increasing food demand with rapid economic growth in eastern Asian countries, 1961–2020. Ecol. Model. 2006, 193, 703–720. [Google Scholar] [CrossRef]
  6. Korea Department Agriculture. Report of the Study on Measure to Reduce the Application of Agricultural Pesticide; Division of Food Policy, Korea Department of Agriculture: Seoul, Korea, 2006. (In Korean)
  7. Min, J.H.; Yun, S.T.; Kim, K.; Kim, H.S.; Hahn, J.; Lee, S.M. Nitrate contamination of alluvial groundwaters in the Nakdong river basin Korea. Geosci. J. 2002, 6, 35–46. (In Korean) [Google Scholar] [CrossRef]
  8. Kim, K.; Rajmohan, N.; Kim, H.J.; Hwang, G.; Cho, M.J. Assessment of groundwater chemistry in a coastal region (Kunsan, Korea) having complex contaminant sources: A stoichiometric approach. Environ. Geol. 2004, 46, 763–774. [Google Scholar] [CrossRef]
  9. Kaown, D.I.; Hyun, Y.J.; Bae, G.O.; Lee, K.K. Factors affecting the spatial pattern of nitrate concentration in shallow groundwater. J. Environ. Qual. 2007, 36, 1479–1487. [Google Scholar] [CrossRef] [PubMed]
  10. Jeon, S.R.; Park, S.J.; Kim, H.S.; Jeong, S.K.; Lee, Y.; Jeong, J. Hydeogeochemical characteristics of groundwater in an agricultural area of Sunchang, South Korea. J. Geol. Soc. Korea 2011, 47, 185–197. (In Korean) [Google Scholar]
  11. Williams, A.; Johnson, J.; Lund, L.; Kabala, Z. Spatial and temporal variations in nitrate contamination of a rural aquifer, California. J. Environ. Qual. 1998, 27, 1147–1157. [Google Scholar] [CrossRef]
  12. Spalding, R.F.; Exner, M.E. Occurrence of nitrate in groundwater—A review. J. Environ. Qual. 1993, 22, 392–402. [Google Scholar] [CrossRef]
  13. Green, C.T.; Böhlke, J.K.; Bekins, B.A.; Phillips, S.P. Mixing effects on apparent reaction rates and isotope fractionation during denitrification in a heterogeneous aquifer. Water Resour. Res. 2010, 46. [Google Scholar] [CrossRef]
  14. Koh, D.C.; Kim, E.Y.; Ryu, J.S.; Ko, K.S. Factors controlling groundwater chemistry in an agricultural area with complex topographic and land use patterns in mid-western South Korea. Hydrol. Process. 2009, 23, 2915–2928. [Google Scholar] [CrossRef]
  15. Mohapatra, P.K.; Vijay, R.; Pujari, P.R.; Sundaray, S.K.; Mohanty, B.P. Determination of processes affecting groundwater quality in the coastal aquifer beneath Puri city, India: A multivariate statistical approach. Water Sci. Technol. 2011, 64, 809–817. [Google Scholar] [CrossRef] [PubMed]
  16. Nolan, B.T. Nitrate behavior in ground waters of the Southeastern USA. J. Environ. Qual. 1999, 28, 1518–1527. [Google Scholar] [CrossRef]
  17. Tang, C.; Chen, J.; Shindo, S.; Sakura, Y.; Zhang, W.; Shen, Y. Assessment of groundwater contamination by nitrates associated with wastewater irrigation: A case study in Shijiazhuang region, China. Hydrol. Process. 2004, 18, 2303–2312. [Google Scholar] [CrossRef]
  18. Thivya, C.S.; Thilagavathi, R.; Prasanna, M.V.; Singaraja, C.; Adithya, V.S.; Nepolian, M. A multivariate statistical approach to identify the spatio-temporal variation of geochemical process in a hard rock auifer. Environ. Monit. Assess. 2015, 187. [Google Scholar] [CrossRef] [PubMed]
  19. Farnham, I.M.; Johannesson, K.H.; Sing, A.K.; Hodge, V.F.; Stetzenbach, K.J. Factor analytical approaches for evaluating groundwater trace element chemistry data. Anal. Chim. Acta 2003, 490, 123–138. [Google Scholar] [CrossRef]
  20. Ministry for Food Agriculture Forestry and Fisheries. Food Agriculture Forestry and Fisheries Statistical Yearbook; Ministry for Food Agriculture Forestry and Fisheries: Seoul, Korea, 2011.
  21. Ki, M.G.; Koh, D.C.; Yoon, H.; Kim, H.S. Temporal variability of nitrate concentration in groundwater affected by intensive agricultural activities in a rural area of Hongseong, South Korea. Environ. Earth Sci. 2015, 74, 6147–6161. [Google Scholar] [CrossRef]
  22. Statistics Korea. Statistical Yearbook of Hongseong; Statistics Korea: Hongseong, Korea, 2013. (In Korean)
  23. Lee, J.H.; Kim, S.S. Geologic Map of Hongseong (1:50000); Geological Society of Korea: Seoul, Korea, 1963; p. 33.
  24. Thyne, G.; Guler, C.; Poeter, E. Sequential analysis of hydrochemical data for watershed characterization. Ground Water 2004, 42, 711–723. [Google Scholar] [CrossRef] [PubMed]
  25. Helena, B.; Pardo, R.; Vega, M.; Barrado, E.; Fernadez, J.M.; Fernandez, L. Temporal evolution of ground water composition in an alluvial aquifer (Pisuerga River, Spain) by principal component analysis. Water Res. 2000, 34, 807–816. [Google Scholar] [CrossRef]
  26. Suk, H.; Lee, K.K. Characterization of a ground water hydrochemical system through multivariate analysis: Clustering into ground water zones. Ground Water 1999, 37, 358–366. [Google Scholar] [CrossRef]
  27. Kim, K.; Jeong, G. Factors influencing natural occurrence of fluoride-rich groundwater: A case study in the southeastern part of the Korean Peninsula. Chemosphere 2005, 58, 1399–1408. [Google Scholar] [CrossRef] [PubMed]
  28. Madison, R.J.; Brunett, J.O. Overview of the Occurrences of Nitrate in Groundwater of the United States; U.S. Geological Survery Water Supply Paper: Washington, DC, USA, 1985; Volume 2275, pp. 93–105.
  29. Nolan, B.T.; Hitt, K.J. Vulnerability of shallow groundwater and drinking-water wells to nitrate in the United States. Environ. Sci. Technol. 2006, 40, 7834–7840. [Google Scholar] [CrossRef] [PubMed]
  30. Koh, D.C.; Ko, K.S.; Kim, Y.; Lee, S.G.; Chang, H.W. Effect of agricultural land use on the chemistry of groundwater from basaltic aquifer, Jeju Islnad, South Korea. Hydrogeol. J. 2007, 5, 727–743. [Google Scholar] [CrossRef]
  31. Hill, A.R. Nitrate distribution in the groundwater of the Alliston region of Ontaniro, Canada. Ground Water 1982, 20, 696–702. [Google Scholar] [CrossRef]
  32. Poinke, H.B.; Urban, J.B. Effect of agricultural land use on groundwater quality in a small Pennsylvania watershed. Ground Water 1984, 23, 68–80. [Google Scholar] [CrossRef]
  33. Rock, L.; Mayer, B. Isotopic assessment of sources and processes affecting sulfate and nitrte in surface water and groundwater of Luxembourg. Isotopes Environ. Health Stud. 2002, 38, 191–206. [Google Scholar] [CrossRef] [PubMed]
  34. Negrel, P.; Pauwels, H. Interaction between different groundwaters in Brittany catchments (France): Characterizing multiple sources through strontium- and Sulphur isotope trancing. Water Air Soil Pollut. 2004, 151, 261–285. [Google Scholar] [CrossRef]
  35. Choi, D. Formation of Jeju island and the characteristics of groundwater. J. Cheju Stud. 1988, 5, 59–78. (In Korean) [Google Scholar]
  36. Lee, J.; Jeon, H.; Jeon, Y. Geochemical characteristics of groundwater in relation to aquifer geology and temperature—A comparison with groundwater in granitic aquifer. J. Soil Groundw. Environ. 1997, 4, 212–222. [Google Scholar]
  37. Kumar, M.; Ramanathan, A.L.; Rao, M.S.; Kumar, B. Identification and evaluation of hydrogeochemical processes in the groundwater environment of Delhi, India. Environ. Geol. 2006, 50, 1025–1039. [Google Scholar] [CrossRef]
  38. Kim, E.Y.; Koh, D.C.; Ko, K.S.; Yoe, I.W. Prediction of nitrate contamination of groundwater in the northern Nonsan area using multiple regression analysis. J. Soil Groundw. Environ. 2008, 13, 57–73. [Google Scholar]
  39. Böhlke, J.K. Groundwater recharge and agricultural contamination. Hydrogeol. J. 2002, 10, 153–179. [Google Scholar] [CrossRef]
  40. Liang, X.Q.; Harter, T.; Porta, L.; van Kessel, C.; Linquist, B.A. Nitrate leaching in Californian rice fields: A field- and regional-scale assessment. Sci. Total Environ. 2014, 43, 881–894. [Google Scholar] [CrossRef] [PubMed]
  41. Kao, Y.H.; Liu, C.W.; Jang, C.S.; Zanh, S.W.; Lin, K.H. Assessment of nitrogen contamination of groundwater in paddy and upland fields. Paddy Water Environ. 2011, 9, 301–307. [Google Scholar] [CrossRef]
  42. Rivett, M.O.; Buss, S.R.; Morgan, P.; Smith, J.W.N.; Bemment, C.D. Nitrate attenuation in groundwater: A review of biogeochemical controlling processes. Water Res. 2008, 42, 4215–4232. [Google Scholar] [CrossRef] [PubMed]
  43. Böhlke, J.K.; Denver, J.M. Combined use of groundwater dating, chemical, and isotopic analyses to resolve the history and fate of nitrte contamination in two agricultural watersheds, Atlantic coastal plain, Maryland. Water Resour. Res. 1995, 31, 2319–2339. [Google Scholar] [CrossRef]
  44. Tang, C.; Sakura, Y. The characteristics of geochemistry in a headwater wetland, Chiba, Japan. In Dynamics and Biogeochemistry of River Corridors and Wetlands; Heathwaite, A.L., Ed.; IAHS Publication: Wallingford, UK, 2005; Volume 294, pp. 167–175. [Google Scholar]
  45. Rust, C.M.; Aelion, C.M.; Flora, J.R.V. Control of pH during denitrification in subsurface sediment microcosm using encapsulated phosphate buffer. Water Res. 2000, 34, 1447–1454. [Google Scholar] [CrossRef]
  46. Drtil, M.; Nemeth, P.N.; Kucman, K.; Bodik, I.; Kasperek, V. Acidobasic balances in the course of heterotrophic denitrification. Water Res. 1995, 29, 1353–1360. [Google Scholar] [CrossRef]
  47. Minzoni, F.; Bonetto, C.; Golterman, H.L. The nitrogen cycle in shallow water sediment systems of rice fields. Part 1: The denitrification process. Hydrobiologia 1988, 159, 189–202. [Google Scholar] [CrossRef]
  48. Xing, G.X.; Cao, Y.C.; Shi, S.L.; Sun, G.Q.; Du, L.J.; Zhu, J.G. Denitrification in underground saturated soil in a rice paddy region. Soil Biol. Biochem. 2002, 34, 1593–1598. [Google Scholar] [CrossRef]
  49. Kingsbury, J.A. Shallow Ground-Water Quality in Agricultural Areas of Northern Alabama and Middle Tennessee, 2000–2001; U.S. Geological Survey Water Resources Investigations Report 03-4181; U.S. Geological Survey: Nashville, TN, USA, 2003; p. 38.
  50. Kim, H.; Kaown, D.; Mayer, B.; Lee, J.; Hyun, Y.; Lee, K. Identifying the sources of nitrate contamination of groundwater in an agricultural area (Heaan basin, Korea) using isotope and microbial community analyses. Sci. Total Environ. 2015, 533, 566–575. [Google Scholar] [CrossRef] [PubMed]
  51. Böttcher, J.; Strebel, O.; Voerkelius, S.; Schmidt, H.L. Using isotope fractionation of nitrate-nitrogen and nitrate-oxygen for evaluation of microbial denitrification in a sandy aquifer. J. Hydrol. 1990, 114, 413–424. [Google Scholar] [CrossRef]
  52. Postma, D.; Boesen, C.; Kristiansen, H.; Larsen, F. Nitrate reduction in an unconfined sandy aquifer: Water chemistry, reduction processes, and geochemical modeling. Water Resour. Res. 1991, 27, 2027–2045. [Google Scholar] [CrossRef]
  53. Kazemi, G.A.; Lehr, J.H.; Perrochet, P. Groundwater Age; Wiley-Interscience: Hoboken, NJ, USA, 2006. [Google Scholar]
  54. Murglet, D.; Tick, G.R. Understanding the sources and fate of nitrate in a highly developed aquifer system. J. Contam. Hydrol. 2013, 155, 69–81. [Google Scholar] [CrossRef] [PubMed]
  55. Mengis, M.; Schiff, S.L.; Harris, M.; English, M.C.; Aravena, R.; Elgood, R.J.; MacLean, A. Multiple geochemical and isotopic approaches for assessing ground water NO3 elimination in a riparian zone. Ground Water 1999, 37, 448–457. [Google Scholar] [CrossRef]
Figure 1. Contour map of elevation of the study area. Solid circles in the map represent locations of the wells where samples were collected.
Water 08 00345 g001
Figure 2. Effect of NO 3   pollution on electrical conductivity and alkalinity. The dashed line indicates concentrations due to natural processes of weathering. A sample whose EC was 1776 μS/cm was excluded from the figure.
Water 08 00345 g002
Figure 3. Principal component (PC) loading plots: (a) PC1 vs. PC2; (b) PC1 vs. PC3.
Water 08 00345 g003
Figure 4. Dendrogram from hierarchical cluster analysis.
Water 08 00345 g004
Figure 5. Box-and-whisker plots of some of the measured parameters of the clustered groups: (a) NO3–N; (b) Na; (c) Ca; (d) Mg; (e) alkalinity (HCO3); (f) F; (g) Cl; (h) SO4.
Water 08 00345 g005
Figure 6. Distribution of the clustered groups on a land use map.
Water 08 00345 g006
Figure 7. Proportions of land uses for the clustered groups. The land use patterns were assigned by analyzing a 50 m radius buffer.
Water 08 00345 g007
Figure 8. Bivariate relations of the samples in clustered groups between NO3–N and some hydrochemical parameters: (a) NO3–N vs. pH; (b) NO3–N vs. pH; (c) NO3–N vs. Mn; (d) NO3–N vs. Fe.
Water 08 00345 g008
Figure 9. Cl/NO3 versus NO3–N plots of the samples in each clustered groups.
Water 08 00345 g009
Table 1. Summary of statistics of measured field parameters and concentrations of dissolved components.
StatisticDepth (m)pHEC (μS/cm)DO (mg/L)Temp (°C)Eh (mV)HCO3 (mg/L)F (mg/L)Cl (mg/L)Br (mg/L)
Min10.05.2114.00.89.516.90.00.05.50.0
Max240.07.71776.011.519.3538.4232.92.3335.60.2
Average56.16.2334.17.115.0233.853.00.133.20.0
25%48.06.0229.55.714.6193.025.60.017.90.0
Median50.06.2305.07.615.0230.040.30.127.50.0
75%84.06.4370.08.815.6270.966.60.139.10.1
StatisticNO3–N (mg/L)SO4 (mg/L)Ca (mg/L)Mg (mg/L)Na (mg/L)K (mg/L)Fe (mg/L)Mn (mg/L)Si (mg/L)Sr (mg/L)
Min0.010.04.20.75.30.60.00.05.30.0
Max67.21135.4102.136.577.3154.50.211.922.21.2
Average17.6312.229.26.821.84.20.040.1915.20.3
25%7.882.818.43.515.61.30.030.0714.10.2
Median15.387.526.55.420.01.90.050.0215.60.3
75%23.2915.137.68.326.42.80.010.00417.00.4
Table 2. Spearman’s rank correlation coefficients between measured parameters.
VariablespHECDOHCO3FClNO3SO4CaMgNaK
pH1
EC−0.2471
DO−0.173−0.1301
HCO30.6270.079−0.6281
F0.663−0.289−0.3890.5301
Cl−0.2660.794−0.1720.087−0.2651
NO3−0.4030.7250.223−0.253−0.4610.5861
SO40.0220.327−0.4150.2390.0370.2470.0071
Ca0.0150.865−0.2620.372−0.0640.7820.6010.3791
Mg−0.0150.764−0.3110.341−0.0290.7280.4310.5210.7771
Na−0.4080.7170.003−0.059−0.3470.7490.805−0.0330.6330.4261
K−0.5200.5080.054−0.305−0.4900.4390.5180.3230.3290.4030.3881
Note: Coefficients are significant at the 0.01 level (2-tailed), and those higher than 0.7 are shown in bold characters.
Table 3. Loadings of principal components rotated by varimax method.
VariablesPC1PC2PC3PC4
Ca0.904
NO30.830(−0.336)
Na0.830(−0.383)
Cl0.828
Mg0.7060.3060.416
HCO30.7920.450
DO−0.775
Mn0.745
pH0.893
F0.560
Fe(−0.428)0.323
SO40.825
K0.734
Eigenvalue3.56322.2681.8311.636
Percentage variance explained27.40717.44914.08312.585
Cumulative percentage variance explained27.40744.85558.93871.523
Note: Loadings higher than 0.7 were shown in bold characters. Only loadings higher than 0.3 were listed.

