Article

Energy Recovery Using Micro-Hydropower Technology in Water Supply Systems: The Case Study of the City of Fribourg

1
Civil Engineering Research and Innovation for Sustainability, Instituto Superior Técnico, Universidade de Lisboa, Lisboa 1049-001, Portugal
2
Laboratory of Hydraulic Constructions, École Polytechnique Fédérale de Lausanne, Lausanne 1015, Switzerland
*
Author to whom correspondence should be addressed.
Water 2016, 8(8), 344; https://doi.org/10.3390/w8080344
Submission received: 21 June 2016 / Revised: 3 August 2016 / Accepted: 9 August 2016 / Published: 12 August 2016
(This article belongs to the Special Issue Water Systems towards New Future Challenges)

Abstract

:
Water supply systems (WWSs) are one of the main manmade water infrastructures presenting potential for micro-hydropower. Within urban networks, local decentralized micro-hydropower plants (MHPs) may be inserted in the regional electricity grid or used for self-consumption at the local grid level. Nevertheless, such networks are complex and the quantification of the potential for micro-hydropower other than that achieved by replacing pressure reducing valves (PRVs) is difficult. In this work, a methodology to quantify the potential for hydropower based on the excess energy in a network is proposed and applied to a real case. A constructive solution is presented based on the use of a novel micro-turbine for energy conversion, the five blade tubular propeller (5BTP). The location of the MHP within the network is defined with an optimization algorithm that maximizes the net present value after 20 years of operation. These concepts are tested for the WSS in the city of Fribourg, Switzerland. The proposed solution captures 10% of the city’s energy potential and represents an economic interest. The results confirm the location of PRVs as potential sites for energy recovery and stress the need for careful sensitivity analysis of the consumption. Finally, an expedited method is derived to estimate the costs and energy that one 5BTP can produce in a given network.

Graphical Abstract

1. Introduction

A water supply system (WSS) is a set of civil infrastructures (tanks, pipes and others), hydro-mechanical facilities, electrical equipment and services that extracts, conveys and distributes water to consumers. This distribution must be compatible with the demand in both quantity and quality [1]. A sub-grid of a water supply network, also termed a “district metered area”, is a part of the network between two nodes where the head pressure is controlled. This pressure is maintained constant or follows a certain schedule [2] to ensure that there is an optimal pressure distribution in all the branches downstream. This is normally ensured by pressure reducing valves (PRVs), but recent studies have proposed their replacement by turbines. Pumps operated as turbines and Kaplan turbines are the technologies proposed by [3,4] for low-head sites. The study presented in [4] has shown that there is an economical interest in micro-hydropower in WSSs. This study was performed at a regional scale, identifying existing infrastructure such as PRVs and reservoirs where there is potential for energy recovery. Moreover, there is potential for energy production within the urban network itself. Besides the locations where PRVs are installed, there are also areas within the sub-grids that have more pressure than necessary, even if not excessive, because of their connection to other higher areas [5].
The use of PRVs or even micro-turbines in a WSS may seem illogical, since most systems need pumping. Nevertheless, the use of operational pressure control has proven to be cost-effective for reducing leakage problems [1,6]. Water loss occurs due to the structural deterioration of the pipes [7]. Local energy dissipation is seen to reduce the frequency of pipe bursts [8], ensure the quality standards of water [9] and protect roads and building foundations from underground cavities originating from water losses [10]. From the perspective of hydropower, the implementation of production units in existing infrastructure has the economic advantage of low costs [11] given the synergies with the existing facilities of the WSS, of consumption dependent discharges, which are predictable and almost guaranteed, and of benefiting several countries with respect to legal and financial incentives for self-generation and self-consumption (e.g., feed-in tariffs provided for renewable energies). However, it is worth mentioning that the feed-in-tariff regulations vary considerably between countries and, for example, in the UK, a micro-hydropower plant (MHP) downstream from any pumping station is not eligible for the subvention [12]. In addition to the abovementioned synergies with the existing WSS facilities, the energy produced may justify the installation of a grid-connected generator or local consumption [13]; the latter provides financial savings by avoiding external consumption and expensive electrical connections [14]. The installation of these systems is highly dependent on the costs associated with the turbine, construction and grid connection [4].
Examples of solutions for the installation of MHPs in WSSs can be found in the literature. For example, the installation of PATs as replacement for a PRV in the an urban water distribution system of Pompei, with discharges between 20 and 50 L/s and heads between 35 and 90 m, would produce between 20 and 94 MWh/year [3]. In Portland, Oregon, a PRV was replaced by a 10’’ (approx. 250 mm) micro turbine that generates 150 MWh/year with 30 kW of installed power [15]. In Hong Kong, an eight blade spherical inline turbine is expected to produce 700 kWh/year in the city’s water main pipes [16]. Finally, the installation of a turbine replacing a break pressure tank in Kildare in Ireland could generate approximately 237 MWh/year from 200 kPa to 17,910 m3/day [17].
Although the potential for energy production within urban WSSs exists, it is difficult to quantify unless focusing on a particular location. Distribution networks are complex systems, usually composed of multiple loops and asymmetric consumption in both time and space. The optimal location of turbines within such systems is a subject of research [5,18,19]. Moreover, before enduring deep analyses and simulations of turbine operation and water demand scenarios, a measure of the excess energy available within the city network, indicating the potential for that network to be used for hydropower, would be useful for WSS managers.
In this research, a method for the evaluation of the potential for hydropower in a city is presented. This method is then applied to a case study city and compared with the actual energy production with a proposed hydropower scheme. The energy production is estimated using an algorithm for the identification of optimal location of the micro-hydropower units considering the whole network where infrastructure may or may not exist. In Section 2, the two methodologies are presented, for potential assessment and for the actual energy production simulation. The case study, the city of Fribourg in Switzerland, and the hydropower scheme are described in Section 3. The results are presented and discussed in Section 4. Section 5 presents a straightforward methodology that is proposed for the presented hydropower scheme and the main conclusions are drawn in Section 6.

2. Methodology

2.1. Availability of Excess Energy

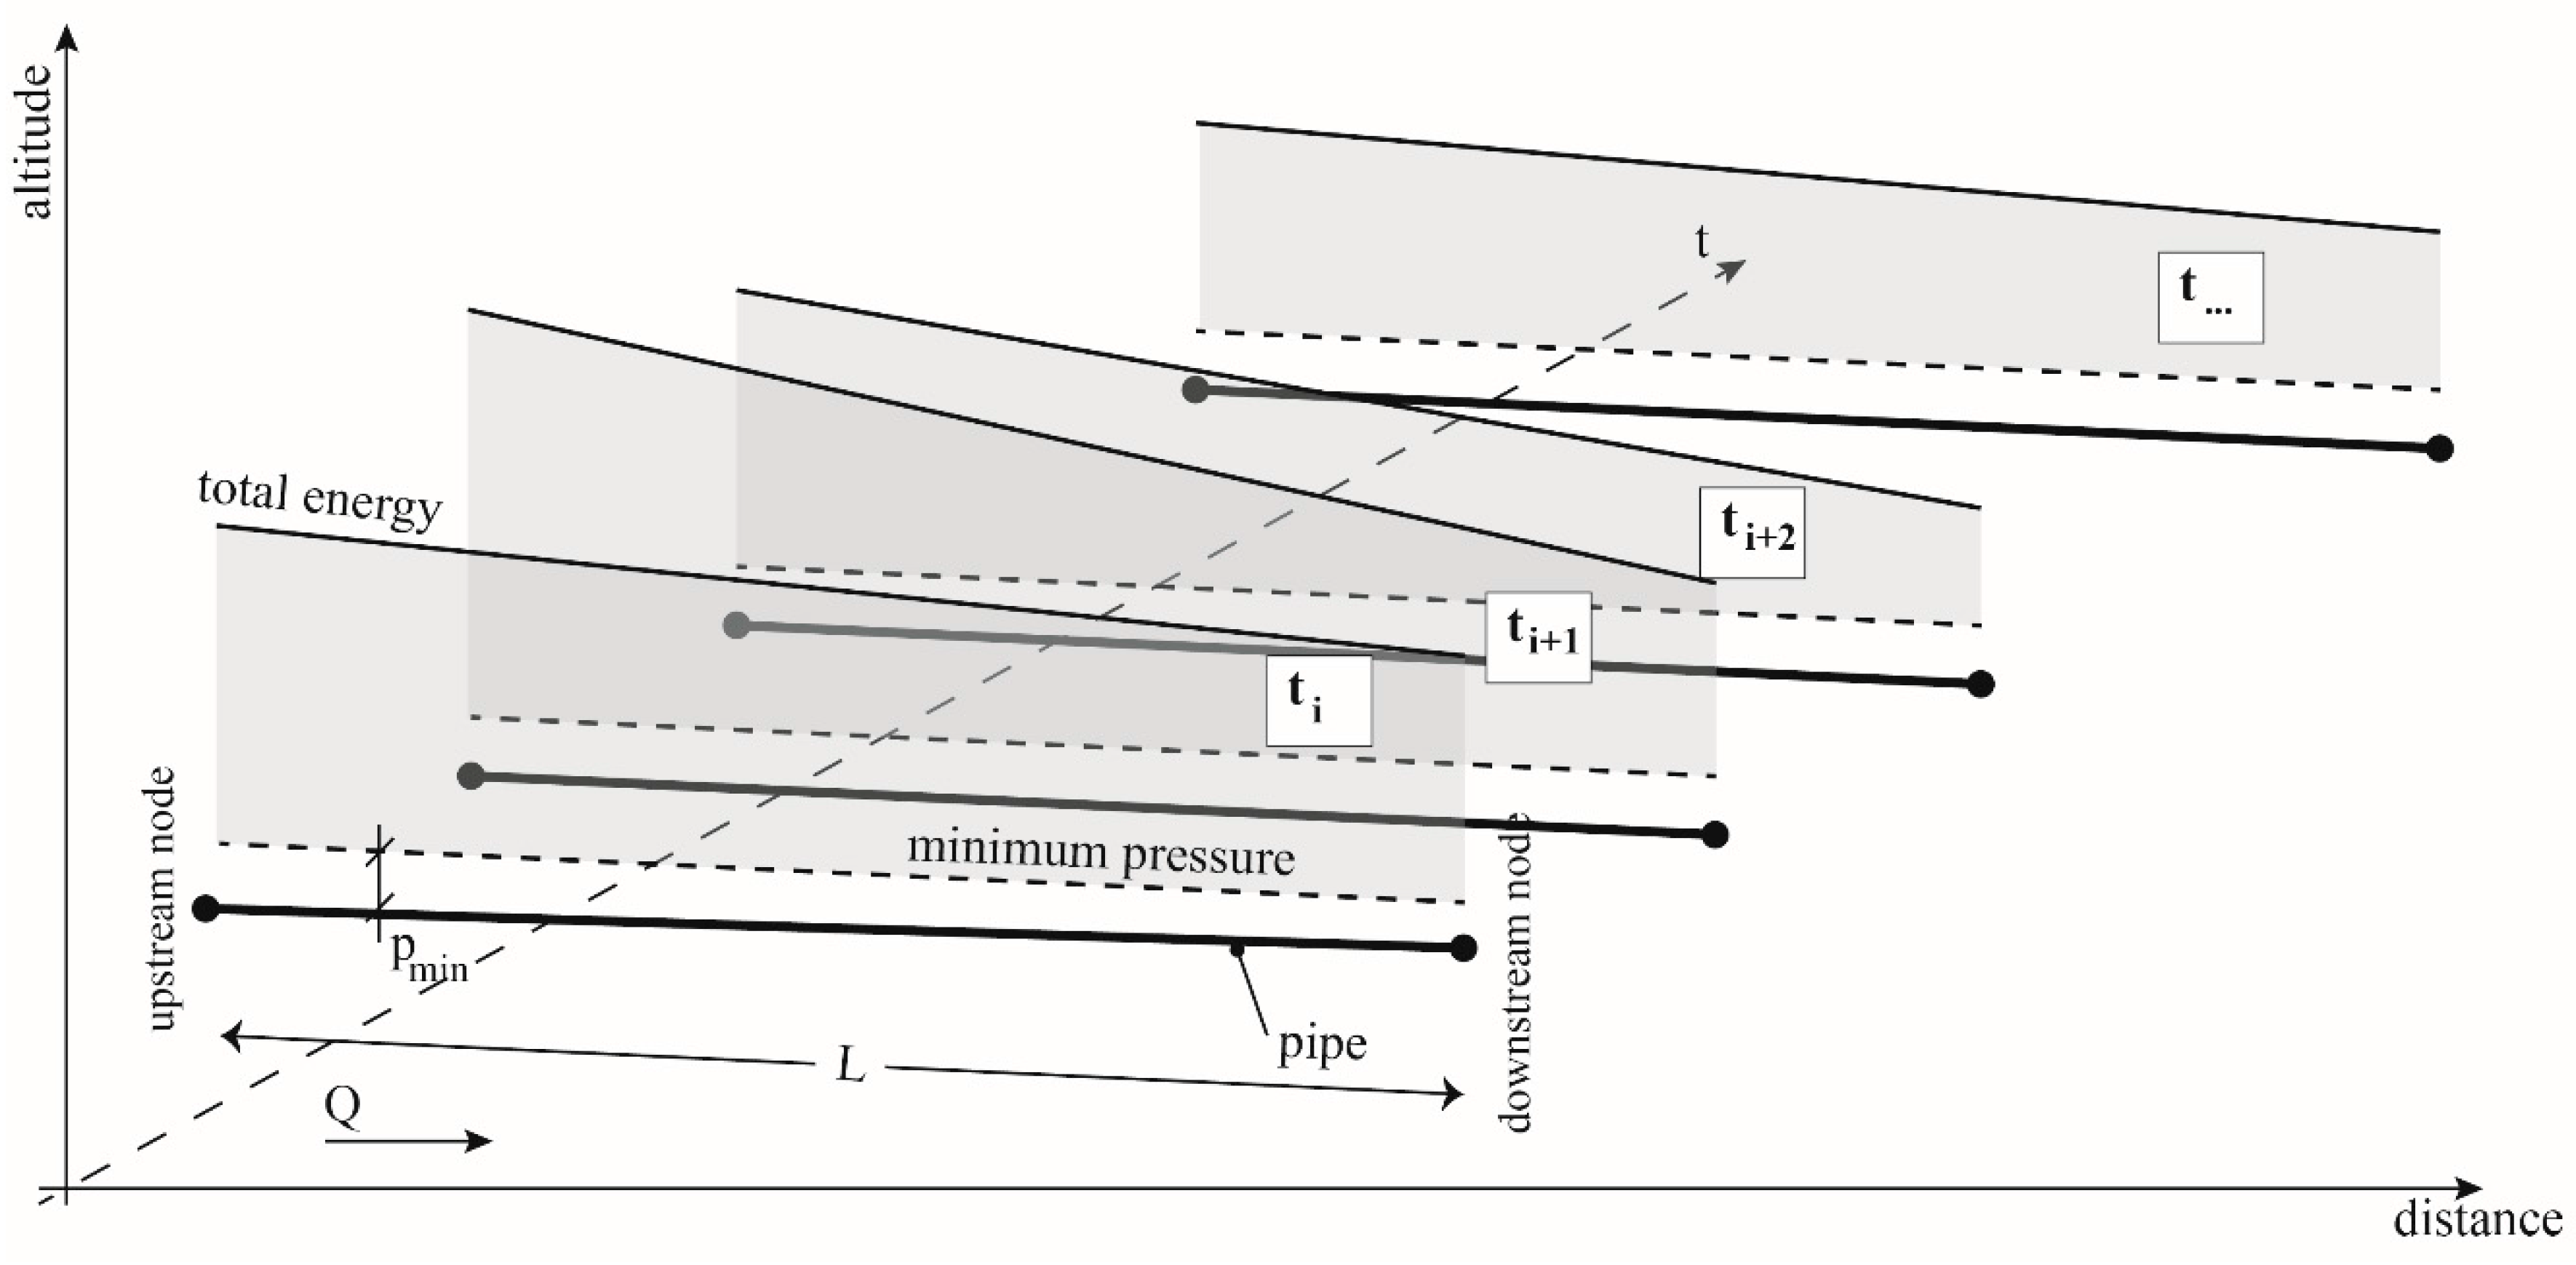
In any pipe of a network at a certain instant with a steady flow regime, the total energy line (Figure 1) can be defined as a straight line, if there are no local head losses, between the head in each boundary nodes. The head in each node will be higher than or equal to a minimum pressure   p m i n , usually imposed by regulators to guarantee a quality service to the population. In each point of the pipe, whenever the head is higher than this minimum pressure, there is excess energy. This excess energy will vary in time, as the demand in the network is not constant, affecting both the pipe flow and the pressure in the nodes.
The hydraulic energy, E (Wh), at any point of the pipe is defined as
E = ρ g Q H Δ t
where ρ is the water density (kg/m3), g is the gravitational acceleration (m2/s), Q is the flow rate (m3/s), H is the hydraulic head (m), meaning the total energy flow subtracted by the topographic elevation of the point, and Δ t (h), a time interval. This time interval can be considered as the duration of a steady state.
To estimate the excess energy in the upstream and downstream nodes of Figure 1, the minimum pressure is subtracted from the hydraulic charges:
E u p = ρ g Q t ( H u p p m i n ) Δ t E d n = ρ g Q t ( H d n p m i n ) Δ t
However, it can be argued that the application of this definition of the excess energy in an entire network cannot be done without taking into account the topography. The excess energy at a given point is often needed to ensure the minimum pressure in another and hence, is not available.
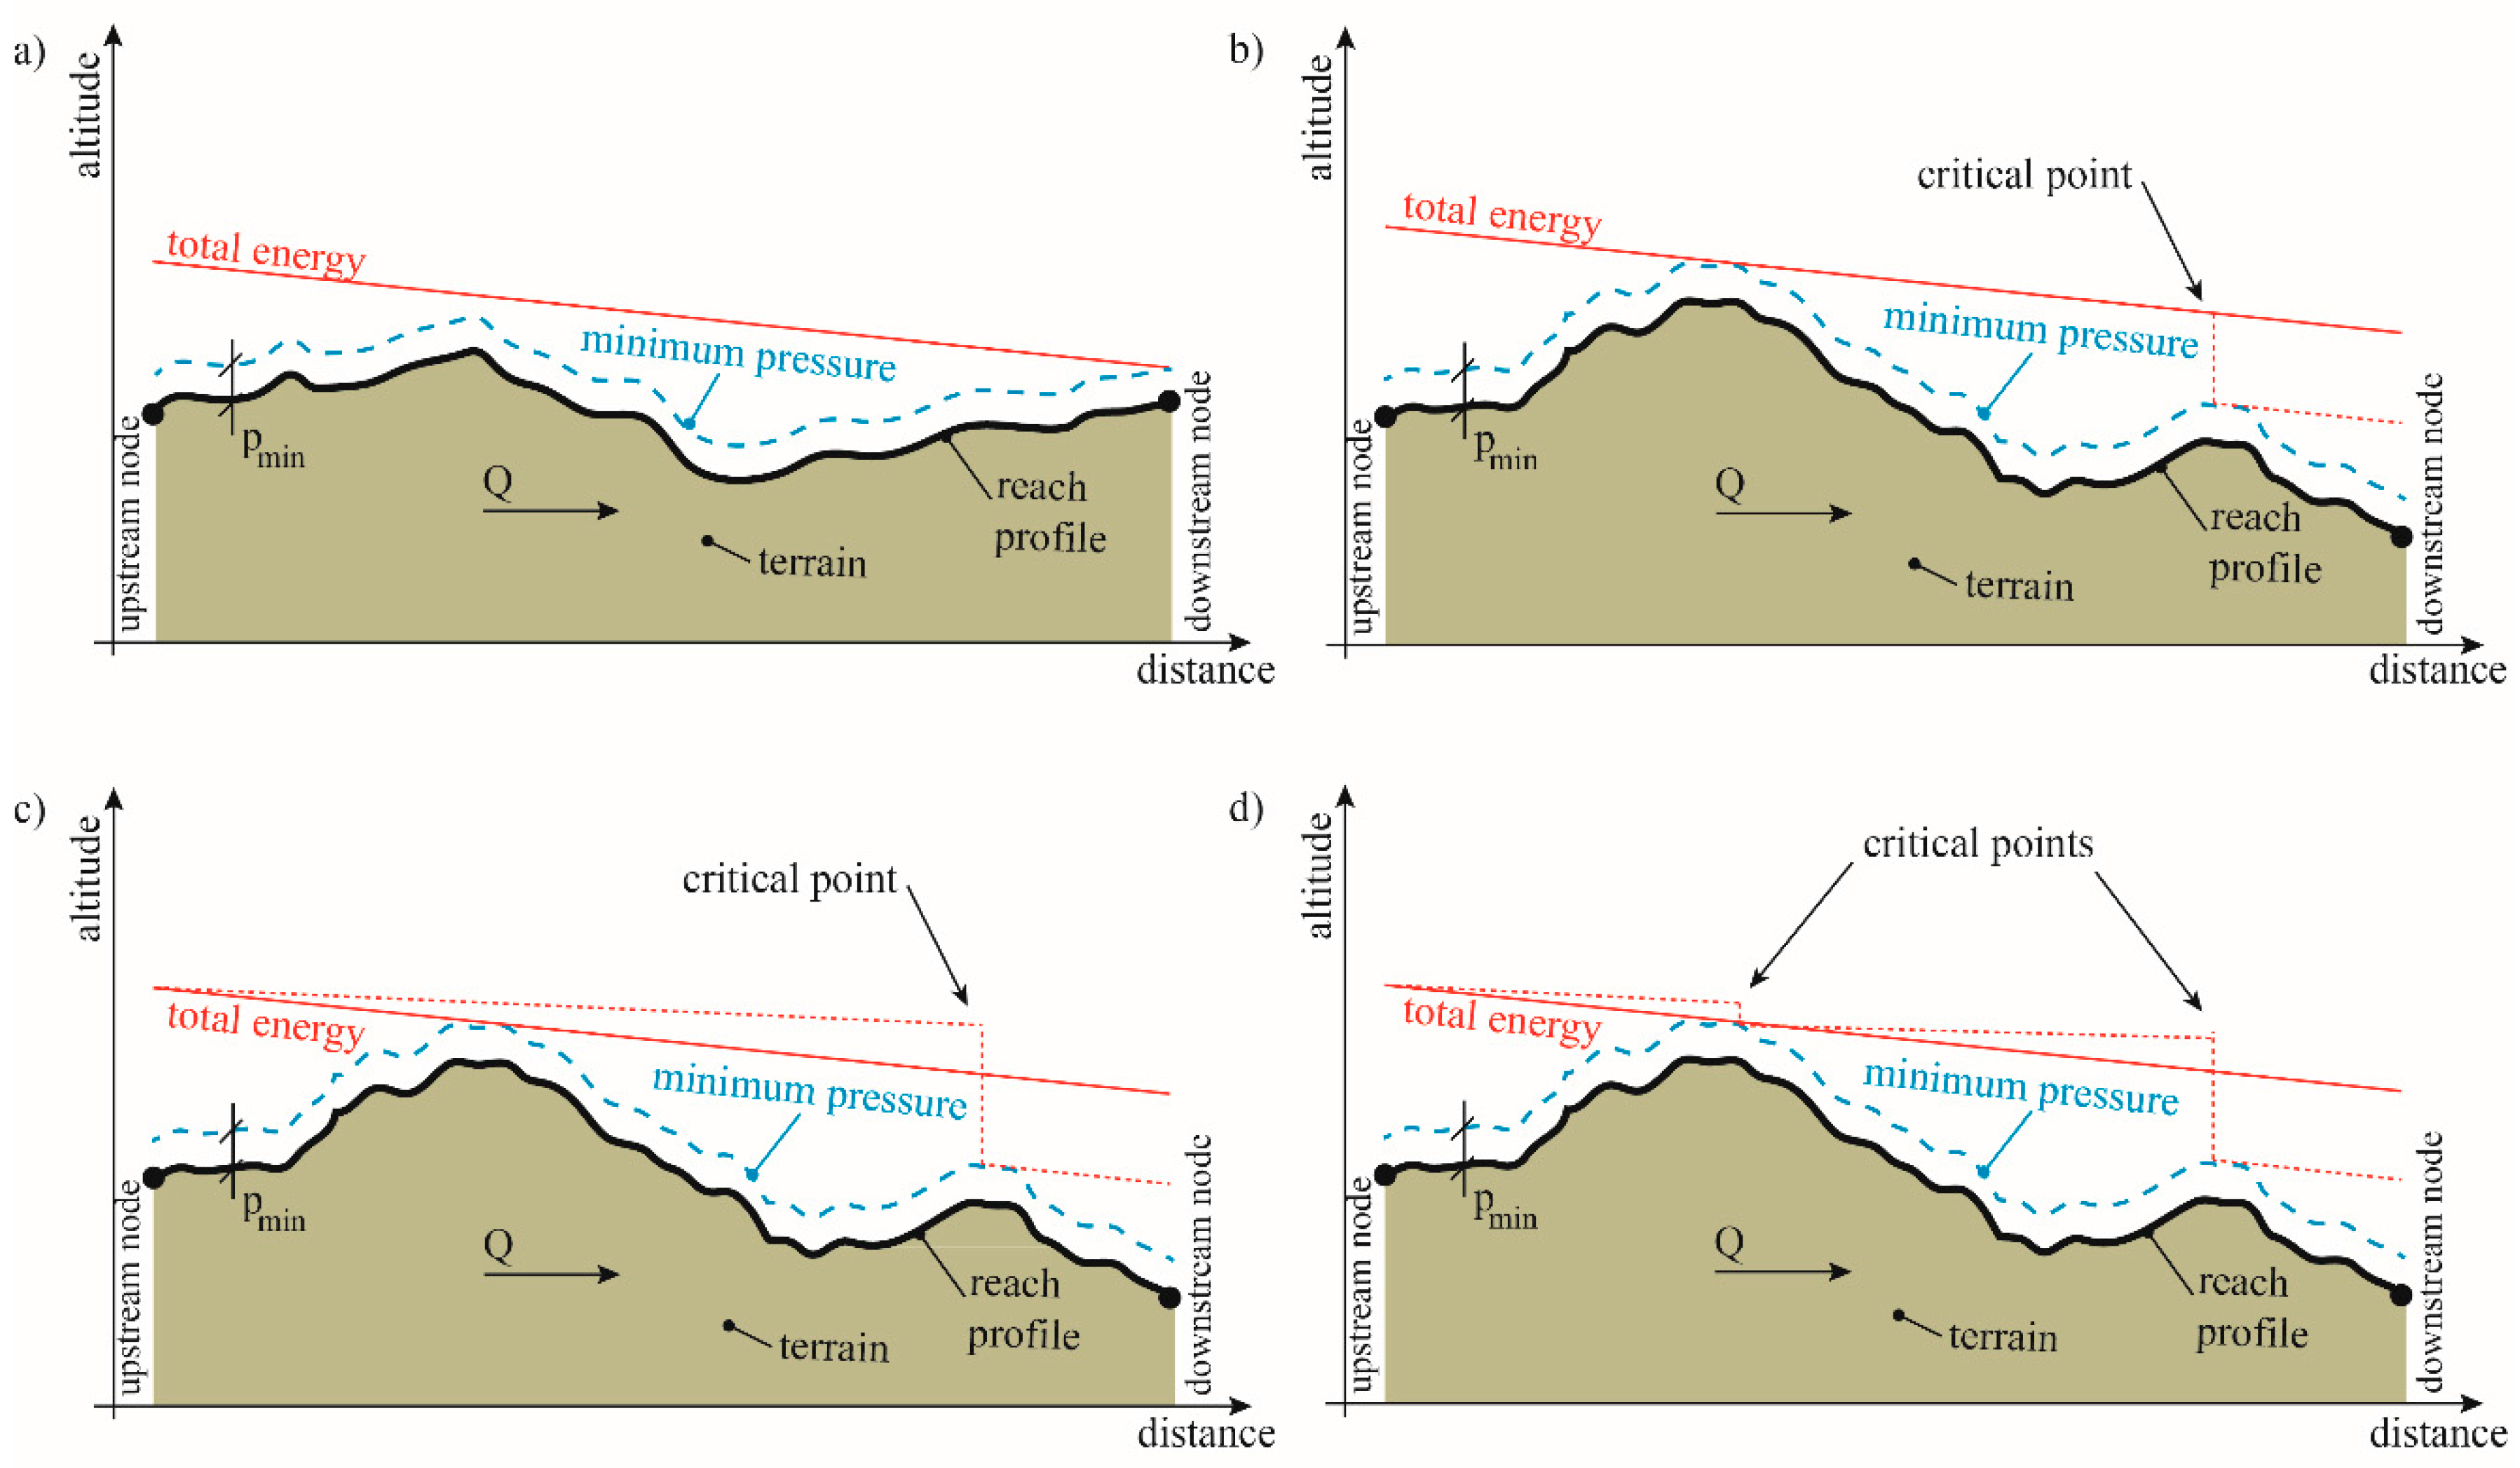
Considering the reach, defined as a sequence of pipes, sketched in Figure 2a, excess energy exists in every point of its water path, but none of this excess is available, since the most downstream point is at the minimum pressure and extra head losses would cause this pressure to decrease. Instead, if we consider the reach sketched in Figure 2b, the minimum pressure is not limited at the downstream extremity but at a high point along the path. The excess downstream from this point is partly available. During the network design, there is usually an effort to minimize this difference by using smaller diameters, as a means to control the pressure. Alternatively, the installation of turbines could be used to dissipate this excess energy.
The available energy at a point in a WSS can hence be defined as the excess energy that can be extracted from the flow without causing pressure below the minimum at any other point. To quantify how much of the excess energy is available for hydropower production, critical points must then be identified. The critical point corresponds to the position in a network where the difference between the total energy and the minimum pressure is minimum but higher than zero. This difference is the head that can be taken from the total energy line. This head and the downstream total energy line are represented by a dotted line in Figure 2b.
The former examples always considered a single reach with no other connecting path between the upstream and the downstream sections either than the presented reach. The positioning of a valve or a turbine in Figure 2b would not have an impact in the discharge along the reach. However, if the reach was in a closed network, which is common in urban WSSs, the introduction of an energy converter and consequent adjustment of the energy distribution would have an impact in the discharge, as represented in Figure 2c. Moreover, the following critical point in the reach is now the point that was at minimum pressure before. If the new critical point is considered for the extraction of energy, a new readjustment occurs and the resulting total energy distribution is presented in Figure 2d.
The available energy in a network is given by the sum of the available energy at every critical point and hence its assessment requires a dynamic process. Also, as mentioned, the available head varies with the demand, which in a WSS is variable throughout the day. Nevertheless, a simpler and more immediate way for estimating available energy is to consider the steady state conditions with maximum flows, and hence the minimum heads.
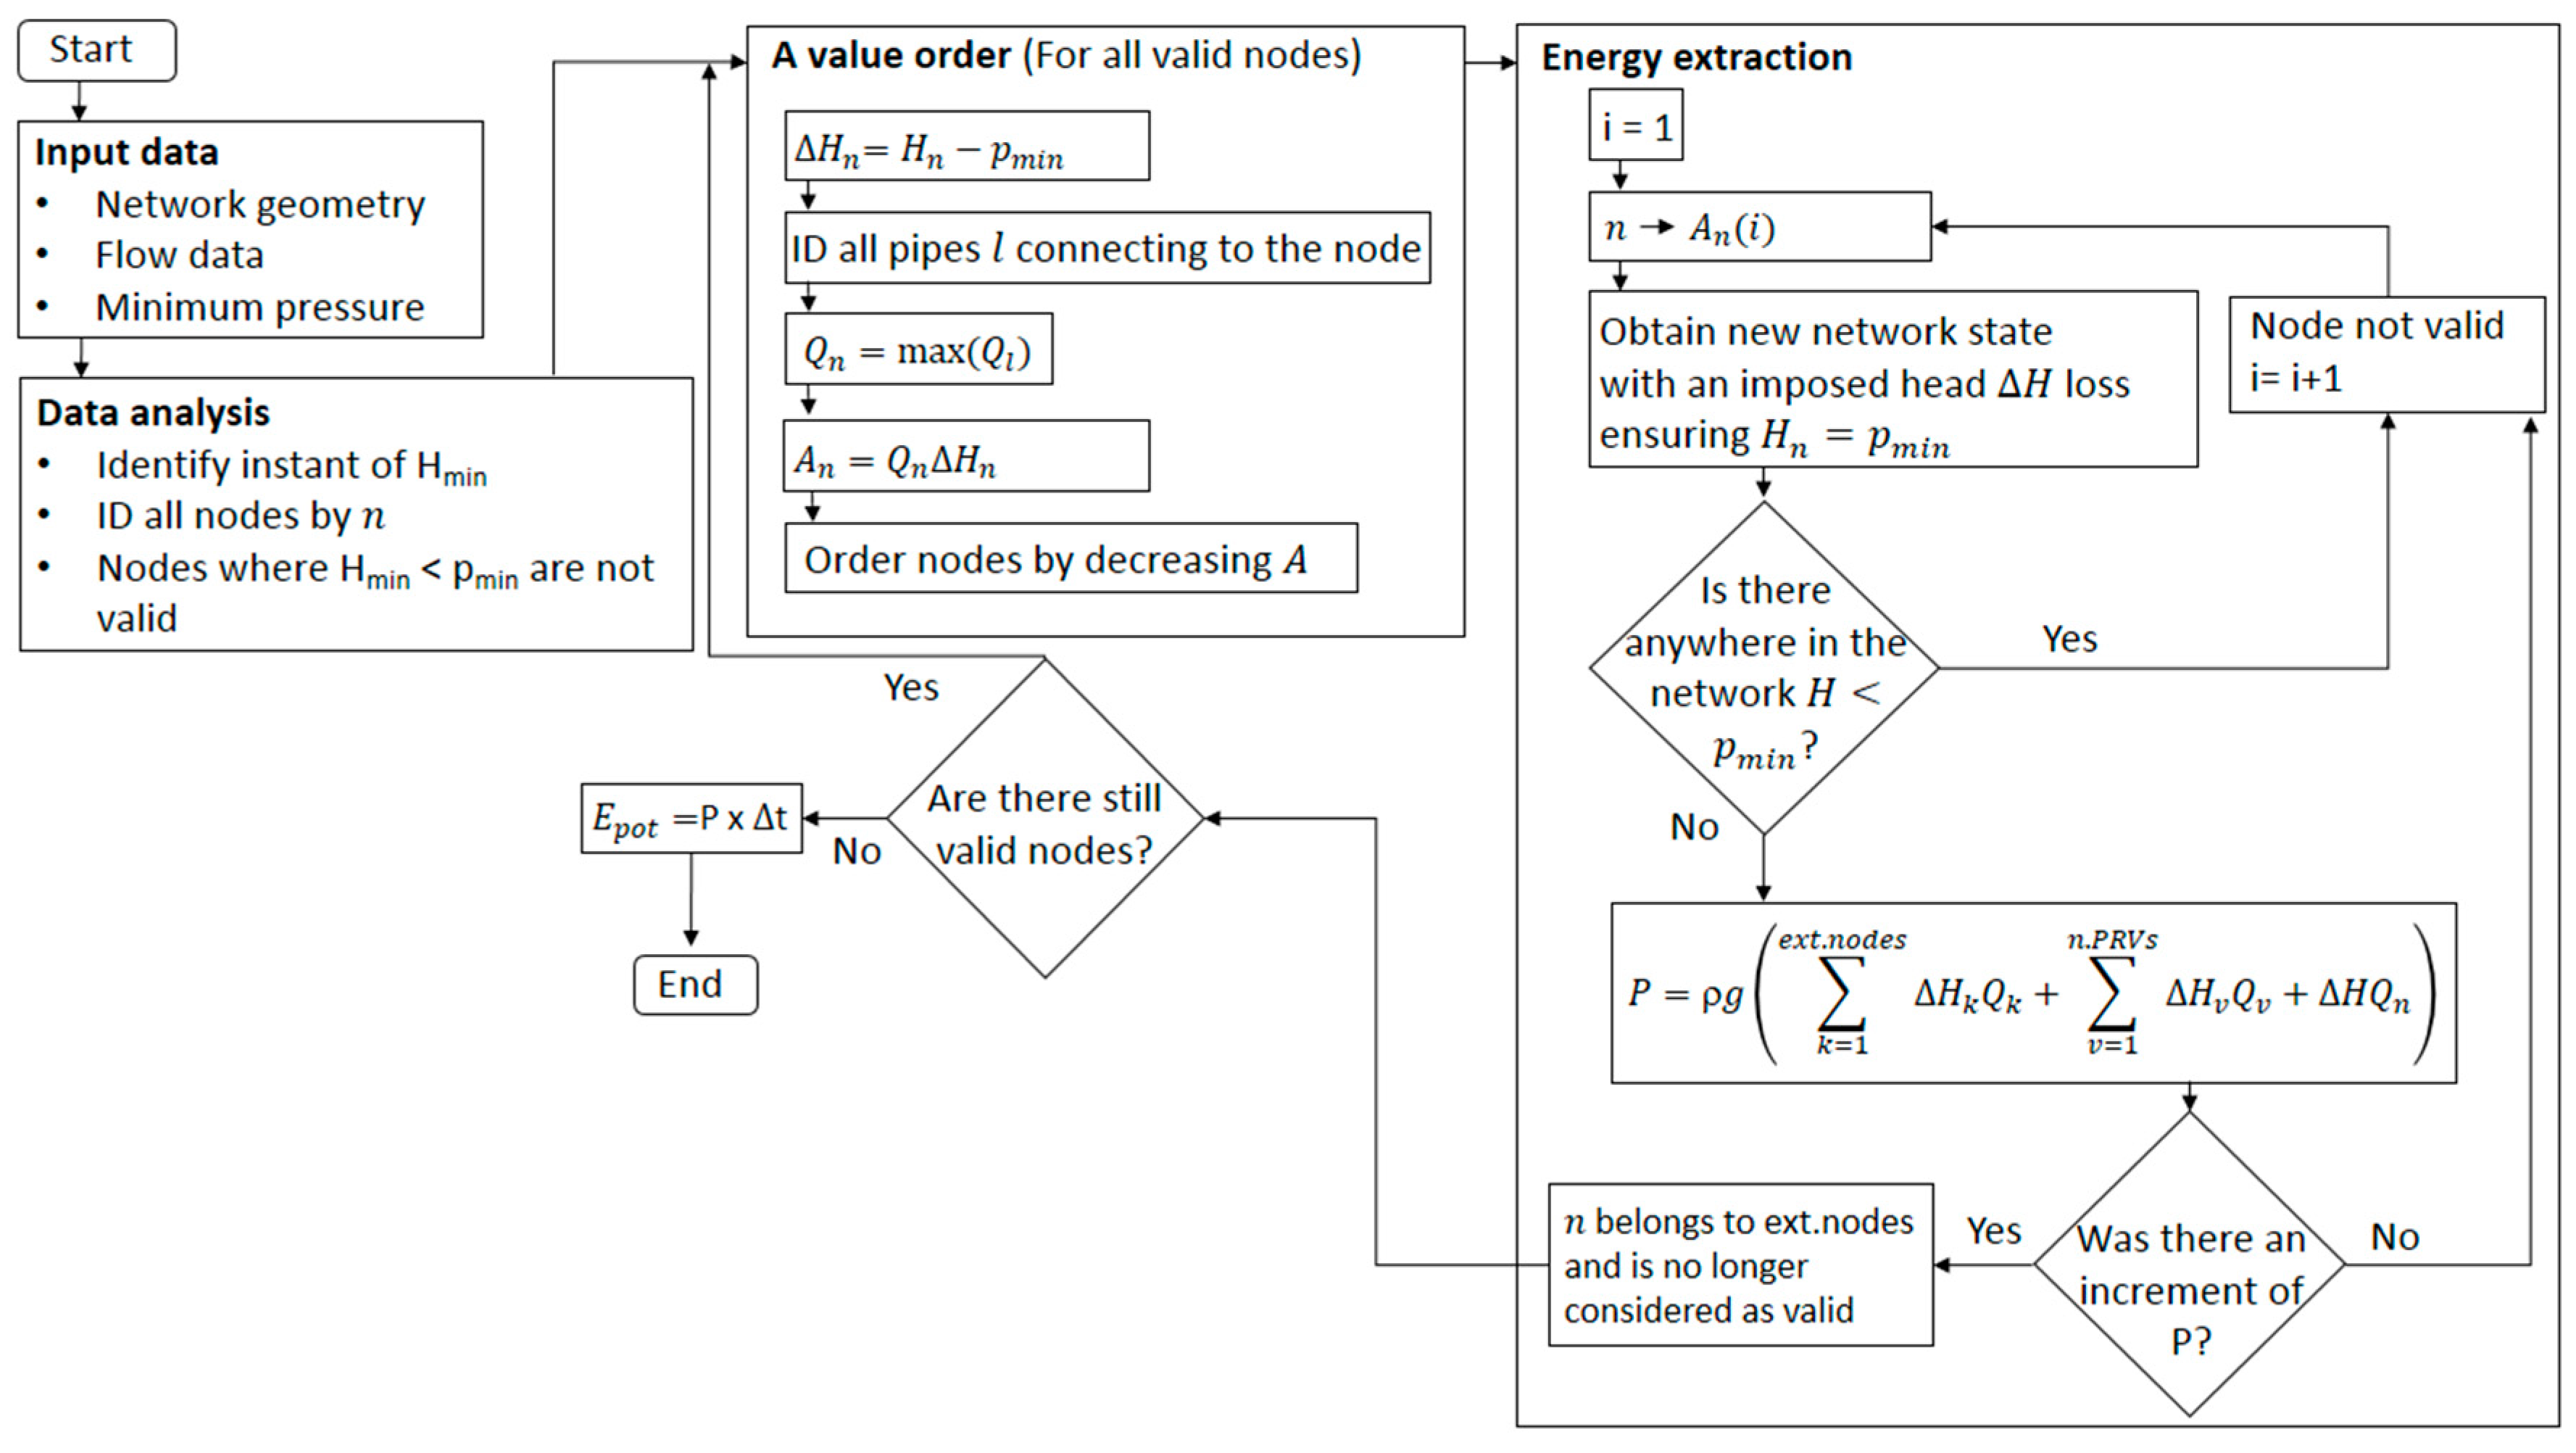
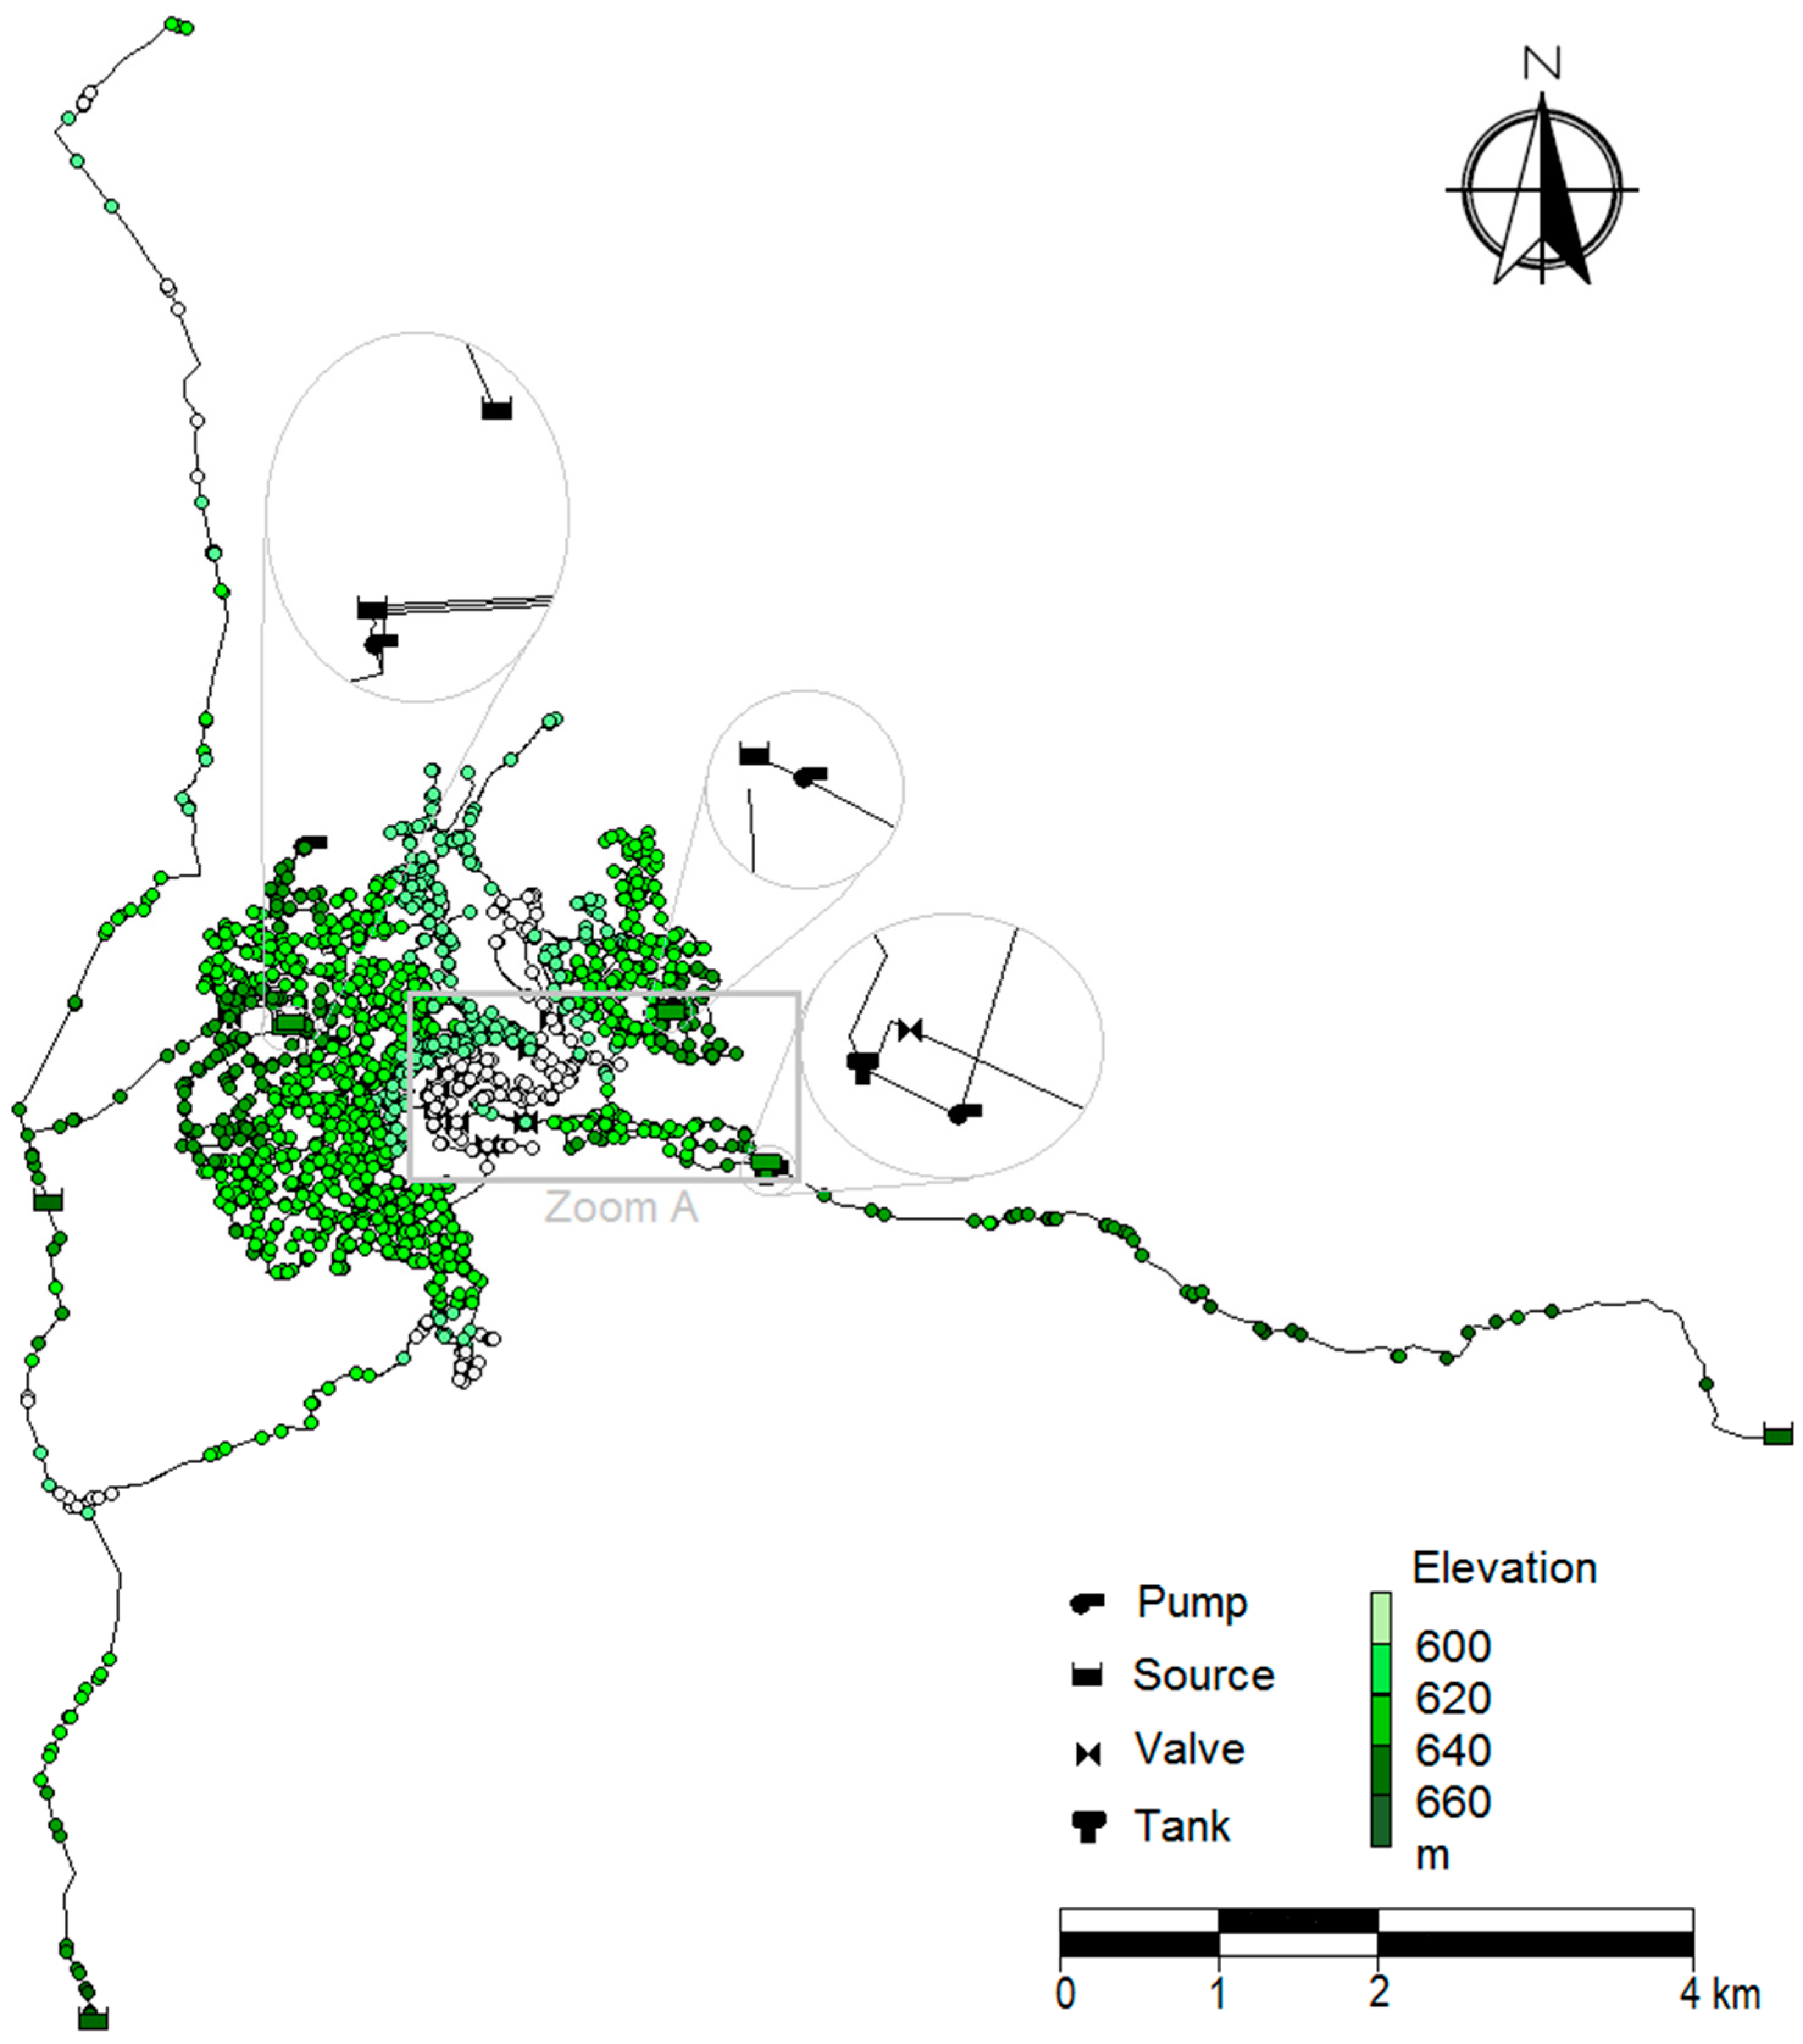
An algorithm was developed to access the potential for hydropower in water supply networks taking into account the previous considerations for available energy in a network (Figure 3). Input data are composed of the network geometry, available consumption data (discharges distributed along the WSS) and minimum pressures to be assured at every node.
The consumption that leads to the average lowest pressure in the network is identified in the analysis. The nodes that do not fulfill the criteria of minimal pressure under these conditions are considered to be non-consumptive nodes, where the pressure is only required to be positive to avoid cavitation.
Since energy depends on both head and flow rate, the available energy cannot be evaluated solely based on available head in the critical points. For all the nodes in the network, a value A is defined, if the node is valid, as:
A n = Δ H n max ( Q l )
where the index l refers to the ID of all pipes connecting to the node n,
Δ H n = H n p m i n
and H n is the hydraulic head over the node n in the current hydraulic state. If the node is not valid, A is zero. The nodes are then re-ordered in decreasing order of A .
For the node with the highest A , the head from Equation (4) is extracted by applying a local head loss in the pipe connecting to the node with the highest discharge. This extraction implies a new energetic equilibrium in the network that needs to be calculated. If the minimum pressure is satisfied in all the consumptive nodes after the network recalculation, the extracted head is given by the imposed head loss, and the available power in that node is given by the head and max ( Q l ) . The power P of the new state is given by the sum of the available power in the new node, the available power in the all the nodes where a head loss was previously imposed and the power that is dissipated in each PRV, if they exist, multiplied by the water volumetric weight. The new node is accepted only if there is an increment in the calculation of the power, to ensure that it does not negatively affect the nodes previously gathered. If it is not accepted, the following highest A is tested and so forth until there is an acceptance or the valid nodes are exhausted.
The procedure of ordering the nodes according to the value of A is repeated with each new accepted equilibrium in the network. Moreover, when extracting the head in a new node, the flow discharge in the previous ones will be affected, and so the potential of both has to be calculated.
When all valid nodes have been evaluated, an estimation of the annual available energy E p o t can be given by the power P multiplied by the considered time window Δ t . The potential for hydropower of a network is hence evaluated through the total available energy.

2.2. Optimum Site Locations

Even if potential for hydropower has been recognized in a certain city, the ideal location of turbines within its network is not straightforward. It depends on numerous factors such as the flow rate and respective velocity restrictions which have daily variations, the head which is dependent not only on the minimum service pressures but also on the chosen turbine, and the geometry of the network that conditions the distribution of the flow within its closed network.
To answer this problem, a search algorithm in which a simulated annealing technique was used to optimize the economic value of the installation of micro-hydropower plants (MHP) in a WSS was applied. In the recently developed search algorithm [5,18], in each iteration, a full year is simulated with an hourly time step considering the installation of a given number of turbines in several locations or combined in one location. The produced energy is obtained by coupling the EPANET hydraulic model [20] that calculates the hydraulic state of the network for each time step with the characteristics of the turbines. The position of the turbines in the WSS is changed in each iteration, in the search for the best output. Only the solutions that respect minimum pressure and maximum velocity constraints are accepted.
The best output is given by the objective function that has been defined as the maximization of the net present value of the project annual cash flows over 20 years of operation:
f ( X ) = min ( 1 N P V 20 )
where X is the solution vector, representing the placement of Nt turbines, and N P V 20 is the net present value of the project discounted cash-flows.
In a concise way, the net present value is given by
N P V = R e v e n u e s C a p i t a l   C o s t s O p e r a t i o n a l   C o s t s M a i n t e n a n c e   C o s t s
where all components are transposed to the year 0 of operation.
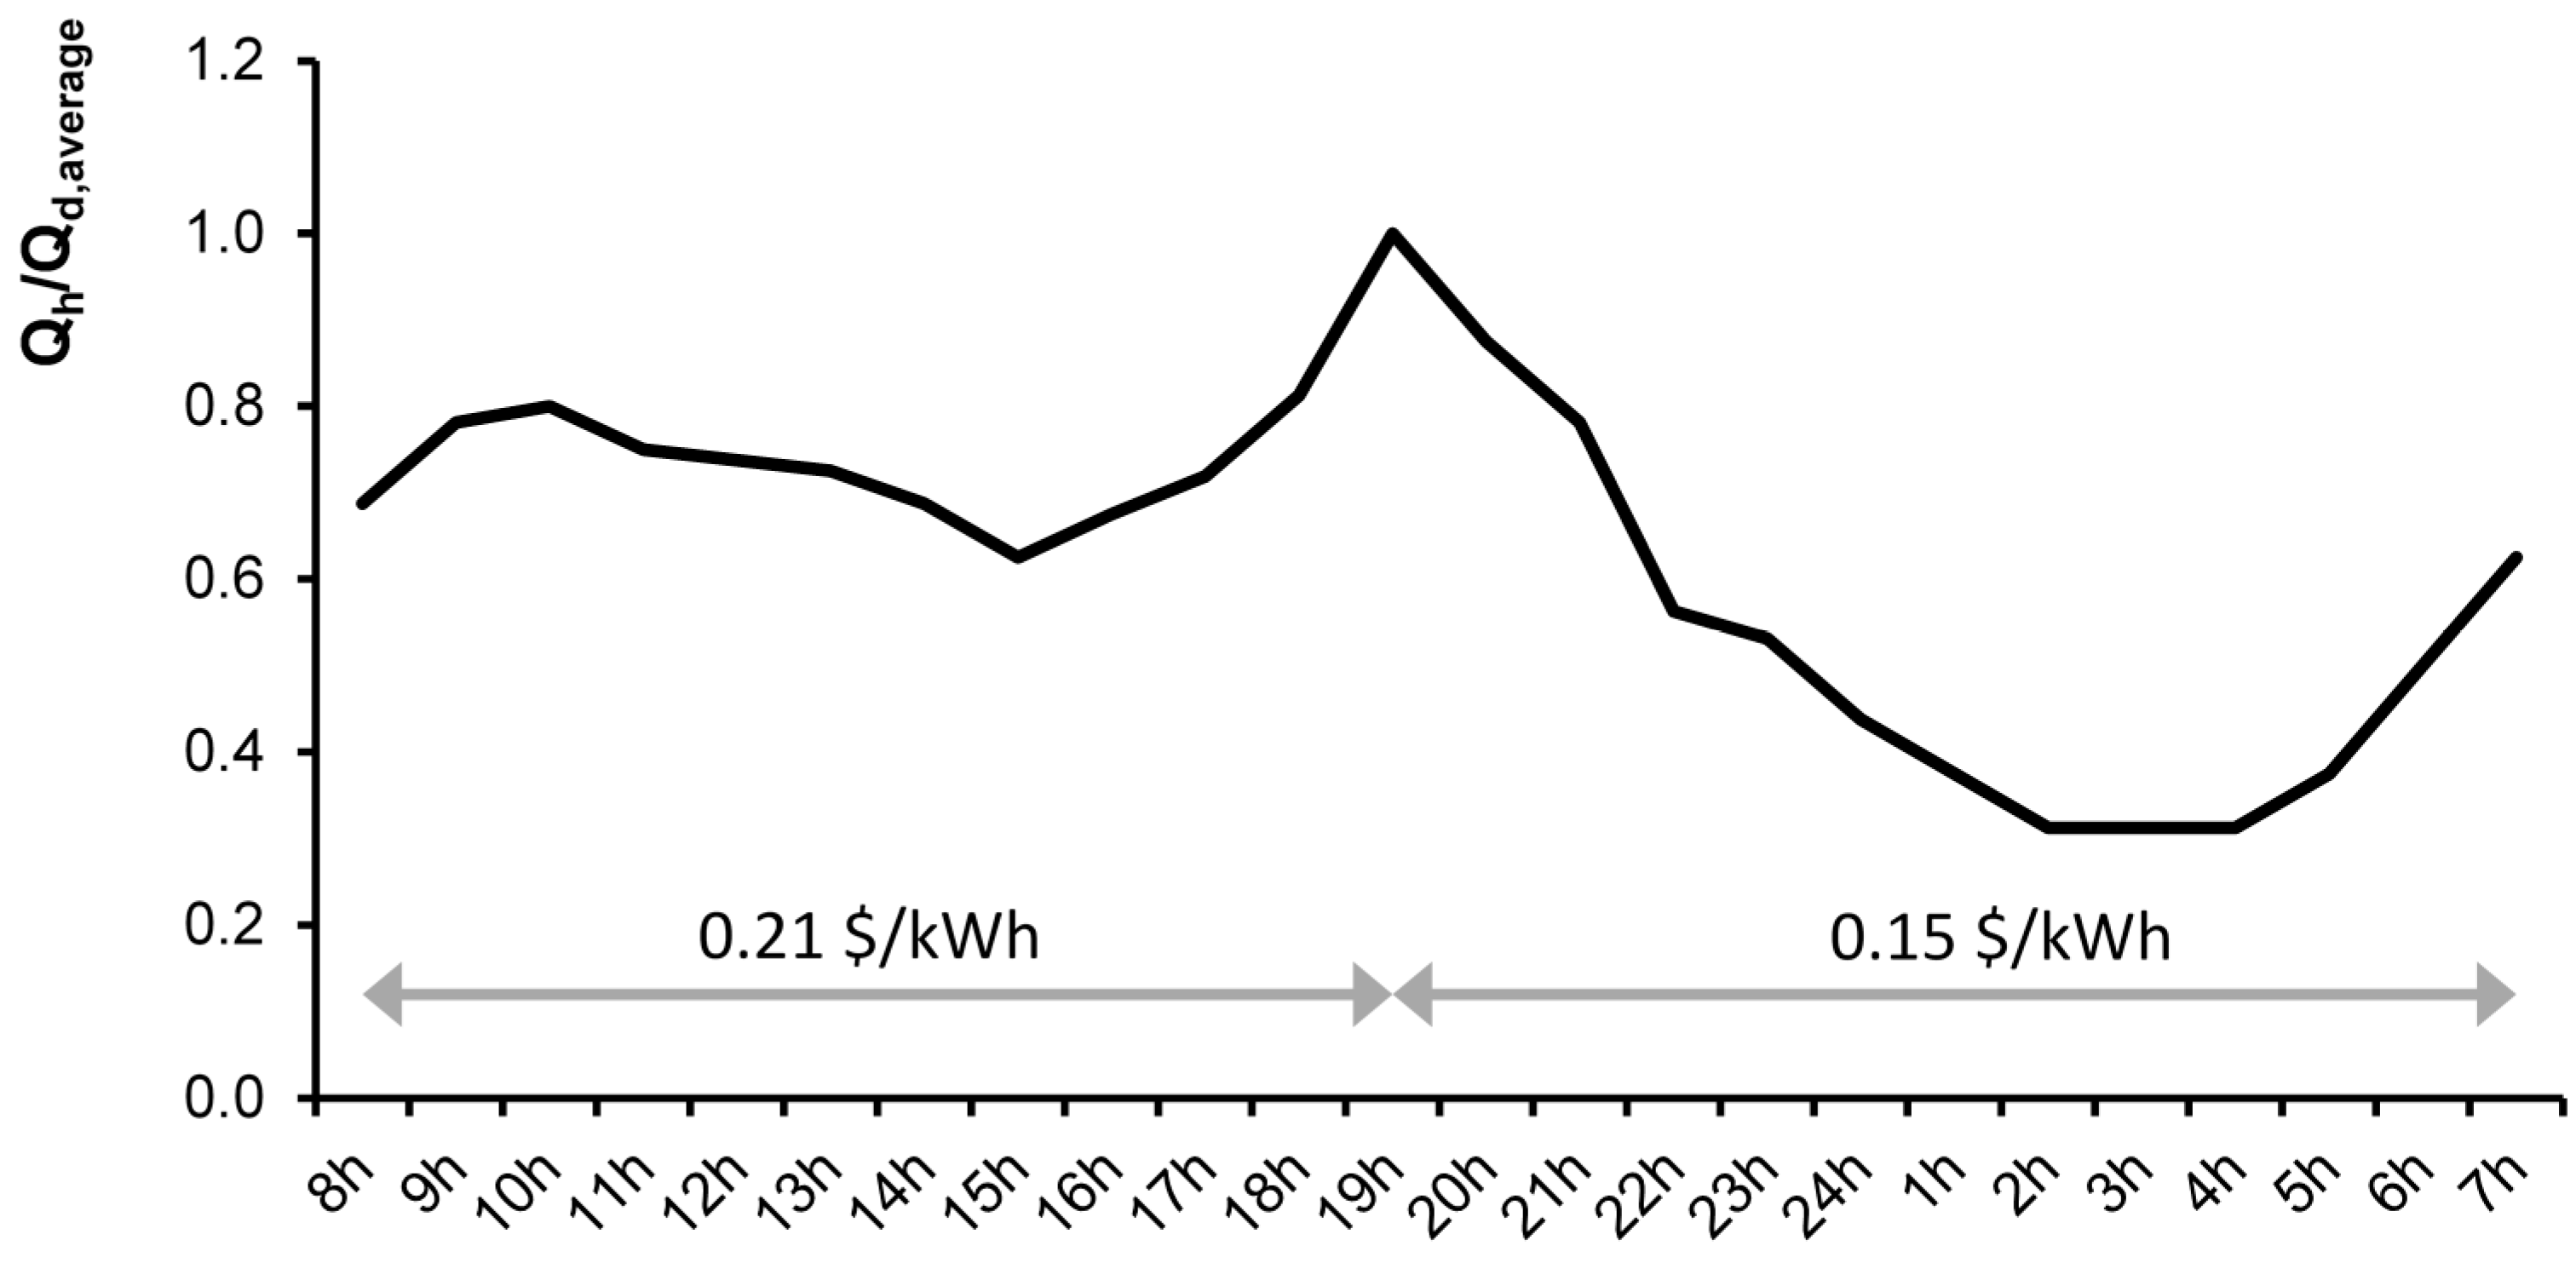
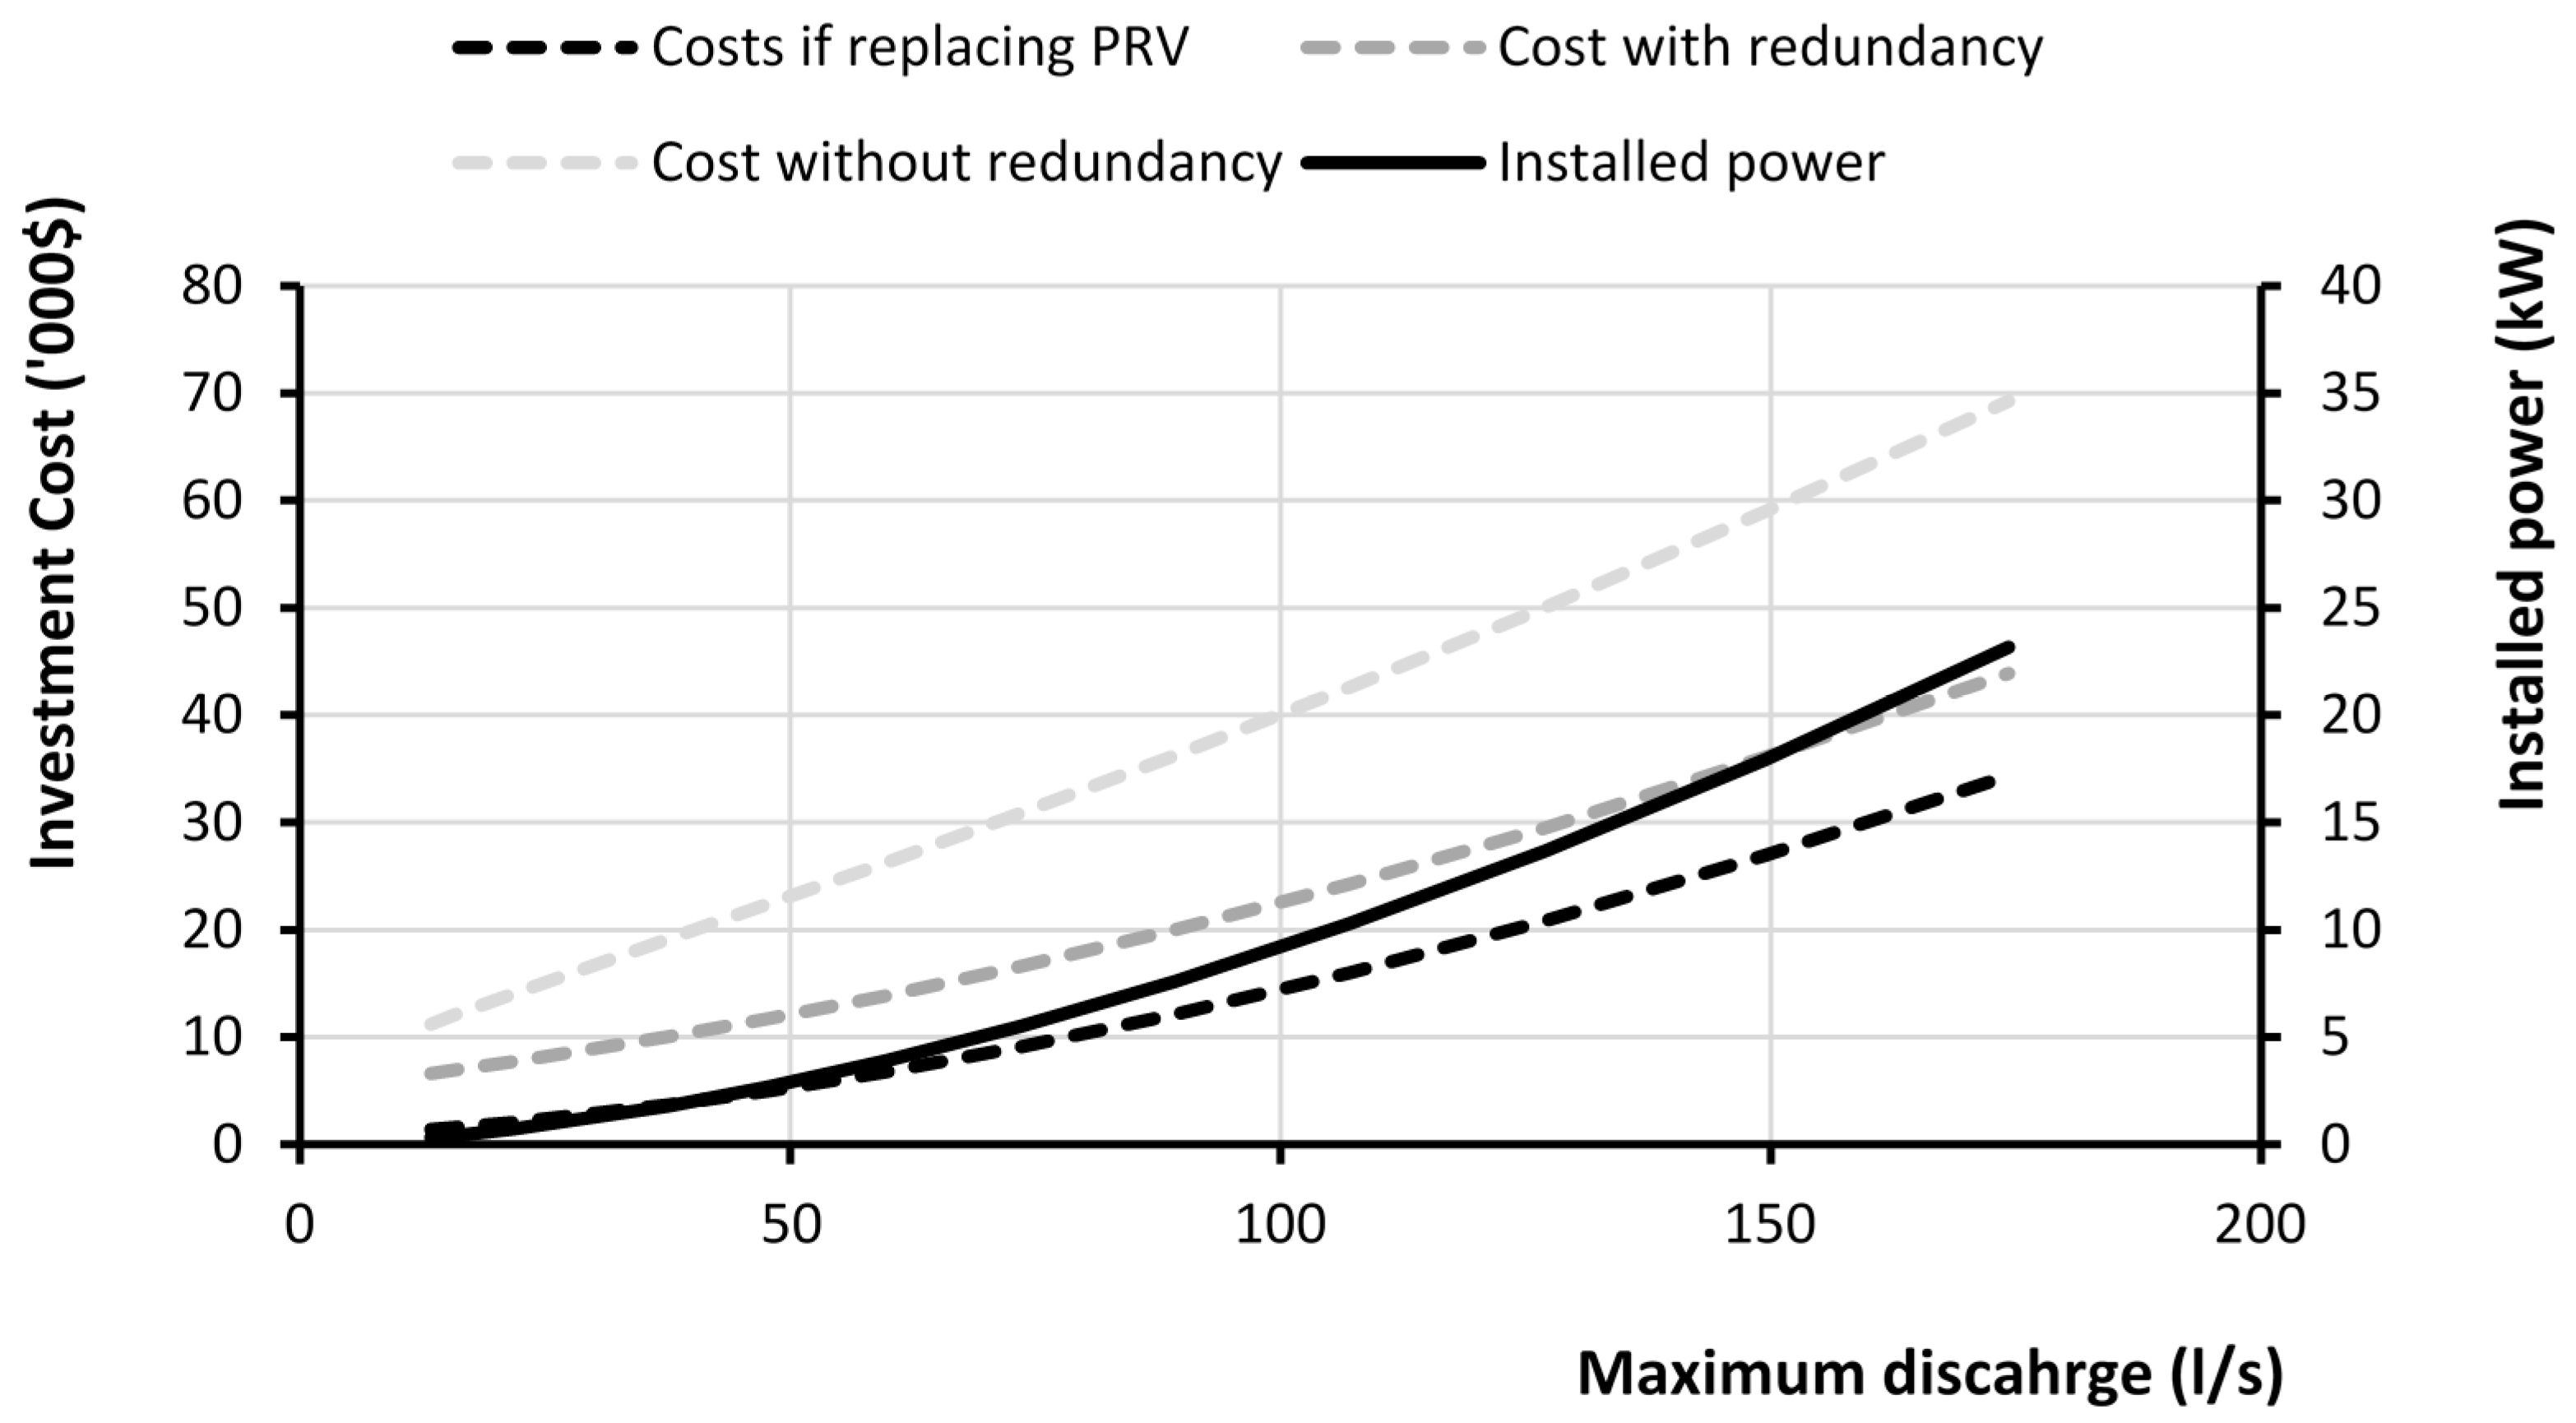
In the considered economic model, the capital costs include all investment costs for the construction of the MHPs. The maintenance costs are considered negligible when compared with the maintenance costs of the entire network. The operational costs of a network are given by the electricity bought for pumping operations and the personnel costs for managing the WSS. In this case, since the focus is only on the construction and operation of the turbines, and not the entire network, only the costs for pumping that are superior to the original operational costs are considered. The operational costs are thus given by the electricity buying tariff and the difference between the electrical energy needed for pumping in the situation with the turbines installed and the energy needed for pumping in the initial situation (without turbines).
Two different types of remuneration can be considered depending on the economic model assumed: selling to the grid or self-consumption. When selling to the grid, the revenues are given by the produced energy and the considered sell-tariff. For a self-consumption scheme, it is assumed that the generated energy is consumed in operations within the network. In this case, the gain is in the savings in the electricity bill of the network. To provide an appreciation of the solution, independently of the remuneration type, another economic index, the cost price, is considered:
C o s t   p r i c e = C a p i t a l   C o s t s ( 1 + r ) 20   1 r ( 1 + r ) 20 E a n n u a l
where r is the discount rate and E a n u a l is the annual energy production.

3. Case Study

3.1. The City of Fribourg

The proposed methodology for potential analysis and economic value assessment was applied to the case study of the city of Fribourg, Switzerland. The urban water supply network model of Fribourg, which can be seen in Figure 4, has 2972 links and 2805 nodes covering 135 km of pipes and a total elevation difference of 216 m. The network, whose model was provided by the Industrial Services of Fribourg, possesses nine PRVs, seven water tanks and four pumping stations. The population served by the WSN is about 38,000 persons, making this a small sized European city.
According to the gathered data, an average daily consumption of Qd,average = 0.108 L/s was associated with each node, and the daily pattern of consumption presented in Figure 5 was applied to obtain an hourly variation.
Six of the water tanks are considered as water sources, with fixed constant levels. The seventh water tank, however, has a known geometry and its level varies along the simulation. In each iteration, the initial level in the seventh water tank was defined in order to have the same initial level at the end of a 24 h cycle. The capacity and elevation of this tank also represents a restriction to the algorithm.
A minimum pressure of 30 m was assumed as a restriction in every consumptive node. According to the Swiss Directive for Water Supply [22], the minimum service pressure in Switzerland is a function of the average number of building stories. The assumed value implies that a 6-story building with 3 m per floor would not require a pump to provide 10 m of water pressure in the upper floor. A restriction of the maximum velocity in the pipes was defined as 2 m/s.
The considered electricity sell-prices is fixed at 0.33 $/kWh and the considered buy-price depends on the period as indicated in Figure 5. The sell-price is the current feed-in-tariff in Switzerland for this type of power plant [23,24].
The operations of the pumping station for the network consume 250 MWh/year, according to Table 1, assuming a constant efficiency of 60%.

3.2. The Micro-Hydropower Technology

The MHP considered for installation in the city was for a micro-turbine currently under development by the authors [25]. The five blade tubular propeller (5BTP), initially designed under the scope of the EU Project HYLOW (2008–2012), has been recently experimentally tested for the characterization of its performance [25].
It is a suitable turbine for energy recovery in a WSS since it can be installed directly into the pressurized pipe. Furthermore, the operation of the 5BTP is possible with variable flow rates and low heads. The machine consists of a bulb followed by a runner with five fixed blades (Figure 6). It is connected to a rotating axis that leaves the pipe through a 45° curve. The rotating axis is connected to the external generator which controls the rotational speed of the turbine. A minimum diameter of 85 mm was considered.
The installation of the turbine within the network is proposed according to the design presented in Figure 7. It is based on a buried concrete chamber constructed in line with an existing pipe, whose dimensions depend on the diameters of both the existing pipe (DP) and turbine runner (DT). The by-pass is only necessary if the considered branch has no redundancy in its supply, as it has been defined in [18].
The choice of diameter of the runner, with a minimum of 85 mm, is a function of the maximum flow rate in the pipe and the experimental characteristic curve [25], which is scaled according to the similarity laws.
Up to four turbines can be installed in the same concrete chamber. The lay-out from Figure 7 is used to estimate the equipment and civil works costs by calculating the main quantities presented in Table 2. A surplus of 25% of this sub-total was added to account for engineering and construction supervision plus 15% for miscellaneous items not quantified at this early phase. The costs for connections to the grid and site access were considered negligible, since the MHPs are installed within urban areas. Savings of 2% were considered for the construction of more than one chamber to take into account group ordering prices. All percentages were applied independently of the number of turbines in the chamber. For the feasibility analysis, a linear cost function was adopted for the electromechanical equipment as a single item. This is justified by the fact that the 5BTP turbine is not yet commercialized, and hence a lumped price based on current technologies for this scale of installed power was considered.
In the cases of PRV sites, it was assumed that the valve ensures a constant downstream pressure unless the pressure immediately upstream from it is already lower. Since there is a defined minimum pressure throughout the network, it was considered that this constraint was enough to ensure adequate pressure levels in the network. However, in the case of a mandatory constant downstream pressure value, the hydraulic regulation strategy developed by [3] could be adopted. According to this strategy, when the pressure drop needs to be smaller than the head taken by the turbine, a by-pass is opened to divide the flow discharge.

4. Results and Discussion

4.1. Energy Recovery Potential in the WSS of Fribourg

The algorithm for the evaluation of the available energy in an urban water network (Figure 3) was applied to the case study of Fribourg. The results presented in Table 3 show that there is approximately 170 MWh/year in the network not being used. If accounting for the 430 MWh/year extracted from the WSS by PRVs, a total of approximately 600 MWh/year of available energy exists. The PRV energy contribution represents 72% of the total.
Table 4 shows the pipes of the network where the energy is extracted and Table 5 shows the energy extracted by the PRVs. Some locations in Table 4 show available heads although the corresponding available energy is relatively low. This indicates that these locations are served with low discharges, thus hardly good position for the installation of a turbine.
In pipe 2986, despite the existence of a PRV (Table 4 and Table 5), 12.3 m of head is still available which corresponds to an available energy of 102 MWh/year.

4.2. Capacity for Generation Using 5BTP Turbine

The search algorithm was applied to the city of Fribourg network model to obtain the optimal locations for the installation of 1, 2, 3 and 4 turbines. A discount rate of 4% was considered in the calculation of the net present value. Some interesting results were identified. The results for the selling to the grid scheme are presented in Table 6, showing also the 2nd and the 3rd best results in terms of N P V 20 for each case. These latter options were defined by restricting one of the pipes from the previous best solution.
In an initial phase, whenever the solution includes a location where a PRV concrete chamber already exists, the turbine is assumed to be installed either in line with the valve, or replacing it in the same chamber. Hence, the construction costs (concrete, excavation and earth fill) are omitted. Since these solutions tend to be cheaper than installing in new locations, they were given priority within the search algorithm.
The location in the network of the retained solutions is shown in Figure 8. In Table 6 the annual energy production, turbine runner diameters, average head, average turbinated flow, installed power, net present value after 20 years of operation and respective cost price of the best solutions are shown. No increase in pumping energy was necessary. All the energy generated was representative of excess pressure in the network. As expected from the analysis of Table 4 and Table 5, the pipe 2986, with a PRV installed, was the best location to install the energy converters.
Figure 8 shows that the replacement of PRVs is often the best solution. In these, excess pressure is already recognized. Furthermore, the considered exemption of construction costs for existing chambers made these solutions more economically viable.
The best solutions can extract a considerable quantity of the available energy of the network. One, two, three and four 5BTP turbines would recover approximately 10%, 20%, 22% and 23% of the available energy, respectively. According to these results, it can also be concluded that the installation of three turbines in one pipe represents a smaller increase of energy production from two turbines than the increase of energy production of installing two turbines when compared to one turbine. This is due to the effect of obstruction of flow discharge, in particular when the extracted head is bigger than the original head dissipated in the PRV.
The best and second best solutions, for all the number of turbines, are identical in terms of energy production and of NPV20. Pipes 2896 and 2730 (Figure 8) are presented in the best and second best solutions, respectively. Since they share one node and are inline, the expected production is similar. The differences between both N P V 20 values are mainly due to the construction costs.
The third best solution has a very small energy production when compared with others, since the discharges and heads are lower. It can be concluded that the pipes where the best and second best solutions are located, upstream from one of the main water tanks, is the most interesting area for hydropower production.
Comparing with the examples of other studies on MHPs in WSSs presented in the introduction, the obtained production in the city of Fribourg is within the same order of magnitude.
Not considering construction costs for the sites where PRVs are located may be optimistic. Hence, a second batch of simulations was carried out considering that additional construction works will be necessary to enlarge and adapt the existing chamber. Site conditions being very varied and coupling old and new chambers being sometimes cumbersome, it was assumed that the construction costs would be equivalent to that of a new chamber. Under these conditions, the best solution from Table 6 became equivalent in terms of NPV20 to the 2nd best solution, since the difference between the two was the construction costs. For the 3rd best solution, no locations were found were it would be feasible to install turbines. The construction costs have hence a considerable weight with respect to the feasibility of these chambers.

4.3. Response to Changes in Water Consumption

Based on the three best solutions previously identified, a 20% decrease in water consumption was imposed on the network. A new energetic equilibrium was computed for these conditions, leading to a new energy production for the network. The results of this sensitivity analysis are presented in Table 7, which can be directly compared with Table 6.
Considering that consumption decreased and that the energy production is highly dependent on the flow discharge, a decrease in energy production was expected. However, the 1st and 2nd best solutions present negligible changes and in the 3rd best solution, there is an increase of energy production. For the best and 2nd best solutions, the MHPs are installed immediately upstream from a regulation water tank. The 20% reduction in the consumption does not strongly influence the flow discharges in this area, which are highly dependent on the levels of the water tank and water source. For the 3rd best solution, the flow discharge increased due to the new network equilibrium. The majority of pipes in the network suffered a decrease in flow discharge with the smaller consumption. However, pipe 2987 was one of the exceptions. These results illustrate the complexity of installing MHPs in urban networks and evoke the need for careful sensitivity analysis with respect to the consumption. Considering the small differences in the results, a sensitivity analysis for a reduction of 10% in the consumption is not shown. Under the actual conditions, the network does not support an increase in the consumption (negative pressures appear in the network even for a slight increase). Thus, an analysis of an increase in the consumption is not presented. However, a complete sensibility analysis should always be envisaged. Also, carrying out long-term simulations is recommended, in order to achieve a robust estimation of the produced energy and economic value of the installation [11].

5. Methodology for Expedited Assessment of Energy Recovery

The obtained results were achieved through an optimization process where a considerable amount of data and also time are needed. Based on the experience gained in the course of this work, an expedited method to preliminarily evaluate the interest of placing one turbine in a given location of a network is provided here. The topography of the network, the maximum discharge in the pipes and the temporal variation of the consumption are assumed to be known.
Since the choice of diameter of the turbine is dependent on the maximum discharge in the pipe, the corresponding head is given by the characteristic curve of the turbine according to the similarity law. Figure 9 presents the variation of head with the maximum pipe discharge, which is obtained considering different runner diameters of the 5BTP. Figure 10 plots investment costs and the installed power as a function of the maximum pipe discharge and, consequently, the diameter of the runner. This figure was obtained considering the unit prices from Table 2 and the existing pipe has a diameter which allows a design velocity of 1 m/s.
The expedite method follows the following steps:
  • Identify all PRVs in the network and obtain the respective maximum discharge.
  • Order all pipes in the network by decreasing discharge and select a feasible number of pipes with highest discharges to analyze (n = 20 for example).
  • In the n selected pipes, and considering the value of the maximum discharge, verify if the difference between the lowest pressure in the downstream node of each selected pipe and the limit minimum pressure is larger than the maximum head according to Figure 9.
  • Estimate for each PRV site and selected pipe the cost of the MHP and generation potential according to Figure 10.
  • Estimate an energy production based on the characteristic curves of the 5BTP [25] and the temporal variation of the consumption. The estimation can be obtained considering the flow data or, if not available, a consumption pattern such as Figure 5.
These steps allow for the preliminary identification of potential locations in the network to install a MHP with one turbine. However, a more detailed simulation, as proposed in the methodology, is required to ensure that the minimum pressure in all nodes is maintained and account for possible discharge variation due to the redundancy of the network, estimating with higher precision both energy production and costs. Combinations with more than one turbine also require detailed simulations.

6. Conclusions

A methodology has been presented in this paper to estimate the potential for hydropower in urban water supply networks based on an available energy concept. It is applied to the city of Fribourg, Switzerland and, for comparison, an optimization algorithm was used to estimate the actual energy production in the best locations of the network with a proposed micro-turbine, the 5BTP. The optimization maximizes the economic value of the installation, and combinations with one to four turbines were tested. It is concluded that one turbine can produce 60.5 MWh/year in this network, representing 10% of the available energy, and that four 5BTP turbines would extract 136.2 MWh/year, which is less than four times the production with one turbine. Locations where PRVs are already in place are attractive, especially if a civil infrastructure that can be adapted is already in place. The costs for civil construction were seen to have an important weight on the feasibility results. Sensitivity analysis of the demand should be considered to verify the impact of this in the energy production and in the behavior of the network. Finally, a method for an expedited assessment of the location and energy production with one turbine is proposed based on discharge data in the network and on typical design assumptions.

Acknowledgments

This research is supported by Ph.D. grant ref. SFRH/BD/51931/2012 issued by FCT under the IST-EPFL Joint Ph.D. initiative. Sponsoring by the Swiss Competence Center for Energy and Research—Supply of Electricity (SCCER-SoE) under contract CTI.2013.0288 is also acknowledged. The authors thank the Industrial Services of Fribourg, Switzerland, for the data provided to support this work and Ribi SA for sharing their knowledgeable insight on the Fribourg water supply network.

Author Contributions

Irene Samora is a Ph.D. Student supervised by Helena M. Ramos and Anton J. Schleiss; Mário J. Franca and Pedro Manso contributed to the developed concepts; all authors contributed to the writing of the paper.

Conflicts of Interest

The authors declare no conflict of interest. The funding sponsors had no role in the design of the study; in the collection, analyses and interpretation of data; in the writing of the manuscript; and in the decision to publish the results.

Abbreviations

The following abbreviations are used in this manuscript:
WSSWater supply system
MHPMicro-hydropower plant
PRVPressure reducing valve
NPVNet present value
5BTPFive blade tubular propeller

References

  1. Vilanova, M.R.N.; Balestieri, J.A.P.; Filho, P.M. Energy and hydraulic efficiency in conventional water supply systems. Energy Policy 2013, 30, 701–714. [Google Scholar]
  2. Ulanicki, B.; Bounds, P.L.M.; Rance, J.P.; Reynolds, L. Open and closed loop pressure control for leakage reduction. Urban Water 2000, 2, 105–114. [Google Scholar] [CrossRef]
  3. Carravetta, A.; Giuseppe, G.; Fecarotta, O.; Ramos, H. Energy production in water distribution networks: A PAT design strategy. Water Resour. Manag. 2012, 26, 3947–3959. [Google Scholar] [CrossRef]
  4. Gallagher, J.; Harris, I.M.; Packwood, A.J.; McNabola, A.; Williams, A.P. Strategic assessment of energy recovery sites in the water industry for UK and Ireland: Setting technical and economic constraints through spatial mapping. Renew. Energy 2015, 81, 808–815. [Google Scholar] [CrossRef]
  5. Samora, I.; Franca, M.J.; Schleiss, A.J.; Ramos, H.M. Simulated annealing in optimization of energy production in a water supply network. Water Resour. Manag. 2016, 30, 1533–1547. [Google Scholar] [CrossRef]
  6. Vicente, D.J.; Garrote, L.; Sánchez, R.; Santillán, D. Pressure management in water distribution systems: Current status, proposals, and future trends. J. Water Resour. Plan. Manag. 2016. [Google Scholar] [CrossRef]
  7. Xu, Q.; Chen, Q.; Ma, J.; Blanckaert, K.; Wan, Z. Water saving and energy reduction through pressure management in urban water distribution networks. Water Resour. Manag. 2014, 28, 3715–3726. [Google Scholar] [CrossRef]
  8. Fantozzi, M.; Calza, F.; Kingdom, A. Experience and results achieved in introducing District Metered Areas (DMA) and Pressure Management Areas (PMA) at Enia utility (Italy). In Proceedings of the IWA International Specialized Conference Water Loss, Cape Town, South Africa, 26–29 April 2009.
  9. Carravetta, A.; Giugni, M. Functionality factors in the management and rehabilitation of water networks. In Management of Water Networks, Proceedings of the Conference Efficient Management of Water Networks, Ferrara, Italy, 17–19 May 2006.
  10. Fecarotta, O.; Aricò, C.; Carravetta, A.; Martino, R.; Ramos, H.M. Hydropower potential in water distribution networks: Pressure control by PATs. J. Water Resour. Plan. Manag. 2014, 29, 699–714. [Google Scholar] [CrossRef] [Green Version]
  11. Sitzenfrei, R.; von Leon, J. Long-time simulation of water distribution systems for the design of small hydropower systems. Renew. Energy 2014, 72, 182–187. [Google Scholar] [CrossRef]
  12. OFGEM. Feed-in Tariff: Guidance for Renewable Installations, 10.2th ed.; Gas and Electricity Markets Authority: London, UK, 2016. [Google Scholar]
  13. Ramos, H.; Kenov, K.; Vieira, F. Environmentally friendly hybrid solutions to improve the energy and hydraulic efficiency in water supply systems. Energy Sustain. Dev. 2011, 15, 436–442. [Google Scholar] [CrossRef]
  14. Williams, A.; Smith, N.P.A.; Bird, C.; Howard, M. Pumps as turbines and the inductions motors as generators for energy recovery in water supply systems. Water Environ. J. 1998, 12, 175–178. [Google Scholar] [CrossRef]
  15. Lisk, B.; Greenberg, E.; Bloetscher, F. Implementing Renewable Energy at Water Utilities; Case Studies; Water Research Foundation: Denver, CO, USA, 2012. [Google Scholar]
  16. Hong Kong Polytechnic University, Novel Inline Hydropower System for Power Generation from Water Pipelines. Available online: http://phys.org/news/2012-12-inline-hydropower-power-pipelines.html (accessed on 24 May 2016).
  17. McNabola, A.; Coughlan, P.; Williams, A.P. Energy recovery in the water industry: An assessment of the potential of micro hydropower. Water Environ. J. 2014, 28, 294–304. [Google Scholar] [CrossRef]
  18. Samora, I.; Manso, P.; Franca, M.J.; Schleiss, A.J.; Ramos, H.M. Opportunity and economic feasibility of inline micro-hydropower units in water supply networks. J. Water Resour. Plan. Manag. 2016. [Google Scholar] [CrossRef]
  19. Corcoran, L.; McNabola, A.; Coughlan, P. Optimization of water distribution networks for combined hydropower energy recovery and leakage reduction. J. Water Resour. Plan. Manag. 2015. [Google Scholar] [CrossRef]
  20. Rossman, L.A. EPANET 2 Users’ Manual. Water Supply and Water Resources Division, National Risk Management Research Laboratory, Cincinnati; United States Environmental Protection Agency: Cincinnati, OH, USA, 2000.
  21. Hickey, H. Water Supply Systems and Evaluation Methods Vol II; U.S. Fire Administration: Emmitsburg, MD, USA, 2008.
  22. Swiss Gas and Water Industry Association (SVGW). W4—Directive for Water Supply; SVGW: Zurich, Switzerland, 2013. (In French) [Google Scholar]
  23. Swiss Federal Council (SFC). Directive for Energy; SFC: Bern, Switzerland, 1998. [Google Scholar]
  24. Swiss Federal Office of Energy (SFOE). Directive for Feed-in-Tariff of Injected Current; SFOE: Bern, Switzerland, 2015. [Google Scholar]
  25. Samora, I.; Hasmatuchi, V.; Münch-Alligné, C.; Franca, M.J.; Schleiss, A.J.; Ramos, H.M. Experimental characterization of a five blade tubular propeller turbine for pipe inline installation. Renew. Energy 2016, 95, 356–366. [Google Scholar] [CrossRef]
Figure 1. Energy excess at each point of a pipe, defined as the hydraulic head above minimum pressure, for several instances where a steady state is observed.
Water 08 00344 g001
Figure 2. Examples of reaches. (a) Reach without available energy; (b) Reach with available energy; (c) Reach belonging to a closed network with available energy: effect of the extraction in one critical point; (d) Reach belonging to a closed network with available energy: effect of the extraction in two critical points.
Water 08 00344 g002
Figure 3. Algorithm to estimate the potential for hydropower of a network, given by the total available energy.
Water 08 00344 g003
Figure 4. Water supply network of Fribourg. The nodes are represented by circles with a fill-color representing the elevation of the node.
Water 08 00344 g004
Figure 5. Pattern of hourly variation of consumption along the day, adapted from [21], with the indication of the energy buy-prices which vary within the day.
Water 08 00344 g005
Figure 6. Detailed sketch representation of the inline installation of a 5BTP in a pipe.
Water 08 00344 g006
Figure 7. Sketch of the concrete chamber for the installation of a 5BTP (adapted from [18]). Up to four turbines can be installed with this design.
Water 08 00344 g007
Figure 8. Localization of selected pipes from Table 6 (Zoom A from Figure 4).
Water 08 00344 g008
Figure 9. Characteristic curve of maximum discharges, for different diameters, of the 5BTP.
Water 08 00344 g009
Figure 10. Variation of average investment cost and installed power of the 5BTP with maximum discharge in the pipe (assuming design head from Figure 9).
Water 08 00344 g010
Table 1. Operating conditions of the pumping stations and annual energy consumption in the network of Fribourg.
Pump StationHmed (m)Qmed (L/s)Pmed (kW)E (MWh)
1805.4760
24518.813111
3605.8648
4583.7331
Total24433.729250
Table 2. Unit prices considered for the Fribourg WSS case study.
ElementUnit Price
Stainless steel7 $/kg
Reinforced concrete250 $/m3
Excavation30 $/m3
Earth fill20 $/m3
Electromechanical equipment1 $/W
Maintenance valve w/wheel drive190,000 $/m2
Flowmeter550 $/unit
Table 3. Results from the evaluation of available energy in the city of Fribourg partitioned by the network, PRVs and the total.
Epot (MWh/year)
Network168
Existing PRV430
Total598
Table 4. Pipes where energy has been extracted.
Pipe IDH (m)Epot (MWh/year)
298612.3101.9
282459.24.4
291411.18.9
19281.51.2
297339.429.2
78640.820.6
24275.92.8
24150.60.3
Total170.7168.3
Table 5. Power extracted in RPV.
PRV IDH (m)Epot (MWh/year)
297849.223.6
297943.217.3
298149.216.0
298249.624.4
298349.59.3
298450.04.4
298550.02.2
298640.3331.2
29870.31.1
Total381.3429.5
Table 6. Results from the search algorithm applied to the Fribourg network model. The three best solutions in terms of NPV20years are shown.
Best SolutionXE (MWh/year)Dt (mm)Pmax (kW)NPV20 (k$)Cost Price (cts$/kWh)Payback Period (years)
Best solution298660.51658.125820.7
(2986, 2986)120.9(165, 165)16.252110.5
(2986, 2986, 2986)131.7(155, 155, 155)17.856910.5
(2986, 2986, 2986, 2987)136.2(165, 165, 165, 135)18.558610.6
2nd best solution273060.51658.125031.1
(2730, 2730)120.9(165, 165)16.251320.8
(2730, 2730, 2730)131.8(155, 155, 155)17.856120.7
(2730, 2730, 2730, 2987)136.2(165, 165, 165, 135)18.557520.8
3rd best solution29871.5850.2572.9
(2987, 2987)1.3(85, 85)0.2573.1
(2987, 2987, 2987)1.1(85, 85, 85)0.2483.5
(2982, 2982, 2987, 2987)1.6(85, 85, 95, 95)0.35125.6
Table 7. Previous solutions with 80% of the consumption.
Best SolutionE (MWh/year)NPV20 (k$)Payback Period (years)
Best solution60.52580.7
120.95210.5
130.35630.5
124.95380.6
2nd best solution60.52501.1
120.95130.8
130.45550.7
124.95270.8
3rd best solution2.082.1
1.662.6
1.562.7
2.174.4

