
A Simplified Model for Modular Green Roof Hydrologic Analyses and Design

1
Water Resources Engineer, Parsons Brinckerhoff, 1 E Pratt Street, Suite 300, Baltimore, MD 21202, USA
2
Civil & Environmental Engineering Departmemt and Water Resources Research Center, University of Hawai’i at Manoa, 2540 Dole Street, Holmes Hall 383, Honolulu, HI 96822, USA
*
Author to whom correspondence should be addressed.
Water 2016, 8(8), 343; https://doi.org/10.3390/w8080343
Submission received: 16 May 2016
/
Revised: 24 July 2016
/
Accepted: 9 August 2016
/
Published: 12 August 2016
(This article belongs to the Special Issue Urban Drainage and Urban Stormwater Management)
Abstract
:Green roofs can mitigate urban rooftop stormwater runoff. However, the lack of accurate, physically-based performance assessment and design models has hindered their wide application. Most hydrologic or hydraulic models have no direct connection to the physical properties of green roof components such as media type/depth, drainage depth, etc. In an effort to assist design engineers, a simplified yet effective physically-based model was developed and calibrated with pilot data in order to provide green roof hydrologic performance curves to guide design. Precipitations with depths ranging from 0 to 40 cm and durations 30 to 1440 min were simulated for 21 green roof designs to determine the effects of common physical design parameters. Results revealed that effective capacity and transient capacity are the controlling factors for runoff volume reduction for single precipitation events. Including a water storage feature in the design increased cumulative long-term runoff reduction by an average of 23.5%, whereas increasing growth media depth yielded an average 5.3% improvement. Peak reduction and peak delay are governed by media depth and drainage opening size. Study results indicate that LEED criteria should be modified to require specific designer-controlled parameters of storage and media depth for the design storm to ensure desired performance.

1. Introduction
Green roofs, which are a best management practice (BMP) for stormwater management, reduce runoff volume during precipitation events by retaining water in the media, reduce peak flow and delay peak flow timing through infiltration and drainage control. In the long term, a green roof also reduces runoff volume through evapotranspiration (ET) [1]. These hydrologic improvements potentially reduce negative impacts of flooding, erosion and degraded water quality on downstream ecosystems and water users. However, for the designer to meet the stormwater management requirements of various environmental criteria such as LEED (Leadership in Energy and Environmental Design), predicting these hydrologic responses in relation to physical design parameters is challenging because of the highly non-linear relationships involved and the spatial and temporal variations of meteorological conditions and precipitation characteristics.
These difficulties result in two challenges for engineers: (1) how to predict hydrologic performance based on green roof designs; and (2) how to design a green roof to meet specific performance requirements. Most existing models are not conveniently ready for either modeling the essential features of modern green roofs such as various water storage mechanisms, or simulating the hydrologic responses to a broad spectrum of precipitation characteristics [2]. For instance, HYDRUS has difficulties modeling open water storage, experiences convergence issues when dealing with extremely dry or wet conditions, and requires advanced skills in simulating precipitation events with variable recurrence intervals, durations, and depths [2]. Other modeling efforts are either case specific [3], statistics based [4,5], or limited in capability to simulate the actual physical processes involved [6,7,8,9,10]. Some physical-process-based models, such as the conceptual model [11] by Locatelli et al. are good for evaluating large-scale impacts of green roofs when integrated in the urban drainage model; the hydrological flux model [12] by Stovin et al. is successful in predicting the long-term water content and runoff retention performance; and the two-stage storage routing model [13] by Vesuviano et al. uses a semi-empirical model to simulate runoff responses. Green roof design practitioners may find it difficult to directly correlate design parameters with expected hydrological performance using these models.
In order to resolve these issues and develop a specialized tool for green roof design and assessment, a model that generalizes the essential features of most modern green roofs and contains variable design components, including growth media depth, drainage control, and water storage, is necessary. Such a model could serve as a platform for investigating hydrologic performance including runoff volume reduction, peak reduction, and peak delay for a wide range of precipitation events and cumulative runoff reduction over long periods of time for any green roof configuration.
In addition, there is a practical issue related to designing for LEED credit which requires 25% reduction of total volume and peak flow for a 2-year, 24-h design storm. Currently, there is no reliable relationship between green roof design parameters and these performance criteria. The work presented here solves this issue by developing green roof hydrologic response curves and suggesting more appropriate capacity-based LEED design criteria.
2. Materials and Methods
2.1. Typical Green Roof Configurations and Hydrologic Processes
Green roofs are located on rooftops where plants are frequently subjected to water stress due to the isolated environment and the rapid draining property of the growth media typically employed. As such, modern green roof designs (Figure 1) should include a water storage reservoir to store water to improve stormwater runoff retention and supply water to the growth media for plant survival.
In this green roof system, water is supplied by precipitation/irrigation, consumed by interception and ET or discharged through surface overflow and drainage underflow. Water in the reservoir is recharged through percolation and discharged by capillary transport to the media or drainage underflow. During precipitation/irrigation, some water will be intercepted by leaves at the beginning, and some will leave the system as surface overflow when the precipitation rate exceeds the infiltration rate. The remainder infiltrates and percolates through the growth media to saturate the media and recharge the water storage. Excess water leaves the system through drainage underflow. Water movement and distribution in the system are governed by the hydraulic conductivity and media-water content profiles. It is noted that typically, green roof media have sufficient permeability to preclude surface overflow.
2.2. Governing Equations
In this study, water movement is simplified by mass conservation equations. Water content in the system is controlled by precipitation (and/or irrigation) rate (P), surface overflow (S), drainage underflow (U), and ET (Equation (1)). Surface overflow and drainage underflow are determined by the hydraulic conductivity function (Equations (2) and (3)). At any given time, the water distribution in the system is balanced by the water content profile. Water storage recharge and capillary exchange between storage and growth media are internal processes based on water exchange surface area and hydraulic conductivity. The free water surface in the water storage (Hs) is equal to the height of the saturated water surface in the growth media. The water content profile and the hydraulic conductivity profile are approximated by a water retention function (θ(H)) Equation (4) from van Genuchten [14], and the hydraulic conductivity function (K(H)) Equation (5) by Mualem [15], respectively. Water content in the system is calculated by Equations (6)–(8).
where: M (cm) is the total amount of water in the system; P (cm/min) is the precipitation rate; S (cm/min) is surface overflow rate; U (cm/min) is drainage underflow rate; ET (cm/min) is evapotranspiration; θ (cm3/cm3) is the volumetric water content; θs (cm3/cm3) is saturated water content; θr (cm3/cm3) is residual water content; α, n, m (m = 1 − 1/n) are hydraulic retention curve parameters of growth media; l is the soil tortuosity parameter; H, h (cm) are height; Hs is where θ = θs; K (cm/min) is hydraulic conductivity; Ks is the saturated hydraulic conductivity; Ao/As is the ratio of the drainage opening area to green roof surface area in each module; fb, and fw are sizing ratios, fb + fw = 1.
2.3. Green Roof Runoff Hydrograph Simulation
Three hydrologic performance quantifiers were calculated based on the runoff hydrograph. Volume reduction (Rv) and peak reduction (Rp) were calculated as the percentage of reduced quantity over precipitation volume or maximum peak flow (Equations (9) and (10)). Peak delay (Rt) was calculated as percentage of delayed time normalized by precipitation duration minus peak time (in order to compare the peak delays of precipitations with various durations) (Equation (11)).
where: Rv, Rp, and Rt are volume reduction, peak reduction, and peak delay; D and d are precipitation depth and runoff depth (cm); P and p are precipitation peak and runoff peak rate (cm/min); T and t are precipitation peak time and runoff peak time (min); L is precipitation duration (min).
2.4. Computer Simulation
The above governing Equations (1)–(8) can be solved numerically. Input data are green roof physical dimension parameters H1, H2, fa, fb, fw; growth media hydraulic properties θr, θs, Ks, α, n, l; ET (typically 0.6~0.8 ET0 for green roofs); and precipitation time series. In this study, precipitation events were generated from Natural Resources Conservation Service (NRCS) Type I synthetic precipitations. Durations were set to 30, 60, 120, 180, 360, 720, and 1440 min and the depths of each synthetic precipitation event of each duration varied from 0 cm to 40 cm at an increment of 0.5 cm. A total of 567 precipitation events were simulated on each of 21 different green roof configurations to study the hydrologic behavior of green roofs. Outputs of this model are the hydrograph of total runoff vs. time and calculated hydrologic performance results (Rv, Rp, and Rt).
During each precipitation event, a finite amount of water is added to the system in each calculation step. The water content profile and hydraulic conductivity profile in the growth media are then numerically solved. Surface overflow occurs when the precipitation rate exceeds the hydraulic conductivity at the media surface. Drainage underflow is calculated by the hydraulic conductivity at the drainage height. Water storage recharge/discharge is calculated based on the hydraulic conductivity and water content along the exchange interface. Then, a second finite amount of water is added and new water content and hydraulic conductivity profiles are calculated. This process continues until after the precipitation ends and the system reaches an equilibrium state.
This model was implemented in Excel using VBA so that design professionals could use it to iterate new green roof designs to meet certain criteria or to conduct performance assessments of existing designs. The model was also programed in MATLab for more sophisticated calculations. The model was calibrated using data collected from a pilot green roof over a 7-day period. The calibrated model was used to simulate 567 precipitation events to evaluate performance trends. The calibrated model was also used to simulate performance of 21 different green roof configurations for one year of historical rainfall and irrigation events at the pilot green roof location.
3. Calibration
3.1. Pilot Green Roof Experimental Data
A pilot green roof system was installed at University of Hawaii at Manoa [16]. There were three different module depths, 10 cm, 15 cm, and 20 cm. All three modules had drainage openings located 1.27 cm above the bottom. There was no water storage reservoir in these modules. Water content of the growth media near the surface (integrated over depth: 0–5 cm) was collected with time domain reflectometry (TDR) sensors (EC-5, Decagon Devices, Pullman, WA, USA). Precipitation and reference ET were monitored by an on-site weather station. Irrigation was also measured.
3.2. Calibration and Sensitivity of the Simplified Model
Model-simulated water content was calibrated against observed water content from the pilot green roof modules by varying the input parameters (Table 1) over a seven-day period. Five minor precipitation events (0.02 to 0.05 cm) occurred during this period along with 7 irrigation events (1.5 to 5 cm each). Water retention curve parameters such as θs and Ks are supplied by the growth media manufacturers. The growth medium used in this experiment was perlite. Typical hydraulic property parameters (θr, α, and n) for perlite and other growth media can be found in the literature [17]. Values for all of these parameters were measured in the pilot green roof at the University of Hawaii and used to calibrate a HYDRUS-2D model as described elsewhere [16].
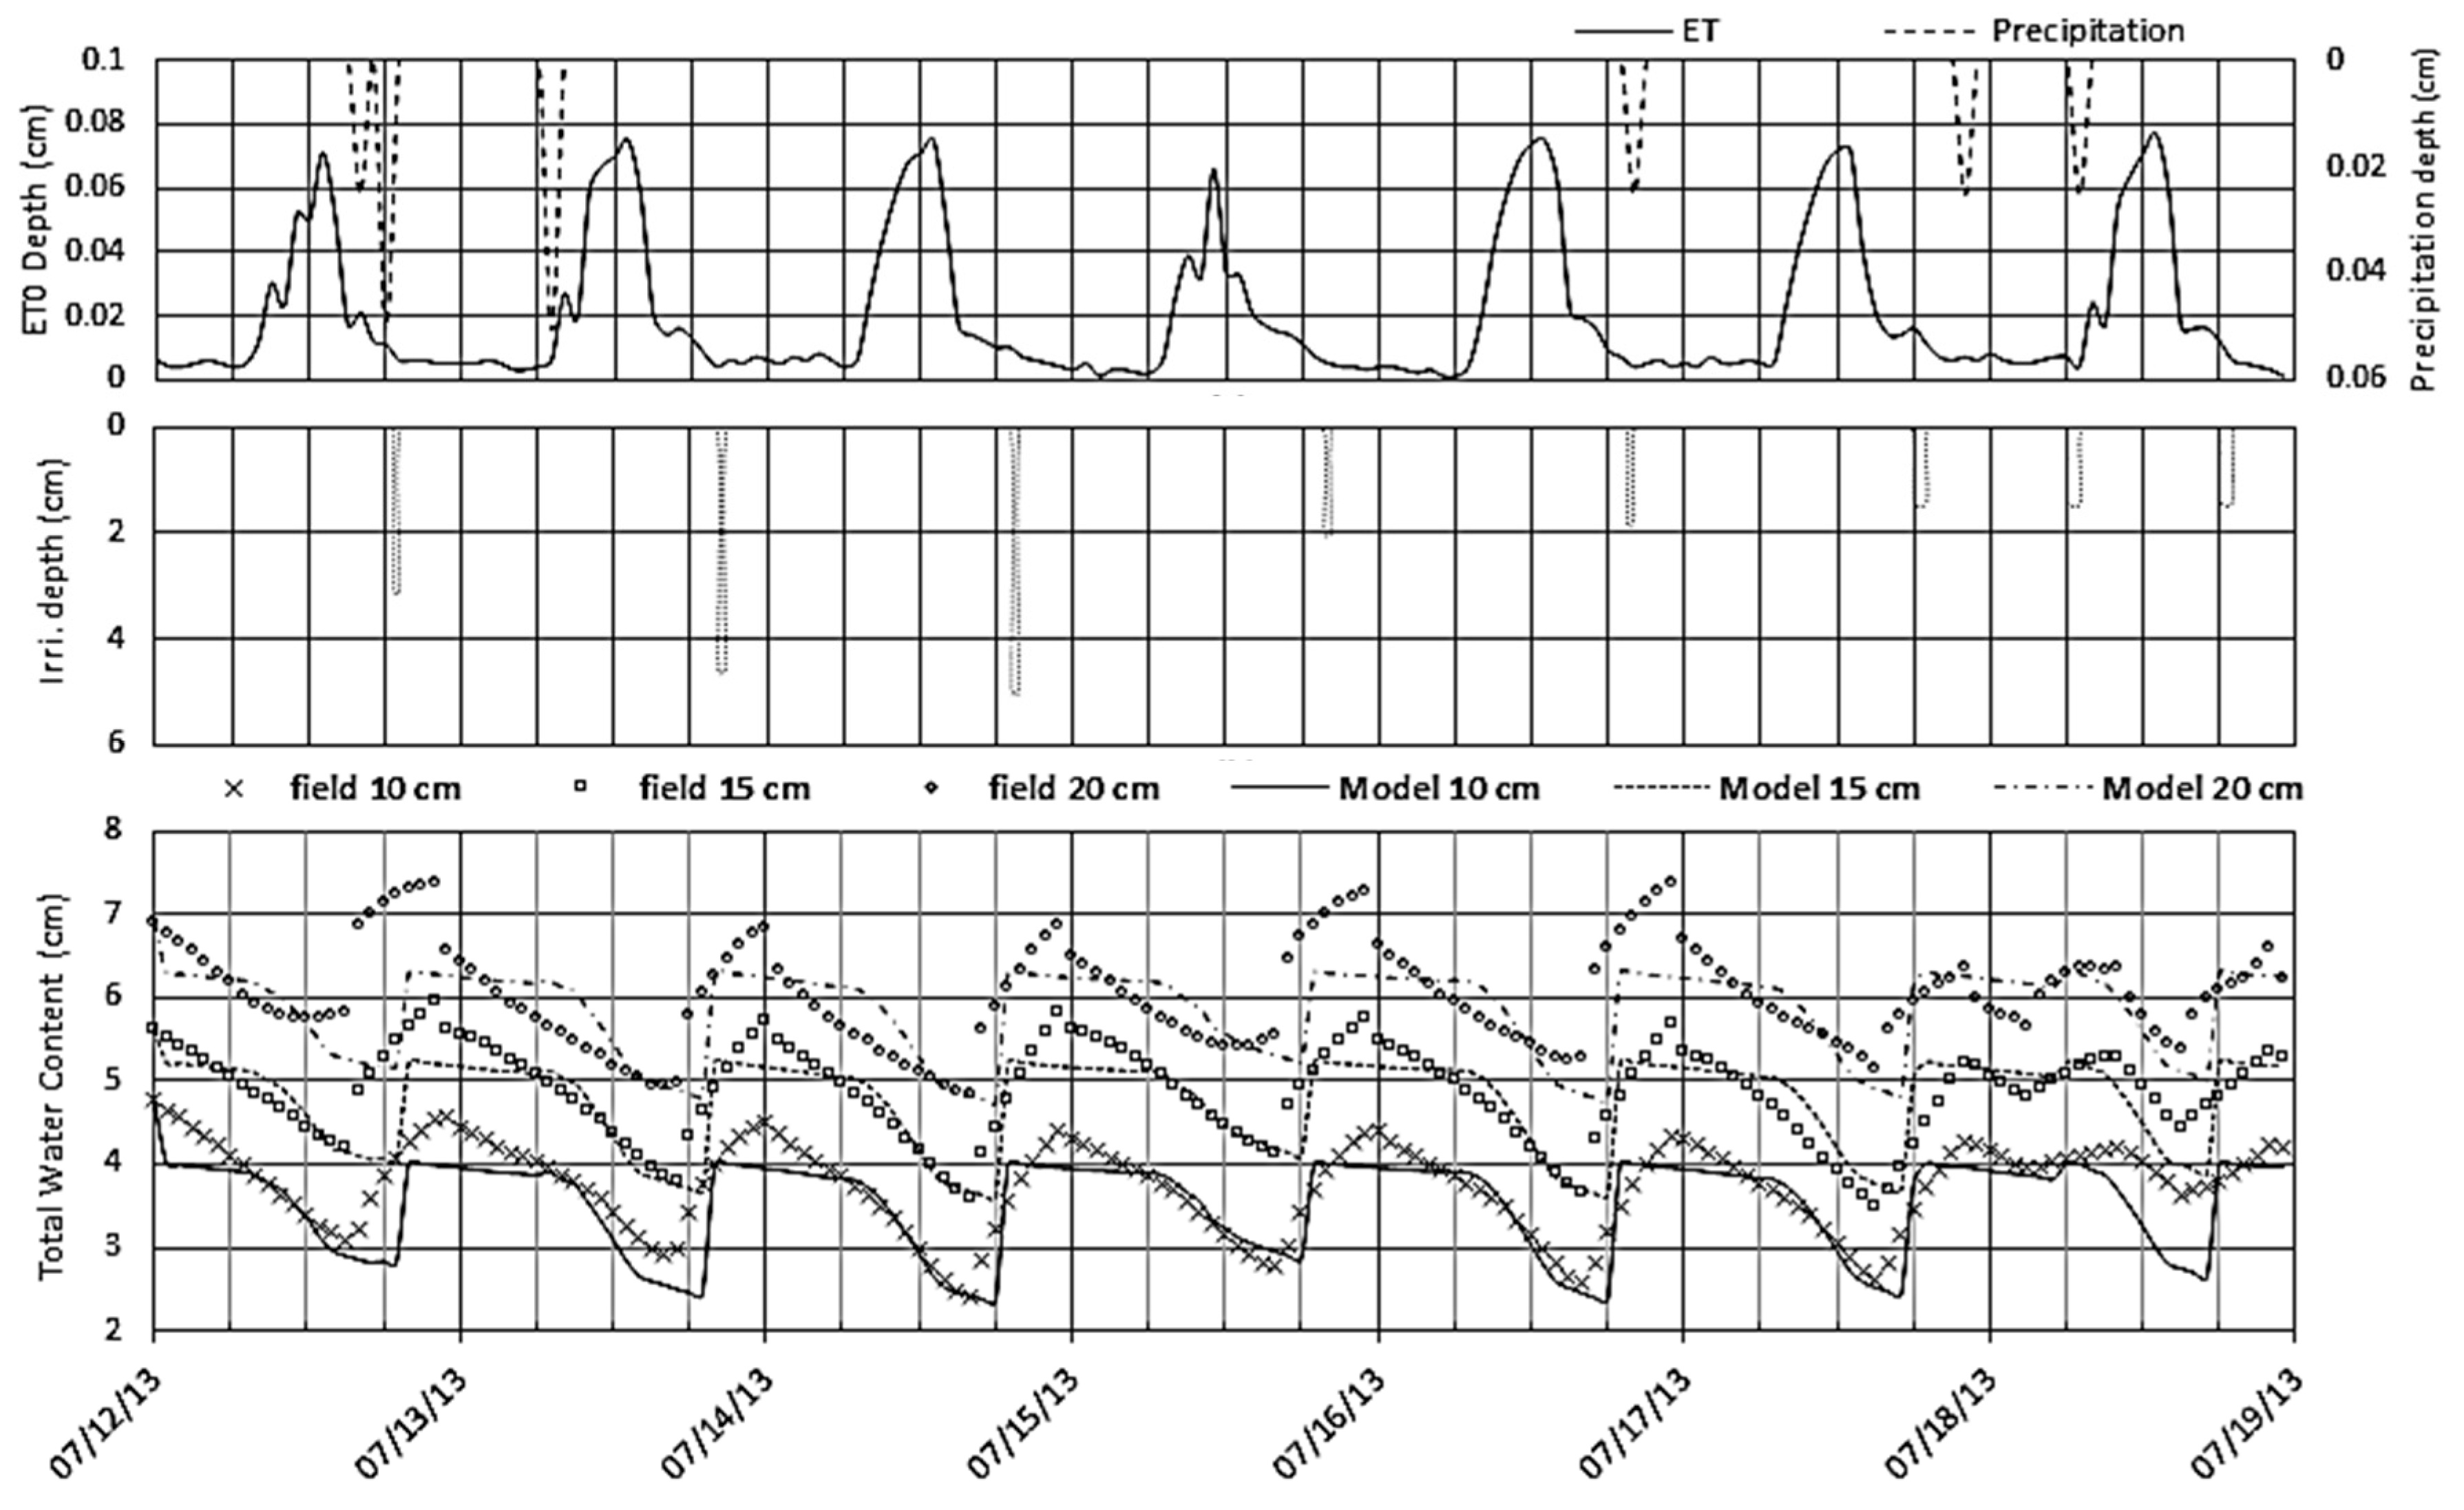
Calibration results showed that this simplified modeling approach is able to capture the general water content trend, but it does not reflect the slow increases and decreases during the irrigation events as seen in Figure 2. The slow increase/decrease of water content is most likely caused by the slow response of the soil moisture sensor. Further, the slow decrease is probably also caused by the temporary retention effect of the vegetation roots. These effects are not considered in the simplified model. Overall, however, the simplified model renders reasonable results. The root mean squared errors are 0.305, 0.311, and 0.327 cm for the 10, 15, and 20 cm modules, respectively. It is noted that there was no surface runoff in the test plots or in the simulation results.
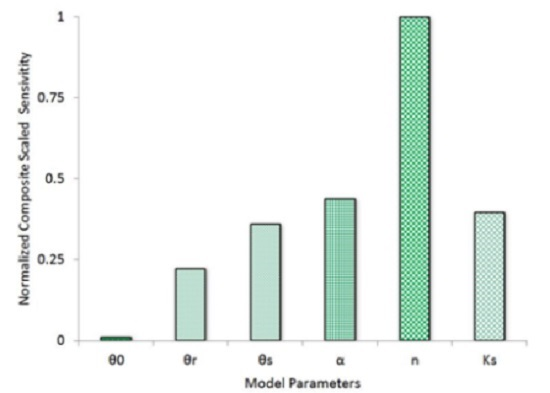
Sensitivity of the model input parameters was analyzed using the composite scaled sensitivity (CSS) method [18]. The sensitivity analysis (Figure 3) shows that the most sensitive parameter for water content simulation is the growth media hydraulic retention curve parameter n. The parameters Ks, α, θs and θr are approximately equally sensitive. θ0 does not affect the results since the model quickly rebalances the water content when irrigation occurs. This calibrated model was used for extrapolation [19] to hypothetical green roofs of greater depth and to synthetic precipitation events of different durations and magnitudes as described in the following section.
As a normal and necessary practice in modelling exercises [19], this study assumes that a physical-based model calibrated with data from an actual instrumented pilot green roof can be used for extrapolation to hypothetical green roofs of greater depth and to synthetic precipitation events of different durations and magnitudes than those used for calibration. The calibrated model was used for analyzing hydrologic behaviors of hypothetical green roofs of greater depth (20 to 40 cm), in response to synthetic precipitation events of different durations (30, 60, 120, 180, 360, 720, and 1440 min) and magnitudes (0 to 40 cm) as described in the following section.
4. Results and Discussion
4.1. Simulation Results of 21 Configurations
Table 2 shows the simulation results for 21 different hypothetical green roof configurations for a 2-year, 24-h storm (12.7-cm depth). In Table 2, each configuration was named with gr + drainage opening height + total module depth + w (optional for water storage). Initial water content in the media was set to 10% for each simulation, which could be thought of as a best-case scenario for maximizing water retention. This can be adjusted to larger values when simulating any storm event to consider the effects of antecedent precipitation. Increasing the initial water content will decrease the volume reduction, peak reduction and peak delay. The effects of antecedent conditions are considered in Section 4.4 (simulation of one year actual precipitation data). Effective capacity (Ce) is introduced in this work to differentiate this value from field capacity, commonly used in agriculture applications. Field capacity is typically very low in green roof systems with highly drainable growth media. However, it is greatly increased when adding a water storage reservoir. In these simulations, w was chosen as 0.8 which means that 80% of the module area contains water storage of a depth equal to the drainage openings with growth media above that. For the other 20% of module area, the growth media extend all the way to the bottom of the module. The Ce was calculated as the amount of water retained in the green roof module without causing substantial drainage. Under the Ce condition, the water retained in the module will still experience very slow but negligible drainage. The maximum capacity (Cm) was calculated as the amount of water retained when the module is fully saturated less residual water content. The water retention difference between Cm and Ce is called transient capacity (Ct) first defined by Kasmin et al. [19]. The Ct is mainly determined by the growth media depth above the drainage openings. Transient water content is subject to rapid and immediate draining, and has important effects on peak flow and peak delay.
The results in Table 2 show that Ce is usually much smaller than the Cm. Rv increases with increased depth of media (compare gr510, gr520, gr530 and gr540), increased drainage opening height (additional media storage) (compare gr330, gr530, gr1030 and gr1530), and added water reservoir storage (compare gr510 and gr510w; gr1020 and gr1020w; gr1530 and gr1530w). It also shows that adding water storage volume is more effective at increasing Rv than increasing media depth (because the higher drainage openings take advantage only of the media porosity for additional storage whereas the reservoir is all water) (compare gr510 with gr510w and gr540; gr2010 with gr2010w and gr2040). Peak flow reductions and peak delay are greatly affected by Ct.
4.2. Hydrologic Performance Curves
The results in Table 2 are all for a 24-h duration storms (12.7-cm depth). Figure 4 shows hydrologic performance curves as a function of a wide range of precipitation depths (0 to 40 cm) and durations (30 to 1440 min). Results indicate that the green roof runoff rate increases with the precipitation rate as expected. As precipitation rate increases, it slowly reaches and then maintains the maximum drainage speed until surface runoff begins to take place, after which the rate of runoff eventually catches up with the rate of precipitation. Volume reduction decreases as precipitation depth increases (Figure 4a). Runoff was stated to follow a second order polynomial equation in several studies [19,20,21]. This relationship works well for describing slow underflow drainage generated by relatively light precipitation, but would not apply for heavy precipitation or with a water storage reservoir installed. In the latter case, runoff reduction can be simplified by a reciprocal function of Ce and precipitation depth when precipitation exceeds Ce (Equation (12)). Volume reduction does not seem to be affected by transient capacity since this water will slowly drain away eventually. Further, precipitation dynamics only affect volume reduction slightly as will be discussed in the following section.
where: Rv is the volume reduction; Ce is the effective capacity; and D is precipitation depth. (This equation tends to overestimate volume reduction by up to 10% in comparison with the model since in reality, water stored in the green roof continues to drain after the precipitation/irrigation event)
Peak reduction and peak delay are more complex than volume reduction (Figure 4b,c). Both decrease with greater precipitation depth initially, but then rebound as the precipitation increases until the green roof saturates. The runoff rate is limited by the maximum drainage underflow rate (Equation (13)).
where: Imax, underflow is the maximum drainage underflow rate (cm/min); Ao/As is the ratio of the drainage opening area to green roof surface area; and Ks is the saturated hydraulic conductivity (cm/min).
After precipitation surpasses the maximum water capacity, Cm, surface runoff occurs, and both peak reduction and peak delay decrease quickly. The initial point of rebound depends on the Ce of the green roof. The rebound phase ends when surface runoff starts, and the length of the rebound depends on the draining speed, precipitation duration, and Ct. Consequently, Ce and Ct are two controlling factors of peak reduction and peak delay.
4.3. Hydrologic Performance Simulation Results and Analyses
Figure 4 illustrates the major factors that affect the hydrologic performance of green roofs. To avoid cluttering, only selected cases are plotted. Table 2 can be used to locate the others. In Figure 4, the x-axis represents precipitation depth; the y-axis represents simulated total Rv, Rp, or Rt. Volume reduction (Figure 4a) of all configurations decreased sharply as the precipitation depth increased and varied only slightly due to precipitation duration (e.g., 540–30 min vs. 540–1440 min curves). Comparing various configurations, Rv (Figure 4a) increased as the height of drainage opening increased (e.g., 12,710 vs. 310 curves), as the depth of growth media increased (e.g., 310 vs. 2040 curves), and when a water storage reservoir was added (e.g., 2040 vs. 2040w curves). Raising the height of the drainage opening resulting in increased Rv; however, it cannot be placed so high to result in the drowning of the plants. Adding the water storage reservoir greatly increased Rv as shown by gr2040w, which is far superior to the gr2040 and all other configurations. It is noted that the value of the water storage ratio used herein was 0.8 and that this is a design parameter. If smaller values of this ratio are employed, then less Rv will be realized. Adding water storage is more effective than increasing media depth (without adding storage) to increase Ce and consequently increase Rv. It is again noted that the simulations in Figure 4 are for individual events with initial water content of 10% (dry antecedent conditions). If larger values of initial water content are employed, all of the curves would shift toward the upper right. In the worst case, the soil would be saturated at the start of the event and there would be no reduction of volume, peak or peak delay. All actual single event performances will fall between these best-case and worst-case antecedent scenarios.
These results suggest that to meet a desired hydrologic requirement, green roof designers should correctly configure the amount of water storage, growth media depth, and drainage height, but unfortunately, the existing LEED (Leadership in Energy and Environmental Design) performance-based requirements could be considered arbitrary and hard to translate into green roof designs. For example, LEED [22] awards 1 credit for 25% reduction of pre-development peak flow rate and total volume from a 2 year 24 h storm for pre-existing imperviousness greater than 50%. LEED imposes no requirement on peak delay. It is almost impossible to connect these criteria with green roof designs without sophisticated computer simulation or extensive field experiments. According to our simulation results, to acquire the desired treatment performance, these criteria could be defined as a permanent water storage and a transient water storage of at least 25% of a 2-year, 24-h storm (12.70 cm for the case of a roof at the University of Hawaii), which is equivalent to a Ce of 3.18 cm and a Ct of 3.18 cm. Scanning through Table 2, all of the configurations with a total thickness greater than 20 cm achieved 25% or greater on both Rv and Rp, except gr12720. The gr12720 is slightly low in Rv (20.1%), but achieved 39% Rp. The gr320, gr520, gr1020 and gr1020w would all probably have the same module cost; however the 1020w would require less growth media and have much better overall performance than the others. It would also be possible to use the gr510w configuration to meet the LEED requirements while using half as much media, which should lead to a significant cost savings compared to the gr1020w. This capacity-based approach could substitute for the performance-based standard commonly used by LEED to manage future stormwater projects with reasonable precision. This could simplify the design process and give some confidence in expected performance for a given media type.
Rp is a non-linear function determined by the combined effects of infiltration speed, drainage speed, growth media depth, water storage, and precipitation duration. The function was derived in Li and Babcock (2015). In this study, the maximum drainage speed was the same for all modules, and infiltration speed was based on the hydraulic properties of one specific growth media that we evaluated. As shown in Figure 4b, Rp was not improved much when raising drainage height (comparing gr12710 and gr510), and although increasing Ce resulted in a better increase in Rp as seen in configurations gr510 and gr510w or gr1030, gr2040, and gr2040w compared with raising the drainage height, increasing the media depth resulted in a superior increase in Rp (comparing gr510 and gr520). The Ct temporarily stored the water and slowed down the discharge. This shows the special effect of Ct on Rp. Rp drops drastically as precipitation duration increases, which suggests that green roofs are more efficient in reducing peaks of intense events because maximum drainage speed is fixed once the system is designed.
Similar to Rp, Rt is also a non-linear function determined by the combined effects of infiltration speed, drainage speed, growth media depth, water storage, and precipitation duration [16]. Increasing Ce increased Rt before the rebound as seen in configurations gr2040 and gr540 (Figure 4c). Increasing Ct drastically increased the rebound trajectory when comparing gr530 and gr540. Further, adding water storage improved the overall Rt as seen in gr510, gr510w and gr2040, gr2040w. Clearly, Ce and Ct are two major factors affecting Rt, but similar to Rp, Rt becomes less significant as precipitation duration increases as seen in the gr12710 simulation series (30-min to 1440-min).
4.4. Long-Term Runoff Volume Reductions
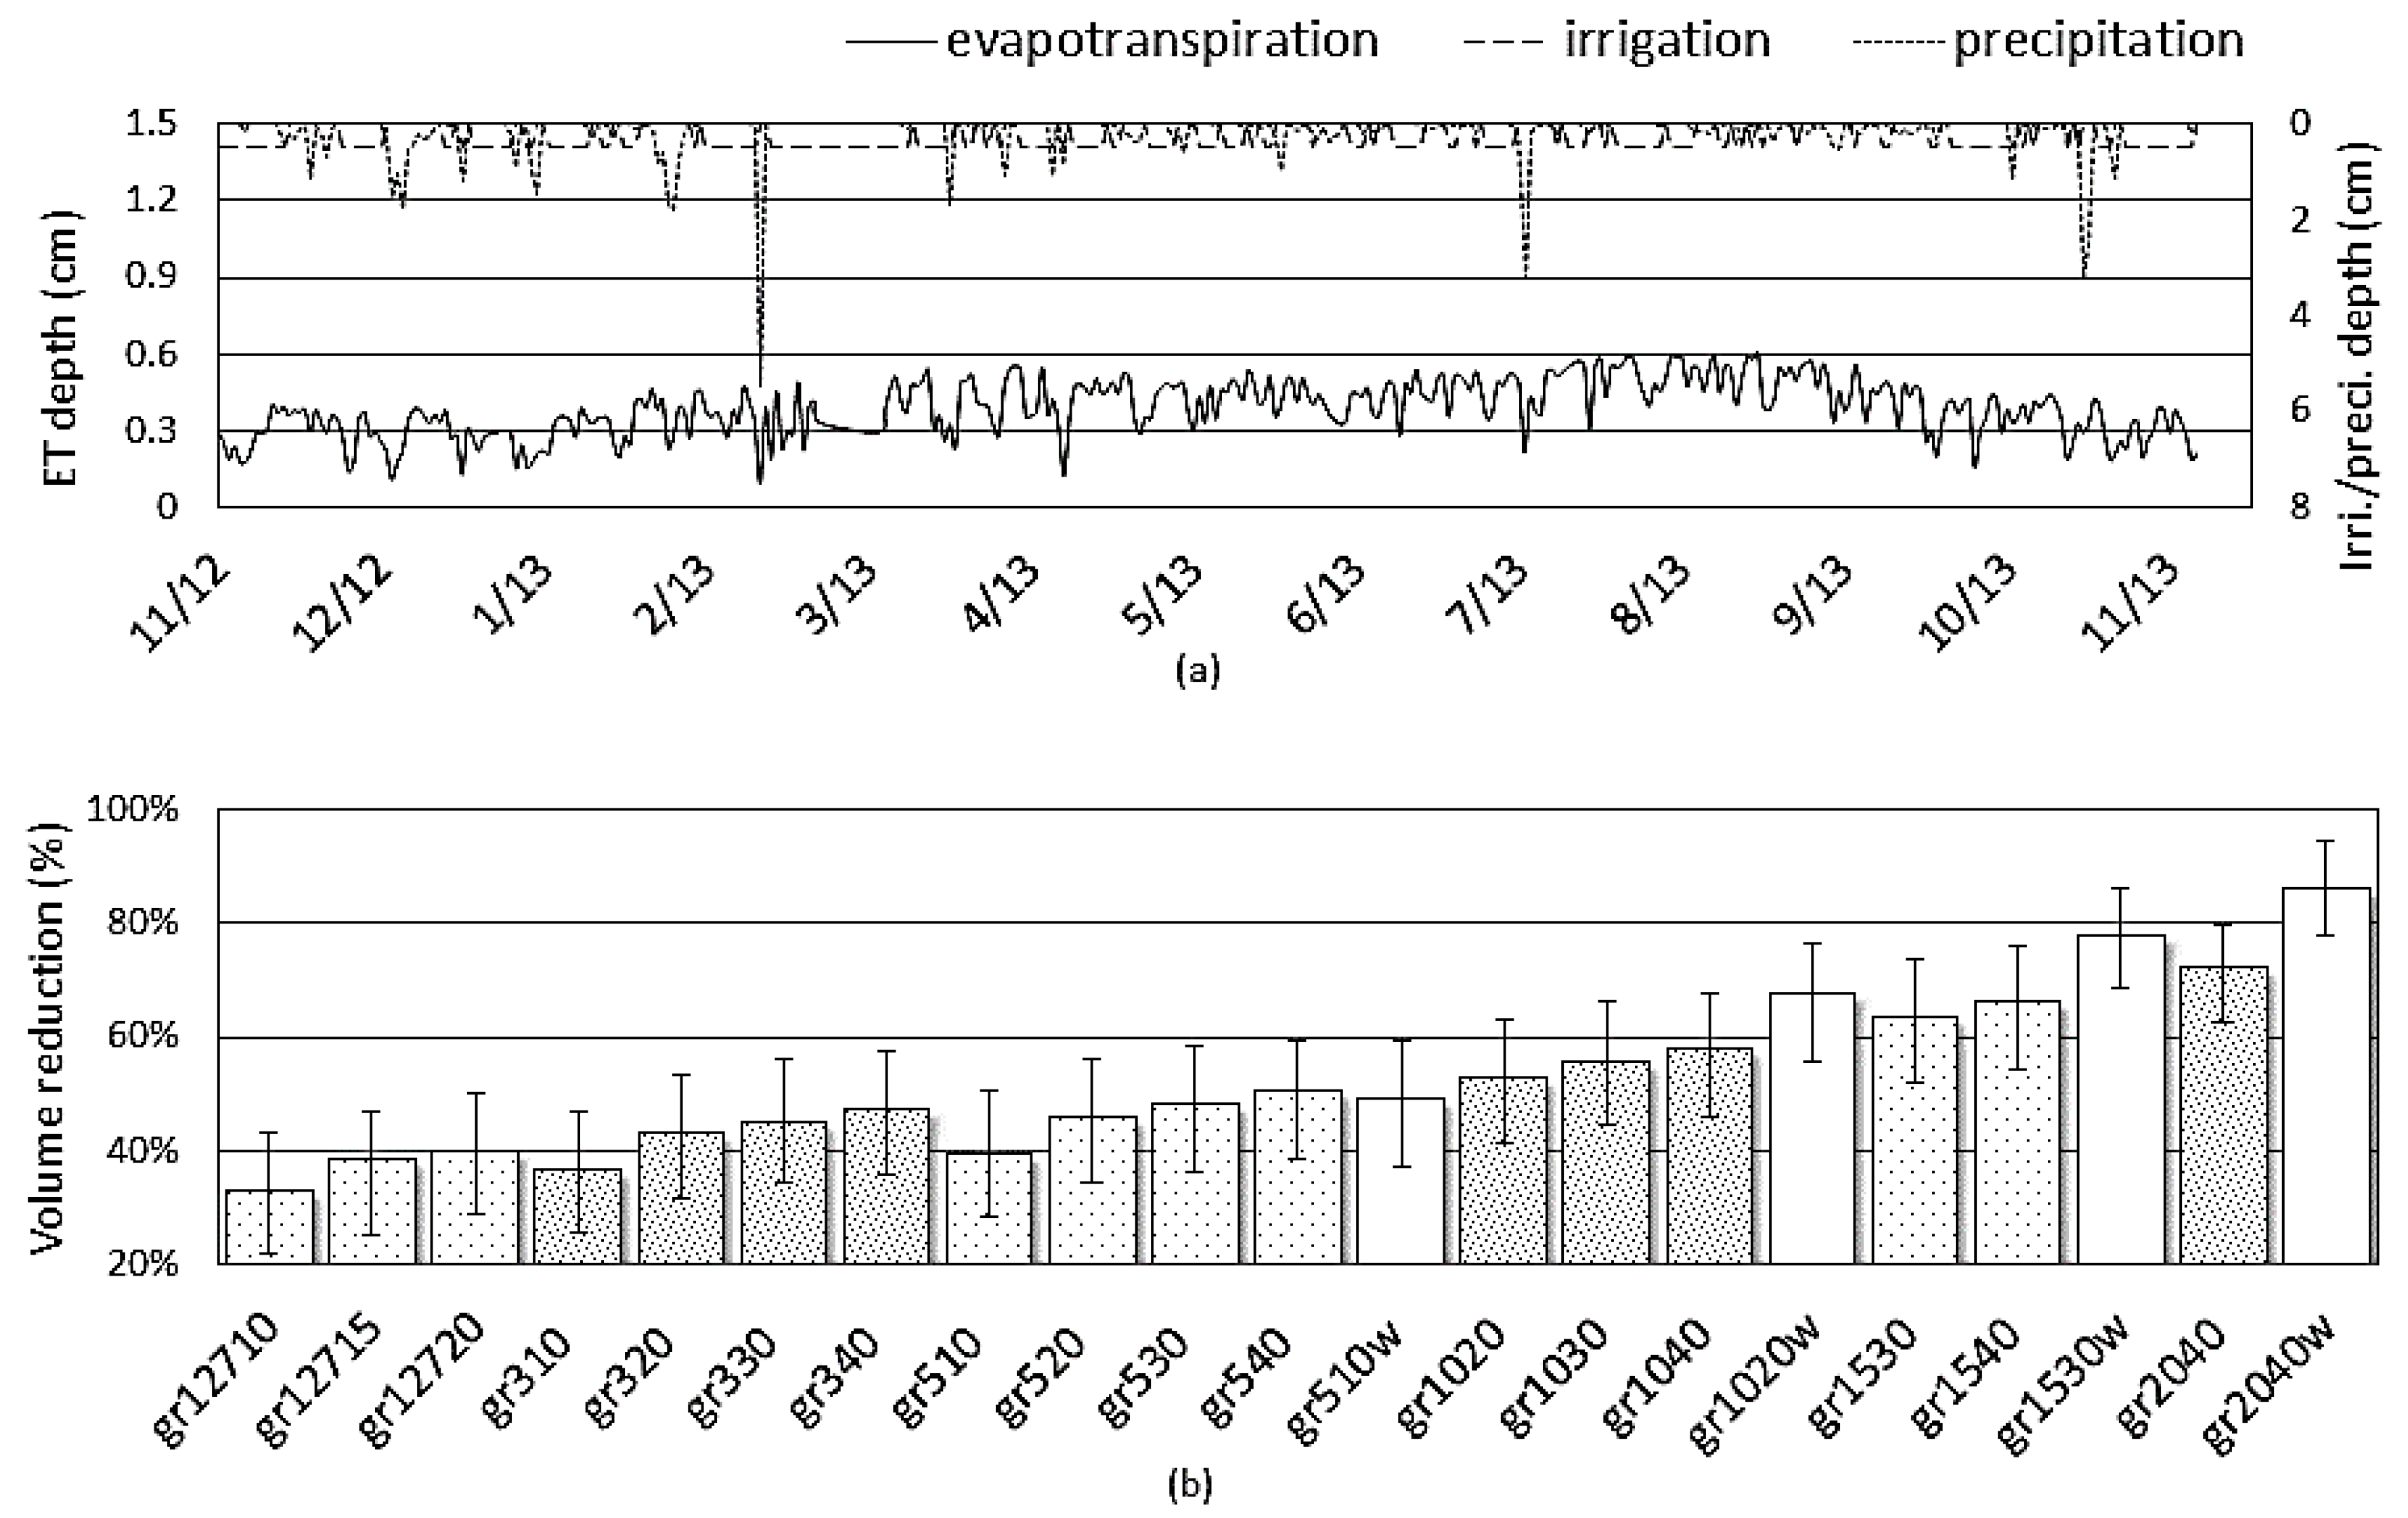
A one-year simulation was performed with this model to compare the long-term cumulative Rv of 21 green roof configurations. Evaluations of Rp and Rt are only relevant for individual events and were irrelevant to this analysis. The simulation used a one-year historical precipitation record during the green roof pilot test period at the University of Hawaii [16]. Reference evapotranspiration (ET0) was calculated by the Penman-Monteith method [23] and ET was 0.65ET0. The use of a crop coefficient of 0.65 to estimate ET was based on our pilot green roof operations [16]; however, in general, the value can be adjusted for any type of green roof vegetation employed. Irrigation was operated as needed at a rate of 0.5 cm/day when the water content was below 10% and when there was no precipitation. Precipitation data were acquired from a rooftop weather station. See Figure 5a.
Comparing the simulation results for various green roof designs (Figure 5b), it shows that Rv increased with increases in the growth media depth and the drainage opening height, and with the addition of water storage. For example, gr520 reduced 7% more annual precipitation volume than gr510, and gr1020 reduced 10% more volume than gr320. Rv increased dramatically for modules with water storage. Module gr510w was better than all the modules to the left of gr540 in the chart; the 20-cm module gr1020w (67.8%) was slightly better than the 40-cm module gr1540, and was 27.6% better than the same thickness module gr12720. To summarize: raising the drainage opening increased Rv by an average of 4.6%; increasing the total media depth increased Rv by an average of 5.3%; and installing water storage increased Rv by an average of 23.5% for the configurations simulated in this study. Rv varied with evapotranspiration which was the source of water consumption. The error bars denote the reduction efficiency for variations of ±10% for the ET estimate. In summary, the most effective method to increase the cumulative Rv efficiency is to install water storage to increase Ce.
5. Conclusions
This study is a continuation of our prior work [16], which used HYDRUS 2-D in the hydrologic performance analyses for green roofs. This study developed a physical-based model to simulate the modular green roof hydrologic responses for various modular green roof configurations. This model was calibrated with the field measured water content from three pilot modular green roofs (10 cm, 15 cm, and 20 cm) under available precipitation and irrigation events. Further, as a normal and necessary practice in modelling exercises [19], this model was used for extrapolation to a total of 21 hypothetical green roofs of similar or greater depth and to a total of 567 synthetic precipitation events of different durations and magnitudes. The assumption for this approach is that the similarity of physical mechanisms in water mass conservation and water distribution remains between varied designed green roof configurations (growth media depth 10 to 40 cm) and under varied design precipitation conditions (precipitation depth 0 to 40 cm). This practice facilitated the examination of a wide spectrum of conditions that would require years of observations at enormous cost [19]. The simulation results revealed distinctive features via the green roof hydrologic performance curves, which indicate that during single precipitation events, green roof volume reduction is mainly a function of effective capacity, while peak reduction and peak delay are controlled by effective capacity, transient capacity, infiltration speed, draining speed, and precipitation duration. Adding water storage to increase effective capacity is more effective (both in terms of performance and likely system cost) than increasing media depth to improve runoff reduction. In addition, these hydrologic performance curves, if supplied by the green roof manufacturers, could serve directly as planning and design tools for engineers. However, this model is not an exact replication of the hydrologic processes in an actual green roof system because, in this model, water movement is simplified to mass conservation equations; water content in the system is simplified by precipitation (and/or irrigation) rate (P), surface overflow (S), drainage underflow (U), and evapotranspiration (ET); surface overflow and drainage underflow are controlled by the hydraulic conductivity function [15]; and, the water distribution in the system follows the water content profile described by the water retention function from van Genuchten [14]. In addition, accurately estimating growth media properties and vegetation growth conditions such as ET could present additional challenges to design engineers. For these reasons, further research work on the model is underway and a database for commonly used growth media will be developed.
At the current development stage, general simulation procedures for the application of this model can follow these steps: (1) determine green roof dimensions including growth media depth, drainage opening/layer height and size, and water storage depth and recharge interface size; (2) acquire retention curve parameters of growth media (θr, θs, Ks, α, n, l) from literature or laboratory tests; (3) obtain/prepare precipitation event (NRCS or NOAA Atlas 14) or long term data, and ET0 estimations (Penman-Montieth [24] or from weather station); (4) utilize the simplified model to calculate hydrologic performance; and (5) evaluate the results and iterate the design as needed.
Since this model calculates the green roof runoff hydrograph for given precipitation events, it can be coupled with existing hydrology models, such as SWMM (Storm Water Management Model, USEPA) to estimate runoff response or peak discharge of drainage basins containing green roofs. Common SWMM approaches are: varying the CN, adding a storage node, or using a cascade of reservoirs (surface, substrate, drainage); however all these methods simplify the physical process of water transport in the growth media. By coupling the results of the model presented herein with SWMM, better evaluations will be possible in planning and design projects with BMP applications.
For future stormwater management projects with green roofs, it appears prudent to adopt capacity-based criteria, rather than using the current performance-based prescriptions. For instance, a green roof requirement that describes effective storage and transient storage requirements of 25% of the 2-year, 24-h design storm is much easier to understand and design than a performance-based criterion requiring 25% volume reduction and 25% peak flow reduction. Manufacturers may also be encouraged to supply runoff response curves as part of green roof product specifications.
Acknowledgments
This research was funded by Office of Facilities and Grounds, University of Hawaii at Manoa.
Author Contributions
This paper consists of the major Ph.D. dissertation research work conducted by the first Author Yanling Li. This research work was supervised by Roger W. Babcock from University of Hawaii. The first author wrote the main manuscript text and prepared the figures and tables. The corresponding author revised the manuscript. All authors reviewed the manuscript.
Conflicts of Interest
The authors declare no conflict of interest.
References
- What is Green Infrastructure. Available online: https://www.epa.gov/green-infrastructure/what-green-infrastructure#Greenroofs (accessed on 10 August 2016).
- Li, Y.L.; Babcock, R.W., Jr. Green roof hydrologic performance and modeling: A review. Water Sci. Technol. 2014, 69, 727–738. [Google Scholar] [CrossRef] [PubMed]
- Vesuviano, G.; Stovin, V. A Generic hydrological model for a green roof drainage layer. Water Sci. Technol. 2013, 68, 769–775. [Google Scholar] [CrossRef] [PubMed]
- Zhang, S.H.; Guo, Y.P. Analytical probabilistic model for evaluating the hydrologic performance of green roofs. J. Hydrol. Eng. 2013, 18, 19–28. [Google Scholar] [CrossRef]
- Guo, Y.P.; Liu, S.G.; Baetz, B.W. Probabilistic rainfall-runoff transformation considering both infiltration and saturation excess runoff generation processes. Water Resour. Res. 2012, 48. [Google Scholar] [CrossRef]
- Alfredo, K.; Montalto, F.; Goldstein, A. Observed and modeled performances of prototype green roof test plots subjected to simulated low- and high-intensity precipitations in a laboratory experiment. J. Hydrol. Eng. 2010, 15, 444–457. [Google Scholar] [CrossRef]
- Burszta-Adamiak, E.; Mrowiec, M. Modelling of green roofs’ hydrologic performance using EPA’s SWMM. Water Sci. Technol. 2013, 68, 36–42. [Google Scholar] [CrossRef] [PubMed]
- Carter, T.; Jackson, C.R. Vegetated roofs for stormwater management at multiple spatial scales. Landsc. Urban Plan. 2007, 80, 84–94. [Google Scholar] [CrossRef]
- She, N.A.; Pang, J. Physically based green roof model. J. Hydrol. Eng. 2010, 15, 458–464. [Google Scholar] [CrossRef]
- Versini, P.A.; Ramier, D.; Berthier, E.; de Gouvello, B. Assessment of the hydrological impacts of green roof: From building scale to basin scale. J. Hydrol. 2015, 524, 562–575. [Google Scholar] [CrossRef] [Green Version]
- Locatelli, L.; Mark, O.; Mikkelsen, P.S.; Arnbjerg-Nielsen, K.; Jensen, M.B.; Binning, P.J. Modelling of green roof hydrological performance for urban drainaage applications. J. Hydrol. 2014, 519, 3237–3248. [Google Scholar] [CrossRef]
- Stovin, V.; Poe, S.; Berretta, C. A modelling study of long term green roof retention performance. J. Environ. Manag. 2013, 131, 206–215. [Google Scholar] [CrossRef] [PubMed]
- Vesuviano, G.; Sonnenwald, F.; Stovin, V. A two-stage storage routing model for green roof runoff detention. Water Sci. Technol. 2014, 69, 1191–1197. [Google Scholar] [CrossRef] [PubMed]
- Van Genuchten, M.T. A closed-form equation for predicting the hydraulic conductivity of unsaturated Soils. Soil Sci. Soc. Am. J. 1980, 44, 892–898. [Google Scholar] [CrossRef]
- Mualem, Y. A new model for predicting the hydraulic conductivity of unsaturated porous media. Water Resour. Res. 1976, 12, 513–522. [Google Scholar] [CrossRef]
- Li, Y.L.; Babcock, R.W., Jr. Modeling hydrologic performance of a green roof system with HYDRUS-2D. J. Environ. Eng. 2015. [Google Scholar] [CrossRef]
- Londra, P.A. Simultaneous determination of water retention curve and unsaturated hydraulic conductivity of substrates using a steady-state laboratory method. HortScience 2010, 45, 1106–1112. [Google Scholar]
- Hill, M.C. Methods and Guidelines for Effective Model Calibration; Water Resources Investigation Report 98-4005; U.S. Geological Survey: Denver, CO, USA, 1998.
- Walesh, S.G. Urban Surface Water Management; John Wiley & Sons, Inc.: Valparaiso, IN, USA, 1989. [Google Scholar]
- Kasmin, H.; Stovin, V.R.; Hathway, E.A. Towards a generic rainfall-runoff model for green roofs. Water Sci. Technol. 2010, 62, 898–905. [Google Scholar] [CrossRef] [PubMed]
- Carson, T.B.; Marasco, D.E.; Culligan, P.J.; McGillis, W.R. Hydrological performance of extensive green roofs in New York City: Observations and multi-year modeling of three full-scale systems. Environ. Res. Lett. 2013, 8. [Google Scholar] [CrossRef]
- Fassman-Beck, E.; Voyde, E.; Simcock, R.; Hong, Y.S. 4 Living roofs in 3 locations: Does configuration affect runoff mitigation? J. Hydrol. 2013, 490, 11–20. [Google Scholar] [CrossRef]
- Leadership in Energy and Environmental Design (LEED). LEED® for New Construction & Major Renovations. Available online: http://www.usgbc.org/Docs/Archive/General/Docs1095.pdf (accessed on 10 August 2016).
- Allen, R.G.; Pereira, L.S.; Raes, D.; Smith, M. Crop evapotranspiration—Guidelines for Computing Crop Water Requirements. FAO Irrigation and Drainage Paper 56. Available online: http://www.fao.org/docrep/x0490e/x0490e00.htm (accessed on 10 August 2016).
Figure 1.
Schematic layout of a green roof system and its hydrologic mechanisms. h1 and h2 (cm) are the thickness of lower and upper growth media; k1, k2, and ks (cm/min) are hydraulic conductivities at the drainage, at the surface and at saturation; θ, θr, and θs (cm3/cm3) are the media water content, residual water content, and saturated water content; and fa, fb, and fw are sizing ratios, fa = 1 and fb + fw = 1.
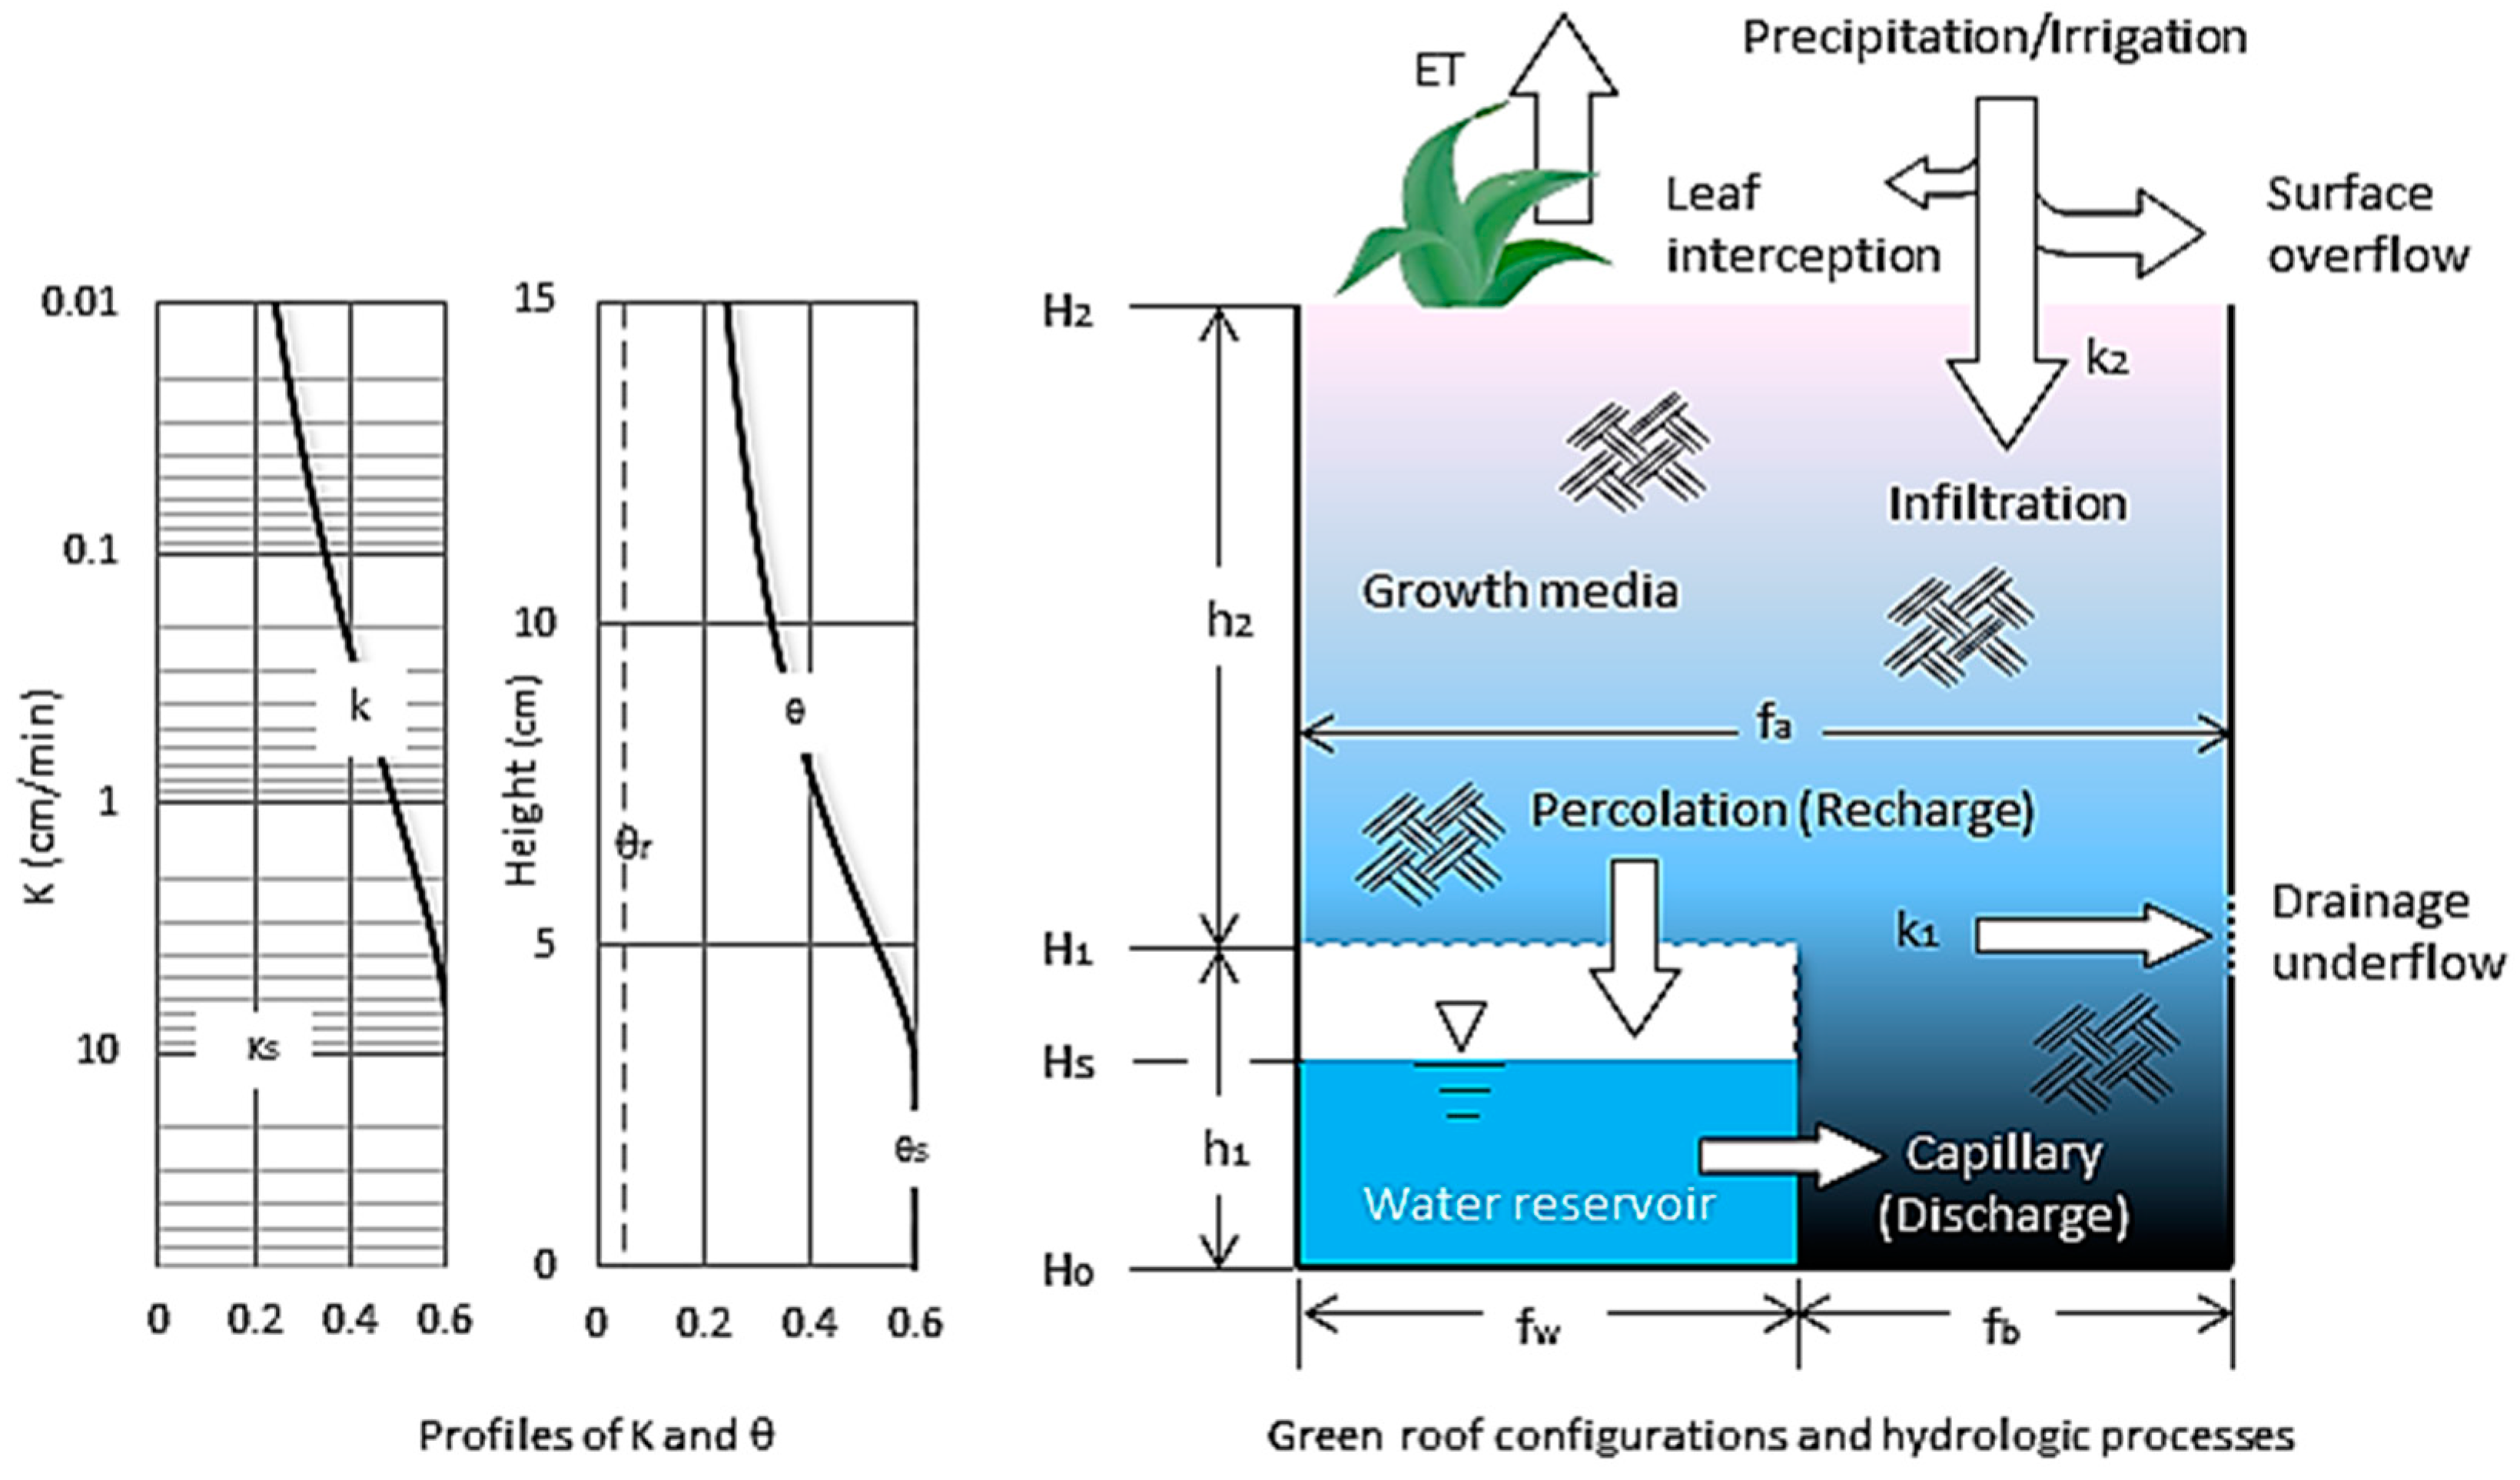
Figure 2.
Water content simulation results of simplified model (lines) vs. observations (markers).
Figure 3.
Normalized composite-scaled sensitivities of the model parameters for the water balance.
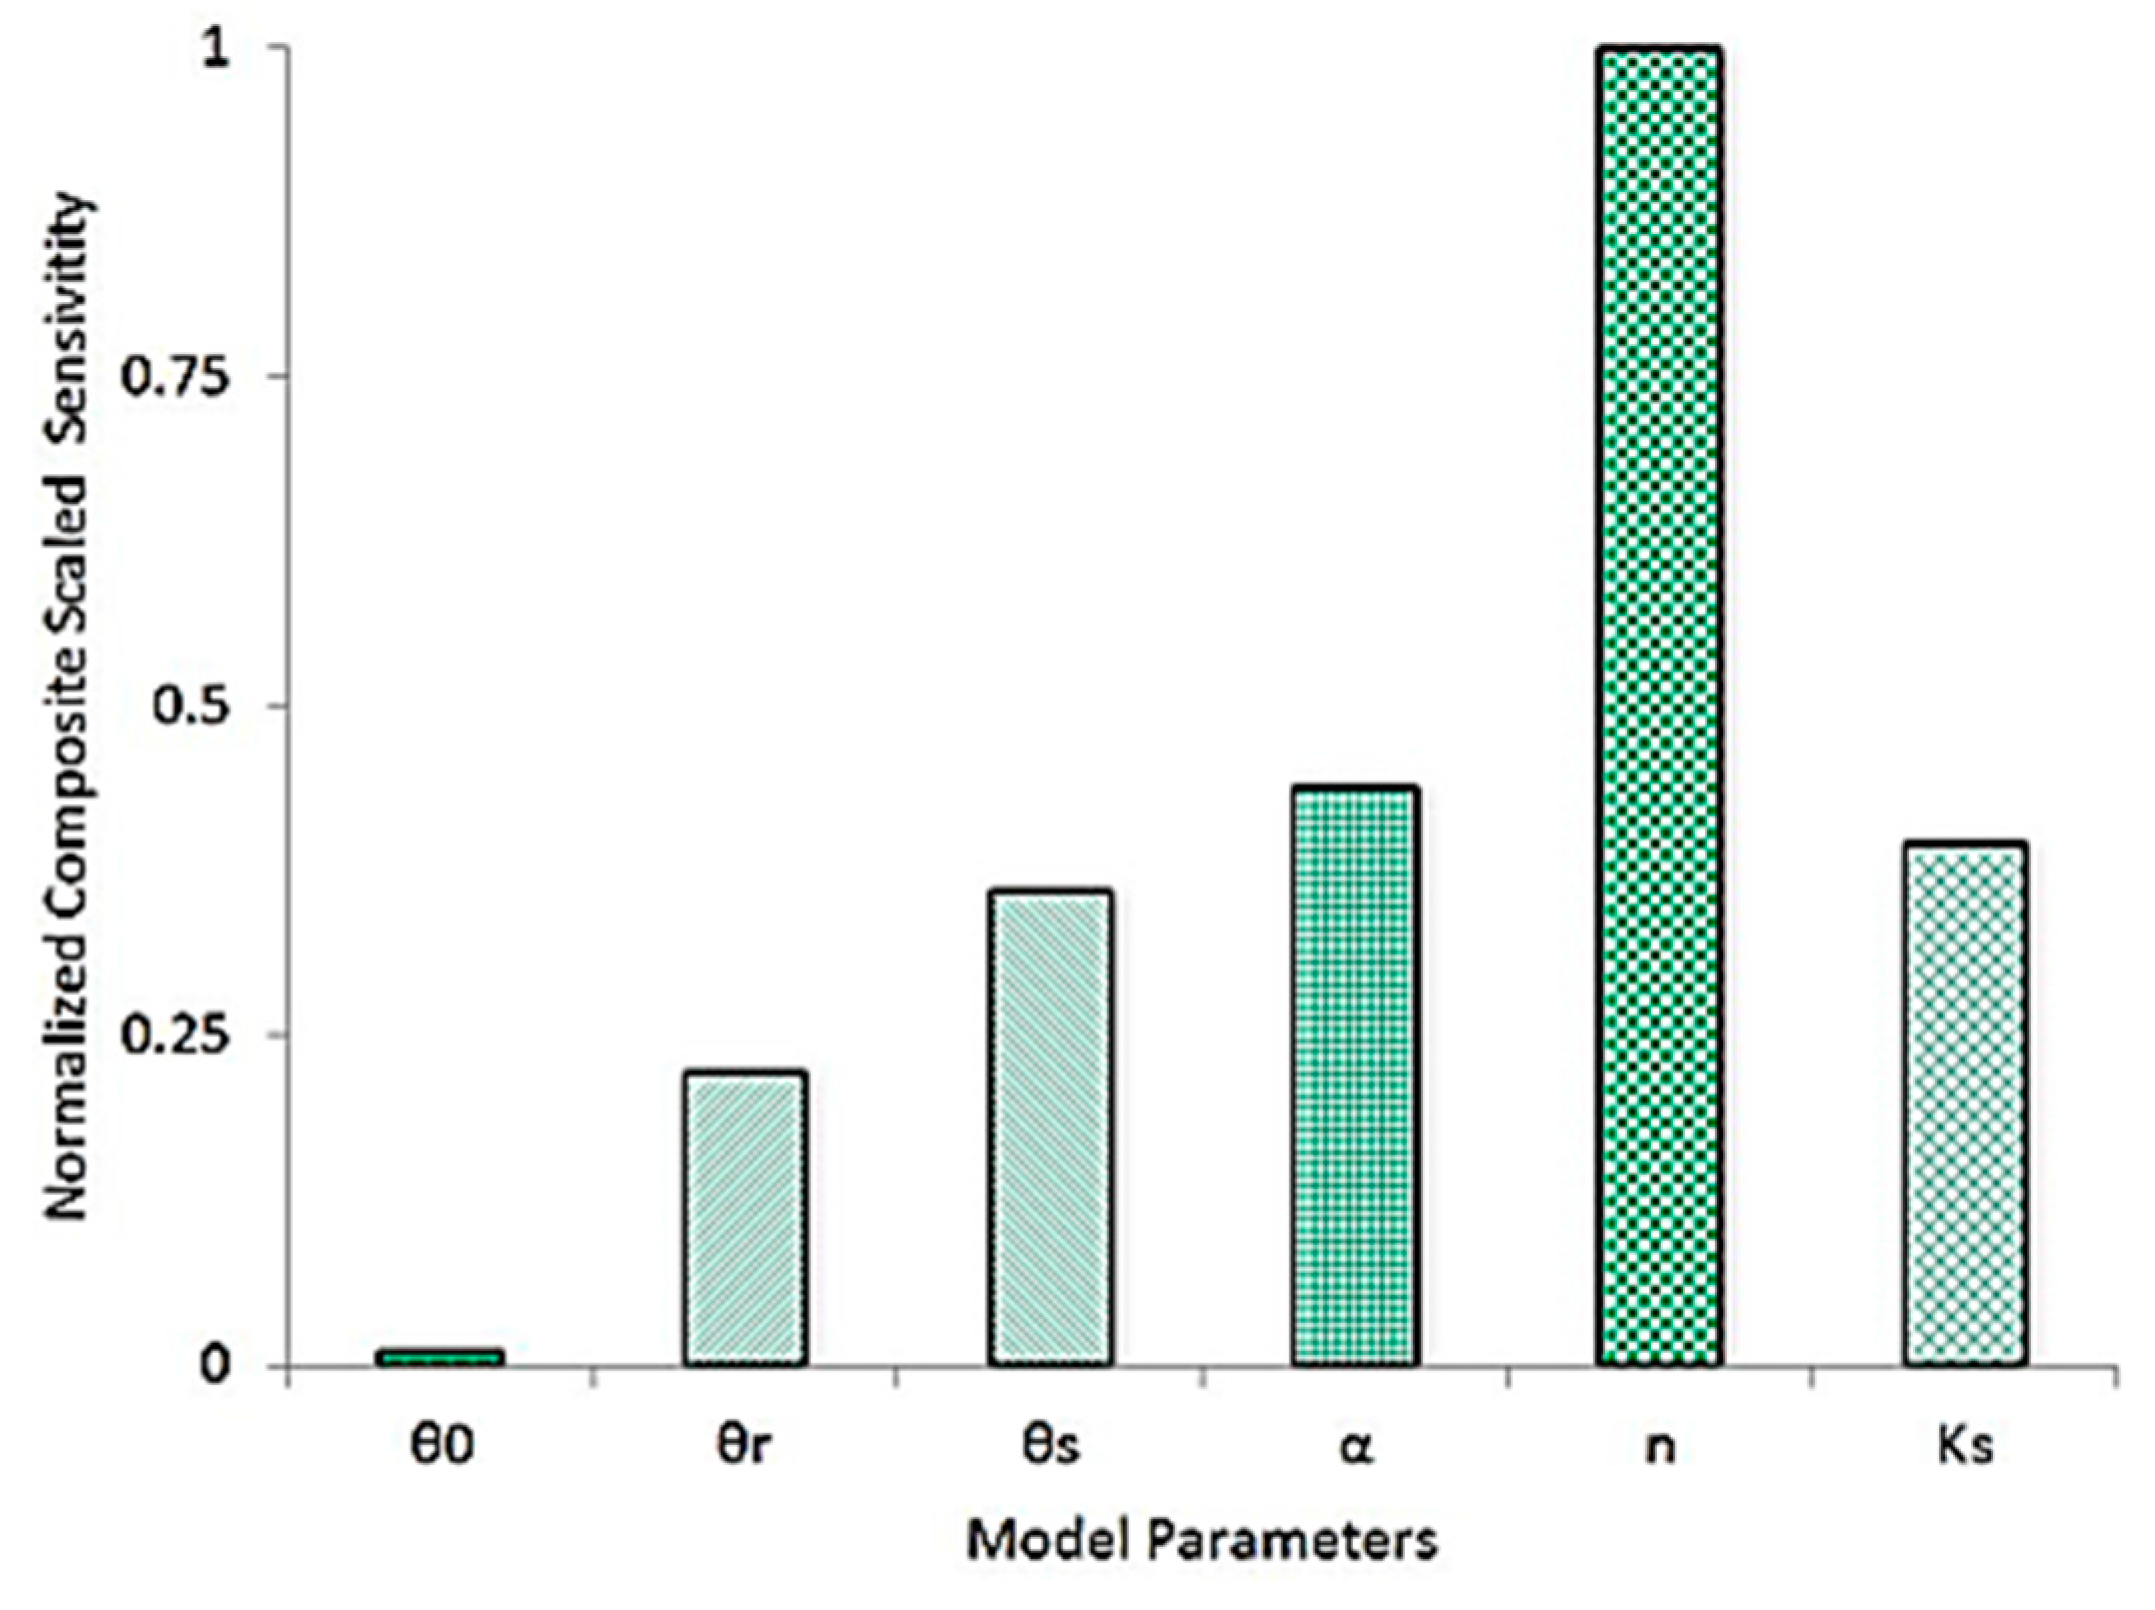
Figure 4.
Volume reduction (Rv) (a); peak reduction (Rp) (b); and peak delay (Rt) (c) vs. precipitation depth.
Figure 4.
Volume reduction (Rv) (a); peak reduction (Rp) (b); and peak delay (Rt) (c) vs. precipitation depth.
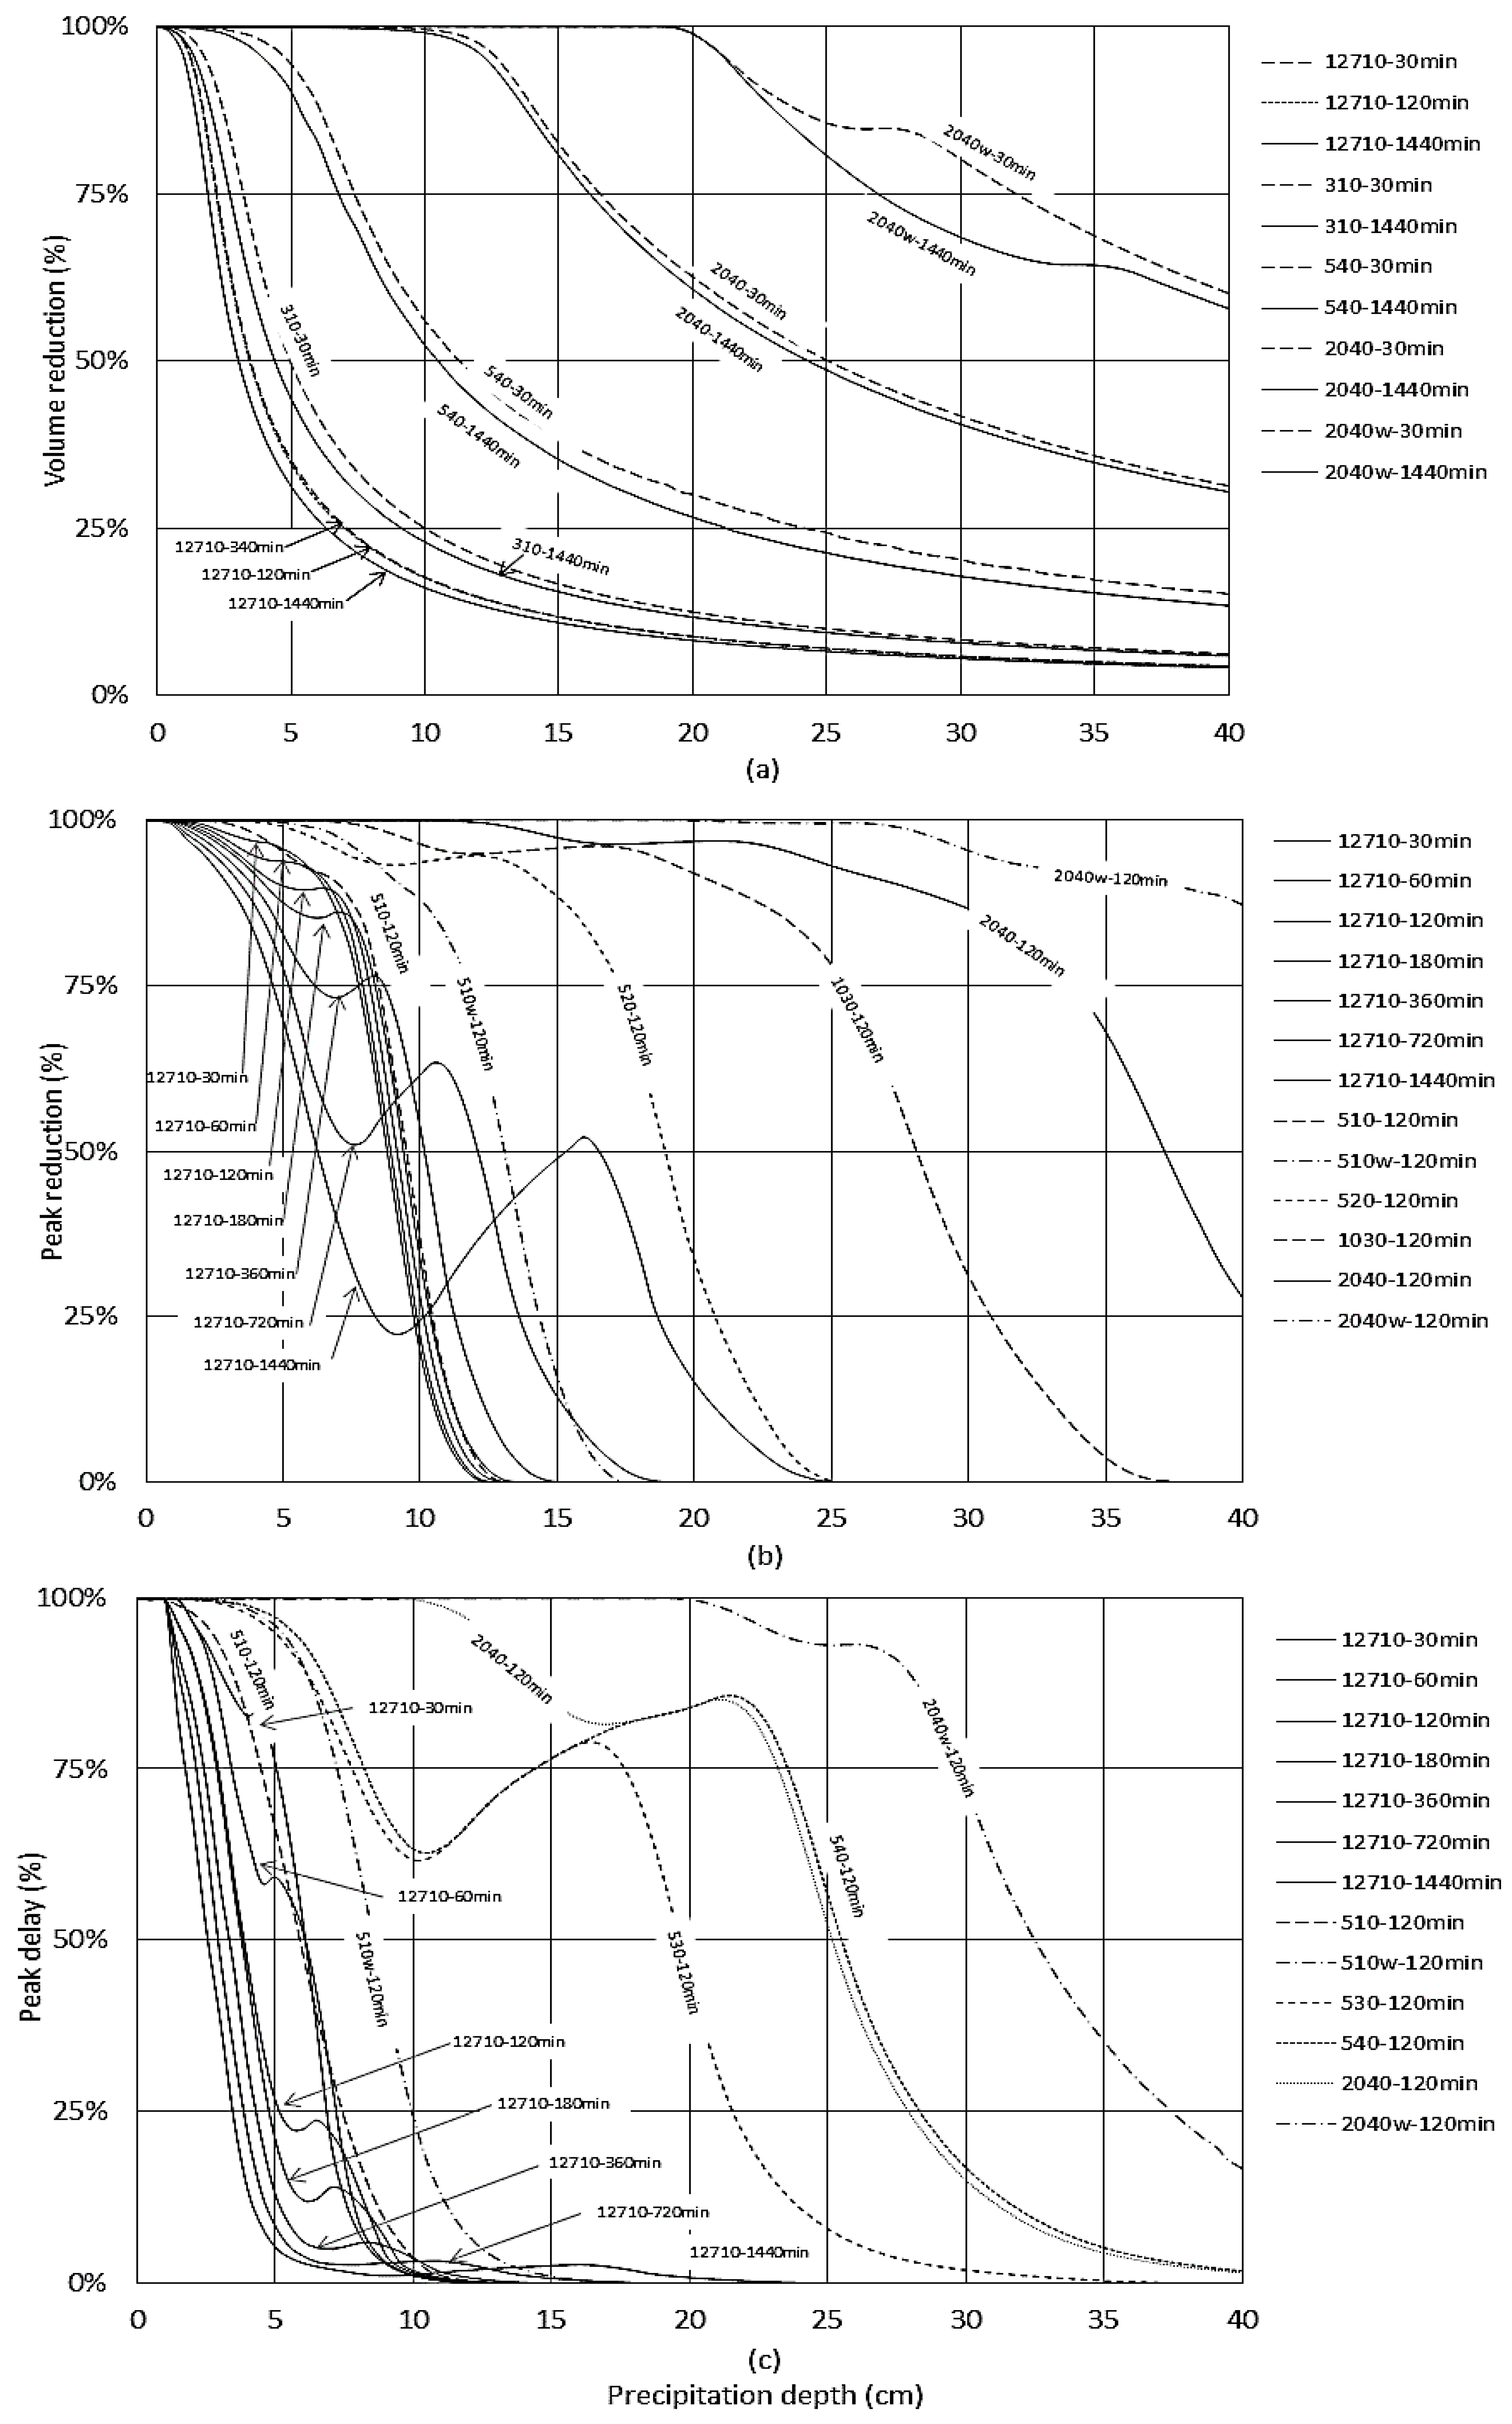
Figure 5.
Irrigation, precipitation, and evapotranspiration from November 2012 to November 2013 (a) and cumulative runoff reductions of various green roof designs; error bars denote reduction efficiency of ±10% reference evapotranspiration values (b).
Figure 5.
Irrigation, precipitation, and evapotranspiration from November 2012 to November 2013 (a) and cumulative runoff reductions of various green roof designs; error bars denote reduction efficiency of ±10% reference evapotranspiration values (b).

| Variable | θr | θs | α | n | Ks | l |
|---|---|---|---|---|---|---|
| Unit | cm3/cm3 | cm3/cm3 | cm−1 | - | cm/min | - |
| Lab Measurement | 0.05–0.16 | 0.55–0.82 | 0.19–0.37 | 1.71–2.17 | 8.00–10.00 | 0.50 |
| Calibration Simplified Model | 0.05 | 0.60 | 0.29 | 1.80 | 10.00 | 0.50 |
Table 2.
Simulated green roof configurations with resulting water content capacities and hydrologic performance results assuming dry antecedent conditions.
| Design | H1 | H2 | fa | fb | fw | Ce | Ct | Cm | Rv * | Rp * | Rt * |
|---|---|---|---|---|---|---|---|---|---|---|---|
| cm | cm | - | - | - | cm | cm | cm | % | % | % | |
| gr12710 | 1.27 | 10 | 1 | 0.6 | 0 | 2.12 | 3.4 | 5.52 | 12.77 | 33.52 | 1.01 |
| gr12715 | 1.27 | 15 | 1 | 0.6 | 0 | 2.83 | 5.43 | 8.26 | 17.05 | 36.60 | 1.55 |
| gr12720 | 1.27 | 20 | 1 | 0.6 | 0 | 3.43 | 7.58 | 11.01 | 20.08 | 40.59 | 1.97 |
| gr310 | 3 | 10 | 1 | 1 | 0 | 2.61 | 2.88 | 5.49 | 18.20 | 36.12 | 2.07 |
| gr320 | 3 | 20 | 1 | 1 | 0 | 4.03 | 6.95 | 10.98 | 26.76 | 40.85 | 2.13 |
| gr330 | 3 | 30 | 1 | 1 | 0 | 5.03 | 11.44 | 16.47 | 31.33 | 53.24 | 2.71 |
| gr340 | 3 | 40 | 1 | 1 | 0 | 5.82 | 16.14 | 21.96 | 34.18 | 65.05 | 3.54 |
| gr510 | 5 | 10 | 1 | 1 | 0 | 3.14 | 2.35 | 5.49 | 23.14 | 28.19 | 1.49 |
| gr510w | 5 | 10 | 1 | 0.2 | 0.8 | 5.59 | 1.70 | 7.29 | 41.46 | 65.50 | 5.96 |
| gr520 | 5 | 20 | 1 | 1 | 0 | 4.69 | 6.29 | 10.98 | 33.14 | 52.38 | 2.74 |
| gr530 | 5 | 30 | 1 | 1 | 0 | 5.76 | 10.71 | 16.47 | 38.41 | 70.40 | 4.56 |
| gr540 | 5 | 40 | 1 | 1 | 0 | 6.58 | 15.38 | 21.96 | 41.41 | 79.13 | 6.69 |
| gr1020 | 10 | 20 | 1 | 1 | 0 | 6.72 | 4.26 | 10.98 | 48.76 | 83.48 | 10.74 |
| gr1020w | 10 | 20 | 1 | 0.2 | 0.8 | 11.00 | 3.59 | 14.59 | 81.93 | 94.95 | 71.12 |
| gr1030 | 10 | 30 | 1 | 1 | 0 | 7.98 | 8.49 | 16.47 | 55.77 | 89.55 | 22.37 |
| gr1040 | 10 | 40 | 1 | 1 | 0 | 8.90 | 13.06 | 21.96 | 59.82 | 91.88 | 30.99 |
| gr1530 | 15 | 30 | 1 | 1 | 0 | 10.15 | 6.32 | 16.47 | 72.48 | 93.78 | 56.49 |
| gr1530w | 15 | 30 | 1 | 0.2 | 0.8 | 16.23 | 5.65 | 21.88 | 100.00 | 100.00 | 99.98 |
| gr1540 | 15 | 40 | 1 | 1 | 0 | 11.21 | 10.75 | 21.96 | 77.72 | 94.84 | 68.07 |
| gr2040 | 20 | 40 | 1 | 1 | 0 | 13.47 | 8.49 | 21.96 | 93.24 | 98.27 | 89.10 |
| gr2040w | 20 | 40 | 1 | 0.2 | 0.8 | 21.36 | 7.82 | 29.18 | 100.00 | 100.00 | 99.98 |
Note: * Rv, Rp, and Rt are simulation results of volume reduction, peak reduction, and peak delay, respectively, for a 2-year, 24-h storm (12.7-cm depth).
© 2016 by the authors; licensee MDPI, Basel, Switzerland. This article is an open access article distributed under the terms and conditions of the Creative Commons Attribution (CC-BY) license (http://creativecommons.org/licenses/by/4.0/).
Share and Cite
MDPI and ACS Style
Li, Y.; Babcock, R.W. A Simplified Model for Modular Green Roof Hydrologic Analyses and Design. Water 2016, 8, 343. https://doi.org/10.3390/w8080343
AMA Style
Li Y, Babcock RW. A Simplified Model for Modular Green Roof Hydrologic Analyses and Design. Water. 2016; 8(8):343. https://doi.org/10.3390/w8080343
Chicago/Turabian StyleLi, Yanling, and Roger W. Babcock. 2016. "A Simplified Model for Modular Green Roof Hydrologic Analyses and Design" Water 8, no. 8: 343. https://doi.org/10.3390/w8080343
Note that from the first issue of 2016, this journal uses article numbers instead of page numbers. See further details here.