Article

Is Recovery of Large-Bodied Zooplankton after Nutrient Loading Reduction Hampered by Climate Warming? A Long-Term Study of Shallow Hypertrophic Lake Søbygaard, Denmark

by
María Florencia Gutierrez
1,2,*,
Melina Devercelli
1,
Sandra Brucet
3,4,5,
Torben L. Lauridsen
5,6,
Martin Søndergaard
5,6 and
Erik Jeppesen
5,6
1
Instituto Nacional de Limnología (CONICET-UNL), 3000 Santa Fe, Argentina
2
Faculty of Biochemistry and Biological Sciences (UNL), 3000 Santa Fe, Argentina
3
Department of Bioscience, Aarhus University, DK-8600 Aarhus, Denmark
4
Aquatic Ecology Group, BETA Research Centre, University of Vic—Central University of Catalonia, 08500 Vic, Spain
5
Catalan Institution for Research and Advanced Studies, ICREA, 08010 Barcelona, Spain
6
Sino-Danish Centre for Education and Research, 100190 Beijing, China
*
Author to whom correspondence should be addressed.
Water 2016, 8(8), 341; https://doi.org/10.3390/w8080341
Submission received: 16 June 2016 / Revised: 26 July 2016 / Accepted: 28 July 2016 / Published: 10 August 2016
(This article belongs to the Special Issue Lake Restoration and Management in a Climate Change Perspective)

Abstract

:
Nutrient fluctuations and climate warming can synergistically affect trophic dynamics in lakes, resulting in enhanced symptoms of eutrophication, thereby potentially counteracting restoration measures. We performed a long-term study (23 years) of zooplankton in Danish Lake Søbygaard, which is in recovery after nutrient loading reduction, but now faces the effects of climate warming. We hypothesized that the recovery of large-bodied zooplankton after nutrient loading reduction would be hampered by climate warming through indirect effects on fish size structure. We found a shift in macrozooplankton from initial dominance of Daphnia spp. towards Bosmina spp. as well as a decline in the body size of copepods and an increase in the abundance of nauplii. These changes coincided with the increase in small sized fish as a result of rising water temperature. Despite a reduction in body size, the total biomass of cladocerans increased coinciding with a diminished fish catch per unit effort (CPUE), and likely then an overall reduction in the predation on zooplankton. A cascading effect to phytoplankton was evidenced by enhanced zooplankton:phytoplankton and cladoceran:phytoplankton ratios and a decrease in Chl-a:TP and Chl-a:TN ratios. Our results indicate that climate warming, through changes in the size structure of fish community, has major effects on zooplankton size structure. In Lake Søbygaard, the decline in zooplankton size did not prevent, but modulated, the positive cascading effect on phytoplankton through an expected diminished fish CPUE related to nutrient loading reduction.

1. Introduction

Eutrophication is a key threat to lake ecosystems, causing phytoplankton blooms, loss of macrophytes, changes in richness and composition of biological assemblages, higher turbidity and deterioration of the whole ecosystem [1]. In order to mitigate and reverse eutrophication, various restoration measures have been applied, including chemical (e.g., nutrient input reduction) [2,3] and biological interventions (i.e., biomanipulation) [4,5,6]. However, recovery is often complex and sometimes strongly delayed [2,7,8].
Besides the internal feedback mechanisms that stabilise the eutrophic state of lakes and hamper their recovery [9], climate warming constitutes an additional external problem due to its direct and indirect effects on biological and physicochemical processes, further exacerbating the eutrophication and potentially preventing recovery [10,11]. Moreover, the symptoms of warming and eutrophication are similar in many aspects, making it difficult to differentiate their individual effects [10,12,13].
Among the direct effects, warming may increase the frequency of cyanobacterial blooms [14,15,16], alter bacterioplankton and protist communities [17,18] and affect lake productivity [19]. For aquatic animals, the respiration rates [13], size structure and life cycles [20,21,22] may be profoundly altered as well, causing serious ecological changes through trophic cascades [23,24].
Warming may also have indirect effects on the trophic webs through shifts in fish community composition and size structure [25]. Warming increases the dominance of zooplanktivorous and omnivorous fish [26,27], change the size structure towards a higher proportion of small individuals [10,13,28] and may lead to higher winter survival due to reduced duration of ice cover [29]. A subsequent increase in fish predation pressure on zooplankton can promote species turnover, diminish the abundance of large-bodied cladocerans, decrease the average size of both cladocerans and copepods [12,30] and reduce grazing on phytoplankton (i.e., weak top-down control). These factors lead to higher algal biomass (and chlorophyll a levels), including, in some cases, potential dominance of harmful filamentous cyanobacteria [24].
Despite the focus on individual and combined effects of global warming and eutrophication have been in focus in several empirical and theoretical analyses [11,16,31,32], little attention has been paid to the potential (negative) effects of warming on the recovery of lake communities after a nutrient loading reduction [33,34]. One way to shed more light on this issue is to analyse long-term survey data [10,35,36] on lakes where restoration measures have been implemented.
Lake Søbygaard is a shallow eutrophic lake located in Central Jutland, Denmark, which has been in recovery from nutrient loading for more than 35 years. Since 1989, fish biomass has shown a declining trend, coinciding, as expected, with a decrease in nutrient concentrations [37]. Moreover, a major change has occurred from roach dominance to a mixed assemblage dominated by roach and perch as seen in other North European lakes that have recovered from eutrophication [33,37,38]. However, despite that such changes in theory should also lead to an increase in the body size of cyprinids and perch [37], a declining trend in fish body size has been observed. This decline has been attributed to climate warming as the size change is related to increased air temperatures in April and in the average summer air temperature (April–September) of 1.2 and 0.5 °C per decade, respectively [25].
Here, we explored the long-term changes in zooplankton composition, abundance and body size in Lake Søbygaard in relation to fish, phytoplankton biomass and nutrients during 23 years (from 1990 to 2012) after recovery from eutrophication and in a climate warming scenario. We hypothesized that climate warming hampered the recovery of large-bodied zooplankton after nutrient loading reduction through indirect effects on fish size structure. We expected that decreased fish size would modify the zooplankton assemblage by favouring the dominance of smaller organism within this community. Such changes will counteract the effects of the nutrient loading reduction that supposedly should lead to: (i) larger-sized cladocerans and copepods; (ii) a higher zooplankton:phytoplankton ratio; and (iii) lower Chl-a:TP and Chl-a:TN ratios via cascading effects [33].

2. Methods

2.1. Study Area

Lake Søbygaard is located in Central Jutland, Denmark (56°15′20′′ N, 9°48′35′′ E). It covers 0.38 km2 and is surrounded by coniferous forest, except the wind-exposed western shore. Submerged vegetation is sparse or absent, and emergent and floating plants are also sparsely developed. The water column is well mixed in summer with no thermal stratification. The lake’s hydraulic retention time varies from 15 to 20 days and the mean depth is 1.0 m, with a maximum of 1.9 m.

2.2. Sampling

Samplings for analyses of chemical parameters, chlorophyll-a (Chl-a) and zooplankton were carried out monthly following the same standardised methods from 1990 to 2012. Water samples for chemical analysis were collected with a type “Patalas” sampler at a mid-lake station at 0.5 and 1.5 m depth. Environmental parameters (dissolved oxygen: DO, conductivity, pH) were measured in the field using portable sensors. Air temperatures were used in this work since they are a strong predictor of water temperatures, particularly in shllow lakes [39,40]. The monitoring of this parameter is part of the National Monitoring and Assessment Programme for the Aquatic and Terrestrial Environments (NOVANA).
Zooplankton samples were collected at 1.5 m below the water surface with a type “Patalas” sampler at three sampling stations (mid-lake, east and west). This sampler was built for quantitative sampling of zooplankton forming a tube with a bottom lid which opens when lowered down the water column. After a desired depth is reached, the bottom lid closes and traps the zooplankton animals in the sampler. The tubular form allows sampling of the integrated water column. A 20 L water sample (mixed from the three stations) was filtered through a 20-µm mesh net. The animals retained on the mesh were pooled and fixed with 2 mL Lugol’s solution in 100 mL tap water.
For fish samples, annual gill net surveys were conducted between August and September every year. The lake was divided into six sections and in each section three multi-mesh size gill nets (14 different mesh sizes ranging from 6.25 to 75 mm) were set overnight. One gill net was set perpendicular to the shoreline, another parallel to and about 25 m from the shoreline and the third about half the distance from the centre of the lake, for more details, see [41]. The most frequent species collected were bream (Abramis brama), crucian carp (Carassius carassius), pike (Esox lucius), perch (Perca fluviatilis), roach (Rutilus rutilus), trout (Salmo trutta), rudd (Scardinius erythropthalmus) and zander (Stizostedion lucioperca). For the analysis, the fish were classified into three size ranges: small (<10 cm), medium (10–25 cm) and large (>25 cm), considering that their feeding habits usually change during their development and that small-sized fish are typically zooplanktivorous. Among the small fish, the most abundant were Perca fluviatilis, Rutilus rutilus, Scardinius erythropthalmus and Stizostedion lucioperca. The first one has been classified as benthi–planktivorous while the other three were classified as exclusively planktivorous. Medium and large sized fish have different feeding habits, including piscivorous, omnivore–benthi–piscivorous, omnivore–benthi–planktivorous and benthi–planktivorous [26].

2.3. Sample Analysis

Nutrient concentrations were estimated according to standardised methods: Mixed total phosphorus (TP) was determined as molybdate-reactive P [42] after persulphate digestion [43]. Total nitrogen (TN) was determined as nitrites + nitrates after potassium persulphate digestion [44]. Nitrites and nitrates were determined as nitrite on a Tecator 5012 flow-injection analyser supplied with a copper–cadmium reductor column. For chlorophyll-a analyses (Chl-a), 100 to 1000 mL water samples were filtered through Whatman GF/C filters (47 mm in diameter, UK) and spectrophotometrical determination after ethanol extraction [45].
For zooplankton, identification of organisms was made to species level, when possible, using specific keys [46,47,48,49]. Zooplankton larger than 140 µm were counted at 40× magnification using a stereomicroscope (Leica MZ12, Wetzlar, Germany), while subsamples between 20 and 140 µm were counted under an inverted microscope at 100× magnification (Leitz Labovert). At least 150 individuals of the dominant zooplankton species were counted in each sample. In periods when the suspended particulate content was high, it was necessary to dilute the samples five to tenfold before counting. Daphnia spp., Bosmina spp. and copepod biomasses were determined by using length–weight relationships [50,51,52]. When possible, 20 to 30 individuals of each taxon were measured in each sample.

2.4. Data Analysis

Zooplankton richness, abundance and diversity index [52] were calculated. Repeated measure (RM) ANOVA was used for testing significant differences in each parameter among years. Previous to this analysis, the normal distribution of data (Kolmogorov–Smirnov’s test), homoscedasticity (Levene’s test) and sphericity (Mauchly’s test) were verified. Such statistical tests are needed to ensure the goodness of fit of the selected RM ANOVA and inform whether data have normal distribution and equal variances. A PERMANOVA with 9999 permutations was also performed on the Bray–Curtis triangular matrix to determine taxonomic differences among years and between the first and second decade under study. The analysis between the first and second decade was performed because exploratory analyses suggested differences between the period 1990–2001 and 2002–2012 regarding the cycles of several species.
The Daphnia:Bosmina biomass ratio was calculated to verify species replacement throughout time. For Copepoda, nauplii:(nau+cop+adults), female:male and weight:density ratios were calculated to detect possible changes in the size structure and stage composition. To estimate the potential grazing rate of cladocerans and zooplankton, we used the ratio of cladocerans (Clad) and zooplankton to total abundance of phytoplankton biomass, calculated as follows: Clad:(Chl-a × 66) and Zoo:(Chl-a × 66), where 66 is considered a measure of algal dry mass [8]. To evaluate the relationships between nutrients and phytoplankton biomass, Chl-a:TN and Chl-a:TP ratios were calculated. Fish catch per unit effort (CPUE) was calculated as mean catch in kg/net per sampling.
The temporal trends of different biotic components and abiotic variables were tested. Significant temporal trends in air temperature, fish CPUE, size of planktivorous fish (roach, bream and rudd), Daphnia:Bosmina, nauplii:(nau+cop+adults), copepod female:male and weight:density ratios, grazing rates, Chl-a:TN and Chl-a:TP were tested using the non-parametric Mann–Kendall test (Z) on average values per year. If a significant linear trend emerged in a time series (pZ < 0.05), the Sen’s slope (Q) was estimated (Excel application MAKESENS 1.0, Finnish Meteorological Institute). Positive values of Q indicate increasing trends, while negative values of Q show decreasing trends. All the ratios were calculated using annual or the spring–summer average of each variable.
Temporal trends in the summer densities of small (<10 cm) and large fish (>25 cm) and their relation with temperature were analysed with generalized linear models (GLM) after checking for absence of autocorrelation with the Durbin–Watson test. G statistic was used as a measure of the goodness of fit of the models.
Temporal trends all through the studied period and spring–summer period in Daphnia spp., Bosmina spp., nauplii and Cyclopoidae densities, and in Chl-a and nutrient concentrations, were assessed with generalized linear mixed models (GLMM) based on a Markov chain Monte Carlo (MCMC) algorithm. These models incorporate random effects and are adjusted for temporal autocorrelation structure. Time was considered as the fixed effect and months were included as the random effect to account for the possible effect of autocorrelation due to seasons. The models were run with R package MCMCglmm [53] under a Poisson distribution, the MCMC p-value (pMCMC) was calculated and the deviance information criterion (DIC) was used as the parameter-adjusted likelihood. Daphnia spp. and Bosmina spp. presented more zeros than the expected based on Poisson distribution, due to the absences of such species during some periods of time, hence a zero-inflated Poisson distribution with a log-link function was found to better adjust the GLMMs. The “zeroinfl” command in the R package “pscl” [54] was used, and the p-value (ppscl) was calculated. The log-likelihood was informed as goodness of fit of the model. Sinusoidal fit and GLM regression lines were used in the graphs to show, respectively, seasonal patterns and the general tendency of variables.
Multiple GLMM analyses were performed to find the model that best explained the variations in Daphnia spp., Bosmina spp. and Chl-a using the same distribution and statistical packages mentioned before. Independent variables were all the measured abiotic variables, categories of fish size (for the Daphnia and Bosmina models) and Bosmina, Daphnia and total zooplankton densities (for the Chl-a model). For Daphnia and Bosmina, the pscl models were made with summer data according to the available information on fish density, while for Chl-a the MCMCglmm model was based on data from all the years. All GLMM statistical analyses were performed with r version 3.1.3 (R Development Core Team).
A multivariate ordination method was applied to analyse the relationship between the abundance of zooplankton species and environmental variables (CANOCO 5 software). This method includes a set of techniques and analysis using several variables at once to explain or predict other dependent variables or phenomena that occur in nature. Detrended Correspondence Analysis suggested that a Redundancy Analysis (RDA) was appropriate since the gradient length of species did not exceed three standard deviations [55]. RDA is a linear method to extract and summarise the variation in a set of response variables that can be explained by a set of explanatory variables. Zooplankton species present in more than 10% of the samples were included as response variables. All the abiotic variables and the density of fish were used as explanatory variables. Response and explanatory variables (except pH) were Hellinger-transformed and standardised by norm. A subset of the more significant variables was selected using the forward selection option, and the significance of the first and of all axes was analysed using unrestricted global Monte Carlo permutation tests (999 permutations).

3. Results

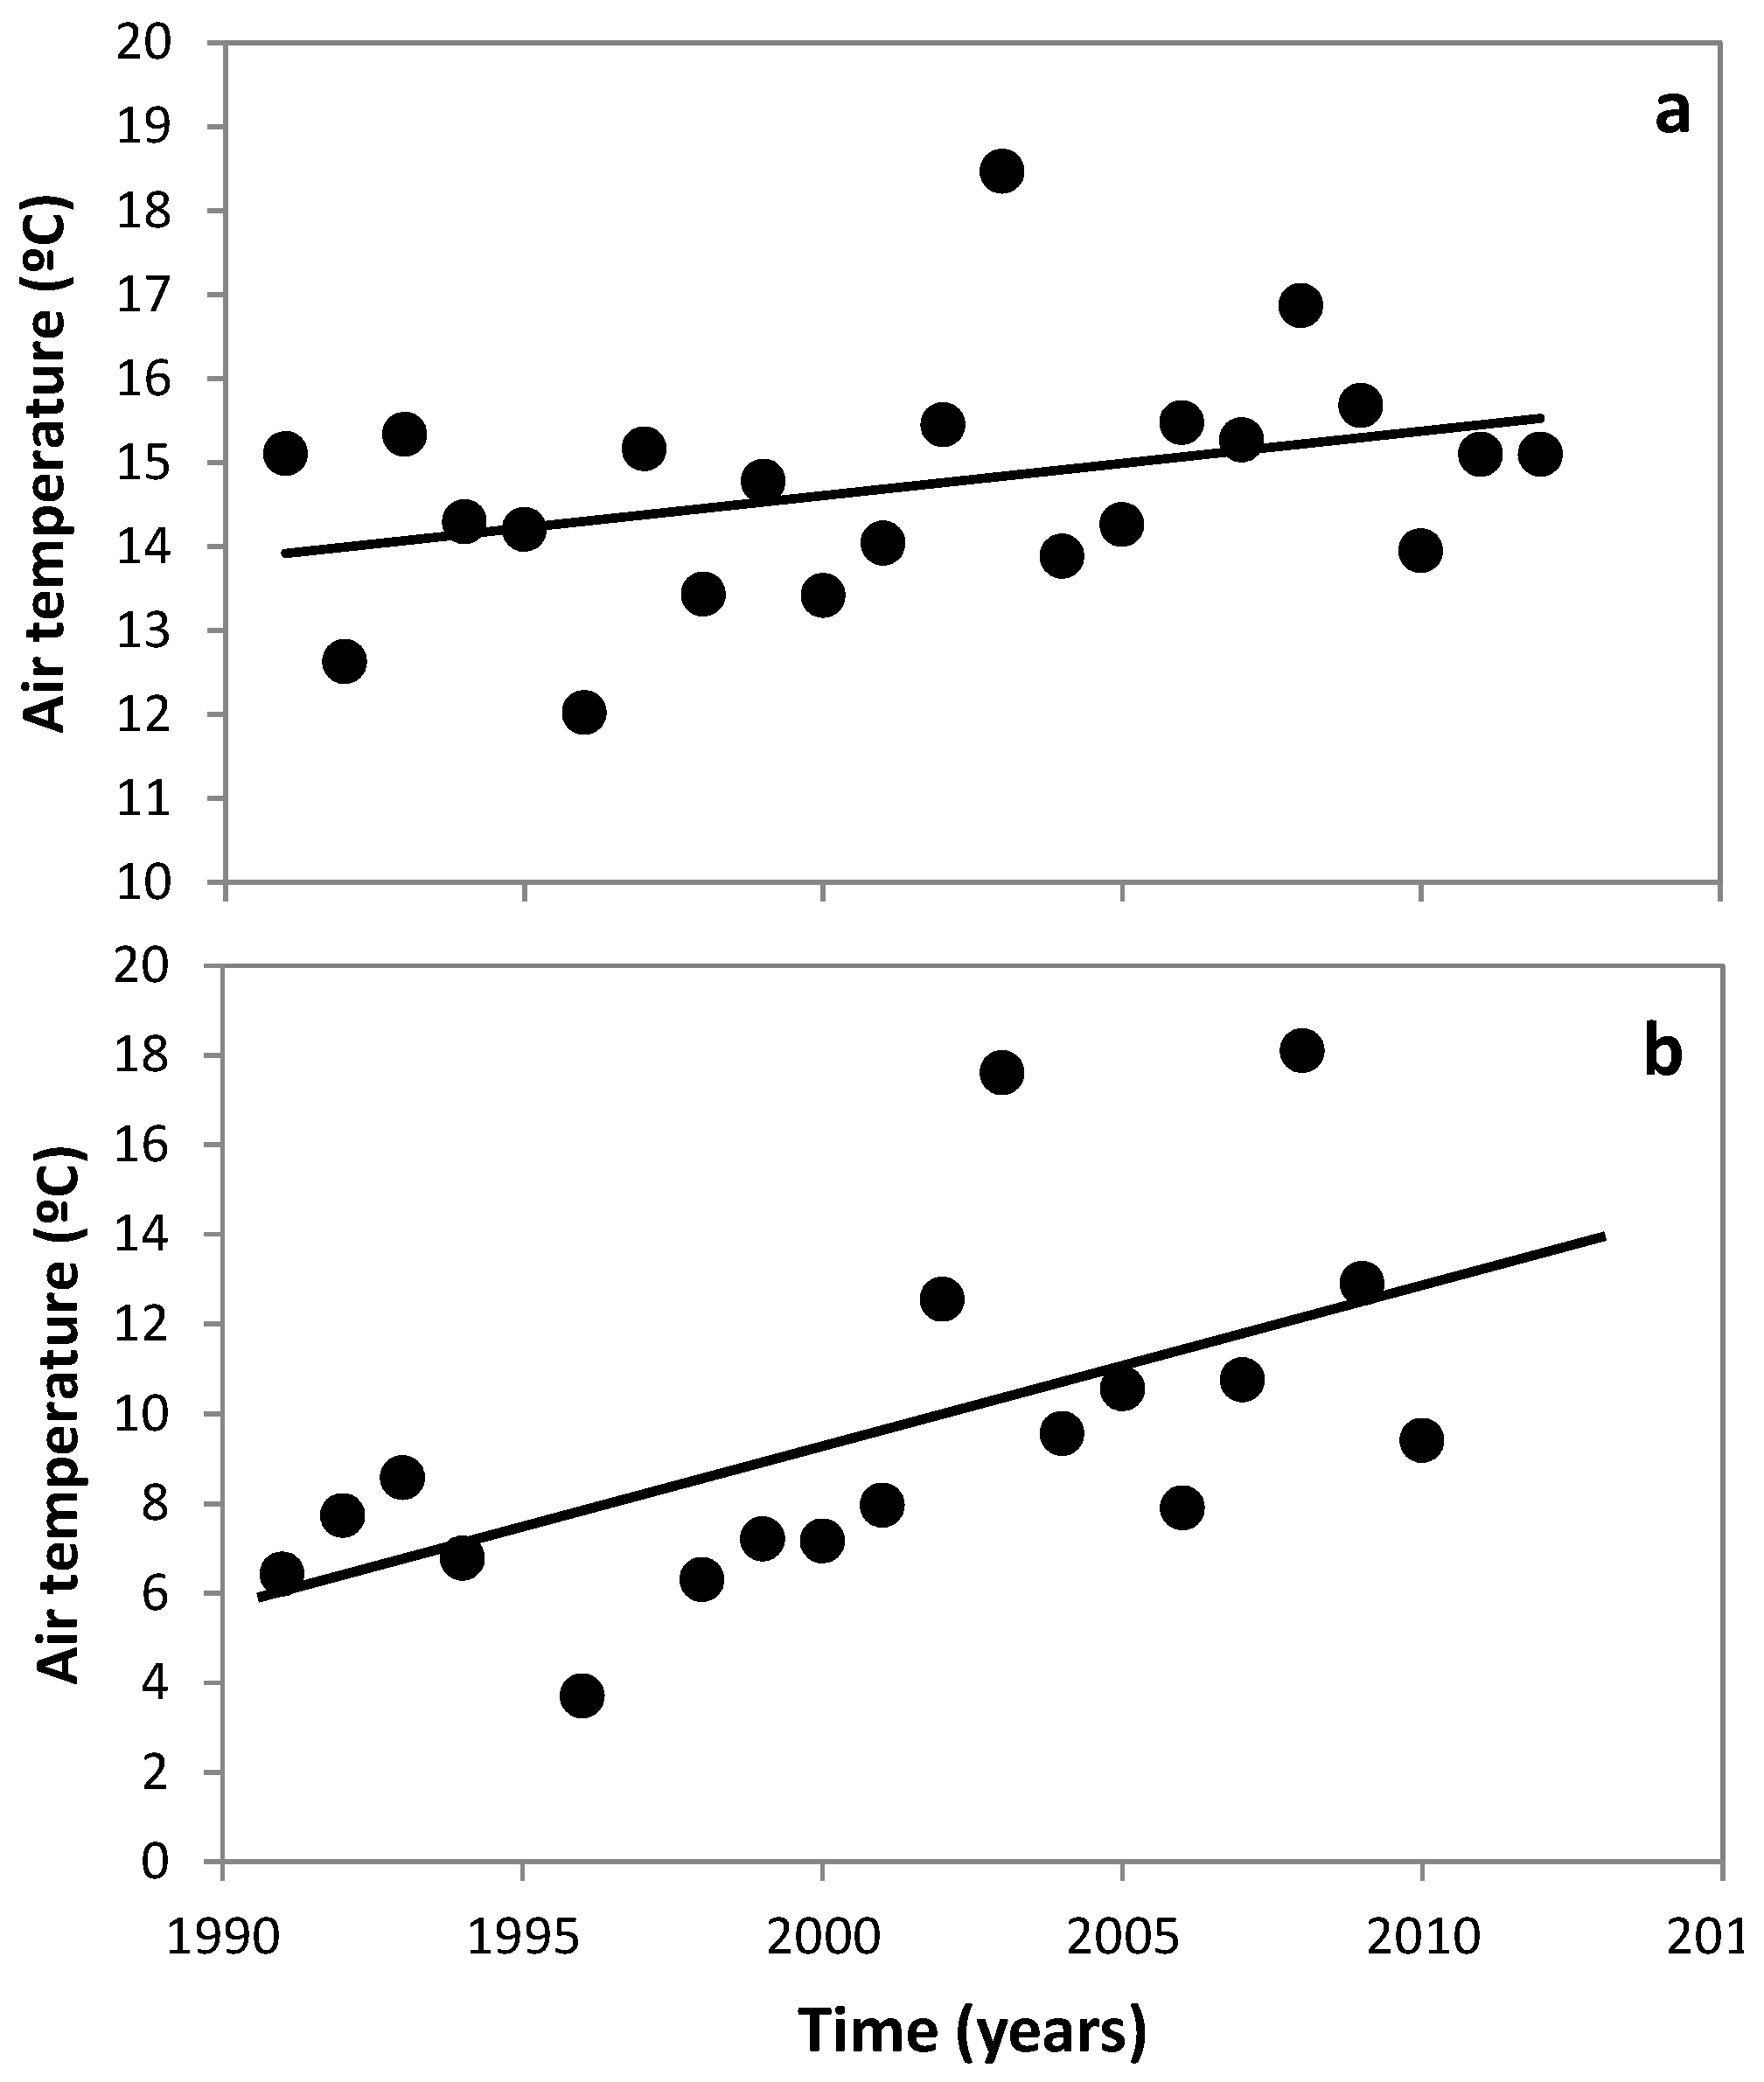
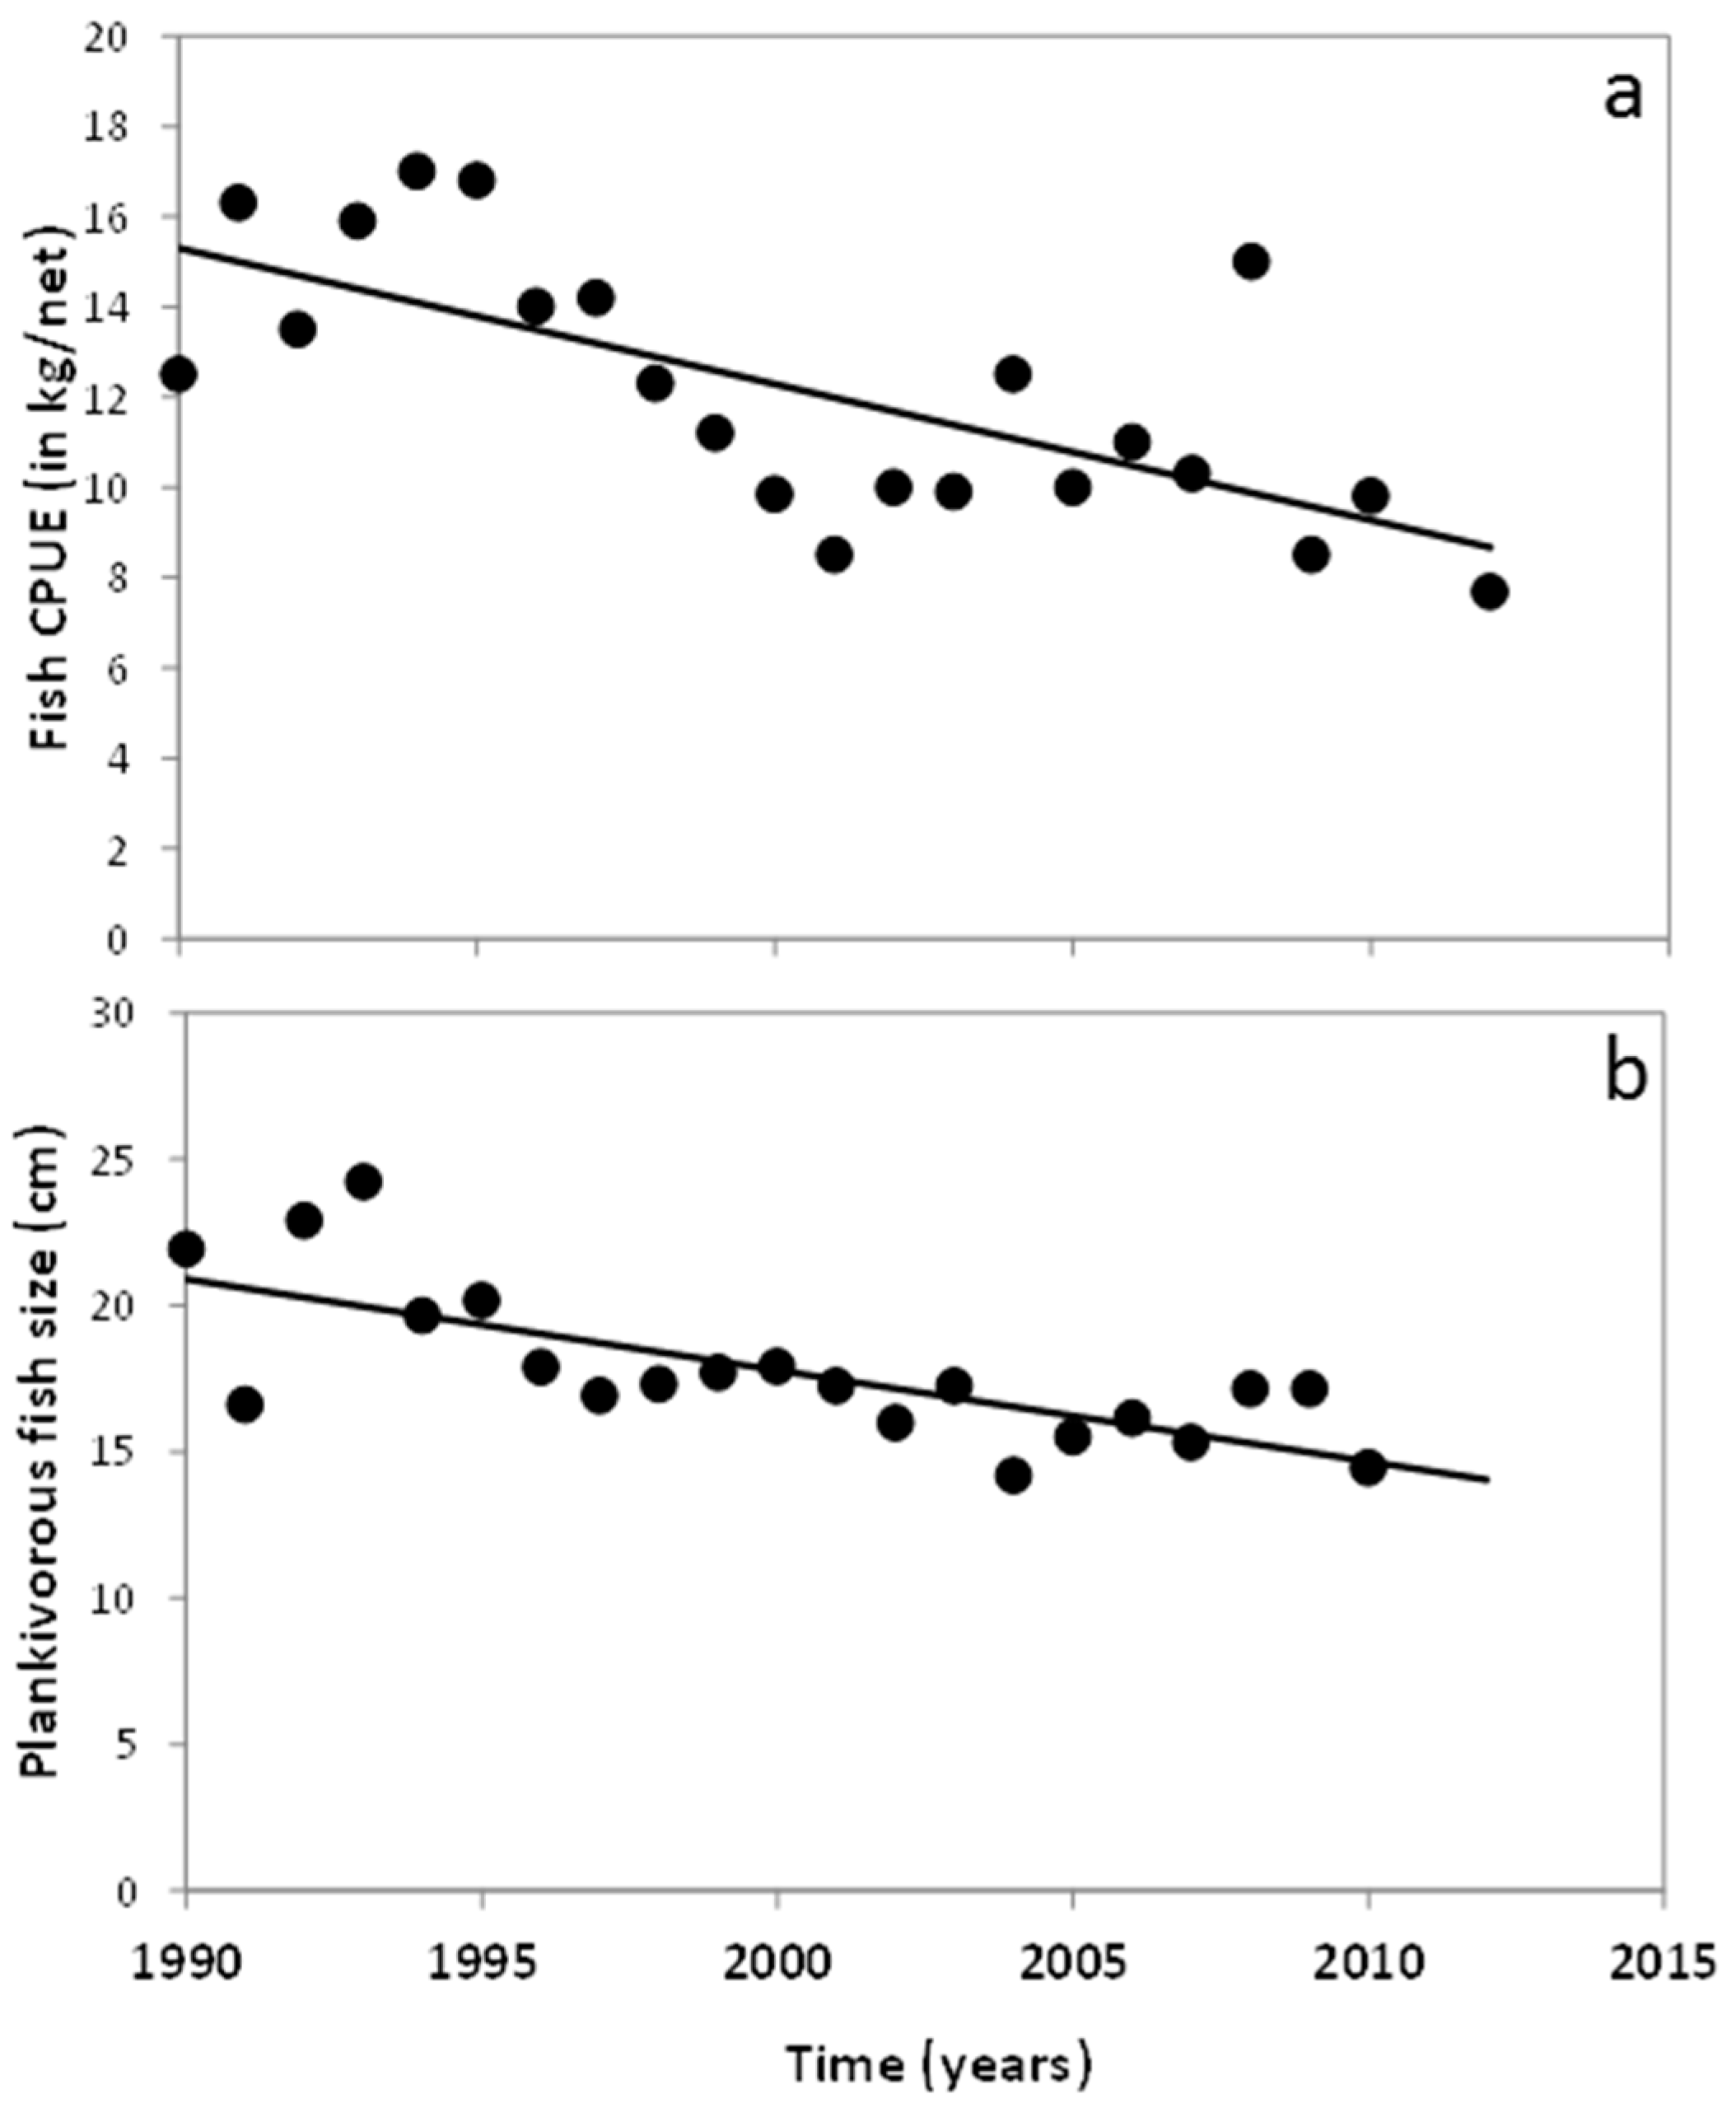
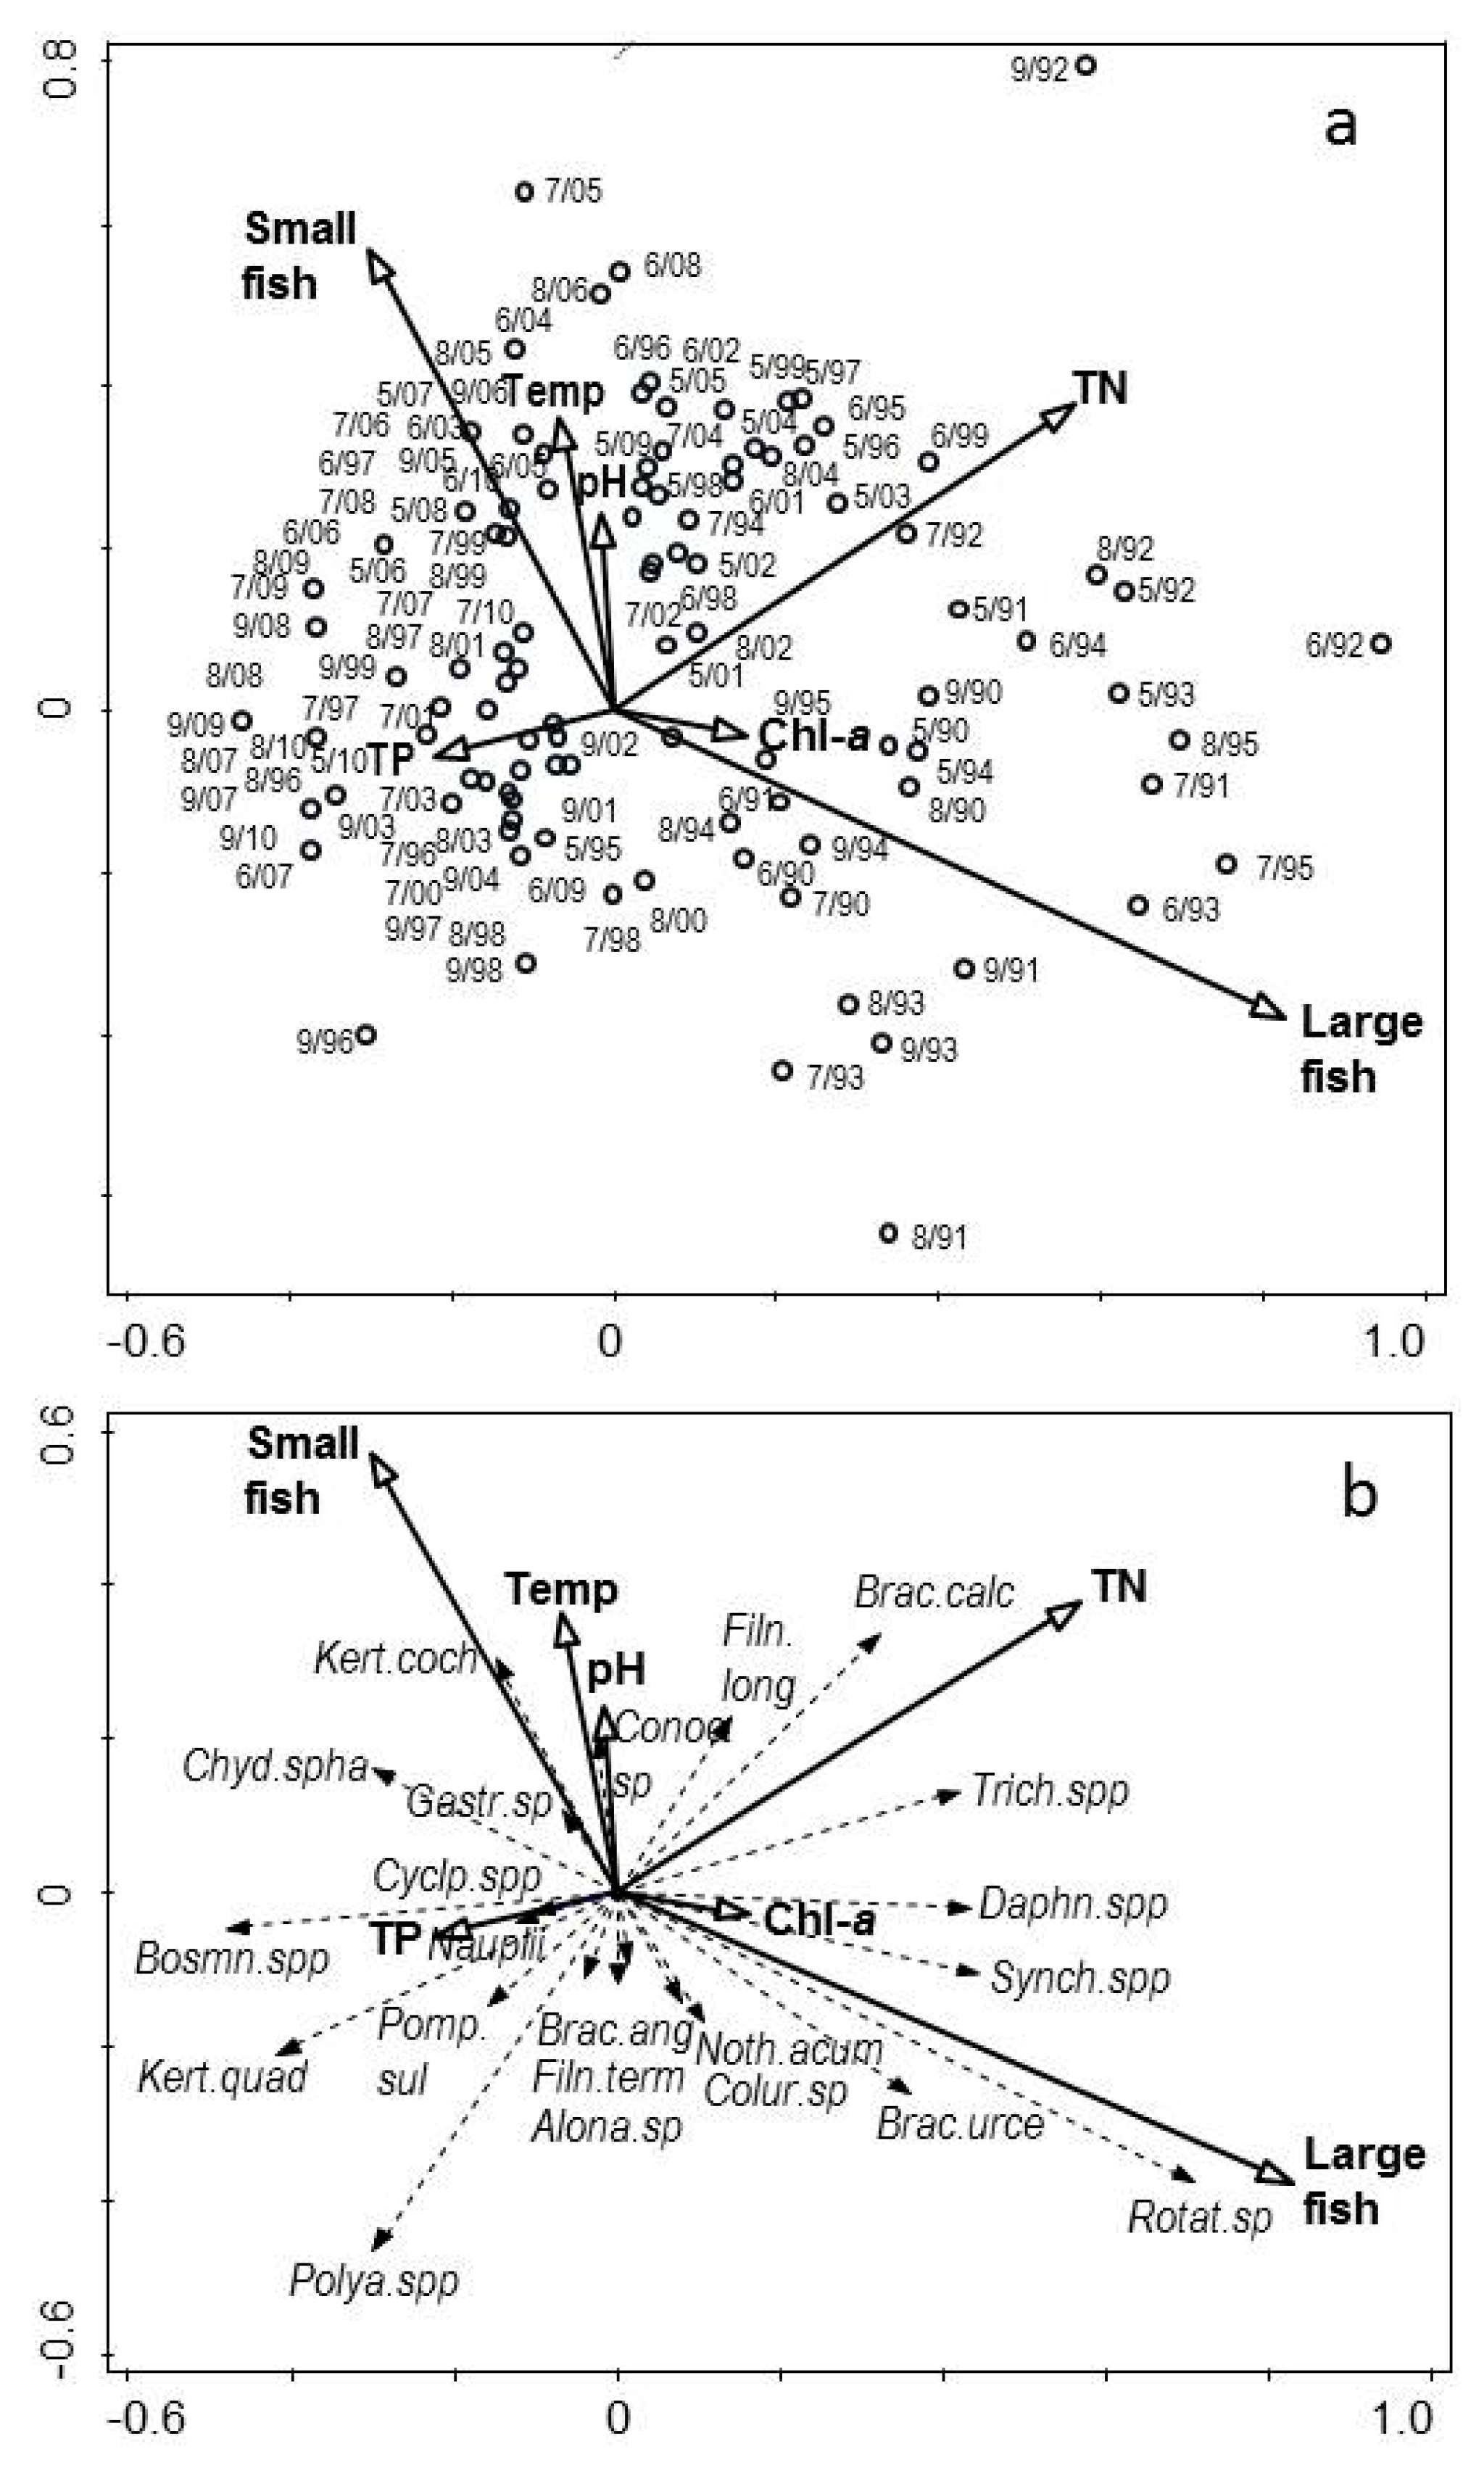
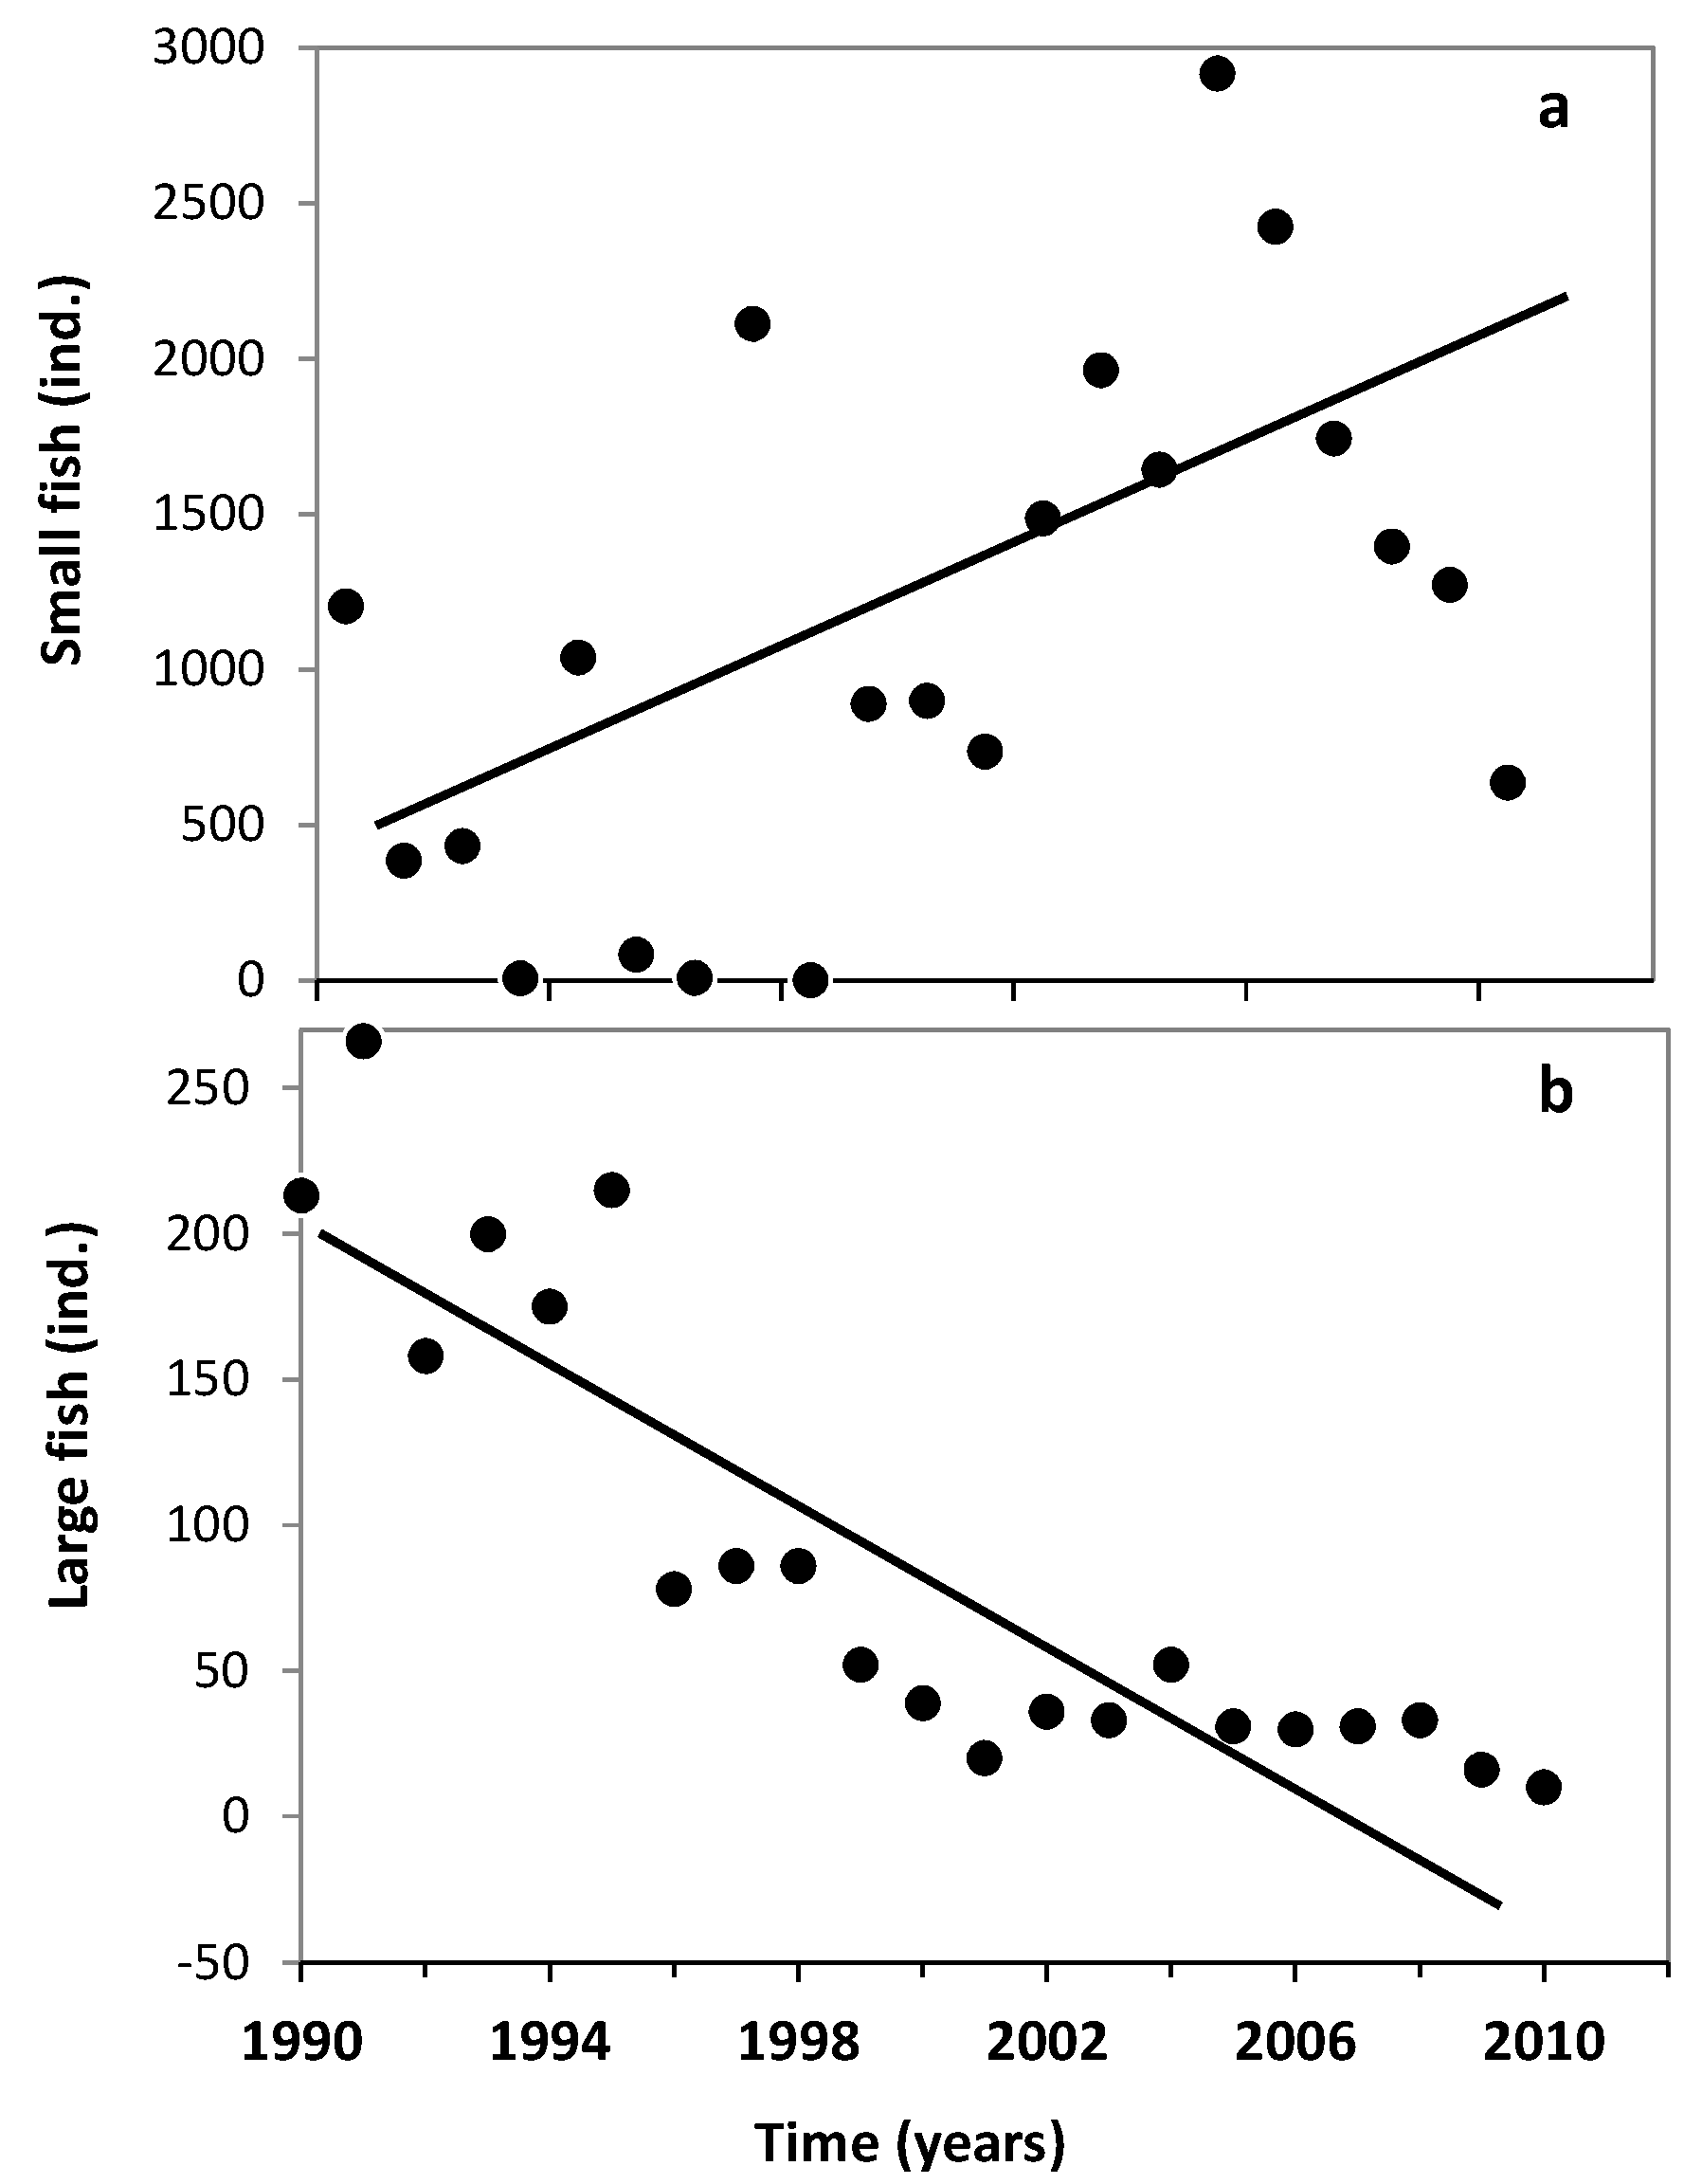
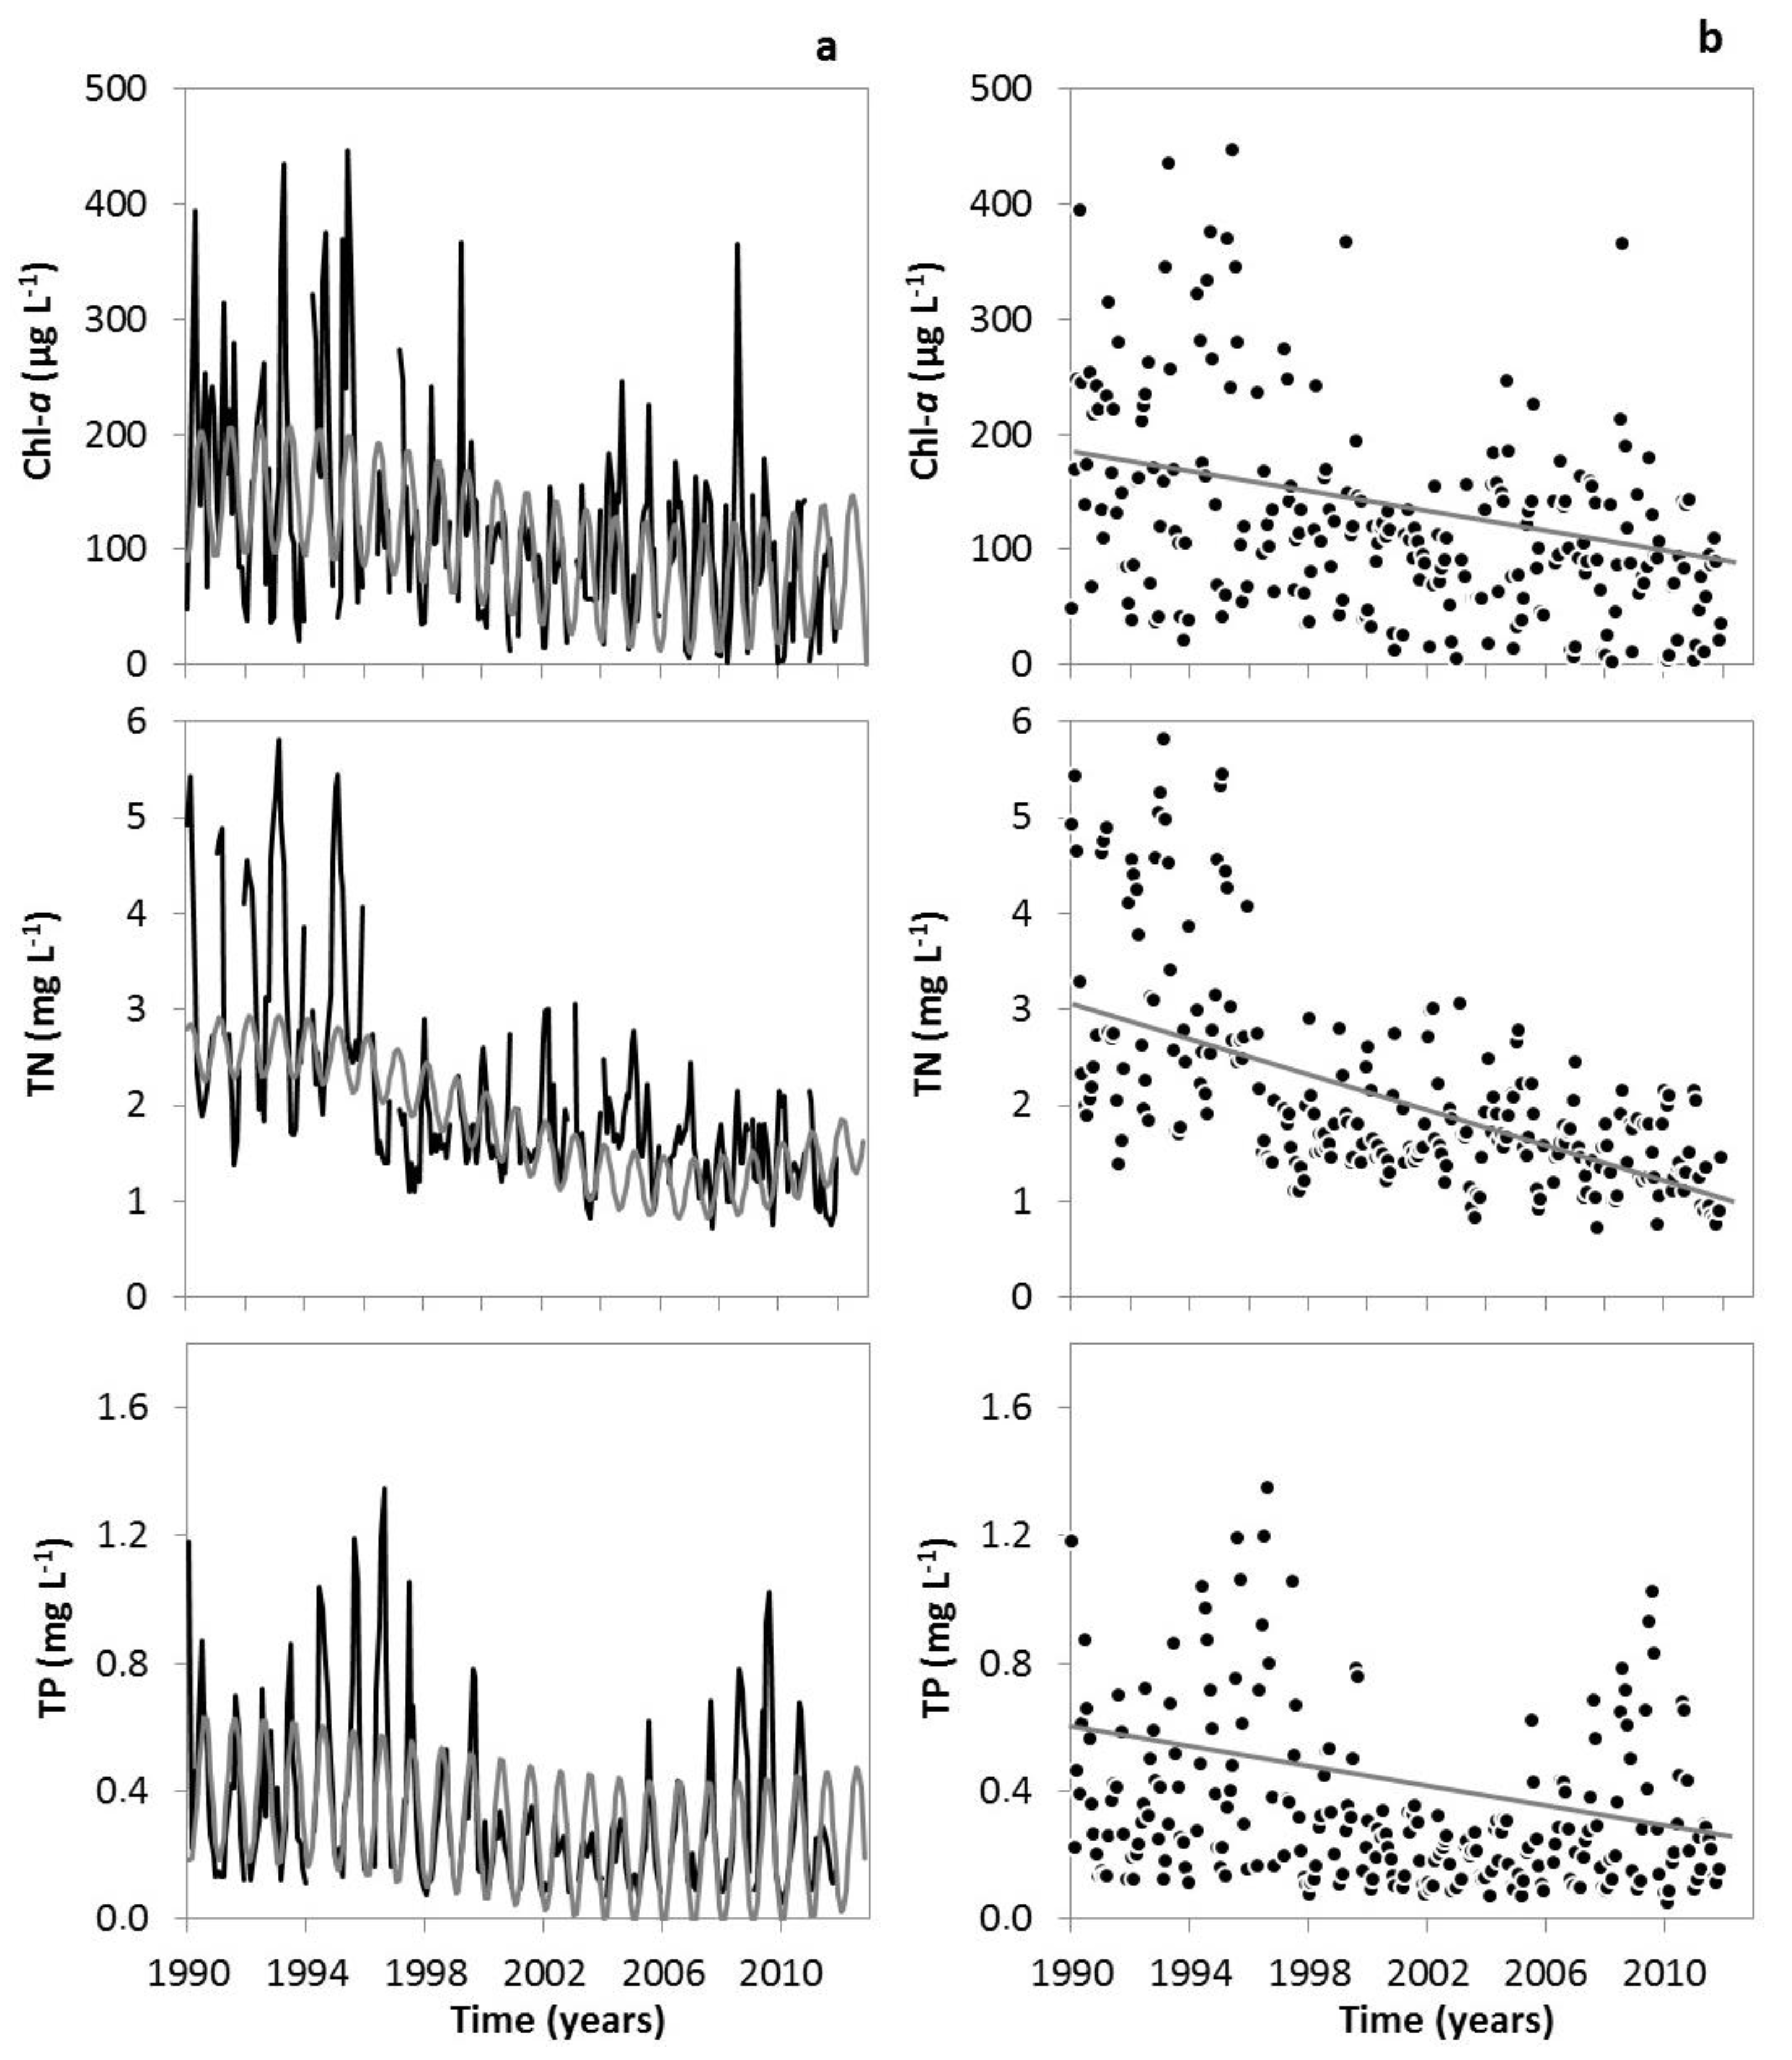
3.1. Changes in Temperature, Fish Assemblage and Their Influence on the Zooplankton Community

The air temperature in the period from April to July during the years 1990 to 2012 in the lake region showed an increasing temporal trend (Q = 0.61, pZ = 0.150), April being the month with the highest temperature increase (Q = 0.314, pZ = 0.009; Figure 1).
The fish community in Lake Søbygaard included 11 species of which perch, roach, rudd and zander dominated. The mean size of fish was 22.7 cm (annual mean: 16 cm; maximum: 31.5 cm). Both capture per unit effort in kg/net (CPUE) and the sizes of roach, bream and rudd, which are considered mainly planktivorous, pooled together decreased with time (Q = −0.327, pZ < 0.001 and Q = −0.334, pZ < 0.001, for CPUE and size, respectively) (Figure 2). Similarly, the number of small fishes (<10 cm) increased (G = 7.015, p = 0.008), while the number of large fishes (>25 cm) declined in the same period (G = 59.672, p < 0.0001) (Figure 3). A positive relation was found between April air temperature and small fish (G = 4.752, p = 0.029) and a negative correlation was found between April air temperature and large fish (G = 3.91, p = 0.047) in the lake region.
A total of 71 zooplankton taxa were identified within the groups Rotifera (43 taxa), Cladocera (21 taxa) and Copepoda (7 taxa) (Table S1, Supplementary Materials). The diversity index (Shannon–Wiener) ranged between 1.68 (in 1993) and 0.87 (in 2003) without significant differences across years (RM ANOVA F = 2.172, p = 0.121). The abundance of zooplankton organisms did not differ among years (RM ANOVA F = 3.028, p = 0.077). Richness ranged between four and 27 taxa and statistical differences were revealed among years (RM ANOVA F = 6.591, p = 0.003). The structure of zooplankton differed significantly among years and between the first and second decade of the study (PERMANOVA, p < 0.0001 and p = 0.0002, respectively), only 13 taxa were responsible for 70% of these variations (Table 1).
Within the zooplankton community, Rotifera exhibited complex and continuous changes in composition and abundance (Figure 4). Their structure differed significantly among years, Polyarthra, Pompholyx and Keratella being the main genera responsible for the differences (Table 1).
Cladocera were particularly abundant during two periods: 1994–1999 and 2004–2011. Daphnia spp. and Bosmina spp. were the dominant species contributing most importantly to the zooplankton variation (Table 1). A general shift from initial dominance of Daphnia spp. to Bosmina spp. occurred (Figure 5a,b). Daphnia spp. decreased significantly with time during the 23 years (ppscl < 0.001), whereas Bosmina spp. (ppscl < 0.001) achieved a significant increasing trends (Table S2, Supplementary Materials). Accordingly, a statistically significant decrease in the Daphnia:Bosmina biomass ratio was observed both for annual data (Q = −0.05; pZ = 0.006) and summer (Q = −0.039; pZ = 0.004) (Figure 6). This trend concurs with changes observed in the fish community; thus, while Daphnia spp. was negatively related to the abundance of small fish and positively related to the Chl-a concentration (multiple GLMM, ppscl < 0.001), Bosmina spp. showed a negative relationship with large-sized fish (multiple GLMM, ppscl < 0.001) (Table 2). Despite the shift from Daphnia spp. to Bosmina spp. dominance, the total biomass of cladocerans increased from 994 µg·L−1 in the period 1991–2004 to 1438 µg·L−1 in the period 2005–2012. This increase was significantly correlated with the density of small fish (G = 8.487, p < 0.004).
Among the changes in other cladoceran species, the proportion of Chydorus sphaericus through the studied 23 years was particularly notable. This Chydoridae was almost absent at the beginning of the study period, but its density increased progressively, reaching the highest abundances between 2004 and 2009 (mean: 11.9; maximum: 43.2 ind. L−1).
Copepoda (cyclopoids only) also showed temporal changes in size and age structure. A significant increase occurred in nauplii density (all period pMCMC < 0.001; spring–summer period pMCMC = 0.004; Figure 5) as well as in the nauplii:(nau+cop+adults) ratio for the entire studied period (Q = 0.145; pZ = 0.026), but not for the summer (Q = −0.004; pZ = 0.101) (Figure 6). There was also an increase in the male:female ratio, significant for annual averages but not for the summer (Q = 0.332, pZ = 0.026 and Q = 0.285, pZ = 0.056, respectively) (Figure 6), and a decreasing, though not significant, trend in the weight:density ratio (Q = −0.217, pZ = 0.089).
The RDA analysis explained 25.1% of the total zooplankton density variation (Figure 7), and CPUE of large fish was the only explanatory variable contributing significantly to the variations (p = 0.007). Among the cladocerans, Daphnia spp. was positively related to large fish and Chl-a, whereas Bosmina spp. was negatively associated with these parameters. Most of the samples from the 1990s were positively related to this variable. On the opposite side of the graph, samples from the last decade of the study were strongly related to the increase in CPUE of small fish and water temperature. Bosmina spp. was positively related to these variables and negatively to large fish and Chl-a.

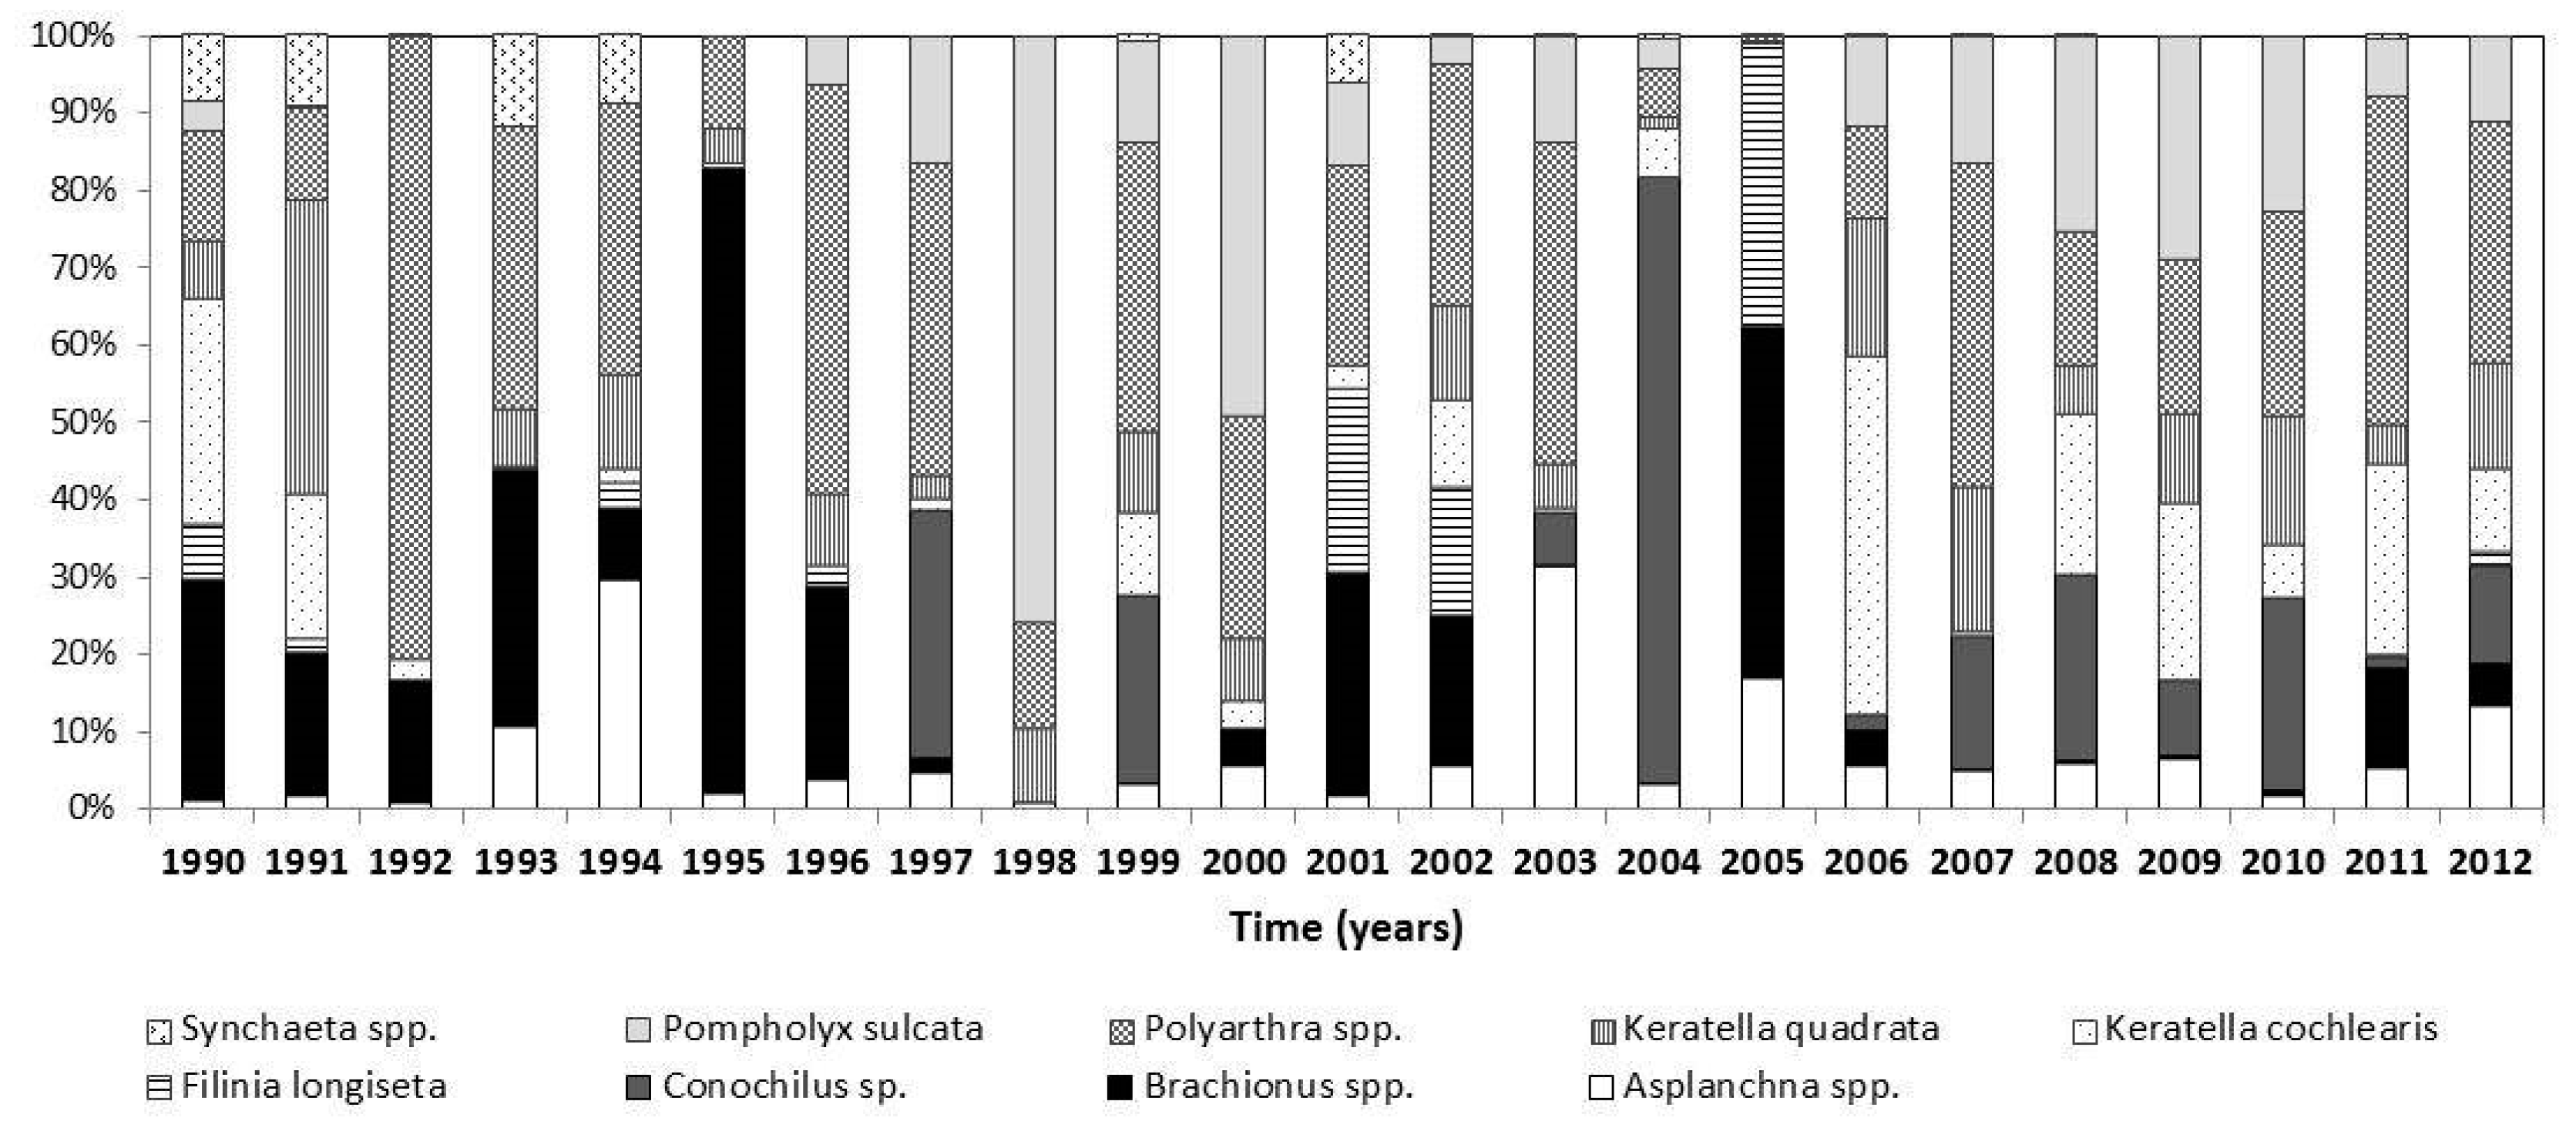
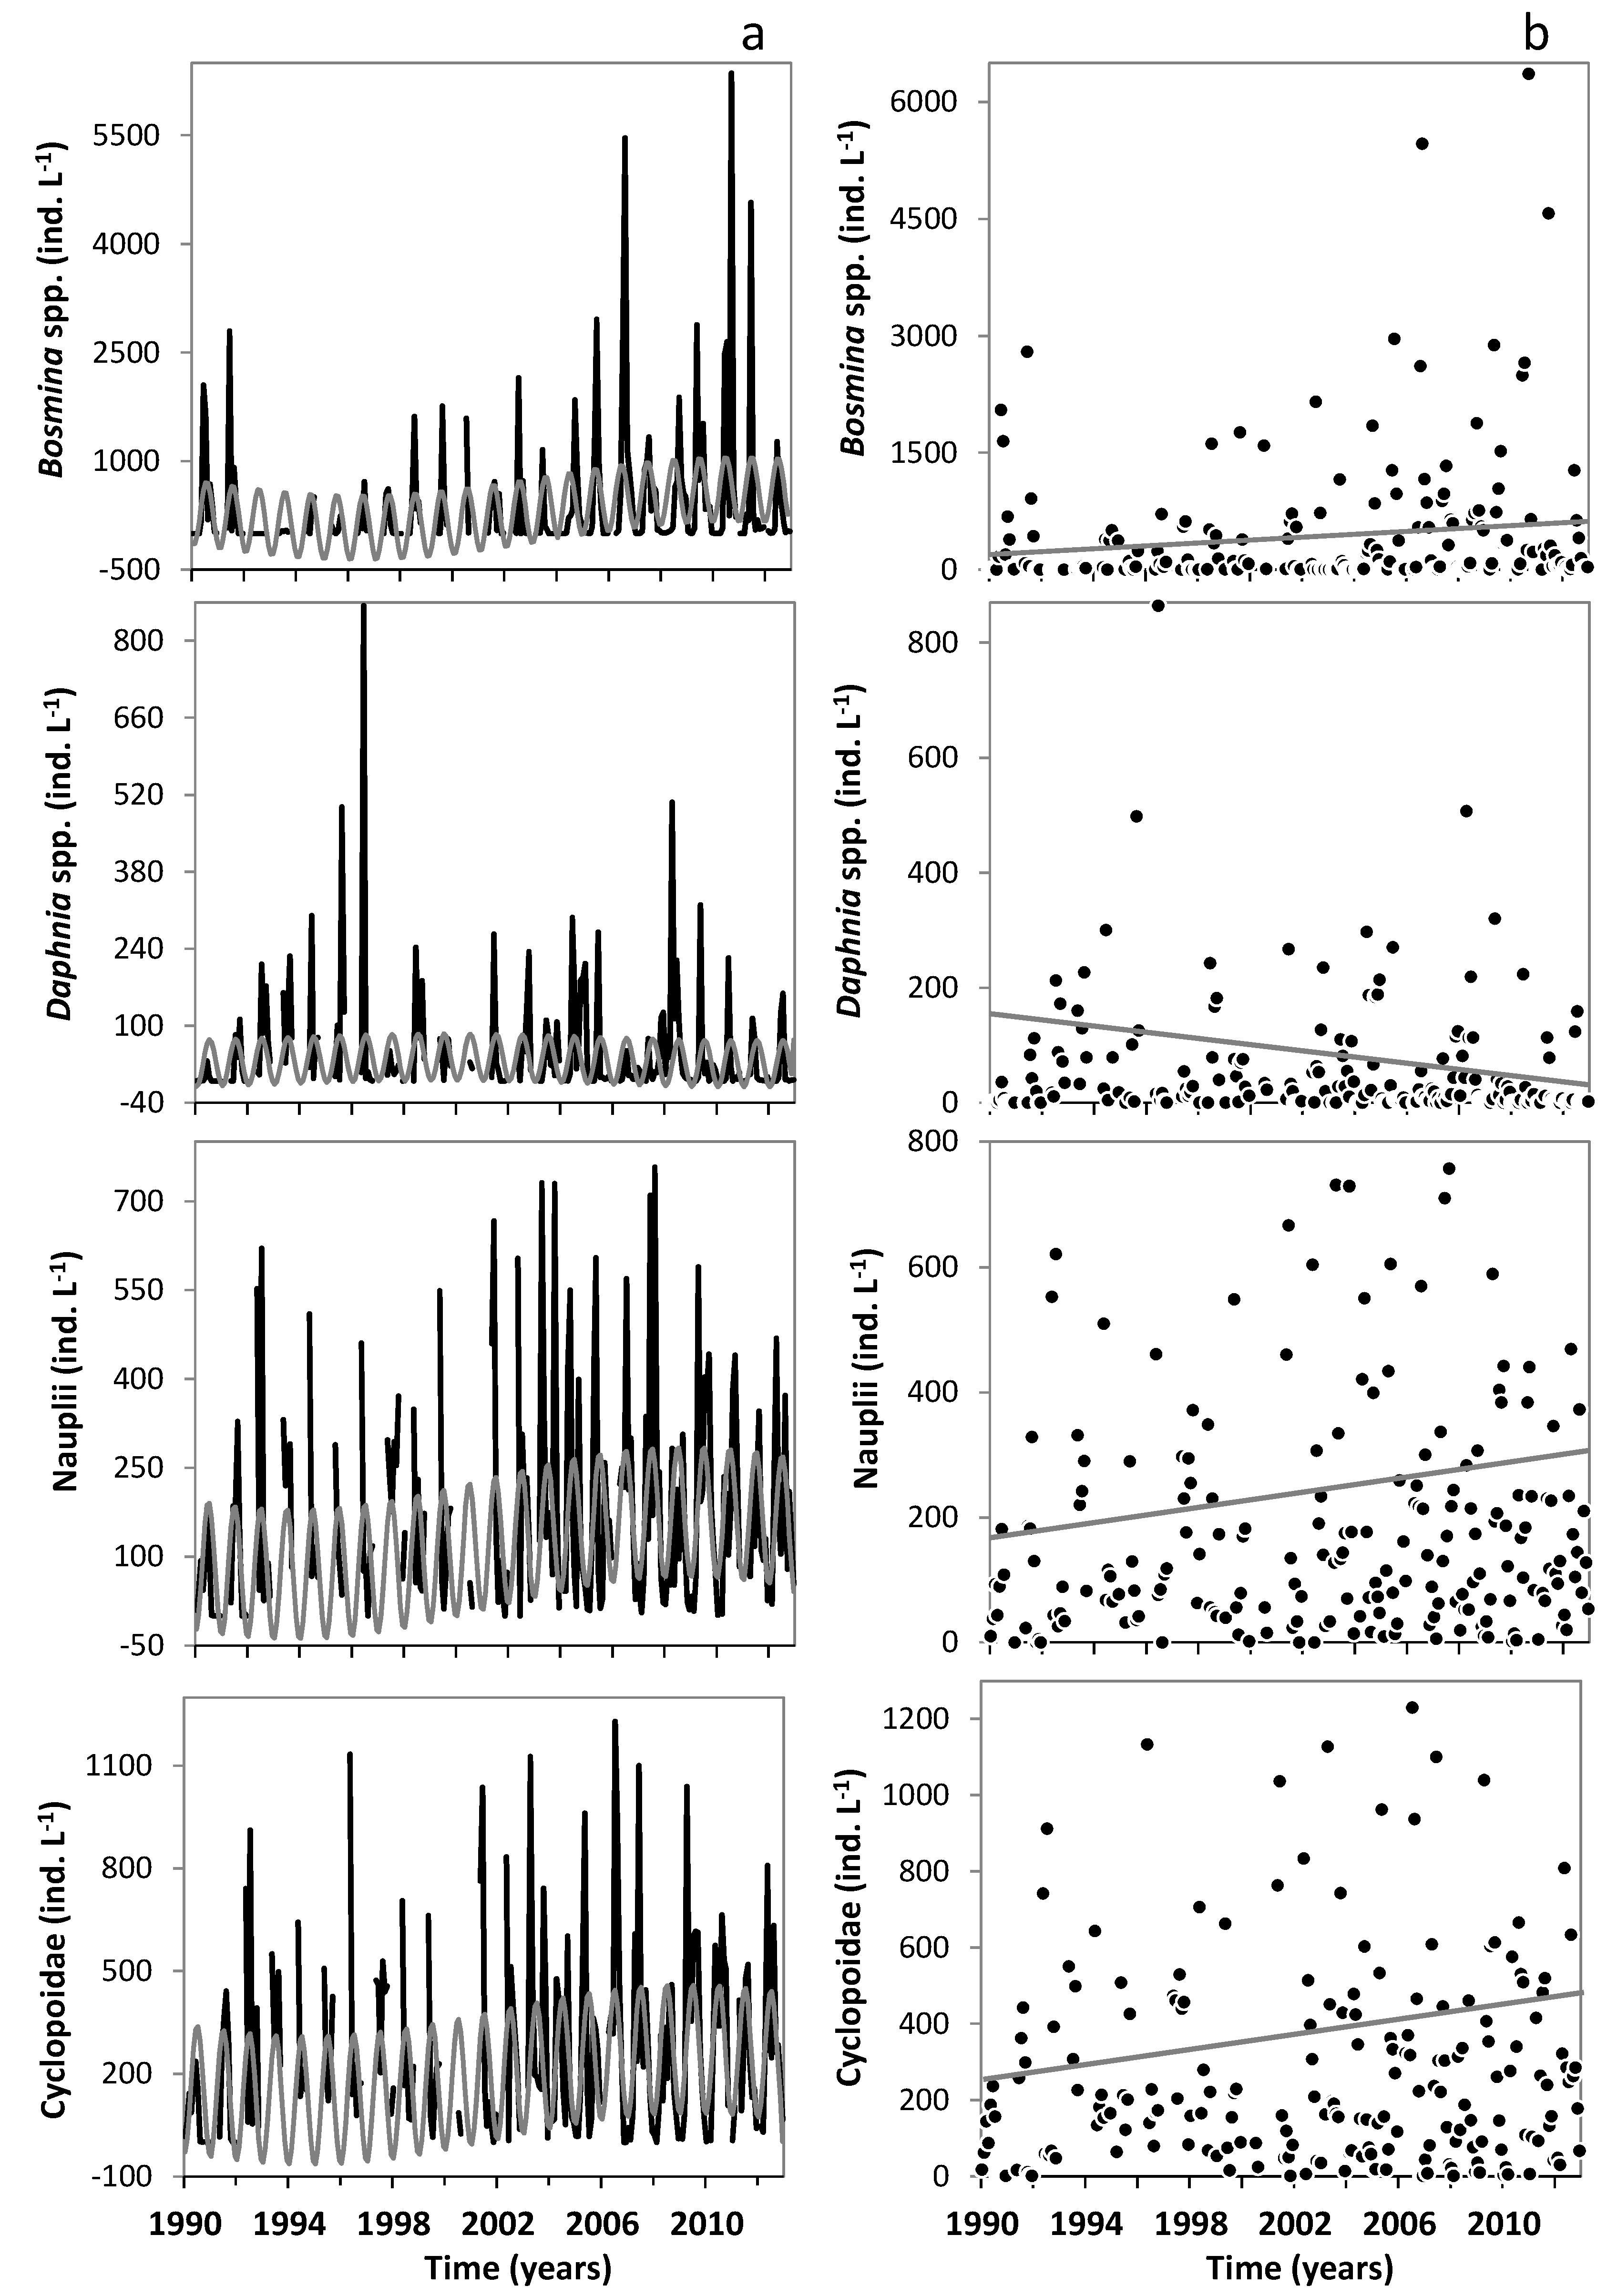
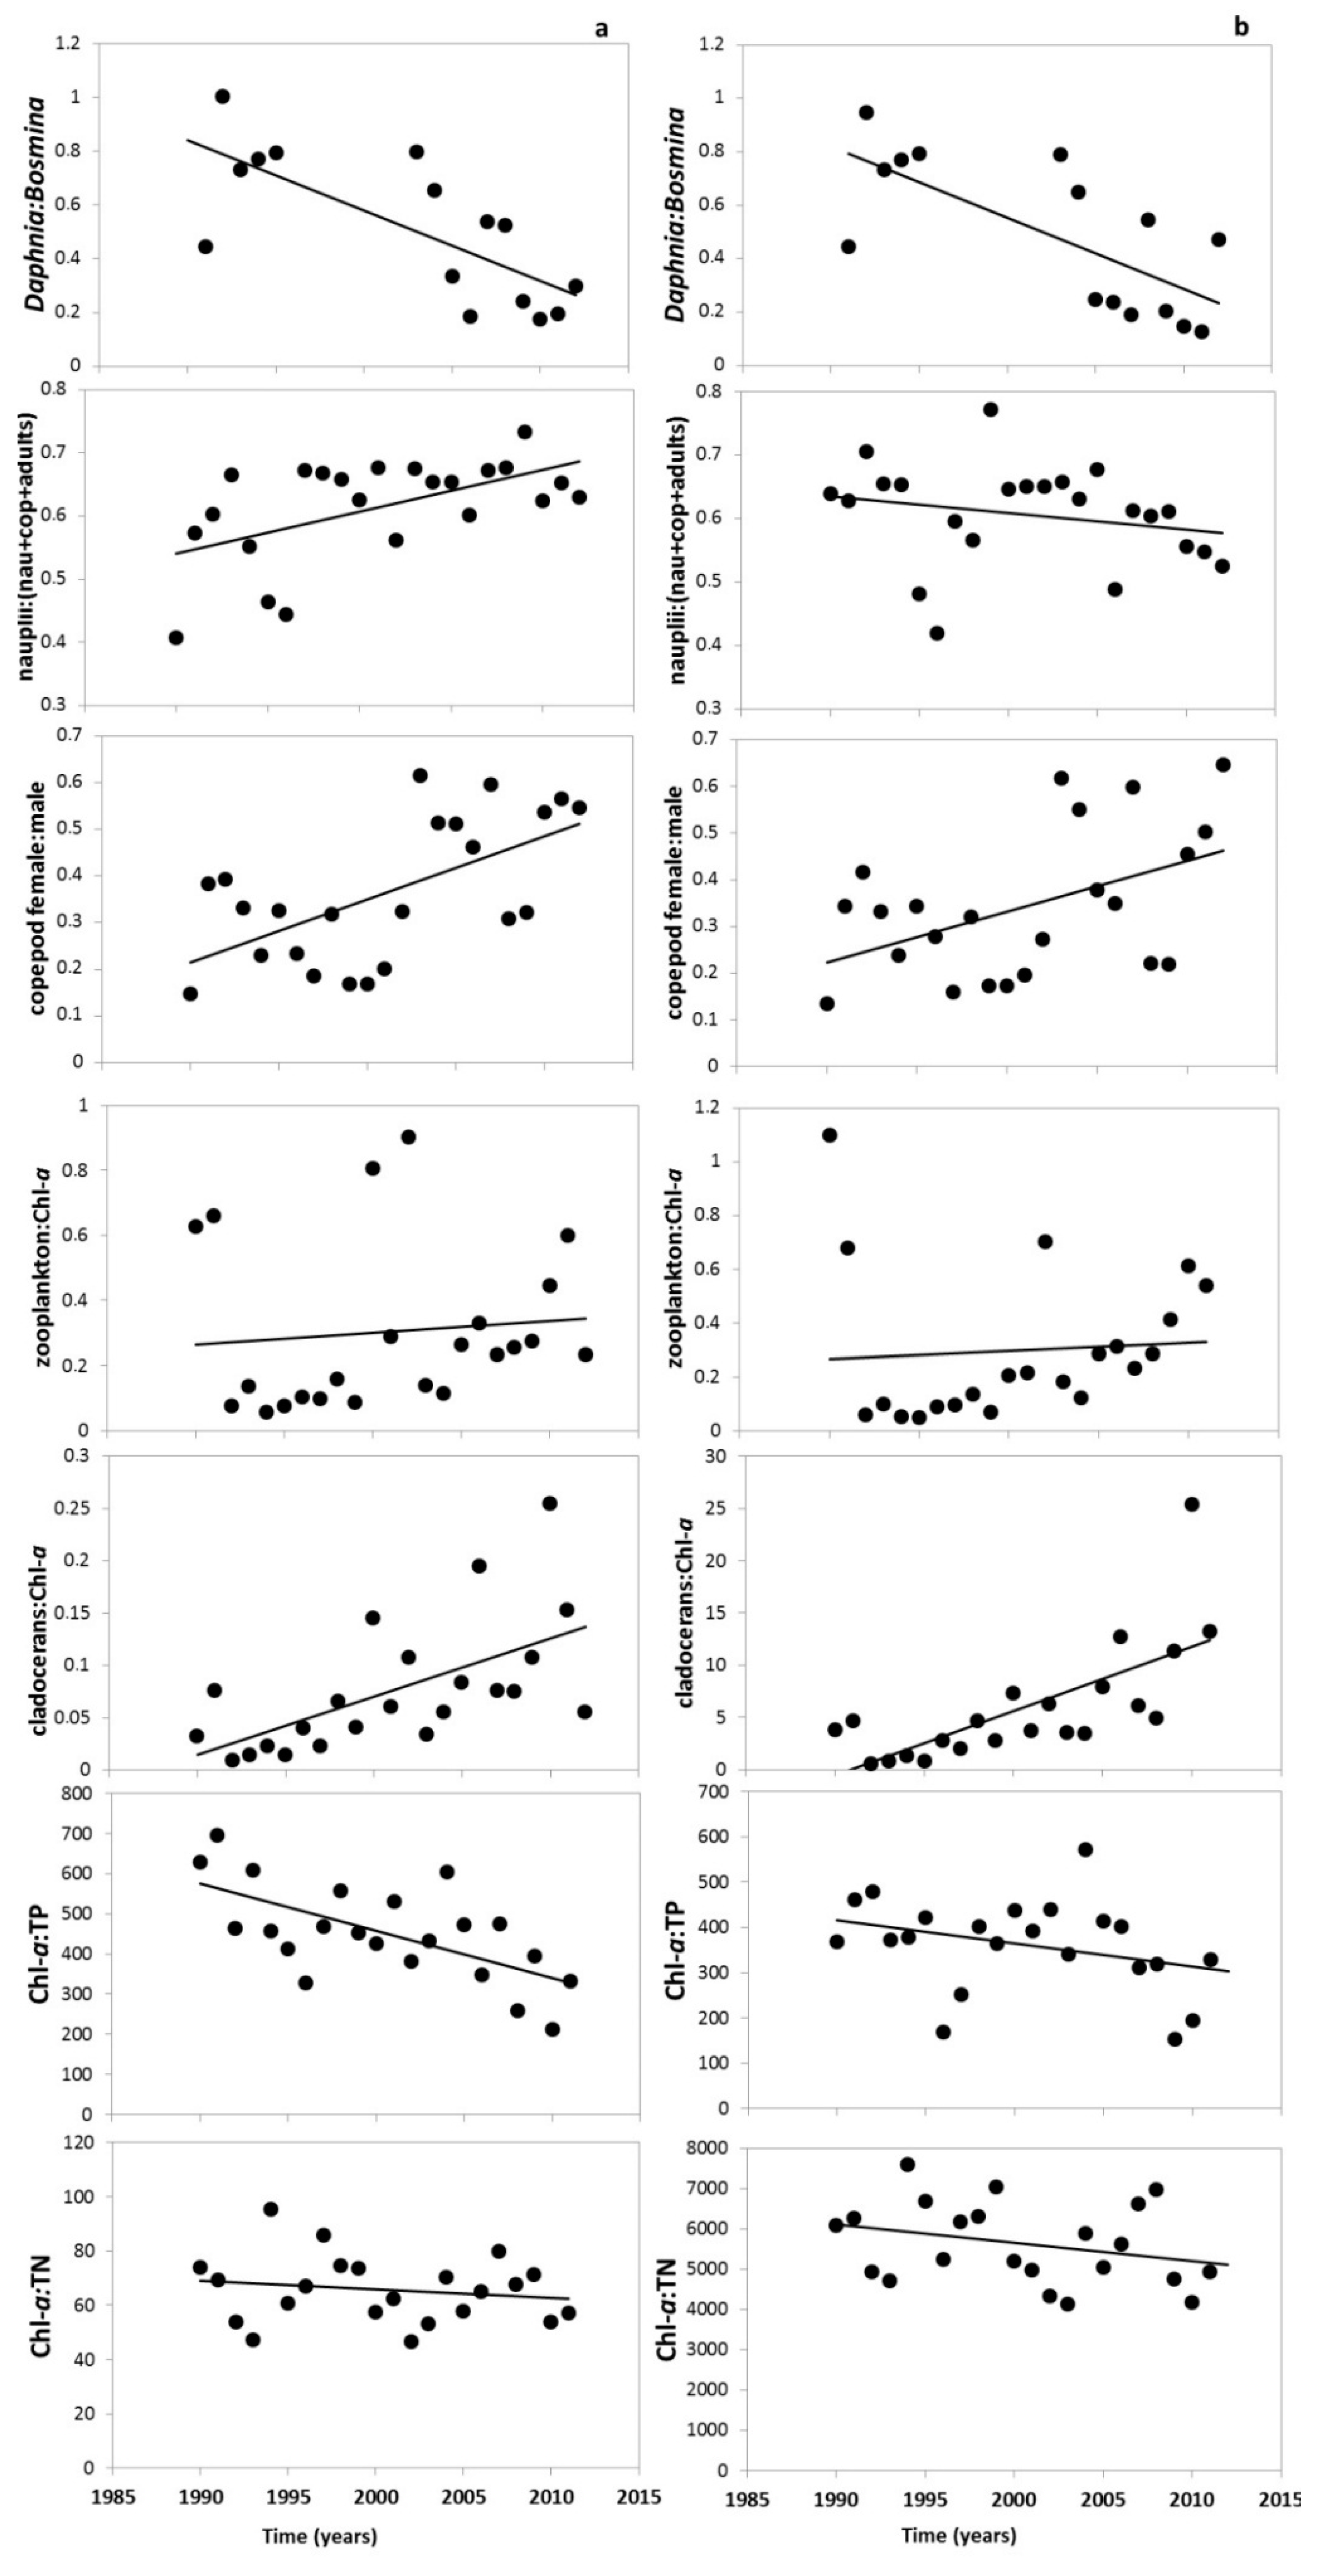
3.2. Changes in the Zooplankton Assemblage and Their Influence on Phytoplankton

Besides the observed changes in the zooplankton assemblage, phytoplankton biomass (measured as the Chl-a concentration) decreased with time (pMCMC < 0.001; Table S3, Supplementary Materials). This pattern applies both to annual data and to spring–summer seasons (Figure 8). The average Chl-a concentration during 1990–2000 was 192 µg·L−1, followed by a decrease during 2001–2012 to 112 µg·L−1. The concentrations of TN and TP had a similar decreasing temporal trend (pMCMC < 0.001 (Table S3, Supplementary Materials) and exhibited similar seasonal and periodical fluctuations as Chl-a (Figure 8). In the period 1990–2000, TN and TP average values were 2 and 0.5 mg·L−1, respectively, while for 2001–2012 they decreased to 1.4 and 0.3 mg·L−1, respectively. As regards the ratios Chl-a:TP and Chl-a:TN, only Chl-a:TP exhibited a significant decreasing trend for the entire study period (Q = −11,986; pZ = 0.001) (Figure 6). Multiple GLMM showed that TN and TP were the only significant variables explaining the variation in Chl-a (positively related) (Table 3). The grazing pressure of total zooplankton (zooplankton:Chl-a) and cladocerans (cladoceran:Chl-a) significantly increased for the summer period (Q = 0.061, pZ = 0.003 and Q = 0.593, pZ < 0.001, for zooplankton and cladocerans, respectively) as well as annually (Q = 0.010, pZ = 0.05 and Q = 0.005, pZ < 0.001, for zooplankton and cladocerans, respectively) (Figure 6).

4. Discussion

Climate warming and nutrient loading reduction showed complex effects on the trophic chain of Lake Søbygaard from 1990 to 2012. The zooplankton assemblage underwent important changes, some of which coincided with expectations for lakes in a recovery after a nutrient loading reduction [33,56,57]. However, other changes are contrary to expectations, particularly those related to zooplankton composition and size structure, suggesting that warming and nutrient loading reduction have interactive rather than independent effects on zooplankton dynamics. Other studies have also reported complex interactions of temperature and nutrient decrease on different groups of zooplankton [35,58,59].
We found a decrease in fish biomass in terms of catch per unit effort (CPUE) along with an overall reduction in nutrient concentrations, especially total nitrogen (TN). This is in accordance with the expected responses of fish to nutrient loading reduction reported in other works [33]. Likely as a consequence of decreased biomass of fish and total zooplankton and, particularly, increased cladoceran biomass. This occurred despite a reduction in resources expressed as Chl-a and generally contrasts the findings from Danish lakes in recovery from eutrophication [33]. In turn, the decline in fish CPUE during recovery did not result in an increase in the proportion of large-bodied zooplankton as expected [37]. In fact, both annual and summer data traced a shift from a cladoceran community dominated by large-sized Daphnia spp. to one dominated by small-sized Bosmina spp. Moreover, the abundance of the small-sized Chydorus sphaericus, almost absent at the beginning of the study period, increased in the last decade. The shift from large to small species indicates enhanced fish predation on large-bodied zooplankton [13,60], which coincides well with the increased catches of small planktivorous fish in the lake. Less frequent surveys of other similar Danish shallow lakes have also pointed towards reduced fish size despite nutrient loading reduction and this has been implicated to multiple effects of warming [25]. Accordingly, we found that summer air temperatures, especially in April where fish are spawning, have become warmer in the region during the study period, and the changes were significantly correlated with the abundances of small (positive) and large fish (negative). Concurrently, field research undertaken in numerous European lakes has shown a significant decline in fish body size with decreasing latitude and thus higher temperatures [20,21,25,61]. The change in fish body size might be a result of improved recruitment of fish due to higher temperatures in spring and likely also as a result of increasing survival of young fish during winter due to a shorter ice cover period [29]. Enhanced fish predation on zooplankton in Lake Søbygaard is also evident from the strong negative correlation detected between Daphnia spp. and the abundance of small fish (<10 cm). This agrees with experimental studies in which the increasing density and dominance of smaller-sized fish due to warming have been observed to augment the predation pressure on large zooplankton species, favouring the development of small-sized species [12,62]. Therefore, a higher temperature-mediated size of the fish assemblage in Lake Søbygaard may have overruled the effect of nutrient loading reduction that usually results in an increase in fish size [37], causing a decrease instead of the expected increase in the size of cladocerans. This corresponds with findings in subtropical and tropical lakes in which small zooplankters dominate, even at low nutrient concentrations [12,63]. The increase in chydorids may perhaps be related to a shift in phytoplankton from dominance by green algae [41] to a higher share of cyanobacteria [64,65,66] and, potentially, also to improved conditions for benthic algae growth. For example, it has been reported that Chydorus sphaericus is able to take the colonies or filamentous algae between its carapace lobes and cling or clamber along them [67].
The changes in copepods followed the pattern observed for cladocerans, i.e., the abundance and proportion of nauplii increased throughout the study period and the weight:density ratio decreased. Field and experimental studies provide evidence that such changes also reflect alterations in the size-selective predation pressure [62,68,69]. The decrease in the weight:density ratio may also be related to a slight decrease in the dominance of C. vicinus and an increasing abundance of Mesocyclops sp. during last decade, which was generally smaller in size. In addition, rotifers exhibited changes in taxonomic composition during the study period, Polyarthra, Pompholyx and Keratella being the genera mainly responsible for the among-year differences. Despite this, the total biomass and size structure of rotifers exhibited no significant changes, which somehow contradict previous works in which the total biomass of rotifers and small size classes were found to increase as a consequence of warming [58].
During recovery, we would expect an increase in grazing pressure on phytoplankton due to release of fish predation and higher resource control of phytoplankton [70]. Accordingly, we found a marked increase in the biomass ratios of cladoceran:Chl-a and zooplankton:Chl-a despite the size reduction of cladocerans and copepods. The capacity of the zooplankton to control phytoplankton seems therefore to have increased in Lake Søbygaard along with the nutrient loading reduction due to enhanced grazing. This behaviour is in line with experimental studies demonstrating that increasing temperatures enhance the zooplankton consumption rate [33,70], and as expected, consumers being more sensitive than producers to a temperature increase, the top-down control on primary production has been strengthened [71,72].
Concurrently with the enhanced grazing activity, the nutrient loading reduction has undoubtedly contributed importantly to the decrease in Chl-a. Our results showed that Chl-a followed the same decreasing pattern as TN and TP, which together were the only significant variables explaining the Chl-a fluctuations during the study period. A previous study in Lake Søbygaard [41] revealed that TN and TP decreased by 55 and 56%, respectively, from the period 1978–1987 to 1988–1995, whereas Chl-a decreased from 755 (average 1978–1987) to 216 µg·L−1 in the latter period. In turn, the values of TN and TP decreased by 20% and 37%, respectively, from the period 1978–1995 to the period 2000–2012 that our study covers; and Chl-a decreased by 48%, reaching an average value of 112 µg·L−1. While these values still qualify for a eutrophic lake according to OECD [73], they evidence a decline in the trophic state of the lake.
In conclusion, despite the overall recovery of Lake Søbygaard following the nutrient loading reduction, large-bodied zooplankton have not recovered similarly; rather they have exhibited a decline in size coinciding with a shift to dominance of smaller-sized fish in lake, attributed to warming. However, these effects have not prevented, but likely modulated, the positive cascading effects on phytoplankton through a diminished fish CPUE related to the nutrient loading reduction.

Supplementary Materials

The following are available online at www.mdpi.com/2073-4441/8/8/341/s1, Table S1: Zooplankton taxa identified within the groups of Rotifera, Cladocera and Copepoda in Lake Søbygaard from 1990 to 2012, Table S2: Statistics of the GLMMs based on Markov chain Monte Carlo method for the temporal trend of Bosmina spp and Daphnia spp. Estimate value, standard error (SE), p-value (ppscl), and log-likelihood are reported, Table S3: Statistics of the GLMMs based on Markov chain Monte Carlo method for the temporal trend in variables shown in Figure 8. The mean of the posterior distribution (post mean), lower and upper 95% credible interval (l-95% CI and u-95% CI), the MCMC p-value (pMCMC) and deviance information criterion (DIC) are reported.

Acknowledgments

The study was supported by the Managing Aquatic ecosystems and water Resources under multiple Stress funded under the 7th EU Framework Programme, Theme 6 (Environment including Climate Change), Contract No.: 603378 (http://www.mars-project.eu), CLEAR (a Villum Kann Rasmussen Centre of Excellence project). María Florencia Gutierrez and Melina Devercelli were supported by CONICET (National Council of Scientific and Technical Research, Argentina). Sandra Brucet’s contribution was supported by Marie Curie Intra European Fellowship No. 330249 (CLIMBING). We are thankful to Anne Mette Poulsen for proofreading the manuscript, to Karina Jensen for assistance with zooplankton counting and sample processing, and to Federico Giri and Liliana Forzani for their advice on GLMM analyses. We thank the anonymous reviewers for their valuable comments and suggestions.

Author Contributions

María Florencia Gutierrez has processed zooplankton samples from 2003 to 2012, analysed the time series and wrote the manuscript. Melina Devercelli and Sandra Brucet have contributed with statistical analyses and revisions. Torben L. Lauridsen, Martin Søndergaard and Erik Jeppesen have contributed with historical data, corrections and revision.

Conflicts of Interest

The authors declare no conflict of interest.

References

  1. Jeppesen, E.; Kronvang, B.; Meerhoff, M.; Søndergaard, M.; Hansen, K.M.; Andersen, H.E.; Lauridsen, T.; Liboriussen, L.; Beklioglu, M.; Özen, A.; et al. Climate change effects on runoff, catchment phosphorus loading and lake ecological state, and potential adaptations. J. Environ. Qual. 2009, 38, 1930–1941. [Google Scholar] [CrossRef] [PubMed]
  2. Sas, H. Lake Restoration by Reduction of Nutrient Loading: Expectations, Experiences, Extrapolations; Academia Verlag Richarz: St. Augustin, Germany, 1989. [Google Scholar]
  3. Marsden, M.W. Lake restoration by reducing external phosphorus loading: The influence of sediment phosphorus release. Freshw. Biol. 1989, 21, 139–162. [Google Scholar] [CrossRef]
  4. Benndorf, J. Possibilities and limits for controlling eutrophication by biomanipulation. Int. Rev. Gesamt. Hydrobiol. 1995, 80, 519–534. [Google Scholar] [CrossRef]
  5. Lauridsen, T.L.; Sandsten, H.; Møller, P.H. The restoration of a shallow lake by introducing Potamogeton spp. The impact of waterfowl grazing. Lakes Reserv. Res. Manag. 2003, 8, 177–187. [Google Scholar] [CrossRef]
  6. Søndergaard, M.; Liboriussen, L.; Pedersen, A.R.; Jeppesen, E. Lake restoration by fish removal: Long-term effects in 36 Danish lakes. Ecosystems 2008, 1, 1291–1305. [Google Scholar] [CrossRef]
  7. Köhler, J.; Hilt, S.; Adrian, R.; Nicklisch, A.; Kozerski, H.P.; Walz, N. Long-term response of a shallow, moderately flushed lake to reduced external phosphorus and nitrogen loading. Freshw. Biol. 2005, 50, 1639–1650. [Google Scholar] [CrossRef]
  8. Søndergaard, M.; Jeppesen, E.; Lauridsen, T.L.; Skov, C.; Van Nes, E.H.; Roijackers, R.; Portielje, R.O.B. Lake restoration: Successes, failures and long-term effects. J. Appl. Ecol. 2007, 44, 1095–1105. [Google Scholar] [CrossRef]
  9. Søndergaard, M.; Jensen, J.P.; Jeppesen, E.; Møller, P.H. Seasonal dynamics in the concentrations and retention of phosphorus in shallow Danish lakes after reduced loading. Aquat. Ecosyst. Health. Manag. 2002, 5, 19–29. [Google Scholar] [CrossRef]
  10. Jeppesen, E.; Meerhoff, M.; Davidson, T.A.; Trolle, D.; Sondergaar, D.M.; Lauridsen, T.L.; Nielsen, A. Climate change impacts on lakes: An integrated ecological perspective based on a multi-faceted approach, with special focus on shallow lakes. J. Limnol. 2014, 73, 84–107. [Google Scholar] [CrossRef] [Green Version]
  11. Moss, B.; Kosten, S.; Meerhoff, M.; Battarbee, R.; Jeppesen, E.; Mazzeo, N.; Havens, K.; Lacerot, G.; Liu, Z.; De Meester, L.; et al. Allied attack: Climate change and eutrophication. Inland Waters 2011, 1, 101–105. [Google Scholar] [CrossRef]
  12. Meerhoff, M.; Clemente, J.M.; Teixeira-de Mello, F.; Iglesias, C.; Pedersen, C.R.; Jeppesen, E. Can warm climate-related structure of littoral predator assemblies weaken clear water state in shallow lakes? Glob. Chang. Biol. 2007, 13, 1888–1897. [Google Scholar] [CrossRef]
  13. Jeppesen, E.; Moss, B.; Bennion, H.; Carvalho, L.; De Meester, L.; Feuchtmayr, H.; Friberg, N.; Gessner, M.O.; Hefting, M.; Lauridsen, T.L.; et al. Interaction of Climate Change and Eutrophication. In Climate Change Impacts on Freshwater Ecosystems; Kernan, M., Moss, B., Battarbee, R., Eds.; Blackwell Publishing Ltd.: Oxford, UK, 2010; pp. 119–151. [Google Scholar]
  14. Jöhnk, K.D.; Huisman, J.; Sharples, J.; Sommeijer, B.; Visser, P.M.; Stroom, J.M. Summer heatwaves promote blooms of harmful Cyanobacteria. Glob. Chang. Biol. 2008, 14, 495–512. [Google Scholar] [CrossRef]
  15. Huber, V.; Wagner, C.; Gerten, D.; Adrian, R. To bloom or not to bloom: Contrasting responses of cyanobacteria to recent heat waves explained by critical thresholds of abiotic drivers. Oecologia 2012, 169, 245–256. [Google Scholar] [CrossRef] [PubMed]
  16. Rigosi, A.; Carey, C.C.; Ibelings, B.W.; Brookes, J.D. The interaction between climate warming and eutrophication to promote cyanobacteria is dependent on trophic state and varies among taxa. Limnol. Oceanogr. 2014, 59, 99–114. [Google Scholar] [CrossRef]
  17. Christoffersen, K.; Andersen, N.; Søndergaard, M.; Liboriussen, L.; Jeppesen, E. Implications of climate-enforced temperature increases on freshwater pico- and nanoplankton populations studied in artificial ponds during 16 months. Hydrobiologia 2006, 560, 259–266. [Google Scholar] [CrossRef]
  18. Özen, A.; Šorf, M.; Trochine, C.; Liboriussen, L.; Beklioglu, M.; Søndergaard, M.; Lauridsen, T.L.; Johansson, L.S.; Jeppesen, E. Long-term effects of warming and nutrients on microbes and other plankton in mesocosms. Freshw. Biol. 2013, 58, 483–493. [Google Scholar] [CrossRef]
  19. Winder, M.; Schindler, D.E. Climatic effects on the phenology of lake processes. Glob. Chang. Biol. 2004, 10, 1844–1856. [Google Scholar] [CrossRef]
  20. Brucet, S.; Boix, D.; Quintana, X.D.; Jensen, E.; Nathansen, L.W.; Trochine, C.; Meerhoff, M.; Gascón, S.; Jeppesen, E. Factors influencing zooplankton size structure at contrasting temperatures in coastal shallow lakes: Implications for effects of climate change. Limnol. Oceanogr. 2010, 55, 1697–1711. [Google Scholar] [CrossRef]
  21. Emmrich, M.; Brucet, S.; Ritterbusch, D.; Mehner, T. Size spectra of lake fish assemblages: Responses along gradients of general environmental factors and intensity of lake-use. Freshw. Biol. 2011, 56, 2316–2333. [Google Scholar] [CrossRef]
  22. Basset, A.; Barbone, E.; Borja, A.; Brucet, S.; Pinna, M.; Quintana, X.D.; Reizopoulou, S.; Rosati, I.; Simboura, N. A benthic macroinvertebrate size spectra index for implementing the Water Framework Directive in coastal lagoons in Mediterranean and Black Sea ecoregions. Ecol. Indic. 2012, 12, 72–83. [Google Scholar] [CrossRef]
  23. Schweiger, O.; Settele, J.; Kudrna, O.; Klotz, S.; Kühn, I. Climate change can cause spatial mismatch of trophically interacting species. Ecology 2008, 89, 3472–3479. [Google Scholar] [CrossRef] [PubMed]
  24. Meerhoff, M.; Teixeira-de Mello, F.; Kruk, C.; Alonso, C.; Gonzalez Bergonzoni, I.; Pacheco, J.P.; Lacerot, G.; Arim, M.; Beklioglu, M.; Balmana, S.B. Environmental warming in shallow lakes: A review of potential changes in community structure as evidenced from space-for-time substitution approaches. Adv. Ecol. Res. 2012, 46, 259–349. [Google Scholar]
  25. Jeppesen, E.; Mehner, T.; Winfield, I.J.; Kangur, K.; Sarvala, J.; Gerdeaux, D.; Rask, M.; Malmquist, H.J.; Holmgren, K.; Volta, P.; et al. Impacts of climate warming on the long-term dynamics of key fish species in 24 European lakes. Hydrobiologia 2012, 694, 1–39. [Google Scholar] [CrossRef] [Green Version]
  26. Teixeira de-Mello, F.; Meerhoff, M.; Pekcan-Hekim, Z.; Jeppesen, E. Substantial differences in littoral fish community structure and dynamics in subtropical and temperate shallow lakes. Freshw. Biol. 2009, 54, 1202–1215. [Google Scholar] [CrossRef]
  27. Gonzalez-Bergonzoni, I.; Meerhoff, M.; Davidson, T.A.; Teixeira-de Mello, F.; Baattrup-Pedersen, A.; Jeppesen, E. Meta-analysis shows a consistent and strong latitudinal pattern in fish omnivory across ecosystems. Ecosystems 2012, 15, 492–503. [Google Scholar] [CrossRef]
  28. Brucet, S.; Pedron, S.; Mehner, T.; Lauridsen, T.L.; Argillier, C.; Winfield, I.J.; Volta, P.; Emmrich, M.; Hesthagen, T.; Holmgren, K.; et al. Fish diversity in European lakes: Geographical predictors dominate over anthropogenic pressures. Freshw. Biol. 2013, 58, 1779–1793. [Google Scholar] [CrossRef]
  29. Jackson, D.A.; Mandrak, N.E. Changing fish biodiversity: Predicting the loss of cyprind biodiversity due to global climate change. In American Fisheries Society Symposium; American Fisheries Society: Bethesda, MD, USA, 2002; pp. 89–98. [Google Scholar]
  30. Balayla, D.; Lauridsen, T.L.; Søndergaard, M.; Jeppesen, E. Larger zooplankton in Danish lakes after cold winters: Are winter fish kills of importance? Hydrobiologia 2010, 646, 159–172. [Google Scholar] [CrossRef]
  31. Feuchtmayr, H.; Moran, R.; Hatton, K.; Connor, L.; Heyes, T.; Moss, B.; Harvey, I.; Atkinson, D. Global warming and eutrophication: Effects on water chemistry and autotrophic communities in experimental hypertrophic shallow lake mesocosms. J. Appl. Ecol. 2009, 46, 713–723. [Google Scholar] [CrossRef]
  32. Hsieh, C.H.; Sakai, Y.; Ban, S.; Ishikawa, K.; Ishikawa, T.; Ichise, S.; Yamamura, N.; Kumagai, M. Eutrophication and warming effects on long-term variation of zooplankton in Lake Biwa. Biogeosciences 2011, 8, 1383–1399. [Google Scholar] [CrossRef]
  33. Jeppesen, E.; Jensen, J.P.; Søndergaard, M.; Lauridsen, T.L. Response of fish and plankton to nutrient loading reduction in eight shallow Danish lakes with special emphasis on seasonal dynamics. Freshw. Biol. 2005, 50, 1616–1627. [Google Scholar] [CrossRef]
  34. Romo, S.; Villena, M.J.; Sahuquillo, M.; Soria, J.M.; Gimenez, M.; Alfonso, T.; Miracle, M.R. Response of a shallow Mediterranean lake to nutrient diversion: Does it follow similar patterns as in northern shallow lakes? Freshw. Biol. 2005, 50, 1706–1717. [Google Scholar] [CrossRef]
  35. Straile, D.; Adrian, R. The North Atlantic Oscillation and plankton dynamics in two European lakes—Two variations on a general theme. Glob. Chang. Biol. 2000, 6, 663–670. [Google Scholar] [CrossRef]
  36. Lau, S.S.; Lane, S.N. Biological and chemical factors influencing shallow lake eutrophication: A long-term study. Sci. Tot. Environ. 2002, 288, 167–181. [Google Scholar] [CrossRef]
  37. Jeppesen, E.; Jensen, J.P.; Søndergaard, M.; Lauridsen, T.; Landkildehus, F. Trophic structure, species richness and biodiversity in Danish lakes: Changes along a phosphorus gradient. Freshw. Biol. 2000, 45, 201–218. [Google Scholar] [CrossRef]
  38. Persson, L.; Diehl, S.; Johansson, L.; Andersson, G.; Hamrin, S.F. Shifts in fish communities along the productivity gradient of temperate lakes—Patterns and the importance of size-structured interactions. J. Fish Biol. 1991, 38, 281–293. [Google Scholar] [CrossRef]
  39. Mackey, A.P.; Berrie, A.D. The prediction of water temperatures in chalk streams from air temperatures. Hydrobiologia. 1991, 210, 183–189. [Google Scholar] [CrossRef]
  40. Livingstone, D.M.; Lotter, A.F. The relationship between air and water temperatures in lakes of the Swiss Plateau: A case study with paleolimnological implications. J. Paleolimnol. 1998, 19, 181–198. [Google Scholar] [CrossRef]
  41. Jeppesen, E.; Søndergaard, M.; Jensen, J.P.; Mortensen, E.; Hansen, A.; Jørgensen, T. Cascading trophic interactions from fish to bacteria and nutrients after reduced sewage loading: An 18-year study of a shallow hypertrophic lake. Ecosystems 1998, 1, 250–267. [Google Scholar] [CrossRef]
  42. Murphy, J.; Riley, J. A modified single solution method for the determination of phosphate in natural waters. Anal. Chim. Acta 1962, 27, 31–36. [Google Scholar] [CrossRef]
  43. Koroleff, F. Determination of total phosphorus in natural waters by means of persulphate oxidation. Interlab. Rep. Cons. Int. Explor Mer. 1970, 3, 19–22. [Google Scholar]
  44. Solórzano, L.; Sharp, J.H. Determination of total dissolved phosphorus and particulate phosphorus in natural waters. Limnol. Oceanogr. 1980, 25, 754–758. [Google Scholar] [CrossRef]
  45. Jespersen, A.M.; Christoffersen, K. Measurements of chlorophyll a from phytoplankton using ethanol as extraction solvent. Arch. Hydrobiol. 1987, 109, 445–454. [Google Scholar]
  46. Ruttner-Kolisko, A. Suggestions for biomass calculations of plankton rotifers. Arch. Hydrobiol. Beih. Ergebn. Limnol. 1977, 8, 71–76. [Google Scholar]
  47. Koste, W. Rotatoria. Die RaÈdertiere Mitteleuropas; Borntraeger: Berlin, Germany, 1978; Volume 2, p. 234. [Google Scholar]
  48. Smirnov, N.N. Cladocera: The Chydorinae and Sayciinae (Chydoridae) of the World; SPB Academic Publishing: Amsterdam, The Netherlands, 1996. [Google Scholar]
  49. Ueda, H.; Reid, J.W. (Eds.) Copepoda: Cyclopoida. Genera Mesocyclops and Thermocyclops. Guides to the Identification of the Microinvertebrates of the Continental Waters of the World 20; Backhuys Publishers: Leiden, The Netherlands, 2003.
  50. Bottrell, H.H.; Duncan, A.; Gliwicz, Z.M.; Grygierek, E.; Herzig, A.; Hillbricht-Ilkows, A. A review of some problems in zooplankton production studies. Norw. J. Zool. 1976, 24, 419–456. [Google Scholar]
  51. Culver, D.A.; Bouchete, M.M.; Bean, D.J.; Fletcher, J.W. Biomass of freshwater crustacean zooplankton from length-weight regressions. Can. J. Fish. Aquat. Sci. 1985, 42, 1380–1390. [Google Scholar] [CrossRef]
  52. Shannon, C.E.; Weaver, W. The Mathematical Theory of Communication; University of Illinois Press: Urbana, IL, USA, 1964. [Google Scholar]
  53. Hadfield, J.D. MCMC methods for Multi-response Generalised Linear Mixed Models: The MCMCglmm R Package. J. Stat. Softw. 2010, 33, 1–22. [Google Scholar] [CrossRef]
  54. Jackman, S. pscl: Classes and Methods for R Developed in the Political Science Computational Laboratory, Stanford University; R Package Version 1.4.9; Department of Political Science, Stanford University: Stanford, CA, USA, 2015. [Google Scholar]
  55. Ter Braak, C.J.F.; Smilauer, P. Canoco for Windows Version 4.5; Centre for Biometry Wageningen: Wageningen, The Netherlands, 2002. [Google Scholar]
  56. Phillips, G.; Kelly, A.; Pitt, J.A.; Sanderson, R.; Taylor, E. The recovery of a very shallow eutrophic lake, 20 years after the control of effluent derived phosphorus. Freshw. Biol. 2005, 50, 1628–1638. [Google Scholar] [CrossRef]
  57. Mehner, T.; Benndorf, J.; Kasprzak, P.; Koschel, R. Biomanipulation of lake ecosystems: Successful applications and expanding complexity in the underlying science. Freshw. Biol. 2002, 4, 2453–2465. [Google Scholar] [CrossRef]
  58. Molinero, J.C.; Anneville, O.; Souissi, S.; Balvay, G.; Gerdeaux, D. Anthropogenic and climate forcing on the long-term changes of planktonic rotifers in Lake Geneva, Europe. J. Plankton Res. 2006, 28, 287–296. [Google Scholar] [CrossRef]
  59. Seebens, H.; Straile, D.; Hoegg, R.; Stich, H.B.; Einsle, U. Population dynamics of a freshwater calanoid copepod: Complex responses to changes in trophic status and climate variability. Limnol. Oceanogr. 2007, 52, 2364–2372. [Google Scholar] [CrossRef]
  60. Brooks, J.L.; Dodson, S.I. Predation, body size and composition of the plankton. Science 1965, 150, 28–35. [Google Scholar] [CrossRef] [PubMed]
  61. Emmrich, M.; Pédron, S.; Brucet, S.; Winfield, I.J.; Jeppesen, E.; Volta, P.; Argillier, C.; Lauridsen, T.L.; Holmgren, K.; Hesthagen, H.; et al. Geographical patterns of size structure of European lake fish communities along abiotic and biotic gradients. J. Biogeogr. 2014, 41, 2221–2233. [Google Scholar] [CrossRef] [Green Version]
  62. Šorf, M.; Davidson, T.A.; Brucet, S.; Menezes, R.F.; Søndergaard, M.; Lauridsen, T.L.F.; Liboriussen, L.; Jeppesen, E. Zooplankton response to climate warming: A mesocosm experiment at contrasting temperatures and nutrient levels. Hydrobiologia 2015, 742, 185–203. [Google Scholar] [CrossRef]
  63. Havens, K.E.; Elia, A.C.; Taticchi, M.I.; Fulton, R.S. Zooplankton–phytoplankton relationships in shallow subtropical versus temperate lakes Apopka (Florida, USA) and Trasimeno (Umbria, Italy). Hydrobiologia 2009, 628, 165–175. [Google Scholar] [CrossRef]
  64. Eckert, B.; Walz, N. Zooplankton succession and thermal stratification in the polymictic shallow Müggelsee (Berlin, Germany): A case for the intermediate disturbance hypothesis? Hydrobiologia 1998, 337, 199–206. [Google Scholar] [CrossRef]
  65. Pieczyńska, E.; Kołodziejczyk, A.; Rybak, J.I. The responses of littoral invertebrates to eutrophication-linked changes in plant communities. Hydrobiologia 1998, 391, 9–21. [Google Scholar] [CrossRef]
  66. Rolighed, J.; Trolle, D.; Søndergaard, M.; Bjerring, R.; Janse, J.H.; Mooij, W.M.; Jeppesen, E. Climate change makes recovery from eutrophication more difficult—A PCLake model study of shallow Danish Lake Søbygaard. 2016; submitted. [Google Scholar]
  67. Fryer, G. Evolution and adaptive radiation in the Chydoridae (Crustacea: Cladocera): A study in comparative functional morphology and ecology. Philos. Trans. R. Soc. Lond. B Biol. Sci. 1968, 254, 221–384. [Google Scholar] [CrossRef]
  68. Lehtiniemi, M.; Hakala, T.; Saesmaa, S.; Viitasalo, M. Prey selection by the larvae of three species of littoral fishes on natural zooplankton assemblages. Aquat. Ecol. 2007, 41, 85–94. [Google Scholar] [CrossRef]
  69. Mahjoub, M.S.; Souissi, S.; Michalec, F.G.; Schmitt, F.G.; Hwang, J.S. Swimming kinematics of Eurytemora affinis (Copepoda, Calanoida) reproductive stages and differential vulnerability to predation of larval Dicentrarchus labrax (Teleostei, Perciformes). J. Plankton Res. 2011. [Google Scholar] [CrossRef]
  70. Kratina, P.; Greig, H.S.; Thompson, P.L.; Carvalho-Pereira, T.S.; Shurin, J.B. Warming modifies trophic cascades and eutrophication in experimental freshwater communities. Ecology 2012, 93, 1421–1430. [Google Scholar] [CrossRef] [PubMed]
  71. O’Connor, M.I.; Piehler, M.F.; Leech, D.M.; Anton, A.; Bruno, J.F. Warming and resource availability shift food web structure and metabolism. PLoS Biol. 2009, 7, e1000178. [Google Scholar]
  72. Shurin, J.B. Interactive effects of predation and dispersal on zooplankton communities. Ecology 2001, 82, 3404–3416. [Google Scholar] [CrossRef]
  73. Organisation for Economic Co-Operation and Development (OECD). Eutrophication of Waters. Monitoring, Assessment and Control; OECD: Paris, France, 1982. [Google Scholar]
Figure 1. Mean values of air temperature (in °C) in the period April–July (a) and in April (b) in the Lake Søbygaard region during the 23 years of study (1990–2012).
Water 08 00341 g001
Figure 2. Temporal trend of CPUE in kg/net (a) and fish size (b) when pooling together the abundance of roach (Rutilus rutilus), bream (Abramis brama) and rudd (Scardinius erythropthalmus) in the Lake Søbygaard region during the 23 years of study (1990–2012).
Water 08 00341 g002
Figure 3. Temporal trend of small (<10 cm) (a) and large (>25 cm) (b) fish in the Lake Søbygaard region during the 23 years of study (1990–2012).
Water 08 00341 g003
Figure 4. Relative abundance of rotifers for the period 1990–2012 in Lake Søbygaard. Averages for the spring–summer period are used for calculation of proportions. Only species accounting for more than 3% of total abundance are shown.
Water 08 00341 g004
Figure 5. Temporal variations in Bosmina spp., Daphnia spp., nauplii and adult Cyclopoidae in Lake Søbygaard region during the 23 years of study (1990–2012). Sinusoidal fit (grey) (a) and GLM (b) regression lines are shown.
Water 08 00341 g005
Figure 6. Interpolated mean annual (a) and summer (b) values of Daphnia:Bosmina, Copepod nauplii:(nau+cop+adults), copepod female:male, zooplankton:Chl-a, cladoceran:Chl-a, Chl-a:TP and Chl-a:TN ratios during 1990–2012 in Lake Søbygaard.
Water 08 00341 g006
Figure 7. First two axes of the RDA based on zooplankton species density. The ordination of samplings is indicated with open circles (a) and references of months and years are given (e.g., 7/05: July 2005). Species scores are indicated with grey arrows, and environmental variables with black arrows (a,b). Temp: water temperature; Kert.coch: Keratella cochlearis; Chyd.spha: Chydorus sphaericus; Gastr.sp: Gastropus sp.; Cylp.spp: Cyclopoidea spp.; Bosmn.spp: Bosmina spp.; Nauplii: nauplii; Pomp.sul: Pompholix sulcata; Kert.quad: Keratella quadrata; Polya.spp: Polyarthra spp.; Brac.ang: Brachionus angularis; Filn.term: Filinia terminalis; Alona.sp: Alona sp.; Noth.acum: Notholca acuminata; Colur.sp: Colurella sp.; Brac.urce: Brachinus urceolaris; Synch.spp: Synchaeta spp.; Daphn.spp: Daphnia spp.; Trich.spp: Trichocerca spp.; Brac.calc: Brachionus calyciflorus; Filn.long: Filinia longiseta; Conoc.sp: Conochilus sp.
Water 08 00341 g007
Figure 8. Temporal variations in Chl-a, TN and TP concentrations in Lake Søbygaard region during the 23 years of study (1990–2012): Sinusoidal fit (grey) (a) and GLM (b) regression lines are shown.
Water 08 00341 g008
Table 1. Zooplankton species account for 70% of the taxa difference across years and between the first (1990–2000) and second decade (2001–2012) in Lake Søbygaard. Results of PERMANOVA analysis (p < 0.0001 in both cases).
TaxaContribution %
among Yearsbetween Decades
CLADOCERA
Bosmina spp.16.1515.32
Daphnia spp.3.0833.083
COPEPODA
Cyclopoidae spp.7.277.196
Nauplii5.1535.161
ROTIFERA
Polyarthra spp.7.0656.862
Keratella cochlearis4.2164.167
Keratella quadrata3.2513.257
Pompholyx sulcata4.1434.056
Conochilus sp.3.4523.229
Brachionus calyciflorus2.4682.478
Rotatoria sp. 14.1084.623
Asplanchna spp.2.392.325
Table 2. Multiple GLMMs based on Markov chain Monte Carlo method showing the predictors for the changes in the abundance (ind. L−1) of Bosmina spp. and Daphnia spp. for the summer period. Estimated value, standard error (SE), p-value (ppscl), and log-likelihood.
EstimateSEppscllog-likelihood
Bosmina spp.
intercept731300.0063<0.001−27,270
large fish−0.00710.0000<0.001
Daphnia spp.
intercept447000.0443<0.001−1291
small fish−0.0005<0.0001<0.001
Chl-a0.00100.0002<0.001
Table 3. Multiple GLMMs based on Markov chain Monte Carlo method showing the predictors for chlorophyll-a concentrations (Chl-a) during the entire study period and the spring–summer period. The mean of the posterior distribution (post.mean), lower and upper 95% credible interval (l-95% CI and u-95% CI), the MCMC p-value (pMCMC) and deviance information criterion (DIC) are reported.
post.meanl-95% CIu-95% CIpMCMCDIC
Chl-a (all period)
intercept3.49273.02234.0609<0.0011479
Daphnia spp.−0.0015−0.0025−0.00030.004
TN0.00340.00190.0049<0.001
TP0.00750.00290.01250.004
Chl-a (spring-summer)
intercept3.65503.37073.9376<0.001958
Daphnia spp.−0.0014−0.0021−0.0007<0.001
TN0.00560.00390.0072<0.001
TP0.00660.00310.0094<0.001

