Article

Reconstruction of a Storm Map and New Approach in the Definition of Categories of the Extreme Rainfall, Northeastern Sicily

by
Francesco Fiorillo
1,*,
Nazzareno Diodato
2 and
Massimiliano Meo
3
1
Dipartimento di Scienze e Tecnologie, Università degli Studi del Sannio, via dei Mulini 59/A, Benevento 82100, Italy
2
Met European Research Observatory, HyMex Mediterranean Experiment Network—Via Monte Pino, Benevento 82100, Italy
3
CMG Testing S.r.l., Via Piano Alvanella, Monteforte Irpino, Avellino 83024, Italy
*
Author to whom correspondence should be addressed.
Water 2016, 8(8), 330; https://doi.org/10.3390/w8080330
Submission received: 16 June 2016 / Revised: 18 July 2016 / Accepted: 21 July 2016 / Published: 5 August 2016
(This article belongs to the Special Issue Urban Drainage and Urban Stormwater Management)

Abstract

:
After more than 350 mm of rainfall fell in a few hours on 22 November 2011, thousands of landslides and floods were induced in two main zones of Northeastern Sicily. The total rainfall has been reconstructed integrating available rain gauge data with Tropical Rainfall Measuring Mission (TRMM) satellite data from NASA (National Aeronautics and Space Administration); the landslide distribution in the field has confirmed the pattern of rainfall accumulated on 22 November 2011. Precipitation maxima of 1, 3, 6, 12, and 24 h was recognized as the hazardous events, which marks the evidence of a changing climate, with a shift toward more intense rainfalls in recent times. To investigate the sequence of the annual maxima, the historical time series have been transformed in the Standard normal distribution, from the cumulative probability of the GEV (Generalized Extreme Value) distribution. Following a similar definition of the Standard Precipitation Index (SPI), the transformation of the historical data in the standardized values allows the definition of categories of hourly maxima in term of extreme, severe, moderate, or mild. This transformation allows to eliminate the asymmetry of the time series, so that trends and fluctuations have been highlighted by the progressive accumulation of data (Rescaled Adjust Partial Sum). This statistical approach allows the improvement of the interpretability of the hydrological extreme events, and could also be used in other cases.

Graphical Abstract

1. Introduction

Despite hydroclimate millennia reconstruction not supporting a general unprecedented intensification of the Northern Hemisphere hydrological cycle in the twentieth century associated with both more extreme wet and dry conditions [1], rainstorms and their injuries are becoming more dangerous as population and infrastructure continue to increase and to occupy areas exposed to flood risk [2,3]. However, few literature sources are available worldwide regarding extreme precipitation and, especially, about rainstorm effects on regional and subregional terrestrial ecosystems and water resources [4,5,6,7]. This also poses another question related to the development of dynamic hydrological models, hampered by incomplete understanding of spatially-varying processes and the lack of adequate datasets to spatially characterize varying rain inputs. According to [8], secular and more records of historical precipitation data are required to deal with long-term studies and cross-site comparisons. This is especially so in the Mediterranean region, where human pressure and erratic rainstorm patterns with marked inter-annual variability expose landforms to exacerbated, damaging hydrological processes [9,10,11,12]. This is also so to spur the emergence of new hazards, such as coastal and urban flooding [13,14]. Mediterranean rainstorms and cyclones tend to be characterized by short life cycles, with average radii ranging from 300 to 500 km (after [15]), many of which are a combination of both frontal and convective storms. Heavy flooding and storms occurring at Mediterranean sites were found to be characterized by a complex property, known as multifractality, which is the spatial distribution organized into clusters of high-rainfall localized cells embedded within a larger cloud system or clusters of lower intensity [16].
Sicily has been hit recently by intense rainstorms, which caused floods and landslides in many places. Particularly affected by recent and intense storms has been the northwestern sector, where a high and continuous ridge, the Peloritani Mountains, extends between the Ionian and Tyrrhenian seas. During recent years, the most catastrophic event occurred on 1 October 2009 along the Ionian side, with more than 200 mm recorded in a few hours, and hit the village of Giampilieri, where landslides caused 36 deaths [17,18]. After 13 November 1855, the event of 2009 was the most catastrophic to have occurred in the Messina province, and follows other catastrophic events that have occurred recently. In particular, on 25 October 2007 an intense rainstorm induced many landslides and floods along the Ionian coast [19,20].
The storm of 22 November 2011 hit a wide area the Tyrrhenian sector of the Peloritani mountains, and caused three deaths in Saponara village (Figure 1). It induces thousands of shallow landslides in two distinct, wide areas (Figure 2), one located in the middle catchment of the Saponara torrent, and the other across both the catchments of Mela and Longano torrents. Huge alluvial phenomena occurred in the urban area of Barcellona Pozzo di Gotto and Milazzo. Recent landslides and flash floods hit the same area on 11 December 2008, 2 November 2010, and 10 October 2015.
In this study we estimate the rainfall that fell on 22 November 2011 by the rain gauge data available, integrated with satellite data; the time of the landslide occurrences has helped in an attempt to define the main features of the storm.
The historical time series of the annual maxima of rainfall, for different time duration, have been analyzed to estimate the frequency of extreme rainfall events and to highlight trend and fluctuations.

2. Materials and Methods

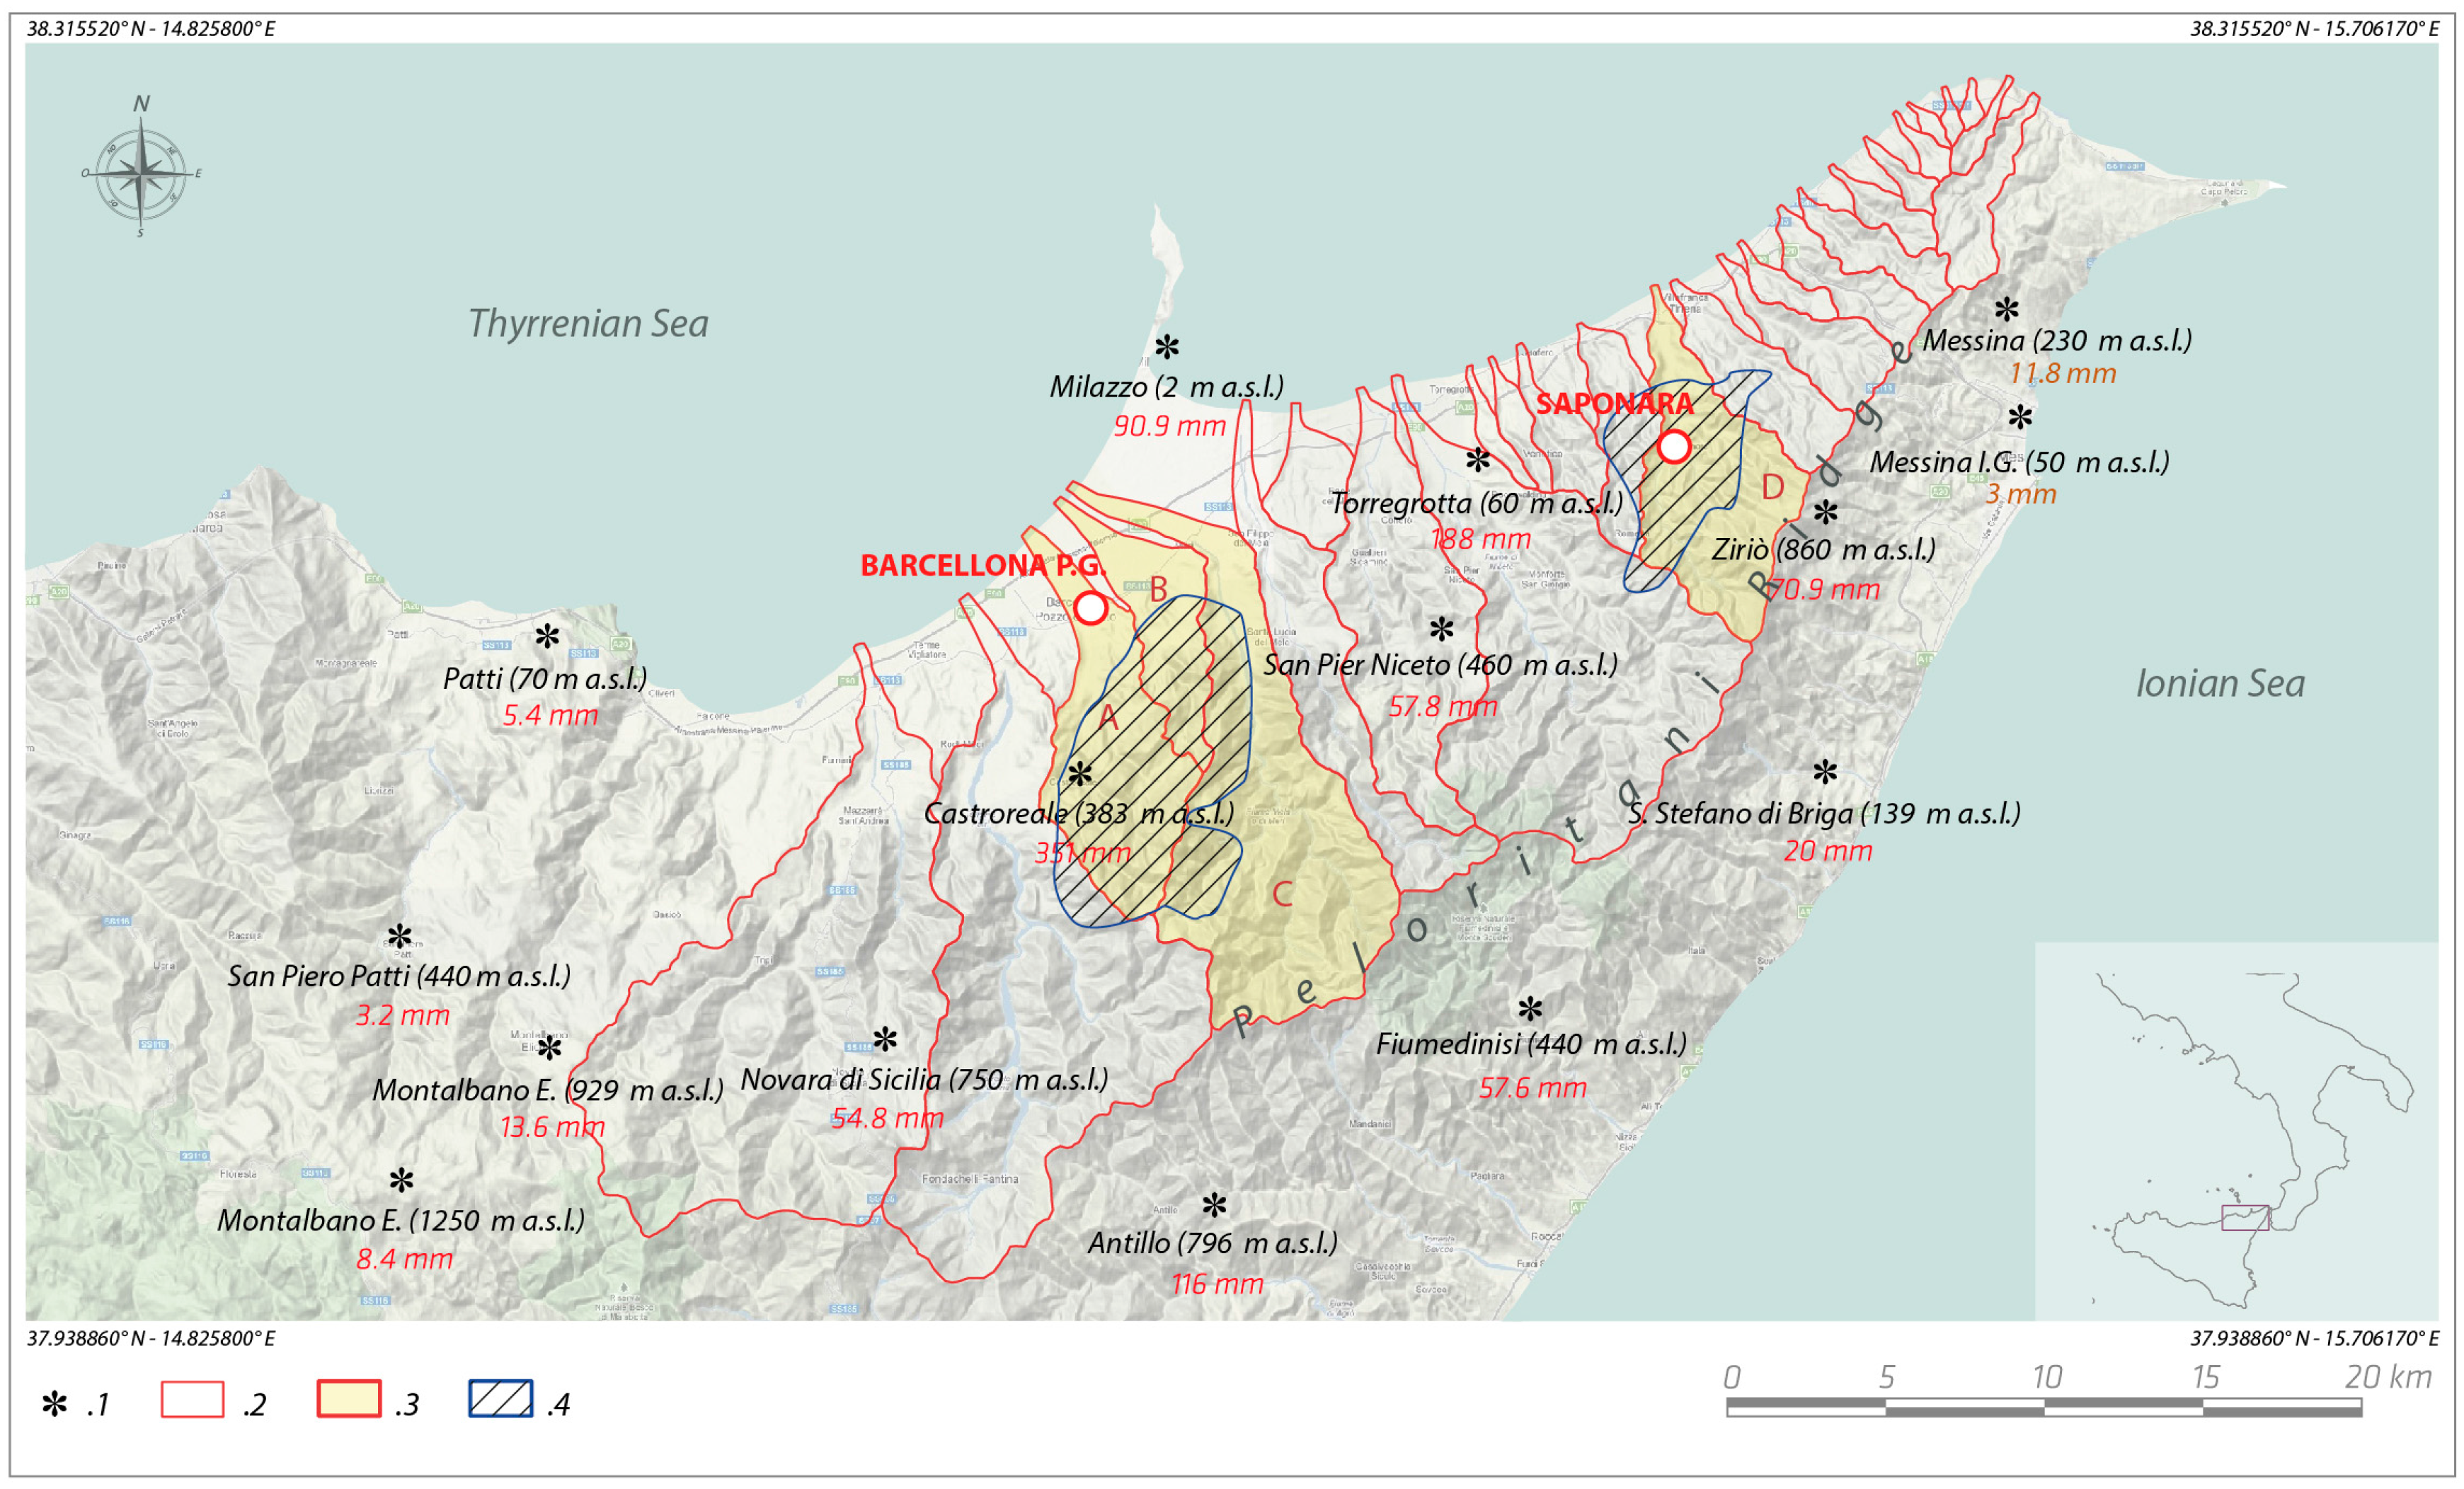
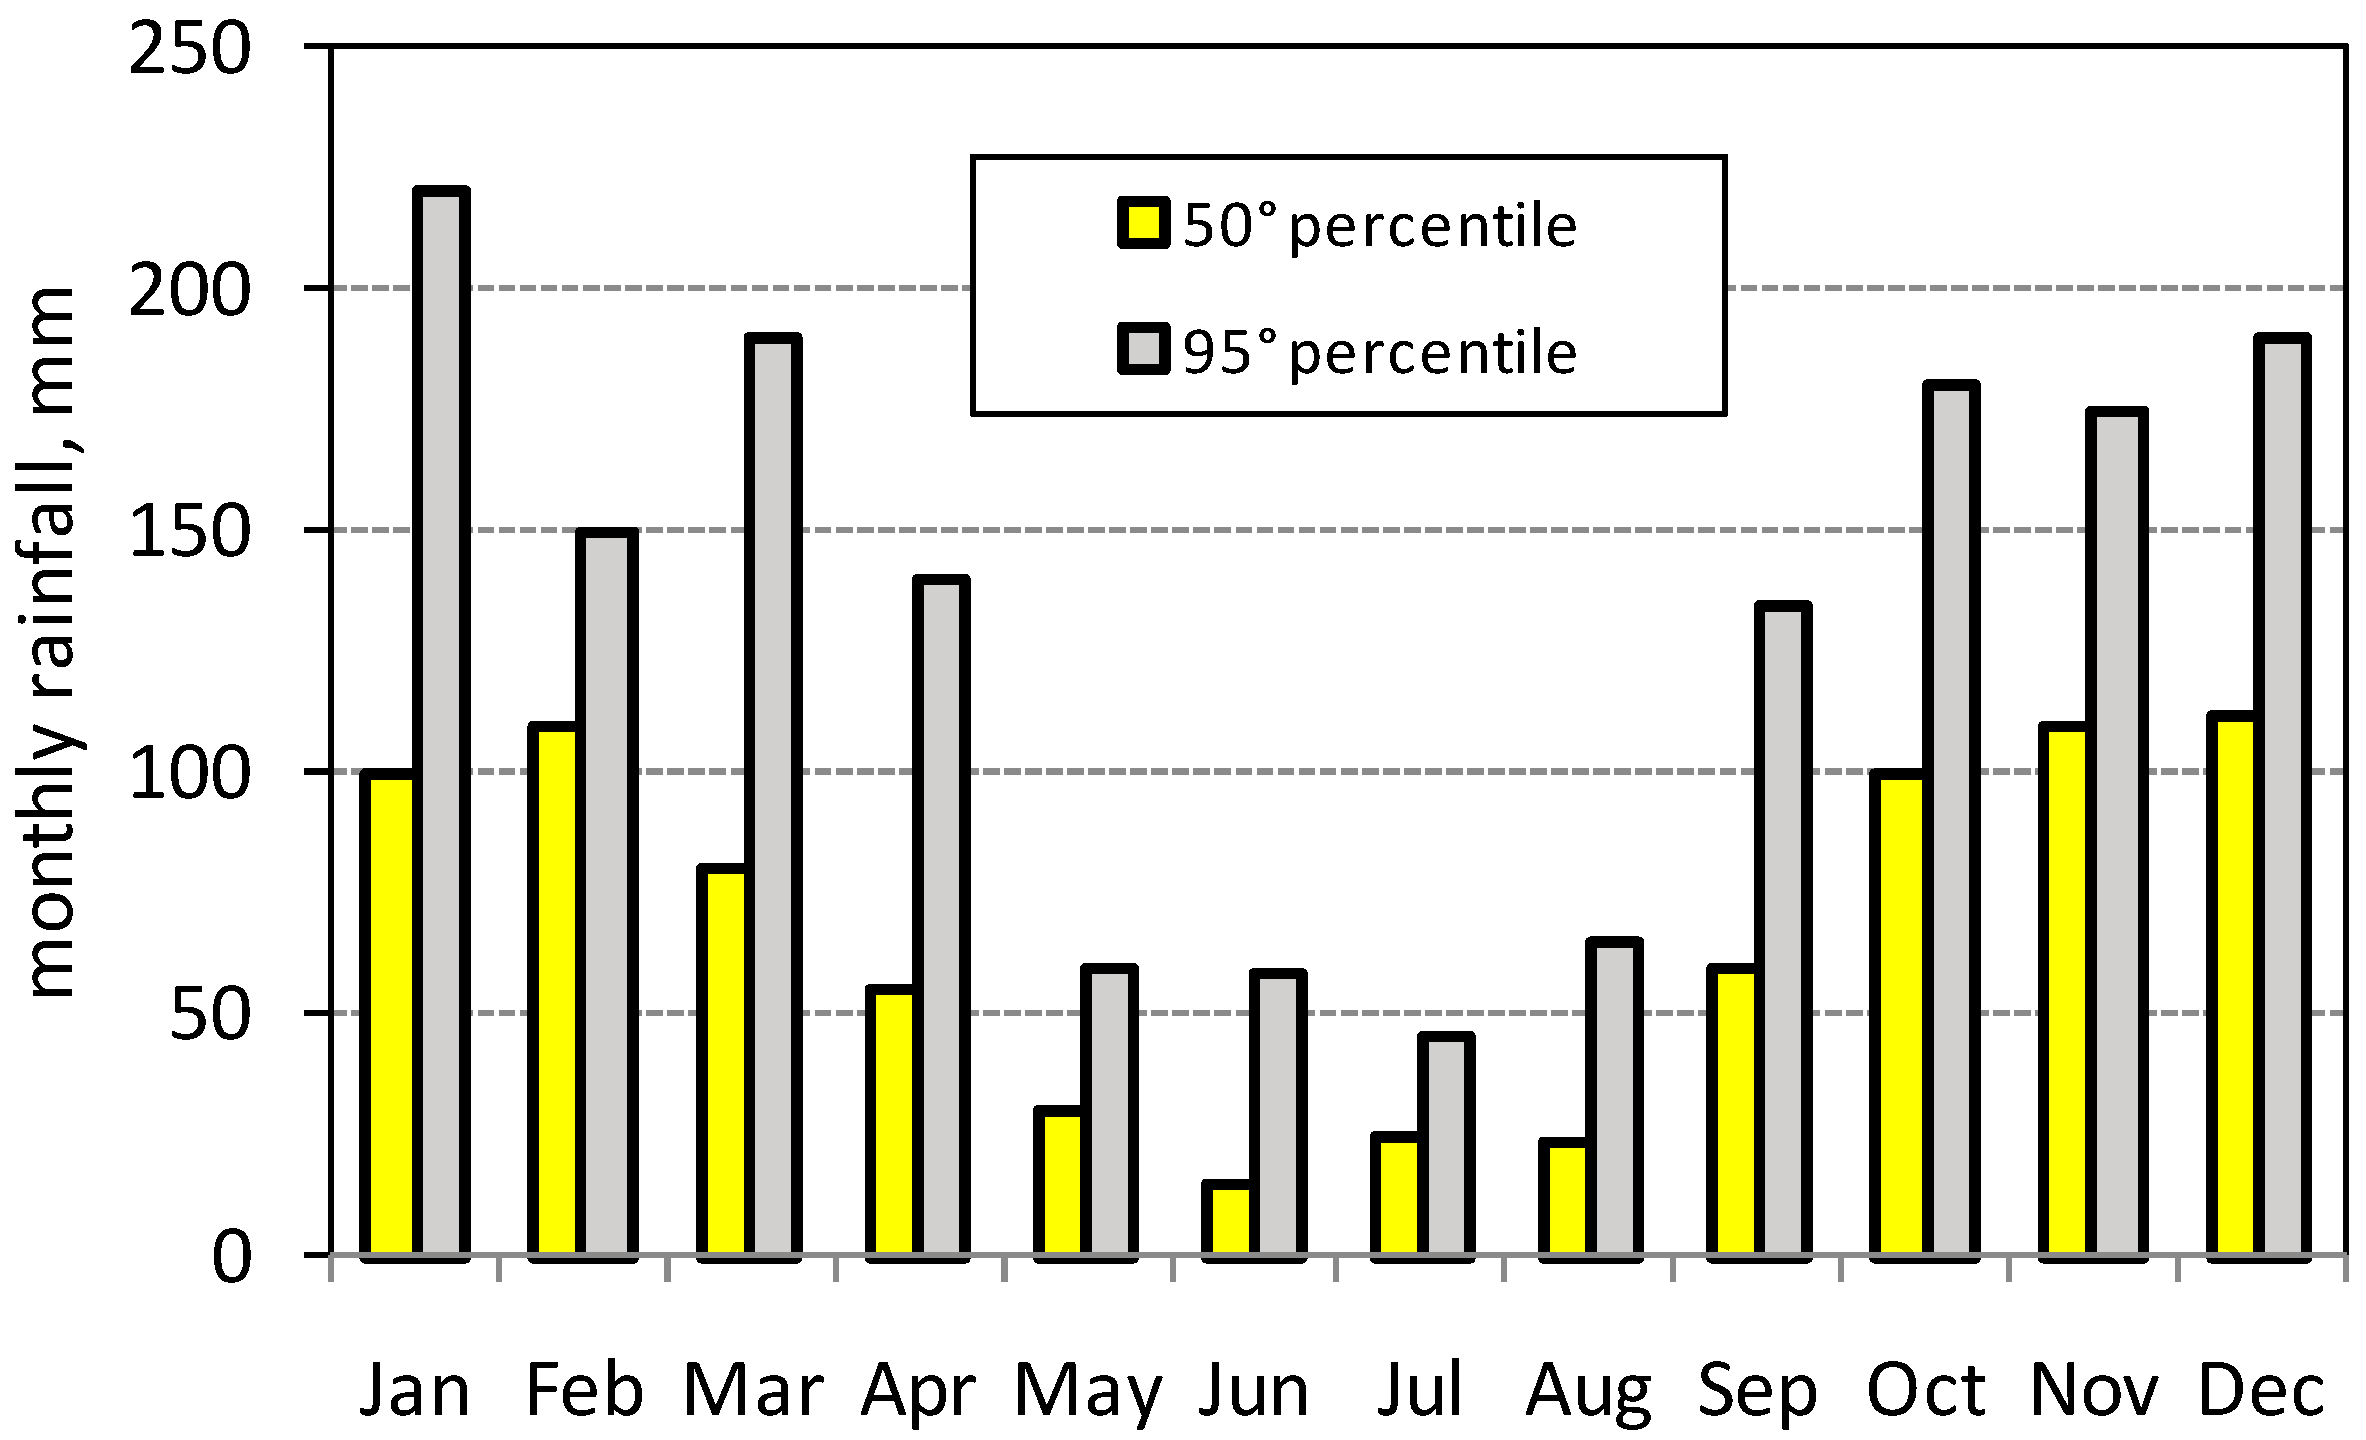
2.1. Main Physical and Geomorphological Characteristics of the Area Hit by the Storm

Due to its climate, affected by long, dry periods followed by heavy rainstorms, the Mediterranean region is particularly prone to multiple damaging hydrological events (MDHE; [21]) since it is characterized by high land vulnerability and poor vegetation coverage. From this point of view, Sicily is one the recognized areas particularly sensitive to changes in extreme precipitation events and currently threatened by flash-floods. The climate of Sicily, described in detail by [22], is the typical Mediterranean climate (Köppen’s Csa type), with rainy winters and long, dry periods in summer. In Sicily, remarkable differences can be recognized between the southwestern portion, characterized by dry sub-humid to semi-arid conditions, and the northeastern portion, where sub-humid/humid conditions prevail. The average annual temperatures range between 11 °C and 20 °C, with summer maxima higher than 40 °C, while rainfalls, mainly concentrated in autumn and winter (Figure 3), show mean annual values ranging from 385 mm up to 1200 mm and more.
The 22 November 2011 storm hit a wide area along the northern sector of the Peloritani Mountains, between Barcellona Pozzo di Gotto and Saponara villages. The main floods occurred in the Longano, Idria, Mela, and Saponara catchments (Figure 2), associated to diffuse landslide phenomena; however, other minor catchments were also affected by flash-floods and landslides, and the entire area of the Milazzo plain was affected by generalized flood phenomena.
The area hit by the storm extends between the Tyrrhenian sea and water divide of the Peloritani Mountains. The coastal sector is characterized by a wide flat area, constituted by recent (Quaternary) alluvial and marine deposits, with ground elevation up to a few tens of meters above sea level (a.s.l.), and includes the Milazzo plain. Inland, ground elevation rapidly increases and substratum outcrops; here the slope angle can be higher than 45°, and characterizes the steep slopes of the Peloritani mountains.
Following the recent geological map of Italy [23], scale 1:50,000 (Map n. 600 “Barcellona Pozzo di Gotto” and Map n. 601 “Messina and Reggio Calabria”), the substratum belongs to a metamorphic complex of Paleozoic age, and to marine sedimentary complexes of Tertiary age (Flysch di Capo d’Orlando and Argille scagliose), both involved in Tertiary tectonic activity of the Apennine chain. Marine sinorogenetic deposits of Miocene (Formation of San Pier Niceto) and Pliocene-Pleistocene (Formation of Rometta) lie on the older terrains, and outcrop between the coastal and inland sectors.
A complex of normal faults have caused the general uplift of the area during the Pliocene and Pleistocene; marine deposits of the lower Pleistocene actually lie at 560 m a.s.l. (Rometta village), testifying the high uplift rate during the Quaternary. As a consequence, the hydrographic network is cached in the substratum, and determines steep and unstable slopes.
A diffuse soil mantle covers the slopes, constituted by colluvial and eluvial deposits originated from the weathering and erosion of the substratum; this soil mantle constitutes the main material involved in the landslide processes.

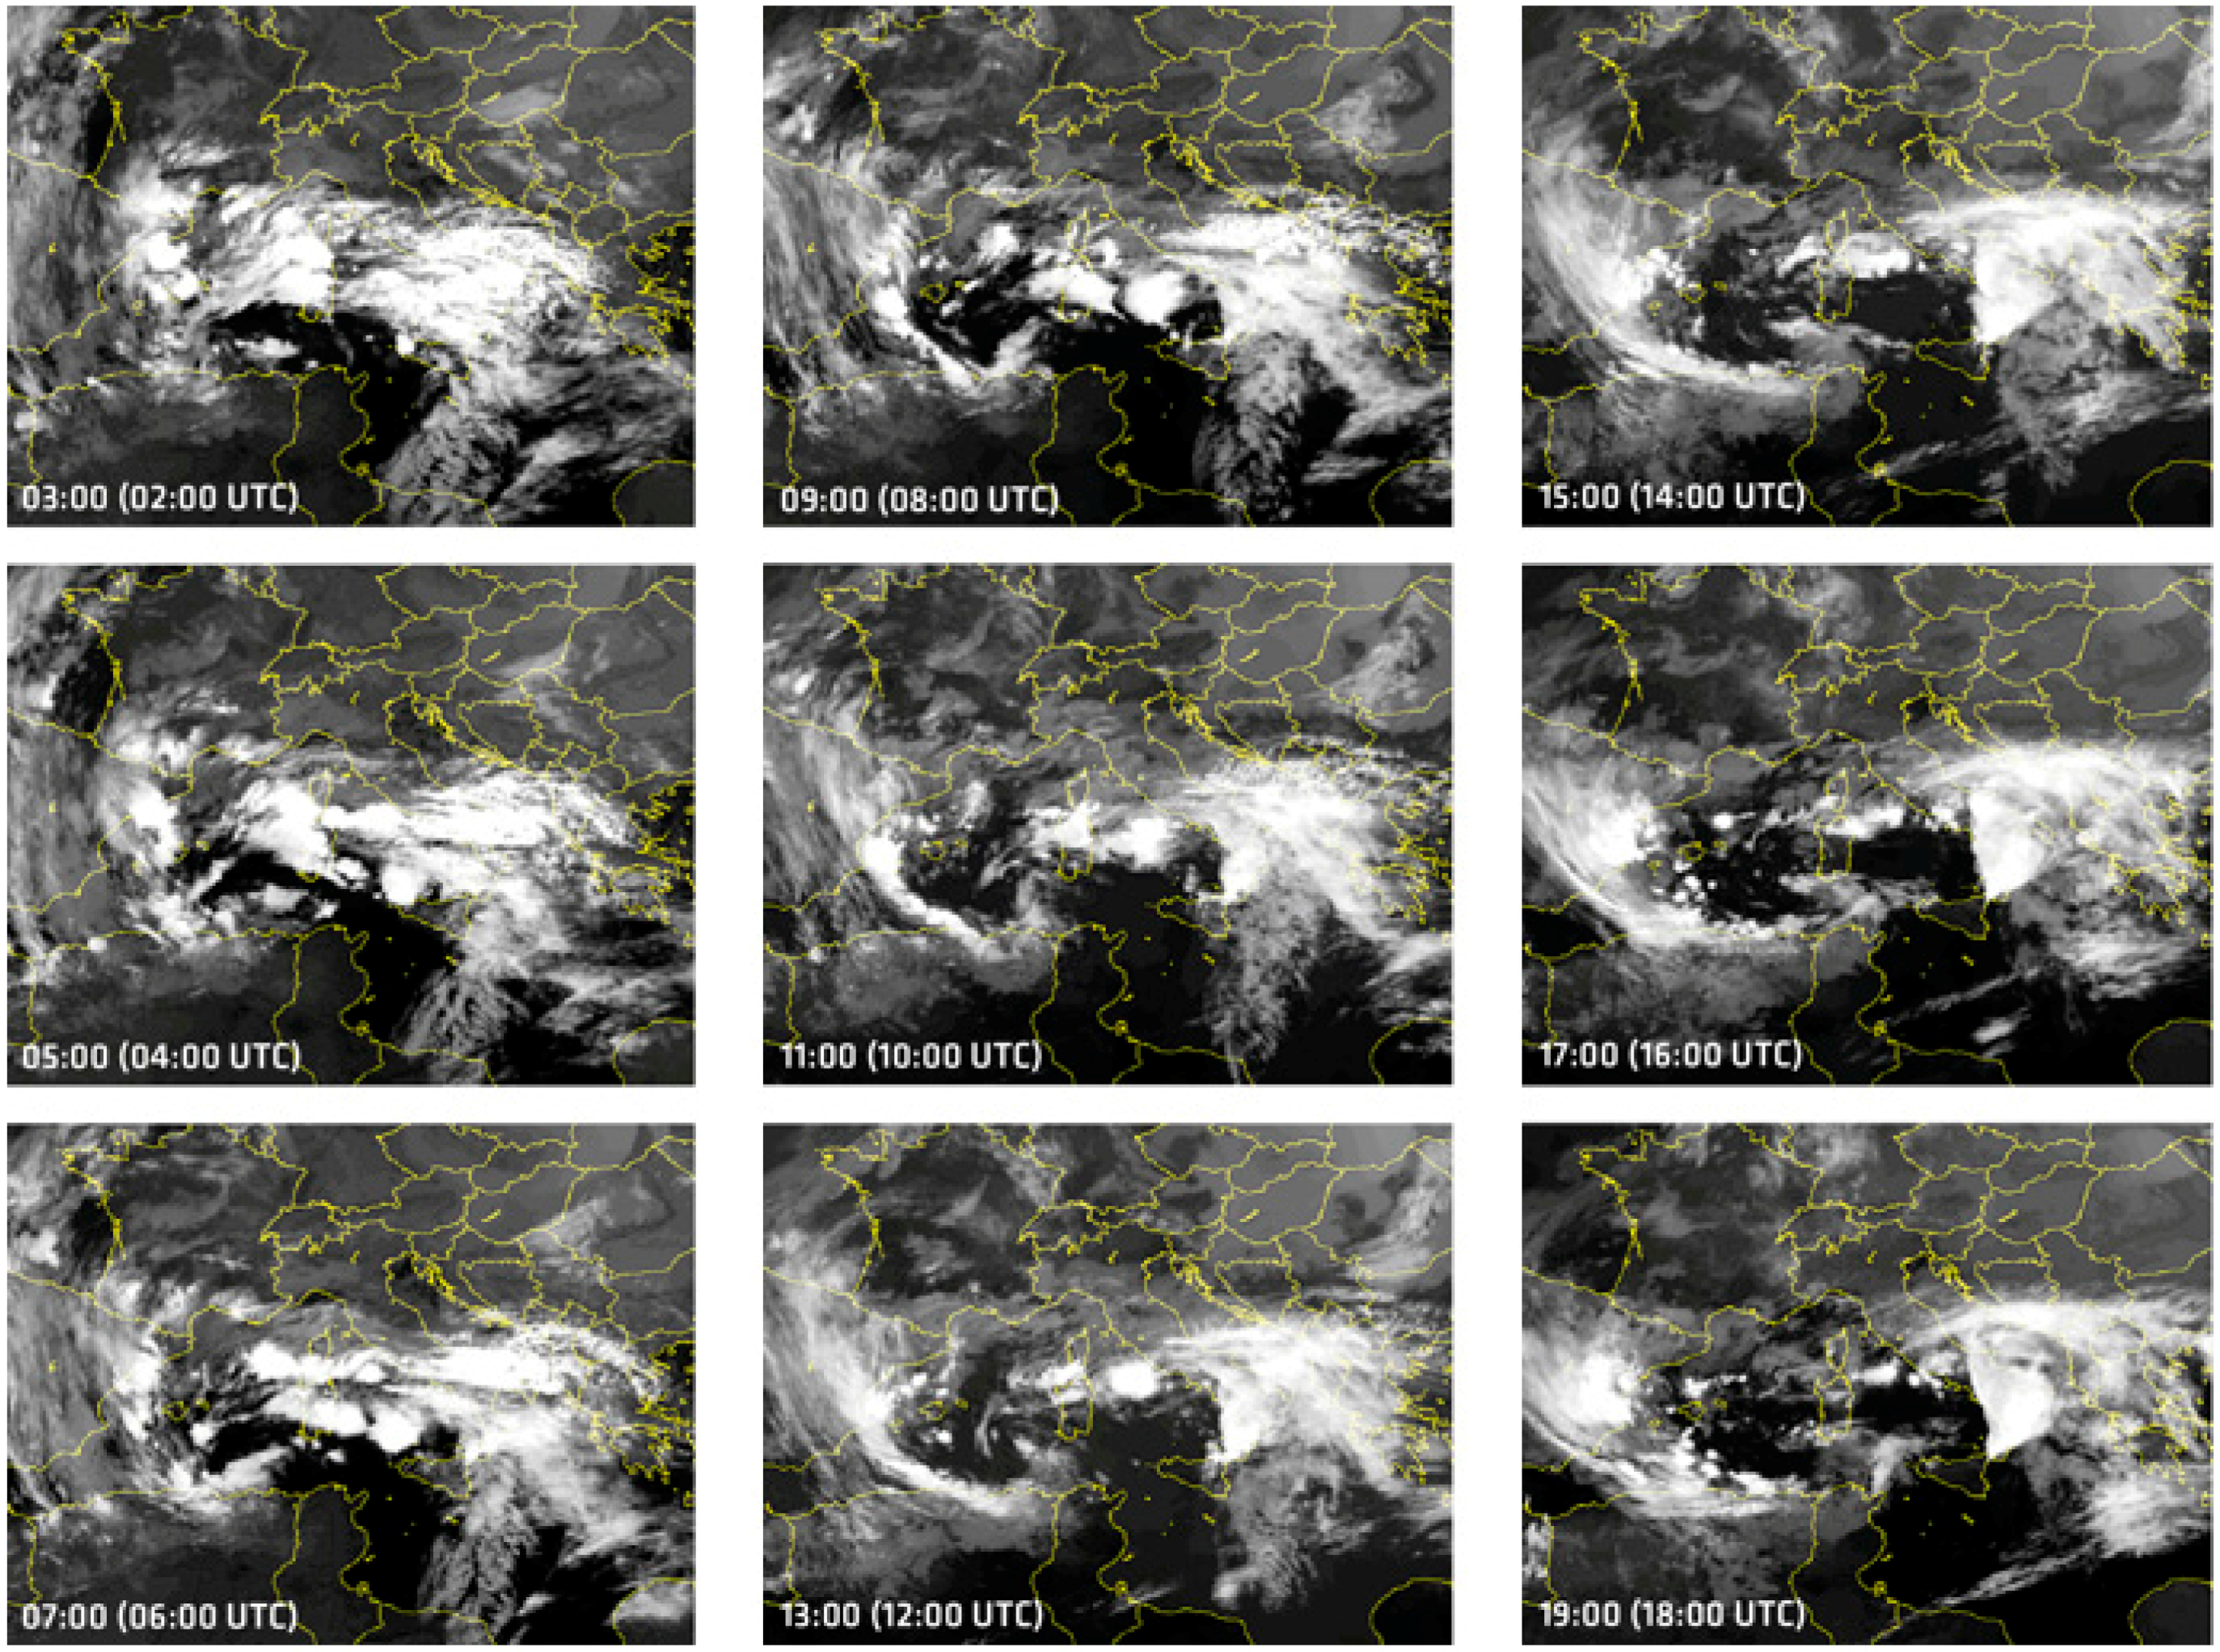
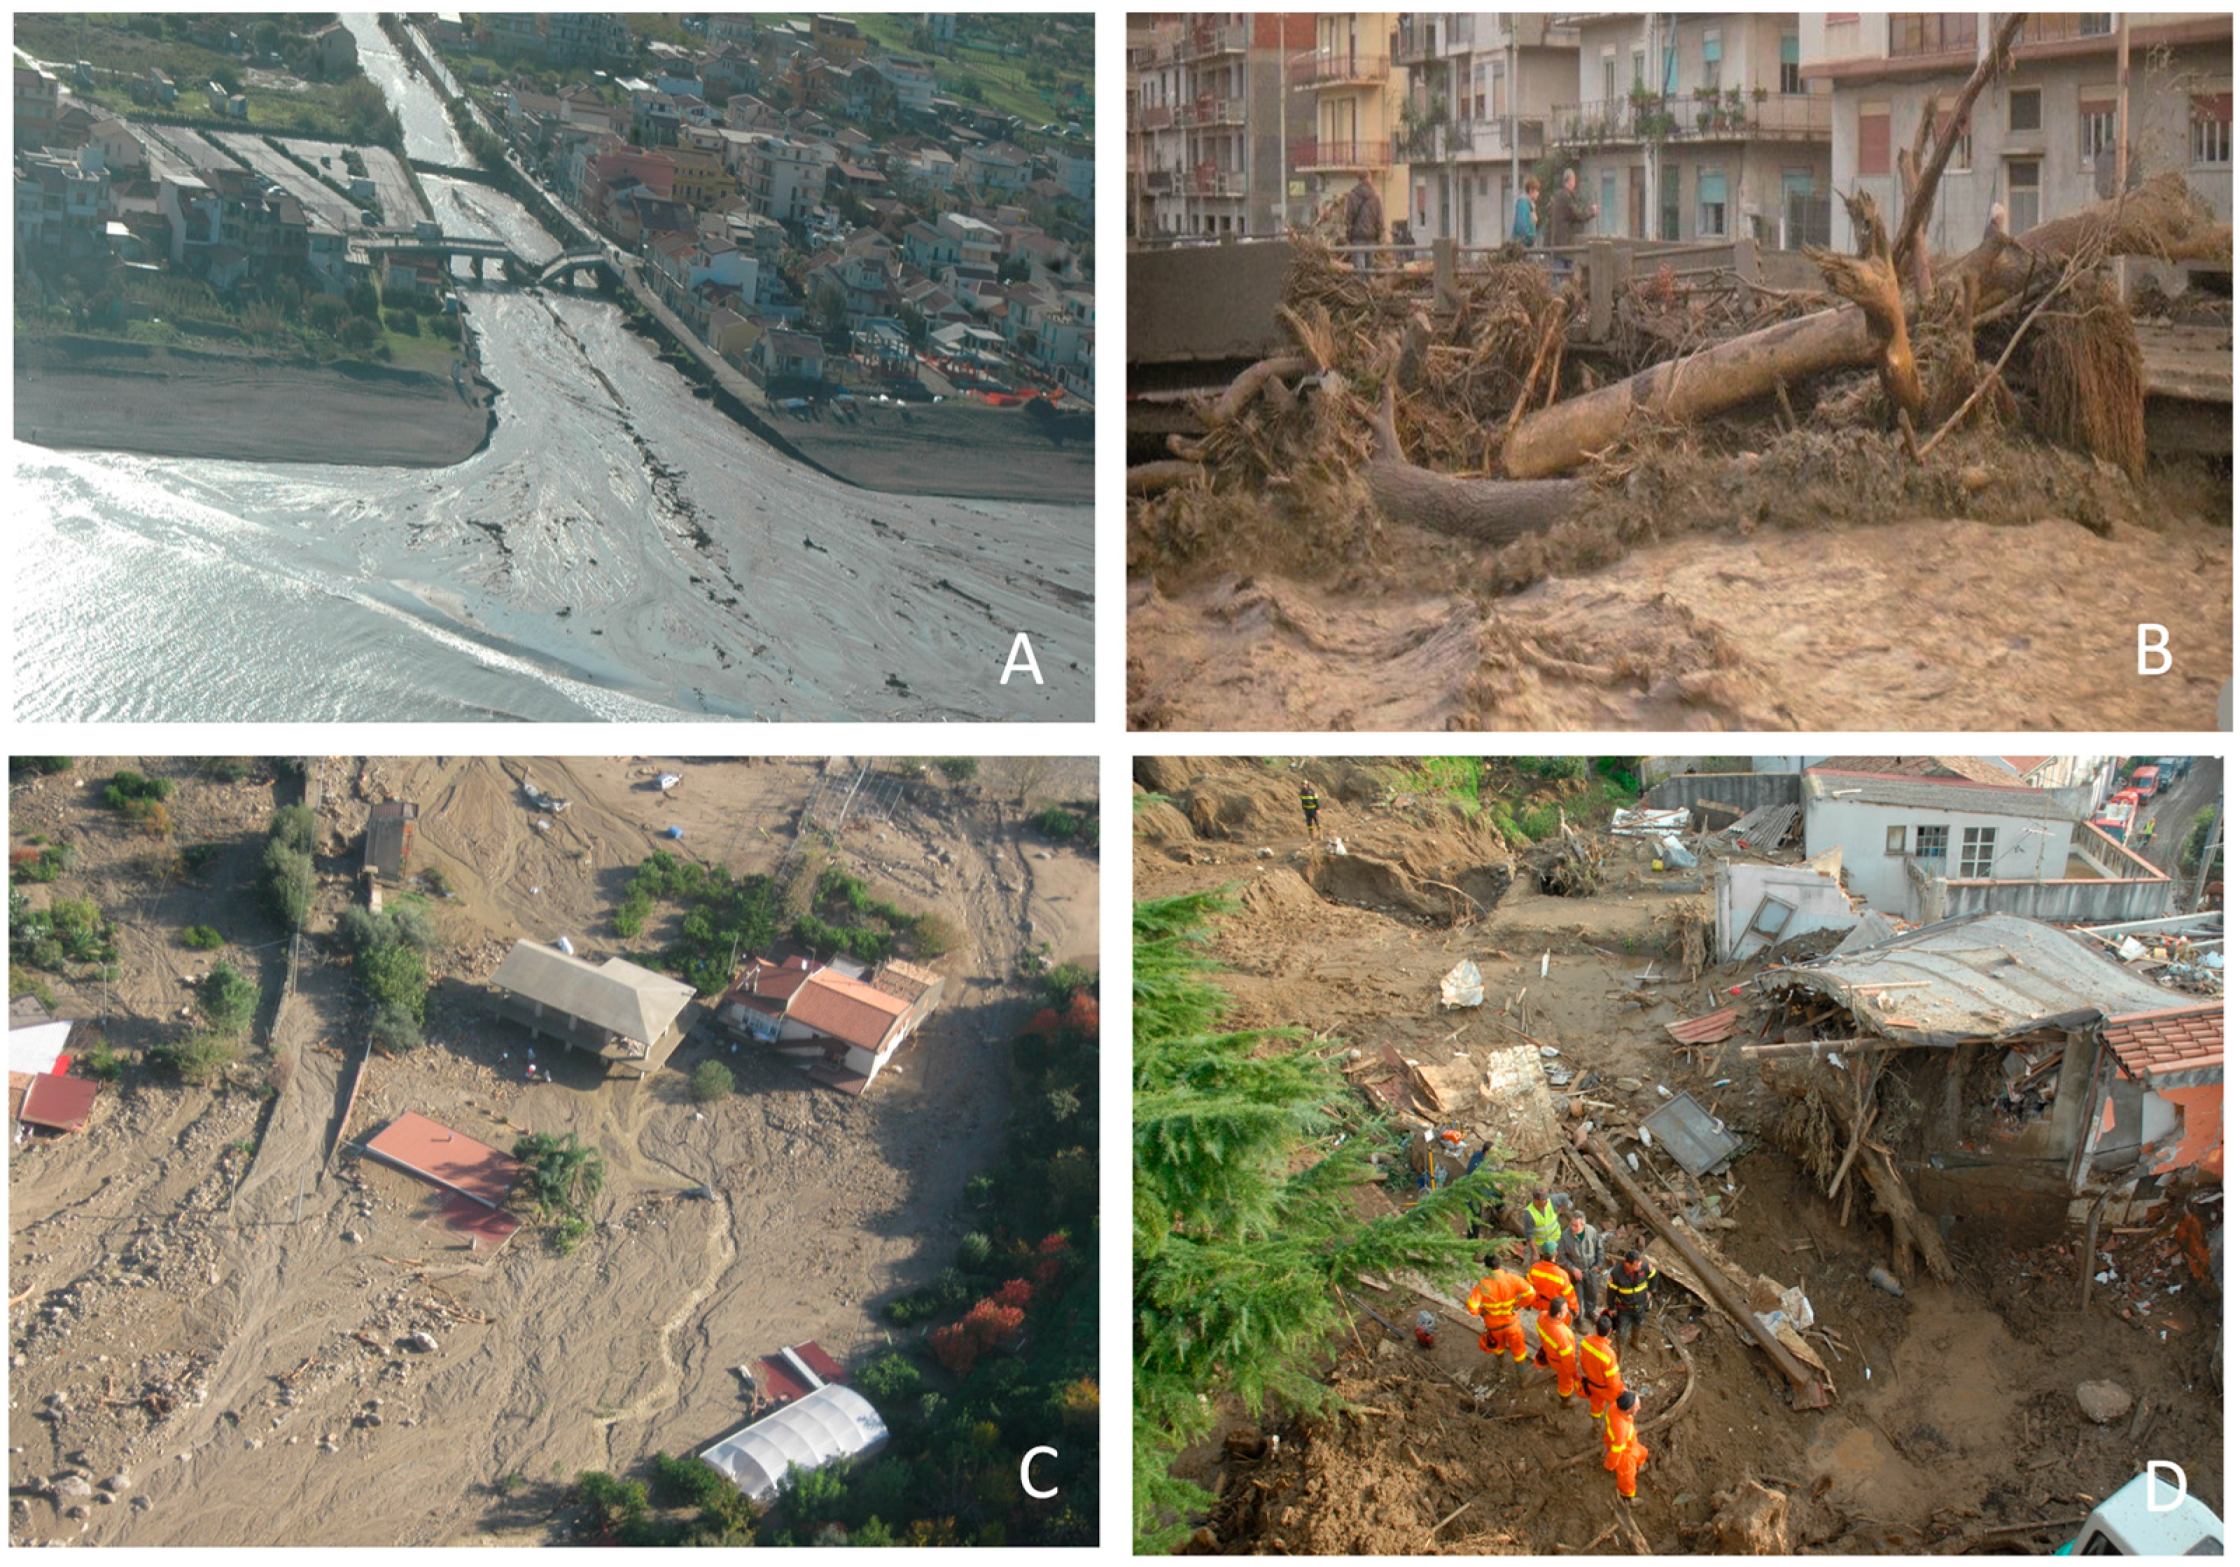
2.2. Main Features of the 22 November 2011 Storm

The meteorological conditions leading to 22 November 2011 storm were connected to an anomalous barometric gradient occurring between the northern side (Tyrrenian basin) and southwestern side (Ionian sea) of the Peloritani Mountains, inducing high-speed sirocco winds. These winds generally cause intense rainfall on the Ionian side of the Peloritani Mountains, where the highest accumulated rainfalls were expected the day before the storm. However, due to the very high intensity of winds during 22 November 2011, the rainfall accumulated mainly on the other side of the Peloritani water divide, causing unexpected landslides and flash floods along the Tyrrhenian side of the Peloritani Mountains. This storm behavior is known locally as the “Alcantara effect”, because the wind from the south rises along the valley between Etna volcano and Peloritani Mountains and crosses the watershed of Peloritani thanks also to strong winds in altitude [24].
The storm few hours later reached the Southern Calabria, inducing further landsides and flash floods; a train derailed near Lamezia Terme, fortunately without further deaths.
Figure 4 shows the development of the atmospheric disturbance from satellite, where, from 6:00, a plume begins to develop, with its vertex on Northeastern Sicily and it spreads to the southern part of the Italian peninsula. The storm has a typical enhanced-V shape from the satellite images.
Figure 2 shows the rain gauge network available during the storm and Table 1 the rainfall accumulated. The highest rainfall was recorded at Castroreale where 351 mm were recorded; with the exception of Torregrotta, with 188.8 mm, the other rain gauges recorded lower rainfall, especially for those located along the Ionian side of the Peloritani Mountains. In Messina town, only a few millimeters of rainfall were recorded. However, the distribution of accumulated rainfall of Figure 5 cannot explain the diffuse landslide phenomena and flash floods occurred in the Saponara catchment, but only that of Longano, Idria, and Mela catchments (cf. Figure 2). This is due to low rain gauge density distribution, which is unable to record the areal peaks distribution of the rainfall, connected to storm development (Figure 4). Additionally, in the area of Saponara, landslides developed during the afternoon of 22 November 2011, several hours later than those occurring in the Mela and Longano catchments. These characteristics indicate that storm migrated toward the northeast, according to the satellite images.
Figure 6 shows the accumulated hourly rainfall recorded at rain gauges during the 22 November 2011 storm. The Castroreale rain gauge recorded the most intense rainfall; it began to rain since the early hours of 22 November, but between 6:00 and 15:00 the storm caused the major part of the precipitation. In particular, 72.5 mm fell between 7:00 and 8:00 and caused the first flood phenomena in the minor gullies. Towards the northeast, (Torregrotta, San Pier Niceto, and Ziriò) the most intense rainfall occurred one or few hours later. Many eyewitnesses described that, in the area of Saponara, the major precipitation occurred in the afternoon of 22 November 2011, highlighting that mainly in this zone the rain gauge network was insufficient to catch the spatial distribution of the rainfall.

2.3. Methods Used

To reconstruct a more likely spatial distribution of rainfall occurring on 22 November 2011, rain gauge density has been integrated with data recorded from the Tropical Rainfall Measuring Mission satellite (TRMM). TRMM is a satellite launched by NASA for research purposes and provides rainfall data as a function of the heat release which manifests contextually to precipitation. Data download is through a portal that can be accessed through the NASA website, with an acquisition interval of 95.2 min. Acquisition points of TRMM provide coverage to the entire Earth’s surface, they form a regular grid of dots arranged at intervals of 0.25° of latitude and longitude.
Available rain gauge data series on the annual maxima rainfall (1, 3, 6, 12, and 24 h) have been analyzed to find some statistical characteristics, as the return time and trend in the time series.
The return time has been estimated by the Generalized Extreme Value (GEV) [25] frequency distribution, where the cumulative probability, P, for values below a specific threshold (Xx), is:
P ( X x ) = exp { [ 1 + ξ ( x μ σ ) ] 1 ξ }
where ξ is the shape parameter (dimensionless), μ and σ are the position and scale parameters.
The actual values were plotted by their order in the time series:
P ( i ) = i N + 1
where N is the number of the series data, and i is the position in the ordered set of data.
The cumulative probability found by the GEV frequency distribution (Equation (1)) has been transformed in the Z value of the Standard normal distribution (Figure 7). This transformation has been carried out for the annual maxima series of rainfall (1, 3, 6, 12, and 24 h), and obtains the symmetric series, with zero mean and standard deviation equal to 1. After the transformation in the normal standardized distribution, the progressive summation of the values highlights trends and fluctuations of the time series; this summation coincides with the Rescaled Adjusted Partial Sum (RAPS; [26]). The RAPS of the time series are defined as follows:
R A P S k = X k = t = 1 k Y t Y ¯ S Y
where Y ¯ is sample mean, SY is the standard deviation, k is counter limit of the current summation. The plot of the RAPS versus time is the visualization of the trends and fluctuations of Yt [26]. Decreasing patterns in the RAPS are the result of periodicity of mostly below-average Yt values, whereas increasing patterns are the result of periods of mostly above-average Yt values. The RAPS highlights the tendency of values to cluster together; that is, the consecutive values below or above the mean provides a decreasing or increasing trend in the RAPS, respectively.

3. Results and Discussion

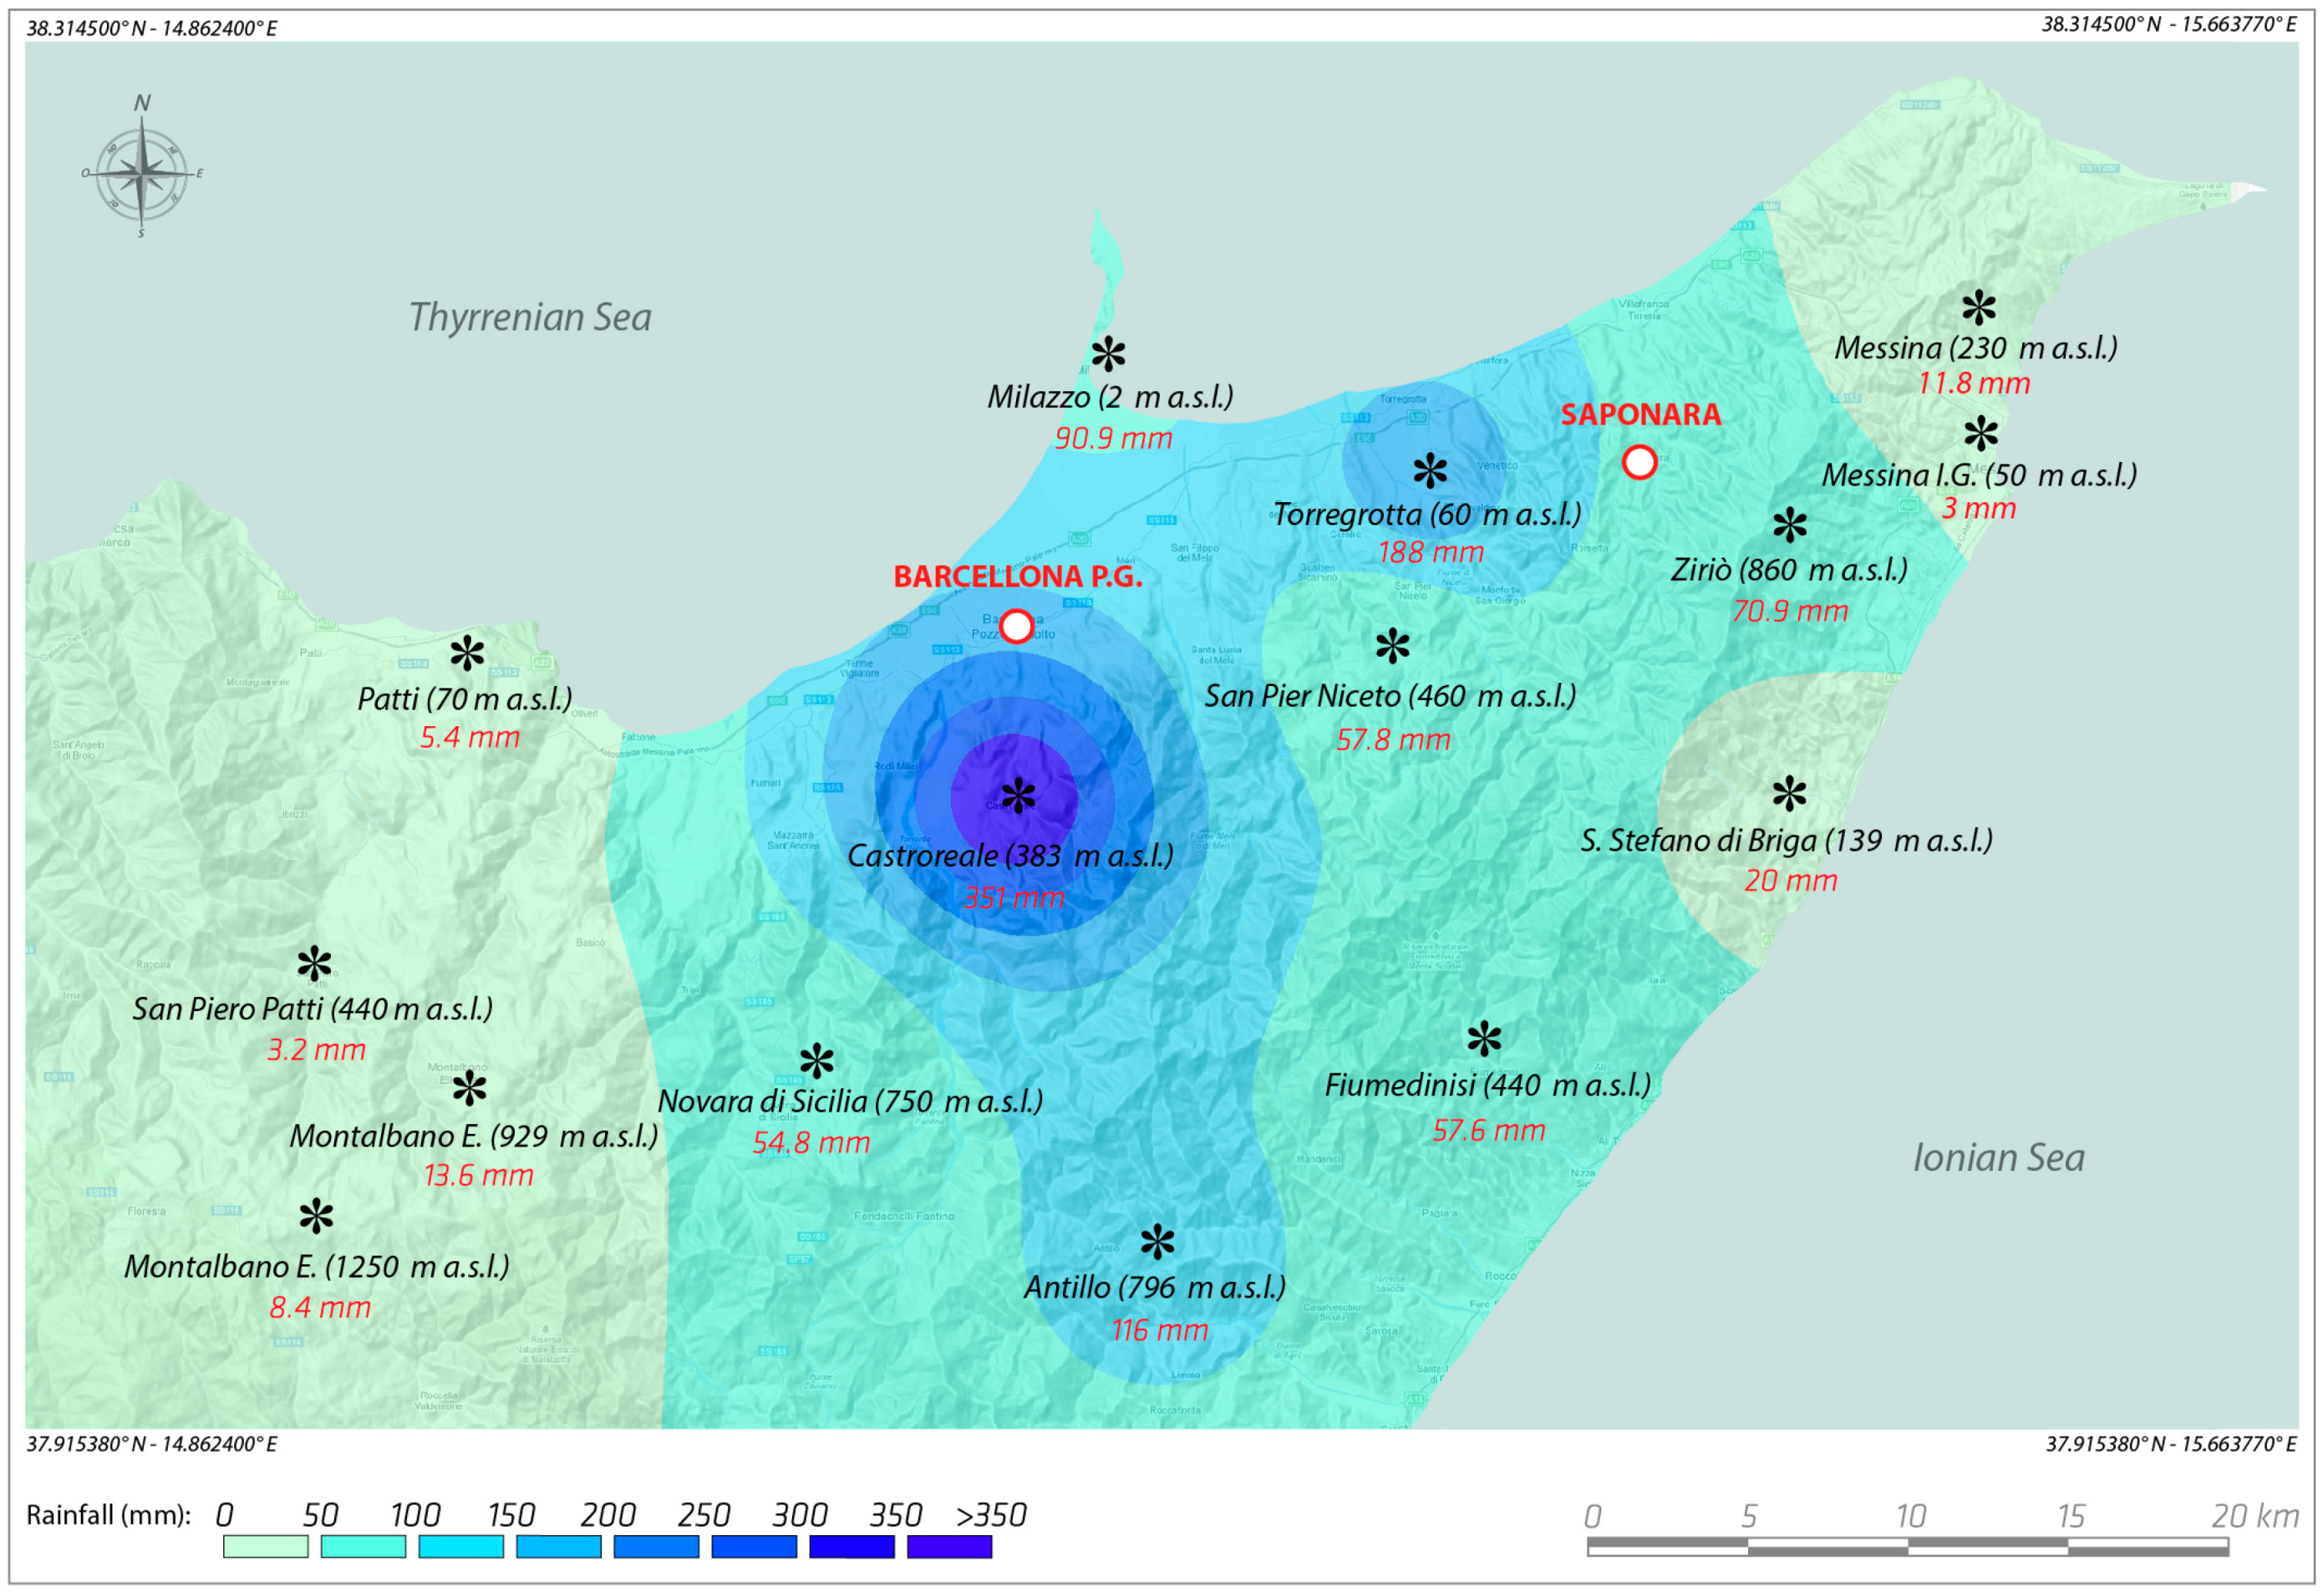
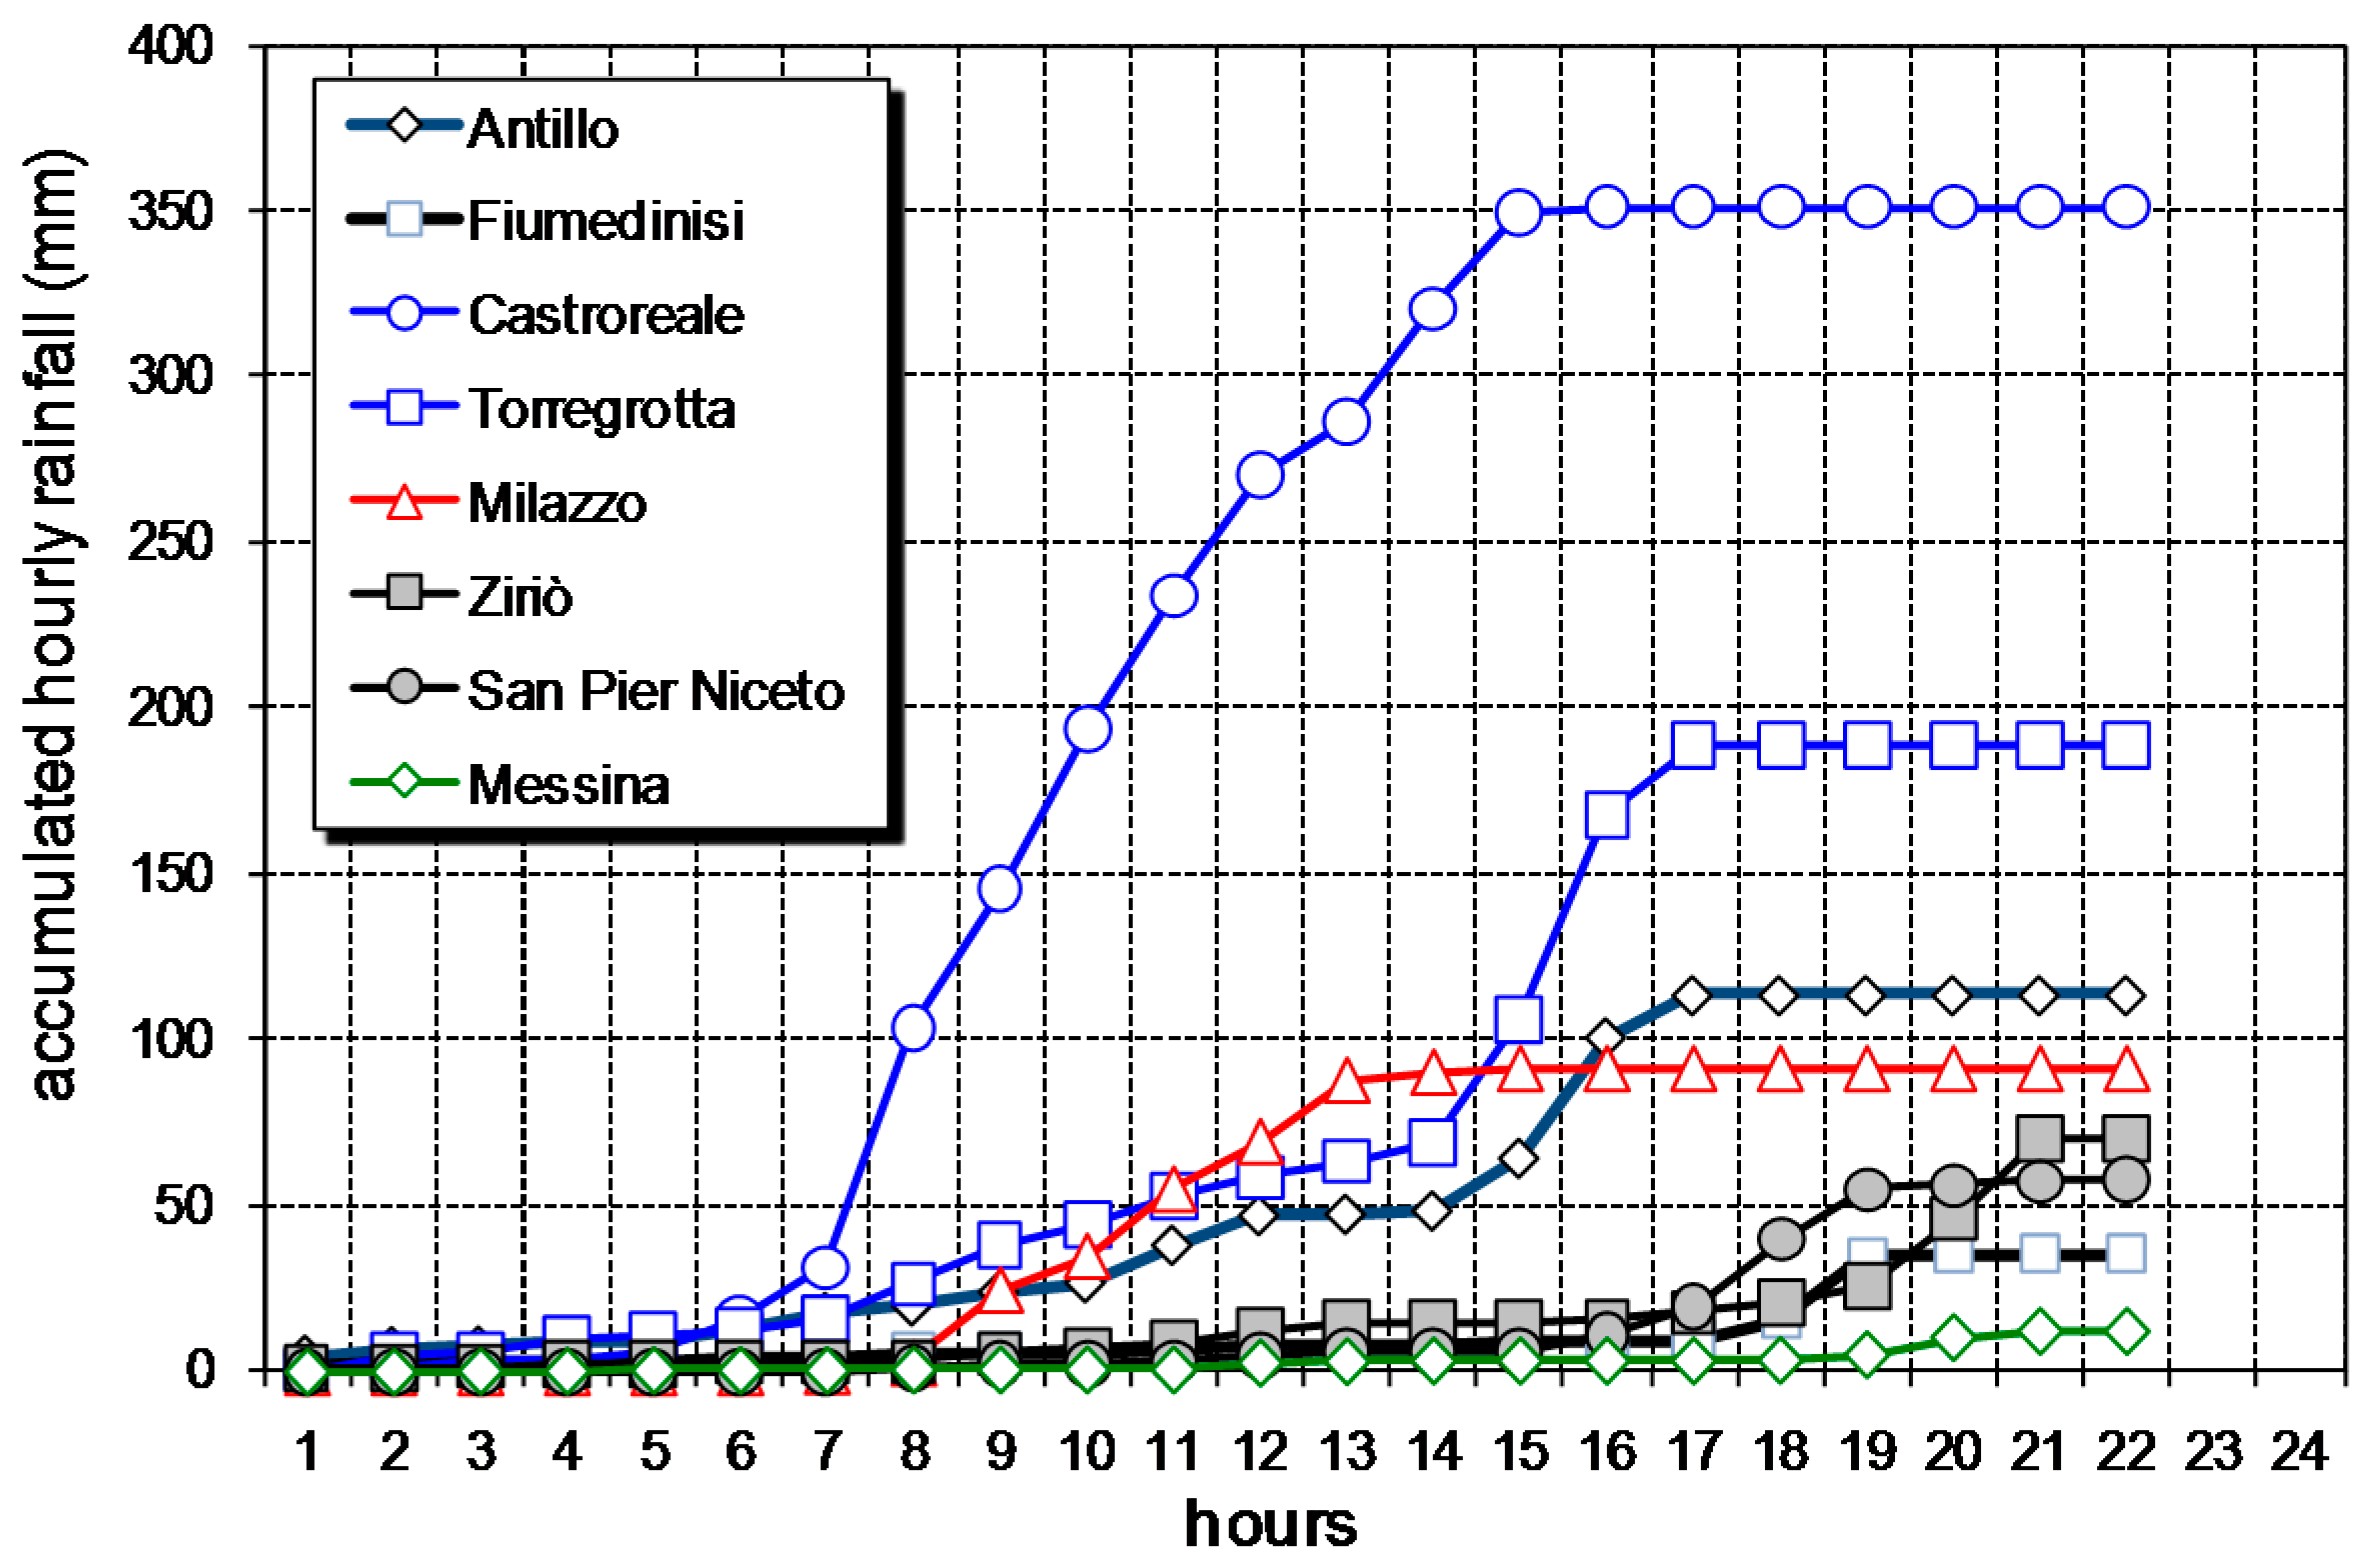
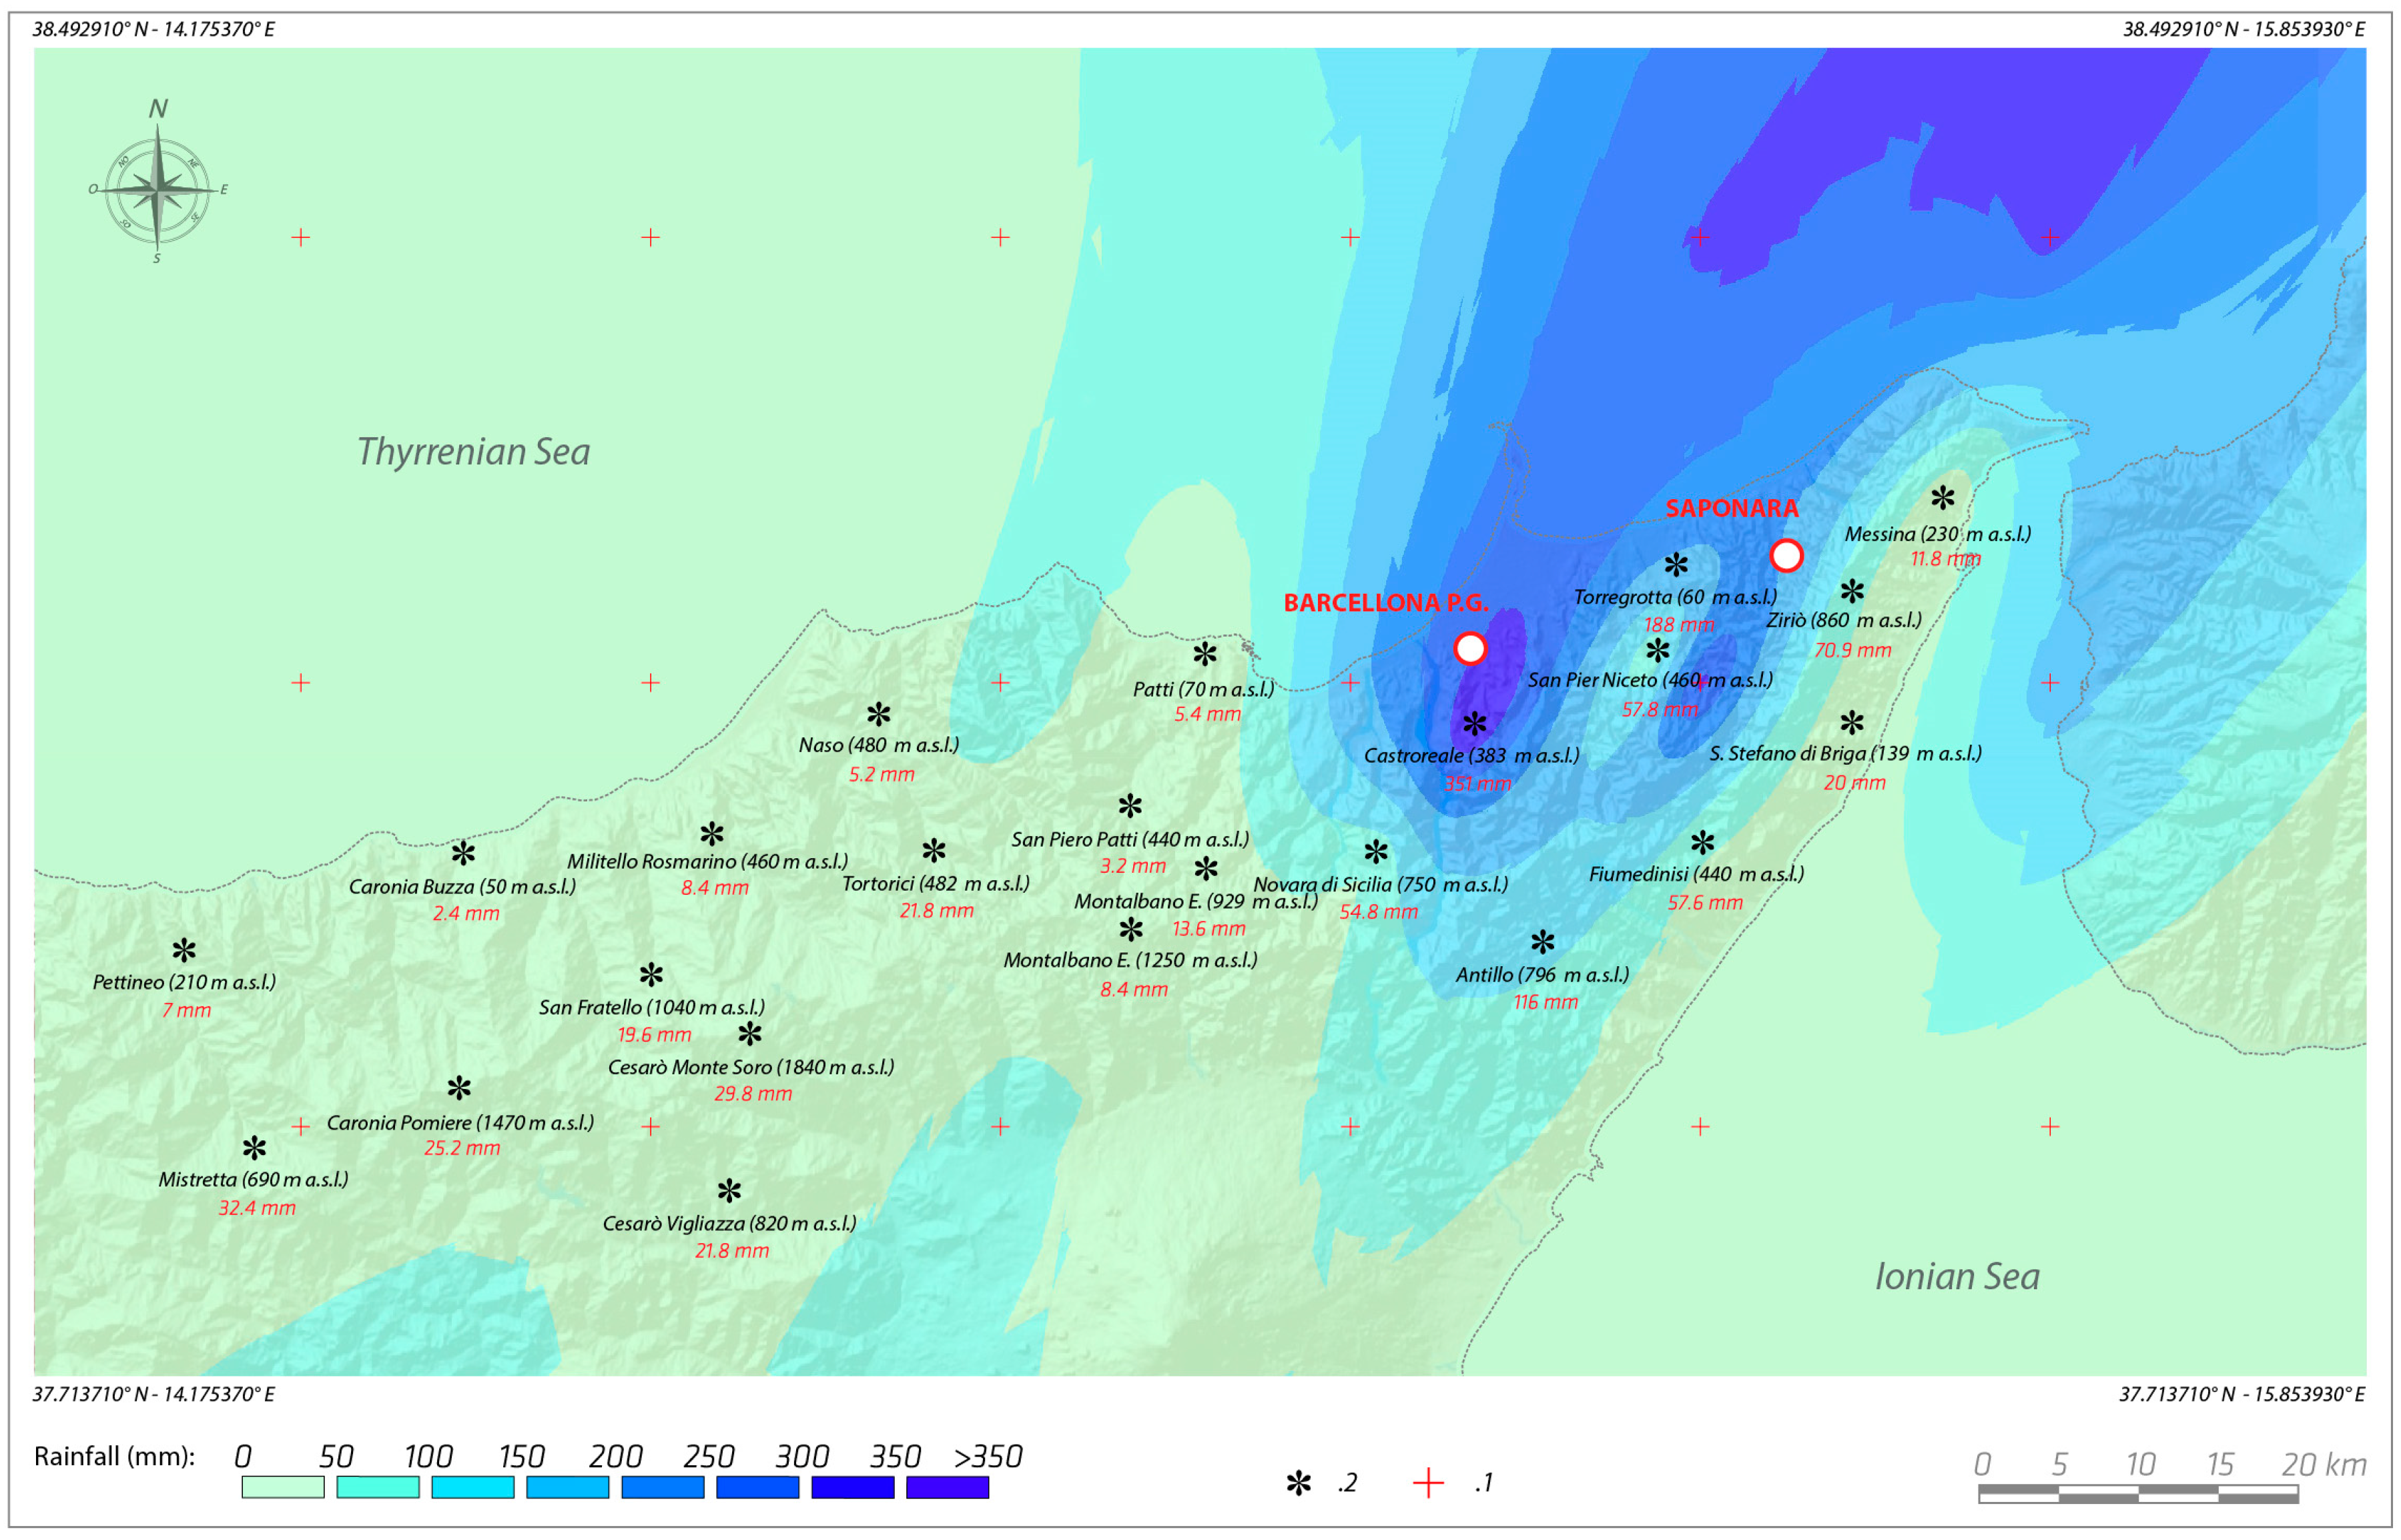
3.1. Reconstruction of the Storm Map

To improve the rainfall spatial distribution on 22 November 2011, rain gauge data have been integrated with data from the TRMM satellite platform. The original values provided by TRMM has been multiplied be a constant, obtained from the ratio between rainfall recorded at several rain gauges and their nearest TRMM measure points; the constant found has a value of 6. On the network formed by rain gauges and TRMM points, a new spatial rainfall distribution has been mapped by kriging interpolation. Figure 8 depicts probably a more realistic spatial distribution of rains from 22 November 2011 with respect to Figure 5; it seems to agree with what was derived from EUMETSAT satellite images of Figure 4, even if it is also based on rainfall data derived indirectly from satellite sensors. The map shows that the storm event of 22 November 2011 is characterized by two rainy centers, elongated in the direction of Southwest–Northeast, one located transversely to Longano, Idria and Mela catchments, and the other in the area of Saponara catchment. The result of interpolation of the data in Figure 8, with the two centers of rain, is in fact the result of the stationing of the plume vertex (mentioned before) for most of the time on these areas. It can be observed that, in the area of Milazzo plain at least 200 mm of rain, would have fallen, according to flash-floods occurring in this area. However, the distribution of rainfall in the Saponara area appears still be coarse (locally, it is also missing a TRMM point, Figure 8), as suggested by the landslide distribution in this zone (Figure 2).

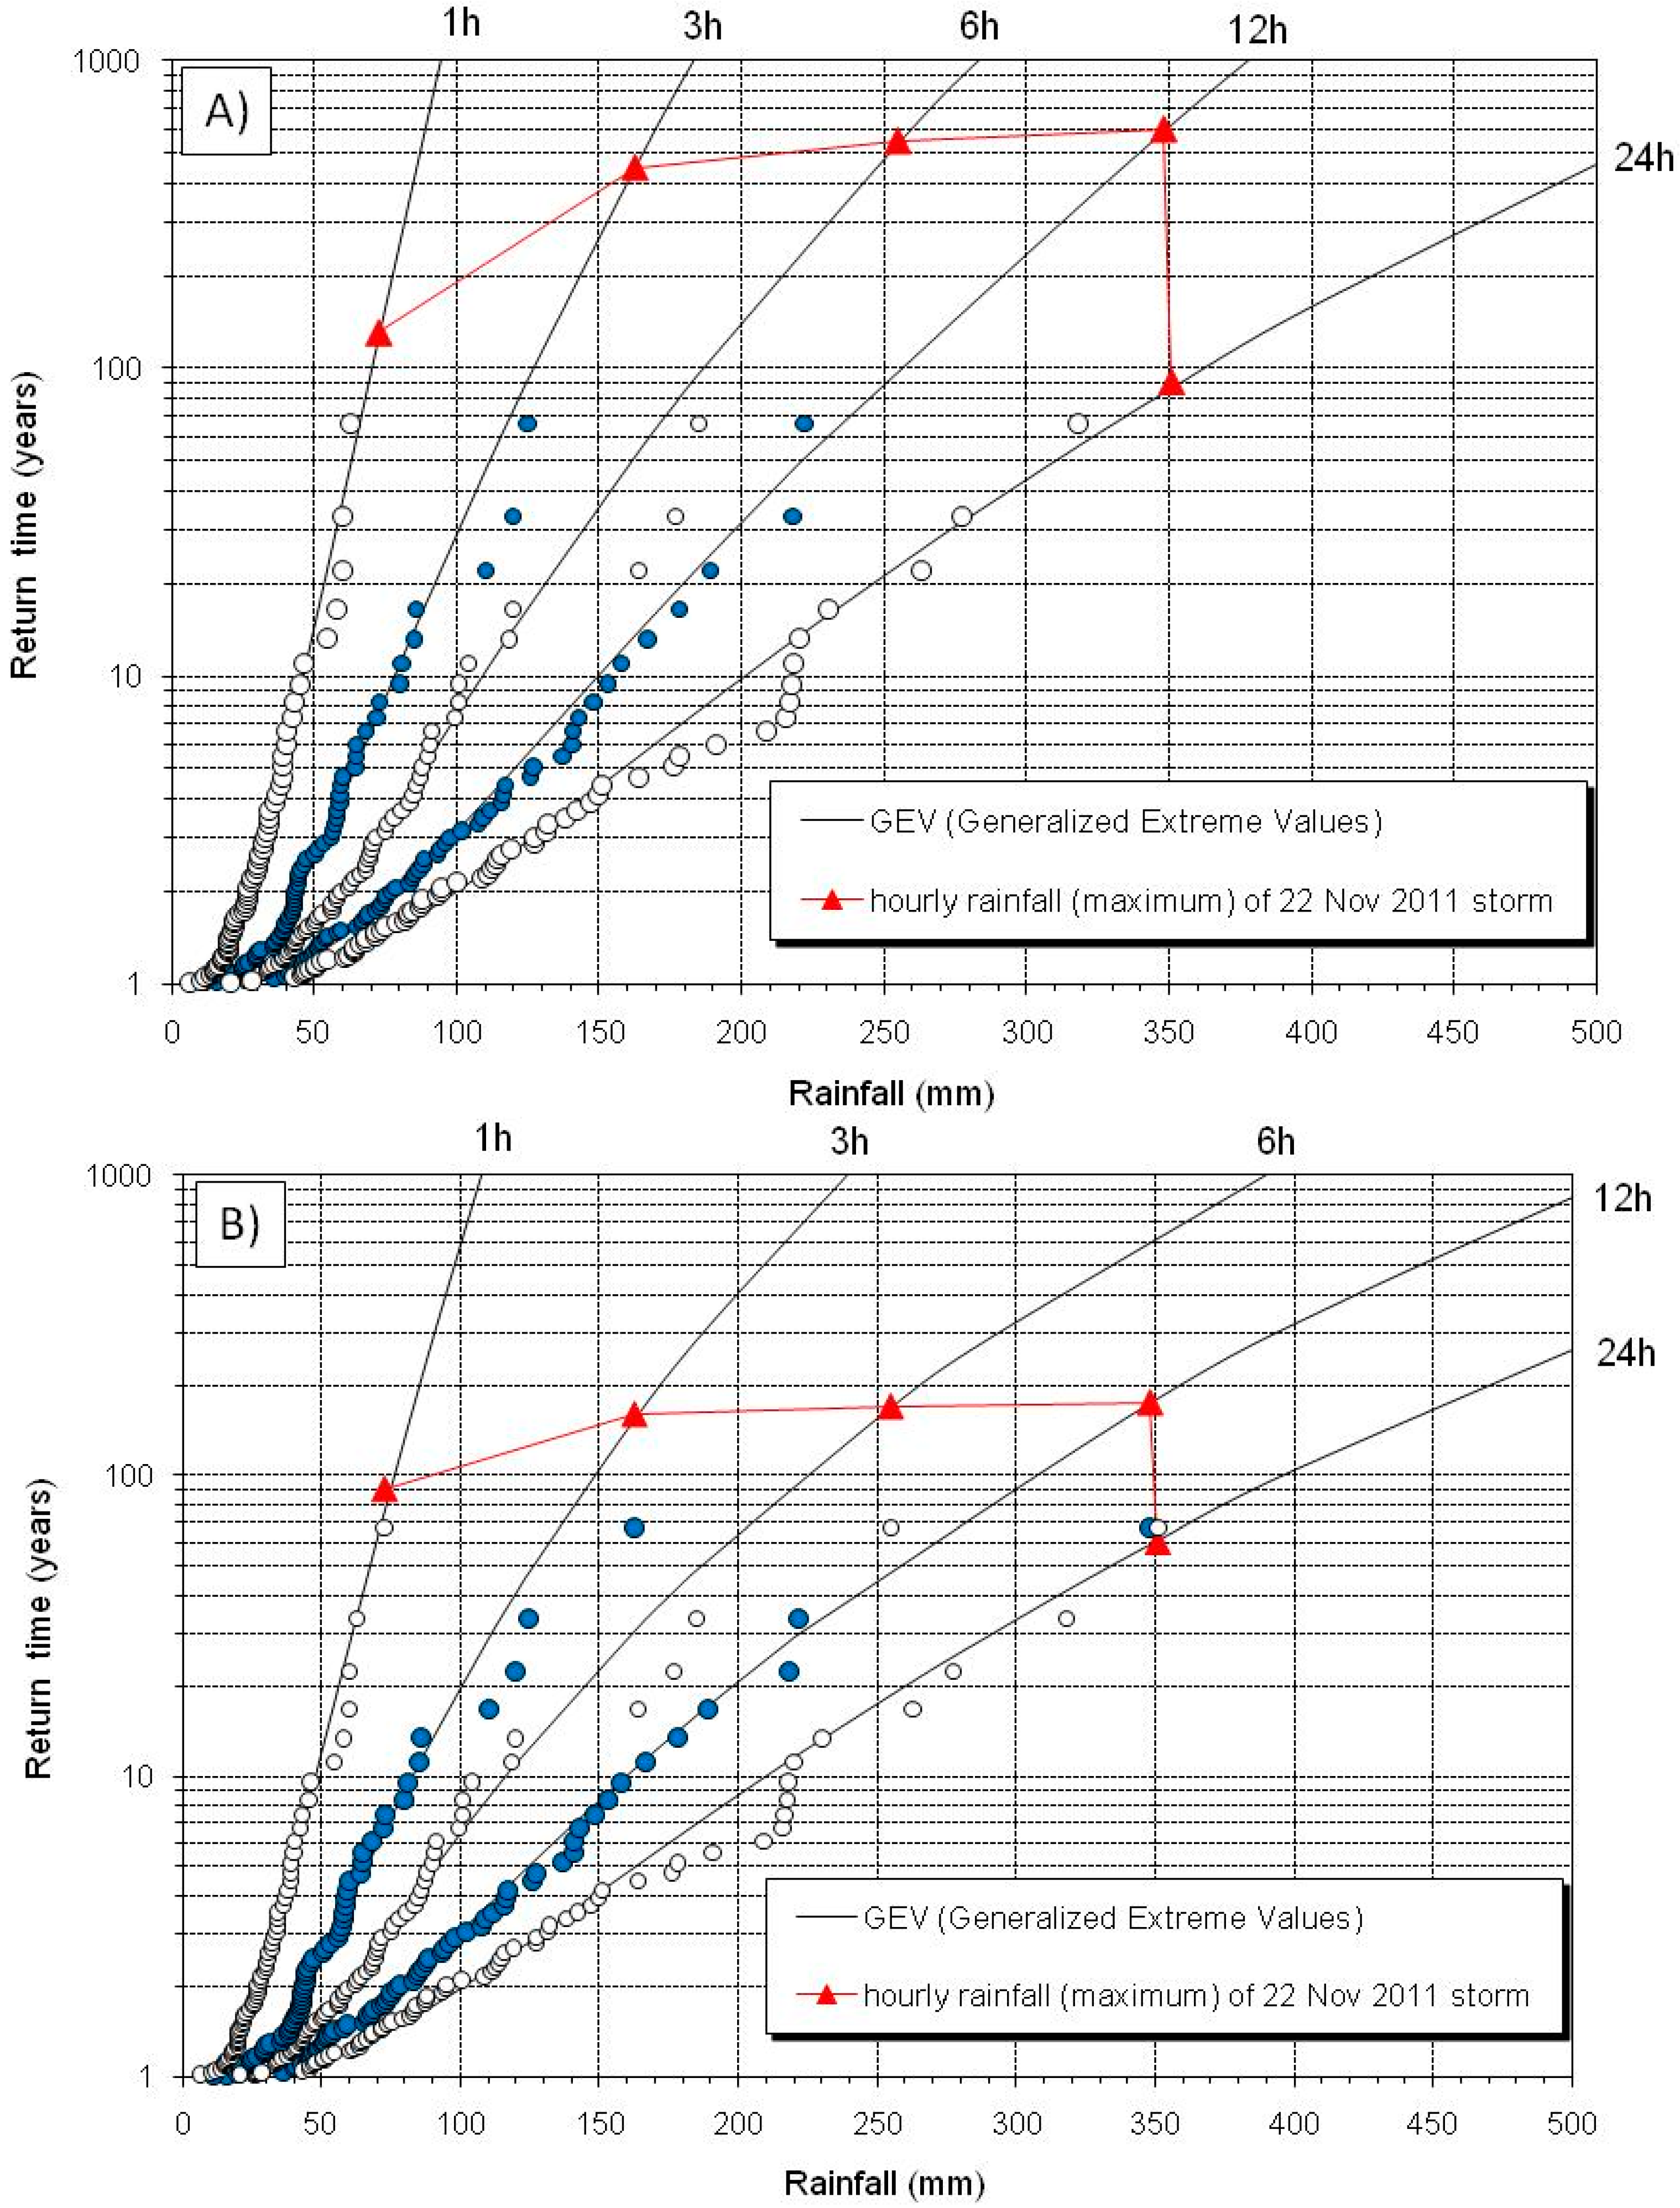
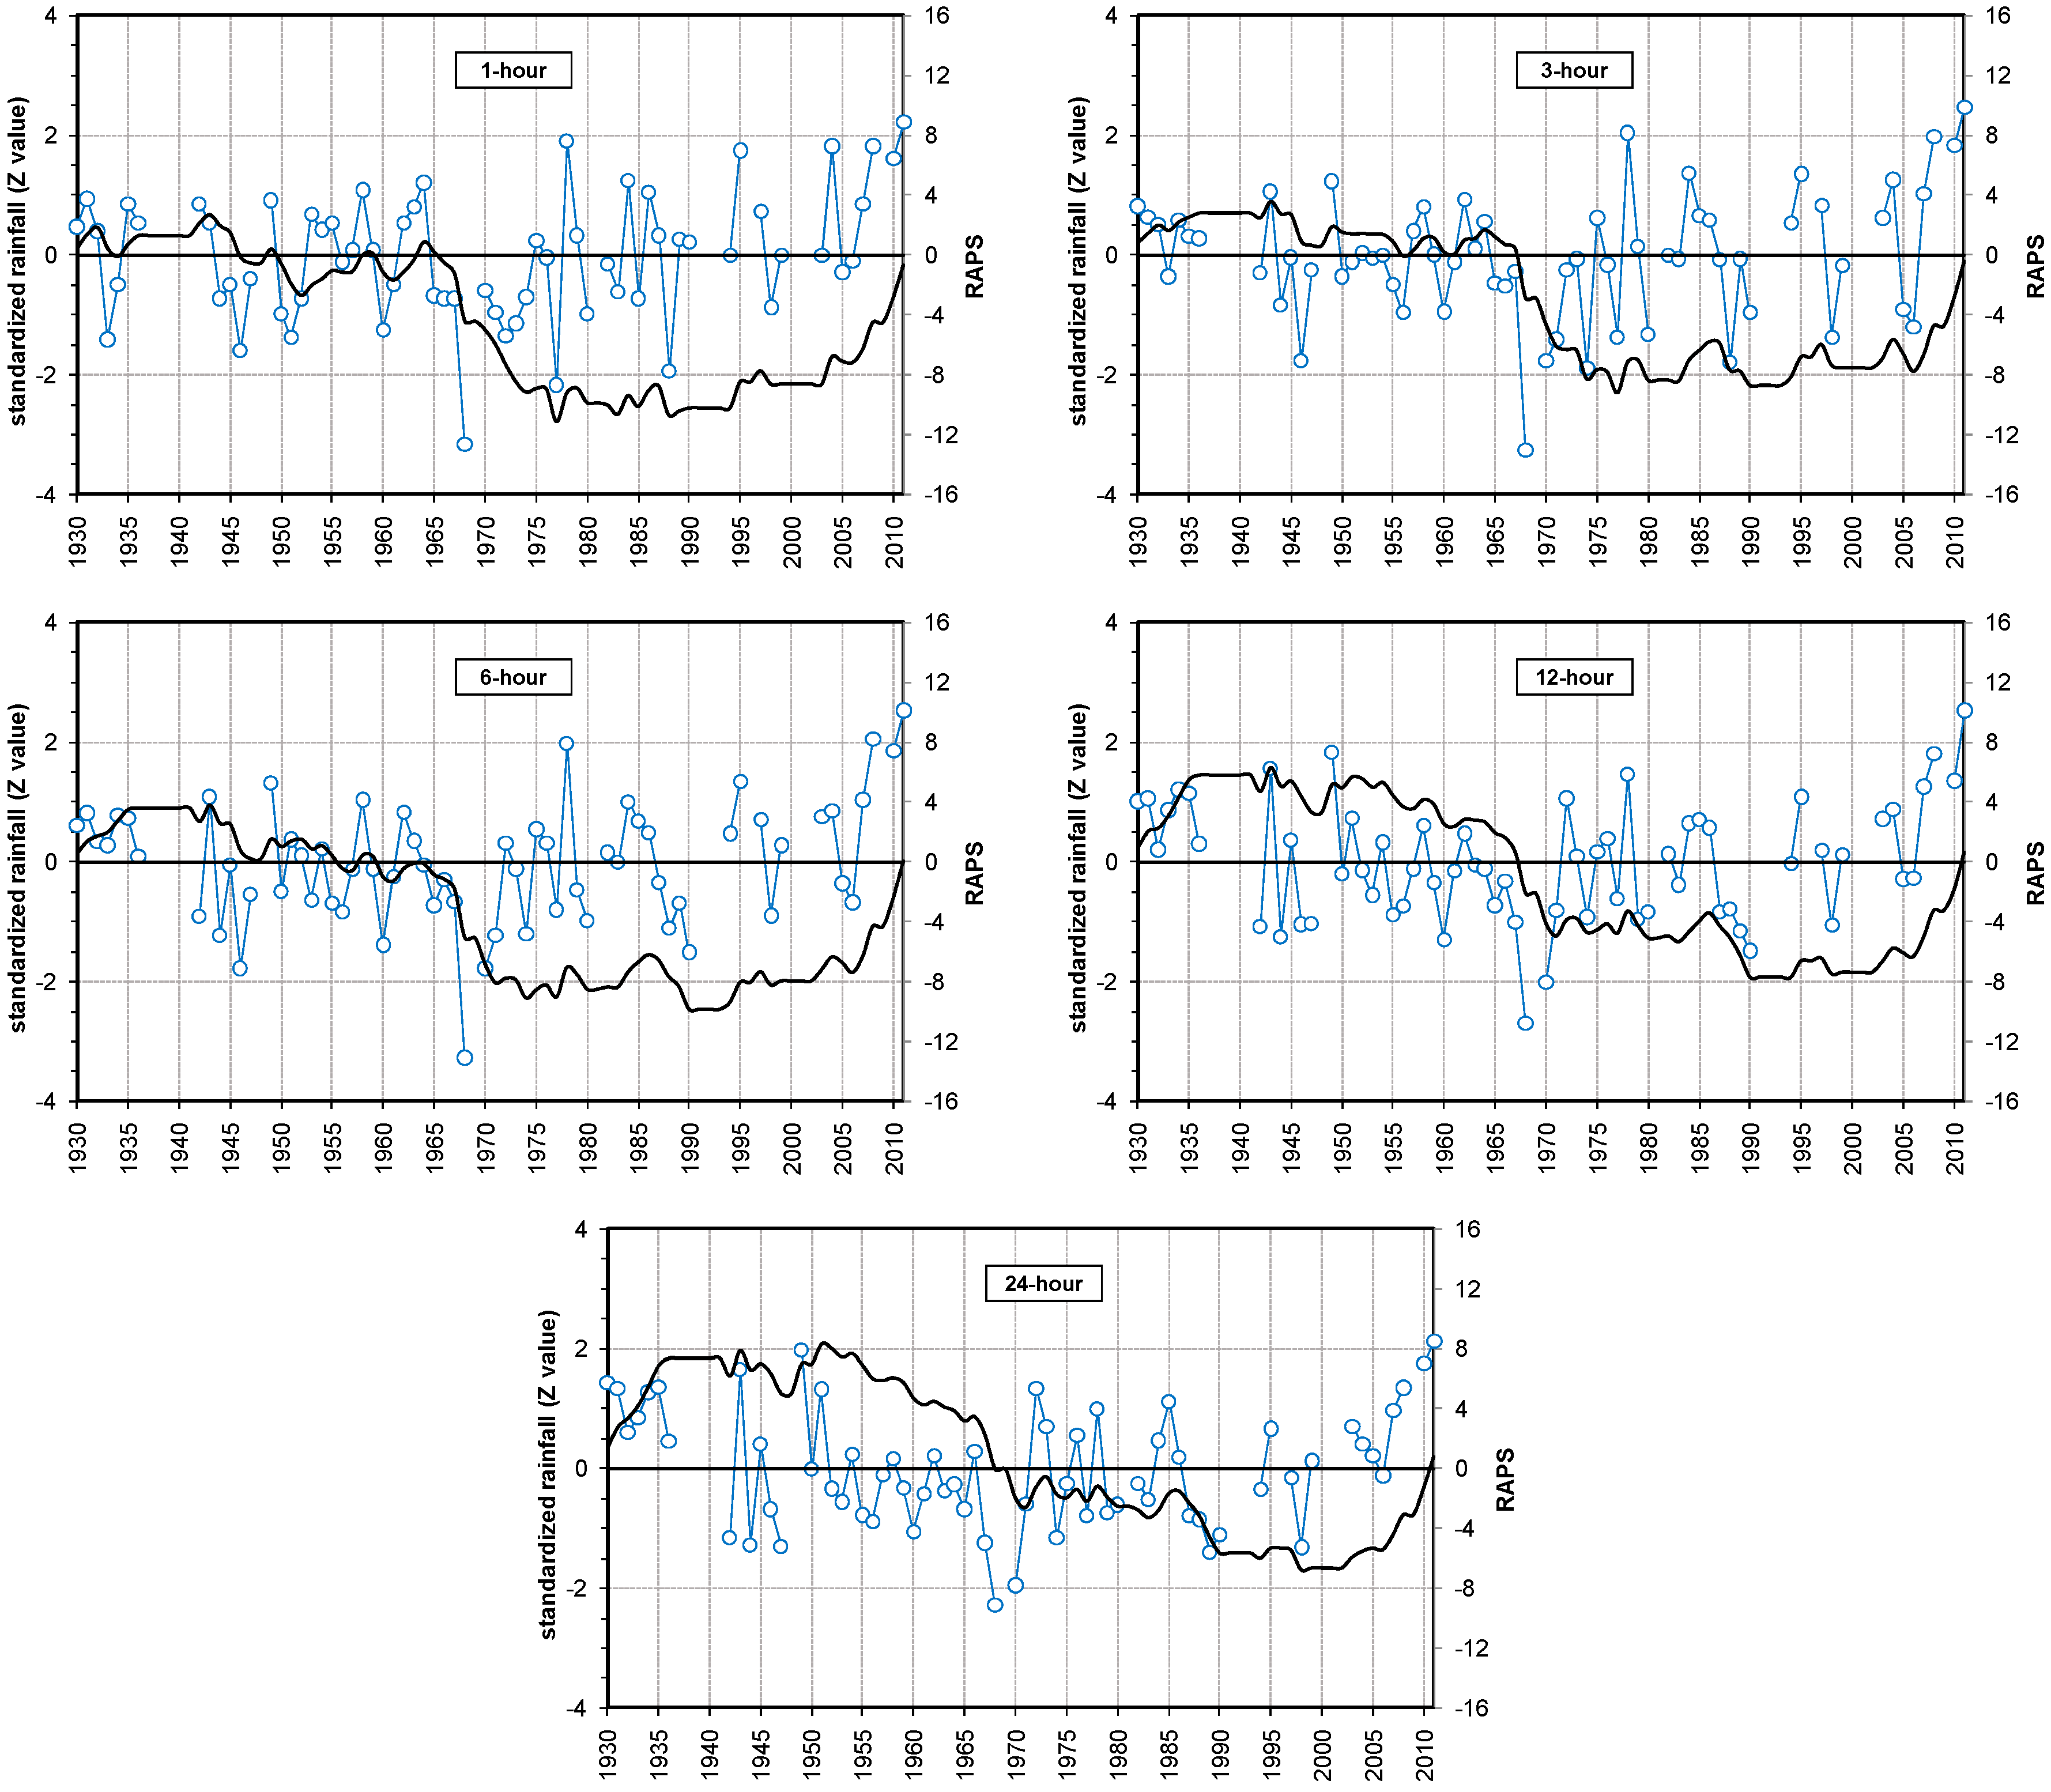
3.2. Frequency Analyses

Specific to the area hit by the 22 November 2011 storm, the rain gauge at Castroreale is the only one where a long historical time series of maxima exists (since 1930), even if some missing data are present. This rain gauge is located in one of two zones characterized by the maximum amount of the rainfall that fell during the storm, as can be deduced from Figure 8 and the landslide distribution occurring in the field (Figure 2). Thus, the maximum intensity of the storm can be analyzed statistically, and provides details on the recurrence of the intense storms in this specific point.
Even if a considerable accumulated rainfall was also recorded at the Torregrotta rain gauge, it has only operated since 2002. Table 2 shows that the rainfall recorded at the Castroreale rain gauge during the 22 November 2011 was the highest for each hourly duration (from 1 to 24 hourly rainfall). In particular, the rainfall of 6 and 12 h has been well higher than previous historical maxima (Table 2).
Figure 9 shows the statistical analyses carried out on annual maxima for 1, 3, 6, 12, and 24 cumulative rainfalls, plotting results as described in [27]. If annual maxima of 2011 are excluded from the dataset (Figure 9A), each statistical curve (GEV) fits the historical data well; the return time of the 22 November 2011 would reach values of 450–600 years between three and 12 h of accumulated rainfall.
If the annual maxima of 2011 are included in the dataset (Figure 9B), the statistical curves (GEV) are not able to fit the extreme value of the series for 3, 6, and 12 h cumulative rainfall (Figure 9B); the return time of the 22 November 2011 storm fall to 160–175 years between 3 and 12 h accumulated rainfall. Thus, the presence of annual maxima of 2011 in data set conditions heavily the estimation of the return time.
The exceptional rainfall of the 22 November 2011 storm caused a considerable shift from each frequency distribution adopted to fit the historical data, and raises the well-known complication in this type of statistical analysis [28,29]. This aspect highlights the outlier characteristic of the 2011 event, and will be considered later.

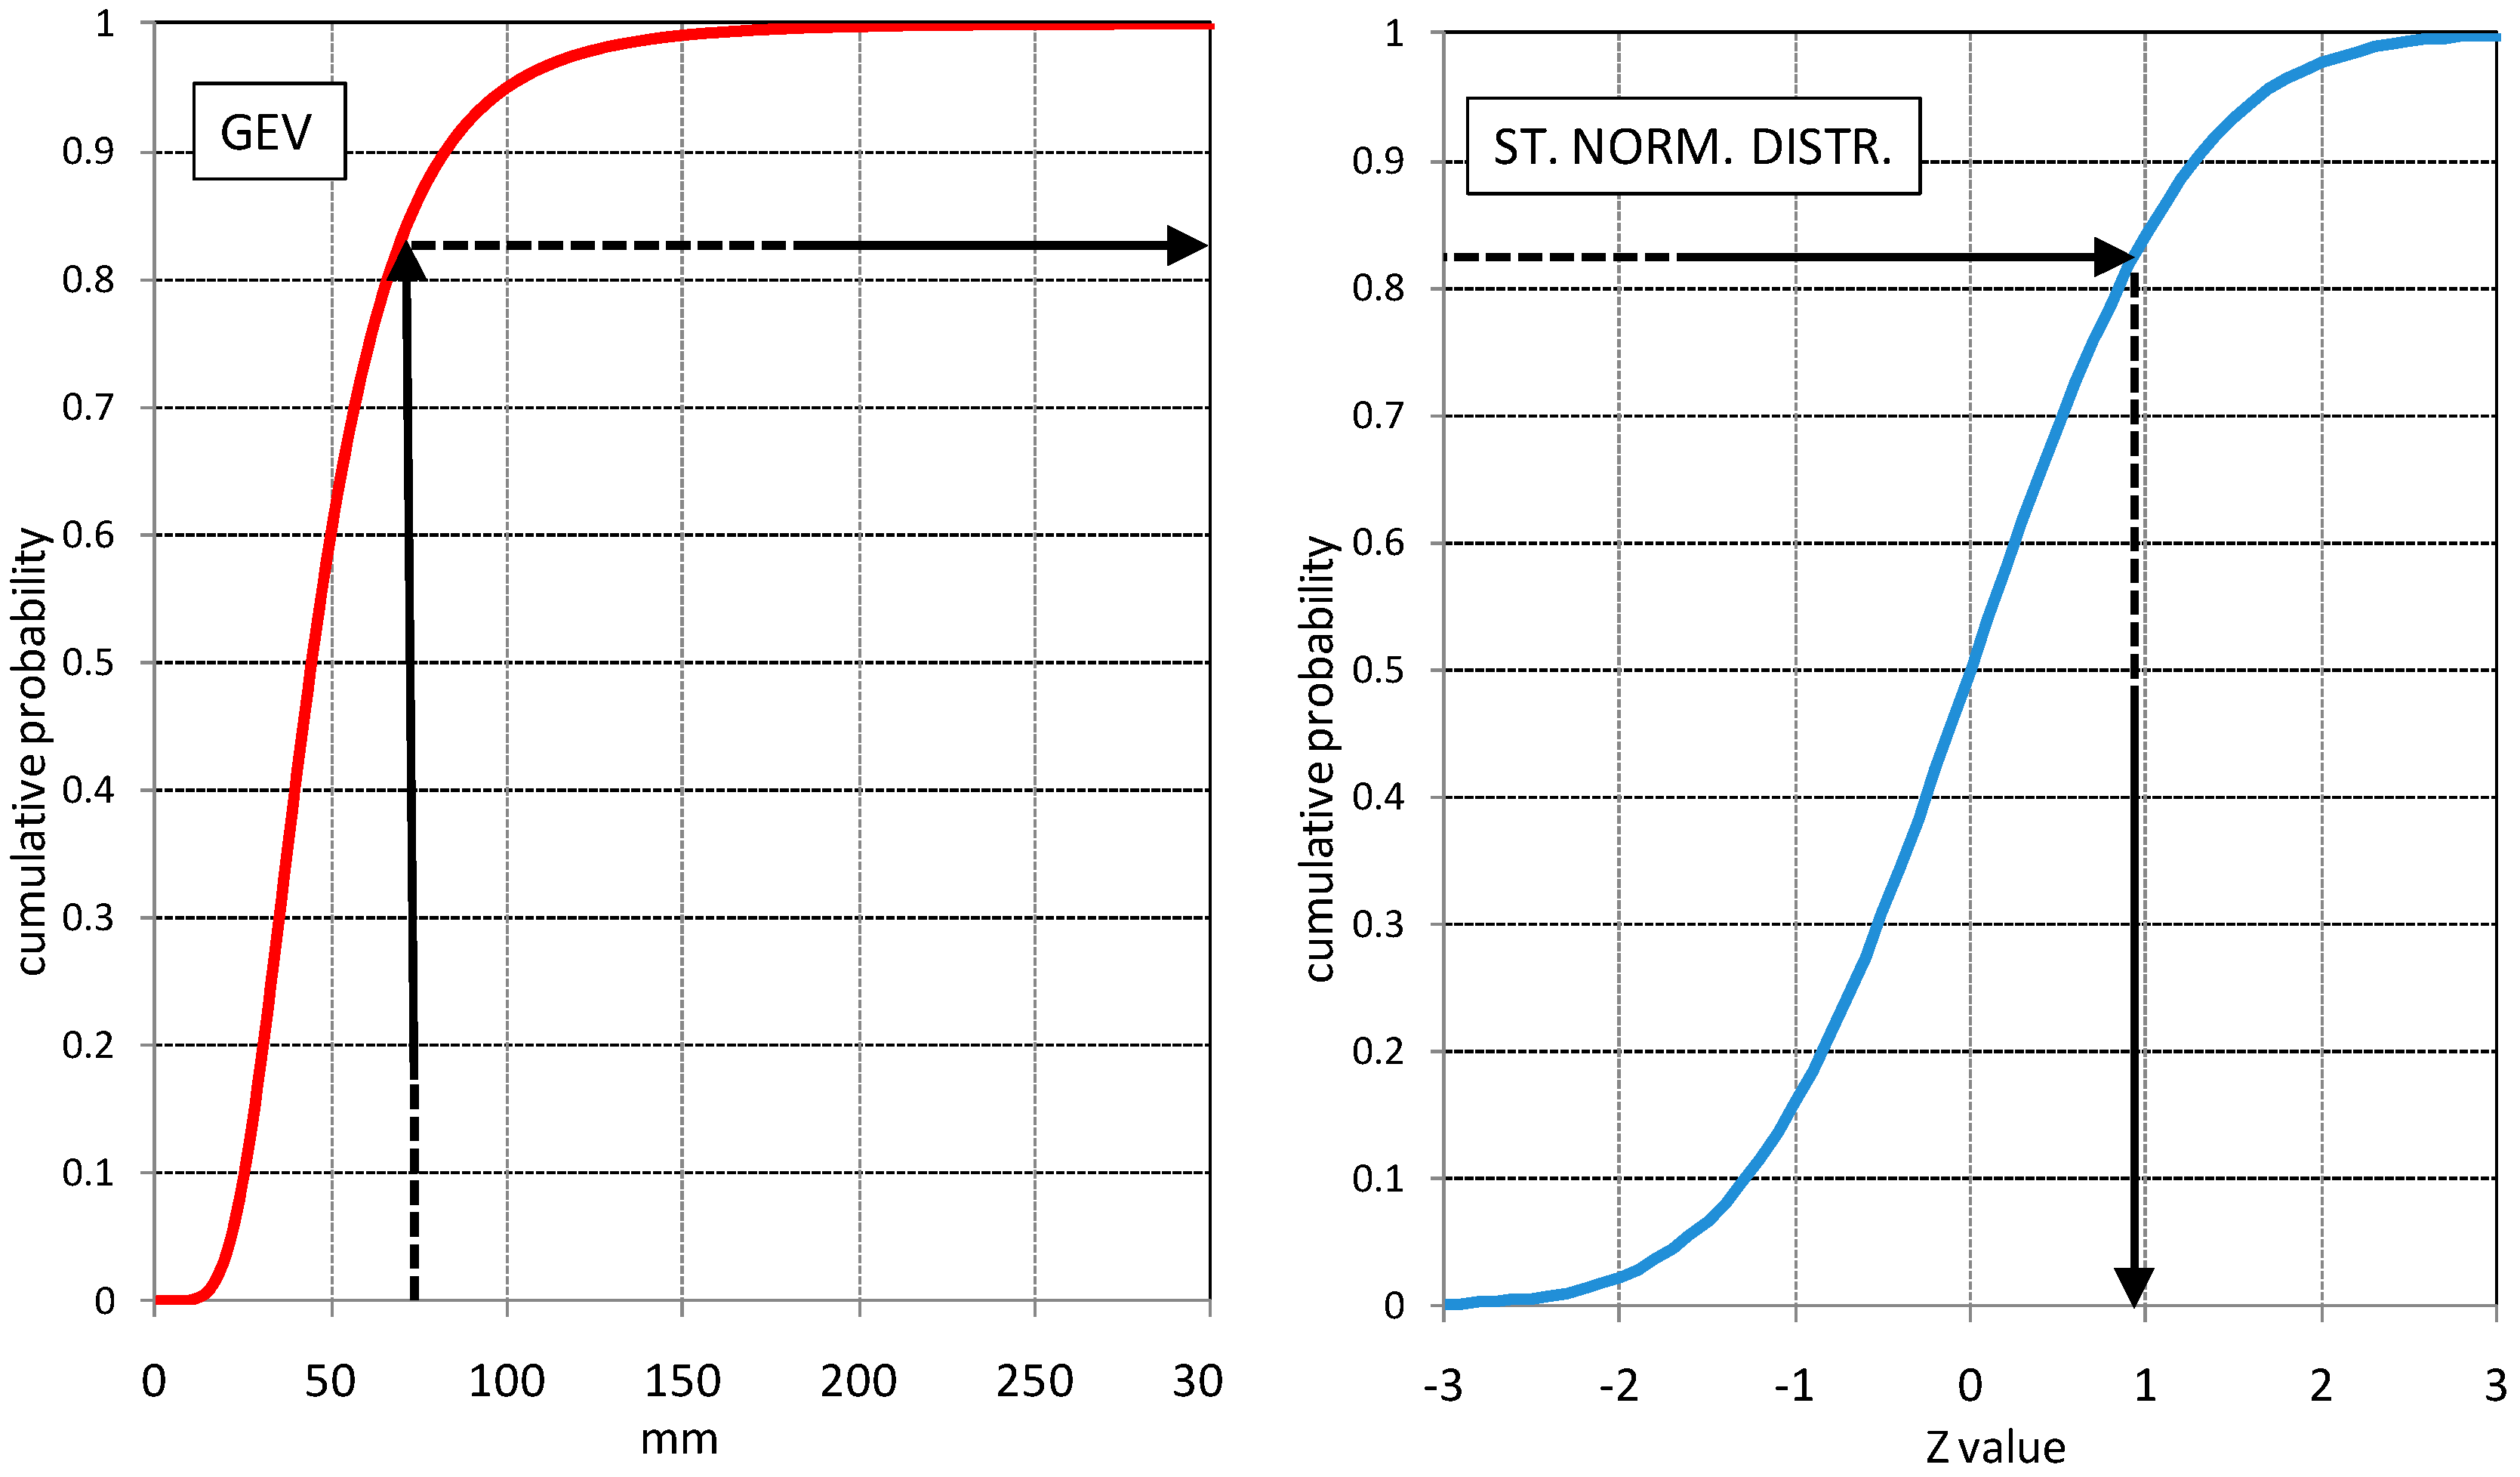
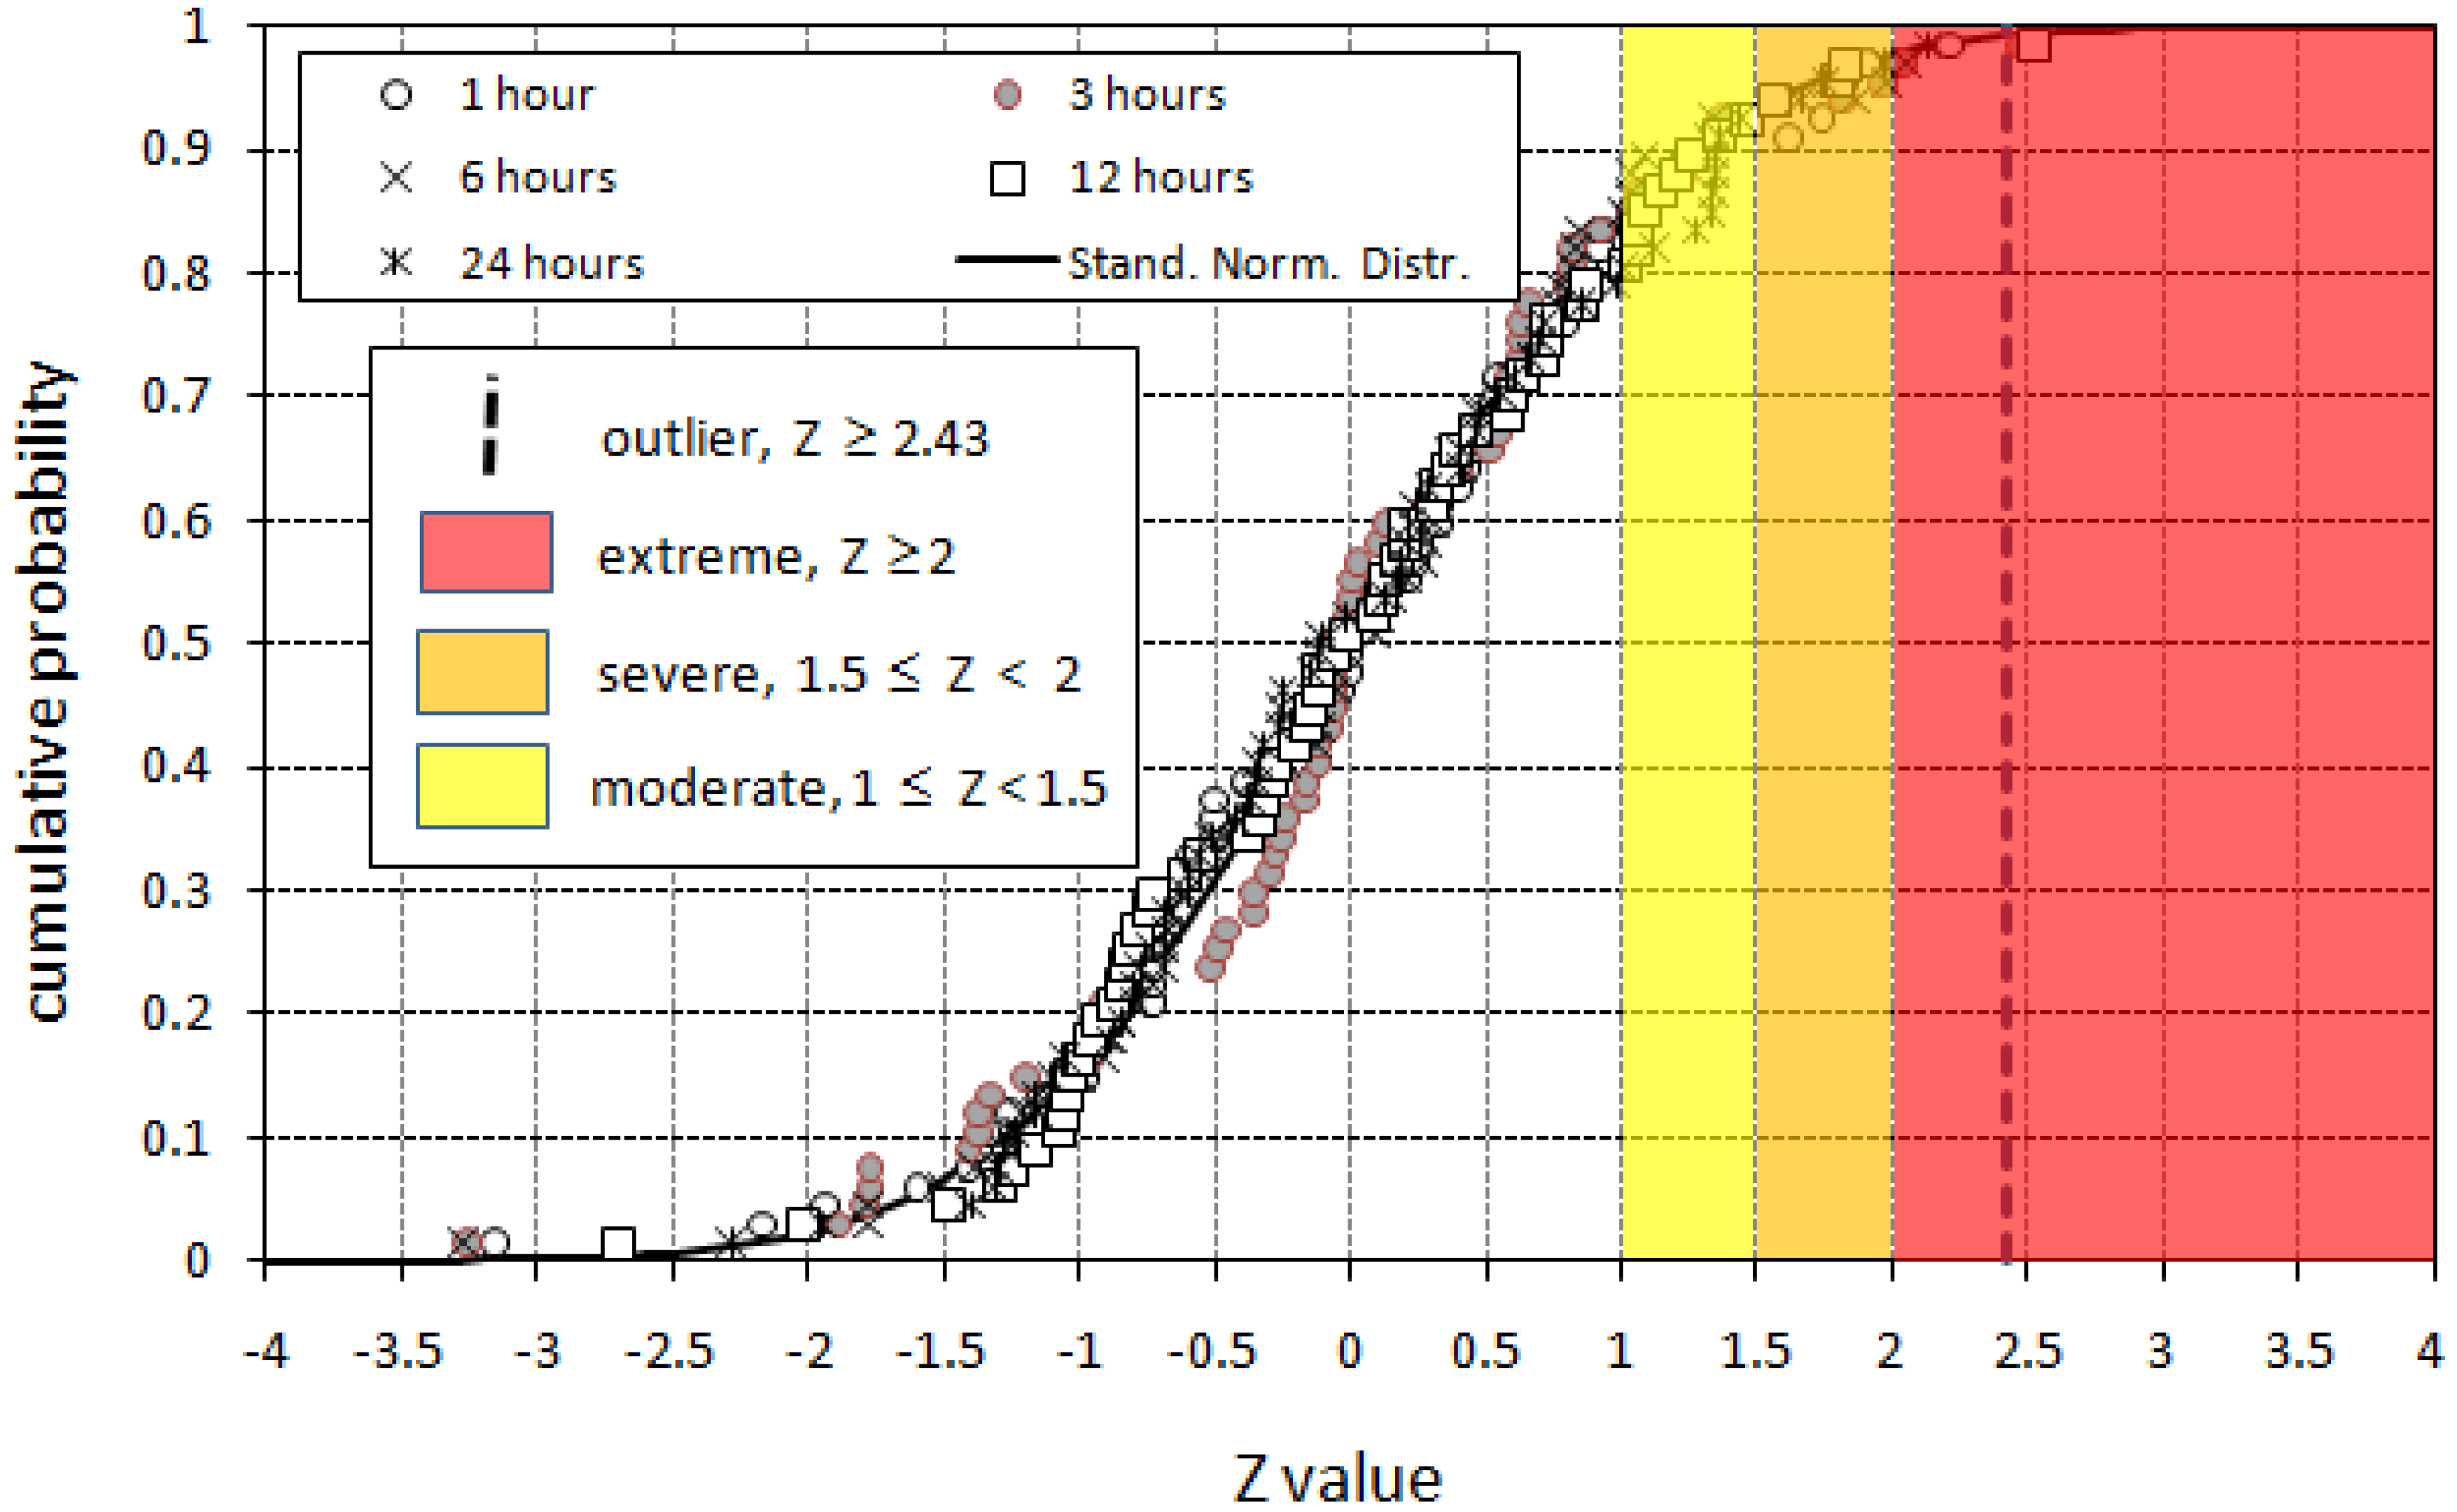
3.3. Transformation in the Standard Normal Distribution

To investigate the sequence of the annual maxima, the historical time series have been transformed in the Standard normal distribution, from the cumulative probability of the GEV distribution (Figure 10). The transformed series of Figure 10 are symmetric with respect to the zero value of the mean and have a standard deviation equal 1.
With the exception of 1978, which appears randomly distributed in the time series, the most intense storms are concentrated in recent years (Figure 10), especially considering durations of 1, 3, and 6 h. In particular, large storms occurred in 2008 and 2010, and, locally, induced landslides and floods, but the rainfall accumulated for different durations was lower than the 2011 storm. For durations of 12 and 24 h, the storms of 1943 and 1949 appear intense in the historical series.
In the transformed series of Figure 10, the values that exceed 2 have a probability of occurrence lower than 0.023; as commonly used in hydrology, for example in the definition of drought categories by the SPI (Standard Precipitation Index; [30]), the values that exceed 2 can be considered as extreme events (in drought analyses the negative values of Z are considered). Following a similar definition of the SPI, but considering positive values of Z in this case, the categories of hourly maxima are defined as extreme, severe, moderate, or mild. The transformation in the Standard normal distribution provides dimensionless values, and allows a direct comparison between the time series of Figure 10 (1, 3, 6, 12 and 24 h). Besides, it also allows the comparison of different hydrological parameters, such as spring discharge and rainfall [31]. The transformed historical data of Figure 10 have been plotted in Figure 11, fitted by the Standard normal distribution. Values are defined as extremes for Z ≥ 2, severe for 1.5 ≤ Z < 2, moderate for 1 ≤ Z < 1.5, and mild for 0 ≤ Z < 1. The Z = 2.43 limit has been found following the Chauvenet’s method, and would allow to identify the outliers in the series; values higher than this limit appear shifted from the distribution fit (as the event of 2011 in Figure 9B). It has to be outlined that the transformation in the Standard normal distribution includes the 2011 data and, thus, it covers all of the available dataset.
Table 3 shows all the storms of historical series characterized by hourly maxima falling in the severe and extreme categories. The event of 22 November 2011 is an extreme event for all rainfall durations, and it is an outlier for 3, 6, and 12 h. For a duration of 6 h, the storm of 2008 was also of the extreme type. In particular, the recent storms of 2008 and 2010 are extreme/severe events for several hourly durations, and were induced by similar meteorological conditions as the 2011 storm.
The 1943 and 1949 storms were severe only for 12 and 24 h, indicating that the hourly distribution of these storms were characterized by the absence of particular peaks. In contrast, some recent storms (1995 and 2004) were severe only for a one hour duration, and they lost their power for a longer duration.
As the annual maximum hourly rainfall time series have been standardized, their progressive accumulation provides the RAPS of the series (Figure 10). Looking at the RAPS of the annual series of Figure 10, the clustering appears in two main periods, the first occurred between 1965 and 1974 with values below the mean; the second period has occurred since 2007 and it is characterized by values well above the mean.
The latter clustering highlights the general increasing of the occurrence of the intense storms, which seems common in all northern parts of Sicily. This is in agreement with the results of [32], by which sub-grid scale convection and intensification phenomena indicate, for Sicily, an increasing trend towards shorter rain durations (about one hour) during the period 1927–2004. Additionally, the increase in the intense precipitation has been recently highlighted in Western Sicily by [33].
The recent increasing of the intense rainfall, marked by the inconstant mean and variance in time series, highlights the difficulties in the estimation of the frequency of recent storms.

4. Conclusions

Placed at the crossroads of Mediterranean flows, Sicily could be considered representative of a geographic scenario of regional climate change associated with warming, reflected in the Mediterranean cyclogenesis, and that would have contributed to the exceptional rainfall rates observed in recent times [2,15]. The assessment of current and future management systems should focus on the hazard of extreme precipitation events, which likely cause accelerated urban and rural land degradation. This must be considered together with the findings that, although rainfall amounts are not always increasing, erratic spatial and temporal storm patterns in some seasons or months drive the power of rainfall to increase its hazard. According to [34], investigations are needed especially in terms of statistical analysis of long pluviometric series, rain intensity and erosivity occurring at decadal and interdecadal scales, which mark substantial climatic fluctuations and changes during last centuries. However, the increase of extremes of precipitation cannot be assumed as a rule in Southern Italy, and in the Calabria region this increase was not observed [35].
Specific to the investigated area, on the basis of the landslide distribution in the field, and on the numerous eyewitnesses describing the storm of 22 November 2001, it clearly appears that the gauge network is insufficient to define the map of intense storms. Thus, some historical storms could be unrecorded or underestimated by the actual rain gauge network, as well as floods occurring in the ungauged catchment of Mela and Saponara.
Historical data available for the Castroreale rain gauge, the only one useful for a statistic, have shown the intensification of the powerful storms in this area, as occurred in 2008, 2010, 2011, and 2015. This intensification could be connected to new and different atmospheric circulation, and the consequent develop of the “Alcantara effect” in this area; before 2008, on the basis of the historical records, this phenomenon seems to have occurred more rarely in the past.
To estimate the probability of occurrence of intense storms, the transformation of the historical data in the standardized values, passing through their best distribution fit (GEV in our case), has allowed to define several categories of the intensity of storms, similarly to SPI.
Even if the effect of storms in the field (floods and landslides) strongly depends on the previous wet conditions of the soil that is on the antecedent rainfall [36], the power of storms appear useful to be expressed in term of the Z value.
This approach can help in the evaluation of extreme data, as the use of the Standard normal distribution allows a more simple statistical management of data. Trends and fluctuations in time series need specific considerations, because the effect of the recent increase in frequency of intense storms could cause an overestimation of the return time values.

Acknowledgments

Authors are grateful to anonymous reviewers for helpful advises. Rainfall data were provided by Osservatorio delle Acque and Servizio Informativo Agrometeorologico Siciliano (SIAS), Regione Sicilia.

Author Contributions

Francesco Fiorillo has organized the research and carried out the statistical analyses; Francesco Fiorillo and Nazzareno Diodato have written the manuscript; Massimiliano Meo has developed the GIS maps.

Conflicts of Interest

The authors declare no conflict of interest.

References

  1. Ljungqvist, F.C.; Krusic, P.J.; Sundqvist, H.S.; Zorita, E.; Brattström, G.; Frank, D. Northern Hemisphere hydroclimate variability over the past twelve centuries. Nature 2016, 532, 94–98. [Google Scholar] [CrossRef] [PubMed]
  2. Diodato, N.; Bellocchi, G. Storminess and Environmental Changes in the Mediterranean Central Area. Earth Interact. 2010, 14, 1–16. [Google Scholar] [CrossRef]
  3. Cevasco, A.; Diodato, N.; Revellino, P.; Fiorillo, F.; Grelle, G.; Guadagno, F.M. Storminess and geo-hydrological events affecting small coastal basins in a terraced Mediterranean environment. Sci. Total Environ. 2015, 532, 208–219. [Google Scholar] [CrossRef] [PubMed]
  4. Diodato, N. Spatial uncertainty modeling of climate processes for extreme hydrogeomorphological events hazard monitoring. J. Environ. Eng. ASCE 2006, 132, 1530–1538. [Google Scholar] [CrossRef]
  5. Clarke, M.; Rendell, H. Climate, extreme events and land degradation. In Climate and Land Degradation; Sivakumar, M.V.K., Ndiang’ui, N., Eds.; Springer: Berlin, Germany, 2007; pp. 137–152. [Google Scholar]
  6. Curtis, S.; Salahuddin, A.; Adler, R.F.; Huffman, G.J.; Gu, G.; Hong, Y. Precipitation extremes estimated by GPCP and TRMM: ENSO relationships. J. Hydrometeorol. 2007, 8, 678–689. [Google Scholar] [CrossRef]
  7. Zolina, O.; Simmer, C.; Belyaev, K.; Kapala, A.; Gulev, S. Improving estimates of heavy and extreme precipitation using daily records from European rain gauges. J. Hydrometeorol. 2009, 10, 701–716. [Google Scholar] [CrossRef]
  8. Wei, W.; Chen, L.; Fu, B. Effects of rainfall change on water erosion processes in terrestrial ecosystems: A review. Prog. Phys. Geogr. 2009, 33, 1–12. [Google Scholar] [CrossRef]
  9. Cannarozzo, M.; Noto, L.V.; Viola, F. Spatial distribution of rainfall trends in Sicily (1921–2000). Phys. Chem. Earth 2006, 31, 1201–1211. [Google Scholar] [CrossRef]
  10. Sanchez, J.; Gallardo, E.C.; Gaertner, M.; Arribas, A.; Castro, M. Future climate extreme events in the Mediterranean simulated by a regional climate model: A first approach. Glob. Planet. Chang. 2004, 44, 163–180. [Google Scholar] [CrossRef]
  11. Van Rompaey, A.; Bazzoffi, P.; Jones, R.J.A.; Montanarella, L. Modeling sediment yields in Italian catchments. Geomorphology 2005, 65, 157–169. [Google Scholar] [CrossRef] [Green Version]
  12. Diodato, N.; Bellocchi, G.; Romano, N.; Guadagno, F.M. Modelling the Rainfall Erosivity of the Rhone Region Associated with Climate Variability and Storminess. Adv. Meteorol. 2016, 21, 7626505. [Google Scholar]
  13. Papathoma, M.; Dominey-Howes, D. Tsunami vulnerability assessment and its implications for coastal hazard analysis and disaster management planning, Gulf of Corinth, Greece. Nat. Hazards Earth Syst. Sci. 2003, 3, 733–747. [Google Scholar] [CrossRef]
  14. Barroca, B.; Bernardara, P.; Mouchel, J.M.; Hubert, G. Indicators for identification of urban flooding vulnerability. Nat. Hazards Earth Syst. Sci. 2016, 6, 553–561. [Google Scholar] [CrossRef]
  15. Lionello, P.; Bhend, J.; Buzzi, A.; Della-Marta, P.M.; Krichak, S.O.; Jansà, A.; Maheras, P.; Sanna, A.; Trigo, I.F.; Trigo, R. (Eds.) Cyclones in the Mediterranean region: Climatology and effects on the environment. In Mediterranean Climate Variability; Elsevier: Amsterdam, The Netherlands, 2006; pp. 325–372.
  16. Mazzarella, A. Multifractal dynamic rainfall processes in Italy. Theor. Appl. Climatol. 1999, 63, 73–78. [Google Scholar] [CrossRef]
  17. Aronica, G.T.; Brigandí, G.; Morey, N. Flash floods and debris flow in the city area of Messina, north-east part of Sicily, Italy in October 2009: The case of the Giampilieri catchment. Nat. Hazards Earth Syst. Sci. 2012, 12, 1295–1309. [Google Scholar] [CrossRef]
  18. Schilirò, L.; Esposito, C.; Scarascia Mugnozza, G. Evaluation of shallow landslide-triggering scenarios through a physically based approach: An example of application in the southern Messina area (northeastern Sicily, Italy). Nat. Hazards Earth Syst. Sci. 2015, 15, 2091–2109. [Google Scholar] [CrossRef]
  19. Aronica, G.T.; Brigandì, G.; Marletta, C.; Manfre, B. Hydrological and hydraulic analysis of the flash flood event on 25 October 2007 in North-Eastern part of Sicily, Italy. In Proceedings of the Floodrisk 2008, Oxford, UK, 30 September–2 October 2008.
  20. Cama, M.; Lombardo, L.; Conoscenti, C.; Agnesi, V.; Rotigliano, E. Predicting storm-triggered debris flow events: Application to the 2009 Ionian Peloritan disaster (Sicily, Italy). Nat. Hazards Earth Syst. Sci. 2015, 15, 1785–1806. [Google Scholar] [CrossRef] [Green Version]
  21. Petrucci, O.; Polemio, M. The use of historical data for the characterisation of multiple damaging hydrogeological events. Nat. Hazards Earth Syst. Sci. 2003, 3, 17–30. [Google Scholar] [CrossRef]
  22. Drago, A.; Cartabellotta, D.; Lo Bianco, B.; Lombardo, M. Atlante Climatologico della Regione Siciliana; Assessorato Regionale Agricoltura e Foreste, UO di Agrometeorologia: Palermo, Iatly, 2000. [Google Scholar]
  23. Istituto Superiore per la Protezione e la Ricerca Ambientale (ISPRA). Geological Map of Italy, 1:50,000 Scale. Istituto Superiore per la Protezione e la Ricerca Ambientale (ISPRA): Rome, 2009. Available online: http://www.isprambiente.gov.it/Media/carg/ (accessed on 16 June 2016). [Google Scholar]
  24. Ingemi, D. Alluvione nel Messinese Tirrenico: Analisi di un Fenomeno Eccezionale Provocato Dall’effetto “Alcantara-Agrò”. 2011. Available online: http://www.meteoweb.eu/2011/11/alluvione-nel-messinese-tirrenico-analisi-di-un-fenomeno-eccezionale-provocato-dalleffetto-alcantara-agro/99210/ (accessed on 17 July 2016).
  25. Jenkinson, A.F. The frequency distribution of the annual maximum (or minimum) values of meteorological elements. Q. J. R. Meteorol. Soc. 1955, 81, 158–171. [Google Scholar] [CrossRef]
  26. Garbrecht, J.; Fernandez, G.P. Visualization of trends and fluctuations in climatic records. Water Resour. Bull. 1994, 30, 297–306. [Google Scholar] [CrossRef]
  27. Fiorillo, F.; Guadagno, F.M.; Aquino, S.; De Blasio, A. The December 1999 Cervinara landslides: Further debris flow in the pyroclastic deposits of Campania (Southern ltaly). Bull. Eng. Geol. Environ. 2001, 60, 171–184. [Google Scholar] [CrossRef]
  28. McCuen, R.H. Modelling Hydrologic Change; Lewis Publishers, CRC Press, Taylor & Francis Group: Boca Raton, FL, USA, 2003; p. 434. [Google Scholar]
  29. Battaglia, F.; Orfei, L. Outlier detection and estimation in nonlinear time-series. J. Time Ser. Anal. 2005, 26, 107–121. [Google Scholar] [CrossRef]
  30. McKee, T.B.; Doesken, N.J.; Kleist, J. The relationship of drought frequency and duration to time scales. In Proceedings of the 8th Conference on Applied Climatology, Anaheim, CA, USA, 17–22 January 1993; American Meteorological Society: Boston, MA, USA, 1993; pp. 179–184. [Google Scholar]
  31. Fiorillo, F.; Guadagno, F.M. Karst Spring Discharges Analysis in Relation to Drought Periods, Using the SPI. Water Resour. Manag. 2010, 24, 1867–1884. [Google Scholar] [CrossRef]
  32. Bonaccorso, B.; Cancelliere, A.; Rossi, G. Detecting trends of extreme rainfall series in Sicily. Adv. Geosci. 2005, 2, 7–11. [Google Scholar] [CrossRef]
  33. Notaro, V.; Liuzzo, L.; Freni, G.; La Loggia, G. Uncertainty Analysis in the Evaluation of Extreme Rainfall Trends and Its Implications on Urban Drainage System Design. Water 2015, 7, 6931–6945. [Google Scholar] [CrossRef]
  34. D’Asaro, F.; D’Agostino, L.; Bagarello, V. Assessing changes in rainfall erosivity in Sicily during the twentieth century. Hydrol. Process. 2007, 21, 2862–2871. [Google Scholar] [CrossRef]
  35. Polemio, M.; Petrucci, O. The occurrence of floods and the role of climate variations from 1880 in Calabria (Southern Italy). Nat. Hazards Earth Syst. Sci. 2012, 12, 129–142. [Google Scholar] [CrossRef]
  36. Fiorillo, F.; Wilson, R.C. Rainfall induced debris flows in pyroclastic deposits, Campania (southern Italy). Eng. Geol. 2004, 75, 263–289. [Google Scholar] [CrossRef]
Figure 1. (A) The mouth of Longano River on the morning of 23 November 2011, and the bridge collapsed after the flood; (B) tree trunks obstruct the river flow in town center of Barcellona Pozzo di Gotto; (C) debris flows hit Varela village, Mela river catchment; and (D) a debris avalanche struck houses in Scarcelli village, Saponara municipality, and caused three deaths.
Water 08 00330 g001
Figure 2. The northeastern sector of Sicily, characterized by the Peloritani ridge, extended between the Tyrrhenian and Ionian sea; (1) rain gauge network working and rainfall recorded on 22 November 2011; (2) catchment boundary of the Peloritani ridge, Tyrrhenian side; (3) catchment of Longano (A), Idria (B), Mela (C) and Saponara (D) torrent affected by floods on 22 November 2011; and (4) the area hit by landslides on 22 November 2011. Damage occurred mainly in the villages of Barcellona Pozzo di Gotto and Saponara, which are highlighted by the white circles.
Water 08 00330 g002
Figure 3. Seasonal regime of different percentile values for the Messina municipality (mean data, 1965–1994 period).
Water 08 00330 g003
Figure 4. Satellite imagines (EUMETSAT, IR 10.8), every 2 h of the 22 November 2011, between 03:00 and 19:00. The white zones are the colder clouds, and the enhanced-V shape develops on Northeastern Sicily.
Water 08 00330 g004
Figure 5. 22 November 2011 rainfall reconstructed by kriging interpolation on available rain gauge of Table 1.
Water 08 00330 g005
Figure 6. Hourly rainfall of 22 November 2011 for several rain gauges.
Water 08 00330 g006
Figure 7. Transformation from GEV distribution to Standard normal distribution.
Water 08 00330 g007
Figure 8. Rainfall of 22 November 2011 reconstructed by kriging interpolation on available rain gauges (1) and TRMM satellite data (2).
Water 08 00330 g008
Figure 9. Return time for different rainfall durations (Castroreale rain gauge). Historical data for 1, 3, 6, 12, and 24 h (white and blue circles) are fitted by the GEV (cumulative) frequency distribution. Triangles show the return times of 22 Novenber 2011 on the GEV curves. (A) Analysis with n.65 data for the 1930–2010 period (without 2011 data); and (B) analysis with n.66 data of the 1930–2011 period (with 2011 data).
Water 08 00330 g009
Figure 10. Annual maximum hourly rainfall, 1, 3, 6, 12, and 24 h time series (blue circles), expressed as Z value of the Standard normal distribution; progressive accumulation (RAPS) is also plotted (black line).
Water 08 00330 g010
Figure 11. Annual maxima hourly rainfall, transformed from GEV distribution, fitted by the Standard normal distribution. Higher values of Z are classified following the SPI; the outlier zone has been defined following Chauvenet’s method.
Water 08 00330 g011
Table 1. Rainfall recorded on 22 November 2011 by the rain gauges network.
NetworkRain GaugeElevation (m a.s.l.)Accumulated Rainfall between 0:00 and 24:00; (mm)
OSSERVATORIO DELLE ACQUEMilazzo290.9
Ziriò—(Saponara)86070.9
Castroreale383351
Montalbano E.92913.6
S.Stefano Briga13920
Messina (Ist.Geof.)503
S.Piero Patti4403.2
SIASTorregrotta60188.8
Montalbano E.12508.4
San Pier Niceto46057.8
Antillo796116.2
Novara di Sicilia75054.8
Patti705.4
Fiumedinisi44057.6
Messina23011.8
Table 2. Historical maxima recorded at the Castroreale rain gauge, for different time intervals.
Time Series1 h3 h6 h12 h24 h
period 1930–2010, 65 years (mm)62.8124.8185222318
22 November 2011 storm (mm)72.5162.5254.8348.2351
Table 3. Z values reached for the most intense storm recorded.
Categories of MaximaStorm Year1 h3 h6 h12 h24 h
ExtremeZ ≥ 219782.04
20082.05
20112.212.472.522.532.13
Severe1.5 ≤ Z < 219431.561.66
19491.831.97
19781.911.98
19951.74
20041.82
20081.971.80
20101.611.821.861.75

