Article

Effects of Rainfall Intensity and Duration on the First Flush from Parking Lots

by
Kenneth C. Schiff
*,
Liesl L. Tiefenthaler
,
Steven M. Bay
and
Darrin J. Greenstein
Southern California Coastal Water Research Project, Costa Mesa, CA 92626, USA
*
Author to whom correspondence should be addressed.
Water 2016, 8(8), 320; https://doi.org/10.3390/w8080320
Submission received: 1 June 2016 / Revised: 20 July 2016 / Accepted: 25 July 2016 / Published: 28 July 2016
(This article belongs to the Special Issue Urban Drainage and Urban Stormwater Management)

Abstract

:
Urban stormwater with large impervious (paved) areas often produces runoff with a variety of contaminants. Although southern California is among the most urbanized coastal areas in the United States, the effect of rainfall variations on washoff efficiency of contaminants from pervious and impervious surfaces is largely unknown. The goal of this study was to investigate the effect of varying rainfall intensities and duration on runoff composition from highly impervious parking lots. In order to control the tremendous natural variability in precipitation of the arid climate in southern California, rainfall simulators were used to generate and quantify pollutant washoff at changing intensities and durations. Washoff of suspended solids, total and dissolved trace metals, and polycyclic aromatic hydrocarbons was strongly inversely correlated with rainfall duration. Rainfall intensity only affected washoff at the smallest measured duration; higher intensities produced decreased concentrations. The effect of rainfall duration was a reflection of the first flush observed in pollutographs for every duration and intensity sampled. Peak concentrations, up to an order of magnitude higher than concentrations later in the event, occurred during the first 10 min after the onset of rainfall. Longer simulated storms effectively diluted the first flush.

1. Introduction

Urban stormwater runoff mobilizes a variety of contaminants to coastal oceans and inland waterways, affecting their water quality [1,2,3]. These contaminants come from different residential, commercial, and industrial land uses within a watershed [4,5]. As development increases and land use activities change and intensify, the concentrations and types of contaminants also increase [6]. Although all land uses can affect water quality, natural processes in undeveloped areas can lessen the impact of contaminants or even remove contaminants from runoff through infiltration [7]. Impervious areas (paved surfaces) reduce the opportunity for natural processes to treat stormwater. Bannerman et al. [8] identified critical source areas (areas with relatively large contaminant loads) within residential, commercial and industrial land uses. In particular, streets and parking lots were found to be critical source areas for most contaminants within all land use types.
Several physical mechanisms control the stormwater quality in critical source areas including pollutant buildup and washoff [3,9]. Contaminants will accumulate on parking lots over time from vehicle traffic and from the continual deposition of atmospheric contaminants. Pollutant build-up is amplified in arid urban environments, such as those in southern California, USA [10]. Rain is infrequent (10–12 storms per season) and pollutants can build up over extended time periods (80% of rainfall occurs from January through March and <5% of rainfall occurs between April and October). Moreover, southern California is intensely urbanized, with more than 17 million people living within 50 km of the coast, the densest coastal population of any region in the USA [11]. Finally, when storms do occur, rainfall is often intense, increasing flows in coastal rivers from <1 to >10,000 cfs in less than two hours [12].
Physical mechanisms, including pollutant build-up, but especially pollutant wash-off, that control urban stormwater quality are not well understood [13], particularly in arid urban environments. The goal of this paper was to answer the question: do concentrations of pollutants in stormwater runoff change with varying rainfall intensities and durations in an arid environment? We explored these rainfall-runoff quality relationships using parking lots, which are critical source areas with almost 100% imperviousness. Since rainfall is infrequent and uncontrollable in arid environments, we used rainfall simulators to mimic storms. This technique provided complete control of all other physical factors that influence runoff, enabling rainfall duration and intensity to be varied independently or together. Environmental managers in southern California and other arid environments can use this information for increasing the effectiveness of management practices by targeting the times or conditions with greatest runoff concentrations.
Two experimental approaches were used during this study. The first approach focused on understanding within-storm variability. This sampling approach enabled an evaluation of the within-storm pollutant washoff phenomenon including “first flush”. Two different sampling designs were employed to accomplish this experimental approach. For those constituents that are easy and inexpensive to measure, discrete sampling every two minutes over the course of the entire simulated storm event was conducted to create a storm “pollutograph”. The second sampling design for assessing within-storm variability divided simulated events into discrete sections. Since we had complete control of the rainfall, samples were collected representing the first quarter (0–10 min), the second quarter (10–20 min), and the remaining half (20–40) of a 40 min simulated event. This enabled an evaluation of within-storm changes in concentrations, but without the added resource burden of sampling every two minutes.
The second experimental approach was to assess among-storm variability induced by differences in rainfall intensity and duration. Since all of the runoff volume was captured during each simulated storm event, storm composite samples were collected representing a census of the entire storm discharge. An unbalanced factorial sampling design was selected to measure the effects of three rainfall intensities (6.3, 12.7, and 25.4 mm/h) and three rainfall durations (10, 20, and 40 min) on contaminant washoff from parking lots. A total of nine combinations of treatments were applied. Three rainfall durations were tested across a single rainfall intensity (6.3 mm/h). Three rainfall intensities were tested across a single duration (20 min). A single runoff volume was evaluated using three simulations of varying levels of rainfall intensity and duration (6.3 mm/h at 40 min, 12.7 mm/h at 20 min, and 25.4 mm/h at 10 min). All treatments were applied on three replicate parking lot surfaces.

2. Materials and Methods

2.1. Study Area

Samples were collected at Long Beach City College in the City of Long Beach, the fifth largest city in California with an estimated population of 440,000 citizens living in a 50-square-mile area [14]. The parking lot, which was constructed of 100% asphalt, had a capacity of 50 cars with a dimension of approximately 20 m by 20 m and a 4% grade. The lot operated seven days per week with five days at full capacity and received no maintenance (i.e., street sweeping or cleaning) during the study period. Turnover rates in the parking lot were measured at 45 cars per hour.
All parking lots were pre-cleaned at the beginning of the study using a professional high-pressure cleaning system to ensure similar initial accumulations on each parking lot surface. The parking lots were left untested for a three-month dry period to allow for accumulation before treatments were applied.

2.2. Rainfall Simulations

Rainfall was simulated using three identical spray rigs each comprised of polyvinylchoride (PVC) pipes with inline pressure gauge, flow meter, control valve, and either Rainbird™ or Hunter™ PGM rotating polyurethane spray heads. One fixed-rate Rainbird™ spray head at 45/36 pounds per square inch (psi) and 5.0 L per min (L/min) flow produced a 3.8 m radius semicircle with an intensity of 12.7 mm/h. This system provided a relatively uniform simulated rainstorm washing off two parking stalls for a total area of 22.7 m2. Approximated rainfall intensities were determined for two types of storm events that occur in southern California. Typical (6 mm/h) and worst-case (25 mm/h) rainfall intensities were simulated using two Hunter™ spray heads with 0.75 gallon-per-minute (gpm) emitters while also varying the pressure and flow rate. Simulating rainfall for a period of 20 min at an intensity of 12.7 mm/h resulted in a total runoff volume of 104.1 L.
The rainfall simulators were designed to isolate and capture the entire volume of the surface runoff from each sampling site. The surface runoff generated by the rainfall simulators was collected continuously during each simulation run using a vacuum system that transferred runoff into a pre-cleaned 208 L (55-gallon) plastic barrel. At the end of each simulated event, the runoff collected in each barrel was stirred vigorously and subsamples for chemistry samples were taken.
A series of quality assurance and quality control (QA/QC) performance evaluations were conducted on all rainfall simulators including pretreatment of source water, evenness of spread, and precision of pressure, flow rate and volume to ensure accuracy and reproducibility among and within spray rigs. Source water was passed through a portable filtration system comprised of three inline cartridges with activated carbon to remove chlorine, sediments, and toxic constituents prior to each simulation. Pretreated water was consistently below constituent detection limits. Rainfall simulators were calibrated prior to each test to ensure that the mean targeted rainfall intensity had <20% coefficient of variation among nine rainfall collectors evenly spaced within the spray pattern of each spray rig.

2.3. Analytical Chemistry

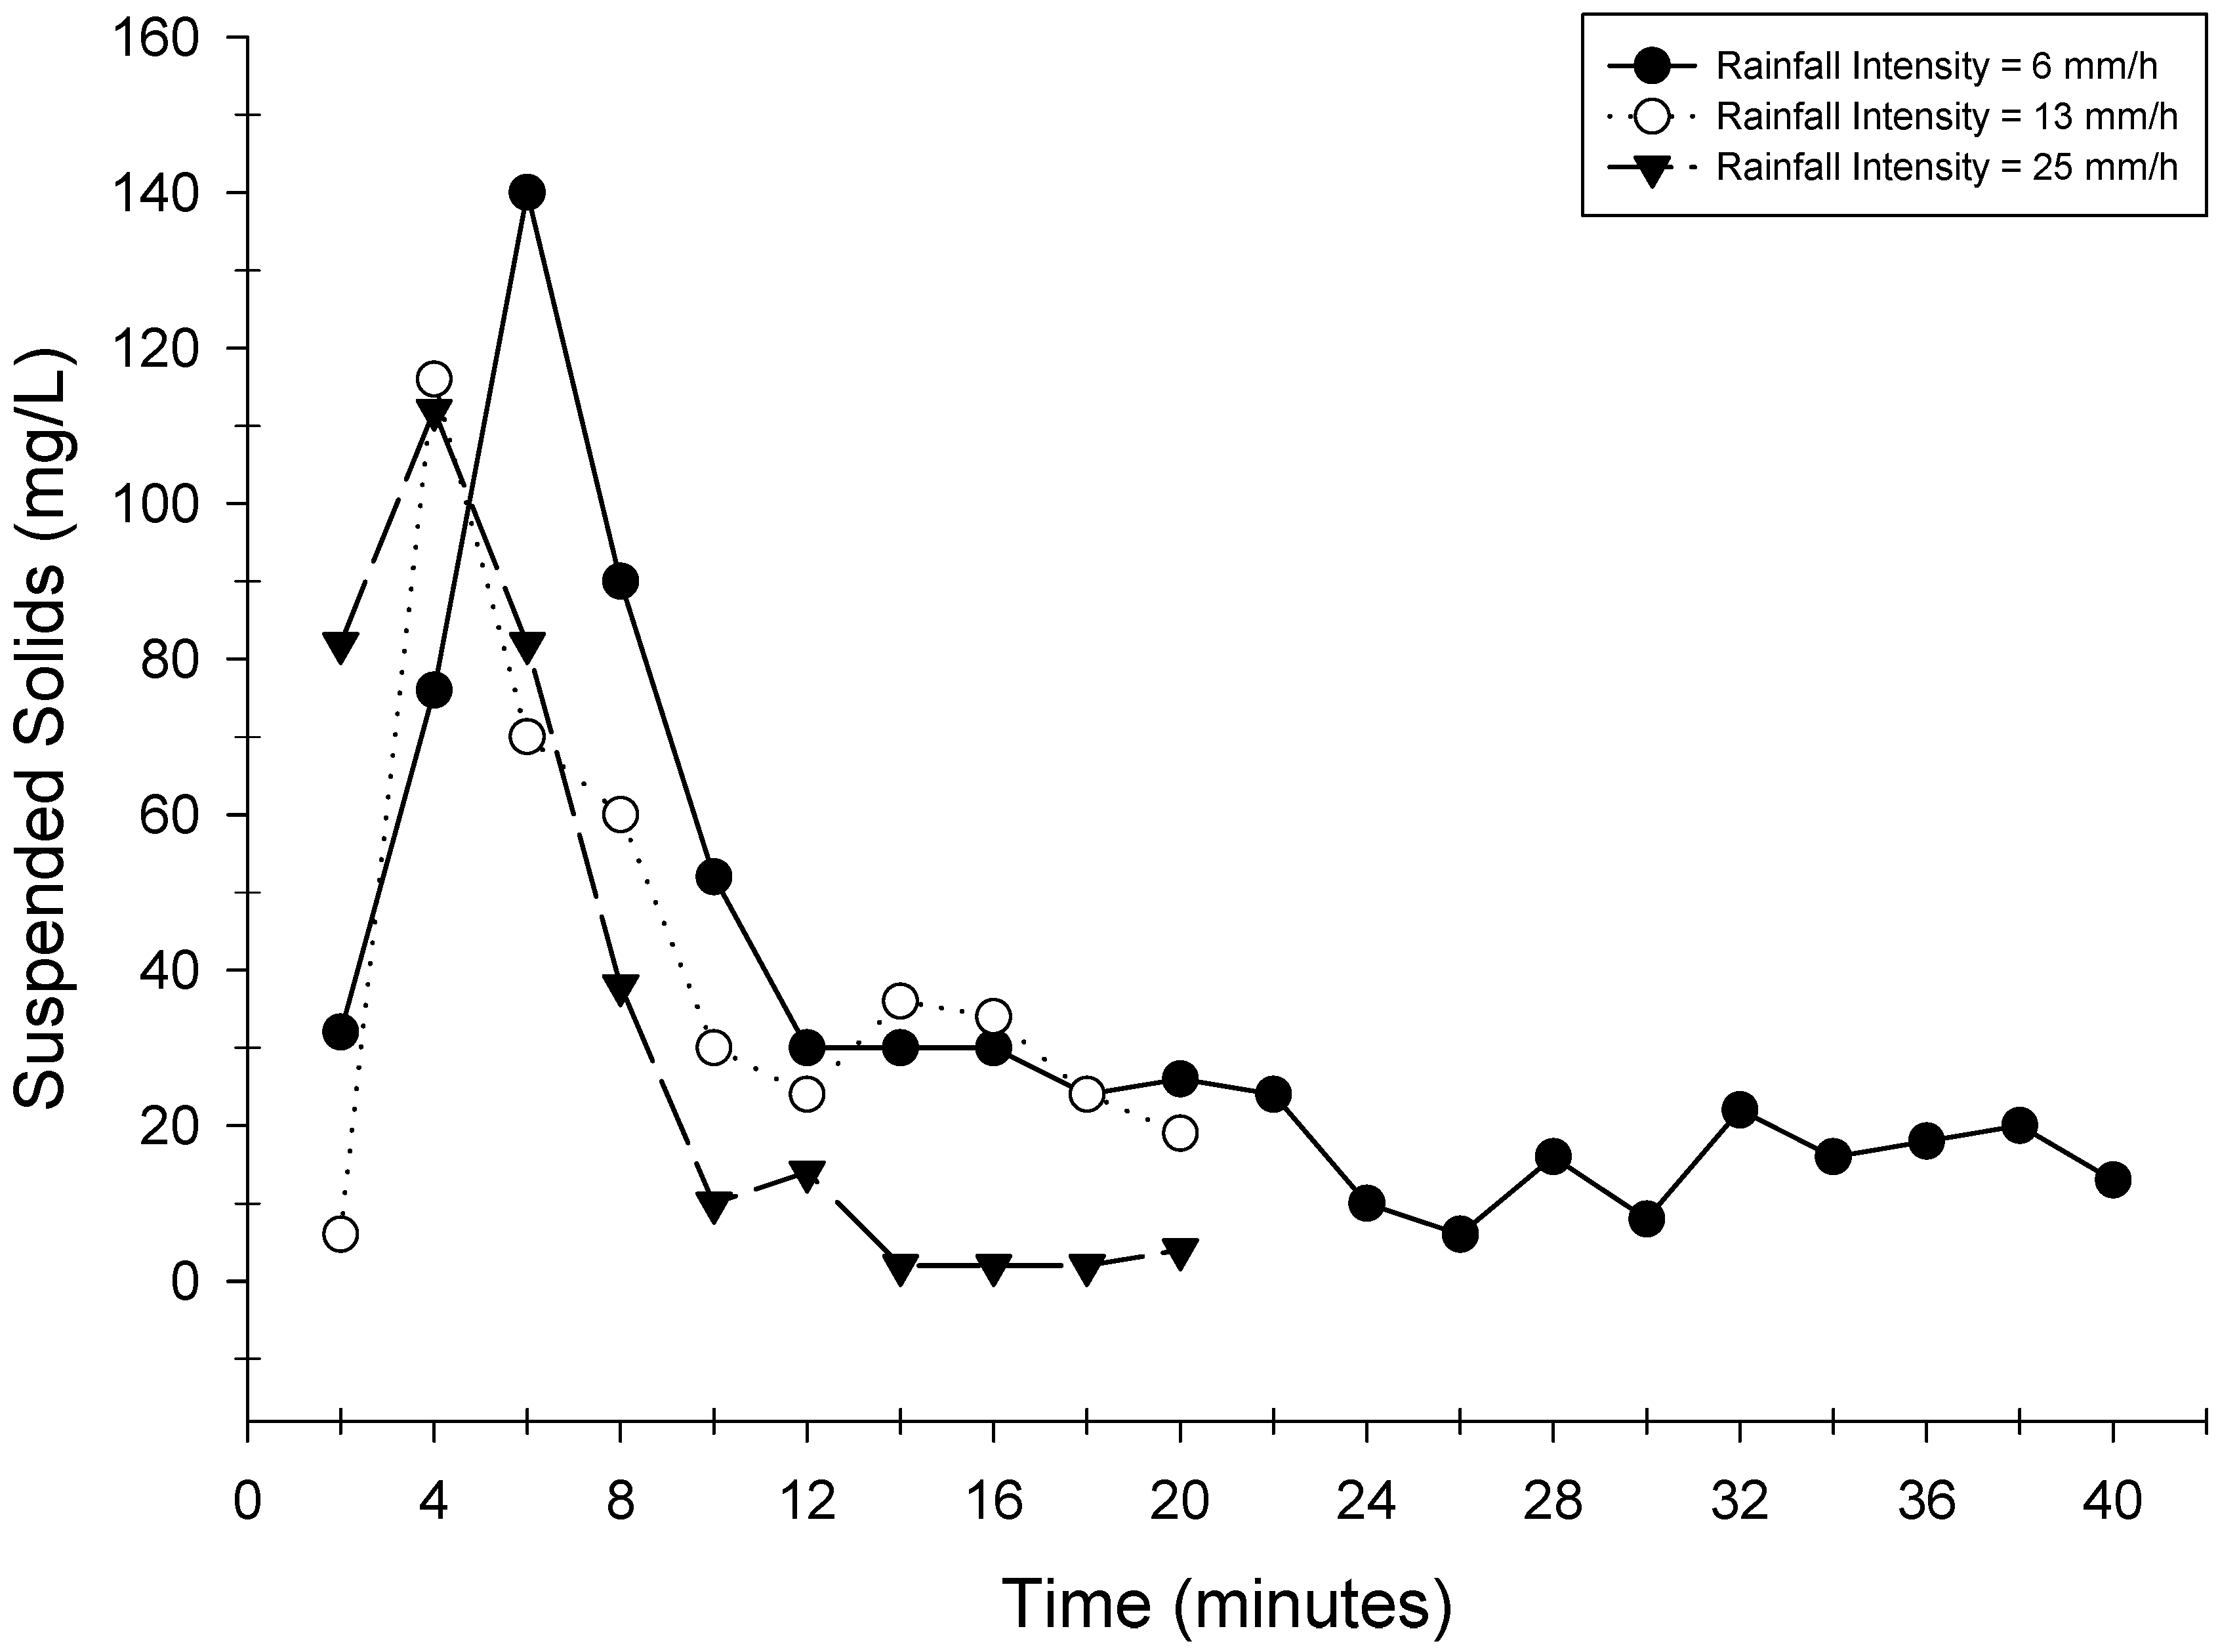
2.3.1. Suspended Solids

Total suspended solids (TSS) were analyzed by filtering a 10 to 100 mL aliquot of stormwater through a tared 1.2 μm (micron) Whatman GF/C filter (EPA Method 160.2). The filters plus solids were dried at 60 C for 24 h, cooled, and weighed.

2.3.2. Trace Metal Analysis

Samples for total and dissolved trace metal analysis were prepared by digestion. Dissolved metals were defined as passing through a 0.45 μm filter. A well-mixed, 25 mL aliquot of acidified sample was dispensed to a Teflon digestion vessel and 2 mL of ultra-pure HNO3 (Optima, Fisher Scientific, Pittsburgh, PA, USA) were added, and the vessel was capped and sealed. The acidified samples were digested in a CEM MSP1000 Microwave Oven by ramping to 100 psi over 15 min and then holding at 100 psi for 10 min. After cooling, the digestate was centrifuged to remove any remaining residue from the sample. The supernatant with sample digest was transferred to a 15 mL test tube prior to analysis.
Inductively coupled plasma-mass spectroscopy (ICP-MS) was used to determine total and dissolved concentrations of inorganic constituents (aluminum, antimony, arsenic, beryllium, cadmium, chromium, copper, iron, lead, mercury, nickel, selenium, silver, and zinc) from sample digest solutions using a Hewlett Packard Model 4500 and following protocols established by EPA Method 200.8, EPA Method 236.1 and 236.2, and by EPA Modified Method 245.1 [15]. The internal standard solution included rhodium and thulium. Instrument blanks were processed to identify sample carry-over. A spiked sample of known concentration was used as the laboratory control material. The Certified Reference Material was ERA 9970 and ERA 9977 (Environmental Resource Associates, WasteWatR Lot No. 9970 and 9977, respectively).

2.3.3. Polycyclic Aromatic Hydrocarbons

Twenty-six polycyclic aromatic hydrocarbons (PAHs) were extracted, isolated, and analyzed using the procedures documented by EPA Method 8270C. The PAHs were separated, identified, and quantified by capillary gas chromatography (GC) coupled to mass spectrometry (MS). Acenaphthene and Pyrene were used for quality control check standards. Twenty-five specific PAHs were determined for this study. Total PAHs (∑PAH) was computed as the sum of these values.

2.4. Data Analysis

The two approaches to sampling the simulated rainfall events were presented for comparing rainfall intensity and duration. First, within storm variability was assessed by comparing pollutographs for suspended solids. The pollutographs were examined for peak concentrations early in the event indicative of a first flush. The concentrations of suspended solids, total and dissolved trace metals, and total PAH were compared for three different sections within the storm. These included 0–10, 10–20, and 20–40 min of a 40 min simulated event with a constant 6.3 mm/h intensity. The concentrations early in the event were compared to concentrations later in the event to assess first flush. Significant differences among mean concentrations of the storm segments were determined by ANOVA using Tukey tests for multiple comparisons for determining differences among treatments. All sample concentrations below detection limits were treated as zero.
The second approach compared event mean concentrations for suspended solids, total and dissolved trace metals, and total PAH. The mean concentrations are compared in three fashions: (1) different durations of the same rainfall intensity (10, 20 and 40 min at 6.3 mm/h); (2) different intensities of the same duration (6.3, 12.7, 25.4 mm/h for 20 min); and (3) the same total runoff volume by manipulating both intensity and duration (6.3 mm/h for 40 min, 12.7 mm/h for 20 min, 25.4 mm/h for 10 min). Significant differences among mean concentrations were determined by ANOVA using Tukey tests for multiple comparisons for determining differences among treatments.

3. Results

Pollutographs showed that suspended solids concentrations were highest at the beginning (first flush) and not at the end of simulated storm events (Figure 1). Peak pollutograph concentrations occurred within the first 4 to 6 min of each simulated event, decreasing to relatively consistent baseline concentrations after 10 to 12 min. The magnitude of the first-flush effect varied between intensities, ranging from 112 mg/L in the 25 mm/h rainfall intensity to 140 mg/L in the 6 mm/h rainfall intensity. The relatively consistent baseline concentrations varied from 2 mg/L in the 25 mm/h rainfall intensity to 20 mg/L in the 6 mm/h rainfall intensity.
Similar to the pollutograph results, concentrations of total and dissolved trace metals and total PAHs were consistently higher in the first 10 min of the simulated events than in later portions of the storm (Table 1). The concentrations for 31 of 32 constituents in Table 1 were higher in the runoff during the first 10 min of the simulated rainfall events than in runoff from the next 10 min segment of the storm. The initial runoff concentrations for all 32 constituents were, on average, a factor of 2.4 times higher than concentrations during the 10–20 min segment of the simulated event. The concentrations of all 32 constituents were reduced even more by the last half of the simulated storm event. The initial runoff concentrations were, on average, a factor of 5.4 times higher than concentrations during the 20–40 min segment of the simulated event.
Washoff of all measured constituents was inversely correlated with rainfall duration, regardless of intensity (Table 2). Longer simulated storms significantly lowered the concentrations of contaminants in parking lot runoff. For example, mean total zinc concentrations measured in the 10 min simulated event at the 6.3 mm/h rainfall intensity decreased from 430 μg/L to 322 μg/L measured during the 20 min simulated storm. Mean total zinc concentrations then significantly decreased to 240 μg/L during the 40 min simulated event at that same rainfall intensity (F = 12.4, p = 0.01). In addition, mean event concentrations of zinc, and every other constituent measured, decreased between the 10 and 20 min simulated events at the 25.4 mm/h rainfall intensity.
Washoff of all measured constituents was inversely correlated with rainfall intensity at the 20 min rainfall duration (Table 2). The lowest rainfall intensity consistently had the highest concentrations during the 20 min simulated storm events. For example, mean total zinc concentrations measured during the 20 min simulated storm significantly decreased from 322 μg/L in the 6.3 mm/h rainfall intensity to 143 μg/L in the 25.4 mm/h rainfall intensity (F = 34.5, p = 0.00).
Simulated storm events of longer duration and less intensity generally produced washoff with higher mean constituent concentrations than simulated events of shorter duration with higher rainfall intensities (Table 2). Twenty-eight of 32 constituents, including all of the dissolved trace metals, exhibited higher mean concentrations during simulated events of 6.3 mm/h for 40 min compared to the other higher intensity, shorter duration events. For example, three storms, all producing approximately 104 L total runoff volume, had total zinc concentrations ranging from 240 to 143 μg/L with the 12.7 mm/h intensity, 20 min duration simulated event having the lowest concentration. While the low intensity, longer duration events had consistently higher mean concentrations, there was sufficient variability among replicate sites that no significant differences among concentrations with the other two intensity-duration combinations existed.
Median dissolved metals concentrations comprised up to 90% of the total metals concentrations (Table 2). Among the eight metals analyzed, five metals (Ni, Cd, Cu, Pb, and Zn) were present mostly in dissolved form (90.1%, 89.9%, 84.5%, 76.0%, and 75.3%, respectively). The proportion of dissolved metals remained relatively similar among rainfall intensities and durations. For example, dissolved zinc comprised 78.2% to 78.7% of the total zinc measured at all three durations during the 6.3 mm/h intensity simulated events. Similarly, dissolved zinc comprised 65.4% to 78.7% of the total zinc measured at all three intensities during the 20 min duration simulated events.

4. Discussion

Changes in rainfall duration had a greater effect on constituent concentrations than rainfall intensity during this study. This relationship can be explained by the mechanism of runoff observed in pollutographs created during the simulated rain events. A distinct first flush with peak concentrations up to 10-fold greater than concentrations later in the event occurred in every storm event sampled. In all cases, the first flush was completed within 10 min after the onset of rainfall. Given the first flush washoff phenomenon, any storm lasting more than 10 min would only serve to dilute the first flush.
Other studies have documented a similar correlation among rainfall duration and intensity as we produced in our simulated rainfall study [16,17,18,19]. For example, Dorman et al. [20] measured higher concentrations of pollutants in runoff from small arid urban catchments in Austin, Texas, during shorter, low-volume, naturally occurring storm events. This was precisely what we were able to produce from highly impervious surfaces in arid southern California. In contrast, other investigators [21,22,23] either have not observed a first flush or the first flush was not correlated to rainfall characteristics. For example, Han et al. [24] measured first flush for TSS and trace metals during natural storm events from heavily used roadways in southern California, but no relationships were observed with rainfall depth, intensity, or duration. Runoff from traffic surfaces can be influenced by other factors including changing rainfall intensities during natural events (especially if intensity increases towards the end of a storm), seasonal variations, and dry weather periods between events or volume of traffic (both of which influence pollutant build-up in arid systems).
The concentrations we observed in runoff from artificial rainfall on parking lots in southern California are comparable to parking lot runoff concentrations measured by others globally. For example, we measured total zinc concentrations that ranged from 143 to 430 μg/L, and runoff concentrations from parking lots compiled by Huber et al. [9] across multiple continents averaged 201 μg/L (range 39 to 620 μg/L). The total trace metal concentrations for cadmium, chromium, copper, and nickel were also within the range of concentrations compiled by Huber et al. [9]. For lead, the range of southern California parking lot runoff concentrations measured herein were higher—up to an order of magnitude higher—than global parking lot concentrations (34 to 169 μg/L compared to 3 to 66 μg/L, respectively). The sources of these higher lead concentrations are unknown.
In our study, we found that many trace metals in runoff from parking lots were present predominantly in the dissolved fraction and are therefore a potential source of toxicity. Dissolved trace metals—zinc and copper in particular—have been implicated in toxicity to marine organisms throughout southern California [25]. Toxicity identification evaluations that applied treatments to remove solids did not reduce toxicity, but treatments that bound trace metals (i.e., the addition of EDTA) eliminated virtually all toxicity [26]. These results have been observed not only in stormwater discharges from urbanized watersheds, but from samples collected from large coastal plumes emanating from urbanized watersheds following rain events [27].
Several studies have measured runoff and contaminant concentrations on roads and highways [28,29,30]. Others, such as Pitt and McLean [31] and Bannerman et al. [8], characterized parking lots as critical source areas contributing disproportionately large contaminant loads, particularly during small rain events. If parking lots are disproportionately large contributors of pollutants and may be contributing to receiving water impacts such as toxicity, then the results of these intensity and duration experiments indicate that stormwater capture and/or treatment systems that focus on the initial portion of stormwater discharge from parking lots are likely to provide great benefit in reducing constituent concentrations. For example, management actions that focused on the first 10 min of a 40 min storm event would mitigate 69.4% of the suspended solid mass emissions. However, several factors need to be considered when designing best management practices (BMPs) including sizing, trapping and treatment efficiency for specific constituents of concern (including dissolved trace metal fractions) and flood protection, among others.

5. Conclusions

The main purpose of this study was to investigate how variations in rainfall intensity and duration affected parking lot surface runoff concentrations. Rainfall simulators were used to control precipitation, varying intensity and duration while keeping other physical parameters constant. Washoff of all constituents was strongly inversely correlated with rainfall duration and intensity. Parking lot runoff samples collected during the first 10 min of a rain event contained the highest constituent concentrations, indicating the presence of a first-flush phenomenon in these rainfall simulations. Longer simulated storms significantly lowered the average concentration of most constituents observed in parking lot runoff. Increases in rainfall intensity decreased the magnitude of the first flush, but the importance of rainfall intensities decreased with longer duration.

Acknowledgments

The authors wish to thank Property Prep Inc. and Wastewater Remediation for construction of the rainfall simulators. The authors are also indebted to the following SCCWRP personnel who assisted in this project: Jeffrey Brown, Dario Diehl, Ehren Doris, Kim Johnson, Julie Kalman, Andrea Steinberger, and David Tsukada. This work was partially funded by the City of Long Beach, CA, USA.

Author Contributions

Kenneth C. Schiff and Steven M. Bay conceived and designed the experiments; Liesl L. Tiefenthaler and Darrin J. Greenstein performed all of the field and laboratory logistics. Physis Laboratories conducted all of the chemical analysis. Kenneth C. Schiff and Liesl L. Tiefenthaler analyzed the data and wrote the paper.

Conflicts of Interest

The authors declare no conflict of interest. Trade names do not constitute an endorsement. The funding sponsors had no role in the design of the study; in the collection, analyses, or interpretation of data; in the writing of the manuscript, and in the decision to publish the results.

Abbreviations

The following abbreviations are used in this manuscript:
AlAluminum
ANOVAAnalysis of Variance
BMPBest Management Practice
CdCadmium
Cfscubic feet per second
CrChromium
CuCopper
EPAEnvironmental Protection Agency
GCGas chromotography
Kmkilometer
km2square kilometers
L/minLiters per minute
Minminutes
mLmilliliter
mm/hrmillimeters per hour
MSMass spectrometry
NiNickel
PAHPolycyclic aromatic hydrocarbons
∑PAHTotal PAH
PbLead
Psipounds per square inch
PVCPolyvinyl chloride
SDStandard deviation
TSSTotal Suspended Solids
μg/Lmicrograms per liter
ZnZinc

References

  1. Cole, R.H.; Frederick, R.E.; Healy, R.P.; Rolan, R.G. Preliminary findings of the priority pollutant monitoring project of the nationwide urban runoff program. J. Water Pollut. Control Fed. 1984, 56, 898–908. [Google Scholar]
  2. Smullen, J.T.; Shallcross, A.L.; Cave, K.A. Updating the US nationwide urban runoff quality data base. Water Sci. Technol. 1999, 39, 9–16. [Google Scholar] [CrossRef]
  3. Revitt, D.M.; Lundy, L.; Coulon, F.; Fairley, M. The sources, impact and management of car park runoff pollution: A review. J. Environ. Manag. 2014, 146, 552–567. [Google Scholar] [CrossRef] [PubMed]
  4. Tiefenthaler, L.L.; Stein, E.D.; Schiff, K.C. Watershed and land use–based sources of trace metals in urban storm water. Environ. Chem. 2008, 27, 277–287. [Google Scholar] [CrossRef] [PubMed]
  5. Stenstrom, M.K.; Silverman, G.S.; Bursztynsky, T.A. Oil and grease in urban stormwater. J. Environ. Eng. 1984, 110, 58–72. [Google Scholar] [CrossRef]
  6. Schueler, T.R.; Kumble, P.A.; Hearty, M.A. A Current Assessment of Urban Best Management Practices: Techniques for Reducing Nonpoint Source Pollution in the Coastal Zone; Anacostia Restoration Team, Department of Environmental Programs, Metropolitan Washington Council of Governments: Washington, DC, USA, 1992.
  7. Barrett, M.E.; Walsh, P.M.; Malina, J.F., Jr.; Charbeneau, R.J. Performance of vegetative controls for treating highway runoff. J. Environ. Eng. 1998, 124, 1121–1128. [Google Scholar] [CrossRef]
  8. Bannerman, R.T.; Owens, D.W.; Dodds, R.B.; Hornewer, N.J. Sources of pollutants in Wisconsin stormwater. Water Sci. Technol. 1993, 28, 241–259. [Google Scholar]
  9. Huber, M.; Welker, A.; Helmreich, B. Critical review of heavy metal pollution of traffic area runoff: Occurrence, influencing factors, and partitioning. Sci. Total Environ. 2016, 541, 895–919. [Google Scholar] [CrossRef] [PubMed]
  10. Ackerman, D.; Schiff, K.C.; Weisberg, S.B. Evaluating HSPF in an arid, urbanized watershed. J. Am. Water Resour. Assoc. 2005, 41, 477–486. [Google Scholar] [CrossRef]
  11. Culliton, T.; Warren, M.; Goodspeed, T.; Remer, D.; Blackwell, C.; McDonough, J., Jr. Fifty Years of Population Change along the Nation’s Coasts, 1960–2010; NOAA Coastal Trends Series; National Oceanic and Atmospheric Administration, U.S. Department of Commerce: Rockville, MD, USA, 1990.
  12. Tiefenthaler, L.L.; Schiff, K.; Leecaster, M.K. Temporal variability patterns of stormwater concentrations in urban stormwater runoff. Water Res. 2002, 36, 1556–1564. [Google Scholar]
  13. Egodawatta, P.; Thomas, E.; Goonetilleke, A. Mathematical interpretation of pollutant wash-off from urban road surfaces using simulated rainfall. Water Res. 2007, 41, 3025–3031. [Google Scholar] [CrossRef] [PubMed] [Green Version]
  14. Economic Development Bureau. Demographic data provided by Claritas for the City of Long Beach. 1999. Available online: http://www.ci.long-beach.ca.us/bdc/demographics.htm (accessed on 11 July 2001). [Google Scholar]
  15. United States Environmental Protection Agency. Methods for the Determination of Metals in Environmental Samples; EPA/600/4-91/010; Office of Research and Development, United States Environmental Protection Agency: Washington, DC, USA, 1991.
  16. Athayde, D.N.; Shelley, P.E.; Driscoll, E.D.; Boyd, G. Results of the Nationwide Urban Runoff Program, Volume I; Final Report; U.S. Environmental Protection Agency: San Francisco, CA, USA, 1983.
  17. Irish, L.B.; Lesso, W.G.; Barrart, M.E.; Malina, J.J.F.; Charbeneau, R.J.; Ward, G.H. An Evaluation of the Factors Affecting the Quality of Highway Runoff in the Austin, Texas Area; Interim Report. FHWA/TX-96/1943-5; U.S. Federal Highway Administration: San Francisco, CA, USA; Texas Department of Transportation: Austin, TX, USA, 1996.
  18. Sansalone, J.J.; Buchberger, S.G. Partitioning and first flush of metals in urban roadway storm water. J. Environ. Eng. 1997, 123, 134–143. [Google Scholar] [CrossRef]
  19. Brodie, I.M.; Egodawatta, P. Relationships between rainfall intensity, duration and suspended particle washoff from an urban road surface. Hydrol. Res. 2011, 42, 239–249. [Google Scholar] [CrossRef] [Green Version]
  20. Dorman, M.E.; Hartigan, J.; Johnson, F.; Maestri, B. Retention, Detention, and Overland Flow for Pollutant Removal from Highway Stormwater Runoff: Interim Guidelines for Management Measures; NTIS: Springfield, VA, USA, 1988.
  21. Deletic, A.; Maksimovic, C. Evaluation of water quality factors in storm runoff from paved areas. J. Environ. Eng 1998, 124, 869–879. [Google Scholar] [CrossRef]
  22. Desta, M.B.; Bruen, M.; Higgins, N.; Johnston, P. Highway runoff quality in Ireland. J. Environ. Monit. 2007, 9, 366–371. [Google Scholar] [CrossRef] [PubMed]
  23. Zhang, Q.; Wang, X.; Hou, P.; Wan, W.; Ren, Y.; Ouyang, Z.; Yang, L. The temporal changes in road stormwater runoff quality and the implications to first flush control in Chongqing, China. Environ. Monit. Assess. 2013, 185, 9763–9775. [Google Scholar] [CrossRef] [PubMed]
  24. Han, Y.H.; Lau, S.L.; Kayhanian, M.; Stenstrom, M.K. Correlation analysis among highway stormwater pollutants and characteristics. Water Sci. Technol. 2006, 53, 235–244. [Google Scholar] [CrossRef] [PubMed]
  25. Jirik, A.; Bay, S.M.; Greenstein, D.J.; Zellers, A.; Lau, S.L. Application of TIEs in studies of urban stormwater impacts on marine organisms. In Environmental Toxicology and Risk Assessment: ASTM STP 1333; Little, E.E., DeLonay, A.J., Greenberg, B.M., Eds.; American Technical Publishers: West Conshohocken, PA, USA, 1998; Volume 302, pp. 284–298. [Google Scholar]
  26. Greenstein, D.; Tiefenthaler, L.; Bay, S. Toxicity of parking lot runoff after application of simulated rainfall. Environ. Contam. Toxicol. 2004, 47, 199–206. [Google Scholar] [CrossRef] [PubMed]
  27. Schiff, K.; Bay, S.M.; Diehl, D. Stormwater toxicity in Chollas Creek and San Diego Bay. Environ. Monit. Assess. 2003, 81, 119–132. [Google Scholar] [CrossRef] [PubMed]
  28. Barrett, M.E.; Zuber, R.D.; Collins, E.R., III; Malina, J.F.; Charbeneau, R.J., Jr.; Ward, G.H. A Review and Evaluation of Literature Pertaining to the Quality and Control of Pollution from Highway Runoff and Construction; Technical Report CRWR 239; Center for Research in Water Resources, Bureau of Engineering Research, The University of Texas, Balcones Research Center: Austin, TX, USA, 1995. [Google Scholar]
  29. Driscoll, E.D.; Shelley, P.E.; Strecker, E.W. Pollutant Loadings and Impacts from Highway Stormwater Runoff. Volume I: Design Procedure; Final Report, FHWA-RD-88-006; U.S. Federal Highway Administration: Anchorage, AK, USA, 1990.
  30. Pitt, R. Characterizing and Controlling Urban Runoff through Street and Sewerage Cleaning; EPA/600/S2-85/038, PB 85-186500; United States Environmental Protection Agency (U.S. EPA), Storm and Combined Sewer Program, Risk Reduction Engineering Laboratory: Cincinnati, OH, USA, 1985.
  31. Pitt, R.; McLean, J. Toronto Area Watershed Managment Strategy Study, Humber River Pilot Watershed Project; Ontario Ministry of the Environment: Toronto, ON, Canada, 1986; p. 483. [Google Scholar]
Figure 1. Pollutographs of suspended solids concentrations (mg/L) for 6.3, 12.7 and 25.4 mm/h simulated rainfall intensities.
Water 08 00320 g001
Table 1. Comparison of mean constituent concentrations (± standard deviation) at three different time intervals within a 40 min storm with an intensity of 6.3 mm precipitation per hour. N = 3 for each time interval.
Parameter6.3 mm/h
0–10 min10–20 min20–40 min
Mean (SD)Mean (SD)Mean (SD)
Suspended Solids (mg/L)72.7 (18.1)20.3 (6.5)11.7 (5.2)
Metals (Total)
Aluminum (μg/L)1036.7 (172.7)233.3 (177.5)180 (55.9)
Cadmium (μg/L)2.4 (0.6)1.0 (0.8)0 (0)
Chromium (μg/L)7.7 (0.7)4.1 (0.3)2.2 (0.2)
Copper (μg/L)54.3 (6.4)27.3 (4.2)10.3 (0.5)
Iron (μg/L)556.7 (56.8)446.7 (27.4)216.7 (71.5)
Lead (μg/L)168.7 (84.2)93 (58)27.7 (14.5)
Nickel (μg/L)44.7 (7.4)21.3 (4.7)6.8 (0.9)
Zinc (μg/L)430 (47.5)213.3 (35.5)76.7 (3.2)
Metals (Dissolved)
Aluminum (μg/L)78.7 (12.4)92.7 (97.2)0 (0)
Cadmium (μg/L)2.1 (0.6)0.9 (0.7)0 (0)
Chromium (μg/L)4.1 (0.4)2.5 (0.2)0.8 (0.7)
Copper (μg/L)47.3 (5.2)24.7 (4.8)8.5 (0.9)
Iron (μg/L)360 (64.4)203.3 (40.3)46.7 (35.5)
Lead (μg/L)133.3 (77.4)85.3 (63.1)23.9 (16.4)
Nickel (μg/L)41.3 (6.9)19.3 (4.7)6.4 (1.1)
Zinc (μg/L)336.7 (52.1)170.0 (47.5)56.0 (11.2)
Total PAHs (μg/L)8.5 (6.2)4.3 (2.8)2.7 (2.1)
Table 2. Comparison of mean constituent concentrations (± standard deviation) during three different intensities and a range of durations. N = 3 for each time interval.
Parameter6.3 mm/h12.7 mm/h25.4 mm/h
10 min20 min40 min20 min10 min20 min
Mean (SD)Mean (SD)Mean (SD)Mean (SD)Mean (SD)Mean (SD)
Suspended Solids (mg/L)72.7 (18.1)46.5 (29.8)34.9 (29.5)28.7 (14.6)41 (13.3)26.5 (17.6)
Metals (Total)
Aluminum (μg/L)1036.7 (172.7)635 (444.6)483.3 (422.2)316.7 (73.5)540 (114.7)341.7 (218.3)
Cadmium (μg/L)2.4 (0.6)1.7 (1)1.1 (1.1)0.8 (0.6)0.5 (0.8)0.3 (0.6)
Chromium (μg/L)7.7 (0.7)5.9 (1.9)4.7 (2.4)2.6 (0.4)4 (1.2)2.9 (1.4)
Copper (μg/L)54.3 (6.4)40.8 (14.8)30.7 (18.9)19.7 (1.3)29.7 (7.6)20 (11.3)
Iron (μg/L)556.7 (56.8)501.7 (71.1)406.7 (153.3)560 (115.4)610 (195.4)438.3 (222.7)
Lead (μg/L)168.7 (84.2)130.8 (80.6)96.4 (82.3)61.7 (28.6)48.7 (18.4)33.7 (20.4)
Nickel (μg/L)44.7 (7.4)33 (13.4)24.3 (16.6)14 (2.3)23.7 (6.9)15.1 (10)
Zinc (μg/L)430 (47.5)321.7 (118)240 (151.2)160 (8.5)216.7 (26.1)143 (77.7)
Metals (Dissolved)
Aluminum (μg/L)78.7 (12.4)85.7 (68.2)57.1 (68.8)0 (0)0 (0)12.8 (29.3)
Cadmium (μg/L)2.1 (0.6)1.5 (0.9)1 (1)0 (0)0.5 (0.7)0.3 (0.6)
Chromium (μg/L)4.1 (0.4)3.3 (0.9)2.5 (1.4)1.6 (0)1.9 (0.6)1.1 (1)
Copper (μg/L)47.3 (5.2)36 (12.6)26.8 (16.6)15.3 (1.8)24.3 (9.4)16.2 (10.7)
Iron (μg/L)360 (64.4)281.7 (95.7)203.3 (138)133.3 (26.1)190 (30.7)121.7 (77.9)
Lead (μg/L)133.3 (77.4)109.3 (73.3)80.8 (72.7)45.1 (28.7)34 (12.6)24 (14.3)
Nickel (μg/L)41.3 (6.9)30.3 (12.6)22.3 (15.4)12 (1.5)21 (7.4)13.4 (9.4)
Zinc (μg/L)336.7 (52.1)253.3 (98.1)187.6 (123.5)104.7 (22.6)156.7 (34.5)103.7 (59.9)
Total PAHs (μg/L)8.5 (6.2)6.4 (5.2)5.2 (4.7)5.5 (2.9)3.3 (1)2.4 (1.2)

