
Impact Evaluation of Low Flow Showerheads for Hong Kong Residents


Department of Building Services Engineering, The Hong Kong Polytechnic University, Hong Kong, China
*
Author to whom correspondence should be addressed.
Water 2016, 8(7), 305; https://doi.org/10.3390/w8070305
Submission received: 1 June 2016
/
Revised: 12 July 2016
/
Accepted: 14 July 2016
/
Published: 21 July 2016
(This article belongs to the Special Issue Water Economics and Policy)
Abstract
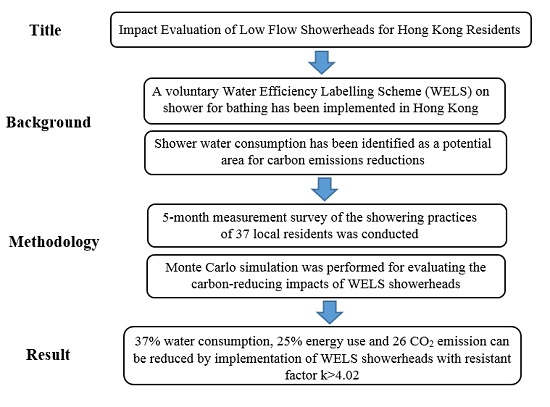
:The voluntary Water Efficiency Labelling Scheme (WELS) on showers for bathing in Hong Kong is a water conservation initiative of the Hong Kong Special Administrative Region (HKSAR) Government. As shower water consumption has been identified as a potential area for carbon emissions reductions, this study examines, from a five-month measurement survey of the showering practices of 37 local residents, a range of showerheads with resistance factors k = 0.54–4.05 kPa·min2·L−2 with showering attributes including hot shower temperature, temperature difference between hot and cold water supply, flow rate and water consumption and shower duration. A Monte Carlo model is proposed for evaluating the water consumption and carbon-reducing impacts of WELS on showers for bathing at confidence intervals with input parameters determined from the measurement survey. The simulation results indicate that full implementation of WELS rated showerheads with k ≥ 4.02 can reduce water consumption by 37%, energy use by 25% and carbon dioxide (CO2) emissions by 26%. This study is also a useful source of reference for policymakers and practitioners to evaluate the impacts of water efficient showerheads on water consumption, energy use, and CO2 emissions.

1. Introduction
The Hong Kong Electrical and Mechanical Services Department (HKEMSD) reported that about one-fifth of energy end-use in Hong Kong was for shower water heating [1]. In Japan, residential water supply systems accounted for nearly 5% of total carbon dioxide (CO2) emissions and over 50% of those emissions came from hot water supply systems [2]. In southeast Queensland, Australia, the average energy consumption from hot showers ranged between 810 and 1246 kWh·ps−1·year−1, corresponding to CO2 emissions ranging between 160 and 245 kg-CO2 ps−1·year−1 [3].
Improving shower water efficiency can lead to energy savings and thus carbon emissions reductions. An effective way to increase shower water efficiency is to replace an inefficient showerhead with a water efficient one. To encourage shower water conservation in Hong Kong, a voluntary Water Efficiency Labelling Scheme (WELS) on showers for bathing has been implemented by the Hong Kong Water Supplies Department (HKWSD) since 2009 [4]. Any showerhead that fulfils the WELS performance requirements can be registered under the scheme. According to their nominal flow rates, all registered showerheads are classified into four water efficiency grades, namely Grade 1: ≤ 0.15 Ls−1, Grade 2: 0.15–0.2 Ls−1, Grade 3: 0.2–0.27 Ls−1 and Grade 4: ≥ 0.27 Ls−1. However, this existing labelling scheme is not well-recognized by the end-users with respect to water and energy efficiency or carbon footprint [5].
This study measures the impacts of WELS rated showerheads on water consumption, energy use and CO2 emissions, and proposes a Monte Carlo model for evaluating the carbon-reducing impacts of WELS on showers for bathing.
2. Methods and Materials
The feedback from 37 volunteers (from 10 families) on showering attributes in their respective residential washrooms (i.e., 10 different washrooms) were studied. Figure 1 exhibits the 10 showerheads under investigation, where n is the number of users, k is the showerhead resistance factor (kPa·min2·L−2) that ranges from 0.54 to 4.05 (p ≤ 0.05, t-test) expressed by the equation below for the showerhead discharge characteristics.
Initially, showering experiences were collected from all participants through interviews. Sample interview questions are shown in the Appendix. Showerhead operating times and shower water temperatures were then recorded for all participants over a week. The time period was considered appropriate as interviewees were found to be adapted to the existing showerhead settings, and they reported that showerhead operating parameters were remaining unchanged for months. After that period of time, the original showerheads under investigation were replaced by identical WELS Grade 2 showerheads that were with a nominal flow rate of 11.5 L·min−1. Showerhead operating times and water temperatures were measured again from October 2013 to February 2014. Corresponding outdoor ambient temperatures were also logged for reference. Measurement data was evaluated on a monthly/weekly basis where appropriate, with statistical tests for significance at a cut-off value of p ≤ 0.05. At the end of the measurement period, user feedback on the new showerhead was gathered through further interviews.
Based on the measurement method by the HKWSD [4,6], i.e., using a laboratory-made apparatus composed of a pressure gauge, a temperature sensor and a timer, flow rates of all showerheads were measured with a water pressure range of 50–350 kPa at the showerhead inlet. Water discharged in a sample operation of about 10 s was collected in a container and the average water supply flow rate was determined from the volume discharged divided by discharge time. Measurements were conducted onsite to determine the actual operating conditions as chosen by households and then continued in a university laboratory to decide the showerhead pressure-flow characteristics [7].
Monte Carlo simulations were used in this study to obtain the confidence intervals of input parameters for the energy consumption estimates as well as CO2 reductions. In the simulations, a uniformly distributed random number x ∈ [0, 1] was taken from a random number set generated by the prime modulus multiplicative linear congruential generator, and input parameters were sampled from descriptive parametric distribution functions [8]. The input value ζi,x of each parameter ζi was then determined from the descriptive distribution function at percentile x [9]. The procedure was coded with Fortran and executive on desktop computer [10]:
3. Results and Discussion
This study recorded a wide range of non-WELS showerhead designs and their hole configurations are illustrated in Figure 1a. Some of these designs were flow rate adjustable to optimize user satisfaction. Although an earlier survey indicated that 98.8% households supported water conservation measures and 36.4% of them were aware of WELS [4,6], this study revealed that the usage rate of WELS rated showerheads was not high and further promotion for these showerheads may be required. This study also reported that 32 participants preferred a fine mist spray while five preferred a powerful spray. Regarding showerhead performance, five participants (13.5%) were not satisfied with their existing showerheads but kept using them.
Table 1 summarizes the surveyed showering attributes. Thirty-four participants (92%) expressed that they were willing to have hot showers even in the summer period. This is consistent with a previous survey that found 97% of the summer showers were hot ones [11]. The hot shower temperature (T0) preferred was between 37 and 39 °C, with an average of 38.6 °C (SD = 2.5 °C). The average showerhead operating time (ts) surveyed was 282 s, with SD = 108 s. In the interviews, 28 participants (76%) reported that they would shampoo every day, eight (22%) every other day and one once every six days. The showerhead operating time for shampooing ranged from 2 to 6 min (average = 2.9 min), and 24 participants (65%) usually took 2 min for shampooing. The expected daily showerhead operating time for shampooing was about 151 s (i.e., average time weighted by the shampooing frequency). The total mean showerhead operating time was 433 s (= 282 s + 151 s), and that was not significantly different from the HKWSD reference value (= 402 s) [6]. During the survey period, all participants took one shower daily (1 day−1). This is again consistent with some previous survey results in Hong Kong: 1.04 times per day between mid-September and mid-January [6] and 1.1 times per day (SD = 0.3 times per day) from December to February [11].
The average hot shower temperature and showerhead operating time measured were 38.5 °C (SD = 2 °C) and 305 s (SD = 107 s), respectively; there was no significant difference between them and the values surveyed from the interviews (p ≥ 0.4, t-test).
3.1. Showerhead Resistance Factor and Showering Attributes
Figure 2 shows the flow rate v (L·min−1) against water supply pressure P (kPa) for the 10 showerheads surveyed.
The operating parameters of the 10 surveyed showerheads, with showerhead resistance factors k, were monitored for a week (the average outdoor temperature in that week was 26.3 °C) and the findings are presented in Table 2. The measured hot shower temperature T0, ranging from 36.8 °C to 42.7 °C, is not only comparable to the average hot shower temperatures reported in Japan (39 °C) and Taiwan (36.1 °C), but is also consistent with a previous local measurement result (40.9 °C) [11,12]. The average showerhead operating time ranged from 240 s to 359 s.
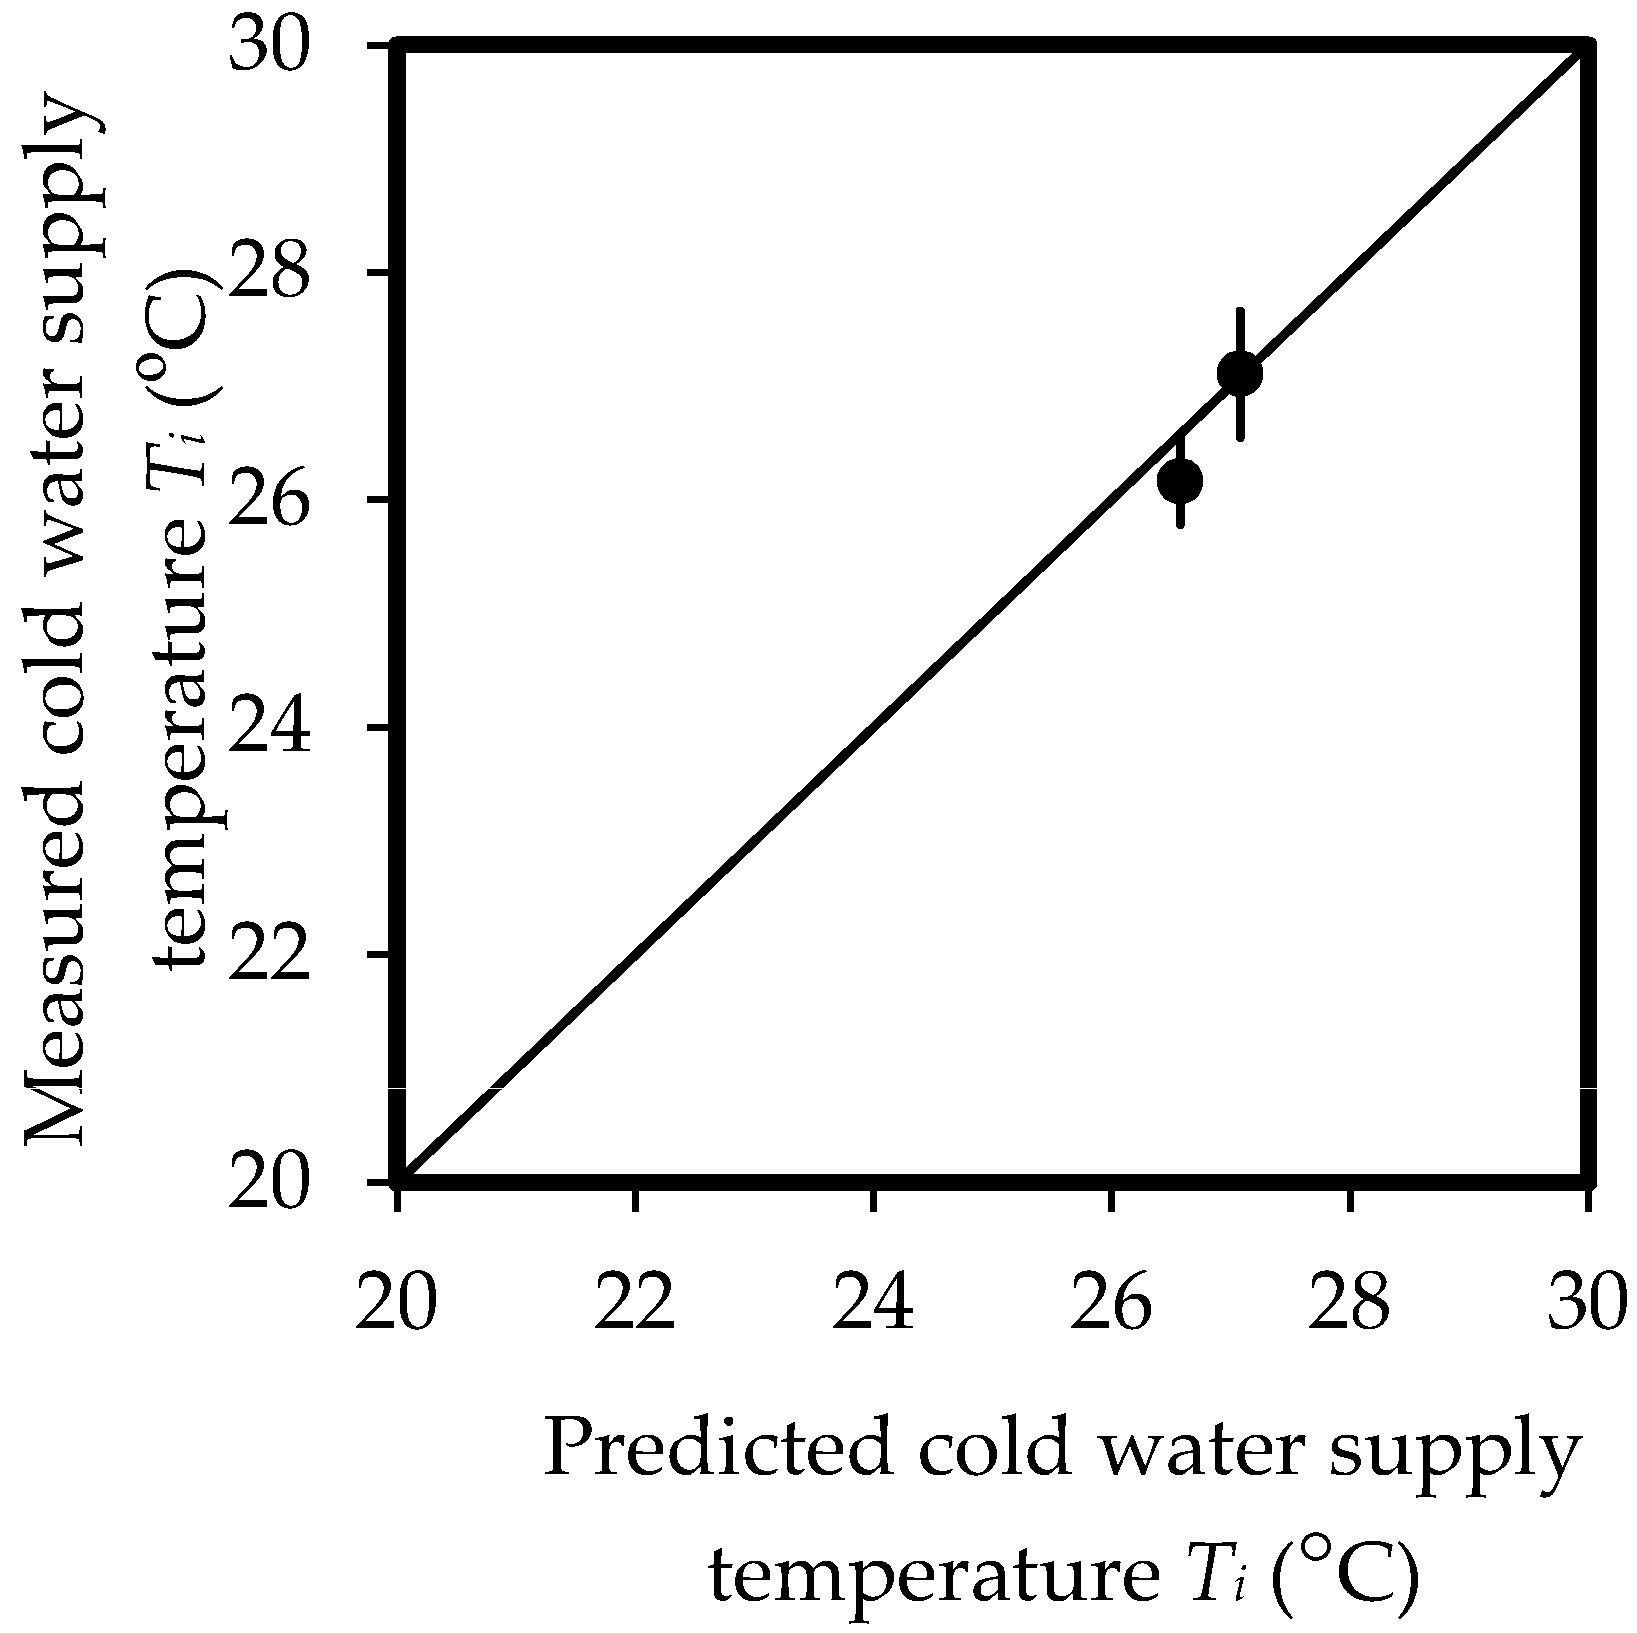
Figure 3 graphs the predicted and measured cold water supply temperatures for the showerheads surveyed as a confirmation to an expression below obtained for Hong Kong residential apartment buildings. A reference line indicating perfect prediction with measurement is shown in the figure. The following expression of cold water supply temperature Ti was confirmed for washrooms in high-rise residential buildings in Hong Kong [11]. Good predictions were made as shown in the figure.
Strong associations with showerhead resistance factor k were reported for hot shower temperature T0 (p < 0.001, t-test), temperature difference between hot and cold water supply T0 − Ti (p < 0.0001, t-test), flow rate v (p = 0.05, t-test) and water consumption V (p = 0.05, t-test), but not for shower duration t (p = 0.4, t-test). A higher shower temperature was observed for showerheads with lower flow rates (p = 0.05, t-test). This is consistent with an earlier laboratory study that showed lower flow showerheads, which resulted in increased shower temperatures for maintaining user comfort [13].
Measurements of four operating parameters, namely hot shower temperature T0, flow rate v, shower duration t and water consumption V, were then continued for five months with the replaced WELS showerheads (k = 2.46) (Figure 1b) and the results are exhibited in Table 3.
Shower duration was demonstrated to be independent of the showerhead design (p = 0.4, t-test). An earlier study reported a similar outcome [14]. On the other hand, water consumption was apparently reduced in the first month after higher flow showerheads (k < 2.46) had been replaced by a lower flow one (k = 2.46); therefore, the use of WELS rated showerheads can improve water efficiency [4].
It was found that outdoor temperature Ta dropped significantly from the first two months (21.7–23.7 °C) to the last three months (15.8–16.3 °C) (p < 0.0001, t-test). No significant difference between these two periods was found for shower temperature T0 (p > 0.05, t-test), flow rate v (p > 0.05, t-test) and water consumption V (p > 0.05, t-test). However, significantly longer shower durations were reported for Groups 1, 3 and 5 (p ≤ 0.05, t-test). The shower duration increased from 297 s to 327 s (i.e., for an outdoor temperature drop of 6 °C, the shower duration was 10% longer) in the two periods. A plot of shower duration t against outdoor temperature Ta suggested a strong association (correlation coefficient R = 0.7, p = 0.001, t-test). Shower operating time is one of the dominating factors of heating energy use for hot water and it may be related to a number of factors such as human thermal comfort and behavior response to climate. Hence, the expected showerhead operating time against the outdoor temperature can be expressed as follows with a standard deviation σt,
Measured showering attributes are summed up in Table 4.
3.2. Water Consumption
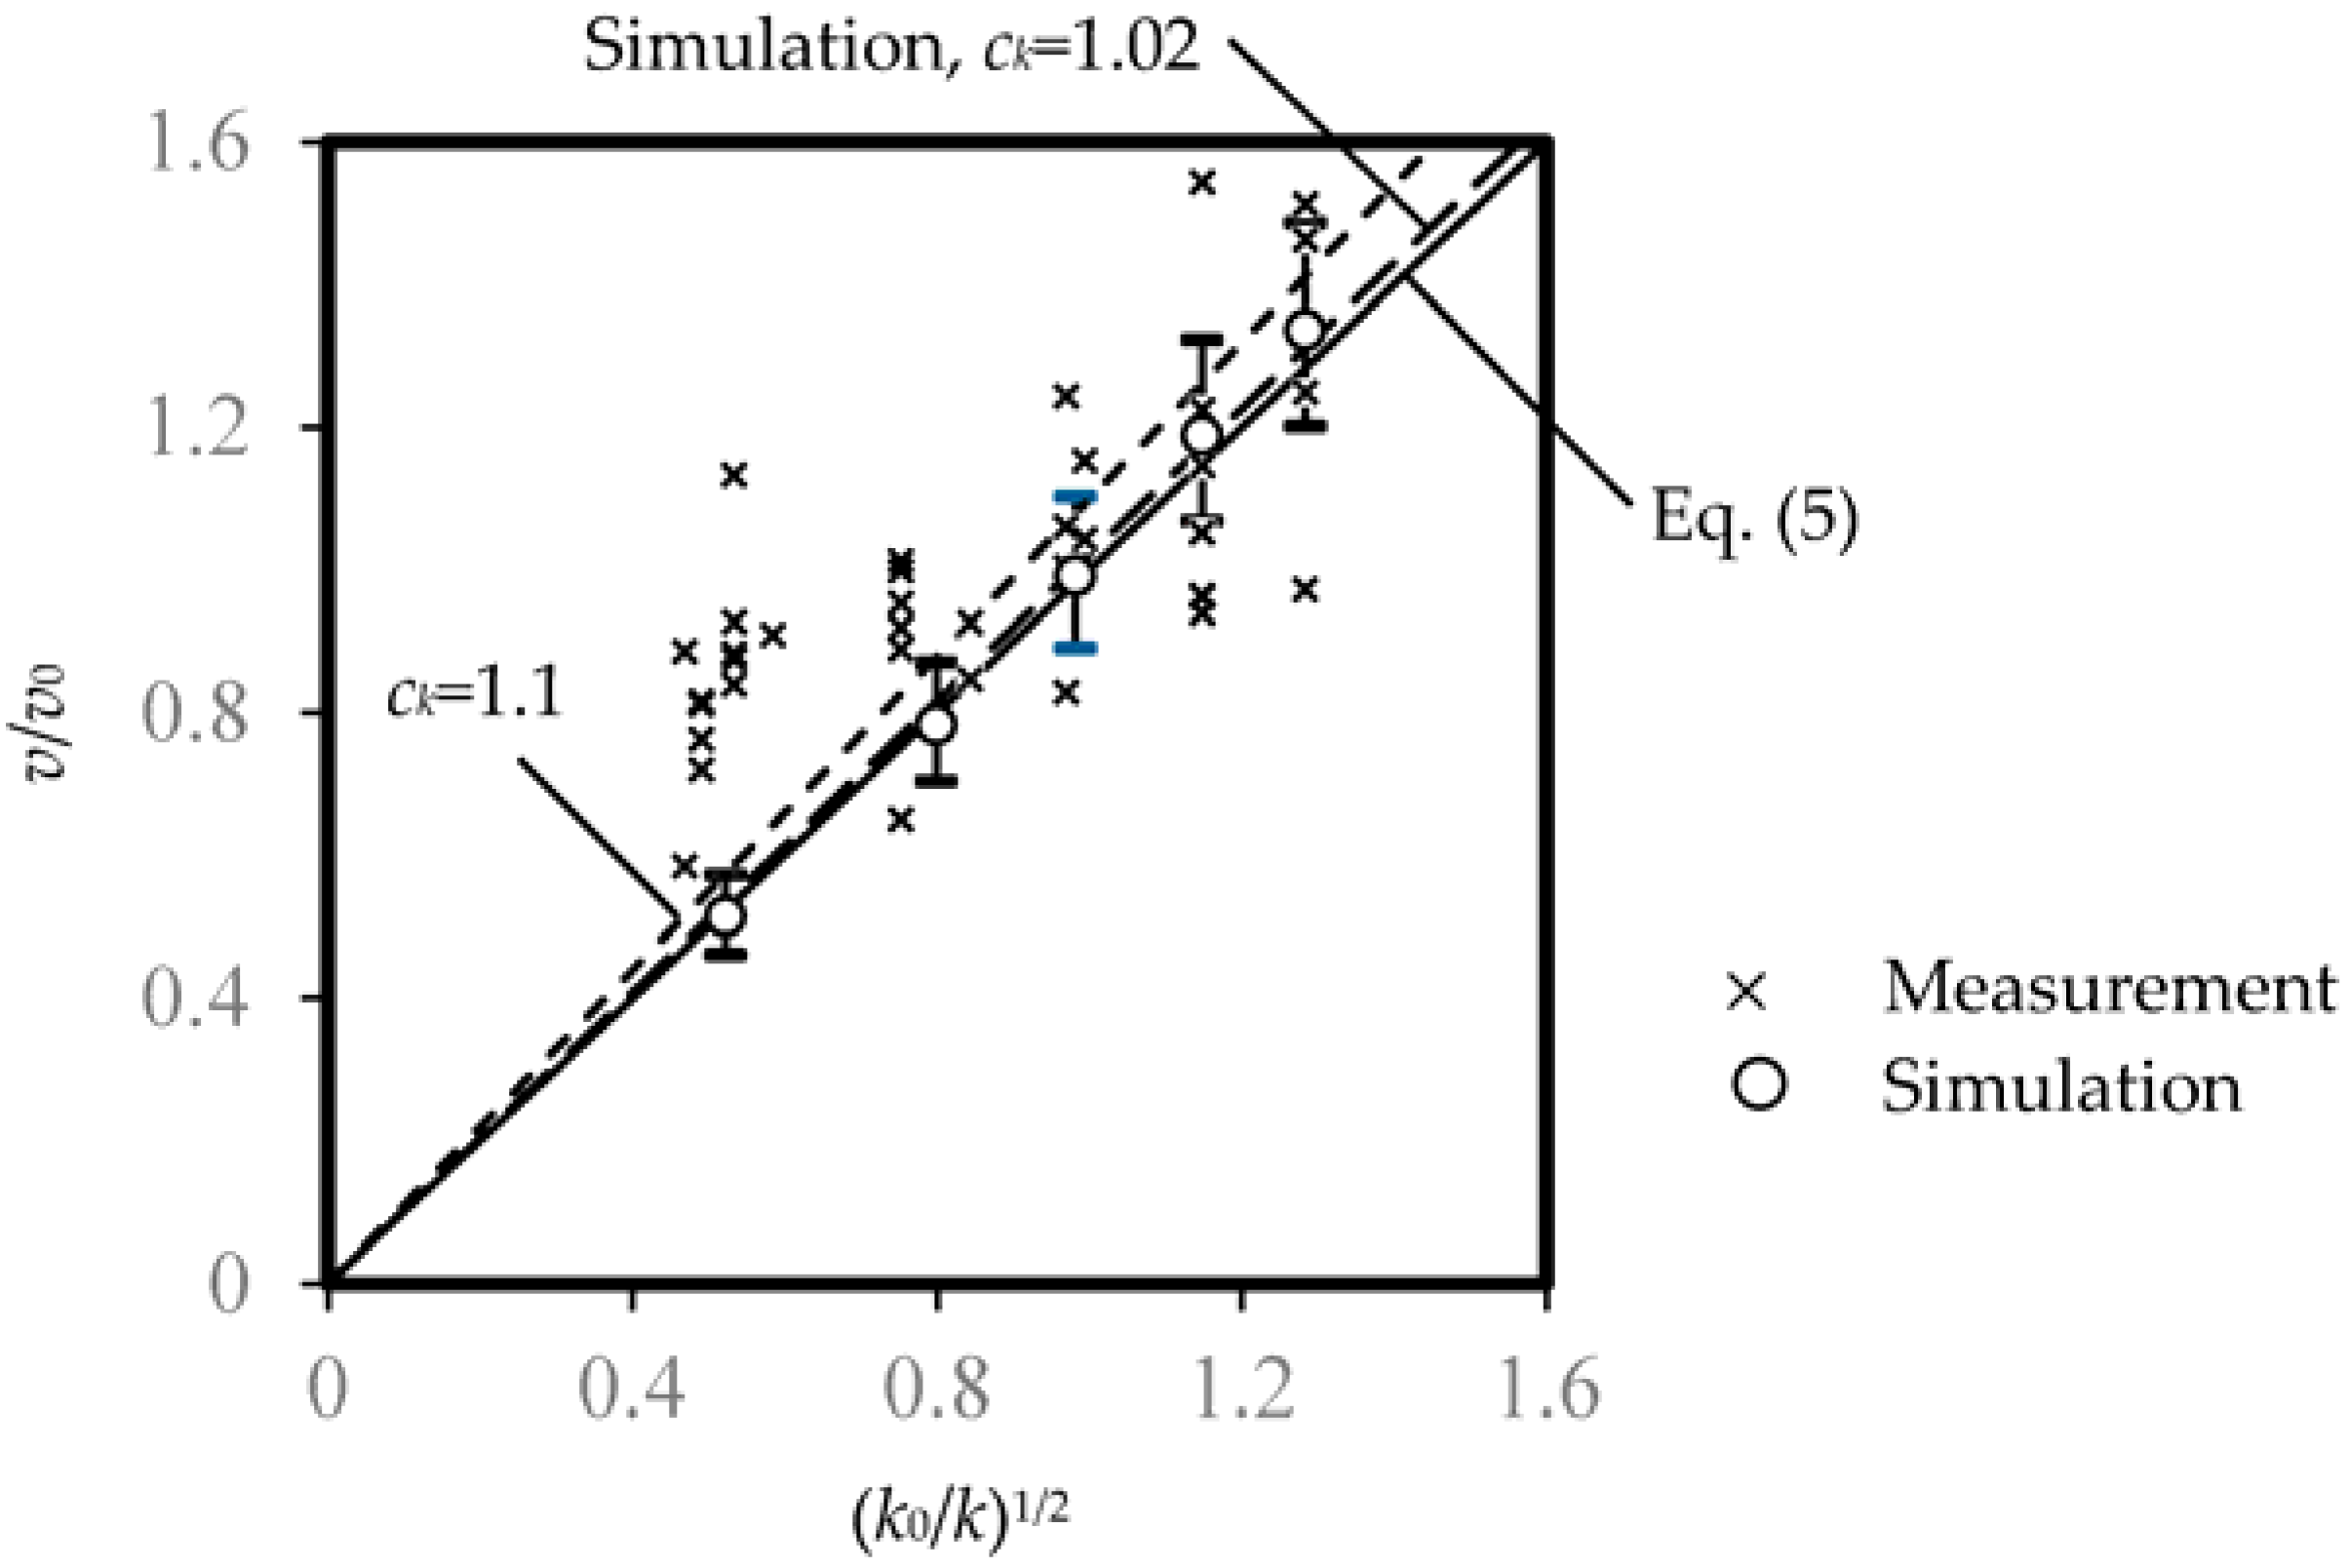
In promoting WELS rated water efficient showerheads, water consumption for an unaltered shower duration is usually assumed to be proportional to the showerhead flow rate [4,14]. Under the same water supply pressure conditions, the flow rate of a WELS showerhead v can be approximated using Equation (5), where v0 is the flow rate of the original showerhead, k0 and k are the resistance factors of the original (old) and WELS (new) showerheads, respectively. The water consumption ratio v/v0 for a shower using the WELS showerhead versus the original one is therefore proportional to (k0/k)1/2:
As there were variations in usage patterns associated with the newly installed WELS showerhead, the amount of water saved could be less significant. The measured and predicted values of v/v0 for the 10 surveyed washrooms against (k0/k)1/2 are plotted in Figure 4. Average prediction with error bars are shown for reference. Equation (5) is shown for the water saving due to the resistance factor. A regression line shows that prediction and measurement of water use can be correlated using a constant ck (p < 0.01, t-test):
The results showed that the average water consumption measured was 10% higher than the one predicted by Equation (5), i.e., ck = 1.1. The regression indicates that a showerhead with a lower nominal flow rate can improve water efficiency, as outdoor temperature and other parameters contributed to water consumption.
3.3. User Satisfaction and Water Consumption
Correlations between showering attributes and participant acceptance were examined. It was reported that 22 participants were not satisfied with the flow rate and pressure of the WELS showerhead and thus preferred to use their original showerheads [7]. Among the 15 participants who were satisfied, eight preferred to use their original showerheads for a more comfortable showering experience while seven would keep using the WELS showerhead. Based on a logistic response, occupant acceptance of a showerhead ϕ can be correlated to water supply flow rate v (p < 0.05, chi-square test) as expressed below, where C0 and C1 are the constants, v* is the occupant preferred flow rate, and f(v) is the distribution function of showerhead flow rates:
The above expression gives ϕ = 0.03–0.97 in a supply flow rate range of 3 to18 L·min−1.
The expression given below assumes a user will always adjust the showerhead flow rate v, which is subject to the maximum flow rate vp available from the water supply system, as close to the preferred flow rate v* as possible, where P (kPa) is the water pressure available at the showerhead, and Ps is a design static pressure range of 150 to 350 kPa used in typical high-rise water supply systems:
The change of pressure drop in the supply pipes from PL,0 to PL,1 corresponding to flow rates from v0 to v1 due to a number of connected showerheads can be approximated by the following expression, where the pipe friction loss range is PL/Le = 0.1–0.5 kPa·m−1 and the range of equivalent supply pipe lengths is Le = 100–300 m [15,16]:
Taking k = 1.52 as an average showerhead resistance factor for the surveyed showerheads (Table 2), a water consumption model [11] using Monte Carlo sampling techniques was applied to simulate the showerhead resistance factor, pipe friction loss and equivalent supply pipe length. The water consumption ratio v/v0 simulated is plotted (with ck = 1.02 and error bars of one standard deviation) in Figure 4 for comparison. As the measured average ck (= 1.1) is within the error range, the water consumption model proposed in Section 3.2 can be adopted to evaluate the energy associated with showering.
4. Simulation of CO2 Emission from Showers for Bathing
Per capita annual CO2 emissions Mp (kg-CO2 ps−1·year−1) from hot showers are linked to water consumption Vp (m3·ps−1·year−1) and energy consumption Ep (GJ·ps−1·year−1) using emission factors α (kg-CO2 m−3) per unit of water consumed and β (kg-CO2 GJ−1) per unit of energy consumed, respectively [17,18,19]:
where Ni is the number of showers taken by a resident per day, i is a day in a year, ts (s) is the showerhead operating time, p ( 1000 kg·m−3) is the density of water, cp (= 4.2 × 10⁻⁶ GJ·kg−1 K) is the specific heat capacity of water, T0 (°C) is the hot shower temperature, Ti (°C) is the cold water temperature, and φ = 1 for a hot shower or 0 for a cold shower.
Table 5 outlines the attributes for hot showers in Hong Kong for the evaluation of CO2 emissions from showers for bathing.
4.1. Model Verification
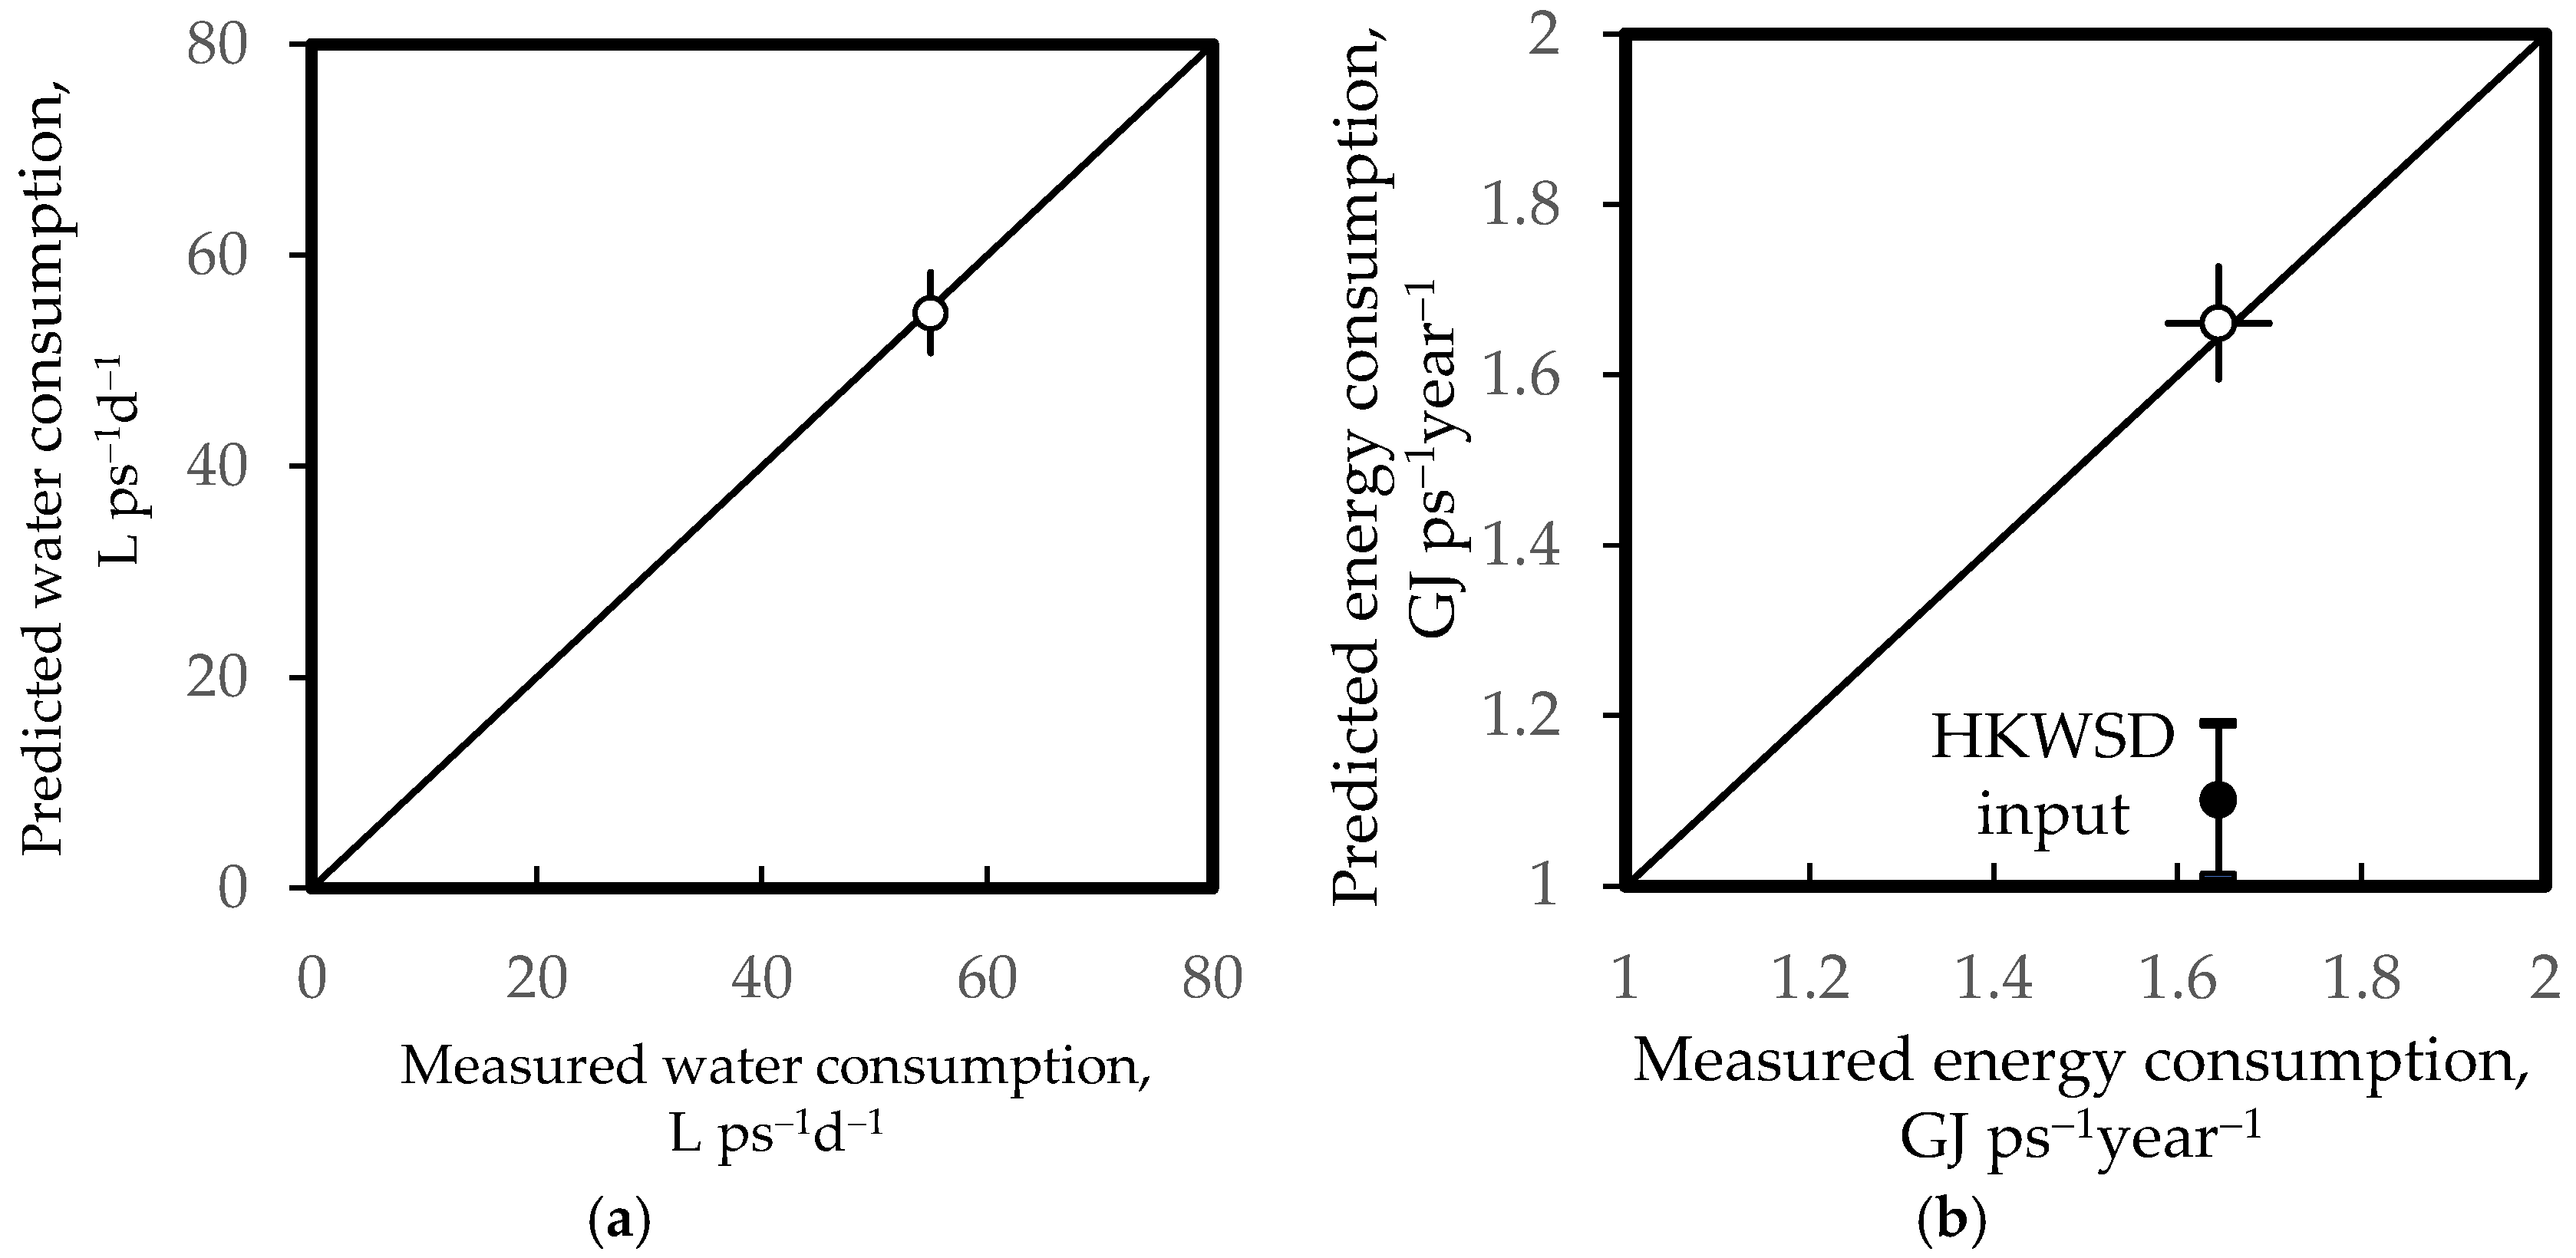
Two reference sources were used for model validation. First, data from a survey conducted by HKWSD were taken as simulation inputs [6]. According to the survey, 39%, 27%, 22% and 13% of the showerheads currently in use were with flow rates equivalent to WELS Grades 1, 2, 3 and 4, respectively (corresponding to mean k values of 4.02, 2.26, 1.27 and 0.81, respectively). The predicted average per capita daily consumption as graphed in Figure 5a is 54.5 L ps−1·day−1, i.e., 1% lower than the surveyed value (55 L·ps−1·day−1). A very good prediction was made as the result is very close to the reference line of HKWSD measured water consumption.
In addition, the annual amount of domestic hot water energy consumed (water used in cooking excluded) in Hong Kong reported by HKEMSD was taken as a reference (i.e., 1.645 GJ ps−1·year−1) [1]. Based on the data from HKWSD, the predicted energy consumption for September to May is 1.1 GJ·ps−1·year−1 (sd = 0.09 GJ ps−1·year−1), 30% below the HKEMSD reference value and the reference line for the energy consumption. Based on the year-round showering patterns of Hong Kong residents from open literature data [6,14], the predicted energy consumption is 1.66 GJ·ps−1·year−1; and as shown in Figure 5b, it is 1% higher than the HKEMSD reference.
4.2. Impacts of Water Efficiency Labelling Scheme on Showers for Bathing
Simulated water and energy consumption results for WELS rated showerheads are exhibited in Table 6. The average water consumption range is 15.4–41 m3·ps−1·year−1 while the average hot water energy consumption range is 1.24–2.44 GJ·ps−1·year−1.
Table 7 presents the impacts of WELS on showers for bathing in relation to water savings, energy savings and CO2 emissions reductions. Based on the per capita hot shower requirements of 114 MJ ps−1·year−1 by water use and 1.66 GJ ps−1·year−1 by heating, the estimated value of CO2 emissions is 355 kg-CO2 ps−1·year−1. This estimate is equivalent to 2.55 × 10⁹ kg-CO2·year−1 for a population of 7.188 million in Hong Kong by the end of 2013. Scenarios for k ≥ 1.27, 2.26 and 4.02 are shown in the table (corresponding to implementation of showerheads with WELS Grades 1–3, Grades 1–2 and Grade 1, respectively), and the results indicate that full implementation of WELS rated showerheads with k ≥ 4.02 can reduce water consumption by 37%, energy consumption by 25% and CO2 emissions by 26%.
5. Conclusions
This study measured the impacts of WELS rated showerheads on water consumption, energy use and CO2 emissions, and proposed a Monte Carlo model for evaluating the carbon-reducing impacts of WELS on showers for bathing. Using a range of showerheads (with resistance factors k = 0.54–4.05 kPa·min2·L−2), input parameters of the proposed model were determined from a five-month measurement survey of the showering practices of 37 local residents. Strong associations with showerhead resistance factor k were reported for hot shower temperature, temperature difference between hot and cold water supply, flow rate and water consumption, but not for shower duration. A higher shower temperature was observed for showerheads with lower flow rates. It was also found that shower duration was dependent on outdoor temperature. For an outdoor temperature drop of 6 °C, the shower duration was 10% longer, corresponding to 10% more heating energy consumption. As the simulation results indicated that full implementation of WELS rated showerheads with k ≥ 4.02 can reduce water consumption by 37%, energy use by 25% and CO2 emissions by 26%, the use of a WELS Grade 1 water efficient showerhead can save water and energy while reducing carbon emissions. This study is a useful source of reference for policymakers and practitioners to evaluate the impacts of water efficient showerheads on water consumption, energy use, and CO2 emissions.
Acknowledgments
The work described in this paper was partially supported by a grant from the Research Grants Council of the Hong Kong Special Administrative Region (HKSAR), China (PolyU 5272/13E) and by four grants from The Hong Kong Polytechnic University (GYBA6, GYL29, GYM64, GYBFN).
Author Contributions
Ling-tim Wong and Kwok-wai Mui assisted the site measurement and questionnaire; Ling-tim Wong performed the Monte Carlo simulation; Ling-tim Wong, Kwok-wai Mui and Yang Zhou were involved in data analysis and result reporting.
Conflicts of Interest
The authors declare no conflict of interest.
References
- Hong Kong Energy End-Use Data 2015; Hong Kong Electrical and Mechanical Services Department, Hong Kong Government: Hong Kong, China, 2015.
- Okamoto, M.; Sato, M.; Yamazaki, H.; Shodai, Y.; Cheng, C.L.; Sakaue, K. Study on relationship between the subjective shower-feeling and the criteria for low-flow showerhead. In Proceedings of the 39th International Symposium of CIBW062 Water Supply and Drainage for Buildings, Nagano, Japan, 17–20 September 2013; pp. 645–655.
- Beal, C.D.; Bertone, E.; Stewart, R.A. Evaluating the energy and carbon reductions resulting from resource-efficient household stock. Energy Build. 2012, 55, 422–432. [Google Scholar] [CrossRef]
- Voluntary Water Efficiency Labelling Scheme on Showers for Bathing; Hong Kong Water Supplies Department, Hong Kong Government: Hong Kong, China, 2011.
- Study on Water Efficiency Standards; Final Report; European Commission (DG ENV): Paris, France, 2009.
- Domestic Water Consumption Survey—Key Survey Findings—Fact Sheet; Hong Kong Water Supplies Department, Hong Kong Government: Hong Kong, China, 2011.
- Cheung, W.Y.; Wong, L.T.; Mui, K.W.; Zhou, Y. Performance evaluation of showerheads for Hong Kong residents. In Proceedings of the 41st International Symposium of CIBW062 Water Supply and Drainage for Buildings, Beijing, China, 18–20 August 2015; pp. 491–500.
- Zwillinger, D.; Kokoska, S. Standard Probability and Statistics Tables and Formulae; Chapman & Hall/CRC: Washington, DC, USA, 1999. [Google Scholar]
- Ross, S.M. Simulation, 3rd ed.; Academic Press: Tokyo, Japan, 2002. [Google Scholar]
- Chivers, I.; Sleightholme, J. Introducting FORTRAN 95; Springer: London, UK, 2000. [Google Scholar]
- Wong, L.T.; Mui, K.W.; Guan, Y. Shower water heat recovery in high-rise residential buildings of Hong Kong. Appl. Energy 2010, 87, 703–709. [Google Scholar] [CrossRef]
- Okamoto, M.; Yaita, R.; Sato, M.; Kamijo, M.; Toyosada, K.; Shimizu, Y.; Sakaue, K.; Liao, W.J.; Lee, M.C.; Cheng, C.L. Comparison of the Physical Properties of Showers that the Satisfaction of Shower Feeling among Users in Three Asian Countries. Water 2015, 7, 4161–4174. [Google Scholar] [CrossRef]
- Nishina, D.; Murakawa, S. Evaluation of shower heads based on the subject’s feeling for taking a shower. In Proceedings of the CIBW062 International Symposium on Water Supply and Drainage for Buildings, Yokohama, Japan, 10–12 November 1997.
- Toyosada, K.; Otani, T.; Shimizu, Y.; Yonemaru, A. Research on the effect of showerhead characteristics on usage time and hot water volume. In Proceedings of the 39th International Symposium of CIBW062 Water Supply and Drainage for Buildings, Nagano, Japan, 17–20 September 2013; pp. 297–308.
- Wong, L.T. A cost model for plumbing and drainage systems. Facilities 2002, 20, 386–393. [Google Scholar] [CrossRef]
- Plumbing Engineering Services Design Guide; Institution of Plumbing: Essex, UK, 2002.
- Wong, L.T.; Mui, K.W.; Shi, K.L. Energy impact of indoor environmental policy for air-conditioned offices of Hong Kong. Energy Policy 2008, 36, 714–721. [Google Scholar] [CrossRef]
- Plappally, A.K.; Lienhard, J.H.V. Energy requirements for water production, treatment, end use, reclamation and disposal. Renew. Sustain. Energy Rev. 2012, 16, 4818–4848. [Google Scholar] [CrossRef]
- Makki, A.A.; Stewart, R.A.; Panuwatwanich, K.; Beal, C. Revealing the determinants of shower water end use consumption: Enabling better targeted urban water conservation strategies. J. Clean. Prod. 2013, 60, 129–146. [Google Scholar] [CrossRef]
Figure 1.
Showerheads under investigation: (a) showerheads used in 10 residential washrooms in Hong Kong; (b) a Water Efficiency Labelling Scheme (WELS) Grade 2 showerhead.
Figure 1.
Showerheads under investigation: (a) showerheads used in 10 residential washrooms in Hong Kong; (b) a Water Efficiency Labelling Scheme (WELS) Grade 2 showerhead.
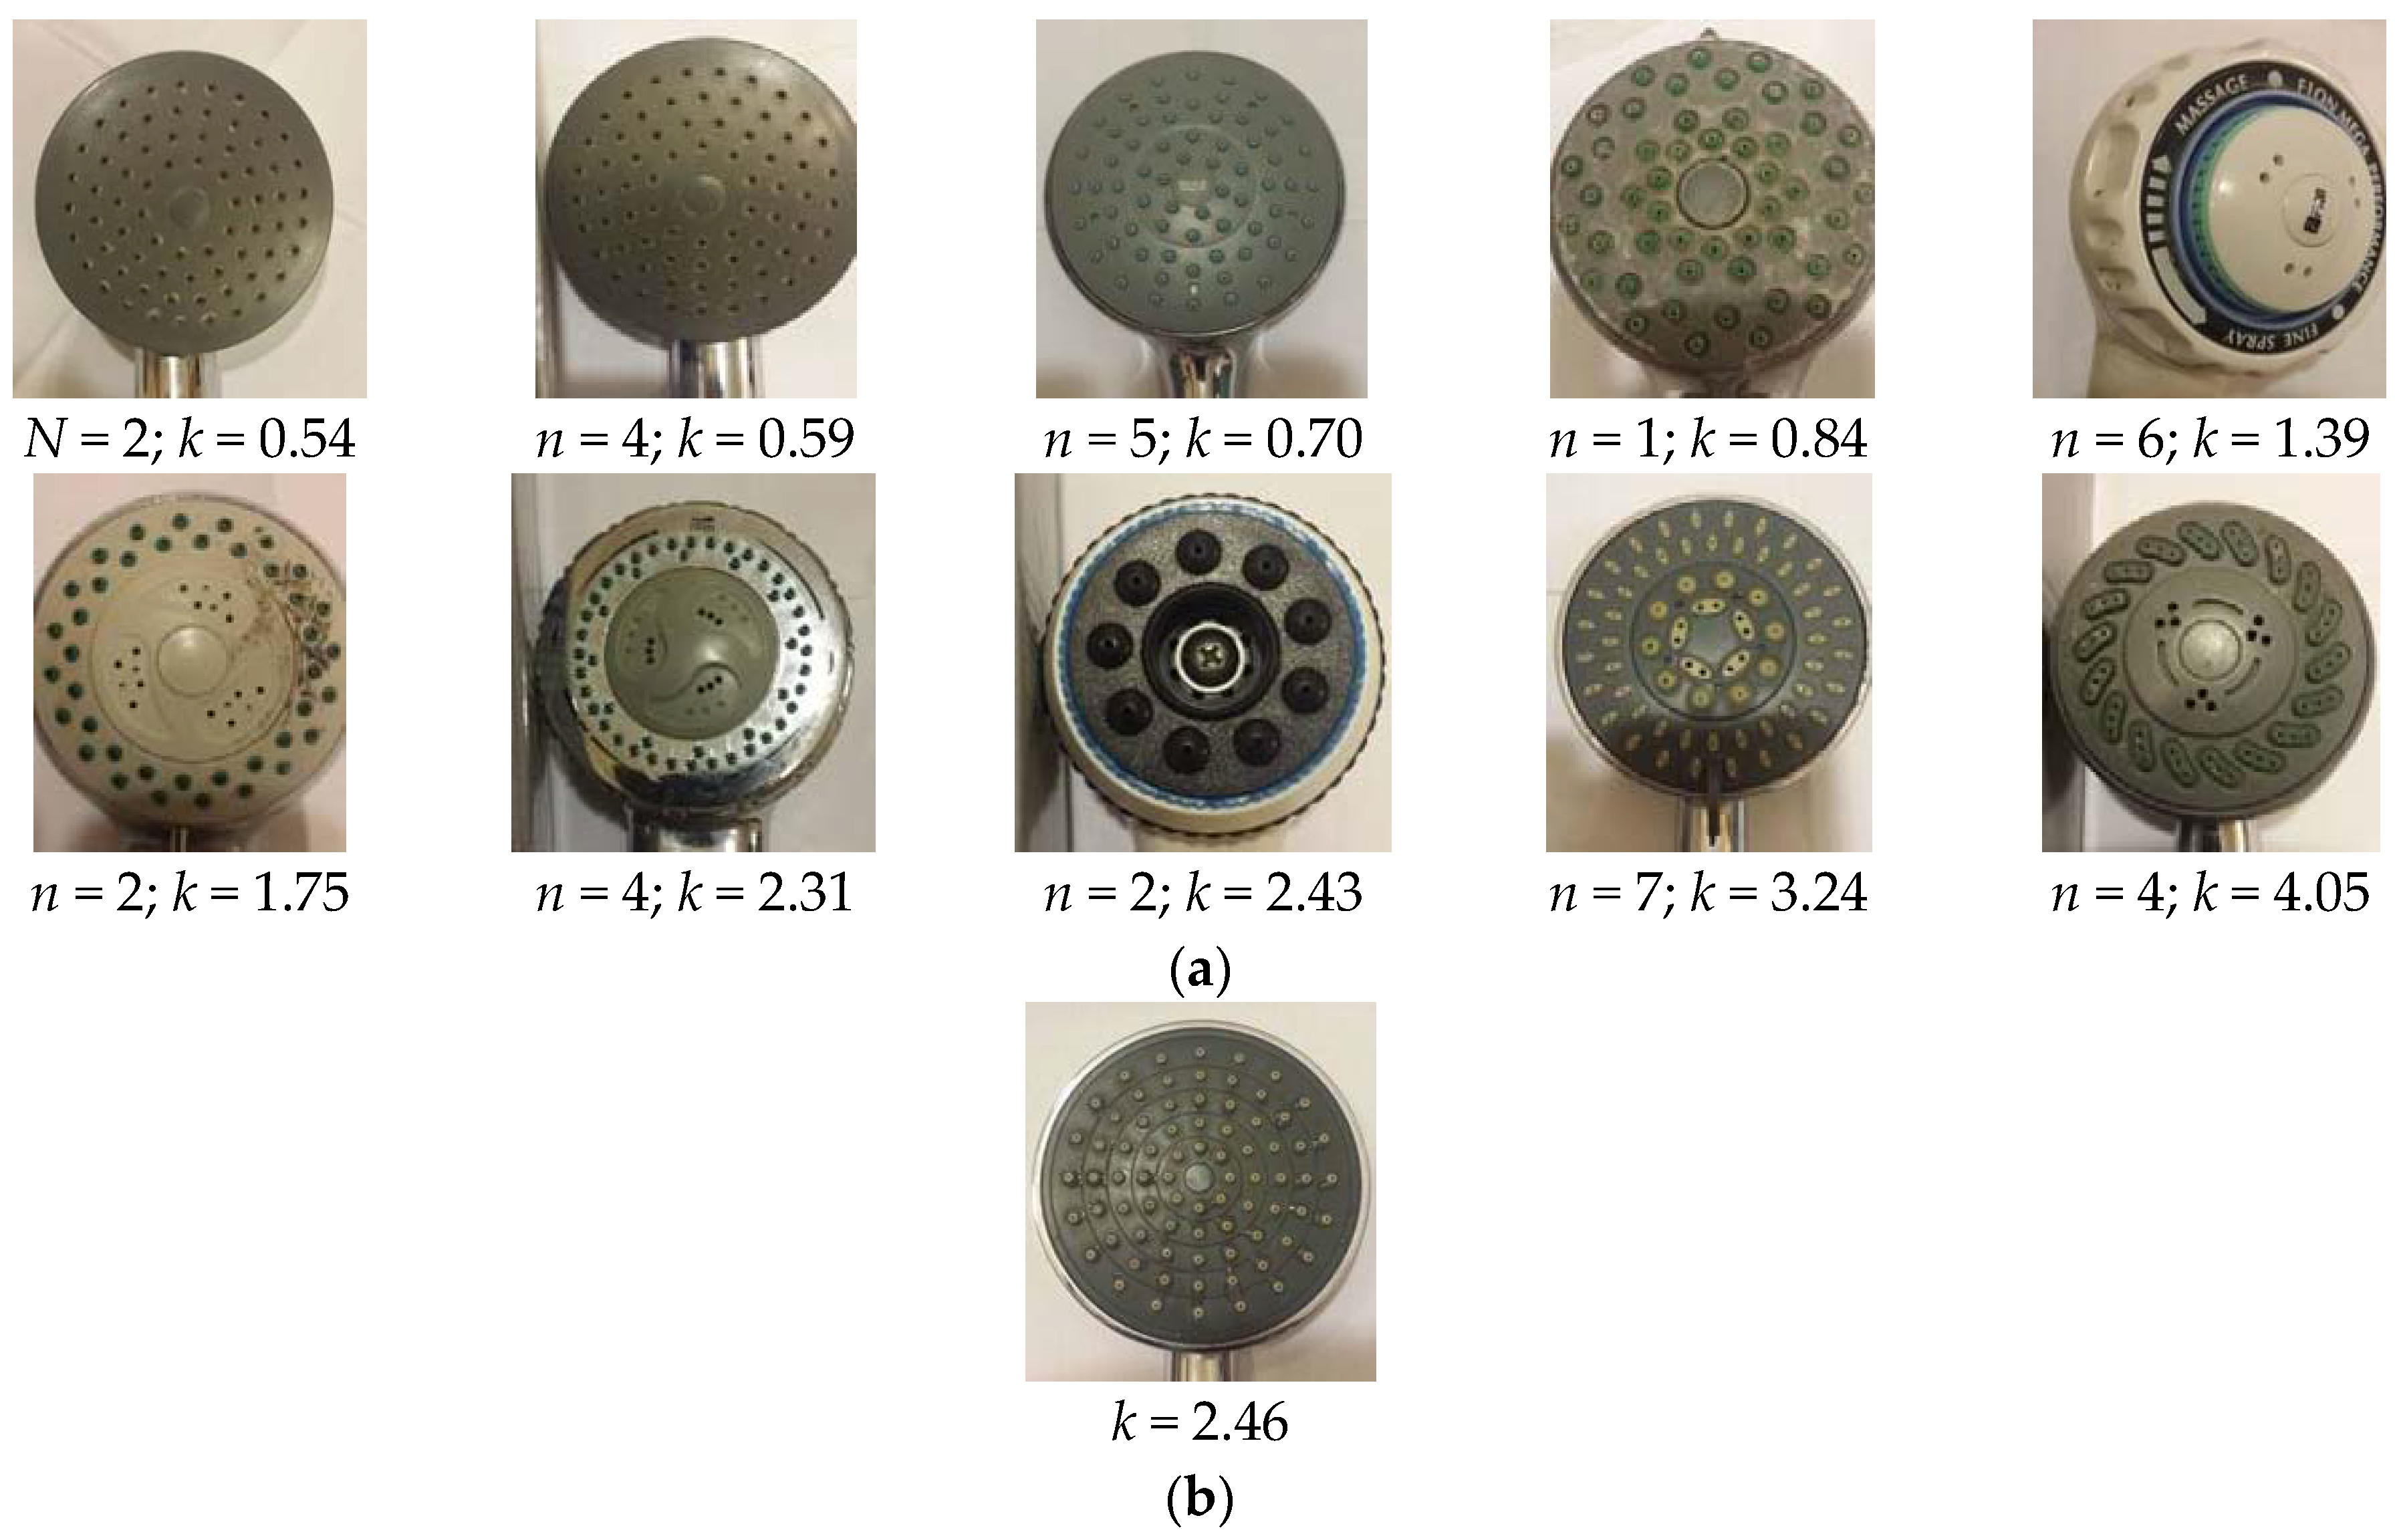
Figure 2.
Showerhead resistance factors k for the 10 showerheads surveyed.
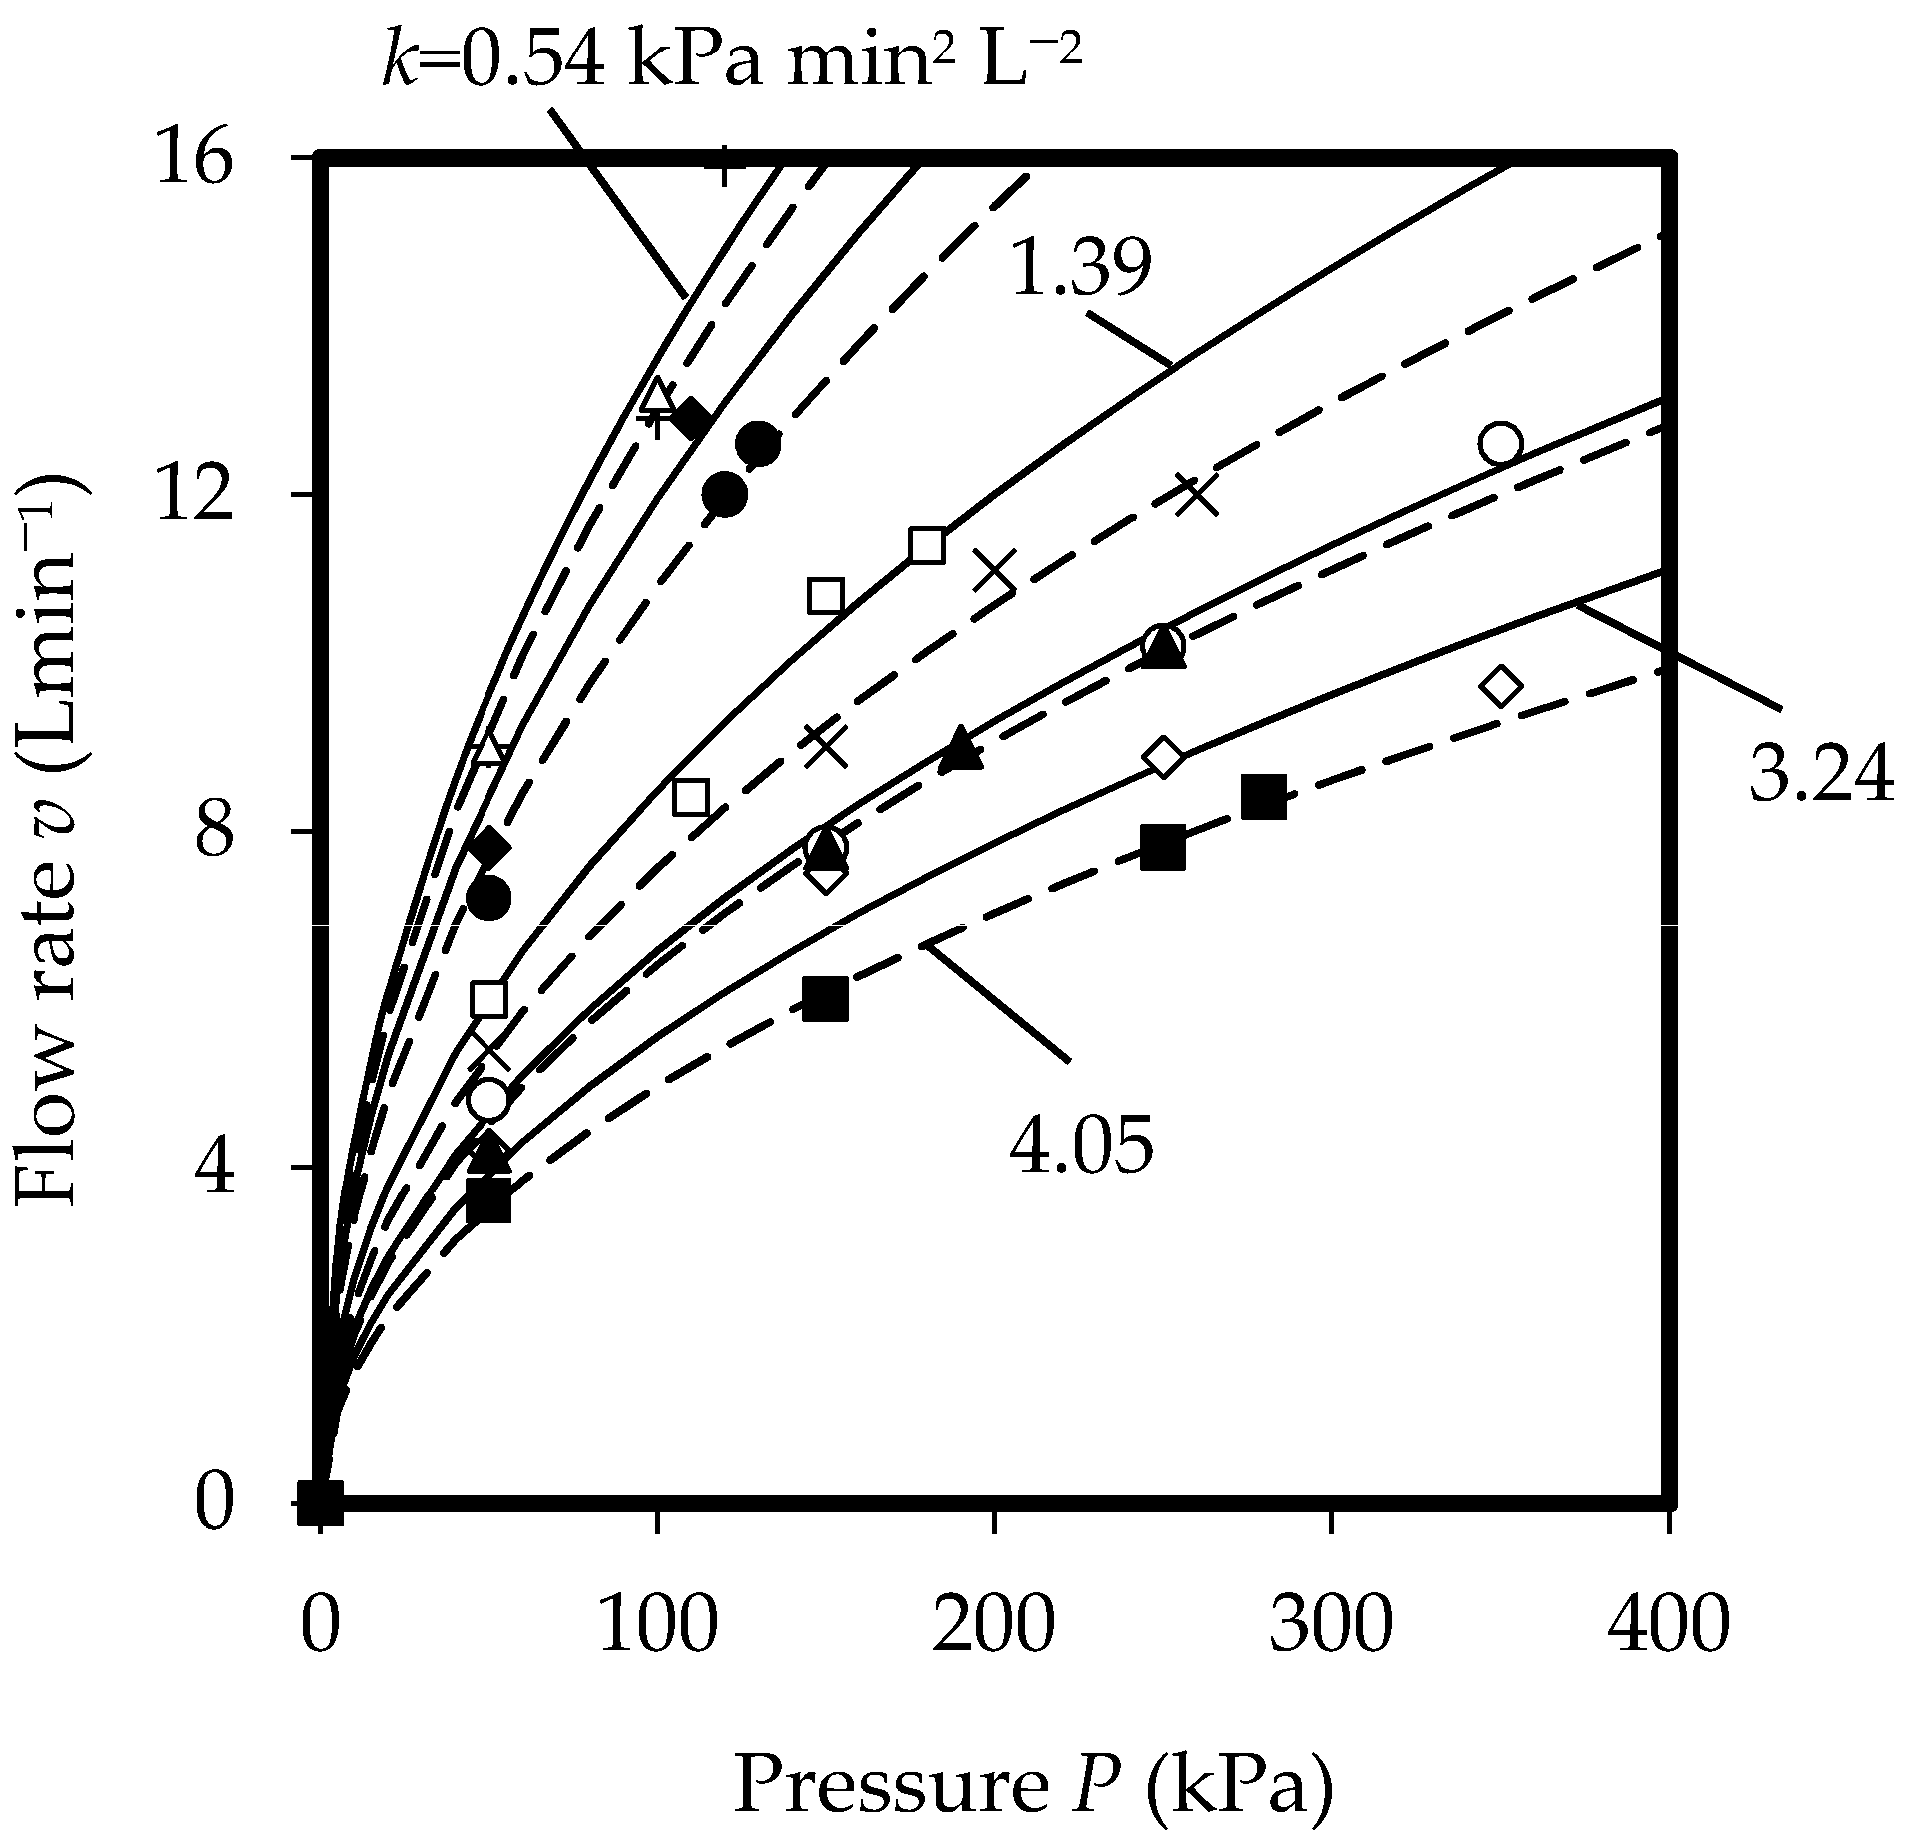
Figure 3.
Cold water supply temperatures at showerheads.

Figure 4.
Water consumption ratios for showers.

Figure 5.
Model validation: (a) per capita daily shower water consumption; (b) per capita annual hot water energy consumption.
Figure 5.
Model validation: (a) per capita daily shower water consumption; (b) per capita annual hot water energy consumption.

| Attribute | Unit | Expression | Other Reference(s) |
|---|---|---|---|
| Hot water shower | - | 92% (summer months) | 97% (summer months) [11] |
| T0 | °C | 38.6 °C (SD = 2.5 °C) | 40.9 °C (SD = 1 °C) [11] |
| ts | s | 282 s (SD = 108 s), shampoo excluded | - |
| t1 | s | 180 s (SD = 85 s), shampoo only | - |
| t + t1 | s | 433 s (SD = 150 s) | 402 s [6] |
| Nj | - | 1 | 1.04 [6] |
| 1.1, SD = 0.3 (winter months) [11] |
| Group | n | K (kPa·min2·L−2) | Ti (°C) | T0 (°C) | T0 − Ti (°C) | v (L·min−1) | T (s) | V (L) |
|---|---|---|---|---|---|---|---|---|
| 1 | 12 | 0.54–0.84 | 26.8 | 36.8 | 10.0 | 11.9 | 359 | 70.9 |
| 2 | 8 | 1.39–1.75 | 26.6 | 38.4 | 11.8 | 9.8 | 357 | 59.1 |
| 3 | 6 | 2.31–2.43 | 26.0 | 35.4 | 9.4 | 10.6 | 314 | 52.9 |
| 4 | 7 | 3.24 | 28.5 | 42.7 | 14.2 | 10.6 | 240 | 42.6 |
| 5 | 4 | 4.05 | 26.2 | 38.8 | 12.6 | 6.0 | 281 | 28.1 |
Table 3.
Operating parameters of a Water Efficiency Labelling Scheme (WELS) rated showerhead (k = 2.46).
| Group | 1st Month (Ta = 23.7 °C) | 2nd Month (Ta = 21.7 °C) | 3rd Month (Ta = 16.1 °C) | 4th Month (Ta = 16.3 °C) | 5th Month (Ta = 15.8 °C) | |||||||||||||||
|---|---|---|---|---|---|---|---|---|---|---|---|---|---|---|---|---|---|---|---|---|
| T0 (°C) | v (L·min−1) | t (s) | V (L) | T0 (°C) | v (L·min−1) | t (s) | V (L) | T0 (°C) | v (L·min−1) | t (s) | V (L) | T0 (°C) | v (L·min−1) | t (s) | V (L) | T0 (°C) | v (L·min−1) | t (s) | V (L) | |
| 1 | 37.6 | 8.9 | 294 | 43.4 | 37.6 | 8.9 | 294 | 43.4 | 37.6 | 8.5 | 309 | 44.0 | 37.6 | 8.6 | 330 | 47.6 | 37.6 | 8.4 | 316 | 44.1 |
| 2 | 38.9 | 8.4 | 321 | 44.9 | 37.6 | 8.6 | 280 | 40.0 | 37.7 | 8.2 | 292 | 40.1 | 37.7 | 8.3 | 319 | 44.4 | 37.7 | 8.1 | 299 | 40.3 |
| 3 | 35.7 | 11.2 | 299 | 55.8 | 37.7 | 8.3 | 297 | 40.8 | 37.8 | 7.9 | 317 | 41.9 | 37.7 | 8.0 | 341 | 45.8 | 37.8 | 7.8 | 324 | 42.0 |
| 4 | 41.9 | 11.1 | 242 | 44.7 | 37.8 | 8.0 | 302 | 40.3 | 37.9 | 7.7 | 326 | 41.7 | 37.8 | 7.8 | 351 | 45.6 | 37.9 | 7.5 | 332 | 41.5 |
| 5 | 39.0 | 6.3 | 321 | 33.7 | 37.9 | 7.7 | 317 | 40.9 | 37.9 | 7.4 | 340 | 42.0 | 37.9 | 7.6 | 368 | 46.3 | 38.0 | 7.3 | 347 | 41.9 |
| Attribute | Unit | Expression | Remark |
|---|---|---|---|
| (a) k = 0.54–4.05 kPa min2·L−2, Ta = 26.3 °C | Test for correlation | ||
| T0 | °C | 36.2 + 1.1k | <0.001 * (t-test) |
| T0 − Ti | °C | 9.8 + 0.88k | <0.0001 * (t-test) |
| v | L·min−1 | 11.4 − 0.72k | 0.05 * (t-test) |
| V | L | 60.3 − 6.1k | 0.05 * (t-test) |
| t | s | 316 −13k | 0.4 (t-test) |
| (b) k = 2.46 kPa min2·L−2, Ta = 15.8–23.7 °C | Test for normality | ||
| T0 | °C | 38.5 (SD = 2) | >0.01 * (w/s test) |
| T0 − Ti | °C | T0 − 10.4Ta0.29 | - |
| v | L·min−1 | v0 (k0/k)1/2 | - |
| V | L | 45.6 (SD = 18.8) | >0.05 * (w/s test) |
| t | s | 305 (SD = 107) | >0.05 * (w/s test) |
Notes: * Level of significance = 0.05 unless otherwise specified; SD = standard deviation.
| Parameter | Values | Distribution | Reference |
|---|---|---|---|
| Water-CO2 Emission Factor, α (kg-CO2 m3) | 0.94 | Constant | [11] |
| Energy-CO2 Emission Factor, β (kg-CO2 MJ−1) | 0.20 | Constant | [17] |
| Number of Showers per Resident per Day, Nj (hd−1·day−1) | range = 1–3, mean = 1.6 (June–August) | Discrete | [11] |
| range = 1–3, mean = 1.1 (September–May) | Discrete | [11] | |
| mean = 1.04 (September–January) | Discrete | [6] | |
| Showerhead Operating Time ts (s) | mean = 496 − 13k, CI = 185–1093 | Log-normal | [7] |
| mean = 402, CI = 178–910 | Log-normal | [6] | |
| Hot Showers, φ | 97% (June–August) | Discrete | [11] |
| 100% (September–May) | Discrete | [11] | |
| Shower Water Temperature, T0 (°C) | mean = 36.2 + 1.1k | Normal | [7] |
| range = 33.4–42.7, sd = 2.6 | |||
| Ambient Temperature, Ta (°C) | Hong Kong weather data in the years of 1884–1939, 1947–2006 | Normal | [11] |
| Showerhead Resistance Factor, k (kPa·min2·L−2) | mean = 3.8, sd = 1.74 | Discrete | [6] |
| 0.81–9.04 | Uniform | [7] | |
| Static Water Pressure at Showerhead, Ps (kPa) | range = 150–350 | Uniform | [16] |
| Pipe Friction Loss, PL (kPa·m−1) | range = 0.1–0.5 | Uniform | [16] |
| Supply Pipe Length, Le (m) | range = 100–300 | Uniform | [15] |
Notes: SD = standard deviation; CI = 99% confidence interval.
| Showerhead | Resistance Factor Range | Water Consumption (m3·ps−1·year−1) | Hot Water Energy Consumption (GJ·ps−1·year−1) |
|---|---|---|---|
| WELS Grade 1 | 4.02–9.04 | 15.4 (0.8) | 1.24 (0.09) |
| WELS Grade 2 | 2.26–4.02 | 23.5 (1.3) | 1.63 (0.12) |
| WELS Grade 3 | 1.27–2.26 | 31.8 (1.7) | 2.00 (0.15) |
| WELS Grade 4 | 0.81–1.27 | 41.0 (2.2) | 2.44 (0.18) |
Table 7.
Impacts of the Water Efficiency Labelling Scheme on showers for bathing in relation to water savings, energy savings and CO2 emissions reductions.
| Scenario | Water Consumption (m3·ps−1·year−1) | Energy Consumption (GJ·ps−1·year−1) | CO2 Emissions (kg-CO2·ps−1·year−1) |
|---|---|---|---|
| Existing: k = 0.81–9.04 (mean = 3.8, sd = 1.74) | 24.3 | 1.66 | 355 |
| (1) For k ≥ 1.27 | 21.0 (−14%) | 1.50 (−10%) | 321 (−10%) |
| (2) For k ≥ 2.26 | 17.5 (−28%) | 1.35 (−19%) | 286 (−19%) |
| (3) For k ≥ 4.02 | 15.4 (−37%) | 1.24 (−25%) | 262 (−26%) |
© 2016 by the authors; licensee MDPI, Basel, Switzerland. This article is an open access article distributed under the terms and conditions of the Creative Commons Attribution (CC-BY) license (http://creativecommons.org/licenses/by/4.0/).
Share and Cite
MDPI and ACS Style
Wong, L.-t.; Mui, K.-w.; Zhou, Y. Impact Evaluation of Low Flow Showerheads for Hong Kong Residents. Water 2016, 8, 305. https://doi.org/10.3390/w8070305
AMA Style
Wong L-t, Mui K-w, Zhou Y. Impact Evaluation of Low Flow Showerheads for Hong Kong Residents. Water. 2016; 8(7):305. https://doi.org/10.3390/w8070305
Chicago/Turabian StyleWong, Ling-tim, Kwok-wai Mui, and Yang Zhou. 2016. "Impact Evaluation of Low Flow Showerheads for Hong Kong Residents" Water 8, no. 7: 305. https://doi.org/10.3390/w8070305
Note that from the first issue of 2016, this journal uses article numbers instead of page numbers. See further details here.