Review

Stormwater Management: Calculation of Traffic Area Runoff Loads and Traffic Related Emissions

by
Maximilian Huber
and
Brigitte Helmreich
*
Chair of Urban Water Systems Engineering, Technical University of Munich, Am Coulombwall 3, 85748 Garching, Germany
*
Author to whom correspondence should be addressed.
Water 2016, 8(7), 294; https://doi.org/10.3390/w8070294
Submission received: 18 May 2016 / Revised: 6 July 2016 / Accepted: 12 July 2016 / Published: 15 July 2016
(This article belongs to the Special Issue Urban Drainage and Urban Stormwater Management)

Abstract

:
Metals such as antimony, cadmium, chromium, copper, lead, nickel, and zinc can be highly relevant pollutants in stormwater runoff from traffic areas because of their occurrence, toxicity, and non-degradability. Long-term measurements of their concentrations, the corresponding water volumes, the catchment areas, and the traffic volumes can be used to calculate specific emission loads and annual runoff loads that are necessary for mass balances. In the literature, the annual runoff loads are often specified by a distinct catchment area (e.g., g/ha). These loads were summarized and discussed in this paper for all seven metals and three types of traffic areas (highways, parking lots, and roads; 45 sites). For example, the calculated median annual runoff loads of all sites are 355 g/ha for copper, 110 g/ha for lead (only data of the 21st century), and 1960 g/ha for zinc. In addition, historical trends, annual variations, and site-specific factors were evaluated for the runoff loads. For Germany, mass balances of traffic related emissions and annual heavy metal runoff loads from highways and total traffic areas were calculated. The influences on the mass fluxes of the heavy metal emissions and the runoff pollution were discussed. However, a statistical analysis of the annual traffic related metal fluxes, in particular for different traffic area categories and land uses, is currently not possible because of a lack of monitoring data.

Graphical Abstract

1. Introduction

In most cases, four types of traffic related loads are used for calculating mass balances and fluxes [1]. Specific substance emission loads are presented in the literature for each vehicle per kilometer traveled (mg/(vehicle·km)) or for all vehicle kilometers traveled in a distinct catchment area during a specific period (mg/(ha·km)). Annual loads can be specified by the road length (g/km) or by the traffic area (g/ha). For the description of the pollution of a traffic area, a differentiation is necessary between total traffic related emission loads, atmospheric deposition loads (wet and/or dry), and runoff loads from traffic areas. For the calculation of runoff loads, long-term measurements of runoff concentrations and water volumes of a monitoring site with a distinct catchment area must be recorded, analyzed, and published. Although several researchers have evaluated the runoff concentrations of different traffic areas [2,3], only a part of these monitoring programs included the calculation of annual loads. This is based on the fact that during most monitoring programs, only a limited number of samples is collected and most objectives do not require the calculation of loads (e.g., manual (grab) samples for stormwater permit applications). Nevertheless, annual heavy metal loads normalized per hectare of impervious catchment area are necessary for mass balances and their determination is subsequently important for several purposes (e.g., modeling of stormwater quality and transportation into receiving water, calculation of metal masses removed by treatment systems, determination of pollution loads for laboratory test methods, calculation of regional or national mass balances, or the assessment of the environmental impact and benefit of different techniques to remove toxic substances in relation to their costs).
For stormwater management, determining traffic area runoff loads for different traffic area categories is necessary to design effective stormwater management practices [4]. Therefore, detailed information on differentiated traffic related sources (emissions because of leaded gasoline, tire wear, brake lining wear, roadway abrasion, weights for tire balance, guardrails, lampposts/signs, and de-icing salts) and areas (traffic area categories) is needed to determine their contributions to the total pollution of environmental compartments and to develop cost efficient mitigation strategies. Previously, urban area pollutant categories were often confined to broader land use categories such as commercial, industrial, or residential [4]. By this approach, the different pollution loads of traffic areas cannot be considered although all road surfaces represent approximately 10%–15% of the total urban area [5,6] and in commercial and industrial areas, parking lots can constitute up to 46% of the total area [5]. Thus, it is essential to consider the runoff loads more differentiated because of the large percentages of different traffic areas to the total urban area. However, most values for specific traffic area categories were available and summarized for highways and less were published for parking lots and other roads [7,8,9]. Because most values and ranges of pollutant loads published in books, reports, regulations, and standards are only based on a few studies, no reliable values are currently available for the main traffic area categories and a relation of the loads to climatic factors was also not evaluated previously. In addition, most published data summaries of runoff loads are based on the last century and they do subsequently not represent the latest trends.
In traffic area runoff, the occurrence of substances depends on several processes. Dustfalls and dry deposition during periods without rain entrain contaminants and remove them from the atmosphere [6,10]. These mechanisms are especially relevant for urban areas [11]. The processes during rain events are wet deposition (removal of additional substances from the atmosphere) and wash-off of previously deposited pollutants. Concerning the wash-off, Racin et al. [12] concluded that splashing and washing of pollutants from vehicles is more important than the wash-off of pollutants accumulated on road surfaces. Both the wash-off and the substances in the atmosphere can be linked to traffic related sources. For most heavy metals, the wear of brakes and tires are relevant sources. Moreover, braking, acceleration, and steering activities lead to increased abrasion of tires, higher use of brake linings, and increased automotive exhaust gas emissions [13,14]. The corrosion and subsequent dissolution of zinc (Zn) from the surface of galvanized elements during rain events is also a relevant source [15]. Further traffic related sources are the use of catalytic converters in vehicles [16], road maintenance with de-icing salts [17], road wear, and drip losses. All of these traffic related sources emit heavy metals, hydrocarbons, and further substances and subsequently lead to a pollution of runoff from traffic areas. Thus, the substances analyzed in traffic area runoff waters include solids, organic parameters, heavy metals, and compounds of de-icing salts [18,19]. Metals such as cadmium (Cd), chromium (Cr), copper (Cu), nickel (Ni), lead (Pb), antimony (Sb), and Zn are crucial pollutants because of their toxicity, non-degradability, and their increase in all environmental compartments in consequence of their widespread industrial use [20,21]. Among these parameters, the three heavy metals Cu, Pb, and Zn were mostly measured in the highest concentrations in runoff from traffic areas [2]. Because of the relevant heavy metal concentrations, a treatment of the runoff water is often necessary to prevent negative effects on surface water, groundwater, and aquatic biota [22,23,24]. These stormwater treatment systems can be designed as a part of existing urban infrastructure for stormwater management [25].
The focus of this paper was set on the metals in traffic area runoff and their traffic related emissions. The hypothesis of this study was that a distinct calculation of mass balances for traffic related metals (emissions and runoff loads) of all types of traffic areas (i.e., highways, roads, and parking lots) is possible as a result of a literature study. The objectives of this paper were as follows: to summarize the distributions of annual metal loads of runoff from different types of traffic areas, to identify relevant trends and factors, to update and expand existing mass balances (heavy metal runoff loads and emissions) for Germany, and to determine the mass fluxes of traffic related metals.

2. Materials and Methods

The annual loads summarized in this paper were selected from a database of German and international studies with descriptions of the runoff from traffic areas. The database includes information on the monitored traffic area (categories: bridges, highways, parking lots, and roads), the substance concentrations and loads, and all influencing factors reported by the authors (e.g., land use characteristics, vegetation, topography, road design, operational characteristics, climatic factors, type of sampling, sampling strategy, sample preparation, sample analysis, and calculation methods). In addition to peer-reviewed journal papers, reports, books, and non-reviewed journal articles that presented data of metals in traffic area runoff were considered after validating the published results (i.e., to fulfill requirements such as a detailed description of the applied methods, the performance of quality control measures, and the reliability of the monitoring setup). The metal runoff concentrations and site-specific and method-specific (i.e., sample collection, preparation, and analysis) factors influencing the results were presented in another review [2]. From this database with more than 300 monitoring sites, this review includes all studies that presented traffic area runoff loads for the metals Cd, Cr, Cu, Ni, Pb, Sb, and Zn. The values were always reported as total (recoverable) metals that were measured after an appropriate digestion (i.e., strong acid or aqua regia digestion; sometimes combined with an autoclave or microwave). The sample preparation and analysis conducted by the selected studies had a low influence on the results because of quality assurance/quality control procedures [2]. All studies used automatic composite samplers to obtain a large number of samples for each rain event (active sampling) or a mixed sample of a part of the complete runoff (passive sampling). The highest uncertainties regarding all selected long-term monitoring programs are related to the handling of the raw data (e.g., time interval of the data logging and the link between flow-/rainfall-measurements and measured runoff concentrations) and the calculation methods for the annual loads (e.g., values below the detection limit or missing values because of a malfunction of a device). All monitored traffic areas were categorized in one of the three categories highway (H), parking lot (P), and road (R). Sites with reported runoff loads that are not completely linked to impervious traffic areas were categorized as special (S). Each monitoring site got an identification number (ID) that consists of one capital letter according to the category (H, P, R, or S) and two consecutive numbers, e.g., H01. These IDs were used in the Tables and Section 3.
The characteristics of the sites used for this review are summarized in Table 1. Table 1 includes data about the location (country), the period of sampling, the land use, special fixed site-specific factors, the road maintenance (i.e., winter services and sweeping), the average annual daily traffic (AADT), the discharge area of the monitoring site (i.e., the catchment area connected to the sampler), and the annual rainfall depth. The runoff loads of the metals are presented in Table 2. This novel evaluation of different types of traffic areas (H, R, and P) only used annual metal loads per hectare of catchment area (g/ha) that were calculated by the respective authors of the selected studies from runoff concentrations of impervious surfaces without a subsequent (pre-)treatment (i.e., some sites presented in [26,27,28,29,30] are summarized in the category S). Therefore, a conversion of units was sometimes performed (lb/acre, mg/m2, or kg/ha in g/ha). In addition, if all required information was available, annual metal loads presented as g/km were recalculated to g/ha. A calculation of loads from runoff concentrations and the corresponding water volumes was not performed because of climatic site-specific factors (i.e., variable at each site) and several uncertainties (e.g., missing data about the percentage of analyzed runoff volumes to total volumes, the percentage of collected rain events to total rain events, the representativeness of the analyzed rain events in terms of intensities and durations, and the ambiguity between rainfall and runoff volumes).
The software package SPSS 22 (IBM) was used for statistical analysis and plotting. For box and whisker plots, the bottom and top of each box are the first and third quartiles and the band inside the box is the median. The whiskers represent 1.5 times the interquartile range (IQR). Outliers (>1.5 times IQR) are marked as small circles and extreme values (>3.0 times IQR) as stars. To analyze historical trends, the period of the monitoring program was used instead of the publication date. Because of the non-normal distribution of most parameters, the non-parametric Spearmen rank-order correlation was subsequently used for the correlation analysis following the example of Mosley and Peake [31]. For the correlation analysis, the sites H27, H28, and R02 were split up into two, four, and nine independent data sets, respectively, to consider the heavy metal loads and annual rainfall depths for each year. For H05, H06, and H08–H13, no values for the annual rainfall depths were used for the statistical analysis because of missing mean values.
For the calculations of median values, mean values, and standard deviations (SD) in Section 3.3, some data were excluded because of special site-specific factors (cf. Section 3.2.1). To avoid a bias because of the historical trends of the Pb data (cf. Section 3.2.2), the values of the 20th century were excluded for the discussion of recent loads. All of these exceptions are directly specified at the presentation and discussion of the particular results.

3. Results and Discussion

3.1. Annual Metal Runoff Loads for Different Traffic Areas

A summary of annual total metal loads of 45 sites is presented in Table 2 for all three traffic area categories (H, R, and P) and the six most relevant heavy metals (Cd, Cr, Cu, Ni, Pb, and Zn). Most of the values were published for highway sites (H, n = 32) with fewer values for other roads (R, n = 8) and parking lots (P, n = 5). The traffic area runoff loads of Cu, Pb, and Zn were mostly measured and published by other researchers. Less data are available for Cd, Cr, Ni, and Sb. For Sb, the annual average runoff load was only published for one urban road (16.8 g/ha at R02; [45]) and three highway sites (11.2 g/ha at H19, 5.6 g/ha at H20, and 17.9 g/ha at H23; [37]).
The most concentrated metal was Zn, followed by Pb, Cu, Ni, Cr, Cd, and Sb. The SDs between all monitoring results are quite high for all heavy metals summarized in Table 2: 12.9 g/ha Cd, 291 g/ha Cr, 587 g/ha Cu, 540 g/ha Ni, 3180 g/ha Pb, and 3330 g/ha Zn. In addition, the runoff loads of one to four sites are calculated as extreme values for most metals (Figure 1). Compared with the other heavy metals, the variations of the Pb and Zn data (e.g., cf. the SDs above and the IQRs presented in Figure 1) are the highest. For Pb, it is linked to the historical trends (cf. Section 3.2.2). In contrast, the contributions of different Zn sources to the runoff loads are highly variable between each site (e.g., brake linings, galvanized bridge parts, galvanized car parts, guardrails, lamp-posts, motor oil, tires, safety fences, and signs; [38,50,51]). Thus, these high loads are based on different fixed site-specific factors (cf. Section 3.2.1), operational characteristics (cf. Section 3.2.2) but can also be linked to climatic (cf. Section 3.2.3) and method-specific influences [2].
For most values, the loads published for runoff from parking lots were lower than the loads of highway and road runoff (Table 2 and Figure 1). One further trend between the traffic area categories was found for the runoff loads from parking lots. The two parking lots P01 and P02 at the Florida Aquarium (USA) were less polluted compared with the three frequently used German highway parking lots for trucks (P03), cars (P04), and all types of vehicles (P05). Thus, the frequently used highway parking lots with high percentages of trucks have increased runoff loads and these values are comparable with the annual metal loads of the runoff from roads.
Strong and statistical significant correlations were determined for Cr with Pb, Cu, and Zn (Table 3) that represent the particulate fraction of these metals because Cr and Pb are mostly particulate in the runoff from traffic areas and Cu and Zn are also particulate but more dissolved [2]. Some significant correlations between the catchment area and the metal runoff loads were also calculated (Table 3). However, only an effect of the area on the first flush was previously reported [52].

3.2. Influences on the Metal Runoff Loads

3.2.1. Fixed Site-Specific Influences

One often-discussed factor is the impact of the AADT on the runoff pollution of traffic areas. However, AADT can only explain approximately 30% of the variations between different sites [53]. In this review, the AADT varies between 2000 vehicles per day and 120,000 vehicles per day for the highway and road sites (Table 1). Significant correlations between AADT and the heavy metals were found for Cd, Cr, and Cu (Table 3). Cr was the only metal with a strong correlation (δ = 0.66). Thus, further site-specific factors have an influence on the annual loads. A general description of these site-specific factors that influence the metal runoff concentrations and loads from traffic areas is given in [2]. In the following, only the fixed site-specific factors that were responsible for the extreme values calculated for all 45 sites were discussed with the exception of Pb (cf. Section 3.2.2).
Most of the largest annual loads were measured for the urban site H01, which has a high AADT of 57600 vehicles per day. Further factors that might have led to the high runoff concentrations were the extreme use of de-icing salts, which had increased levels of metal contents (cf. Section 3.4.2), by the winter services (ca. 2100 g/(m2·yr)), the grade of congestion during rush hours, and the road design (e.g., a section of the monitoring site was a bridge with concrete pillars) [32]. In addition to these high concentrations, uncertainties regarding the discharge area because of the steep slope at the ends of the drainage area causing additional water flowing into the monitored area might have led to the increased calculated annual runoff loads [32]. At H12, the presence of a nearby Zn smelter was responsible for the high Zn runoff loads [34]. The road design of R01 resulted in increased runoff loads because of the complete drainage of the catchment area by curbs and gutters (runoff volumes were calculated from the rainfall depths and an assumed runoff coefficient of 0.9), the presence of guardrails (at the median and at both sites of the road), and the stop-and-go traffic.
For the special sites (S, n = 10), grass swales were often used instead of conventional curbs and gutters to drain the catchment areas and the samples were often taken at the drainage pipes. The category S consists of the highway sites S01–S04 and the parking lot sites S05–S10. Most metal runoff loads of category S (Table 4) are much lower than the ones reported for non-pre-treated runoff loads for comparable sites (Table 2). At S01, the surface was only sealed by 39.6% with asphalt and the rest of the drainage area were adjacent areas with surfaces vegetated by grass [26]. At S02, the catchment area consisted of 61% asphalt, which was drained to a catch basin, and the grassy shoulder that were both monitored [28]. A similar situation was present at S03 with 45% impervious asphalt and a grassy shoulder [28]. At S04, 37.6% of the drainage area was paved with asphalt and the highway runoff drained into a large grassy median that were both simultaneously monitored in mixed samples [30]. For the parking lots, several loads for pre-treated runoff were reported [29]: asphalt surfaces with subsequent vegetated swales (S05,S06), cement surfaces with subsequent vegetated swales (S07,S08), and pervious surfaces with subsequent vegetated swales (S09,S10). A comparison of the sites S05–S10 with the sites P01 and P02 shows that small alterations to parking lot designs can dramatically decrease runoff metal loads. The reduction of pollutants by grass swales was also measured for the adjacent sites H21/S02 and the data presented for S04 in [30]. These results concerning the runoff load reductions by pervious surfaces and vegetated swales can be used for designing stormwater management practices. For the design of vegetated swales, further site-specific factors such as the road design (e.g., crossings and roundabouts) and the grade of congestion (i.e., sites with frequent stop-and-go traffic) must be considered [54].

3.2.2. Historical Trends

The historical trends of traffic area runoff loads published in literature were analyzed for Cu, Pb, and Zn from the 1970s to date. The loads were aggregated into five decades and plotted as box and whisker plots in Figure 2.
For the Pb data, a significant decrease of the loads was detected as a function of time because of the phase-out and substitution of leaded gasoline. The decrease of Pb use as an anti-knocking agent started in the USA in the mid-1980s and was completed in 1996 [55]. In Europe, the situation was not as homogenous as in the USA. For example, Pb was almost completely phased-out in gasoline in Germany and several other countries of Western Europe since 1986 [56,57]. The phase-out in the European Union ended in January 2002, with the elimination of leaded gasoline in Italy [58]. At the same time, leaded gasoline was banned in China [15]. Further reductions of Pb usage are related to the substitution of Pb in tires and brake linings [38,59,60], lubricating oil and grease [50], and weights added to vehicles for tire balance [61,62]. These developments are responsible for the high Pb loads reported in older publications (cf. Table 2). However, tires still contain Pb [63,64] (cf. Section 3.4.2) and Pb is added to the gasoline used in classic cars. As a consequence, Pb is still found in runoff samples of the 21st century in low concentrations [2] and in younger vegetated infiltration swales in low contents [54]. Thus, only Pb data of the 21st century should be used for current mass balances (cf. Section 3.3 and Section 3.4). For Cu and Zn, no historical trends were detected. The median values of the decades varied because of different characteristics of the sites monitored per decade. The evaluation of the Cu and Zn loads confirms the higher variability of Zn (e.g., cf. the IQRs presented in Figure 2) compared with Cu that is based on the different sources (e.g., presence of Zn in galvanized structures and crumbs of car tire rubber; cf. Section 3.4.2). In addition, Cu and Zn are simultaneously present in some sources such as brake linings [38,65] and, therefore, their runoff loads have a medium correlation (Table 3).

3.2.3. Annual Variations and Climatic Site-Specific Influences

Since most of the other sampling periods were only 1 to 2 years long (cf. Table 1), values of the annual runoff loads and annual rainfall depths are only available for each monitored year for the three traffic area sites R02, H27, and H28. Variations of the annual runoff loads (n = 9) were calculated for a nine-year monitoring program (R02) from the data presented by Nadler and Meißner [45]. The minima and maxima of the annual runoff loads calculated for each twelve months are 0.5–3.1 g/ha Cd, 17–76 g/ha Cr, 116–324 g/ha Cu, 20–60 g/ha Ni, 28–143 g/ha Pb, 10–23 g/ha Sb, and 1530–3550 g/ha Zn. The coefficients of variation (n = 9) for the annual runoff loads of R02 are 56% for Cd, 51% for Cr, 33% for Cu, 43% for Ni, 44% for Pb, 27% for Sb, and 30% for Zn. The catchment area, the sampling procedure, and most fixed site-specific factors (e.g., presence of a guardrail) were the same for the complete monitoring campaign. Only a small increase of the AADT was measured (6100 vehicles per day at the beginning and approximately 6800 vehicles per day in the second half of the monitoring program) and a different agricultural land use occurred in the east of the monitoring site. Since most annual metal loads of the second half of the monitoring program are lower than the loads of the first half, the influence of the AADT on the loads is not significant. Therefore, the variation of the heavy metals might be correlated with climatic factors such as the annual rainfall depth that varied largely between 334 mm and 863 mm (mean 667 mm; coefficient of variation 26%). However, a strong correlation (δ ≥ 0.60) between the seven metals and the annual rainfall depth was only calculated for Sb (δ = 0.68, p < 0.05). Thus, the annual rainfall depths also had no significant influence on the variability of the annual heavy metal runoff loads for this site although most of the lowest loads were calculated for the year with low rainfall depths and long dry weather periods in the spring and summer.
Smaller annual variations of the heavy metal runoff loads were published for H28 (n = 4) for each of the four years that were monitored [41]: 340–381 g/ha for Cu, 47–63 g/ha for Pb, and 1200–1370 g/ha for Zn. The coefficients of variation (n = 4) are 5% for Cu, 13% for Pb, and 6% for Zn. The annual rainfall depths varied between 477 mm and 726 mm (mean 591 mm; coefficient of variation 22%) at this highway site. The small variations can be partially explained by varying street sweeping intervals of the hard shoulders [41]. Because of the small n, no correlation analyses were performed.
The variations of the annual rainfall depths at both sites were comparable (coefficients of variation are 26% and 22%). However, the variations between the metal runoff loads were much higher for R02 than for H28. These differences between the monitored years and sites can depend on a multitude of climatic boundary conditions (not only the rainfall depths), which can generally induce different deposition and wash-off processes, and on fixed site-specific factors (i.e., different median pollution loads of both sites). These influences on the median loads can be related to the different AADT and speed limits (50 km/h at R02 and 120 km/h at H28) and the presence of noise barriers, a forest, and hard shoulders at H28, which can also reduce the influences of climatic factors (e.g., wind turbulences) on the runoff loads [41]. Thus, the fixed site-specific factors also affected the influences of the climatic factors on the annual variations of the runoff loads.
At H27, with a speed limit of 120 km/h, the published annual heavy metal runoff loads were 470/410 g/ha for Cu, 71/88 g/ha for Pb, and 1010/1370 g/ha for Zn for the years 2006/2007 [41]. The annual rainfall depths were 876 mm and 1184 mm for the years 2006 and 2007, respectively. Thus, the rainfall depth was higher for 2007 and the runoff loads increased for Pb and Zn but not for Cu. Consequently, median runoff concentrations from the literature multiplied by different annual rainfall depths of a specific site cannot be used to describe the variance of the annual runoff loads because of climatic variations.
For all monitoring sites, the annual rainfall depth varied between 254 mm and 2540 mm (median 792 mm; 90th percentile 1200 mm). A strong correlation between the annual rainfall depths and the heavy metals was only calculated for Cd (δ = 0.64, p < 0.01) for all monitoring sites (Table 3). The influence of the seasons on the pollution of traffic area runoff was evaluated by Helmreich et al. [66] with a considerable seasonal increase of pollutants in the runoff during the cold season. A correlation of the seasons could not be performed in this study because all published annual loads did not distinguish between different seasons. Therefore, only the results of single events can be used for this purpose. For example, the first storm of each season in (semi)arid regions is a special case for the climatic influences that is characterized by higher runoff loads [67,68].
In addition, the atmospheric deposition (wet and dry) must be considered as a climatic factor that affects the runoff loads. The deposition fluxes on traffic areas are strongly influenced by site-specific factors [69]. For example, the absence of curbs, hard shoulders, and noise barriers are site-specific influences that have a positive effect on reducing runoff concentrations by decreasing the deposition rates and the subsequent wash-off [41,70]. The deposition is also influenced by the traffic volume and the surrounding land use. Less data are available for urban traffic area sites (in particular roads and parking lots) at which higher fractions of metal emissions can be deposited and washed-off compared with non-urban traffic areas [11]. These rates are also influenced by the antecedent dry period [71]. However, Racin et al. [12] concluded that splashing and washing of pollutants from vehicles is more important than the wash-off of pollutants accumulated on road surfaces by precipitation (wet deposition). An increased importance of precipitation for runoff pollution of traffic areas in industrial zones is proposed by Dannecker et al. [72] and it is highly variable for each metal. Dry deposition at industrial sites also has an important effect, whereas the influences of traffic related emissions become more important at non-industrial urban sites [72]. For the non-urban sites H04, H07, and S01, the influence of the wet and dry deposition rates on the corresponding annual runoff loads was determined. The ratios of deposition loads to runoff loads for the sites H05/H07/S01 were 35%/31%/42% for Cd, 65%/2%/125% for Cr, 36%/23%/46% for Cu, 24%/27%/50% for Pb, and 54%/31%/80% for Zn [27]. Thus, the deposition affects the runoff loads at these non-urban highway sites and the influences depend on both the site and the metal.
In summary, the deposition is highly variable for each site because of site-specific factors and a robust data set is currently not available to determine the deposition loads for all types of traffic areas and the most relevant land use categories. For a rough estimation, the average deposition loads summarized by Zessner [73] can be used, which consist of traffic related and non-traffic related metals. He determined annual deposition loads of 1.4 g/ha Cd, 50 g/ha Cu, and 300 g/ha Zn for rural areas and annual deposition loads of 6.0 g/ha Cd, 250 g/ha Cu, and 1000 g/ha Zn for urban areas. Ilyin et al. [74] modeled annual deposition loads of 0.25–0.65 g/ha Cd and 8–20 g/ha Pb for Germany on a large scale. However, these data might underestimate the real values of metals deposited on traffic areas because of the large-scale model. For comparison, Kocher et al. [75] determined annual deposition loads for three different German highways and the rates varied strongly between each year, season, metal, and monitoring point (at ground level or 1.5 m height and with distance from the highways). Thus, method-specific factors also have an influence on the results. At 1.5 m height, the deposition rates determined by Kocher et al. [75] are in the range of the ones summarized by Zessner [73]. However, the values at ground level can be higher by a factor of up to approximately five for the measurements directly at the highway site. Thus, traffic related emissions highly affect the deposition rates on traffic areas.
A general description of the influences of climatic factors such as deposition rates, the antecedent dry periods, rain characteristics (volume, intensity, and duration), seasonal effects, and wind turbulence on the runoff from traffic areas is given in [2]. For rain characteristics, mostly poor correlations were obtained for the metal runoff concentrations. This is in accordance with the findings of this review (low correlation between annual rainfall depths and runoff loads). Thus, the differences of the runoff loads cannot be based on the uncertainties of the measured values and the high variability of the metal runoff loads between different years must be based on the variability of climatic factors and some fixed-site specific factors such as road maintenance (e.g., the variability of the use of de-icing salts by winter services; cf. Section 3.4.2). However, further data are needed to calculate the correlations between runoff loads and rainfall intensities or antecedent dry periods.

3.3. Average Runoff Loads for Different Traffic Area Categories

The values of the runoff loads presented in Table 2 were used to calculate median values, mean values, and SDs that could be used for mass balances (no values from H01 and Zn from H12). The calculated median annual runoff loads for all traffic areas are presented in Table 5.
For the highway data, the calculated median runoff loads are presented in Table 6.
In a literature study, Hullmann and Kraft [76] presented annual average Cu and Zn loads for runoff from traffic areas that were summarized from several studies as approximately 800 g/ha for Cu and 2700 g/ha for Zn. These values are higher than the ones calculated in this study. For comparison, Driscoll et al. [7] reported the following ranges of annual heavy metal runoff loads measured in the USA (n = 24): 7.2–37 g/ha for Cd, 12–120 g/ha for Cr, 30–4670 g/ha for Cu, 70 g/ha for Ni, 80–21,200 g/ha for Pb, and 220–10,400 g/ha for Zn. The surrounding land use characteristics comprised nineteen urban sites (commercial, residential, and suburban) and five non-urban sites (forest, agricultural, and desert). Burton and Pitt [8] also summarized the runoff loads for parking lots, highways, and different land use categories that were published in five reports of the 1970s and 1980s. For parking lots, the reported values of the annual runoff loads are 10 g/ha Cd, 60 g/ha Cu, 800 g/ha Pb, and 800 g/ha Zn [8]. The published annual runoff loads are higher for highway sites: 20 g/ha Cd, 90 g/ha Cr, 370 g/ha Cu, 4500 g/ha Pb, and 2100 g/ha Zn [8]. With the exception of Pb, these annual highway runoff loads are only slightly higher than the median values calculated for highways in this review. In contrast, these summarized parking lot runoff loads are highly different compared with the parking lot values of Table 2 because the use of parking lots differ widely. Subsequently, the runoff loads of parking lots should not be summed up but considered in accordance to their type of use (cf. Section 3.1). Another relevant factor for parking lots is the contamination of parked vehicles with dirt, rust, and further substances [77] that must be considered for planning stormwater management strategies.

3.4. Heavy Metal Load Balances for Germany

3.4.1. Mass Balances of Heavy Metal Traffic Area Runoff Loads

In Germany, there are approximately 281.3 km2 of highways and 339.5 km2 of state roads [78]. The total amount of all types of traffic areas, which also include the areas for railroads, airports, and waterways, is 18,070 km2 in Germany and the fraction of roads, places (e.g., parking lots and marketplaces), and sidewalks is 15,750 km2 [79].
Since median values are preferred for the analyses of such field data [80], the median annual loads for highway runoff and the area of highways in Germany (281.3 km2) were used to calculate the total amount of metal loads in runoff from German highways.. These total loads are presented as t/yr (1 t/yr = 1000 kg/yr) and were calculated as approximately 0.38 t/yr Cd, 2.1 t/yr Cr, 9.8 t/yr Cu, 2.5 t/yr Ni, 2.0 t/yr Pb, 0.31 t/yr Sb, and 53.4 t/yr Zn.
The calculated median annual heavy metal loads for all traffic areas, which are similar to the ones for the highway sites, and the total amount of all transportation areas (15,750 km2) were used to estimate the total traffic area runoff loads for Germany. Thus, approximately 10.7 t/yr Cd, 119 t/yr Cr, 558 t/yr Cu, 103 t/yr Ni, 173 t/yr Pb, 22.1 t/yr Sb, and 3087 t/yr Zn are transported by runoff from traffic areas in Germany. Since less polluted traffic areas are also summarized in the total amount of transportation areas and no data are available for these categories regarding runoff loads, the calculated values tend to exaggerate the total runoff loads for Germany.

3.4.2. Mass Balances of Traffic Related Heavy Metal Emissions

Hillenbrand et al. [81] published heavy metal emission loads of different sources in a literature study for Germany. For the traffic related heavy metal emissions, they calculated the average loads for Cu, Pb, and Zn for the following sources: brake lining wear, tire wear, roadway abrasion, and Pb weights for tire balance. These data were adapted, updated, and extended by Cd and further sources (Zn weights for tire balance guardrails, lampposts/signs, and de-icing salts) for this review. The emission of Pb by leaded gasoline used by classic cars was not considered (only 0.6% of the cars in Germany are classic cars and their kilometric performances are low). A summary of the following results for the four metals Cd, Cu, Pb, and Zn is presented in Table 7. Both the metal contents of different sources (mg/kg) and the emission rates (mg/(vehicle·km)) are highly variable and only average values for each source are published to indicate their importance in relation to other emission sources.
The first four sources are directly related to vehicles and the loads are determined by multiplying the metal contents of the material by their total abrasion masses. The tire wear was determined by Kocher et al. [82] based on 62 different tire samples for 13 metals and further substances. Kocher et al. [82] measured the metal contents of each tire (n = 62) and the coefficients of variation for the metal contents are 70% for Cd, 38% for Cr, 56% for Cu, 74% for Ni, 95% for Pb, 330% for Sb, and 35% for Zn. This is based on the different ages, manufacturers, and types of tires. The complete mass of tire wear is based on the emission factors reported in seven studies, which determined the tire wear as (mg/(vehicle·km)) for four vehicle categories (summarized in [81]), and the kilometric performances of the vehicles in Germany. By using the mean metal contents published by Kocher et al. [82] and an annual mass of tire wear of 111,420 t (coefficient of variation 29%) for Germany, the mean total emission loads for tire wear in Germany were calculated as 0.19 t/yr Cd, 0.51 t/yr Cr, 0.79 t/yr Cu, 0.97 t/yr Ni, 2.03 t/yr Pb, 0.42 t/yr Sb, and 1255 t/yr Zn. In contrast, Hillenbrand et al. [81] proposed annual emission loads of 2.7 t/yr Pb and 1620 t/yr Zn for tire wear. Thus, the calculated Pb and Zn loads of tire wear differ by approximately 20%–25% between these two studies. A summary of measured metal contents in tires and brakes was also presented by McKenzie et al. [64]. The contents also have a high variation for each metal (mostly one order of magnitude) and are in the order of the values summarized and measured by the German researchers [81,82]. The Cd emission load caused by brake wear was calculated with the metal content of 2.7 mg/kg presented by Legret and Pagotto [38], which is the median value of the contents summarized by McKenzie et al. [64] (coefficient of variation 120%), and the total brake lining abrasion mass of 12,500 t/yr published by Hillenbrand et al. [81]. The loads of brake lining wear for Cu, Pb, and Zn are taken from [81], which are based on the heavy metal contents of brake linings and their emissions published in eight studies separately for cars and trucks. In Germany, the brake linings of cars were responsible for 83%, 94%, and 80% of the total brake lining emission loads for Cu, Pb, and Zn, respectively. The emissions by weights for tire balances (Pb emissions reduced by 75% because of its substitution, mainly by Zn) and roadway abrasion were adapted from [81]. The roadway abrasion loads are based on the mean values of 18 road samples. The metal contents of the road surfaces varied between 0.0 and 31.5 mg/kg Cu, 0.9–29.0 mg/kg Pb, and 4–614 mg/kg Zn. Since only few data were available about the wear emission rates, in particular for different types of vehicles (e.g., cars, trucks, and buses), the uncertainties of the emission loads are high. Consequently, more data are needed to calculate reliable tire and break wear loads.
Guardrails, lampposts, and signs are parts of the road design and their heavy metal emissions must also be linked to road transportation [81]. The Zn emissions of lampposts and signs can only be a rough estimation because the number and surface area of traffic signs and further posts at traffic areas cannot be determined exactly. Most values are based on the assumptions proposed by Hillenbrand et al. [81].
The traffic related heavy metal emissions by de-icing salts for road maintenance were not previously evaluated for Germany. The novel calculated mean de-icing salt emissions (0.70 t/yr Cd, 1.75 t/yr Cu, 11.6 t/yr Pb, and 1.75 t/yr Zn) are based on an annual consumption of 3.5 million tons in Germany [78] and heavy metal contents of 0.2 mg/kg for Cd, 0.5 mg/kg for Cu and Zn, and 3.3 mg/kg for Pb in the de-icing salts [38]. However, these annual de-icing salt emissions are highly variable because of the different metal contents of the salts and the different annual consumptions that strongly depend on climatic factors. According to German regulation, the maximum permitted values for the soluble fraction of de-icing salts in Germany (sodium chloride, calcium chloride, and magnesium chloride) are 2 mg/kg Cd, 5 mg/kg Cu, 5 mg/kg Cr, 5 mg/kg Ni, 5 mg/kg Pb, and 20 mg/kg Zn [83]. In Great Britain, higher values were measured for a sodium chloride de-icing salt with 4.7 mg/kg Cr, 12 mg/kg Ni, 8.7 mg/kg Pb, and 6.0 mg/kg Zn [32]. Values of 1.2 mg/kg Cu and 1.6 mg/kg Pb were reported in [84] for sodium chloride (Cd and Zn not detected). For another sodium chloride de-icing salt, metal contents of 0.94 mg/kg Cd, 1.02 mg/kg Cr, 3.15 mg/kg Cu, 6.29 mg/kg Ni, 6.29 mg/kg Pb, and 1.57 mg/kg Zn were reported by Kobriger and Geinopolos [85]. Variations of the metal contents for highway de-icing salts were also published by Gupta et al. [86]: 0.003–0.01 mg/kg for Cr, 0–0.0004 mg/kg for Cu, 0.002–0.003 mg/kg for Ni, and 0.08–0.09 mg/kg for Pb. A comparison of the metal contents in de-icing salts with the ones measured in cooking salts [87] confirms that these small impurities can occur in all salts used in large quantities. Nevertheless, the total emission loads can be high because of the large amounts of salts used in Germany per year.
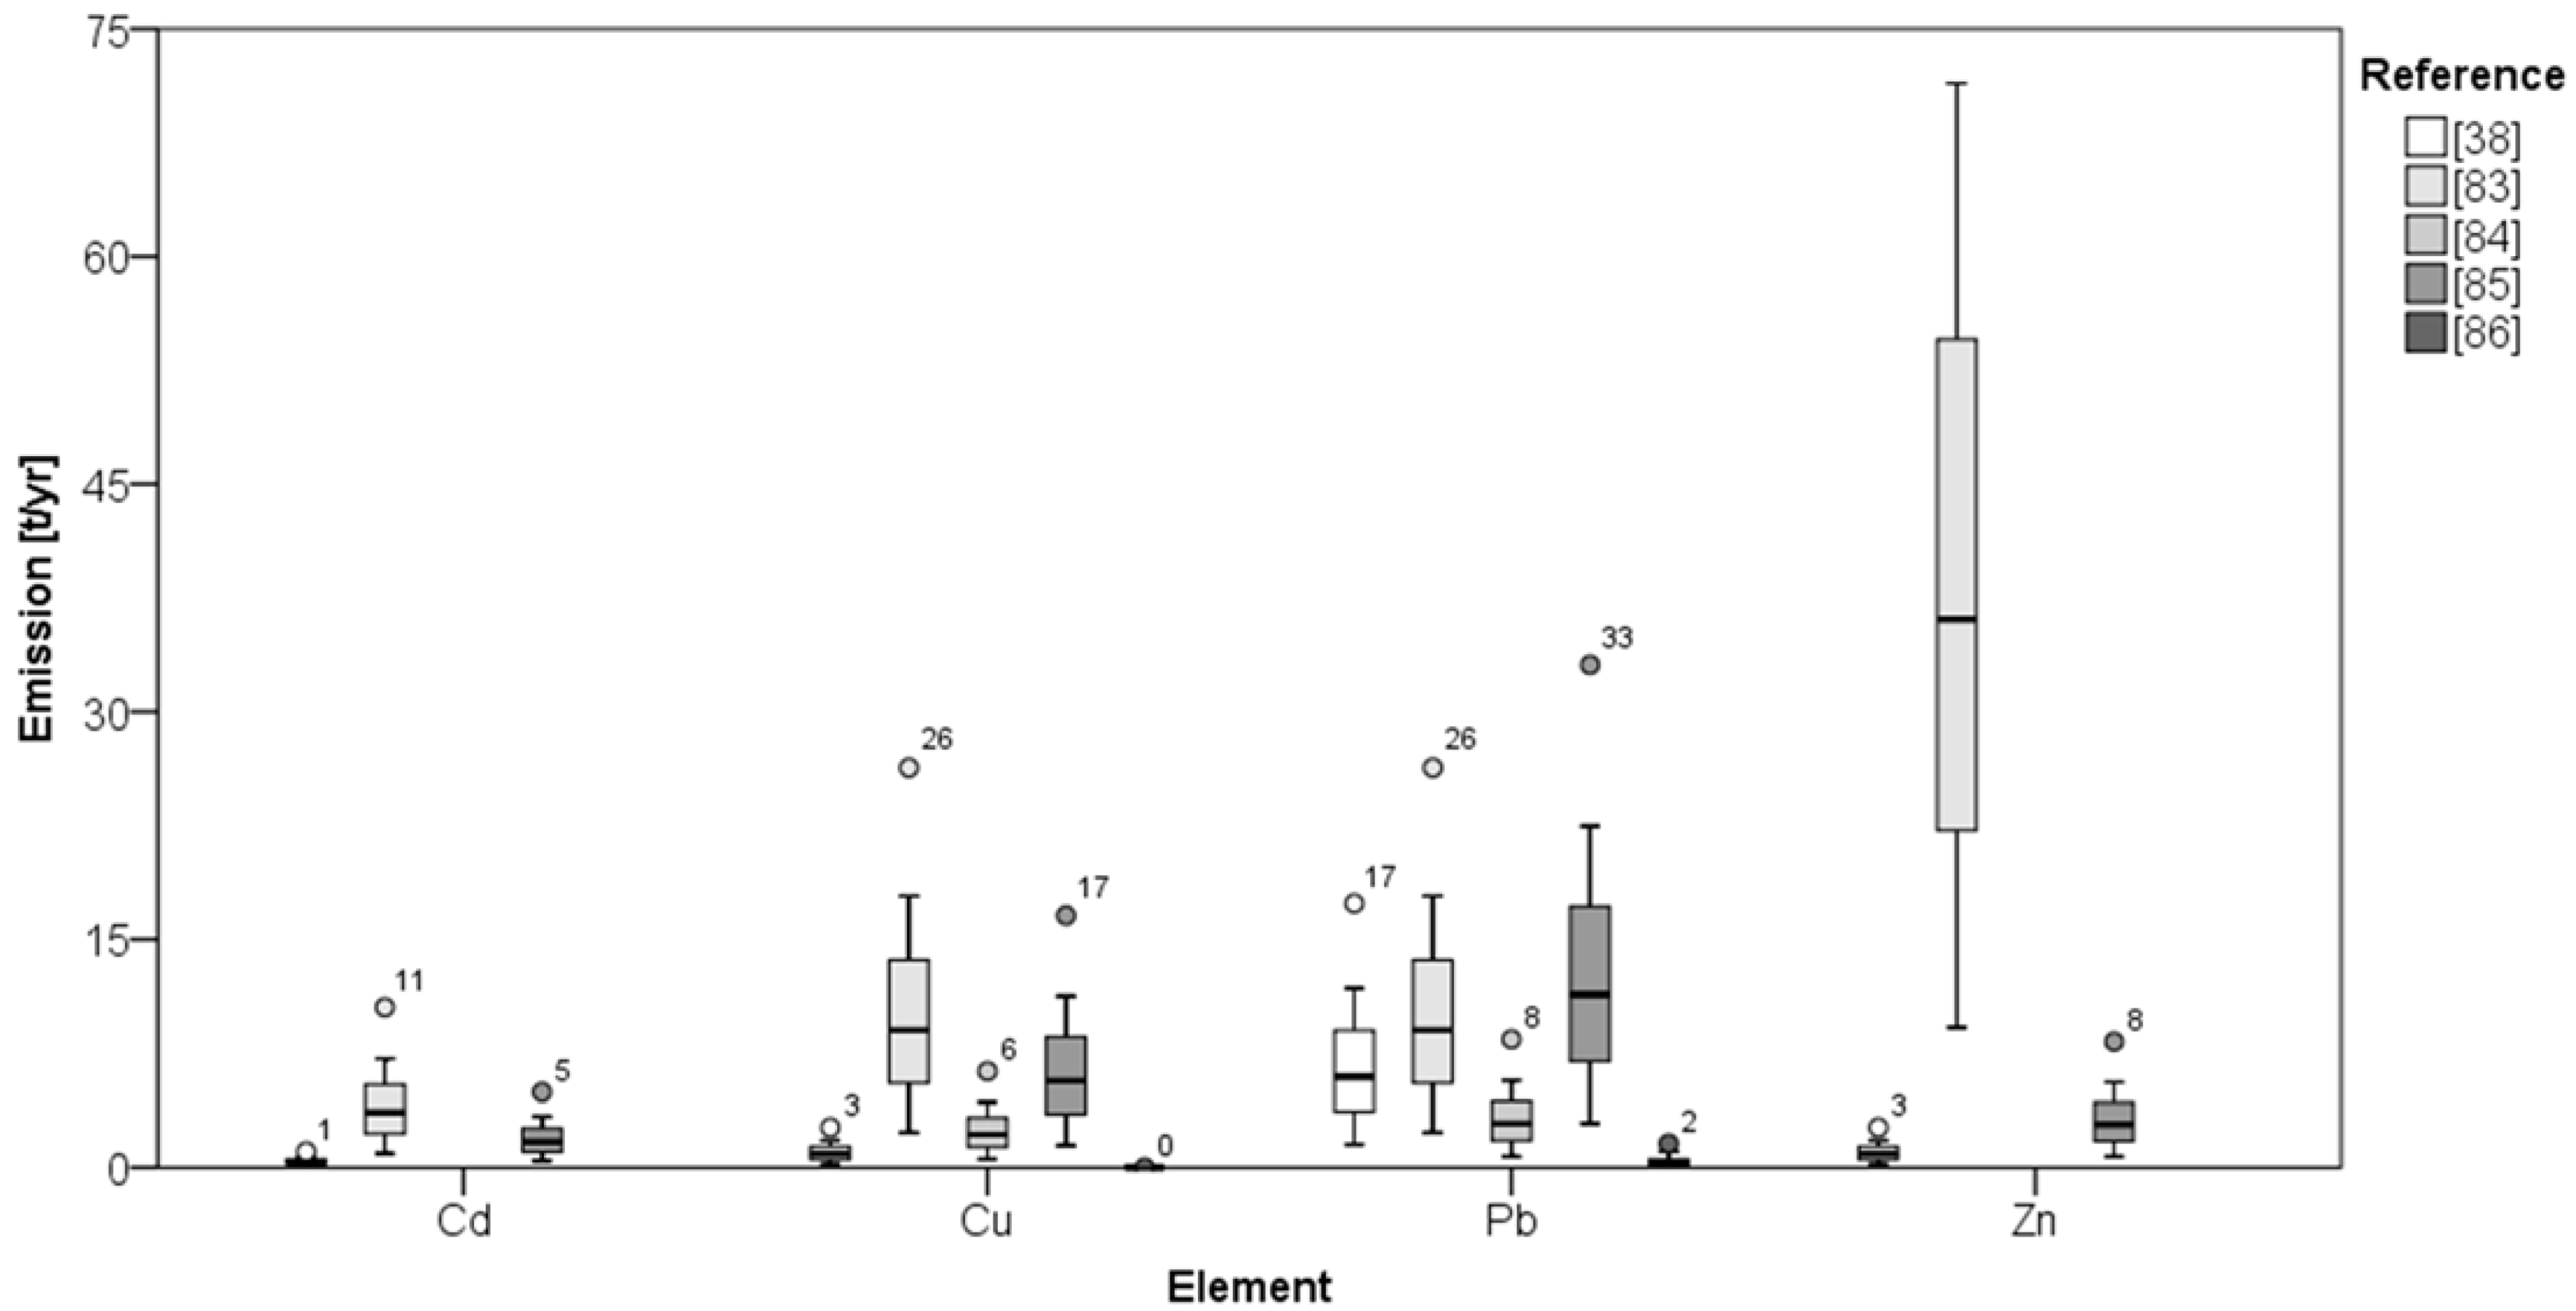
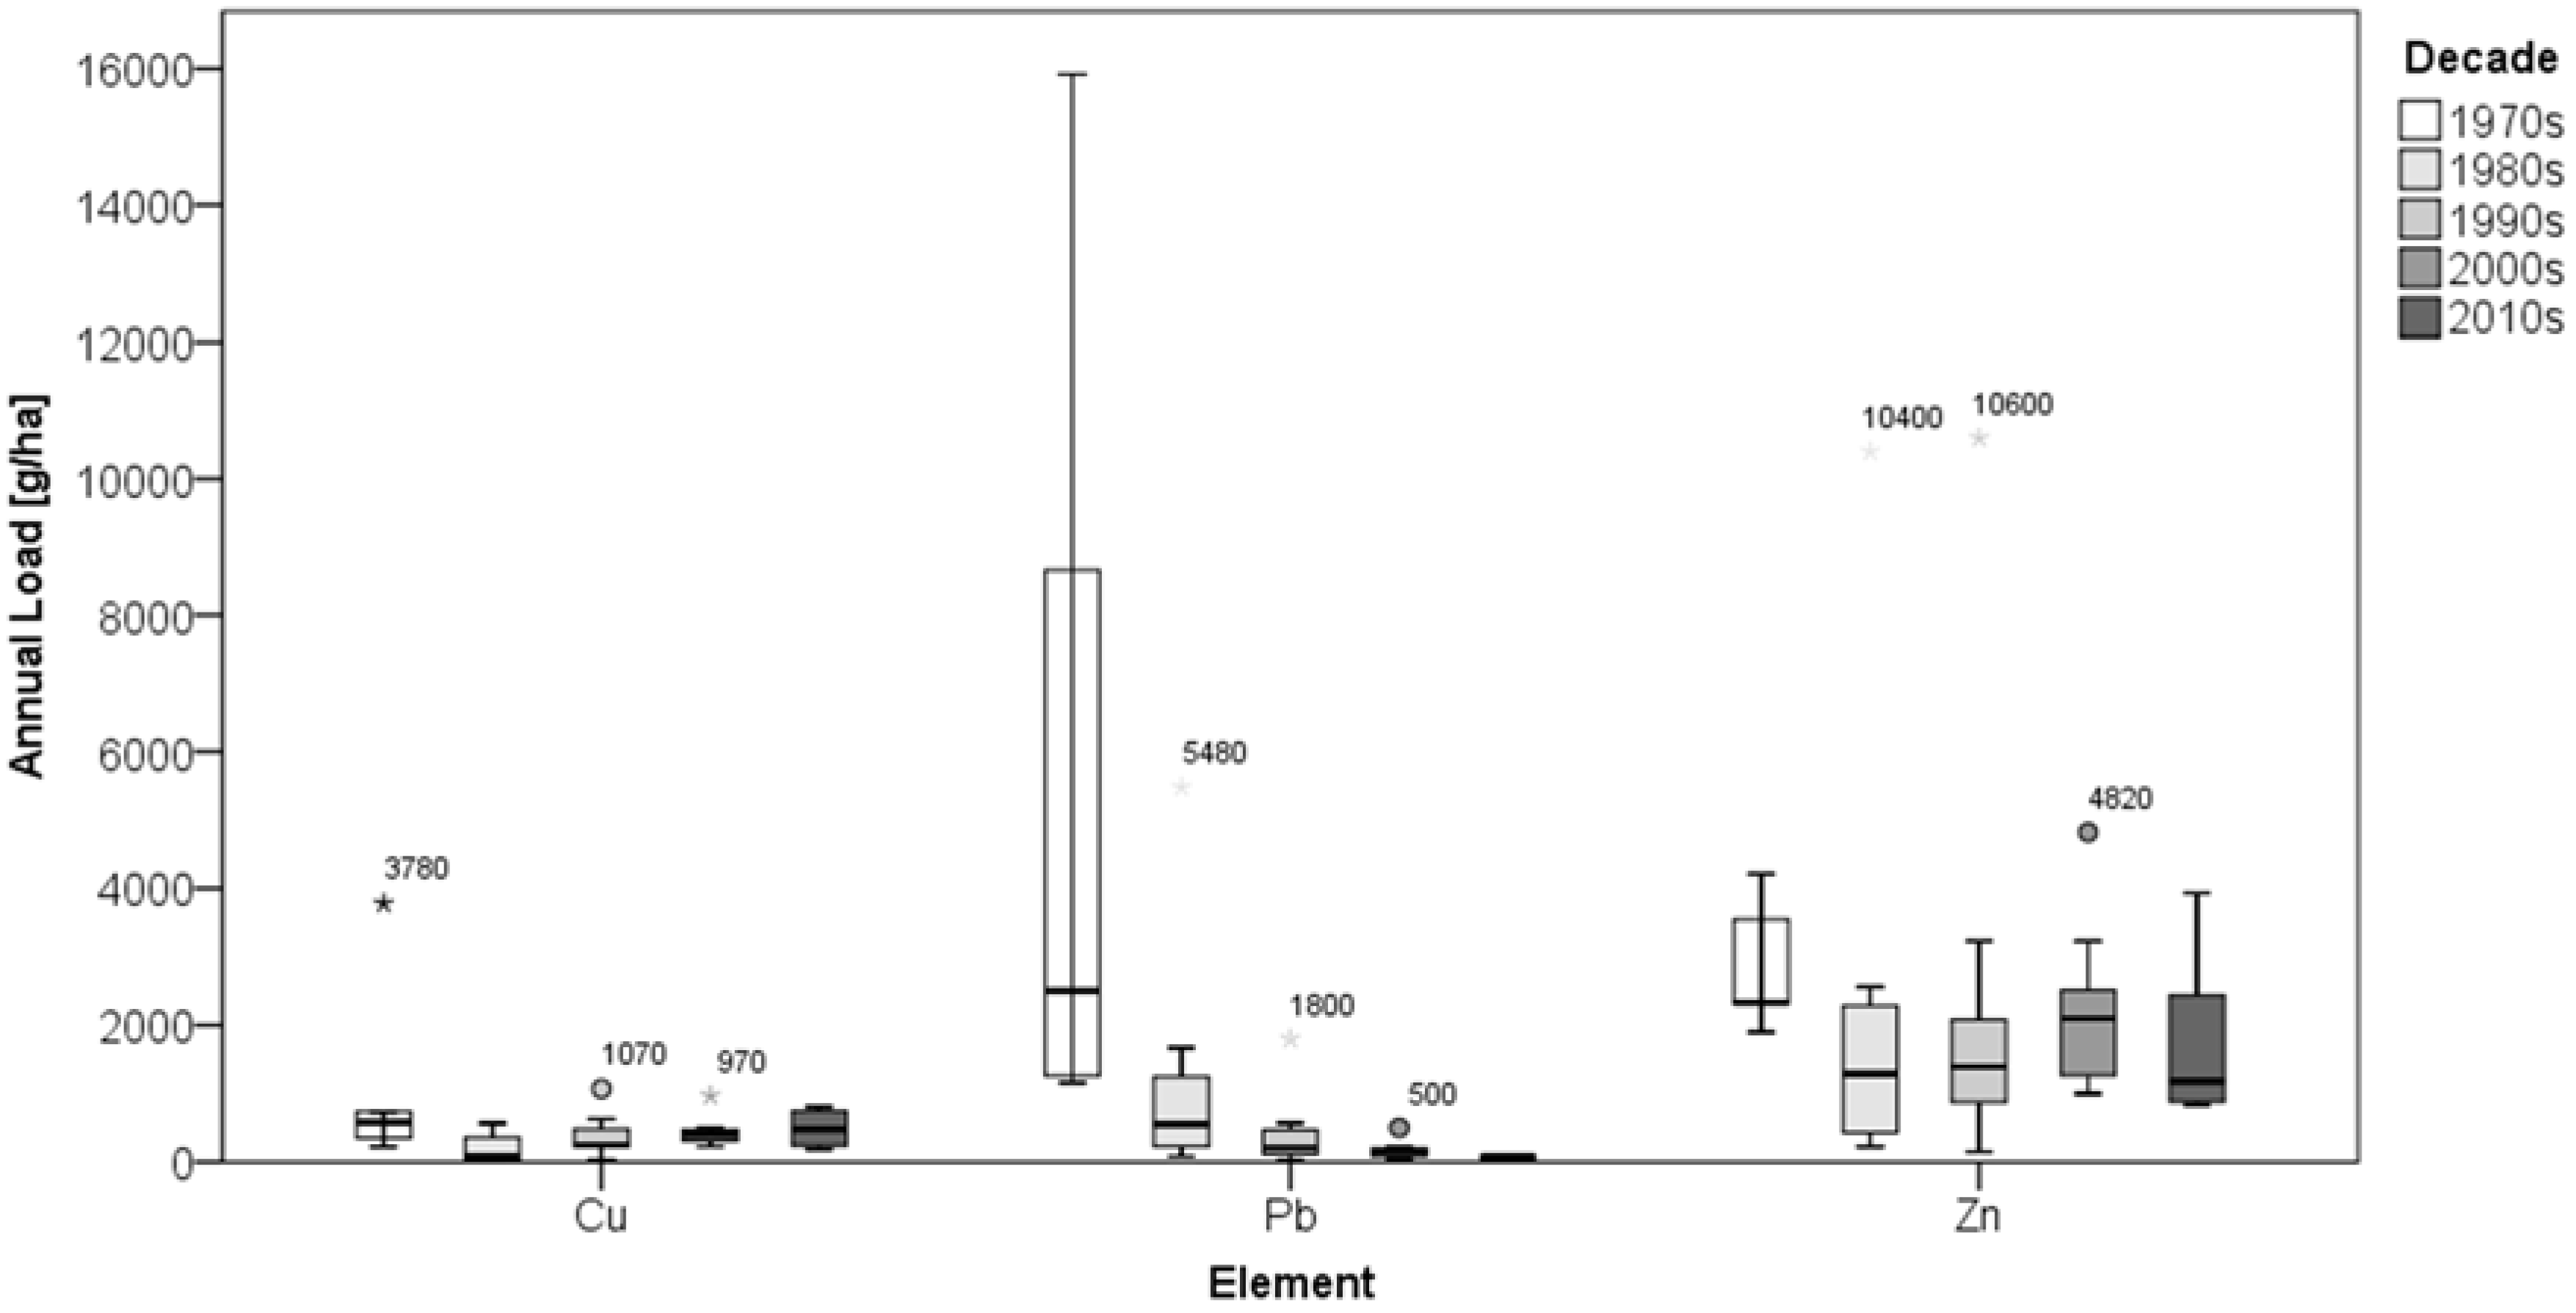
The total emissions are influenced by the highly variable annual consumption in Germany (0.46–5.26 million tons per year for the years 1990–2013). The metal contents of Cd, Cu, Pb, and Zn published in five references were multiplied by the annual consumption values in Germany for the years 1990–2013 (Table 8 and Figure 3). Each box and whisker represents the annual variation of the heavy metal emissions by de-icing salts for one element and the metal content of the corresponding reference. Thus, the mean de-icing salt emissions presented in Table 7 can only be a very rough estimation. In contrast to the other traffic related emission sources, the variability of these emissions mainly depends on climatic factors.
For the year 2013 (year 2000 in brackets), the German Federal Environment Agency published national total annual emissions for road transportation as 0.78 (0.82) t Cd, 25.7 (25.1) t Cr, 2109 (1986) t Cu, 5.0 (4.7) t Ni, 88.7 (80.8) t Pb, and 1906 (1805) t Zn [88]. There is a slight increase of the emissions for five of the six heavy metals in the 21st century. In 2013, the percentages of the traffic related emissions based on the total emissions are 11% for Cd, 45% for Cr, 98% for Cu, 5% for Ni, 42% for Pb, and 95% for Zn. Considering these data, road transportation is an important source of total heavy metal emissions in Germany. With the exception of the data for Cu, these values are comparable with the ones presented in Table 7. Denier van der Gon et al. [89] presented annual road transportation emissions for Germany for the year 2000 of 0.88 t Cd, 4.0 t Cr, 102.9 t Cu, 5.0 t Ni, 0.40 t Pb, and 209.8 t Zn. Most of these emission values are lower than the ones proposed by Hillenbrand et al. [81], calculated in this study, and published by Umweltbundesamt [88]. These differences are quite high and this is not only related to the variability of the data but also to the fact that each study considers different traffic related sources, which can also vary because of substitutions.

3.4.3. Transportation of Traffic Related Heavy Metals

A sustainable stormwater management combines the stormwater source control and the treatment of traffic area runoff loads to reduce the impact of heavy metals on receiving waters. Therefore, the influence of the traffic related heavy metal emissions on the runoff loads because of leaded gasoline, tire wear, brake lining wear, roadway abrasion, weights for tire balance, guardrails, lampposts/signs, and de-icing salts must also be considered to identify cost efficient mitigation strategies. This process was successfully implemented by the phase-out of Pb in recent decades (cf. Section 3.2.2). Nevertheless, not all traffic related emissions are found in the runoff because of wind turbulences, vehicles (traffic volume and vehicle speed), antecedent dry periods, and other site-specific factors (e.g., particle size distribution, land use, road surface roughness, or elevated configuration of the traffic area; [69]). For example, Hallberg et al. [90] found out that splashing corresponds with the average vehicle speed during storms. In Great Britain, Harrison et al. [91] measured that 90% of Pb emissions from fast-moving vehicles are deposited away from the immediate vicinity of a non-urban highway (up to several hundred meters). Consequently, most of the emitted Pb was not measured in the runoff. In contrast to Pb, Harrison and Johnston [92] showed that the Cd and Cu deposition fluxes were elevated close to the investigated highway section and decreased to background levels within 20–40 m. Langbein et al. [14] and Steiner et al. [93] measured the different fluxes of Cd, Cr, Cu, Pb, and Zn emissions at a non-urban road with approximately 17,000 vehicles per day in Switzerland (average vehicle speed between 60 km/h and 80 km/h). They evaluated that 17%–25% of the heavy metals were found in the runoff, 21%–38% in the splash water, 19%–45% were blown away and deposited in a distance of up to 25 m away from the road, and 17%–37% were deposited far away (>25 m). Thus, only some heavy metals were found in the runoff of a non-urban road and the fluxes of the emitted heavy metals varied between each element. Legret and Pagotto [38] calculated emission fluxes and estimated the percentages of Cd, Cu, Pb, and Zn that were removed by runoff waters. The following were considered as emission sources: tire and brake wear, gasoline, safety fences, de-icing salts, and atmospheric deposition (wet and dry). At the investigated rural highway bridge, 313% of the emitted Cd, 2% of Cu, 5% of Pb, and 37% of Zn were found in the runoff water and the rest was dispersed into the atmosphere as dust. For Cd, the authors assumed that some sources might be unrealized or underestimated. Hewitt and Rashed [94] also measured that the largest part of Pb (approximately 86%) was dispersed in the atmosphere. Most of these mass fluxes are proposed for non-urban sites and bridges. In contrast, a higher percentage of the traffic related emissions (e.g., 50%) might be found in urban runoff from traffic areas [14]. Thus, the heavy metal emissions in the urban areas influence the runoff concentrations and loads more directly [11]. Moreover, all traffic related emissions that were not found in the runoff (i.e., approximately 50%–98% according to the above data) would be deposited on non-traffic areas and consequently have an effect on the environment.
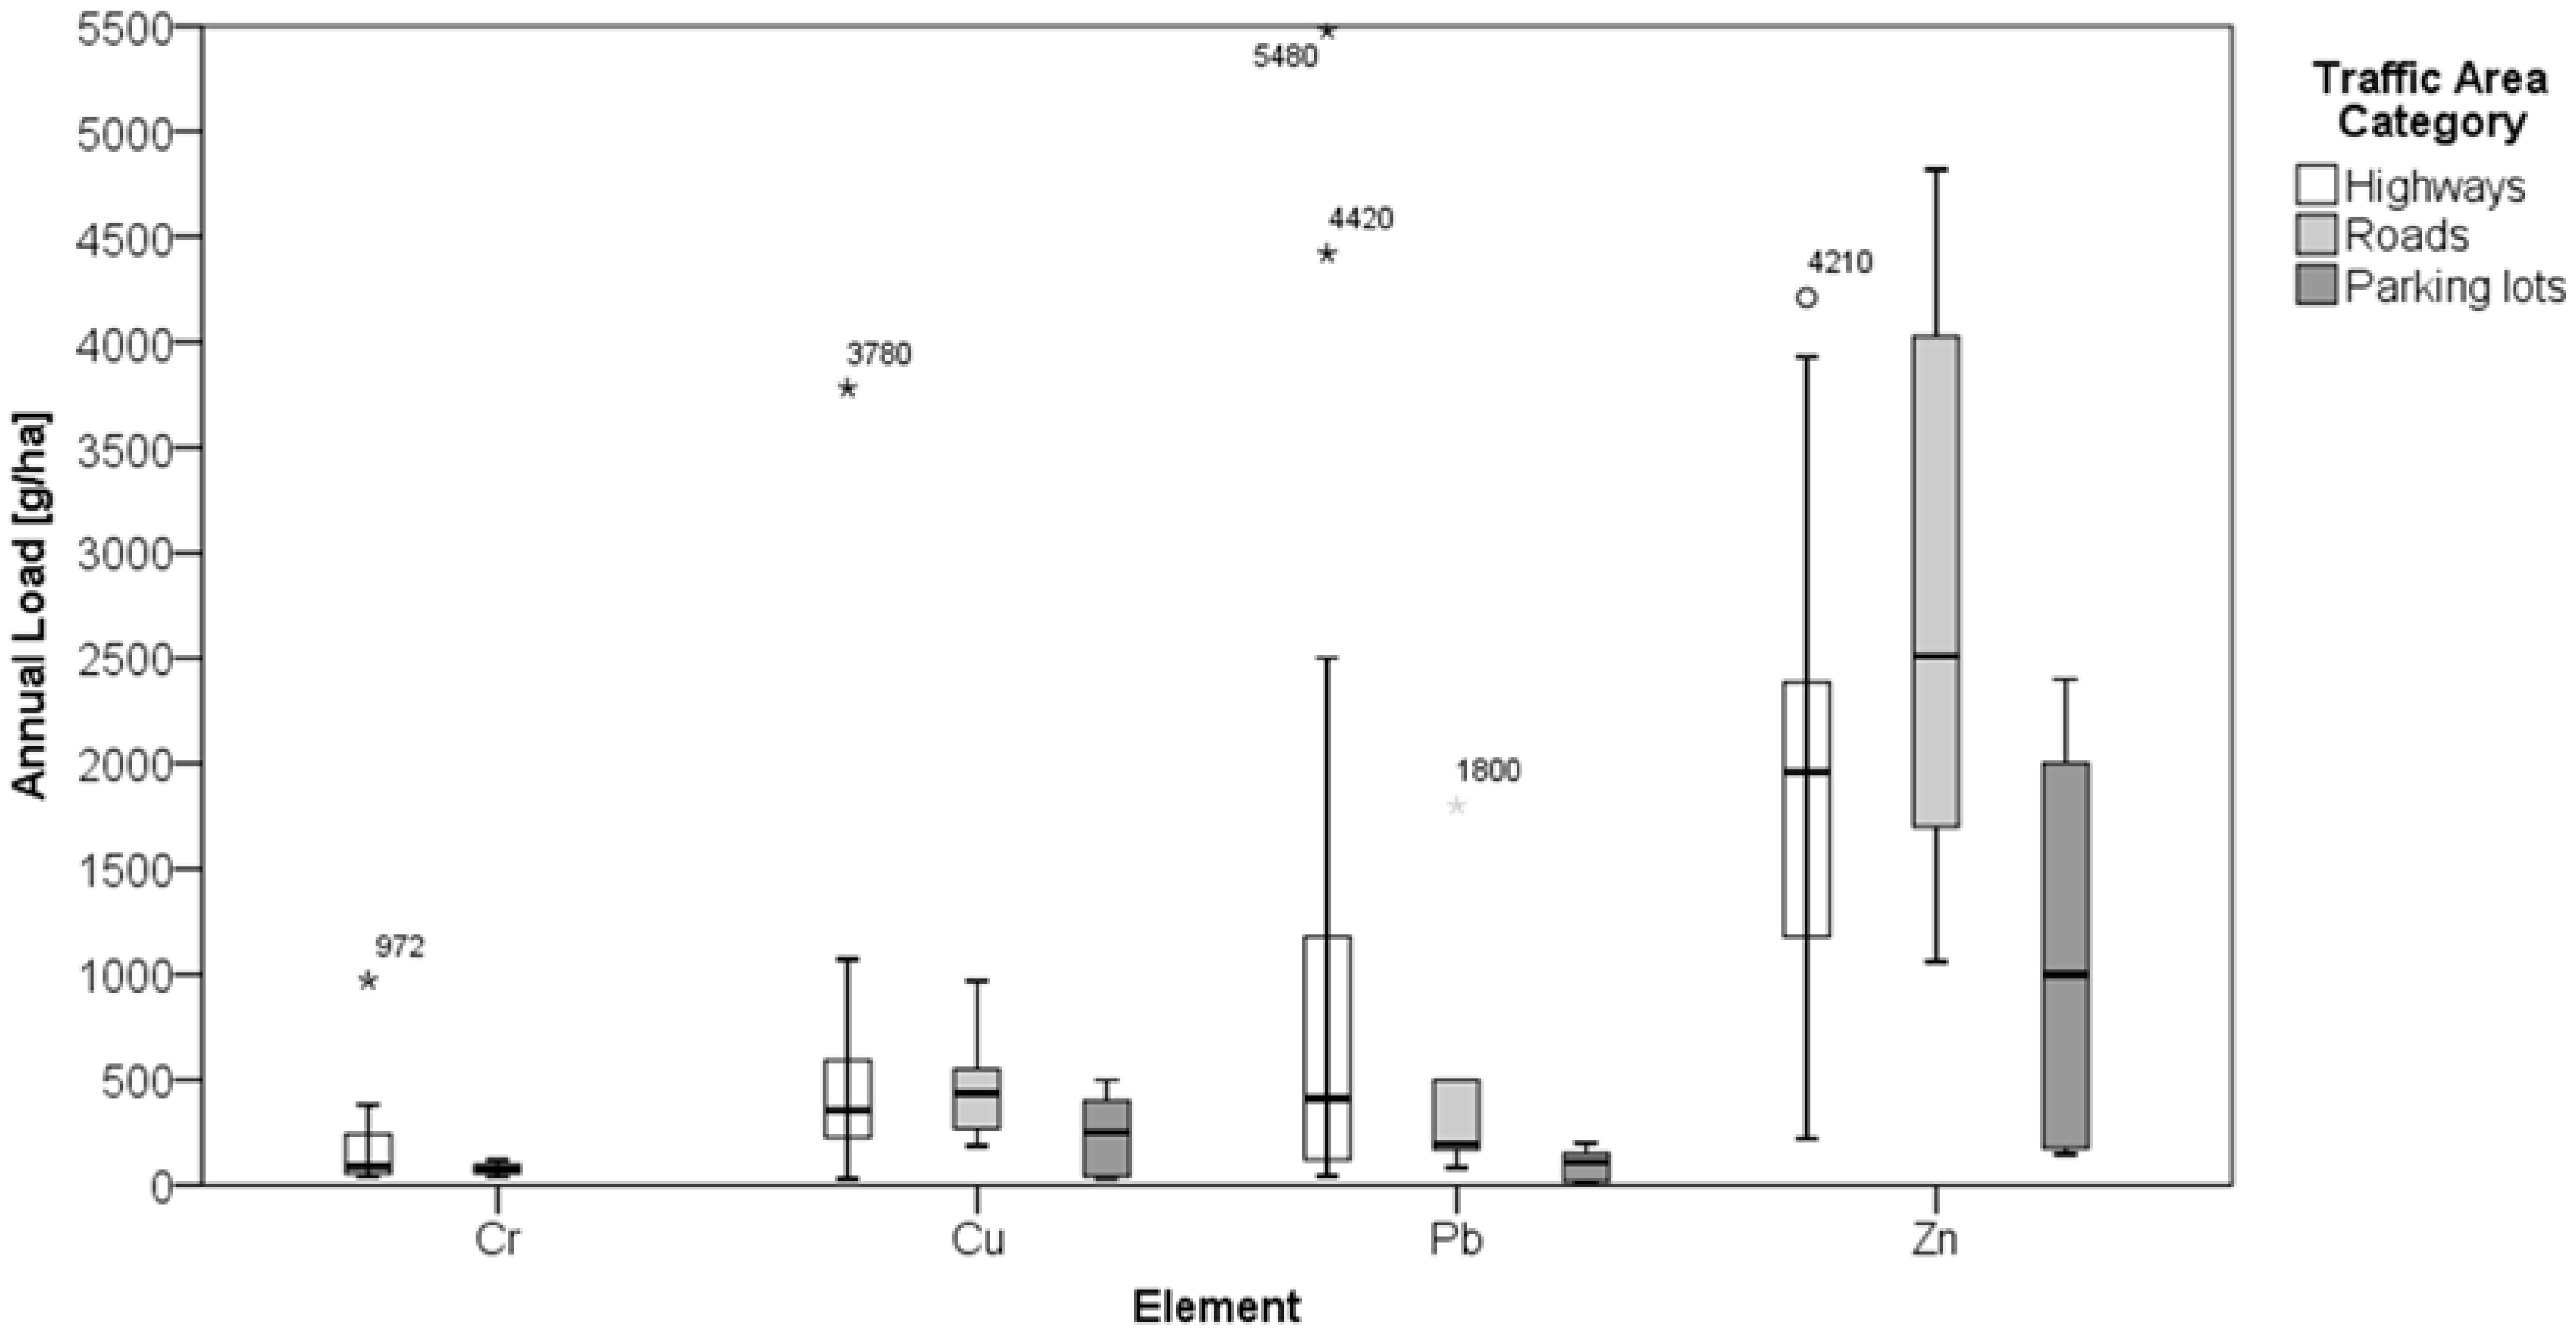
The influence of traffic related emissions on the runoff loads can be determined for de-icing salt applications on highways. Granato [95] calculated mean annual runoff loads as 4100 g/ha Cl, 1.8 g/ha Cr, 6.6 g/ha Cu, 2.0 g/ha Ni, and 3.6 g/ha Pb for the application of sodium chloride on highway runoff. Compared with the median runoff loads for highways calculated in this review (76 g/ha Cr, 355 g/ha Cu, 90 g/ha Ni, and 72 g/ha Pb), the de-icing salt emissions contribute to about 2.4%, 1.9%, 2.2%, and 5.0% of the total annual runoff loads for Cr, Cu, Ni, and Pb, respectively. Higher ratios were calculated for H01 with 38% for Cr, 56% for Ni, 2.2% for Pb, and 1.5% for Zn [32]. Thus, the use of de-icing salts with lower metal impurities can directly reduce the runoff loads by some percentages although de-icing salts are only used for several months per year.
In summary, the identification and subsequent reduction or substitution of relevant traffic related heavy metal sources (cf. Section 3.4.2) can help to fulfill the requirements of a sustainable stormwater management. Since the runoff loads are also influenced by special site-specific factors (e.g., nearby industries like Zn smelters) and non-traffic related emissions, a runoff treatment of distinct traffic area categories (e.g., highways, roads, and frequently used parking lots) is also necessary. This can be done by permeable pavements, grass swales, and technical stormwater treatment systems [96,97].

4. Conclusions

For stormwater management, an improved knowledge about the runoff loads of different traffic area categories is necessary. These loads were summarized for highways, roads, and parking lots. The highest loads were determined for highways, roads, and frequently used parking lots (in particular by trucks). In contrast to highways and roads, parking lots must be considered individually because of site-specific factors. The traffic related emissions in Germany were estimated for seven different sources (tire wear, brake lining wear, roadway abrasion, weights for tire balance, guardrails, lampposts/signs, and de-icing salts). Zn is mostly emitted by galvanized elements and tires, Cu and Pb by brakes, and Cd by de-icing salts. The calculated loads are comparable with the ones presented in other studies for most metals. However, a statistical analysis of traffic related metal mass fluxes (e.g., the contribution of metal emissions on the runoff loads, in particular for different traffic area categories and land uses) is not currently possible because of a lack of monitoring data (e.g., metal contents of different sources, emission factors, deposition rates for different traffic area categories and land use characteristics, and size characterizations of distinct catchment areas for different traffic area categories).
Nevertheless, the estimation of the runoff loads and the emission loads for Germany stated that the vehicles, the road design, and the winter services emit heavy metals in large quantities (0.93 t/yr Cd, 935 t/yr Cu, 84.4 t/yr Pb, and 2094 t/yr Zn) and the runoff also contains high amounts of metal loads per year. Currently, the most relevant metals are Cu and Zn because the annual Pb loads have decreased significantly in the last few decades and traffic related Cd and Ni contribute only 5% and 11% of the total emissions in Germany, respectively. However, the loads of the other metals can also be detrimental for receiving waters and aquatic biota. In particular, for the highly toxic metals Cd and Sb. Thus, efforts should be intensified to reduce traffic related loads (both emissions and runoff) and subsequently to minimize their input into receiving waters and soils.
For the future, more long-term data, which include a large variety of substances and a detailed description of climatic factors, must be measured and published to improve the determination of metal loads, mass balances, and fluxes and to reduce the large uncertainties of several values used in this review for the calculations.

Acknowledgments

Special thanks to Alicia Dery and Antje Welker for their contributions, support, and valuable comments. This work was supported by the German Research Foundation (DFG) and the Technical University of Munich (TUM) in the framework of the Open Access Publishing Program.

Author Contributions

Maximilian Huber collected the data, evaluated all documents, and wrote the paper. Brigitte Helmreich contributed to the results and discussions.

Conflicts of Interest

The authors declare no conflict of interest.

References

  1. Dauber, L.; Novak, B.; Zobrist, J.; Zürcher, F. Schmutzstoffe im Regenwasserkanal einer Autobahn. Stuttgarter Berichte zur Siedlungswasserwirtschaft. In Beeinflussung der Gewässergüte durch Regenabflüsse von Straßen; Oldenbourg Verlag: München, Germany, 1979; Volume 64, pp. 41–57. (In German) [Google Scholar]
  2. Huber, M.; Welker, A.; Helmreich, B. Critical review of heavy metal pollution of traffic area runoff: Occurrence, influencing factors, and partitioning. Sci. Total Environ. 2016, 541, 895–919. [Google Scholar] [CrossRef] [PubMed]
  3. Opher, T.; Friedler, E. Factors affecting highway runoff quality. Urban Water J. 2010, 7, 155–172. [Google Scholar] [CrossRef]
  4. Schueler, T. Stormwater pollution source areas isolated in Marquette, Michigan. Watershed Prot. Tech. 2000, 3, 609–612. [Google Scholar]
  5. Bannerman, R.T.; Owens, D.W.; Dodds, R.B.; Hornewer, N.J. Sources of pollutants in Wisconsin stormwater. Water Sci. Technol. 1993, 28, 241–259. [Google Scholar]
  6. Ball, J.E. Stormwater Quality at Centennial Park, Sydney, Australia; University of New South Wales, School of Civil and Environmental Engineering, Water Research Laboratory: Sydney, New South Wales, Australia, 2002; pp. 1–62. [Google Scholar]
  7. Driscoll, E.; Shelley, P.E.; Strecker, E.W. Pollutant Loadings and impacts from Highway Stormwater Runoff, Volume IV: Design Procedure; Report no. FHWA-RD-88-009; US Department of Transportation: Washington, DC, USA, 1990; pp. 1–143. [Google Scholar]
  8. Burton, G.A.; Pitt, R.E. Stormwater Effects Handbook: A Toolbox for Watershed Managers, Scientists, and Engineers; CRC Press: Boca Raton, FL, USA, 2001. [Google Scholar]
  9. SN640347. Strassenentwässerung. Belastung von Strassenabwasser (gültig ab 1. Februar 2009); Schweizerischer Verband der Strassen- und Verkehrsfachleute, Schweizerische Normen-Vereinigung SNV: Zürich, Switzerland, 2009; pp. 1–20. (In German) [Google Scholar]
  10. Hamilton, R.S.; Revitt, D.M.; Warren, R.S.; Duggan, M.J. Metal mass balance studies within a small highway dominated catchment. Sci. Total Environ. 1987, 59, 365–368. [Google Scholar] [CrossRef]
  11. Barrett, M.; Zuber, R.D.; Collins, E.R.; Malina, J.F.; Charbeneau, R.; Ward, G.H. A Review and Evaluation of Literature Pertaining to the Quantity and Control of Pollution from Highway Runoff and Construction; CRWR Online Report 95-5; University of Texas at Austin: Austin, TX, USA, 1995; pp. 1–180. [Google Scholar]
  12. Racin, J.A.; Howell, R.B.; Winters, G.R.; Shirley, E.C. Estimating Highway Runoff Quality; Report No. FHWA-CA/TL-82/11; California Department of Transportation: Sacramento, CA, USA, 1982; pp. 1–97. [Google Scholar]
  13. Muschack, W. Pollution of street run-off by traffic and local conditions. Sci. Total Environ. 1990, 93, 419–431. [Google Scholar] [CrossRef]
  14. Langbein, S.; Steiner, M.; Boller, M. Schadstoffe im Straßenabwasser einer stark befahrenen Straße und deren Retention mit neuartigen Filterpaketen aus Geotextil und Adsorbermaterial, Schlussbericht des Forschungsprojekts; Eawag: Dübendorf, Switzerland, 2006; pp. 1–77. (In German) [Google Scholar]
  15. Gan, H.; Zhuo, M.; Li, D.; Zhou, Y. Quality characterization and impact assessment of highway runoff in urban and rural area of Guangzhou, China. Environ. Monit. Assess. 2008, 140, 147–159. [Google Scholar] [CrossRef] [PubMed]
  16. Wiseman, C.L.S.; Zereini, F. Airborne particulate matter, platinum group elements and human health: A review of recent evidence. Sci. Total Environ. 2009, 407, 2493–2500. [Google Scholar] [CrossRef] [PubMed]
  17. Dai, H.L.; Zhang, K.L.; Xu, X.L.; Yu, H.Y. Evaluation on the effects of deicing chemicals on soil and water environment. Procedia Environ. Sci. 2012, 13, 2122–2130. [Google Scholar] [CrossRef]
  18. Eriksson, E.; Baun, A.; Scholes, L.; Ledin, A.; Ahlman, S.; Revitt, M.; Noutsopoulos, C.; Mikkelsen, P.S. Selected stormwater priority pollutants—A European perspective. Sci. Total Environ. 2007, 383, 41–51. [Google Scholar] [CrossRef] [PubMed]
  19. Folkeson, L.; Bækken, T.; Brenčič, M.; Dawson, A.; Frančois, D.; Kuřímská, P.; Leitão, T.; Ličbinský, R.; Vojtěšek, M. Sources and fate of water contaminants in roads. In Water in Road Structures—Movement, Drainage and Effects, 1st ed.; Dawson, A., Ed.; Springer Science+Business Media B.V.: Dordrecht, The Netherlands, 2009; pp. 107–146. [Google Scholar]
  20. Roeva, N.N.; Rovinskii, F.Y.; Kononov, E.Y. Special features of the behavior of heavy metals in various natural environments. J. Anal. Chem. 1996, 51, 352–364. [Google Scholar]
  21. Kayhanian, M.; Stransky, C.; Bay, S.; Lau, S.L.; Stenstrom, M.K. Toxicity of urban highway runoff with respect to storm duration. Sci. Total Environ. 2008, 389, 386–406. [Google Scholar] [CrossRef] [PubMed]
  22. Barbosa, A.E.; Hvitved-Jacobsen, T. Highway runoff and potential for removal of heavy metals in an infiltration pond in Portugal. Sci. Total Environ. 1999, 235, 151–159. [Google Scholar] [CrossRef]
  23. Spromberg, J.A.; Baldwin, D.H.; Damm, S.E.; McIntyre, J.K.; Huff, M.; Sloan, C.A.; Anulacion, B.F.; Davis, J.W.; Scholz, N.L. Coho salmon spawner mortality in western us urban watersheds: Bioinfiltration prevents lethal storm water impacts. J. Appl. Ecol. 2016, 53, 398–407. [Google Scholar] [CrossRef]
  24. McIntyre, J.K.; Davis, J.W.; Hinman, C.; Macneale, K.H.; Anulacion, B.F.; Scholz, N.L.; Stark, J.D. Soil bioretention protects juvenile salmon and their prey from the toxic impacts of urban stormwater runoff. Chemosphere 2015, 132, 213–219. [Google Scholar] [CrossRef] [PubMed]
  25. Scholz, M. Sustainable drainage systems. Water 2015, 7, 2272–2274. [Google Scholar] [CrossRef]
  26. Klein, H. Die Beschaffenheit der Niederschlagsabflüsse von Autobahnen. Wasserwirtschaft 1982, 72, 37–43. (In German) [Google Scholar]
  27. Stotz, G. Investigations of the properties of the surface water run-off from federal highways in the FRG. Sci. Total Environ. 1987, 59, 329–337. [Google Scholar] [CrossRef]
  28. Wu, J.; Allan, C.; Saunders, W.; Evett, J. Characterization and pollutant loading estimation for highway runoff. J. Environ. Eng. 1998, 124, 584–592. [Google Scholar] [CrossRef]
  29. Rushton, B.T. Low-impact parking lot design reduces runoff and pollutant loads. J. Water Resour. Plan. Manag. 2001, 127, 172–179. [Google Scholar] [CrossRef]
  30. Barrett, M.E.; Malina, J.F.; Charbeneau, R.J.; Ward, G.H. Characterization of highway runoff in Austin, Texas, area. J. Environ. Eng. 1998, 124, 131–137. [Google Scholar] [CrossRef]
  31. Mosley, L.M.; Peake, B.M. Partitioning of metals (Fe, Pb, Cu, Zn) in urban run-off from the Kaikorai Valley, Dunedin, New Zealand. N. Z. J. Mar. Freshw. Res. 2001, 35, 615–624. [Google Scholar] [CrossRef]
  32. Hedley, G.; Lockley, J.C. Quality of water discharged from an urban motorway. Water Pollut. Control 1975, 74, 659–674. [Google Scholar]
  33. Cathelain, M.; Friant, G.; Olie, J.L. Les eaux de ruissellement de chaussees autoroutieres: Evaluation des charges de pollution. Paris Bull. Liaison Lab. Ponts Chaussees 1981, 116, 9–24. (In French) [Google Scholar]
  34. Chui, T.W.D.; Mar, B.W.; Horner, R.R. Highway Runoff in Washington State: Model Validation and Statistical Analysis; Report No. WA-RD-39.12; Washington State Department of Transportation: Olympia, WA, USA, 1982. [Google Scholar]
  35. Balades, J.D.; Cathelain, M.; Marchandise, P.; Peybernard, J.; Pilloy, J.C. Chronic pollution of intercity motorway runoff waters. Water Sci. Technol. 1984, 17, 1165–1174. [Google Scholar]
  36. Montrejaud-Vignoles, M.; Roger, S.; Herremans, L. Runoff water pollution of motorway pavement in Mediterranean area. In Proceedings of the 7th International Conference on Urban Storm Drainage, Hannover, Germany, 9–13 September 1996; pp. 247–252.
  37. CH2MHILL. Highway Stormwater Runoff Study; The Michigan Department of Transportation: Lansing, MI, USA, 1998; pp. 1–48. [Google Scholar]
  38. Legret, M.; Pagotto, C. Evaluation of pollutant loadings in the runoff waters from a major rural highway. Sci. Total Environ. 1999, 235, 143–150. [Google Scholar] [CrossRef]
  39. Lange, G.; Grotehusmann, D.; Kasting, U.; Schütte, M.; Dietrich, M.; Sondermann, W. Wirksamkeit von Entwässerungsbecken im Bereich von Bundesfernstraßen. Forschungsberichte aus dem Forschungsprogramm des Bundesministers für Verkehr, Bau- und Wohnungswesen und der Forschungsgesellschaft für Straßen- und Verkehrswesen e.V; Bundesministerium für Verkehr, Bau- und Wohnungswesen, Abteilung Straßenbau, Straßenverkehr: Bonn, Germany, 2003; Volume 861. (In German) [Google Scholar]
  40. Suter, J. Schwermetallbilanz eines Autobahnabschnittes und die Behandlung des Strassenabwassers. Diploma Thesis, ETHZ/Eawag, Zürich/Dübendorf, Switzerland, 2000. [Google Scholar]
  41. Scheiwiller, E. Schadstoffabschwemmungen: Am Beispiel von Hochleistungsstraßen. GWA 2008, 88, 539–546. (In German) [Google Scholar]
  42. Grotehusmann, D.; Lambert, B.; Fuchs, S.; Graf, J. Schlussbericht zum BASt Forschungsvorhaben FE-Nr. 05.152/2008/GRB “Konzentrationen und Frachten organischer Schadstoffe im Straßenabfluss”; Ingenieurgesellschaft für Stadthydrologie mbH, Hannover: Bundesanstalt für Straßenwesen, Bergisch Gladbach, Germany, 2014; pp. 1–89. (In German) [Google Scholar]
  43. Scheiwiller, E.; (Amt für Wasser und Abfall des Kantons Bern, Bern, Switzerland). Personal communication, 2014.
  44. Gäth, S.; Sternheim, M.; Frede, H.-G. Einfluss des Kraftfahrzeugverkehrs auf den Schwermetallgehalt von Straßenabflußwasser. Forum Städte—Hyg. 1990, 41, 235–238. (In German) [Google Scholar]
  45. Nadler, A.; Meißner, E. Versickerung des Niederschlagswassers von befestigten Verkehrsflächen, Abschlussbericht, Entwicklungsvorhaben, Oktober 1996—Oktober 2005; Bayerisches Landesamt für Umwelt: Augsburg, Germany, 2007; pp. 1–72. (In German) [Google Scholar]
  46. Prestes, E.C.; dos Anjos, V.E.; Sodré, F.F.; Grassi, M.T. Copper, lead and cadmium loads and behavior in urban stormwater runoff in Curitiba, Brazil. J. Braz. Chem. Soc. 2006, 17, 53–60. [Google Scholar] [CrossRef]
  47. Hilliges, R.; Schriewer, A.; Helmreich, B. A three-stage treatment system for highly polluted urban road runoff. J. Environ. Manag. 2013, 128, 306–312. [Google Scholar] [CrossRef] [PubMed]
  48. Wichern, M.; Vesting, A.; Pecher, K.H.; Giga, A.; Wolke, M.; Helmreich, B.; Huber, M.; Li, Y. Untersuchungs- und Entwicklungsvorhaben im Bereich Abwasser zum Themenschwerpunkt Niederschlagswasserbeseitigung: Vergabe-Nr. 08/058.2. Reduktion von Kohlenwasserstoffen und anderen organischen Spurenstoffen durch ein dezentrales Behandlungssystem für Verkehrsflächenabflüsse, gefördert durch das Ministerium für Klimaschutz, Umwelt, Landwirtschaft, Natur- und Verbraucherschutz des Landes Nordrhein-Westfalen, wissenschaftlich begleitet durch das Landesamt für Natur, Umwelt und Verbraucherschutz Nordrhein-Westfalen (IV-7–042 600 002E). Abschlussbericht Projektphase II; Ruhr-Universität Bochum: Bochum, Germany, 2015; pp. 1–260. (In German) [Google Scholar]
  49. Grotehusmann, D.; Kasting, U. Schlussbericht: Untersuchung über die Beschaffenheit der Oberflächenabflüsse von Parkflächen bei Tank- und Rastanlagen; Ingenieurgesellschaft für Stadthydrologie mbH, Hannover: Bundesanstalt für Straßenwesen: Bergisch Gladbach, Germany, 2002; pp. 1–62. (In German) [Google Scholar]
  50. Ball, J.E.; Jenks, R.; Aubourg, D. An assessment of the availability of pollutant constituents on road surfaces. Sci. Total Environ. 1998, 209, 243–254. [Google Scholar] [CrossRef]
  51. Wilson, D. Highway 520 Bridge Storm Water Runoff Study; King County Water and Land Resources Division, Department of Natural Resources and Parks: Seattle, WA, USA, 2006; pp. 1–66. [Google Scholar]
  52. Lau, S.-L.; Han, Y.; Kang, J.-H.; Kayhanian, M.; Stenstrom, M.K. Characteristics of highway stormwater runoff in Los Angeles: Metals and polycyclic aromatic hydrocarbons. Water Environ. Res. 2009, 81, 308–318. [Google Scholar] [CrossRef] [PubMed]
  53. Kayhanian, M.; Singh, A.; Suverkropp, C.; Borroum, S. Impact of annual average daily traffic on highway runoff pollutant concentrations. J. Environ. Eng. 2003, 129, 975–990. [Google Scholar] [CrossRef]
  54. Horstmeyer, N.; Huber, M.; Drewes, J.E.; Helmreich, B. Evaluation of site-specific factors influencing heavy metal contents in the topsoil of vegetated infiltration swales. Sci. Total Environ. 2016, 560–561, 19–28. [Google Scholar] [CrossRef] [PubMed]
  55. FHWA. Is Highway Runoff a Serious Problem? Office of Infrastructure R&D, Turner-Faribank Highway Research Center: McLean, VA, USA, 1999.
  56. Berbee, R.; Rijs, G.; de Brouwer, R.; Van Velzen, l. Characterization and treatment of runoff from highways in the Netherlands paved with impervious and pervious asphalt. Water Environ. Res. 1999, 71, 183–190. [Google Scholar] [CrossRef]
  57. Hagner, C. European regulations to reduce lead emissions from automobiles—Did they have an economic impact on the German gasoline and automobile markets? Reg. Environ. Chang. 2000, 1, 135–151. [Google Scholar] [CrossRef]
  58. Mangani, G.; Berloni, A.; Bellucci, F.; Tatàno, F.; Maione, M. Evaluation of the pollutant content in road runoff first flush waters. Water Air Soil Pollut. 2005, 160, 213–228. [Google Scholar] [CrossRef]
  59. Sansalone, J.J.; Buchberger, S.G.; Al-Abed, S.R. Fractionation of heavy metals in pavement runoff. Sci. Total Environ. 1996, 189–190, 371–378. [Google Scholar] [CrossRef]
  60. Davis, A.P.; Shokouhian, M.; Ni, S. Loading estimates of lead, copper, cadmium, and zinc in urban runoff from specific sources. Chemosphere 2001, 44, 997–1009. [Google Scholar] [CrossRef]
  61. Root, R.A. Lead loading of urban streets by motor vehicle wheel weights. Environ. Health Perspect. 2000, 108, 937–940. [Google Scholar] [CrossRef] [PubMed]
  62. Bleiwas, D.I. Stocks and Flows of Lead-Based Wheel Weights in the United States, U.S. Geological Survey Open File Report 1111; U.S. Department of the Interior, U.S. Geological Survey: Reston, VA, USA, 2006; pp. 1–6. [Google Scholar]
  63. Shinya, M.; Funasaka, K.; Katahira, K.; Ishikawa, M.; Matsui, S. Lead isotope ratios in urban road runoff. Water Sci. Technol. 2006, 53, 185–191. [Google Scholar] [CrossRef] [PubMed]
  64. McKenzie, E.R.; Money, J.E.; Green, P.G.; Young, T.M. Metals associated with stormwater-relevant brake and tire samples. Sci. Total Environ. 2009, 407, 5855–5860. [Google Scholar] [CrossRef] [PubMed]
  65. Thorpe, A.; Harrison, R.M. Sources and properties of non-exhaust particulate matter from road traffic: A review. Sci. Total Environ. 2008, 400, 270–282. [Google Scholar] [CrossRef] [PubMed]
  66. Helmreich, B.; Hilliges, R.; Schriewer, A.; Horn, H. Runoff pollutants of a highly trafficked urban road—Correlation analysis and seasonal influences. Chemosphere 2010, 80, 991–997. [Google Scholar] [CrossRef] [PubMed]
  67. Stenstrom, M.K.; Kayhanian, M. First Flush Phenomenon Characterization; University of California: Berkeley, CA, USA, 2005; pp. 1–69. [Google Scholar]
  68. Terzakis, S.; Fountoulakis, M.S.; Georgaki, I.; Albantakis, D.; Sabathianakis, I.; Karathanasis, A.D.; Kalogerakis, N.; Manios, T. Constructed wetlands treating highway runoff in the central Mediterranean region. Chemosphere 2008, 72, 141–149. [Google Scholar] [CrossRef] [PubMed]
  69. Liu, A.; Gunawardana, C.; Gunawardena, J.; Egodawatta, P.; Ayoko, G.A.; Goonetilleke, A. Taxonomy of factors which influence heavy metal build-up on urban road surfaces. J. Hazard. Mater. 2016, 310, 20–29. [Google Scholar] [CrossRef] [PubMed]
  70. Driscoll, E.; Shelley, P.E.; Strecker, E.W. Pollutant Loadings and Impacts from Highway Stormwater Runoff, Volume III: Analytical Investigation and Research Report; Report No. FHWA-RD-88-008; U.S. Department of Transportation: Washington, DC, USA, 1990; pp. 1–162. [Google Scholar]
  71. Li, M.; Barrett, M.; Rammohan, P.; Olivera, F.; Landphair, H. Documenting stormwater quality on Texas highways and adjacent vegetated roadsides. J. Environ. Eng. 2008, 134, 48–59. [Google Scholar] [CrossRef]
  72. Dannecker, W.; Au, M.; Stechmann, H. Substance load in rainwater runoff from different streets in Hamburg. Sci. Total Environ. 1990, 93, 385–392. [Google Scholar] [CrossRef]
  73. Zessner, M. Bedeutung und Steuerung von Nährstoff- und Schwermetallflüssen des Abwassers; Wiener Mitteilungen: Wien, Austria, 1999; Volume 157. (In German) [Google Scholar]
  74. Ilyin, I.; Gusev, A.; Rozovskaya, O.; Strijkina, I. Transboundary Pollution of Germany by Heavy Metals and Persistent Organic Pollutants in 2010; EMEP/MSC-E technical Report 5/2012; EMEP/MSC-E: Moscow, Russia, 2012; pp. 1–23. [Google Scholar]
  75. Kocher, B.; Brose, S.; Chlubek, A.; Görg, C.; Klein, N.; Siebertz, I. Stoffeintrag in Straßenrandböden: Messzeitraum 2006/2007; Berichte der Bundesanstalt für Straßenwesen: Bergisch Gladbach, Germany, 2010; Volume 199, pp. 1–38. (In German) [Google Scholar]
  76. Hullmann, H.; Kraft, U. Kupfer und Zink—Die Bedeutung der Abschwemmungen von Metalldächern. gwf Wasser/Abwasser 2003, 144, 127–133. (In German) [Google Scholar]
  77. Pick, V.; Fettig, J.; Miethe, M.; Strüber, K. Dezentrale Behandlung des Niederschlagsabflusses von Verkehrsflächen in einer mehrstufigen Schachtanlage. KA Abwasser Abfall 2002, 49, 312–320. (In German) [Google Scholar]
  78. Lippold, C. Der Elsner 2015: Handbuch für Straßen- und Verkehrswesen (Planung, Bau, Erhaltung, Verkehr, Betrieb), 69 ed.; Otto Elsner Verlagsgesellschaft: Berlin, Germany, 2014. (In German) [Google Scholar]
  79. DESTATIS. Land-und Forstwirtschaft, Fischerei. Bodenfläche nach Art der tatsächlichen Nutzung. Fachserie 3 Reihe 5.1; Statistisches Bundesamt: Wiesbaden, Germany, 2015. (In German) [Google Scholar]
  80. Horwatich, J.A.; Bannerman, R.T. Pollutant Loading to Stormwater Runoff from Highways Impact of a Highway Sweeping Program: Phase II, Madison, Wisconsin; Wisconsin Department of Transportation: Madison, WI, USA, 2009; pp. 1–121. [Google Scholar]
  81. Hillenbrand, T.; Toussaint, D.; Böhm, E.; Fuchs, S.; Scherer, U.; Rudolphi, A.; Hoffmann, M.; Kereißig, J.; Kotz, C. Einträge von Kupfer, Zink und Blei in Gewässer und Böden—Analyse der Emissionspfade und möglicher Emissionsminderungsmaßnahmen; Forschungsbericht 202 242 20/02, UBA-Texte 19/05; Umweltbundesamt: Dessau, Germany, 2005; pp. 1–329. (In German) [Google Scholar]
  82. Kocher, B.; Brose, S.; Feix, J.; Görg, C.; Peters, A.; Schenker, K. Stoffeinträge in den Straßenseitenraum—Reifenabrieb; Berichte der Bundesanstalt für Straßenwesen: Bergisch Gladbach, Germany, 2010; Volume 188, pp. 1–33. (In German) [Google Scholar]
  83. FGSV379/1. Hinweise und Empfehlungen für die Beschaffung von Streustoffen—Kommentar zur TL-Streu; FGSV Forschungsgesellschaft für Straßen- und Verkehrswesen e. V.: Köln, Germany, 2004. (In German) [Google Scholar]
  84. Harned, D.A. Effects of Highway Runoff on Streamflow and Water Quality in the Sevenmile Creek Basin, a Rural Area in the Piedmont Province of North Carolina, July 1981 to July 1982; U.S. Geological Survey Water-Supply Paper 2329; U.S. Geological Survey: Denver, CO, USA, 1988; pp. 1–44. [Google Scholar]
  85. Kobriger, N.P.; Geinopolos, A. Sources and migration of highway runoff pollutants. Volume III: Research Report; Report No. FHWA-RD-84/059; US Department of Transportation: Washington, DC, USA, 1984; pp. 1–368. [Google Scholar]
  86. Gupta, M.K.; Agnew, R.W.; Kobriger, N.P. Constituents of Highway Runoff. Volume I: State-of-the-Art Report; Report No. FHWA-RD-81/042; US Department of Transportation: Washington, DC, USA, 1981; pp. 1–124. [Google Scholar]
  87. Heshmati, A.; Vahidinia, A.; Salehi, I. Determination of heavy metal levels in edible salt. Avicenna J. Med. Biochem. 2014, 2, e19836. [Google Scholar] [CrossRef]
  88. Umweltbundesamt. National Trend Tables for the German Atmospheric Emission Reporting (Heavy Metals) 1990–2013; Final Version: 3 February 2015; Umweltbundesamt: Berlin, Germany, 2015. [Google Scholar]
  89. Denier van der Gon, H.A.C.; van het Bolscher, M.; Visschedijk, A.J.H.; Zandveld, P.Y.J. Study to the Effectiveness of the UNECE Heavy Metals Protocol and Costs of Possible Additional Measures. Phase I: Estimation of Emission Reduction Resulting from the Implementation of the HM Protocol; TNO-Report B&O-A R 2005/193; TNO: Apeldoorn, The Netherlands, 2005; pp. 1–134. [Google Scholar]
  90. Hallberg, M.; Renman, G.; Lundbom, T. Seasonal variations of ten metals in highway runoff and their partition between dissolved and particulate matter. Water Air Soil Pollut. 2007, 181, 183–191. [Google Scholar] [CrossRef]
  91. Harrison, R.M.; Johnston, W.R.; Ralph, J.C.; Wilson, S.J. The budget of lead, copper and cadmium for a major highway. Sci. Total Environ. 1985, 46, 137–145. [Google Scholar] [CrossRef]
  92. Harrison, R.M.; Johnston, W.R. Deposition fluxes of lead, cadmium, copper and polynuclear aromatic hydrocarbons (PAH) on the verges of a major highway. Sci. Total Environ. 1985, 46, 121–135. [Google Scholar] [CrossRef]
  93. Steiner, M.; Boller, M.; Schulz, T.; Pronk, W. Modelling heavy metal fluxes from traffic into the environment. J. Environ. Monit. 2007, 9, 847–854. [Google Scholar] [CrossRef] [PubMed]
  94. Hewitt, C.N.; Rashed, M.B. An integrated budget for selected pollutants for a major rural highway. Sci. Total Environ. 1990, 93, 375–384. [Google Scholar] [CrossRef]
  95. Granato, G.E. Deicing chemicals as source of constituents of highway runoff. Transp. Res. Rec. J. Transp. Res. Board 1996, 1533, 50–58. [Google Scholar] [CrossRef]
  96. Dierkes, C.; Lucke, T.; Helmreich, B. General Technical Approvals for Decentralised Sustainable Urban Drainage Systems (SUDS)—The Current Situation in Germany. Sustainability 2015, 7, 3031–3051. [Google Scholar] [CrossRef]
  97. Huber, M.; Welker, A.; Dierschke, M.; Drewes, J.E.; Helmreich, B. A novel test method to determine the filter material service life of decentralized systems treating runoff from traffic areas. J. Environ. Manag. 2016, 179, 66–75. [Google Scholar] [CrossRef] [PubMed]
Figure 1. Annual total heavy metal loads of Cr (n = 10), Cu (n = 41), Pb (n = 42), and Zn (n = 43) in runoff from traffic areas for each of the three categories highways (H), roads (R), and parking lots (P).
Water 08 00294 g001
Figure 2. Historical trends of Cu (n = 41), Pb (n = 42), and Zn (n = 43) in traffic area runoff loads from the 1970s to date.
Water 08 00294 g002
Figure 3. Variations of the traffic related heavy metal emissions by de-icing salts in Germany (1990–2013). Heavy metal contents of the de-icing salts differ largely within each reference.
Water 08 00294 g003
Table 1. Characteristics of traffic area sites with heavy metal loads reported in the literature.
IDLiteratureLocation *Period of SamplingStudy Site Characteristics **AADT (veh./d)Discharge Area (m2)Rainfall (mm/yr)
H01[32]GBR1973–1974urban, B, D, S57,60036,000533
H02[1]CHE1976–1977non-urban, D72,00054,3001132
H03[33]FRA1978–197913,600
H04[26,27]DEU1978non-urban, D, nS41,00013,000792
H05[34]USA1978–1981urban53,0004937810–1140
H06[34]USA1978–1981urban42,000401810–1140
H07[26,27]DEU1979non-urban, D, nS47,00025,200737
H08[34]USA1979–1981non-urban860011331020–2290
H09[34]USA1979–1981non-urban77007281520–2540
H10[34]USA1979–1981non-urban730011331780–2540
H11[34]USA1979–1981non-urban20005059178–381
H12[34]USA1979–1981urban, B, Zn smelter17,300890432–711
H13[34]USA1979–1981non-urban25001012254–483
H14[35]FRA1980–1982non-urban55001470801
H15[35]FRA1980–1982non-urban7000620
H16[36]FRA1993–1994non-urban30,00013,000
H17[30]USA1993–1995urban, B58,15053411160
H18[30]USA1994–1995urban, B87805261670
H19[37]USA1995–1996urban41,0001670945
H20[37]USA1995–1996urban51,0004940945
H21[28]USA1995–1996urban, B, D25,0001497
H22[38]FRA1995–1996urban, B, D, S12,0003200656
H23[37]USA1995–1997urban120,0001880945
H24[39]DEU1998–2000urban, D>50,00075,800774
H25[39]DEU1998–2000urban, D>50,00051,300774
H26[40]CHE1999–2000non-urban60,00075,0001050
H27[41]CHE2006–2007urban, D, S59,00025,000876–1184
H28[41]CHE2006–2009non-urban, D, S74,00020,000477–726
H29[42]DEU2011–2012non-urban, D85,60027.5538
H30[42]DEU2011–2012urban, D66,20028.0471
H31[42]DEU2011–2012non-urban, D45,00027.3454
H32[43]CHE2012–2013urban, D, S39,00042,0001147
R01[44]DEU1988–1989urban18,129162.2609
R02[45]DEU1996–2005urban, D680017.3334–863
R03[14]CHE2002–2004non-urban17,00015001000
R04[14]CHE2002–2004urban17,00014.11000
R05[46]BRA2002–2004urban90001300
R06[47]DEU2006–2007urban, D, S57,000100739
R07[48]DEU2014–2015non-urban, D20,60098701200
R08[48]DEU2015urban, nD95001600800
P01[29]USA1998–1999urban10501000
P02[29]USA1998–1999urban10501000
P03[49]DEU2001non-urban, D, S10,000635
P04[49]DEU2001non-urban, D, S5000635
P05[49]DEU2001non-urban, D, S17,700769
Notes: * BRA (Brazil), CHE (Switzerland), DEU (Germany), FRA (France), GBR (Great Britain), and USA (United States of America); ** B = Bridge, D = De-icing salt application, nD = no De-icing salt application, nS = no Sweeping, S = Sweeping reported in the literature.
Table 2. Annual total heavy metal loads in runoff from traffic areas. The characteristics of all traffic area sites are described in Table 1.
IDLiteratureCd Load (g/ha)Cr Load (g/ha)Cu Load (g/ha)Ni Load (g/ha)Pb Load (g/ha)Zn Load (g/ha)
H01[32]9723780100012,90019,000
H02[1]2535025001900
H03[33]12002300
H04[26,27]376262113302330
H05[34]22344202320
H06[34]73215,9204210
H07[26,27]2910054411602890
H08[34]34130220
H09[34]36116702010
H10[34]56554802560
H11[34]3080470
H12[34]11869010,400
H13[34]65320390
H14[35]4101170
H15[35]8201410
H16[36]1401390
H17[30]2304701300
H18[30]80200450
H19[37]5.650.42351121300
H20[37]4.540.4269112874
H21[28]309022090200
H22[38]8.12495672080
H23[37]19.13816284253230
H24[39]4402171960
H25[39]4802502120
H26[40]3010705601990
H27[41]440801190
H28[41]359551270
H29[42]1.4805882440
H30[42]0.624144878
H31[42]0.835072834
H32[43]7503930
R01[44]500180010,600
R02[45]1.74122541832510
R03[14]4.01194711793230
R04[14]3.275.43981702100
R05[46]8.0310500
R06[47]9702104820
R07[48]6001300
R08[48]1841060
P01[29]4218174
P02[29]3317147
P03[49]4001502400
P04[49]2501101000
P05[49]5002002000
Table 3. Spearman correlation coefficients of average annual daily traffic (AADT), catchment area, annual rainfall depths, and heavy metal runoff loads: correlation coefficient ≤0.39 = weak correlation, 0.40–0.59 = medium correlation, and ≥0.60 = strong correlation. Strong correlations are in bold type and no values are presented for Ni because of the small n (5 or 6 for all correlations).
VariableCdCrCuPbSbZnAADTAreaRainfall
Cd
Cr0.76 **
n = 17
Cu0.49 *0.77 **
n = 24n = 18
Pb0.94 **0.90 **0.43 **
n = 24n = 18n = 50
Sb−0.220.080.41−0.10
n = 12n = 12n = 12n = 12
Zn0.210.69 **0.56 **0.50 **0.63 *
n = 22n = 17n = 51n = 52n = 12
AADT0.44 *0.66 **0.47 **−0.01−0.32−0.03
n = 24n = 18n = 48n = 49n = 12n = 50
Area0.74 **0.54 *0.41 **0.25−0.39−0.140.43 **
n = 24n = 18n = 53n = 52n = 12n = 53n = 50
Rainfall0.64 **0.290.040.220.07−0.110.020.22-
n = 22n = 17n = 43n = 42n = 12n = 45n = 40n = 44
Notes: * p < 0.05, statistical significance of the correlations; ** p < 0.01, statistical significance of the correlations.
Table 4. Annual total heavy metal loads in pre-treated runoff from traffic areas.
SiteLiteratureCd Load (g/ha)Cr Load (g/ha)Cu Load (g/ha)Ni Load (g/ha)Pb Load (g/ha)Zn Load (g/ha)
S01[26,27]7.212130360715
S02[28]1020702070
S03[28]505010050130
S04[30]151060
S05[29]8237
S06[29]25779
S07[29]8342
S08[29]9456
S09[29]3120
S10[29]6336
Table 5. Median annual runoff loads (g/ha) for all traffic areas. For Pb, only data measured in the 21st century was used.
ParameternMedianMeanSD
Cd166.813.012.9
Cr975107106
Cu40355384254
Ni2666635
Pb13110149119
Sb414.012.95.7
Zn41196020181751
Table 6. Median annual runoff loads (g/ha) for all highway sites. For Pb, only data measured in the 21st century was used.
ParameternMedianMeanSD
Cd12141614
Cr676121130
Cu27355388260
Ni19090
Pb5726818
Sb311126
Zn29190017731004
Table 7. Traffic related heavy metal emissions in Germany (summary of mean values of the calculations presented in Section 3.4.2 that are based on different literature data).
SourceCd (t/yr)Cu (t/yr)Pb (t/yr)Zn (t/yr)
Tire wear0.190.792.01255
Brake lining wear0.0392861.5309
Roadway abrasion4.37.1149
Weights for tire balance2.26.6
Guardrails313
Lampposts and signs60
De-icing salts0.701.7511.61.75
Sum of all seven sources0.9293584.42094
Table 8. Variations of the traffic related heavy metal emissions (t/yr) by de-icing salts with different contents (cf. [38,83,84,85,86]) in Germany (1990–2013).
ParameterMinMedianMeanMax
[38][83][84][85][86][38][83][84][85][86][38][83][84][85][86][38][83][84][85][86]
Cd0.090.920.430.363.611.700.414.071.911.0510.54.95
Cu0.232.300.551.450.000.909.022.175.680.001.0210.22.446.410.002.6326.36.3116.60.00
Pb1.522.300.742.890.045.959.022.8911.40.166.7110.23.2512.80.1817.426.38.4233.10.47
Zn0.239.200.720.9036.12.831.0240.73.192.631058.26

