
Modeling the Probability of Surface Artificialization in Zêzere Watershed (Portugal) Using Environmental Data


Abstract
:
1. The Artificialization of Surfaces and Their Assessment
2. Main Objectives
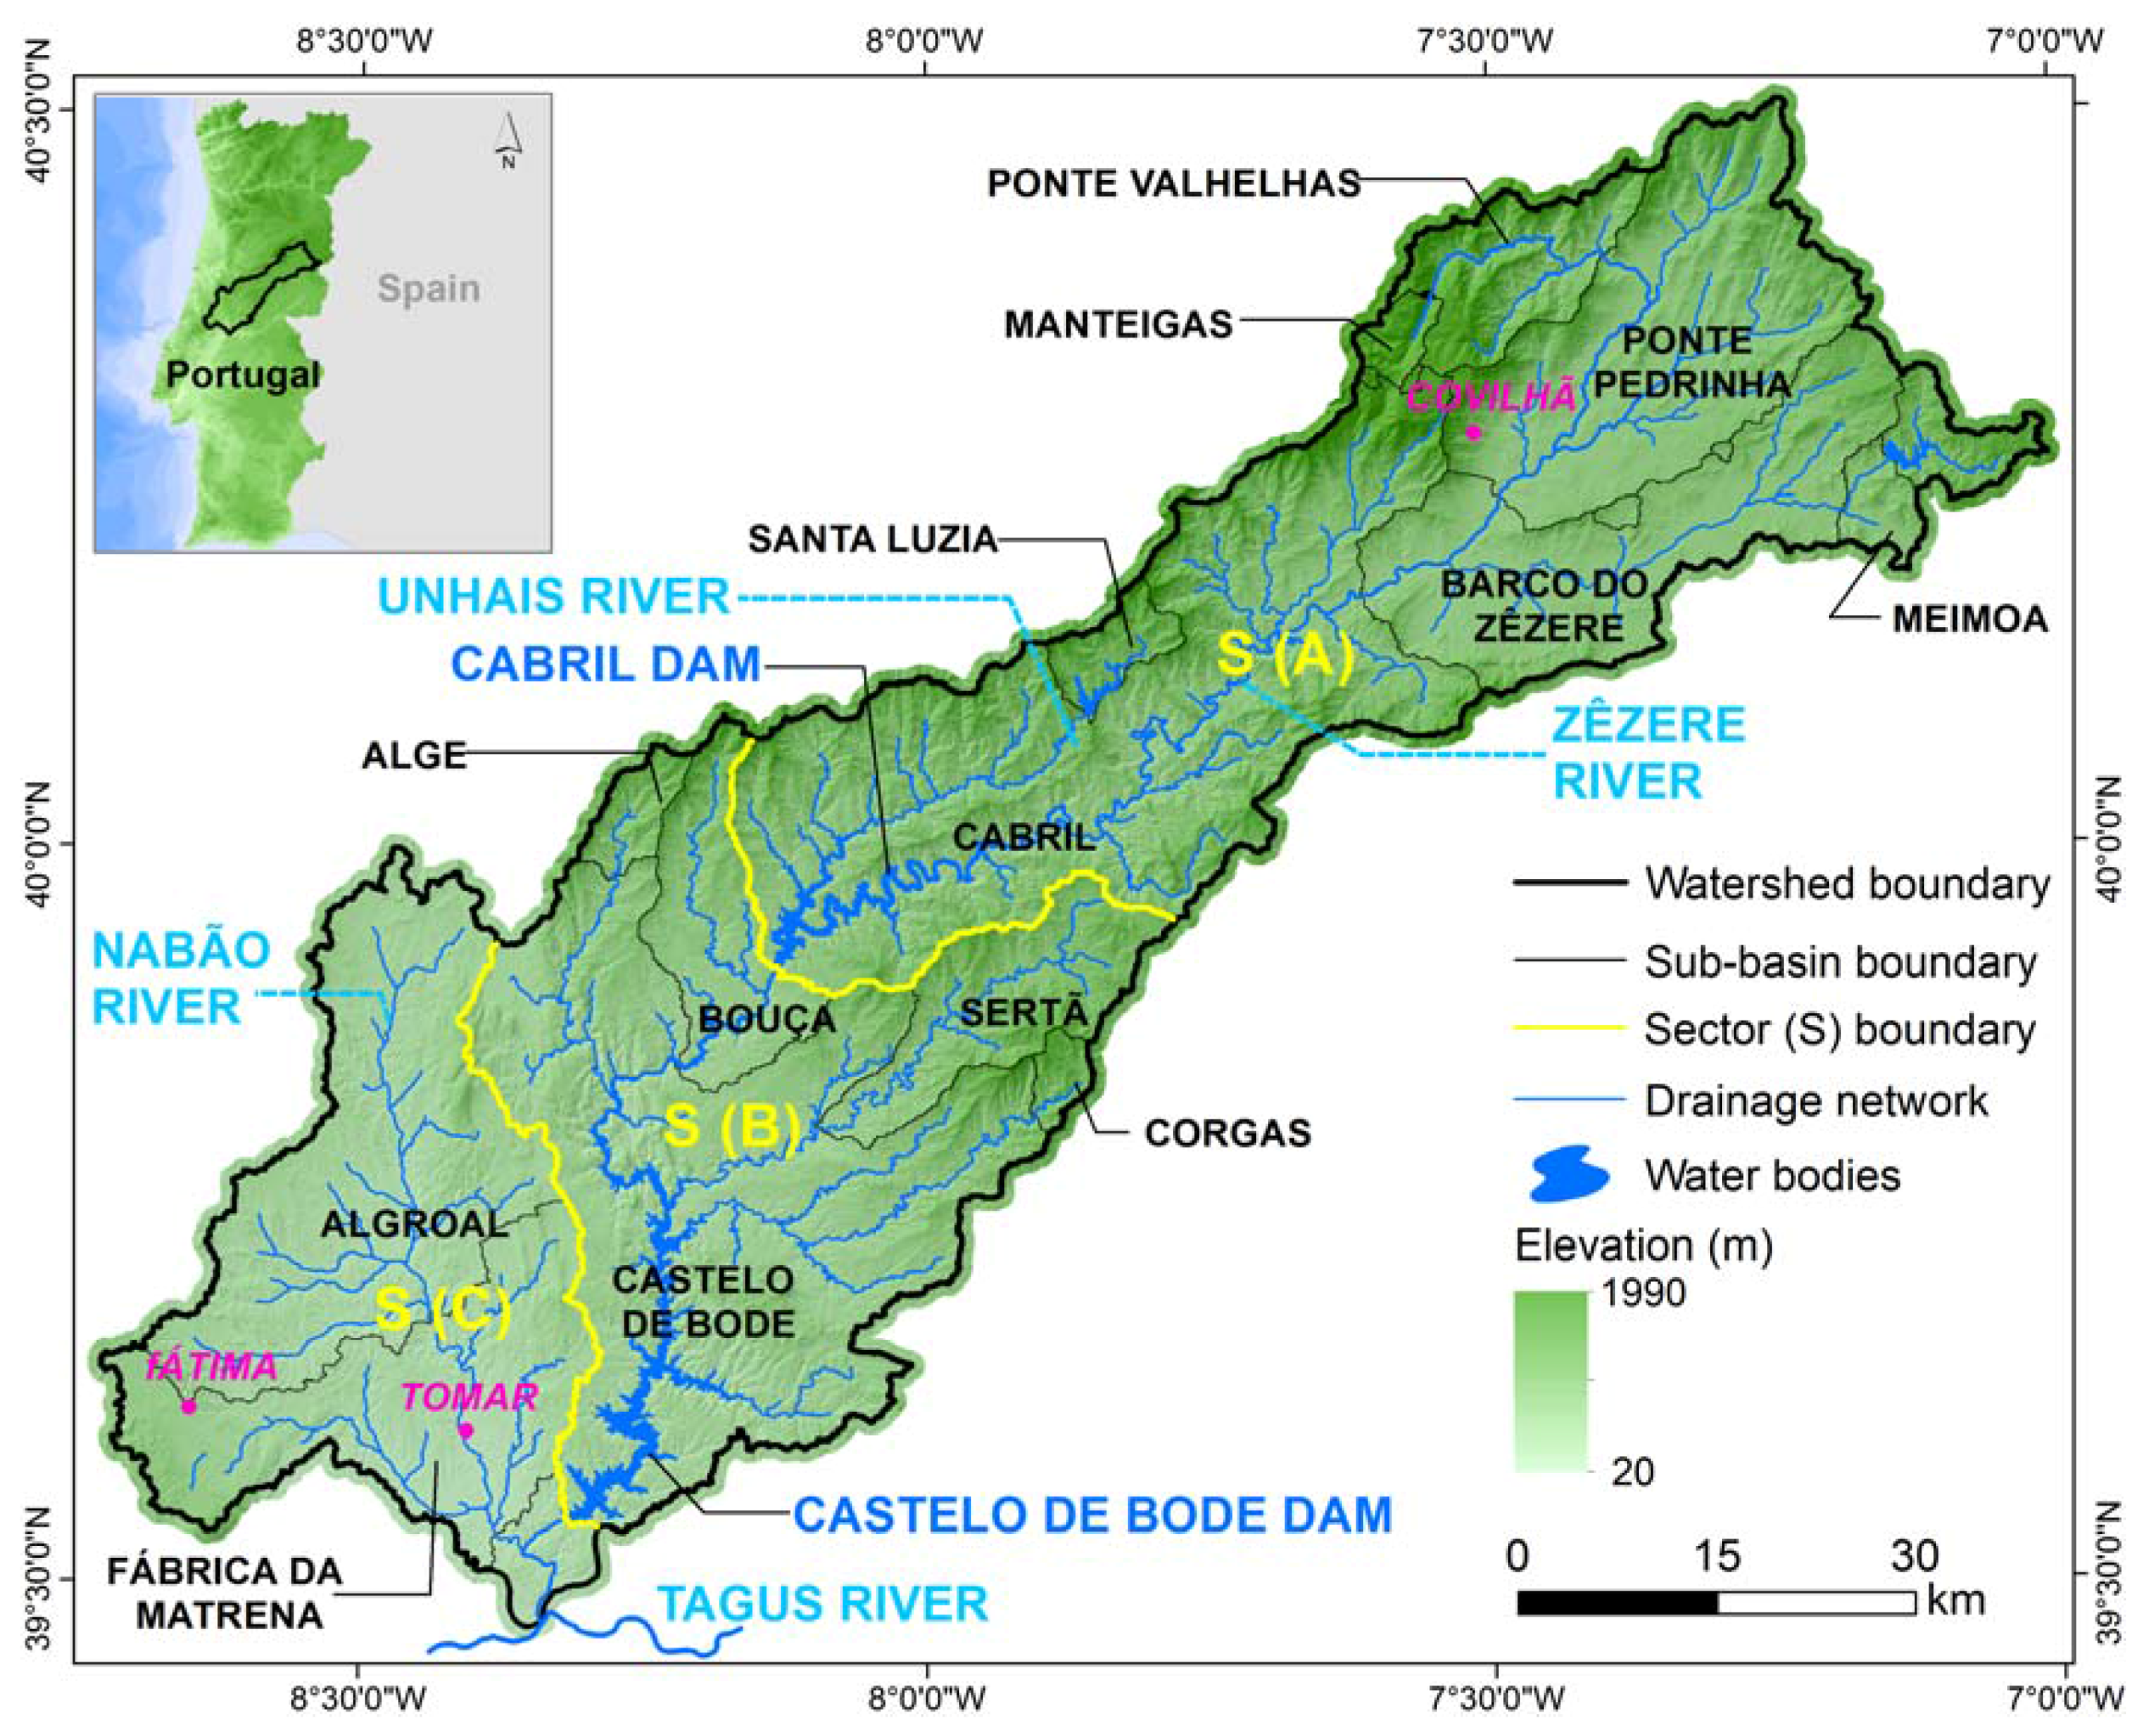
3. Research Area
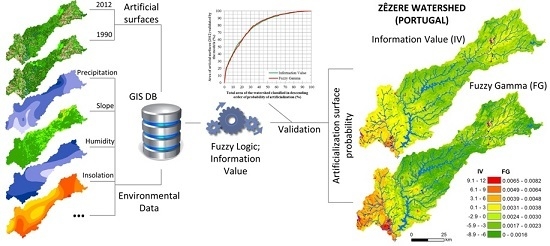
4. Data, Tools, and Methods
4.1. Statistical Methods and Validation
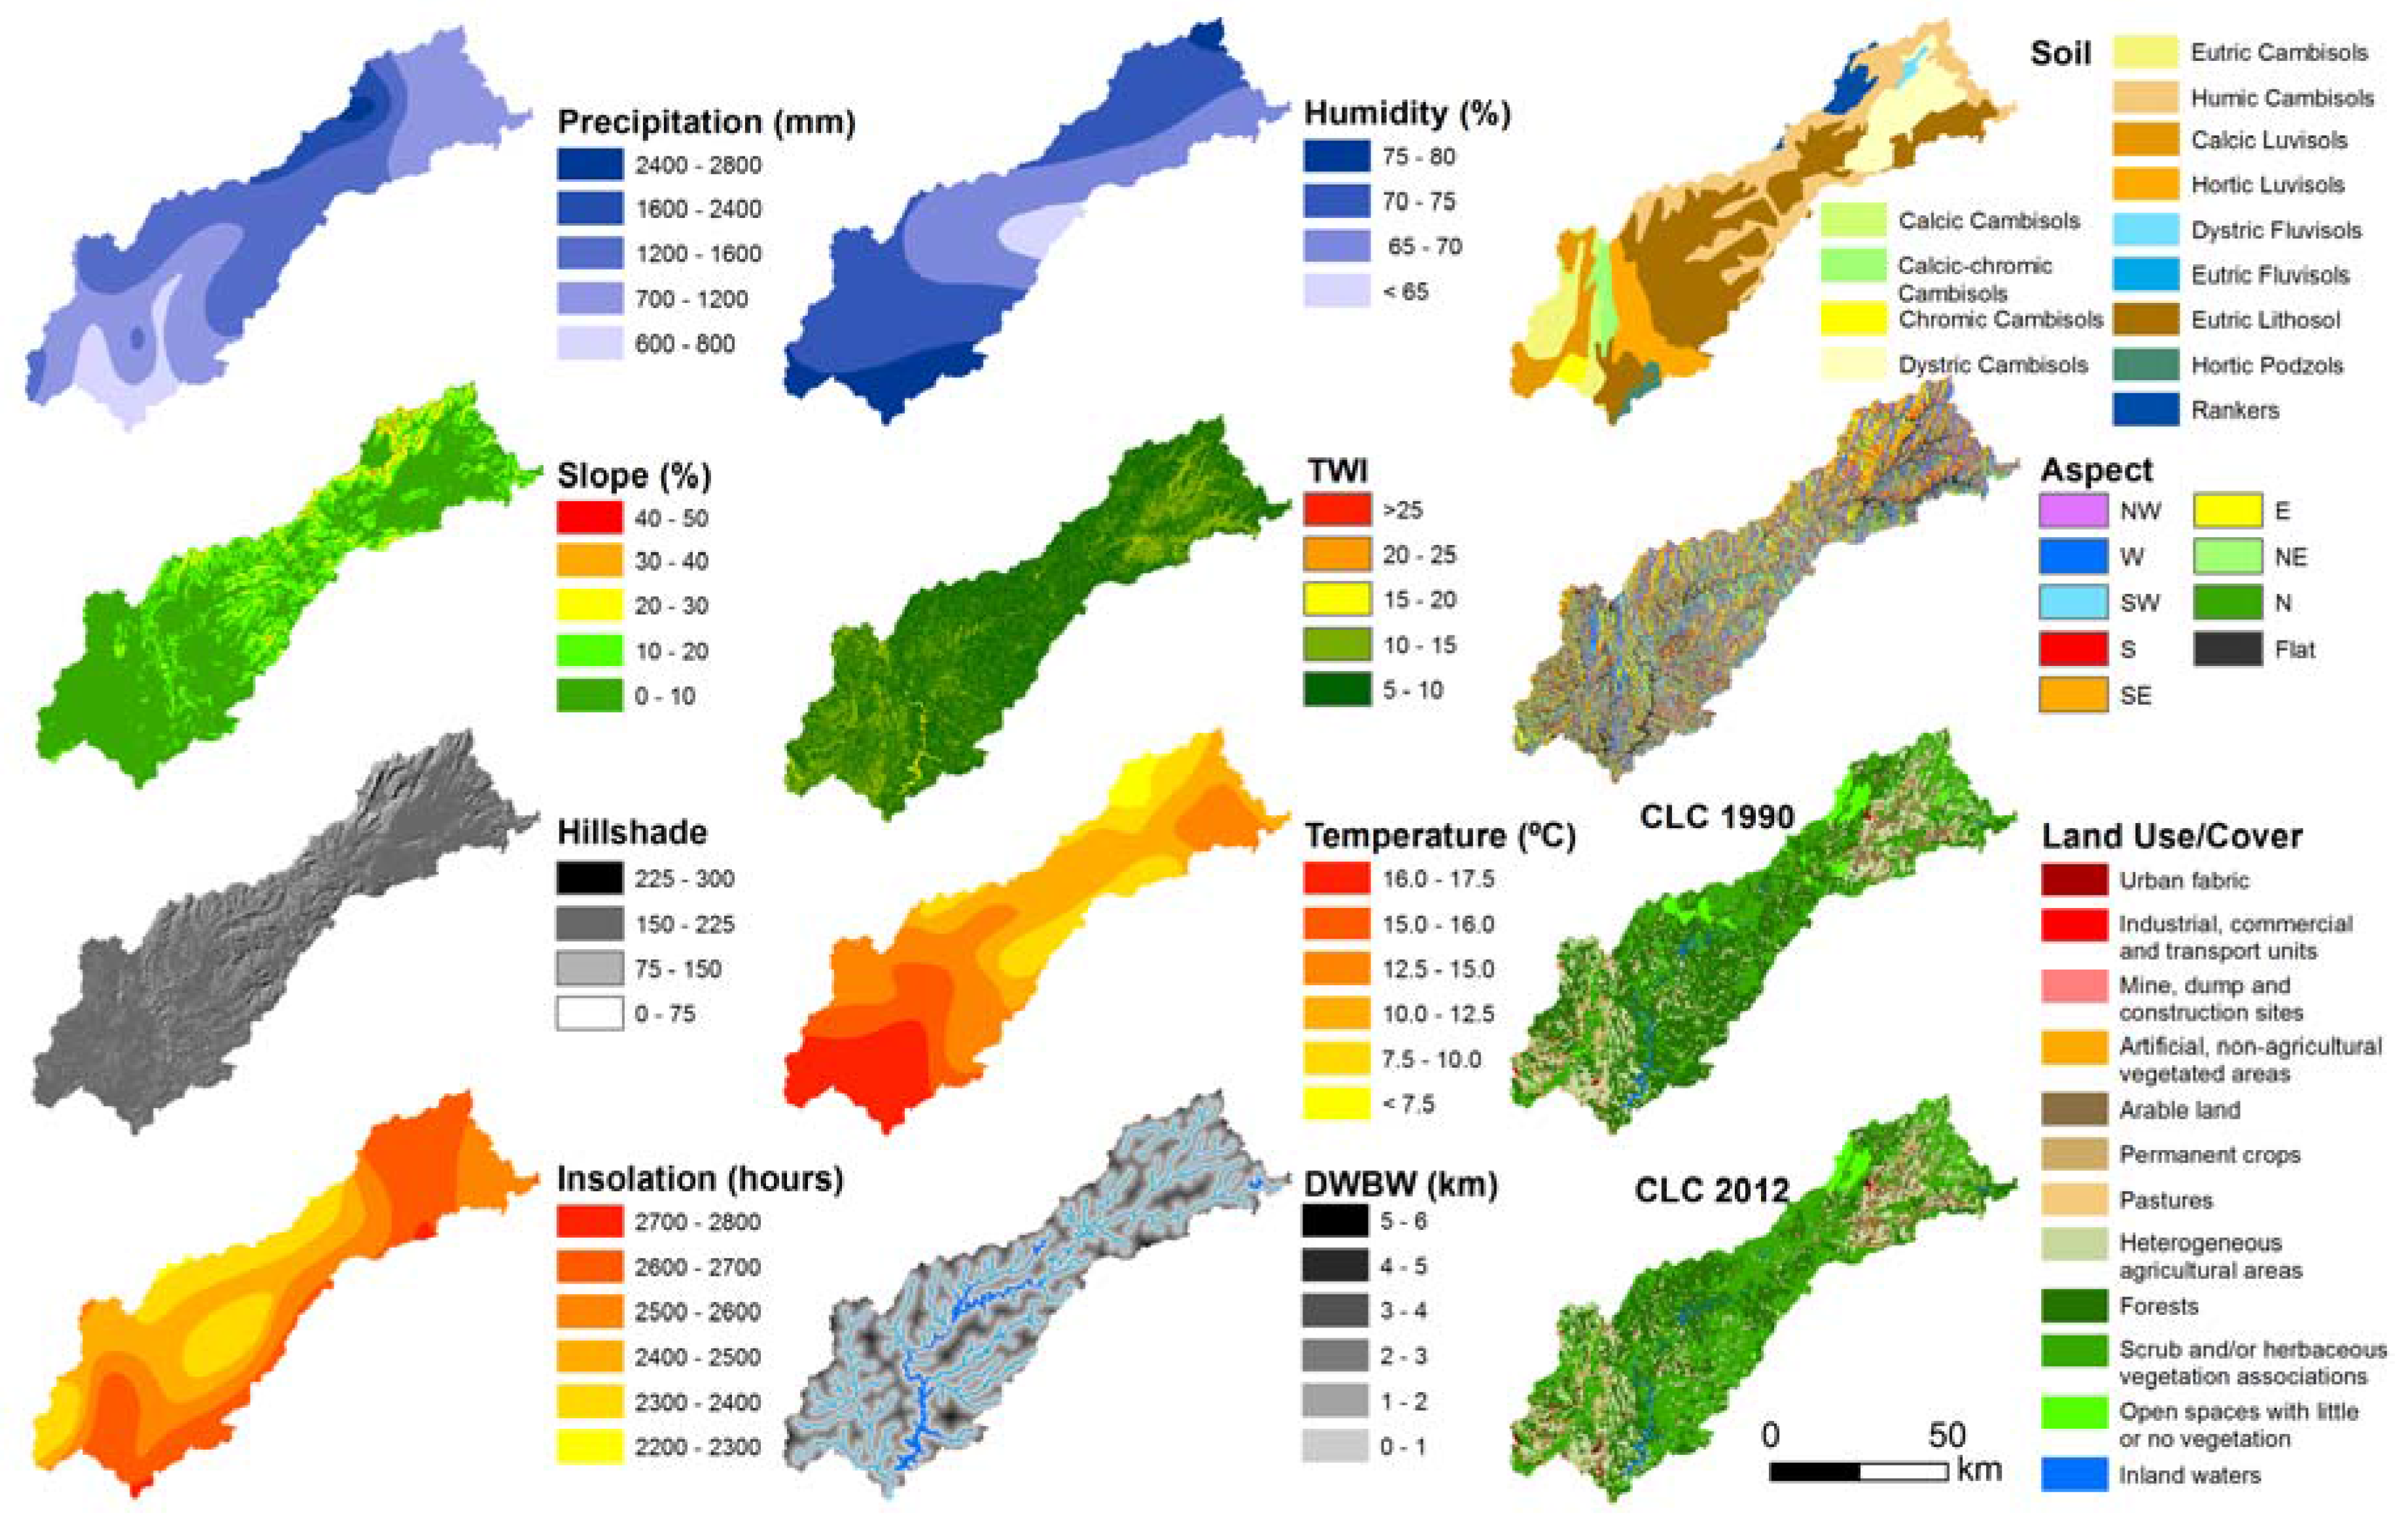
4.2. Data Collection and Tools
5. Results and Analyses
5.1. Conditioned Probabilities of Artificialization Surfaces in the Zêzere Watershed
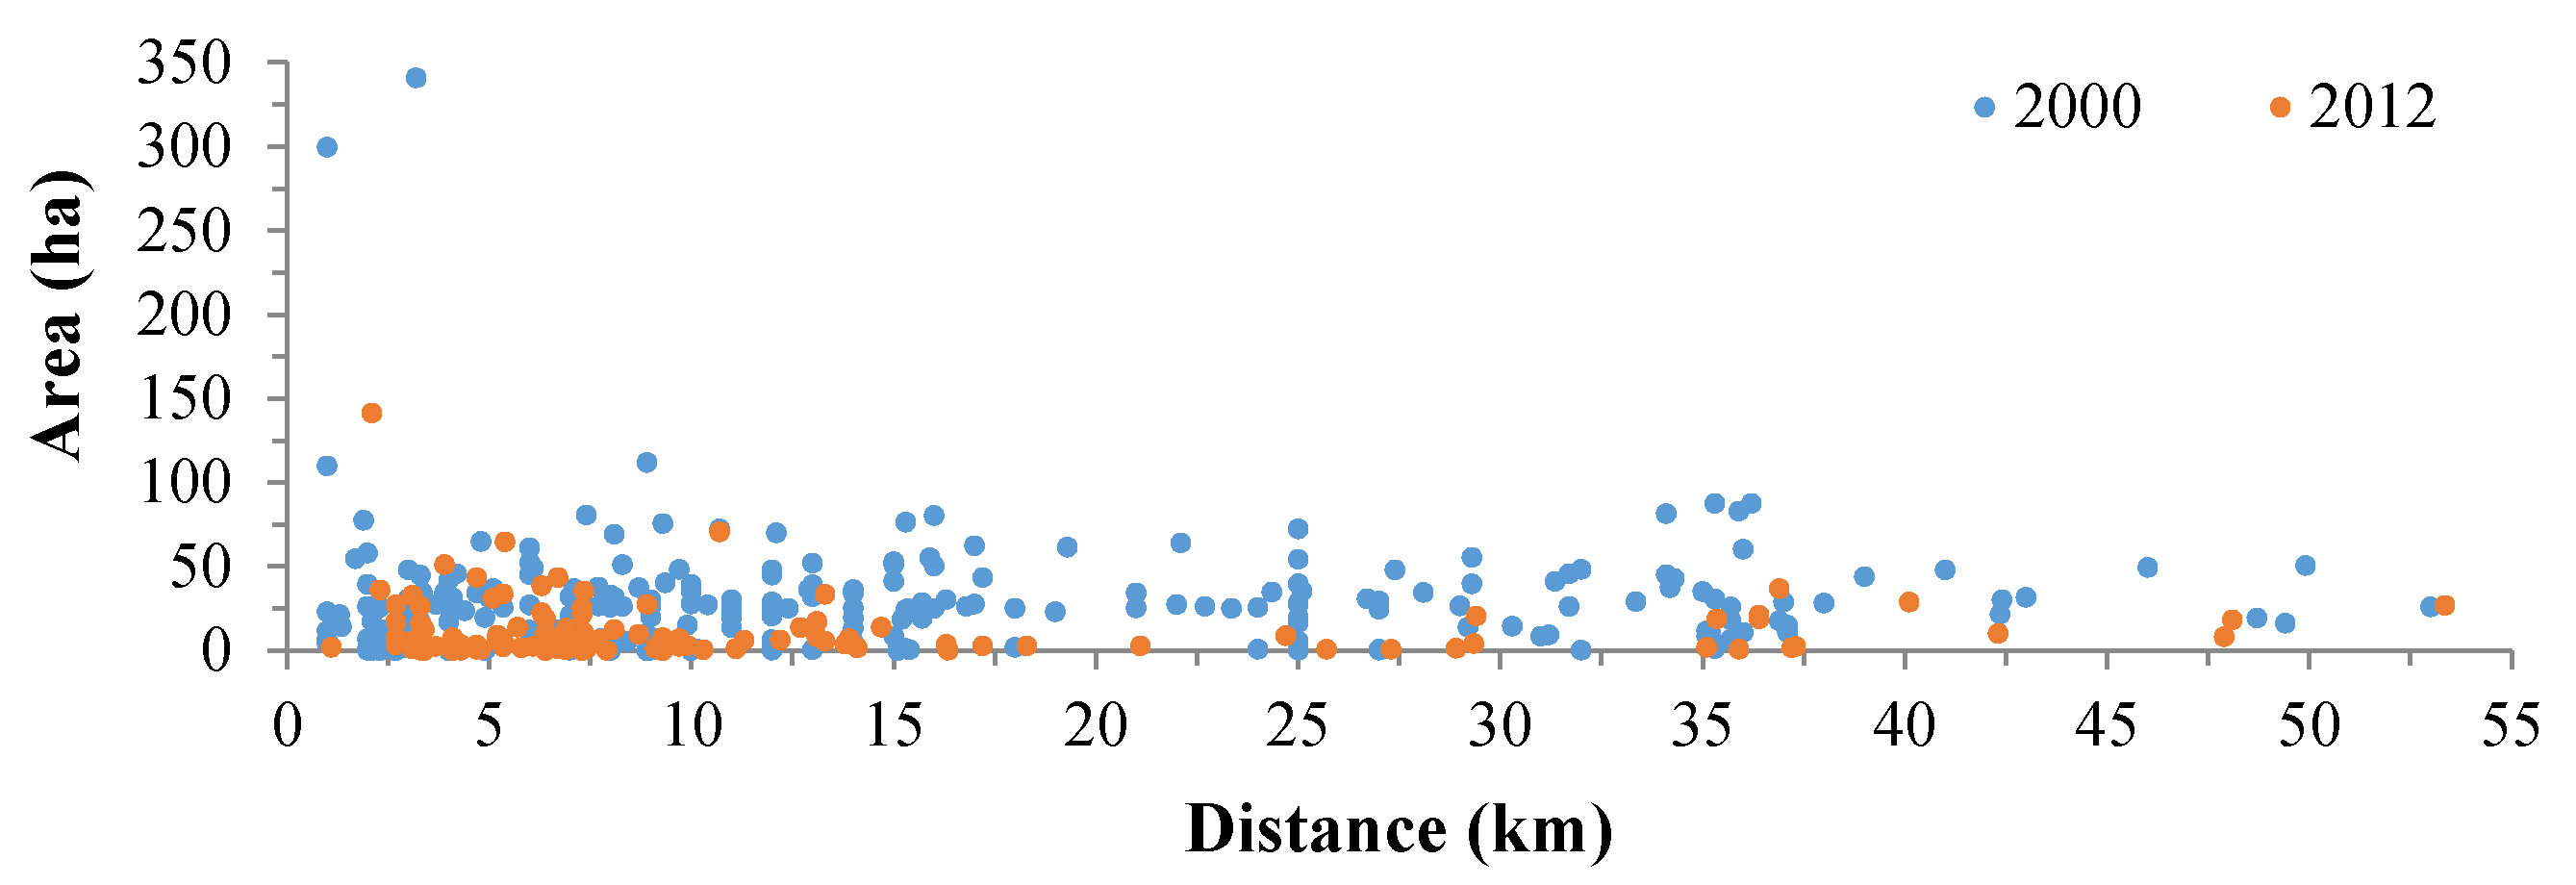
5.2. Spatial Variation of the Probability of Artificialization Surfaces in the Zêzere Watershed
5.3. Artificialization Surfaces by the Sectors of the Zêzere Watershed and the Relevance of the Environmental Predisposing Factors to Artificialization Process
6. Discussion
7. Conclusions
Acknowledgments
Author Contributions
Conflicts of Interest
References
- Bagan, H.; Yamagata, Y. Remote Sensing of Environment Landsat analysis of urban growth: How Tokyo became the world’s largest megacity during the last 40 years. Remote Sens. Environ. 2012, 127, 210–222. [Google Scholar] [CrossRef]
- Berdegué, J.A.; Carriazo, F.; Jara, B.; Modrego, F.; Soloaga, I. Cities, Territories, and Inclusive Growth: Unraveling Urban–Rural Linkages in Chile, Colombia, and Mexico. World Dev. 2015, 73, 56–71. [Google Scholar] [CrossRef]
- Hegazy, I.R.; Kaloop, M.R. Monitoring urban growth and land use change detection with GIS and remote sensing techniques in Daqahlia governorate Egypt. Int. J. Sustain. Built Environ. 2015, 4, 117–124. [Google Scholar] [CrossRef]
- Kourtit, K.; Nijkamp, P.; Reid, N. The new urban world: Challenges and policy. Appl. Geogr. 2014, 49, 1–3. [Google Scholar] [CrossRef]
- Shafizadeh-Moghadam, H.; Helbich, M. Spatiotemporal variability of urban growth factors : A global and local perspective on the megacity of Mumbai. Int. J. Appl. Earth Obs. Geoinform. 2015, 35, 187–198. [Google Scholar] [CrossRef]
- Shafizadeh-Moghadam, H.; Helbich, M. Spatiotemporal urbanization processes in the megacity of Mumbai, India: A Markov chains-cellular automata urban growth model. Appl. Geogr. 2013, 40, 140–149. [Google Scholar] [CrossRef]
- Direção Geral do Território (DGT). Land Use and Land Cover Evolutions in Continental Portugal. Work to Support Reporting of Emissions and Carbon Sequestration in the Sector Use and Land Use Changes. Kyoto Protocol and United Nations Framework Convention on Climate Changes; DGT: Lisbon, Portugal, 2014. [Google Scholar]
- Meneses, B.M.; Vale, M.J.; Reis, R.; Marrecas, P.; Barreira, E. Metodologias para a avaliação do uso e ocupação do solo em diferentes épocas. In Uso e Ocupação do Solo em Portugal Continental: Avaliação e Cenários Futuros. Projeto LANDYN; Direção-Geral do Território: Lisboa, Portugal, 2014; pp. 5–16. [Google Scholar]
- Quan, B.; Chen, J.-F.; Qiu, H.-L.; Romkens, M.J.M.; Yang, X.-Q.; Jiang, S.-F.; Li, B.-C. Spatial-temporal pattern and driving forces of land use changes in Xiamen. Pedosphere 2006, 16, 477–488. [Google Scholar] [CrossRef]
- Rodriguez-Galiano, V.; Chica-Olmo, M. Land cover change analysis of a Mediterranean area in Spain using different sources of data: Multi-seasonal Landsat images, land surface temperature, digital terrain models and texture. Appl. Geogr. 2012, 35, 208–218. [Google Scholar] [CrossRef]
- Teixeira, Z.; Teixeira, H.; Marques, J.C. Systematic processes of land use/land cover change to identify relevant driving forces: Implications on water quality. Sci. Total Environ. 2014, 471, 1320–1335. [Google Scholar] [CrossRef] [PubMed]
- Fiquepron, J.; Garcia, S.; Stenger, A. Land use impact on water quality: Valuing forest services in terms of the water supply sector. J. Environ. Manag. 2013, 126, 113–121. [Google Scholar] [CrossRef] [PubMed]
- Long, H.; Tang, G.; Li, X.; Heilig, G.K. Socio-economic driving forces of land-use change in Kunshan, the Yangtze River Delta economic area of China. J. Environ. Manag. 2007, 83, 351–364. [Google Scholar] [CrossRef] [PubMed]
- Nunes, A.N.; de Almeida, A.C.; Coelho, C.O.A. Impacts of land use and cover type on runoff and soil erosion in a marginal area of Portugal. Appl. Geogr. 2011, 31, 687–699. [Google Scholar] [CrossRef]
- Ribeiro, M.; Vale, M.J.; Reis, R. Identificação das principais forças motrizes: Abordagem quantitativa. In Uso e Ocupação do Solo em Portugal Continental: Avaliação e Cenários Futuros. Projeto LANDYN; Direção-Geral do Território: Lisboa, Portugal, 2014; pp. 81–88. [Google Scholar]
- Schoene, D.H.F.; Bernier, P.Y. Adapting forestry and forests to climate change: A challenge to change the paradigm. For. Policy Econ. 2012, 24, 12–19. [Google Scholar] [CrossRef]
- Vale, M.J.; Meneses, B.M.; Reis, R.; Saraiva, R.A.; Villegas, J.; Cruz, M. Water Quality Impact Assessment of Land Use and Land Cover Changes. A dynamic IT model for territorial integrated management. In Proceedings of the GEOProcessing 2015: The Seventh International Conference on Advanced Geographic Information Systems, Applications, and Services, Lisbon, Portugal, 22–27 February 2015; pp. 38–42.
- Bičı́k, I.; Jeleček, L.; Štěpánek, V. Land-use changes and their social driving forces in Czechia in the 19th and 20th centuries. Land Use Policy 2001, 18, 65–73. [Google Scholar] [CrossRef]
- Regos, A.; Ninyerola, M.; Moré, G.; Pons, X. Linking land cover dynamics with driving forces in mountain landscape of the Northwestern Iberian Peninsula. Int. J. Appl. Earth Obs. Geoinform. 2015, 38, 1–14. [Google Scholar] [CrossRef]
- Liu, C.; Ma, X. Analysis to driving forces of land use change in Lu’an mining area. Trans. Nonferrous Met. Soc. China 2011, 21, 727–732. [Google Scholar] [CrossRef]
- Teixeira, Z.; Teixeira, H.; Marques, J.C. Systematic processes of land use/land cover change to identify relevant driving forces: Implications on water quality. Sci. Total Environ. 2014, 470–471, 1320–1335. [Google Scholar] [CrossRef] [PubMed]
- Ascione, M.; Campanella, L.; Cherubini, F.; Ulgiati, S. Environmental driving forces of urban growth and development. Landsc. Urban Plan. 2009, 93, 238–249. [Google Scholar] [CrossRef]
- Melo, J.L.B. Landyn: Land Use and Land Cover Change in Continental Portugal: Characterization, Driving Forces and Future Scenarios. Technical Report for the Landyn Project. Final Report: CO2 Emissions and Removals from the LULUCF; Direção Geral do Território: Lisbon, Portugal, 2014. [Google Scholar]
- Meneses, B.M. The Influence of Forest Fire on Water Quality of São Domingos Stream Located in the Western Region of Portugal; High Institute of Agronomy of University of Lisbon: Lisbon, Portugal, 2013. [Google Scholar]
- Vale, M.J.; Saraiva, R.A. GI and Watershed Management: Discussing GI Relevance Towards Monitoring EU Legal Framework. In Proceedings of the INSPIRE Conference 2012, Istanbul, Turkey, 23–27 June 2012.
- Meneses, B.M. Nuno Cortez Effect of a forest fire on physicochemical properties of the water of São Domingos Stream (Western Region of Portugal). J. Waters Resour. 2015, 36, 1–10. [Google Scholar]
- Vale, M.J.; Reis, R.; Meneses, B.M. A caraterização do uso e ocupação do solo de Portugal Continental. In Uso e Ocupação do Solo em Portugal Continental: Avaliação e Cenários Futuros. Projeto LANDYN; Direção-Geral do Território: Lisboa, Portugal, 2014; pp. 1–5. [Google Scholar]
- Meneses, B.M.; Saraiva, R.; Reis, R.; Vale, M.J. A importância da avaliação das transições de uso e ocupação do solo na compreensão da evolução da paisagem. In Espaços de Fronteira, Territórios de Esperança: Das Vulnerabilidades às Dinâmicas de Desenvolvimento; Jacinto, R., Ed.; Iberografias, Centro de Estudos Ibéricos: Guarda, Portugal, 2014; pp. 79–92. [Google Scholar]
- Srivastava, P.K.; Han, D.; Rico-Ramirez, M.A.; Bray, M.; Islam, T. Selection of classification techniques for land use/land cover change investigation. Adv. Space Res. 2012, 50, 1250–1265. [Google Scholar] [CrossRef]
- Paz, J.M.; Sánchez, J.; Visconti, F. Combined use of GIS and environmental indicators for assessment of chemical, physical and biological soil degradation in a Spanish Mediterranean region. J. Environ. Manag. 2006, 79, 150–162. [Google Scholar] [CrossRef] [PubMed]
- Verstegen, J.A.; Karssenberg, D.; van der Hilst, F.; Faaij, A.P.C. Identifying a land use change cellular automaton by Bayesian data assimilation. Environ. Model. Softw. 2014, 53, 121–136. [Google Scholar] [CrossRef]
- Basse, R.M.; Omrani, H.; Charif, O.; Gerber, P.; Bódis, K. Land use changes modelling using advanced methods: Cellular automata and artificial neural networks. The spatial and explicit representation of land cover dynamics at the cross-border region scale. Appl. Geogr. 2014, 53, 160–171. [Google Scholar] [CrossRef]
- García-Frapolli, E.; Ayala-Orozco, B.; Bonilla-Moheno, M.; Espadas-Manrique, C.; Ramos-Fernández, G. Biodiversity conservation, traditional agriculture and ecotourism: Land cover/land use change projections for a natural protected area in the northeastern Yucatan Peninsula, Mexico. Landsc. Urban Plan. 2007, 83, 137–153. [Google Scholar] [CrossRef]
- Mitsova, D.; Shuster, W.; Wang, X.H. A cellular automata model of land cover change to integrate urban growth with open space conservation. Landsc. Urban Plan. 2011, 99, 141–153. [Google Scholar] [CrossRef]
- Kamusoko, C.; Aniya, M.; Adi, B.; Manjoro, M. Rural sustainability under threat in Zimbabwe—Simulation of future land use/cover changes in the Bindura district based on the Markov-cellular automata model. Appl. Geogr. 2009, 29, 435–447. [Google Scholar] [CrossRef]
- Guan, D.; Li, H.; Inohae, T.; Su, W.; Nagaie, T.; Hokao, K. Modeling urban land use change by the integration of cellular automaton and Markov model. Ecol. Model. 2011, 222, 3761–3772. [Google Scholar] [CrossRef]
- König, H.J.; Uthes, S.; Schuler, J.; Zhen, L.; Purushothaman, S.; Suarma, U.; Sghaier, M.; Makokha, S.; Helming, K.; Sieber, S.; et al. Regional impact assessment of land use scenarios in developing countries using the FoPIA approach: Findings from five case studies. J. Environ. Manag. 2013, 127, S56–S64. [Google Scholar] [CrossRef] [PubMed]
- Chen, X.; Yu, S.X.; Zhang, Y.P. Evaluation of Spatiotemporal Dynamics of Simulated Land Use/Cover in China Using a Probabilistic Cellular Automata-Markov Model. Pedosphere 2013, 23, 243–255. [Google Scholar] [CrossRef]
- Santos, P.P.; Tavares, A.O.; Zêzere, J.L. Risk analysis for local management from hydro-geomorphologic disaster databases. Environ. Sci. Policy 2014, 40, 85–100. [Google Scholar] [CrossRef]
- Zêzere, J.L.; Vaz, T.; Pereira, S.; Oliveira, S.C.; Marques, R.; Garcia, R.A.C. Rainfall thresholds for landslide activity in Portugal: A state of the art. Environ. Earth Sci. 2014, 73, 2917–2936. [Google Scholar] [CrossRef]
- Pereira, S.; Zêzere, J.L.; Quaresma, I.D.; Bateira, C. Landslide incidence in the North of Portugal: Analysis of a historical landslide database based on press releases and technical reports. Geomorphology 2014, 214, 514–525. [Google Scholar] [CrossRef]
- Meneses, B.M. Susceptibility and Risk of Landslides in Tarouca County. Master’s Thesis, Institute of Geography and Spatial Planning, University of Lisbon, Lisbon, Portugal, 2011. [Google Scholar]
- Tehrany, M.S.; Pradhan, B.; Jebur, M.N. Spatial prediction of flood susceptible areas using rule based decision tree (DT) and a novel ensemble bivariate and multivariate statistical models in GIS. J. Hydrol. 2013, 504, 69–79. [Google Scholar] [CrossRef] [Green Version]
- Conforti, M.; Pascale, S.; Robustelli, G.; Sdao, F. Evaluation of prediction capability of the artificial neural networks for mapping landslide susceptibility in the Turbolo River catchment (northern Calabria, Italy). Catena 2014, 113, 236–250. [Google Scholar] [CrossRef]
- Brown, C.D.; Davis, H.T. Receiver operating characteristics curves and related decision measures: A tutorial. Chemom. Intell. Lab. Syst. 2006, 80, 24–38. [Google Scholar] [CrossRef]
- Vale, M.J. Web Based Colaboratory to Support Water Resources Management and Landuse Integrated Planning; Instituto Superior de Estatística e Gestão de Informação, Universidade Nova de Lisboa: Lisbon, Portugal, 2002. [Google Scholar]
- Bonham-Carter, G. Geographic Information Systems for Geoscientists: Modeling with GIS; Elsevier Science Inc. (Pergamon Press): New York, NY, USA, 1994. [Google Scholar]
- Yin, K.; Yan, T. Statistical Preditiction Model for Slope Instability of Metamorphosed Rocks. In Proceedings of the Fifth International Symposium in Landslides; Bonnard, C., Ed.; Balkema: Rotterdam, The Netherlands, 1988; pp. 1269–1272. [Google Scholar]
- Varnes, D. Slope movement types and processes. In Landslides: Analysis and Control (Special Report—Transportation Research Board, National Research Council; 176); Schuster, R., Krizek, R., Eds.; Transportation Research Board: Washington, DC, USA, 1978; pp. 11–28. [Google Scholar]
- Guzzetti, F. Risk-Advanced Weather Forecast System to Advise on Risk Events and Management. Review and Selection of Optional Geological Models Related to Spatial Information Available; IRPI CNR (INTERREG III B CADSES; Europion Union): Perugia, Italy, 2005. [Google Scholar]
- Eeckhaut, M.; Reichenbach, P.; Guzzetti, F.; Rossi, M.; Poesen, J. Combined landslide inventory and susceptibility assessment based on different mapping units: An example from the Flemish Ardennes, Belgium. Nat. Hazards Earth Syst. Sci. 2009, 9, 507–521. [Google Scholar] [CrossRef]
- Zêzere, J.; Faleh, A.; Sadiki, A.; Garcia, R.; Oliveira, S. Modelação da Susceptibilidade a Deslizamentos na Bacia do Oued Sra (Rif central, Marrocos) com Métodos Estatísticos Bi-variados. In Publicações da Associação Portuguesa de Geomorfólogos, Vol. VI, APGEOM; APGEOM: Braga, Portugal, 2009; pp. 203–210. [Google Scholar]
- Zadeh, L.A. Fuzzy sets. Inf. Control 1965, 8, 338–353. [Google Scholar] [CrossRef]
- Blahut, J.; Westen, C.; Sterlacchini, S. Analysis of landslide inventories for accurate prediction of debris-flow source areas. Geomorphology 2010, 119, 36–51. [Google Scholar] [CrossRef]
- Beven, K.J.; Kirkby, M.J. A physically based variable contributing model of basin hydrology. Hydrol. Sci. Bull. 1979, 24, 43–69. [Google Scholar] [CrossRef]
- Yesilnacar, E.; Topal, T. Landslide susceptibility mapping: A comparison of logistic regression and neural networks methods in a medium scale study, Hendek region (Turkey). Eng. Geol. 2005, 79, 251–266. [Google Scholar] [CrossRef]
- Chung, C.J.; Fabbri, A.G. Predicting landslides for risk analysis—Spatial models tested by a cross-validation technique. Geomorphology 2008, 94, 438–452. [Google Scholar] [CrossRef]
- Druga, M.; Faltan, V. Influences of environmental drivers on land cover structure and its long term changes: A case study of the villages of Malachov and Podkonice in Slovakia. Morav. Geogr. Rep. 2014, 22, 29–41. [Google Scholar]
- Meneses, B.M.; Reis, R.; Vale, M.J.; Saraiva, R. Land use and land cover changes in Zêzere watershed (Portugal)—Water quality implications. Sci. Total Environ. 2015, 527–528, 439–447. [Google Scholar] [CrossRef] [PubMed]
- Erwin, D.H. Evolutionary uniformitarianism. Dev. Biol. 2011, 357, 27–34. [Google Scholar] [CrossRef] [PubMed]
- Baker, V.R. Uniformitarianism, earth system science, and geology. Anthropocene 2014, 5, 76–79. [Google Scholar] [CrossRef]
- Dumanski, J.; Pieri, C. Land quality indicators: Research plan. Agric. Ecosyst. Environ. 2000, 81, 93–102. [Google Scholar] [CrossRef]


| LUC | 1990 | 2000 | 2006 | 2012 |
|---|---|---|---|---|
| Continuous urban fabric | 0.02 | 0.02 | 0.02 | 0.02 |
| Discontinuous urban fabric | 1.01 | 1.13 | 1.15 | 1.32 |
| Industrial or commercial units | 0.06 | 0.16 | 0.25 | 0.24 |
| Road and rail networks and associated land | 0.00 | 0.00 | 0.01 | 0.01 |
| Airports | 0.01 | 0.01 | 0.01 | 0.03 |
| Mineral extraction sites | 0.03 | 0.05 | 0.06 | 0.06 |
| Dump sites | 0.01 | 0.01 | 0.02 | 0.03 |
| Construction sites | 0.04 | 0.05 | 0.01 | 0.00 |
| Sport and leisure facilities | 0.01 | 0.01 | 0.01 | 0.01 |
| Variables | Classes | Total Area (ha) | AS 1990 (ha) | AS 2000 (ha) | AS 2012 (ha) | CPji (AS 1990) | CPji (AS 2000) | CPji (AS 2012) | IV (AS 1990) | FM (AS 1990) |
|---|---|---|---|---|---|---|---|---|---|---|
| Aspect | Northwest | 51,549.15 | 338.96 | 409.33 | 482.17 | 0.007 | 0.008 | 0.009 | −0.593 | 0.007 |
| West | 56,574.22 | 411.9 | 489.83 | 549.45 | 0.007 | 0.009 | 0.010 | −0.491 | 0.008 | |
| Southwest | 61,918.88 | 705.13 | 848.98 | 967.34 | 0.011 | 0.014 | 0.016 | −0.044 | 0.013 | |
| South | 57,996.57 | 884.72 | 1050.81 | 1209.06 | 0.015 | 0.018 | 0.021 | 0.248 | 0.017 | |
| Southeast | 61,927.05 | 786.6 | 953.71 | 1138.82 | 0.013 | 0.015 | 0.018 | 0.065 | 0.014 | |
| East | 54,624.12 | 642.44 | 787.59 | 961.53 | 0.012 | 0.014 | 0.018 | −0.012 | 0.013 | |
| Northeast | 48,357.44 | 525.06 | 657.68 | 791.94 | 0.011 | 0.014 | 0.016 | −0.092 | 0.012 | |
| North | 42,475.03 | 300.68 | 379.59 | 458.83 | 0.007 | 0.009 | 0.011 | −0.52 | 0.008 | |
| Flat | 66,855.89 | 1382.43 | 1682.28 | 2028.42 | 0.021 | 0.025 | 0.030 | 0.552 | 0.023 | |
| Hillshade | 250–300 | 221.62 | 3.30 | 3.15 | 3.15 | 0.015 | 0.014 | 0.014 | 0.224 | 0.016 |
| 200–250 | 89,250.44 | 259.45 | 314.87 | 352.12 | 0.003 | 0.004 | 0.004 | −1410 | 0.003 | |
| 150–200 | 306,686.8 | 5193.93 | 6328.9 | 7562 | 0.017 | 0.021 | 0.025 | 0.353 | 0.019 | |
| 100–150 | 85,814.72 | 475.65 | 559.81 | 614.41 | 0.006 | 0.007 | 0.007 | −0.764 | 0.006 | |
| 50–100 | 18,890.39 | 43.41 | 50.54 | 53.17 | 0.002 | 0.003 | 0.003 | −1645 | 0.003 | |
| 0–50 | 1414.38 | 2.18 | 2.53 | 2.71 | 0.002 | 0.002 | 0.002 | −2044 | 0.002 | |
| Humidity (%) | 75–80 | 59,071.72 | 1432.73 | 1775.39 | 2442.13 | 0.024 | 0.030 | 0.041 | 0.712 | 0.027 |
| 70–75 | 249,233.66 | 3745.74 | 4436.33 | 5012.9 | 0.015 | 0.018 | 0.020 | 0.233 | 0.017 | |
| 65–70 | 171,005.31 | 745.06 | 993.69 | 1051.27 | 0.004 | 0.006 | 0.006 | −1005 | 0.005 | |
| <65 | 22,967.66 | 54.39 | 54.39 | 81.26 | 0.002 | 0.002 | 0.004 | −1615 | 0.003 | |
| Insolation (Hours) | 2700–2800 | 4373.7 | 74.95 | 83.46 | 83.46 | 0.017 | 0.019 | 0.019 | 0.365 | 0.019 |
| 2600–2700 | 149,922.62 | 2085.83 | 2603.91 | 3409.02 | 0.014 | 0.017 | 0.023 | 0.156 | 0.015 | |
| 2500–2600 | 123,480.1 | 919.68 | 986.32 | 1051.59 | 0.007 | 0.008 | 0.009 | −0.469 | 0.008 | |
| 2400–2500 | 117,329.61 | 1419.26 | 1629.11 | 1747.50 | 0.012 | 0.014 | 0.015 | 0.016 | 0.013 | |
| 2300–2400 | 105,098.18 | 1478.2 | 1957.00 | 2295.99 | 0.014 | 0.019 | 0.022 | 0.167 | 0.015 | |
| 2200–2300 | 2074.14 | 0 | 0 | 0 | 0 | 0 | 0 | −0.469 * | 0 | |
| Precipitation (mm) | 2400–2800 | 5012.81 | 35.06 | 35.06 | 35.06 | 0.007 | 0.007 | 0.007 | −0.532 | 0.008 |
| 2000–2400 | 10,286.57 | 132.26 | 132.26 | 131.62 | 0.013 | 0.013 | 0.013 | 0.077 | 0.014 | |
| 1600–2000 | 20,541.19 | 430.63 | 506.08 | 531.68 | 0.021 | 0.025 | 0.026 | 0.566 | 0.023 | |
| 1400–1600 | 66,379.08 | 550.95 | 769.49 | 916.67 | 0.008 | 0.012 | 0.014 | −0.36 | 0.009 | |
| 1200–1400 | 132,983.26 | 1623.23 | 2009.96 | 2402.33 | 0.012 | 0.015 | 0.018 | 0.025 | 0.013 | |
| 1000–1200 | 90,577.8 | 945.34 | 1115.63 | 1311.52 | 0.01 | 0.012 | 0.014 | −0.131 | 0.011 | |
| 800–1000 | 130,193.4 | 1226.4 | 1474.78 | 1642.62 | 0.009 | 0.011 | 0.013 | −0.234 | 0.01 | |
| 700–800 | 39,288.9 | 677.81 | 804.97 | 1048.72 | 0.017 | 0.020 | 0.027 | 0.371 | 0.019 | |
| 600–700 | 7015.34 | 356.24 | 411.57 | 567.34 | 0.051 | 0.059 | 0.081 | 1,451 | 0.056 | |
| Slope (%) | 40–45 | 175 | 0 | 0 | 0 | 0 | 0 | 0 | −0.967 * | 0 |
| 35–40 | 874.97 | 0 | 0 | 0 | 0 | 0 | 0 | −0.967 * | 0 | |
| 30–35 | 2670.4 | 1.35 | 1.35 | 1.35 | 0.001 | 0.001 | 0.001 | −3159 | 0.001 | |
| 25–30 | 7100.77 | 33.55 | 33.55 | 33.55 | 0.005 | 0.005 | 0.005 | −0.924 | 0.005 | |
| 20–25 | 16,322.43 | 61.62 | 73.16 | 72.73 | 0.004 | 0.004 | 0.004 | −1148 | 0.004 | |
| 15–20 | 37,573.66 | 264.08 | 276.15 | 290.43 | 0.007 | 0.007 | 0.008 | −0.527 | 0.008 | |
| 10–15 | 79,761.58 | 360.91 | 421.9 | 439.29 | 0.005 | 0.005 | 0.006 | −0.967 | 0.005 | |
| 5–10 | 156,451.83 | 1267.97 | 1596.84 | 1863.89 | 0.008 | 0.010 | 0.012 | −0.384 | 0.009 | |
| 0–5 | 201,347.71 | 3988.44 | 4856.85 | 5886.32 | 0.020 | 0.024 | 0.029 | 0.509 | 0.022 | |
| Soil | Humic Cambisols | 110,548.72 | 708.37 | 800.85 | 819.07 | 0.006 | 0.007 | 0.007 | −0.619 | 0.007 |
| Rankers | 12,992.15 | 31.48 | 31.48 | 31.48 | 0.002 | 0.002 | 0.002 | −1592 | 0.003 | |
| Dystric Cambisols | 48,878.67 | 581.17 | 829.4 | 1067.76 | 0.012 | 0.017 | 0.022 | −0.001 | 0.013 | |
| Dystric Fluvisols | 3017.1 | 6.39 | 6.39 | 6.39 | 0.002 | 0.002 | 0.002 | −1726 | 0.002 | |
| Eutric Lithosol | 187,479.93 | 1475.36 | 1776.12 | 2140.97 | 0.008 | 0.009 | 0.011 | −0.414 | 0.009 | |
| Calcic Cambisols | 8275.49 | 77.74 | 86.98 | 86.98 | 0.009 | 0.011 | 0.011 | −0.237 | 0.01 | |
| Calcic Luvisols | 34,032.09 | 1300.16 | 1509.65 | 1793.44 | 0.038 | 0.044 | 0.053 | 1166 | 0.042 | |
| Hortic Luvisols | 40,991.55 | 320.14 | 376.3 | 421.69 | 0.008 | 0.009 | 0.010 | −0.421 | 0.009 | |
| Calcic-chromic Cambisols | 13,019.96 | 169.54 | 215.53 | 215.55 | 0.013 | 0.017 | 0.017 | 0.09 | 0.014 | |
| Eutric Cambisols | 30,585.64 | 1213.24 | 1512.2 | 1792.56 | 0.04 | 0.049 | 0.059 | 1204 | 0.044 | |
| Chromic Cambisols | 6065.93 | 80.23 | 100.8 | 197.57 | 0.013 | 0.017 | 0.033 | 0.106 | 0.015 | |
| Hortic Podzols | 6390.79 | 13.8 | 13.77 | 13.77 | 0.002 | 0.002 | 0.002 | −1707 | 0.002 | |
| Eutric Fluvisols | 0.33 | 0.3 | 0.33 | 0.33 | 0.909 | 1.000 | 1.000 | 4336 | 1000 | |
| Temperature (°C) | 16.0–17.5 | 83,699.31 | 2360.49 | 2918.1 | 3851.4 | 0.028 | 0.035 | 0.046 | 0.863 | 0.031 |
| 15.0–16.0 | 60,518.29 | 819.04 | 918.61 | 929.71 | 0.014 | 0.015 | 0.015 | 0.129 | 0.015 | |
| 12.5–15.0 | 135,430.82 | 977.72 | 1250.24 | 1320.63 | 0.007 | 0.009 | 0.010 | −0.5 | 0.008 | |
| 10.0–12.5 | 135,296.25 | 814.51 | 994.85 | 1122.5 | 0.006 | 0.007 | 0.008 | −0.682 | 0.007 | |
| 7.5–10.0 | 72,973.84 | 935.96 | 1094.53 | 1279.85 | 0.013 | 0.015 | 0.018 | 0.075 | 0.014 | |
| <7.5 | 14,359.84 | 70.2 | 83.47 | 83.47 | 0.005 | 0.006 | 0.006 | −0.89 | 0.005 | |
| DWBW (km) | 5–6 | 135.23 | 1.26 | 11.52 | 11.52 | 0.009 | 0.085 | 0.085 | −0.245 | 0.01 |
| 4–5 | 2872.22 | 140.47 | 226.48 | 236.48 | 0.049 | 0.079 | 0.082 | 1413 | 0.054 | |
| 3–4 | 24,827.85 | 458.91 | 563.72 | 676.75 | 0.018 | 0.023 | 0.027 | 0.44 | 0.02 | |
| 2–3 | 80,622.99 | 1053.36 | 1258.36 | 1404.17 | 0.013 | 0.016 | 0.017 | 0.093 | 0.014 | |
| 1–2 | 154,963.46 | 1443.75 | 1803.56 | 2327.76 | 0.009 | 0.012 | 0.015 | −0.245 | 0.01 | |
| 0–1 | 238,856.6 | 2880.17 | 3396.16 | 3930.88 | 0.012 | 0.014 | 0.016 | 0.013 | 0.013 | |
| TWI | >25 | 910.24 | 12.52 | 10.48 | 10.43 | 0.014 | 0.012 | 0.011 | 0.145 | 0.015 |
| 20–25 | 2612.17 | 43.22 | 47.5 | 53.52 | 0.017 | 0.018 | 0.020 | 0.33 | 0.018 | |
| 15–20 | 18,209.96 | 297.73 | 348.24 | 401.76 | 0.016 | 0.019 | 0.022 | 0.318 | 0.018 | |
| 10–15 | 174,288.6 | 3317.83 | 4030.44 | 4772.98 | 0.019 | 0.023 | 0.027 | 0.47 | 0.021 | |
| 5–10 | 306,257.38 | 2306.62 | 2818.86 | 3342.93 | 0.008 | 0.009 | 0.011 | −0.457 | 0.008 |
| Description | IV | FG | ||||
|---|---|---|---|---|---|---|
| S (A) | S (B) | S (C) | S (A) | S (B) | S (C) | |
| Min. | −8.89 | −8.89 | −4.49 | 0 | 0 | 0.0014 |
| Max. | 3.34 | 4.25 | 10.41 | 0.0051 | 0.0067 | 0.0082 |
| Mean | −2.58 | −1.67 | 1.88 | 0.0020 | 0.0023 | 0.0041 |
| Std. Dev. | 1.84 | 1.98 | 1.86 | 0.0007 | 0.0008 | 0.0011 |
| Variables | S (A) | S (B) | S (C) | |||
|---|---|---|---|---|---|---|
| Aspect | 59.9 | 1.0 | 54.2 | 0.9 | 54.5 | 3.8 |
| Hillshade | 72.5 | 1.1 | 91.1 | 1.0 | 94.6 | 3.4 |
| Humidity | 98.5 | 1.5 | 67.5 | 0.9 | 44.8 | 5.0 |
| Insolation | 84.4 | 1.5 | 65.0 | 1.3 | 36.8 | 6.5 |
| Precipitation | 44.1 | 2.2 | 48.0 | 1.0 | 56.4 | 5.7 |
| Slope | 77.8 | 0.9 | 69.4 | 1.2 | 87.2 | 3.4 |
| Soil | 30.2 | 1.2 | 69.3 | 3.5 | 81.3 | 3.9 |
| Temperature | 47.3 | 1.6 | 86.7 | 0.8 | 74.7 | 3.6 |
| DWBW | 26.9 | 1.3 | 54.7 | 0.8 | 67.9 | 3.9 |
| TWI | 45.0 | 1.0 | 64.2 | 1.2 | 70.4 | 4.0 |
© 2016 by the authors; licensee MDPI, Basel, Switzerland. This article is an open access article distributed under the terms and conditions of the Creative Commons Attribution (CC-BY) license (http://creativecommons.org/licenses/by/4.0/).
Share and Cite
Meneses, B.M.; Reis, E.; Vale, M.J.; Reis, R. Modeling the Probability of Surface Artificialization in Zêzere Watershed (Portugal) Using Environmental Data. Water 2016, 8, 289. https://doi.org/10.3390/w8070289
Meneses BM, Reis E, Vale MJ, Reis R. Modeling the Probability of Surface Artificialization in Zêzere Watershed (Portugal) Using Environmental Data. Water. 2016; 8(7):289. https://doi.org/10.3390/w8070289
Chicago/Turabian StyleMeneses, Bruno M., Eusébio Reis, Maria J. Vale, and Rui Reis. 2016. "Modeling the Probability of Surface Artificialization in Zêzere Watershed (Portugal) Using Environmental Data" Water 8, no. 7: 289. https://doi.org/10.3390/w8070289