Article

Simulation and Validation of Cisco Lethal Conditions in Minnesota Lakes under Past and Future Climate Scenarios Using Constant Survival Limits

Department of Civil Engineering, Auburn University, Auburn, AL 36849-5337, USA
*
Author to whom correspondence should be addressed.
Water 2016, 8(7), 279; https://doi.org/10.3390/w8070279
Submission received: 9 May 2016 / Revised: 21 June 2016 / Accepted: 29 June 2016 / Published: 7 July 2016
(This article belongs to the Special Issue Climate Change Effects on Freshwater Organisms and Ecosystems)

Abstract

:
Fish habitat in lakes is strongly constrained by water temperature (T) and available dissolved oxygen (DO) that are changed under climate warming. A one dimensional, dynamic water quality model MINLAKE2012 was used for T and DO simulation over 48 years. A fish habitat model FishHabitat2013 using simulated T and DO profiles as input was developed to determine lethal conditions of cisco Corgenous artedi in Minnesota lakes. Twenty-three lakes that had observations of cisco mortality or survival in the unusually warm summer of 2006 were used for model validation. The cisco habitat model used a lethal temperature of 22.1 °C and DO survival limit of 3 mg/L determined through model validation and sensitivity analysis. Cisco lethal conditions in 12 shallow, 16 medium-depth, and 30 deep virtual lakes were then simulated. Isopleths of total number of years with cisco kill and average cisco kill days for the years with kills under past (1961–2008) and future climate were generated to understand/extrapolate climate impacts on cisco in 620 Minnesota lakes. Shallow and medium-depth lakes are projected to not be good candidates for cisco refuge lakes, but deep lakes are possible cisco refuge lakes based on lethal condition projection under future warmer climate.

1. Introduction

Fish growth and survival in lakes are constrained by several environmental factors such as water temperature (T), available dissolved oxygen (DO), food supply, and human interference. In this study, T and DO, the two most significant water quality parameters affecting survival of fishes in lakes [1,2,3,4,5,6], were simulated using a one-dimensional lake water quality model MINLAKE2012 and were used to simulate/project cold-water fish survival and lethal conditions in 620 cisco lakes in Minnesota under past climate conditions (1961–2008) and one future climate scenario. An increase of atmospheric CO2 and/or other greenhouse gases is projected to cause climate changes and climate warming [7,8], which in turn is projected to warm the water and increase hypolimnetic oxygen depletion during summer stratification in lakes [9,10,11]. Therefore, projected changes of T and DO characteristics due to climate warming have the potential to reduce cold-water fish habitat or result in fish kill in lakes [12,13,14].
Cisco Coregonus artedi is the most common cold-water stenothermal fish in Minnesota lakes, and the Minnesota (MN) Department of Natural Resources (DNR) has sampled cisco from 648 lakes in netting assessments since 1946 (MN DNR files). Cisco also exists in lakes over other northern states, e.g., Wisconsin and Michigan. The combination of a wide geographic distribution in northern Minnesota [15] and a requirement for cold, oxygenated water [4,16,17] makes cisco a sensitive indicator of ecological stresses caused by climate warming. For example, eighteen lakes (Table 1) in north-central Minnesota experienced cisco mortality in the unusually warm summer of 2006 [4]. Ciscoes have been declining in recent years in Minnesota lakes, likely because of climate warming [15]. Sharma et al. [18] projected that about 30%–70% of the cisco population in about 170 of Wisconsin’s deepest and coldest lakes could disappear by 2100. Therefore, the study of survival conditions of cisco in lakes under past and future climate conditions will give natural resource managers information on climate change effects on freshwater organisms and ecosystems.
The goal of the study was to first validate cisco survival and lethal conditions in 23 Minnesota lakes (Table 1) under 2006 weather conditions and then simulate daily T and DO profiles in 58 virtual lakes (Table 2) [20] to project/extrapolate long-term cisco survival and potential lethal conditions in 620 cisco lakes in Minnesota under a future climate scenario. The physiological response of adult populations of different fish species to T and DO levels has been the subject of numerous laboratory and field studies, e.g., by Coutant [21], McCormick et al. [22], Hokanson et al. [23], Eaton et al. [24]. These studies correlated fish survival, growth, reproduction and other responses to chronic levels of T and DO exposure. The oxythermal habitat approach commonly used in cold-water fish niche modeling [25], defines an upper boundary for T and a lower boundary for DO, which are lethal temperature (LT) and DO survival limit (DOLethal). These oxythermal habitat models determine the water volume or layer thickness in a stratified lake between the upper temperature and lower DO bounds that represent either optimal thermal habitat [25] or non-lethal/useable habitat [26]. The “uninhabitable spaces” or “lethal conditions” for a fish species in a lake are where temperature is above and/or DO is below the survival limits [26]. Simulations of oxythermal habitat changes for three fish guilds, i.e., cold-water, cool-water, and warm-water, in response to projected climate warming were conducted in small lakes (up to 10 km2 surface area) in Minnesota [13] and in the contiguous USA [14,26]. This study uses the oxythermal habitat approach to simulate and validate the lethal conditions and fish kill in summer for a cold-water fish species–cisco Coregonus artedi in 620 Minnesota lakes.
The processes of pursuing the objective include: (1) validate the FishHabitat2013 model using simulated T and DO profiles given by MINLAKE2012 and cisco mortality or survival data (observations) in 23 Minnesota lakes during an unusually warm summer of 2006; (2) select/develop 58 virtual lakes (12 shallow, 16 medium-depth, and 30 deep), which could represent 620 cisco lakes in Minnesota; (3) perform long-term oxythermal fish habitat modeling in 58 virtual lakes using simulated T and DO profiles, then develop contour plots of total number of years with cisco kill and average cisco lethal days for the years with cisco kill under past climate conditions (1961–2008) and a future climate scenario (MIROC 3.2) for 58 virtual lakes; and (4) qualitatively analyze the cisco mortality possibility by marking the 620 Minnesota lakes on contour plots generated from oxythermal habitat results in 58 virtual lakes.

2. Materials and Methods

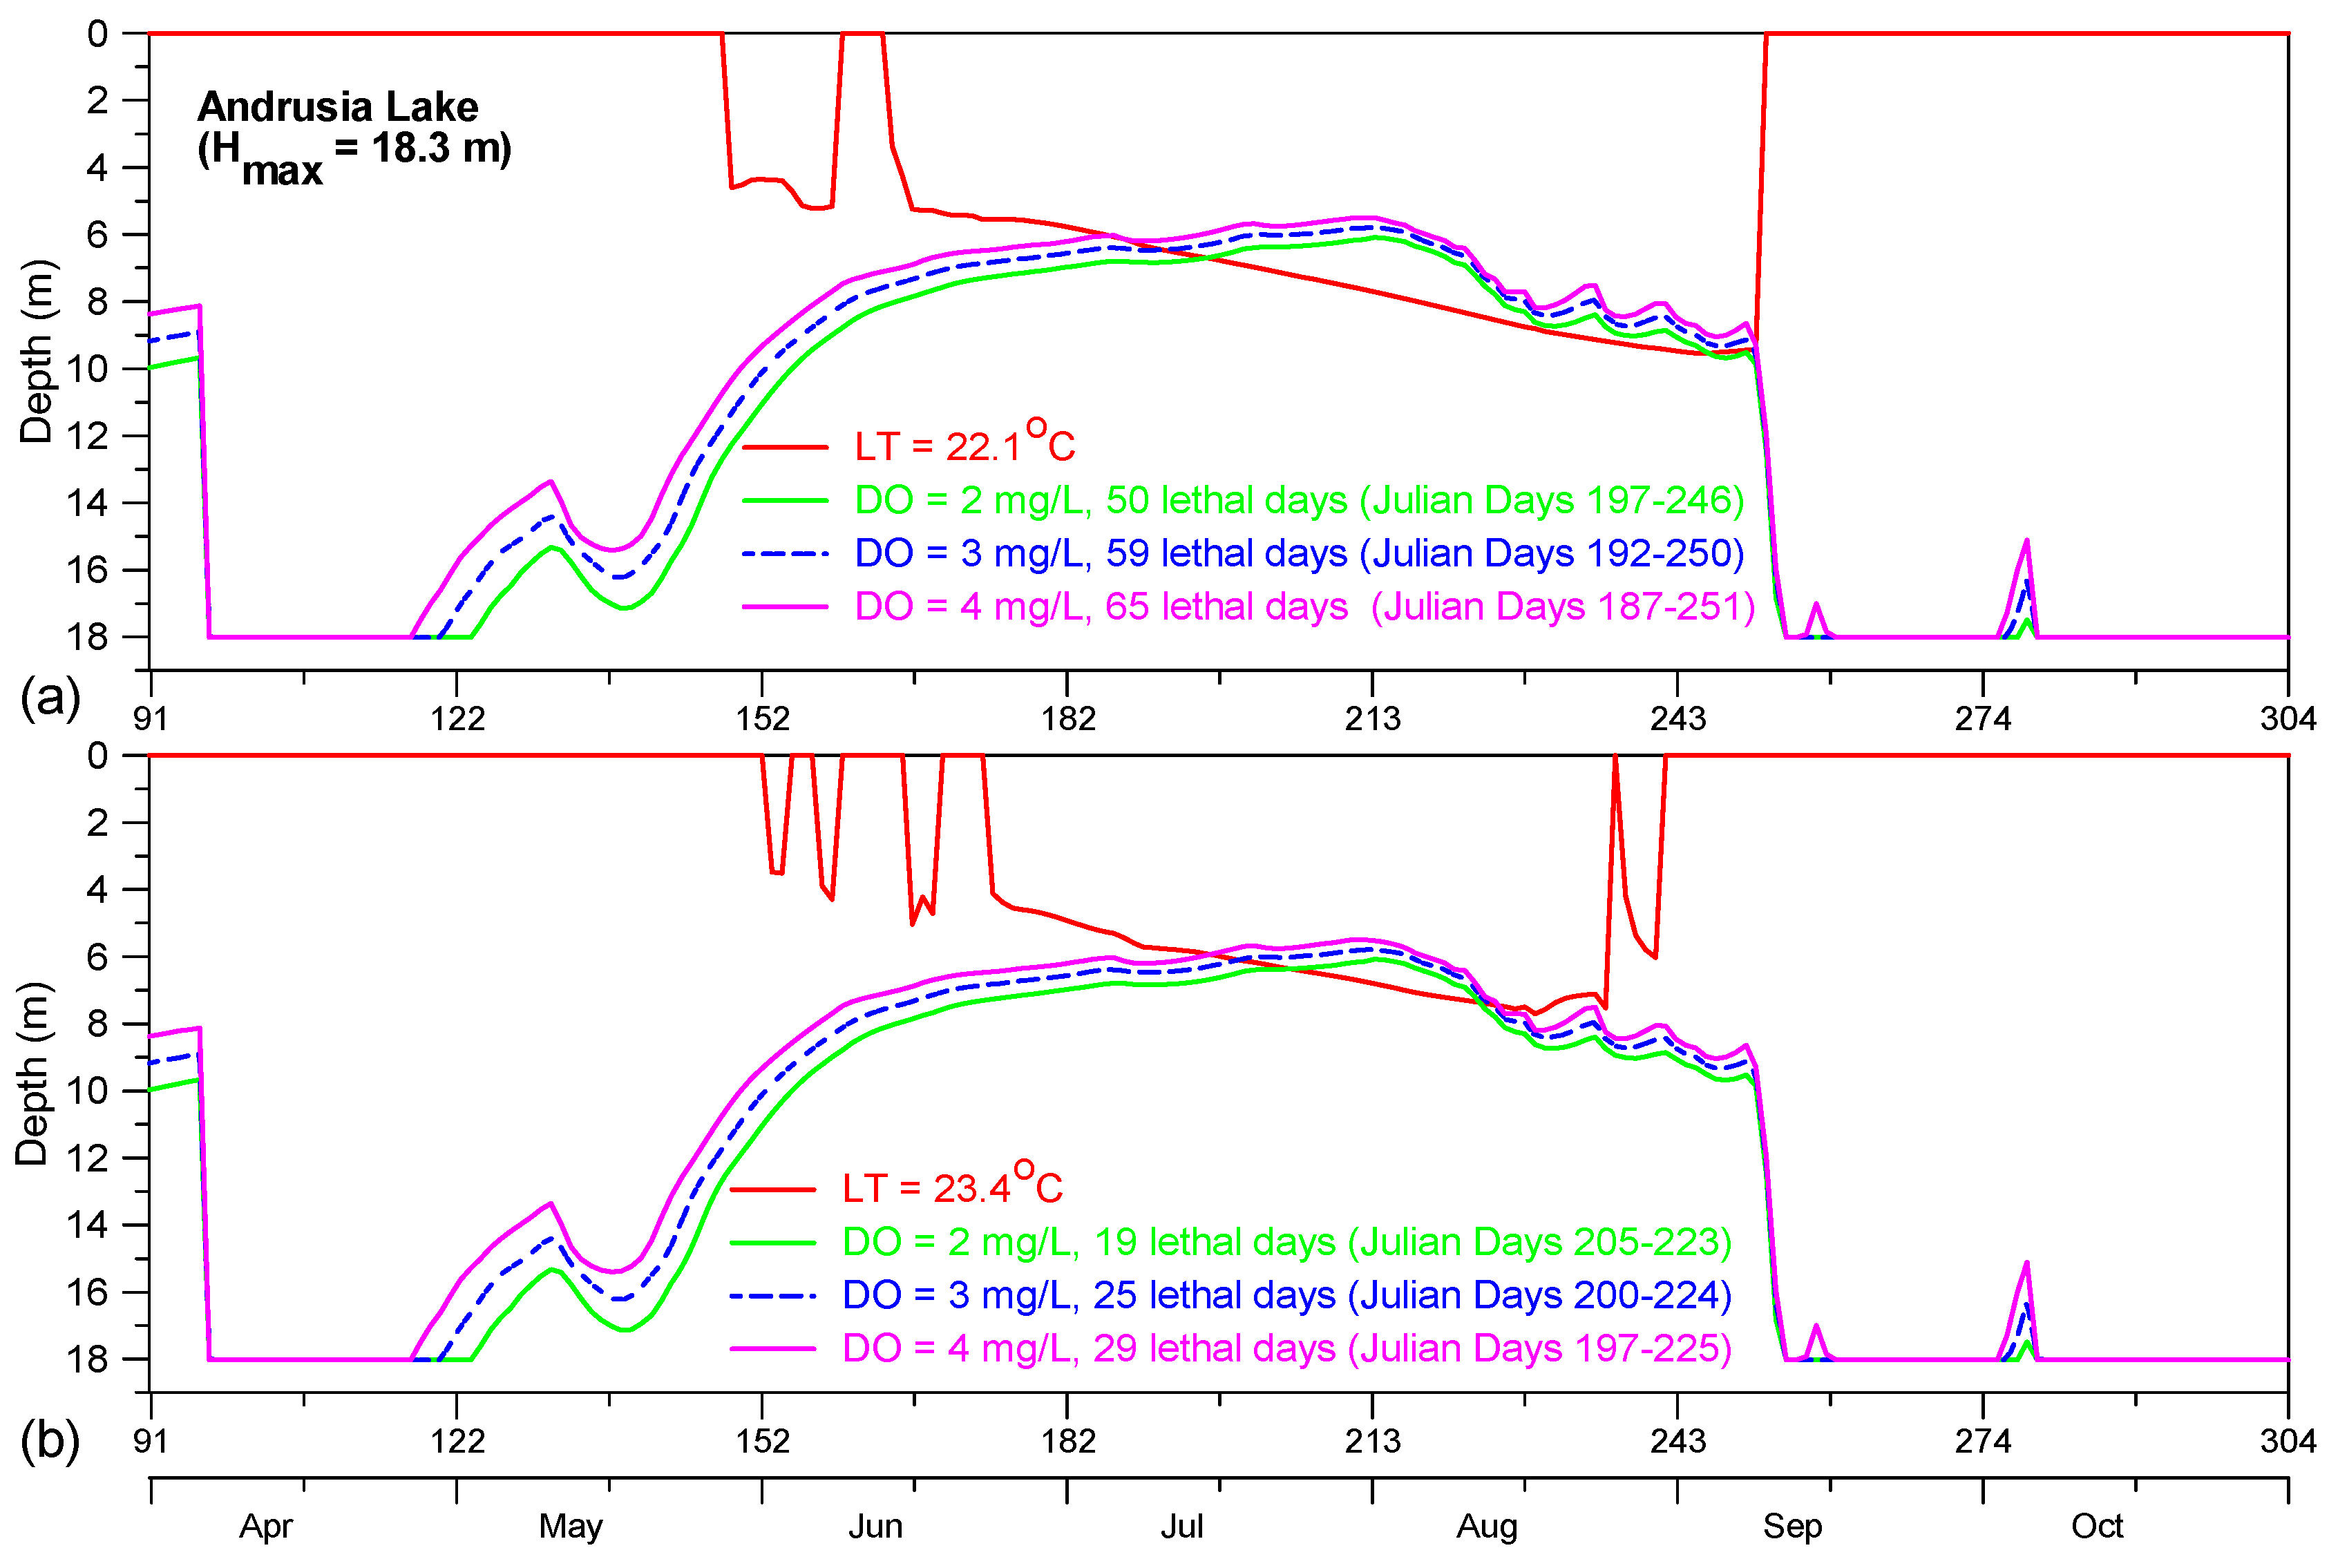
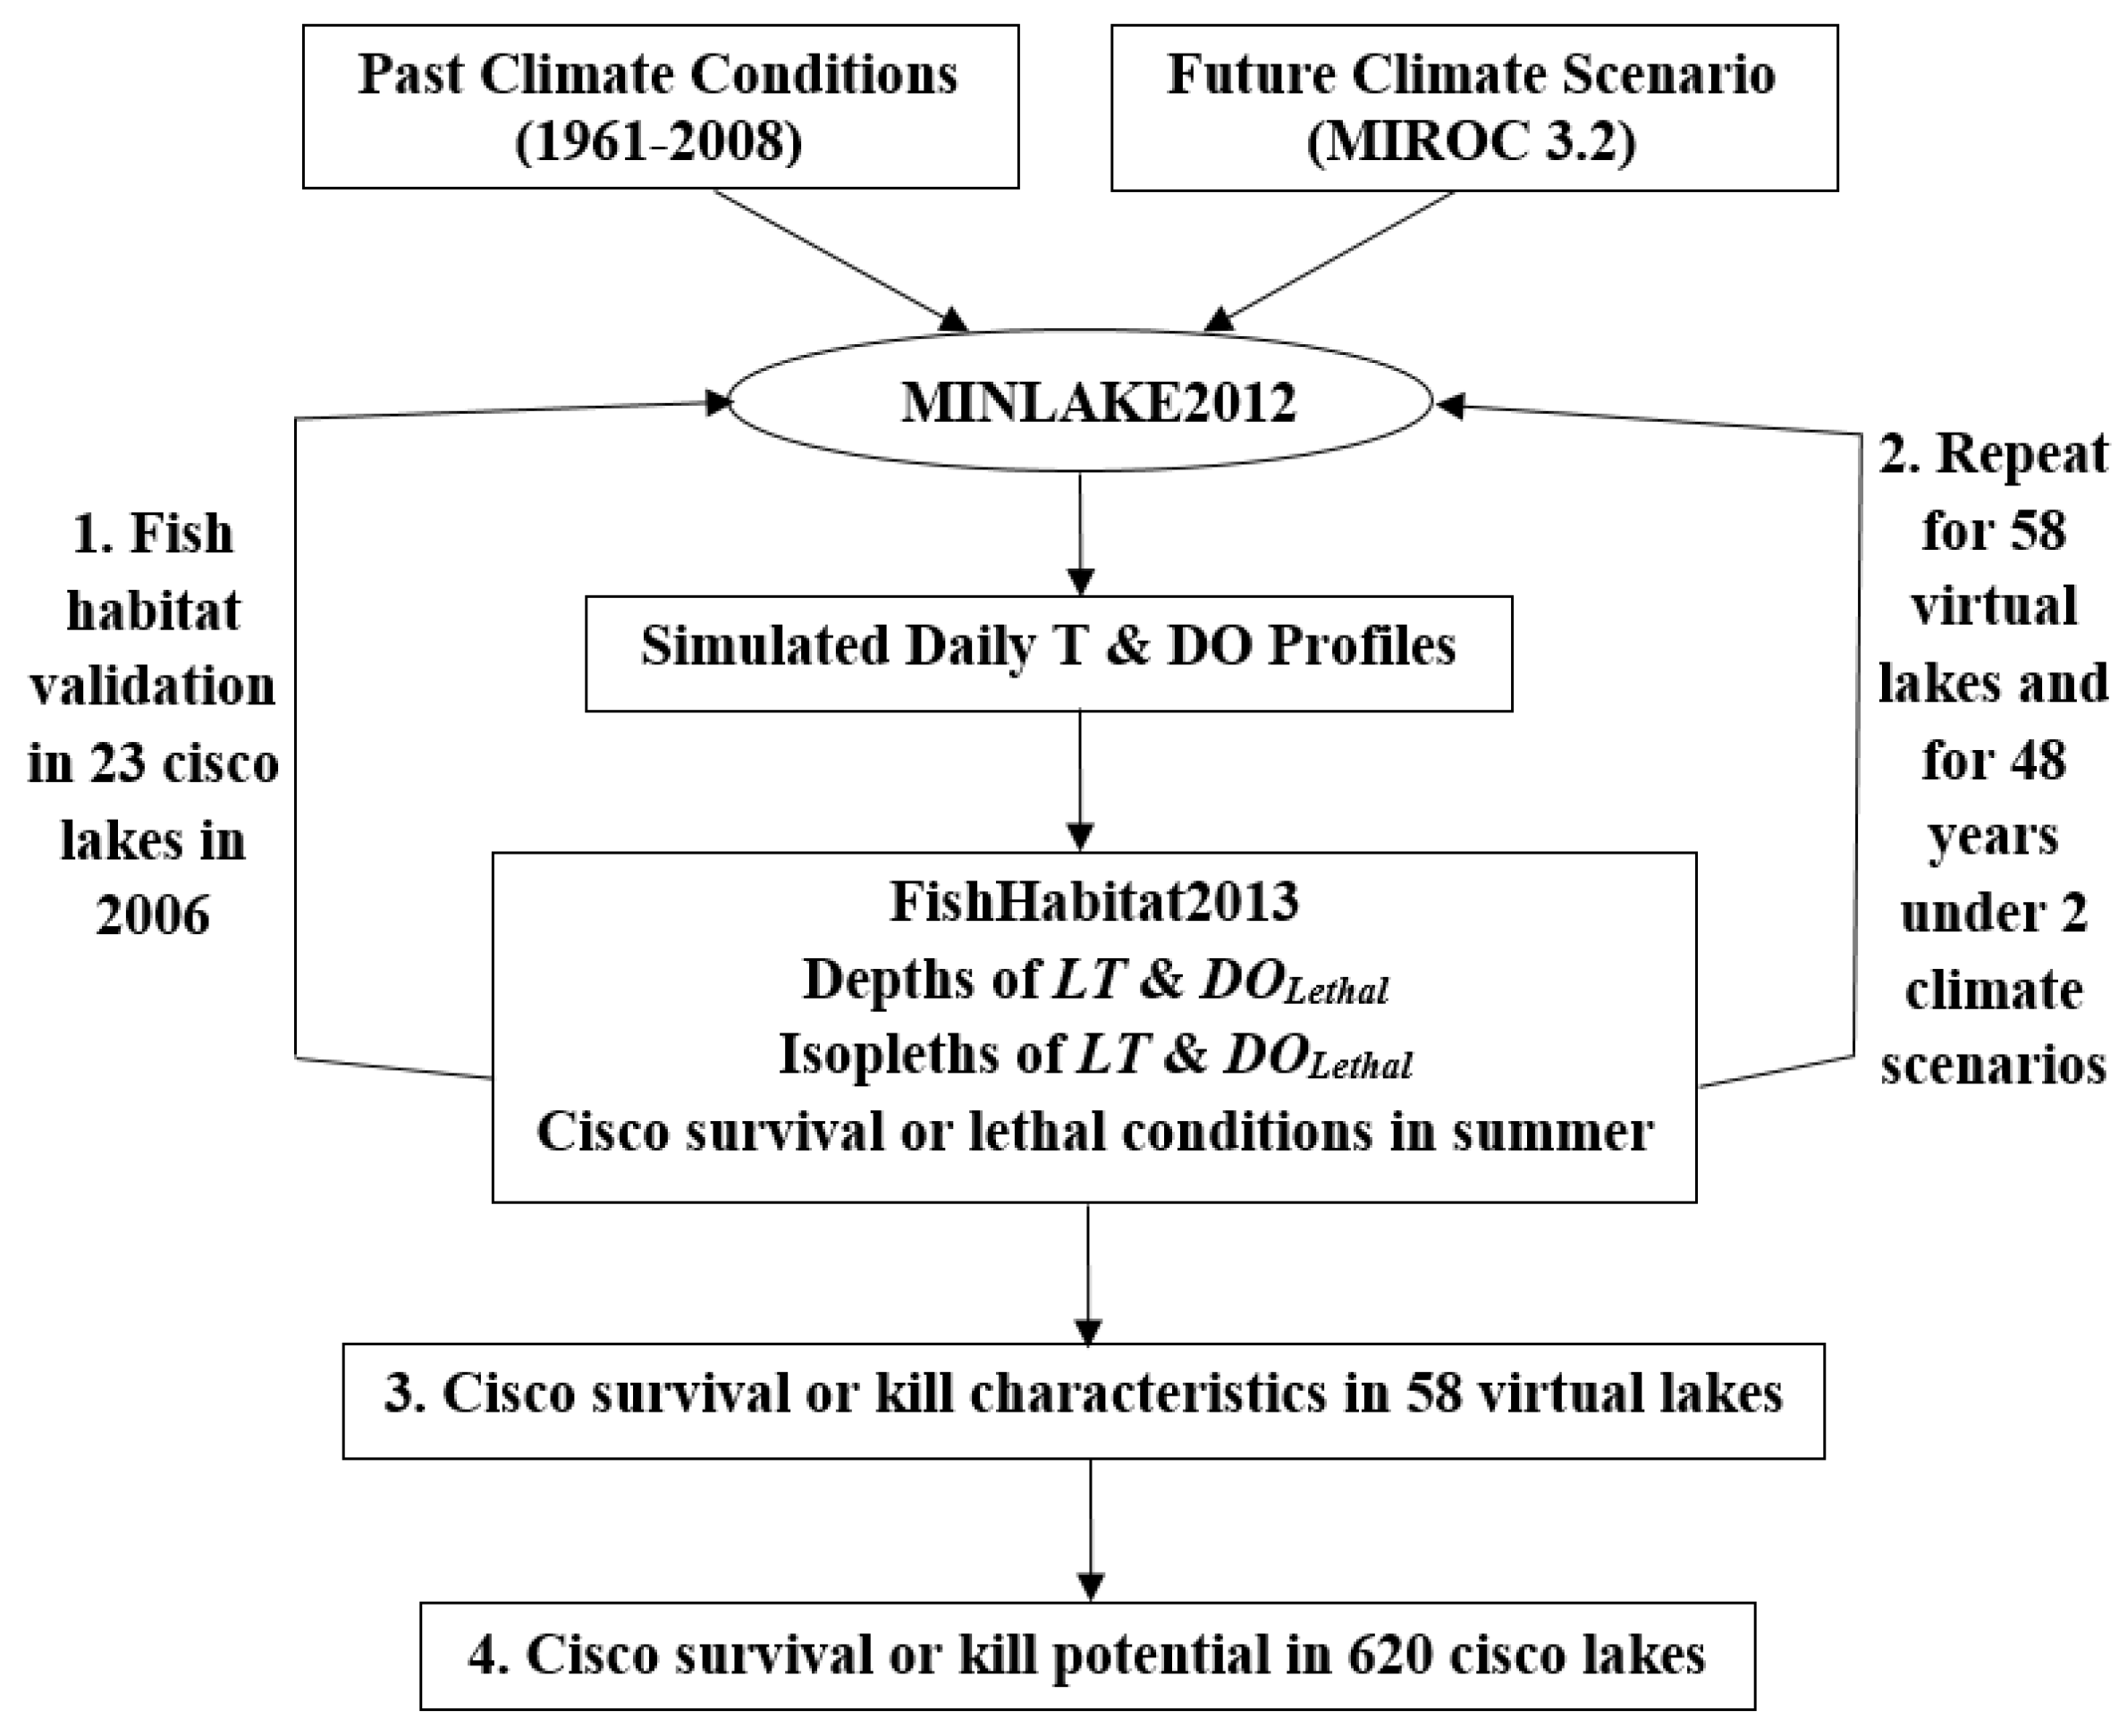
2.1. Simulation and Validation of Cisco Survival or Lethal Conditions Using Constant Survival Limits

Cisco habitat survival and lethal conditions were determined using LT, DOLethal, simulated daily T and DO profiles in lakes as model inputs; a method similar to the approach used by Christie and Regier [3] and Fang et al. [14]. FishHabitat2013 has two basic and key model parameters: LT and DOLethal that are kept as constants in all simulation years under past and future climate scenarios; therefore, they are constant survival limits. The fish kill in summer or summerkill is defined as lethal conditions over the entire depth of a lake for 3 continuous days or more during the summer [26].
Depths where simulated daily temperature and DO are equal to LT and DOLethal are determined day by day in each lake from simulated vertical T and DO profiles. Isopleths of LT and DOLethal on a depth versus time plot are then developed and used to determine whether, when, and how many days cisco lethal conditions can occur in a particular lake in each simulation year, and an example plot is shown in Figure 1 for Lake Andrusia in Minnesota. Simulated T and DO profiles were not averaged during the simulation period as was done in previous studies [13,14]. When isopleths of LT and DOLethal for cisco intersect in a particular day, the entire depth of a stratified lake is under lethal conditions on that day. The lethal conditions occur because water temperature is higher than LT from the water surface to or below the intersecting depth and DO is lower than DOLethal from the lake bottom to or above the intersecting depth. When the maximum daily water temperature is lower than the LT, the depth of LT is set to zero (water surface) in Figure 1. Therefore, DOLethal becomes the only lethal criteria during the winter ice-cover period, early spring and later fall, but this study only deals with lethal conditions of cisco during the summer months and Figure 1 shows cisco habitat and lethal condition results from 1 April to 31 October (Julian Days 91 to 304).
In previous studies, LT for each fish species was determined from laboratory, e.g., 22.1 °C for Brook Trout and 26.6 °C for Brown Trout [13]. Eaton et al. [24] updated the LT values for cold-water fish species that ranged from 19.8 °C (Chum salmon) to 24.1 °C (Brown Trout) with guild mean of 22.9 °C based on field temperature and fish observations. The LT and DOLethal for cisco were not well studied in the laboratory by any researcher previously. They were determined through model validation of cisco mortality or survival conditions occurred in the unusually warm summer of 2006 in 23 Minnesota lakes. Adult cisco mortality was reported by Jacobson et al. [4] in 18 of the 23 cisco lakes in Minnesota (Table 1 and Figure 2). Cisco mortality happened from mid-July to early August in 2006 [4]. Additional five lakes without cisco mortality in 2006 were also studied by Jacobson et al. [4]; these five lakes were called “reference” lakes by them and in this study. Temperature and DO profiles in 23 lakes were collected shortly after occurrences of adult cisco mortality in 17 lakes (no profile measurement in Mille Lacs Lake) by MN DNR to study LT and DOLethal. These 23 cisco lakes are located in north central Minnesota (Figure 2). The surface areas (As) and maximum depths (Hmax) of the 23 Minnesota lakes ranged from 1.02 to 518.29 km2, and 8.53 to 63.4 m [4], respectively. Based on lake classes developed for Minnesota lakes [13], 12 of the 23 cisco lakes are classified as medium-depth lake as 5 m ≤ Hmax < 20 m (Figure 3a), and remaining 11 lakes are deep lakes as Hmax > 20 m (Figure 3b).
The LT is the water temperature at which fish cannot be acclimated without causing death. The LT = 23.4 °C [24] used for the cold-water fish guild in previous studies [14,26] was the mean value of LT values for ten cold-water fish species (pink salmon, sockeye salmon, chinook salmon, chum salmon, coho salmon, brown trout, rainbow trout, brook trout, lake trout, and mountain whitefish). Jacobson et al. [4] developed a lethal oxythermal niche boundary curve (equation) for adult cisco. The curve mapped the temperatures and DO concentrations from the profiles measured in 17 Minnesota lakes (Table 1) that experienced cisco mortality in July and August 2006. From the niche boundary curve [4], the lethal temperature of adult cisco is 22.6 °C at 4.0 mg/L, 22.1 °C at 3.0 mg/L, and 21.2 °C at 2.0 mg/L of DO.
The DO concentration of 3.0 mg/L requirement for the cold-water fish guild, below which mortality is more likely to occur or growth is impaired [27], was developed from an available US EPA database [28]. Jacobson et al. [29] proposed a single oxythermal variable TDO3, and TDO3 is defined as the water temperature at 3 mg/L of DO. The 3 mg/L was selected as a benchmark oxygen concentration that is probably lethal or nearly so for many cold-water species [17]. Several benchmark DO concentrations (2, 3, 4, and 5 mg/L) were considered by Jacobson et al. [29] and they were highly correlated as will be demonstrated later.
Before appropriate LT and DO limits for adult cisco were determined in this study, a sensitivity analysis using 22.1 °C and 23.4 °C as LT and 2, 3, and 4 mg/L as DO survival limit was performed. The combinations of two LTs and three DO limits result in six constant LT-DO criteria for the FishHabitat2013 model. The final LT-DO criteria, LT = 22.1 °C and DO = 3 mg/L, was chosen according to fish habitat model validation based on the cisco mortality field data in 2006, discussed and given in the Section 3.2.

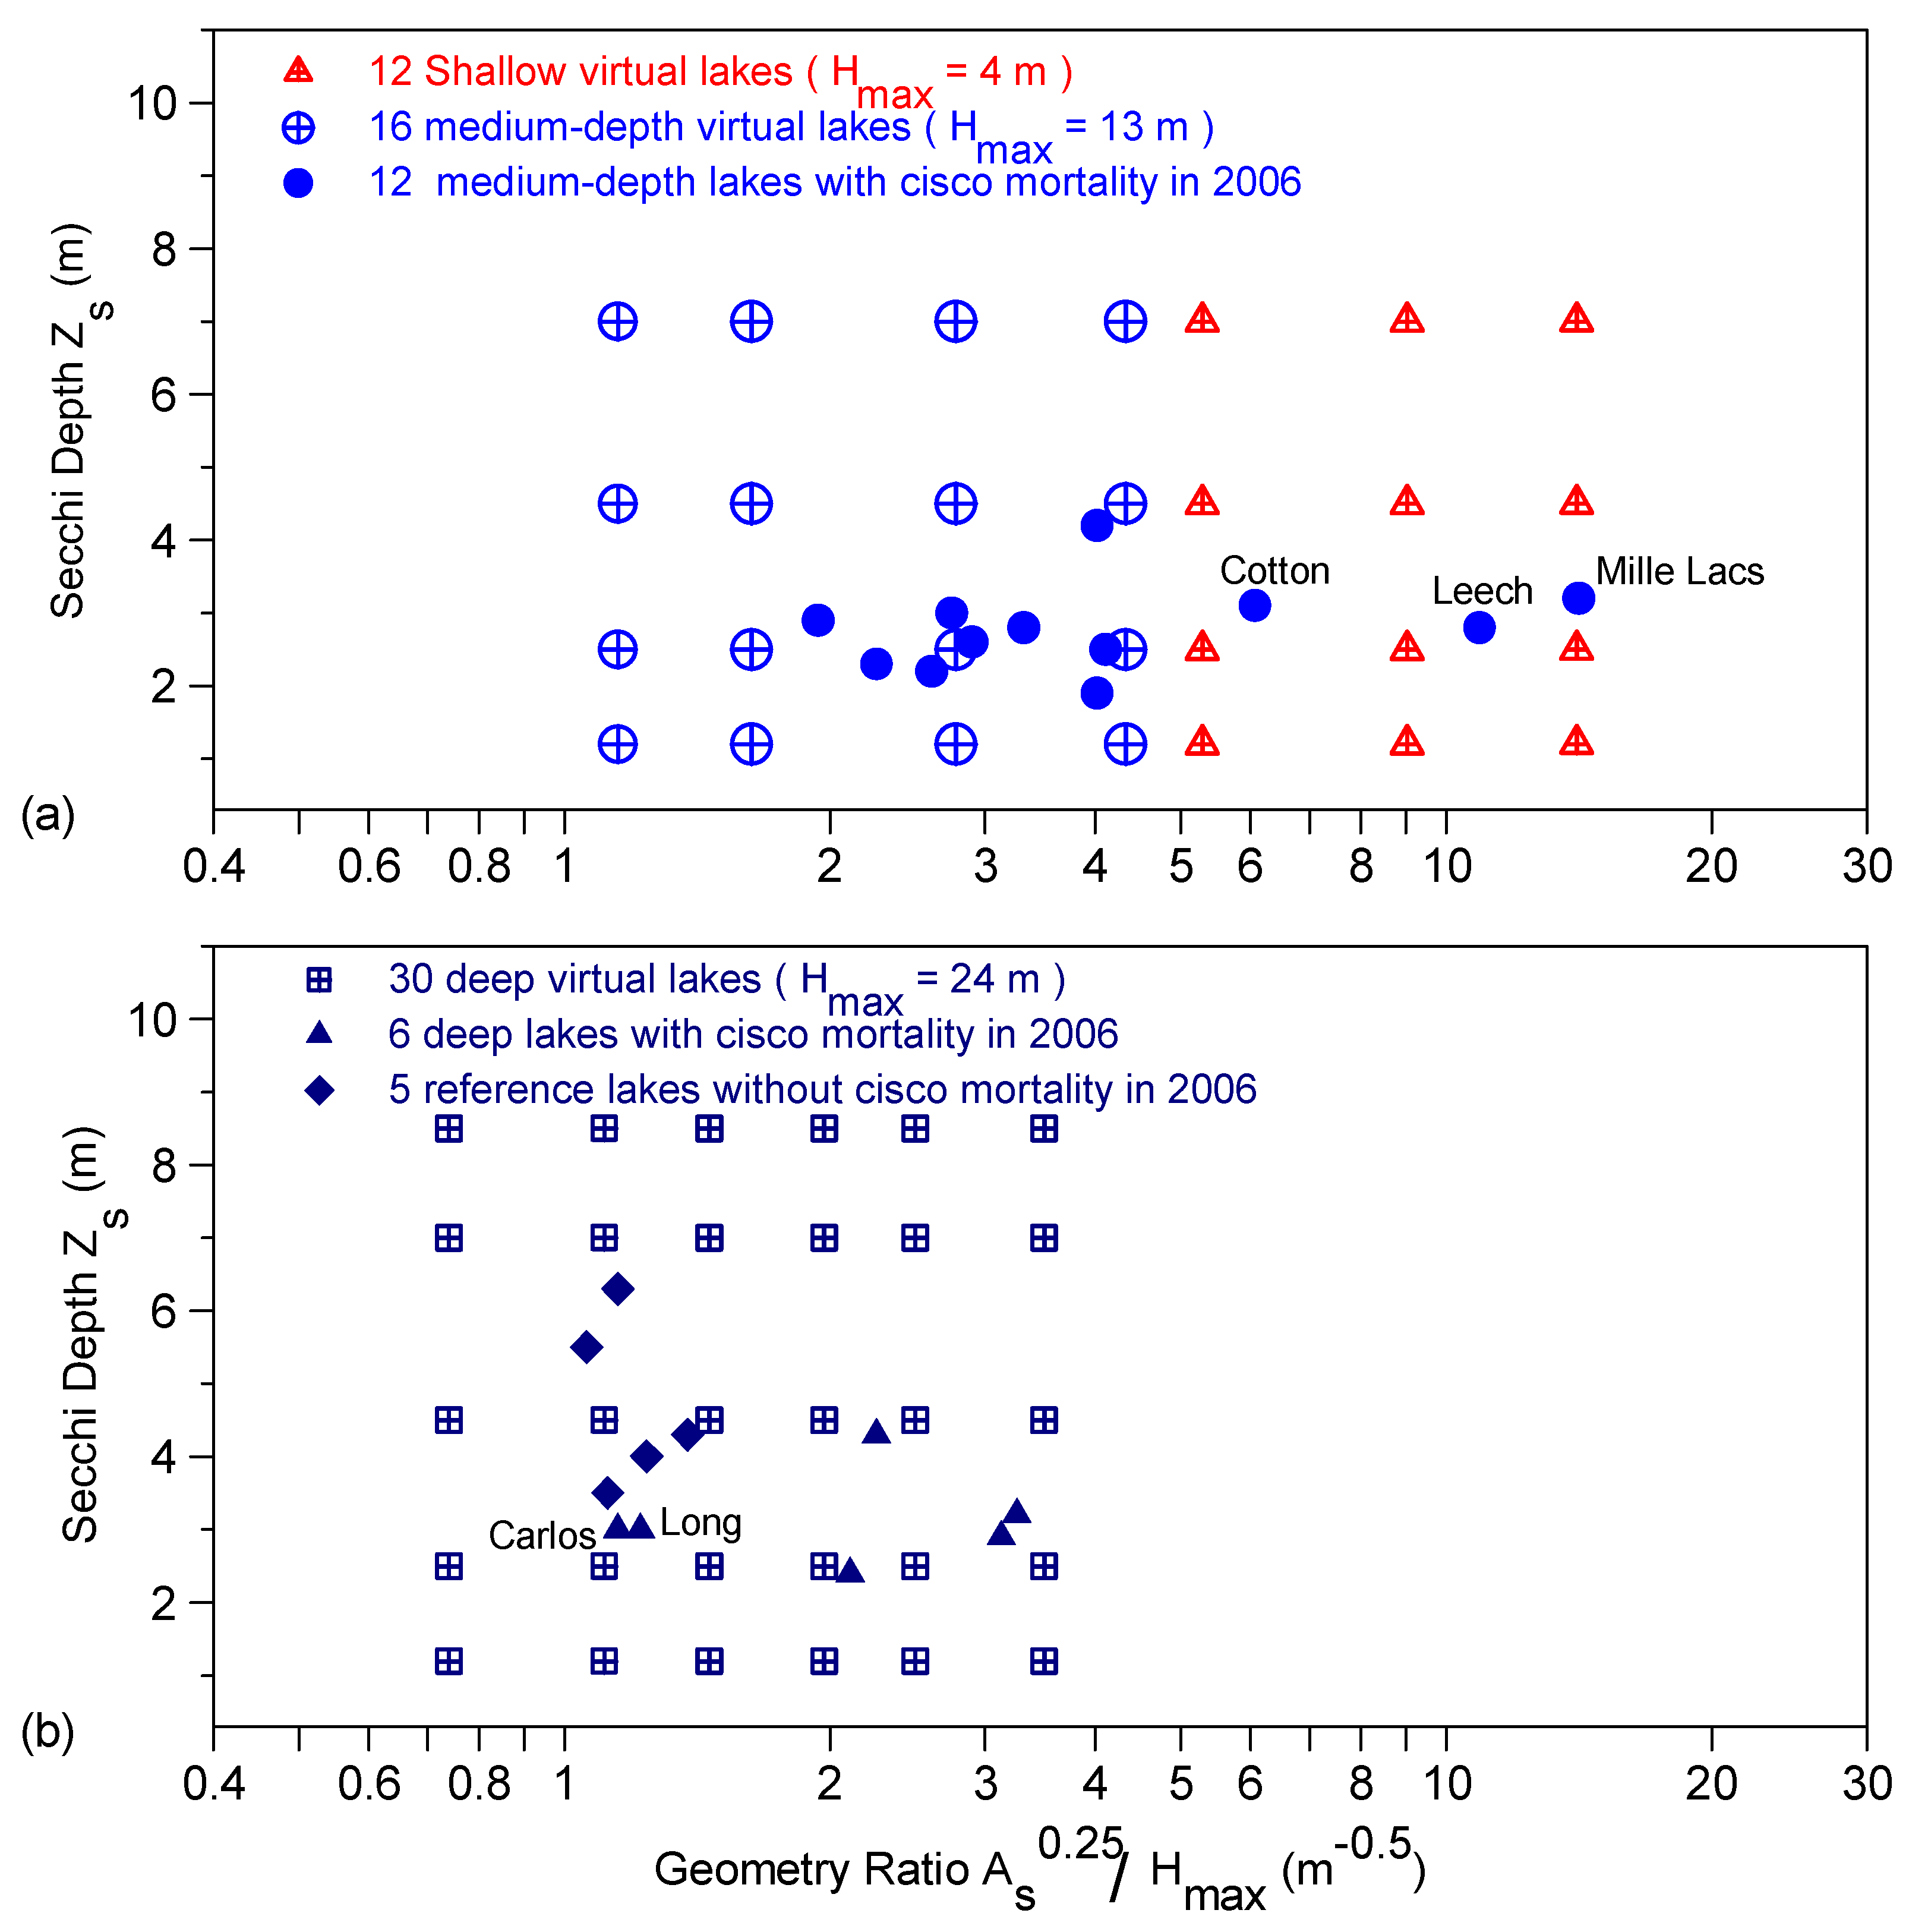
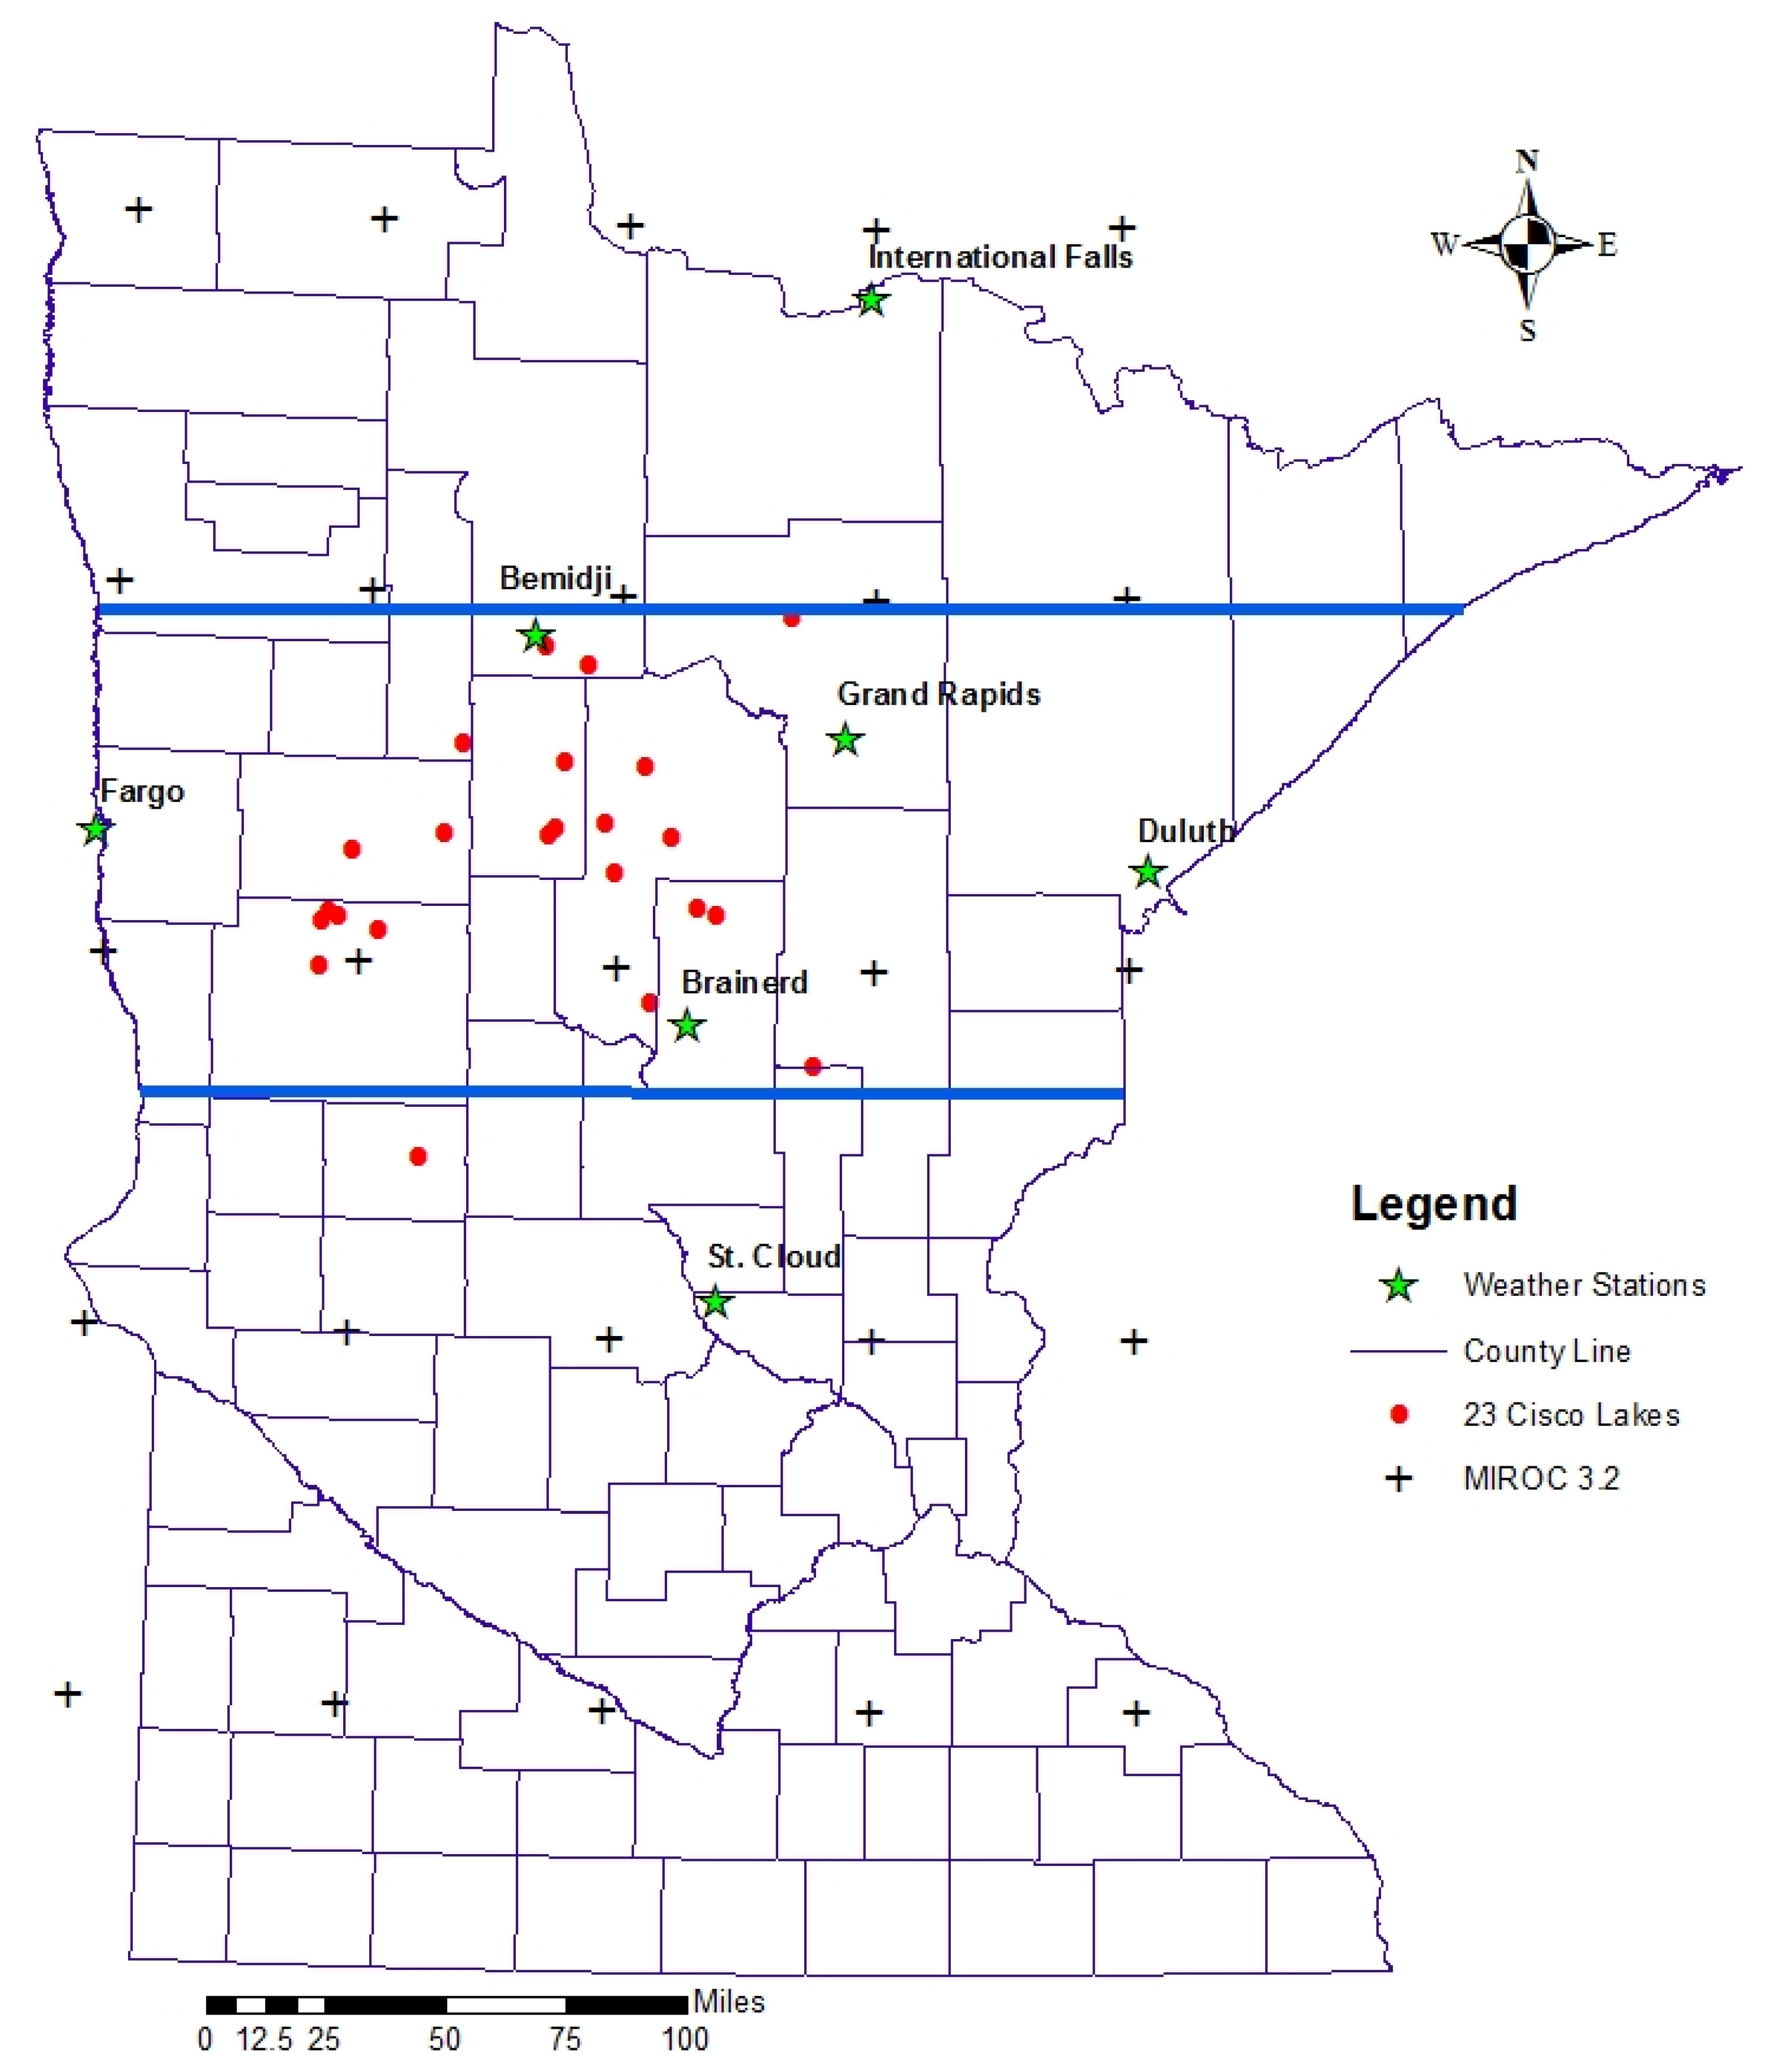
2.2. Selection of 58 Virtual Lakes to Represent 620 Cisco Lakes in Minnesota

An MN DNR lake database contains 620 cisco lakes that were used for this study and previous studies [20]. Fang et al. [30] used the fixed benchmark method and Jiang et al. [20] implemented the variable benchmark method to divide these 620 lakes into Tier 1, Tier 2, and Tier 3 refuge cisco lakes using an oxythermal habitat variable TDO3. This study examines the cisco lethal conditions in the same 620 cisco lakes. On average, Minnesota’s cisco lakes are deeper, more transparent and less trophic than other lakes in Minnesota [31]. These 620 lakes are scattered throughout much of the central and northern part of Minnesota [20]. Characteristics of 620 lakes are reported previously [20], and they are plotted separately for shallow and medium-depth lakes (Figure 4a) and deep lakes (Figure 4b) using lake geometry ratio (GR) and Secchi depth (Zs) as axes. Mean summer Zs is an indicator of lake trophic state (it relates to mean chlorophyll-a levels and summer transparency of a lake), while lake GR is an indicator of summer mixing dynamics of a lake [32].
Because it was not feasible to run deterministic lake models for all 620 cisco lakes, we used 58 virtual lakes: 12 shallow, 18 medium-depth (Table 2), and 30 deep lakes to represent the entire set of 620 lakes in Minnesota. A similar approach using 27 generic lake types had been used to study climate warming impact on fish habitat in small lakes in Minnesota [13] and in the contiguous USA [14]. Each virtual lake is characterized by four attributes: As, Hmax, Zs (related to lake trophic status), and location. Location of a lake is categorized into three regions: northern, medium-latitude, and southern Minnesota (Figure 2). The geometry ratio GR of a lake is defined as As0.25/Hmax in m−0.5 when As is in m2 and Hmax in m. The strength of the seasonal lake stratification is related to the GR value [32]. Polymictic lakes (such as large shallow lakes) have the highest GR numbers, while strongly stratified lakes (such as small deep lakes) have the lowest GR; the transition from unstratified to stratified lake occurs for GR between 3 and 5 [32].
The 27 generic lake types included 9 shallow lakes (representative Hmax = 4 m) with GR > 5.29 m−0.5, 9 medium-depth lakes (Hmax = 13 m) with GR = 1.63, 2.78, and 4.33 m−0.5; and 9 deep lakes (Hmax = 24 m) with GR = 0.88, 1.50, and 2.34 m−0.5 [13]. Therefore, medium-depth lakes overlap with deep lakes on the plot of Zs vs. GR (Figure 2 and Figure 3). Despite the overlap, simulated water temperature and DO characteristics [13] and snow/ice cover characteristics [33] in 27 generic lake types have consistent variations with GR and Zs. Simulated maximum daily surface and bottom temperatures, days of seasonal stratification, maximum daily percentage of total lake volume with anoxia, and many other T and DO characteristics were successfully presented and analyzed to draw useful information using Zs vs. GR plots [13,34,35]. However, the overlap of GR between medium-depth and deep lakes creates discontinuities to present certain fish habitat parameters on the Zs vs. GR plots [36], for example, projected good-growth periods are more than 220 days for deep lakes under future climate scenario, but medium-depth lakes with similar GR are projected to have no fish habitat [14]. Therefore, we studied cisco survival and lethal conditions separately in shallow and medium-depth lakes using 12 shallow and 16 medium-depth virtual lakes (Table 2) and deep lakes using 30 virtual deep lakes (Figure 4). For the 620 cisco lakes (Figure 4) in Minnesota, there are 14 shallow lakes (Hmax < 5.0 m), 385 medium-depth lakes (5.0 m ≤ Hmax < 20.0 m), and 221 deep lakes (Hmax > 20.0 m) [13].
The 12 shallow and 16 medium-depth virtual lakes were extended from the original 9 shallow (LakeR01-R09 in Table 2) and 9 medium-depth (LakeR10-R18) virtual lake types used in previous studies [13] by adding 10 new virtual lakes (LakeR28-R33 &LakeR37-R40) for studying cisco habitat. The minimum and maximum GR values for 14 shallow and 385 medium-depth Minnesota cisco lakes are 1.04 and 22.7 m−0.5 (Figure 4), respectively, therefore, LakeR37 to LakeR39 were added to represent medium-depth (13 m), small surface area (0.05 km2) lakes with GR = 1.15 m−0.5. The 12 shallow and 16 medium-depth virtual lakes have GR ranging from 1.15 to 14.06 m−0.5 (Table 2, Figure 3 and Figure 4); there are only five Minnesota cisco lakes with GR beyond the range of GR values for these 28 virtual lakes (Figure 4a). Mean summer Secchi depths of the 620 cisco lakes ranged from 0.7 to 9.5 m [20], and 10% or 61 cisco lakes had Zs ≥ 5.0 m; therefore, seven representative cisco lake types (LakeR28-R33 and lake R40 in Table 2) with Zs = 7.0 m were added (only two medium-depth cisco lakes with Zs > 7.0 m shown in Figure 4a). Overall, 28 virtual lakes can well represent the 14 shallow and 385 medium-depth cisco lakes in Minnesota (Figure 4a) and 12 medium-depth cisco lakes among the 23 cisco lakes (Figure 3a). There are no cisco lakes in Minnesota with Zs > 4.5 m and GR > 5.3 m−0.5, but those virtual lakes at the right upper corner of Figure 4a are useful to develop smooth contour lines of cisco kill parameters shown later.
The 30 deep virtual lakes proposed for previous studies [20,30] were used in this study also. Those lakes (LakeC01 to LakeC30) comprise lakes with five different Zs values (1.2, 2.5, 4.5, 7.0, and 8.5 m) and six different surface areas (0.1, 0.5, 1.5, 5.0, 13.0, and 50 km2). The maximum depth of all 30 virtual lakes was set at 24 m [20]. The 30 virtual lakes have GR ranging from 0.74 to 3.5 m−0.5, which represent well 221 deep stratified cisco lakes in Minnesota (Figure 4b) and 12 deep cisco lakes among the 23 cisco lakes (Figure 3b). Twenty of the 30 virtual cisco lake types, LakeC01 to LakeC20, are strongly stratified with GR < 2, and the other ten lake types (LakeC21 to LakeC30) are relatively weakly stratified. The 30 deep virtual lakes are all stratified lakes based on GR, but they cover lakes having small to large surface areas and include eutrophic (Zs = 1.2 m), mesotrophic (Zs = 2.5 m), and oligotrophic (Zs ≥ 4.5 m) lakes [13].

2.3. Long-Term Historic and Projected Cisco Lethal Conditions in 58 Virtual Lakes

To understand long-term lethal conditions and cisco kill in 58 virtual lakes (Figure 3 and Figure 4), daily T and DO profiles were simulated using a deterministic, one-dimensional (vertical) and unsteady year-round water quality simulation model, MINLAKE2012 that was developed from MINLAKE2010 [37] and MINLAKE96 model [38] for applications to deeper and more transparent cisco lakes in Minnesota. The most important upgrades of MINLAKE2012 compared to MINLAKE2010 are the conversion to a user-friendly Excel spreadsheet environment and the introduction of variable temporal resolution, allowing to run the model at hourly and daily time step. MINLAKE2012 was used to study temperature dynamics in Lake Kivu, one of the seven African Great Lakes, using hourly time step [39] and investigate daily ice/snow characteristics of Harp Lake in Canada [40].
In this study, the year-round model was run in daily time steps over multiple simulation years (1961–2008) including both open-water seasons and ice-cover periods. The one-dimensional heat transfer and DO transport equations were solved numerically for layer thicknesses from 0.02 m (near the water surface or ice-water interface) to 1.0 m (for depths greater than 1.0 m) using an implicit finite difference scheme and a Gaussian elimination method. Descriptions of MINLAKE96 and MINLAKE2010 are presented elsewhere [10,30,38]. MINLAKE model uses lake bathymetry (As, Hmax, horizontal areas versus depths), lake trophic status (Secchi depth), corresponding model parameters, and daily weather data (depending on lake location) as model input. MINLAKE2010 was calibrated using 21 cisco lakes and 7 non-cisco lakes in Minnesota based on multi-year data availability (7384 data pairs spanning 439 lake-days over 81 lake-years). After calibration, the average standard error of estimates against measured data for all 28 lakes was 1.47 °C for water temperature (range from 0.8 to 2.06 °C) and 1.50 mg/L for DO (range from 0.88 to 2.76 mg/L) [37].
In this study, we further calibrated MINLAKE2012 using measured T and DO profile data collected in 23 cisco lakes under past climate conditions, then simulated T and D profiles in 2006 were used to calibrate the FishHabitat2013 model using cisco survival or kill observations in these lakes. In order to get better calibration results for MINLAKE2012 and FishHabitat2013 models, the closest weather station to a lake was used for simulations and is listed in Table 1 for each of 23 lakes. Four weather stations in Minnesota (Bemidji, Brainerd, Grand Rapids, and St. Clouds) and one station in North Dakota (Fargo) associated with 23 lakes (Table 1) were used and presented in Figure 2. Weather stations at St. Clouds, MN and Fargo, ND, are the National Weather Services (NWS) Class I stations having climate data from 1961 to 2008 for the study, and Brainerd and Bemidji are the NWS Class II stations having climate date from 1973 to 2008 and Grand Rapids from 1984 to 2008.
This study is to project whether 620 Minnesota lakes that had or currently has a cisco population can support cisco habitat under future climate scenarios, i.e., after climate warming. To make the projection, the model outputs from one Coupled General Circulation Models (CGCMs) of the earth’s atmosphere and oceans, i.e., MIROC 3.2 (Figure 2), were used as input to the MINLAKE2012 model to project future T and DO profiles. Mean monthly increments over 30 years (2070–2099) for climate parameters were obtained from the MIROC 3.2 model outputs, and applied to measured daily climate conditions (1961–2008) to generate projected daily future climate scenario. Monthly increments from the grid center point closest to a weather station were used to specify the future climate.
The MIROC 3.2 [41] was developed by the Center for Climate System Research, University of Tokyo; the National Institute for Environmental Studies; and the Frontier Research Center for Global Change—Japan Agency for Marine-Earth Science and Technology. Output of the MIROC 3.2 model with a high spatial surface grid resolution of roughly 1.12 degrees latitude and longitude or approximately 120 km in Minnesota was used. Mean monthly air temperature increments projected by MIROC 3.2 range from 3.53 to 4.70 °C with annual averages of 4.00 to 4.24 °C for the three weather stations.
The long-term lethal conditions and cisco kill were first simulated in 58 virtual lakes under past climate conditions (1961–2008) and MIROC 3.2 future climate scenario (Figure 5). Results for 58 virtual lakes from MINLAKE2012 and FishHabitat2013 were developed using weather data from three class I weather stations (Figure 2): International Falls, Duluth, and St. Cloud. Each of these three weather stations has a closest grid center point (Figure 2) with mean monthly increments [20,30].

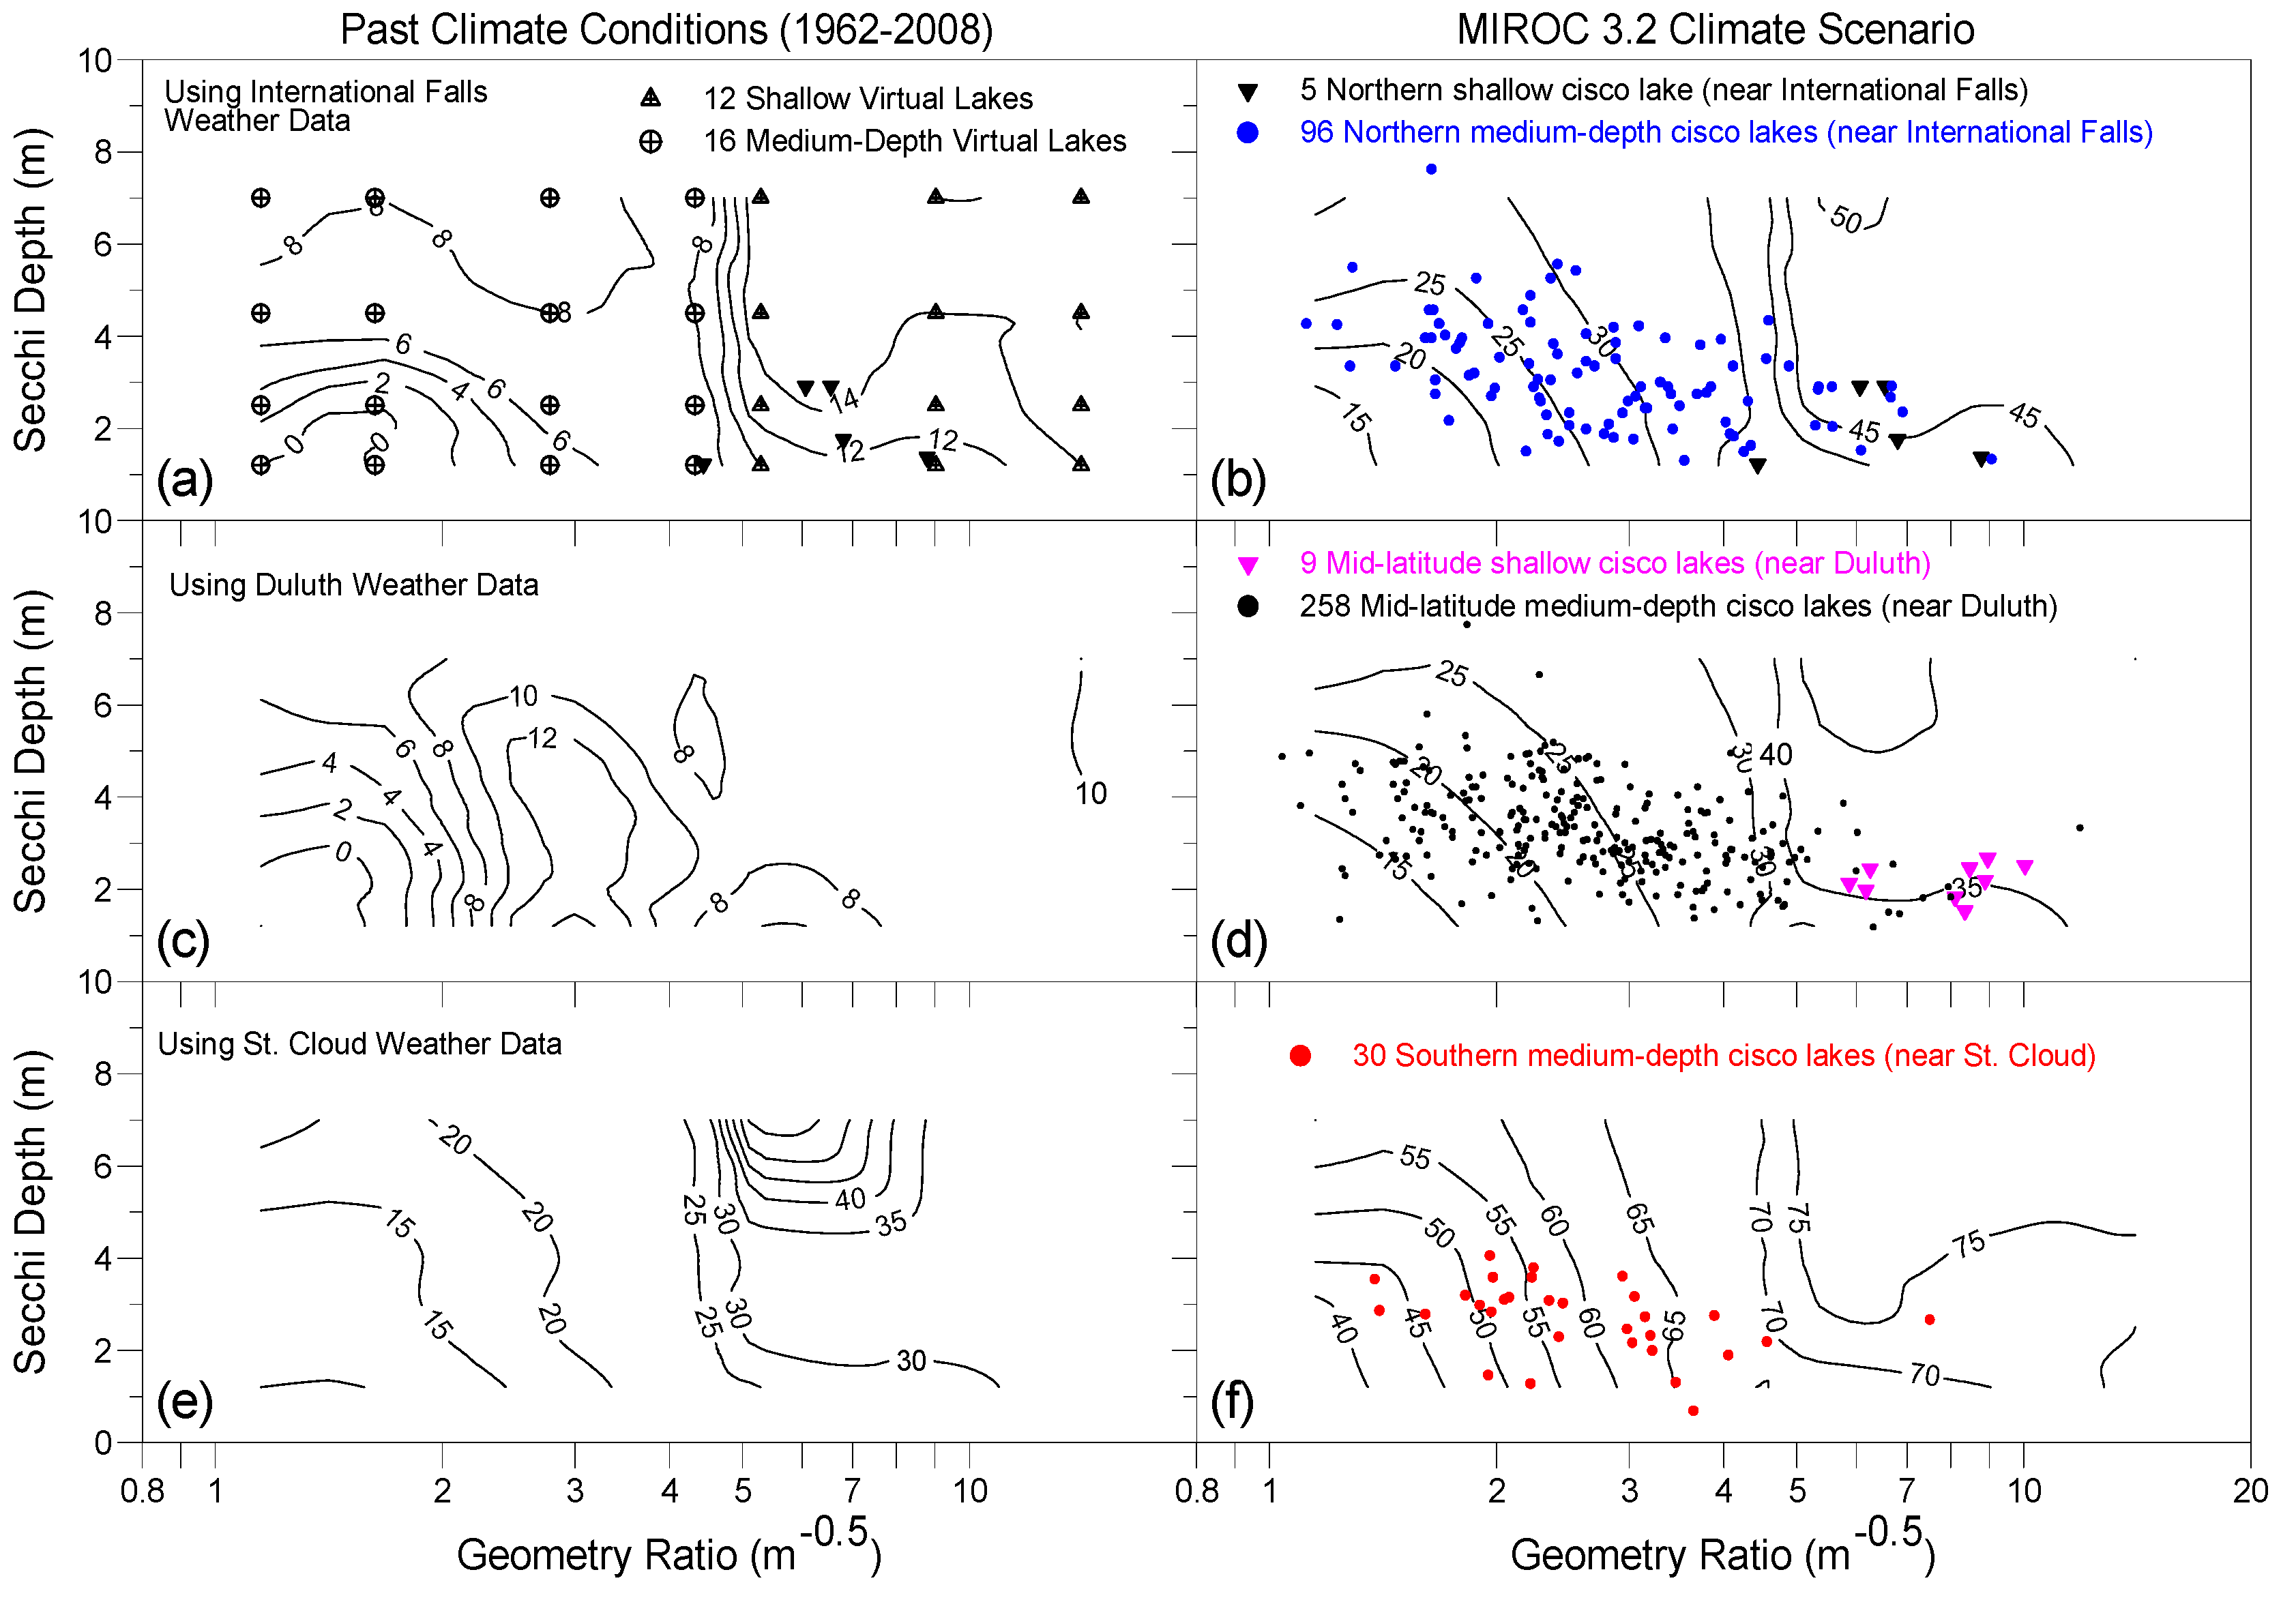
2.4. Understanding/Extrapolating Cisco Lethal Potential in 620 Cisco Lakes

Figure 5 shows the flowchart or four modeling steps used for the study to simulate cisco survival and lethal conditions in Minnesota lakes. Past climate conditions (1961 to 2008) and a future climate scenario are model inputs (atmospheric boundary conditions) for the lake water quality model MINLAKE2012 [37]. After 2006 model validation of FishHabitat2013, long-term characteristics of cisco lethal conditions such as starting and ending days of cisco kills and non-survival days (NSD) or lethal days are calculated in 58 virtual lakes for projecting or extrapolating cisco lethal conditions for 620 cisco lakes in Minnesota. The simulated characteristics of cisco lethal days in 58 virtual lakes are plotted and interpolated as isolines on a plot of Zs vs. GR. The cisco survival and lethal conditions of the 620 cisco lakes in Minnesota are projected using the mean summer Zs and GR of each lake as independent variables on the same plot with results from 58 virtual lakes. In this way, the un-simulated lakes can be connected to simulated virtual lakes (Figure 4).
The 620 cisco lakes in Minnesota were divided into three regions based on their geographic locations: northern, medium-latitude and southern cisco lakes in addition to grouping them by the maximum depth; and Figure 2 shows the latitude boundary lines to divide lakes by regions, which were the same boundary lines used in previous study [20]. Weather data at International Falls were considered to represent for 165 northern cisco lakes, Duluth for 399 mid-latitude cisco lakes, and St. Cloud for 56 southern cisco lakes; which is the same approach used by Jiang et al. [20].

3. Results

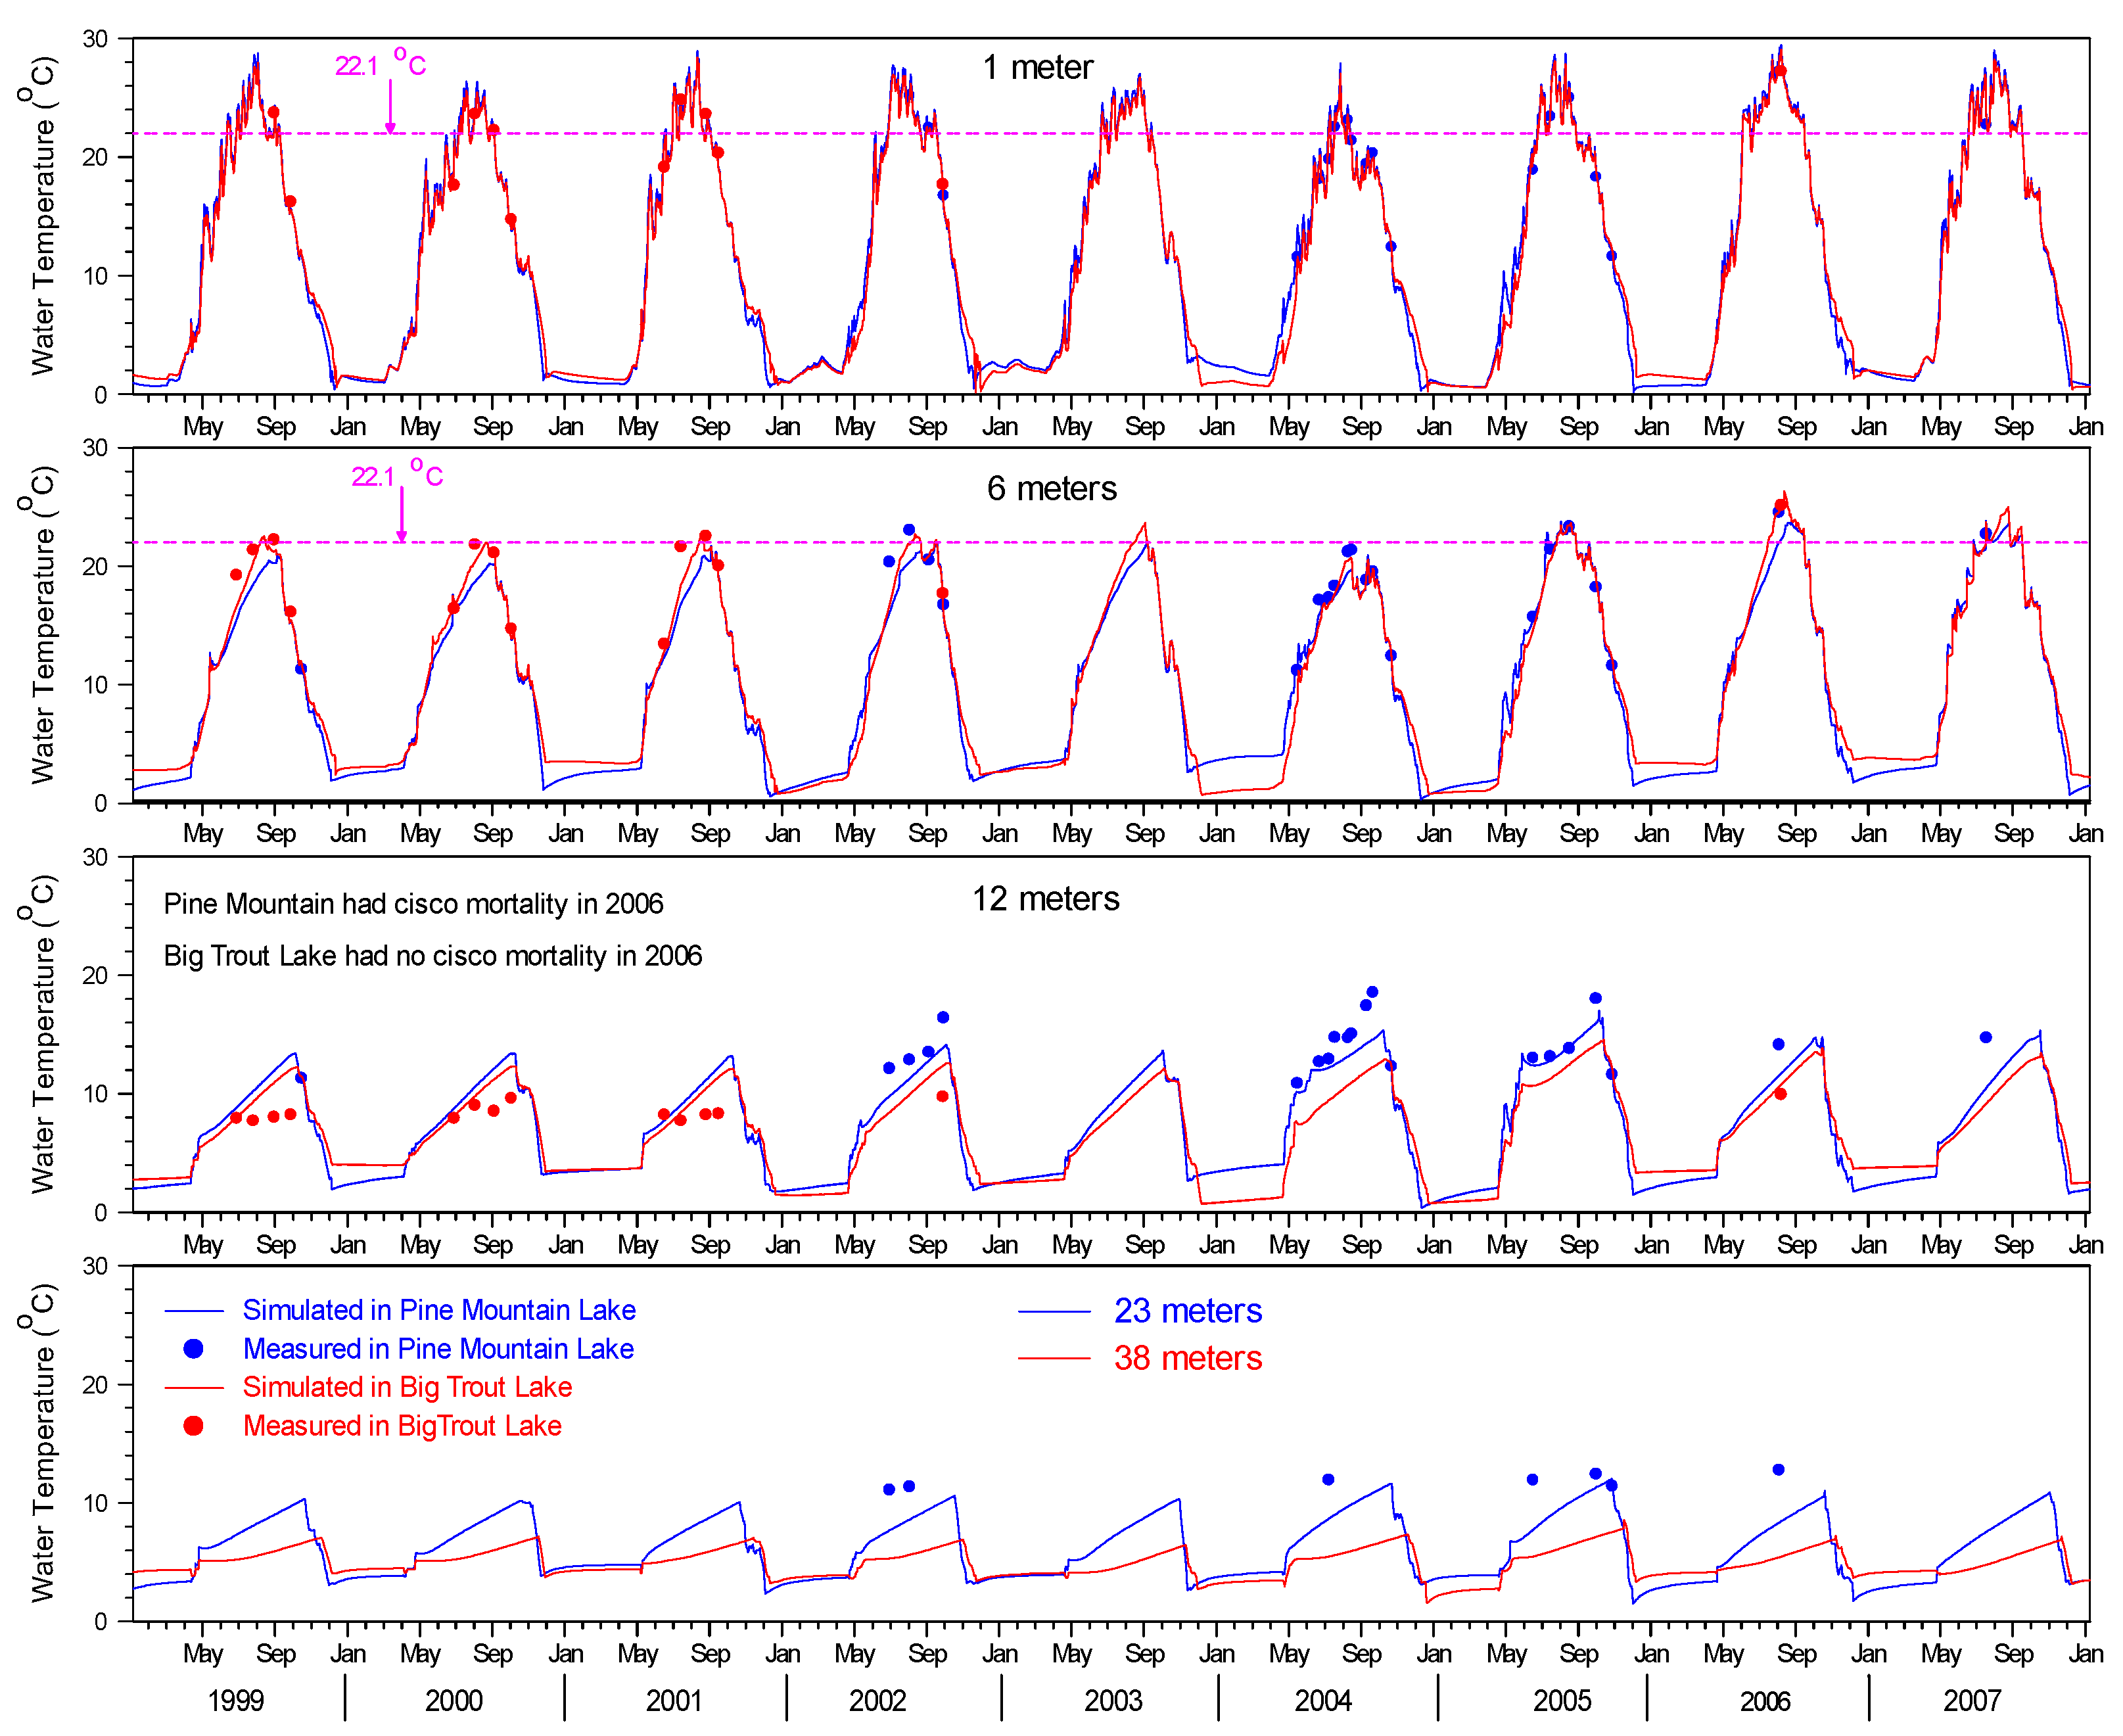
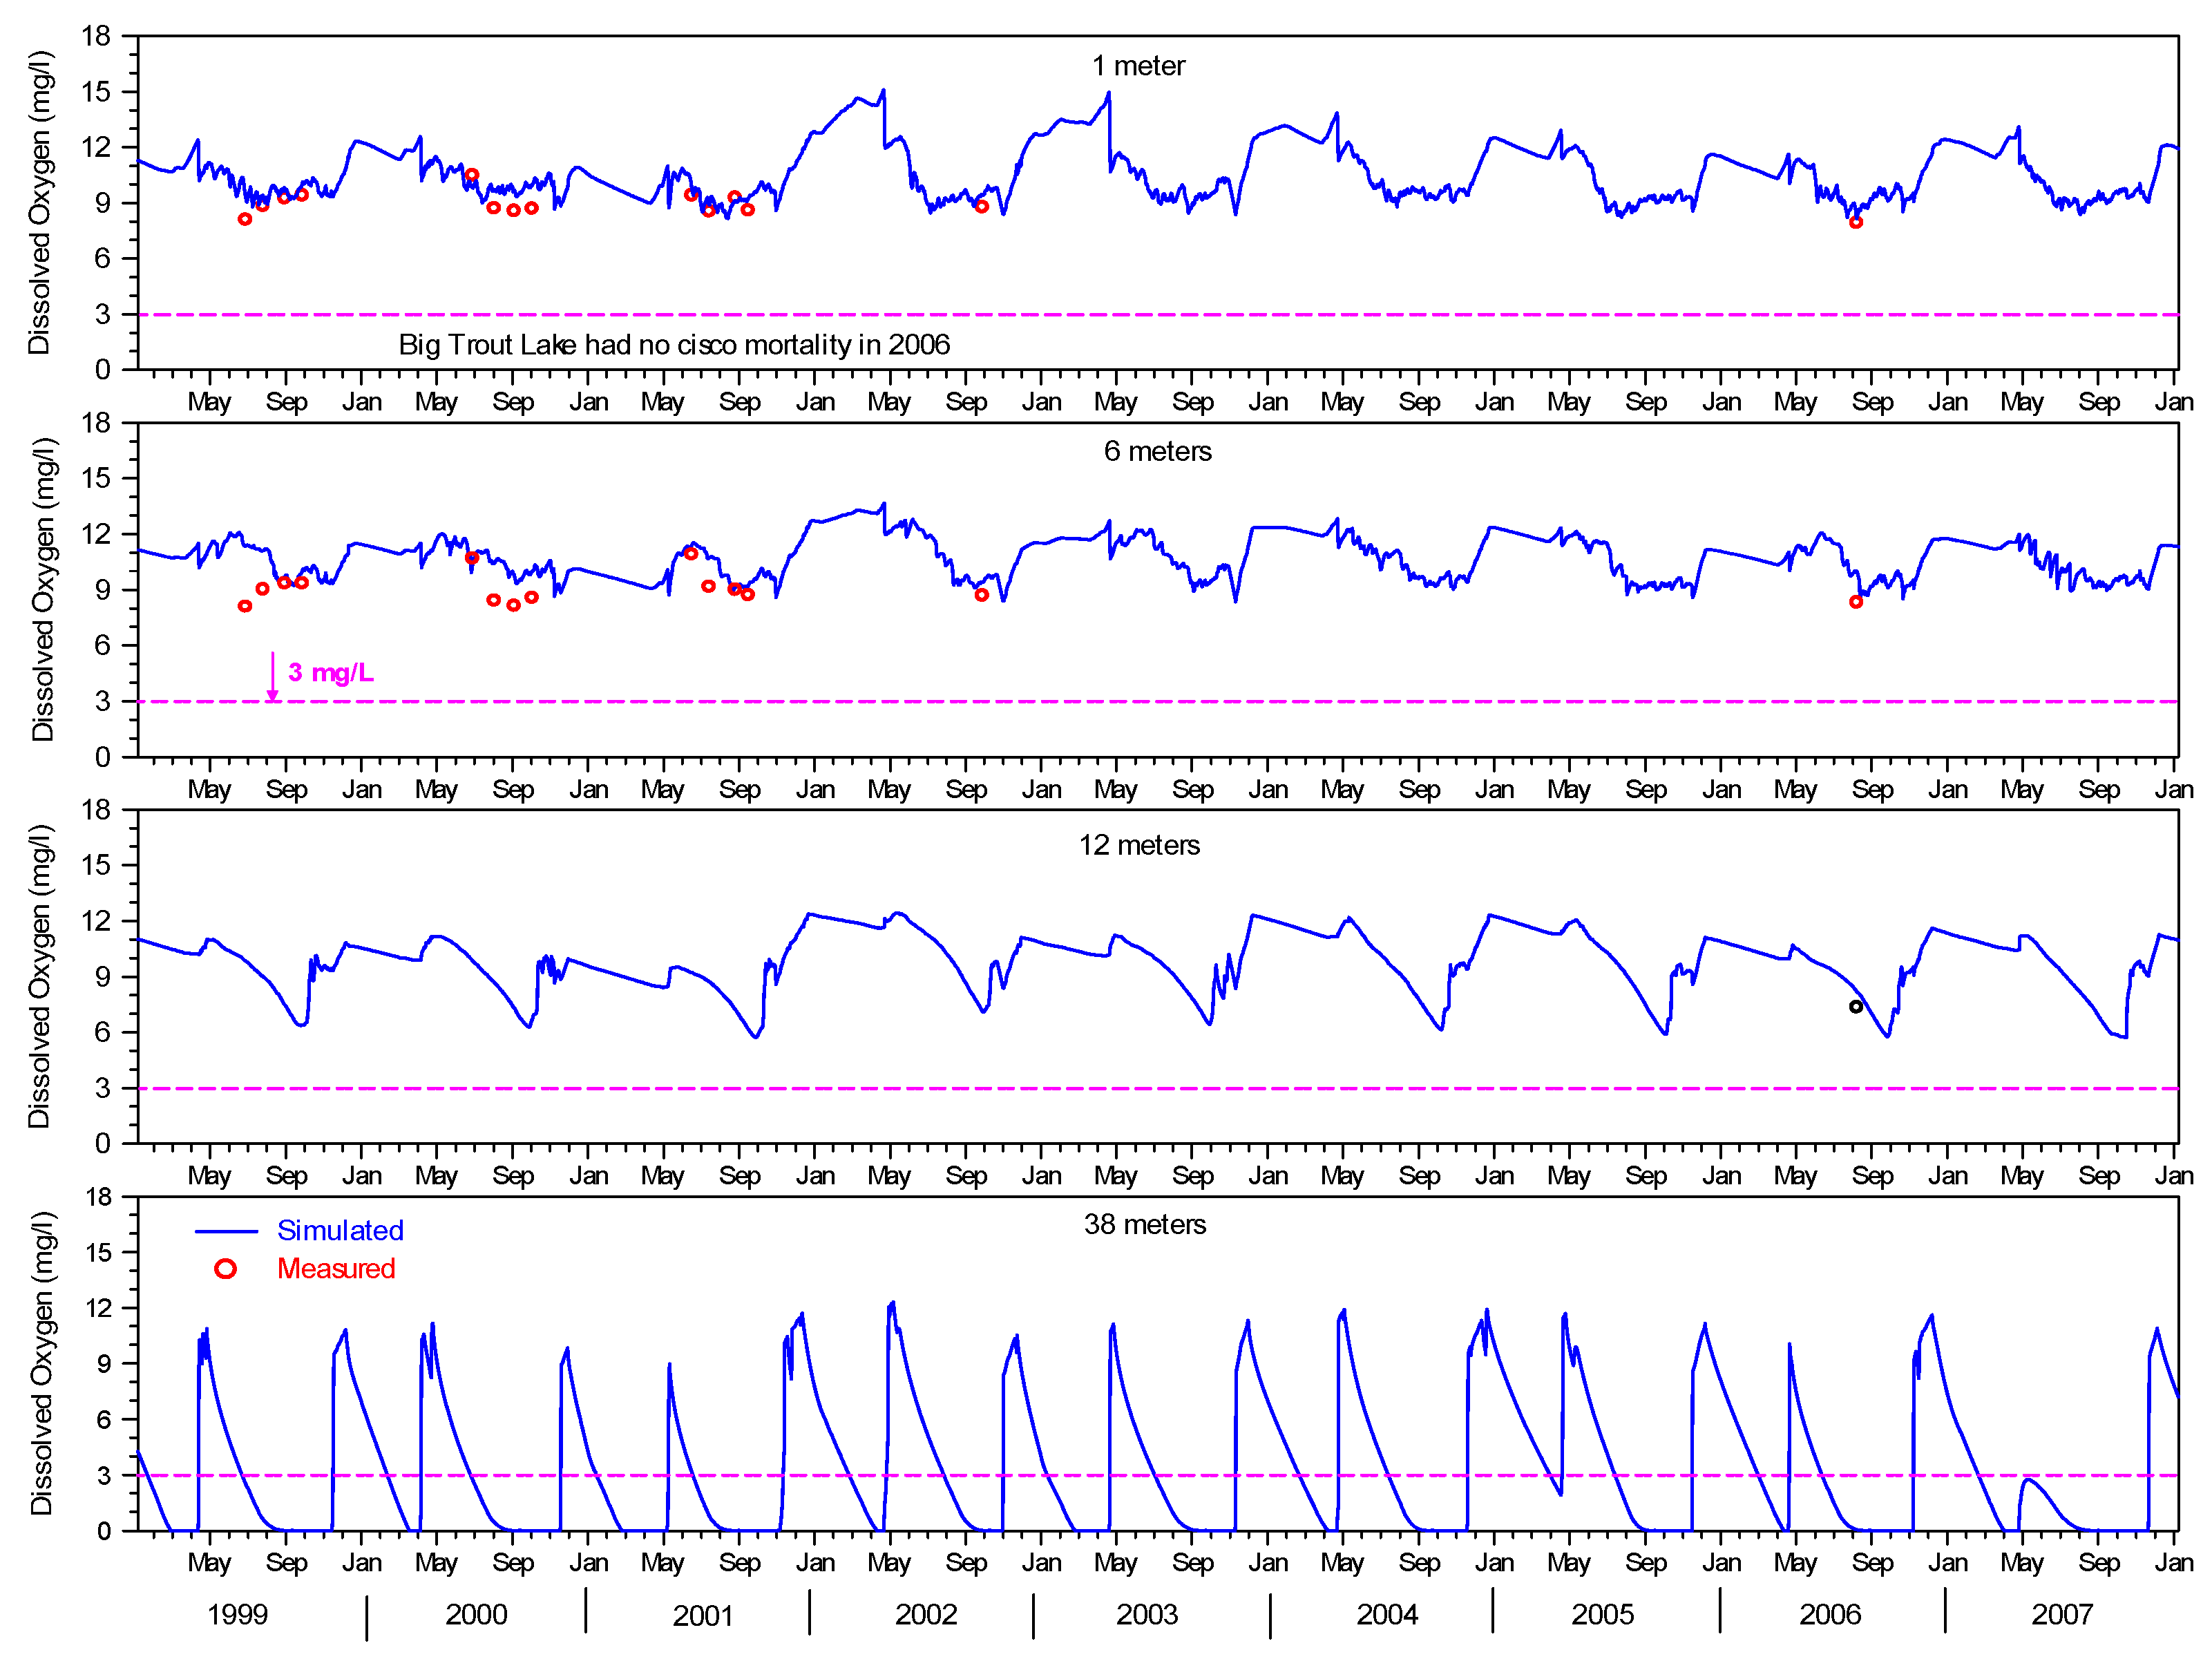
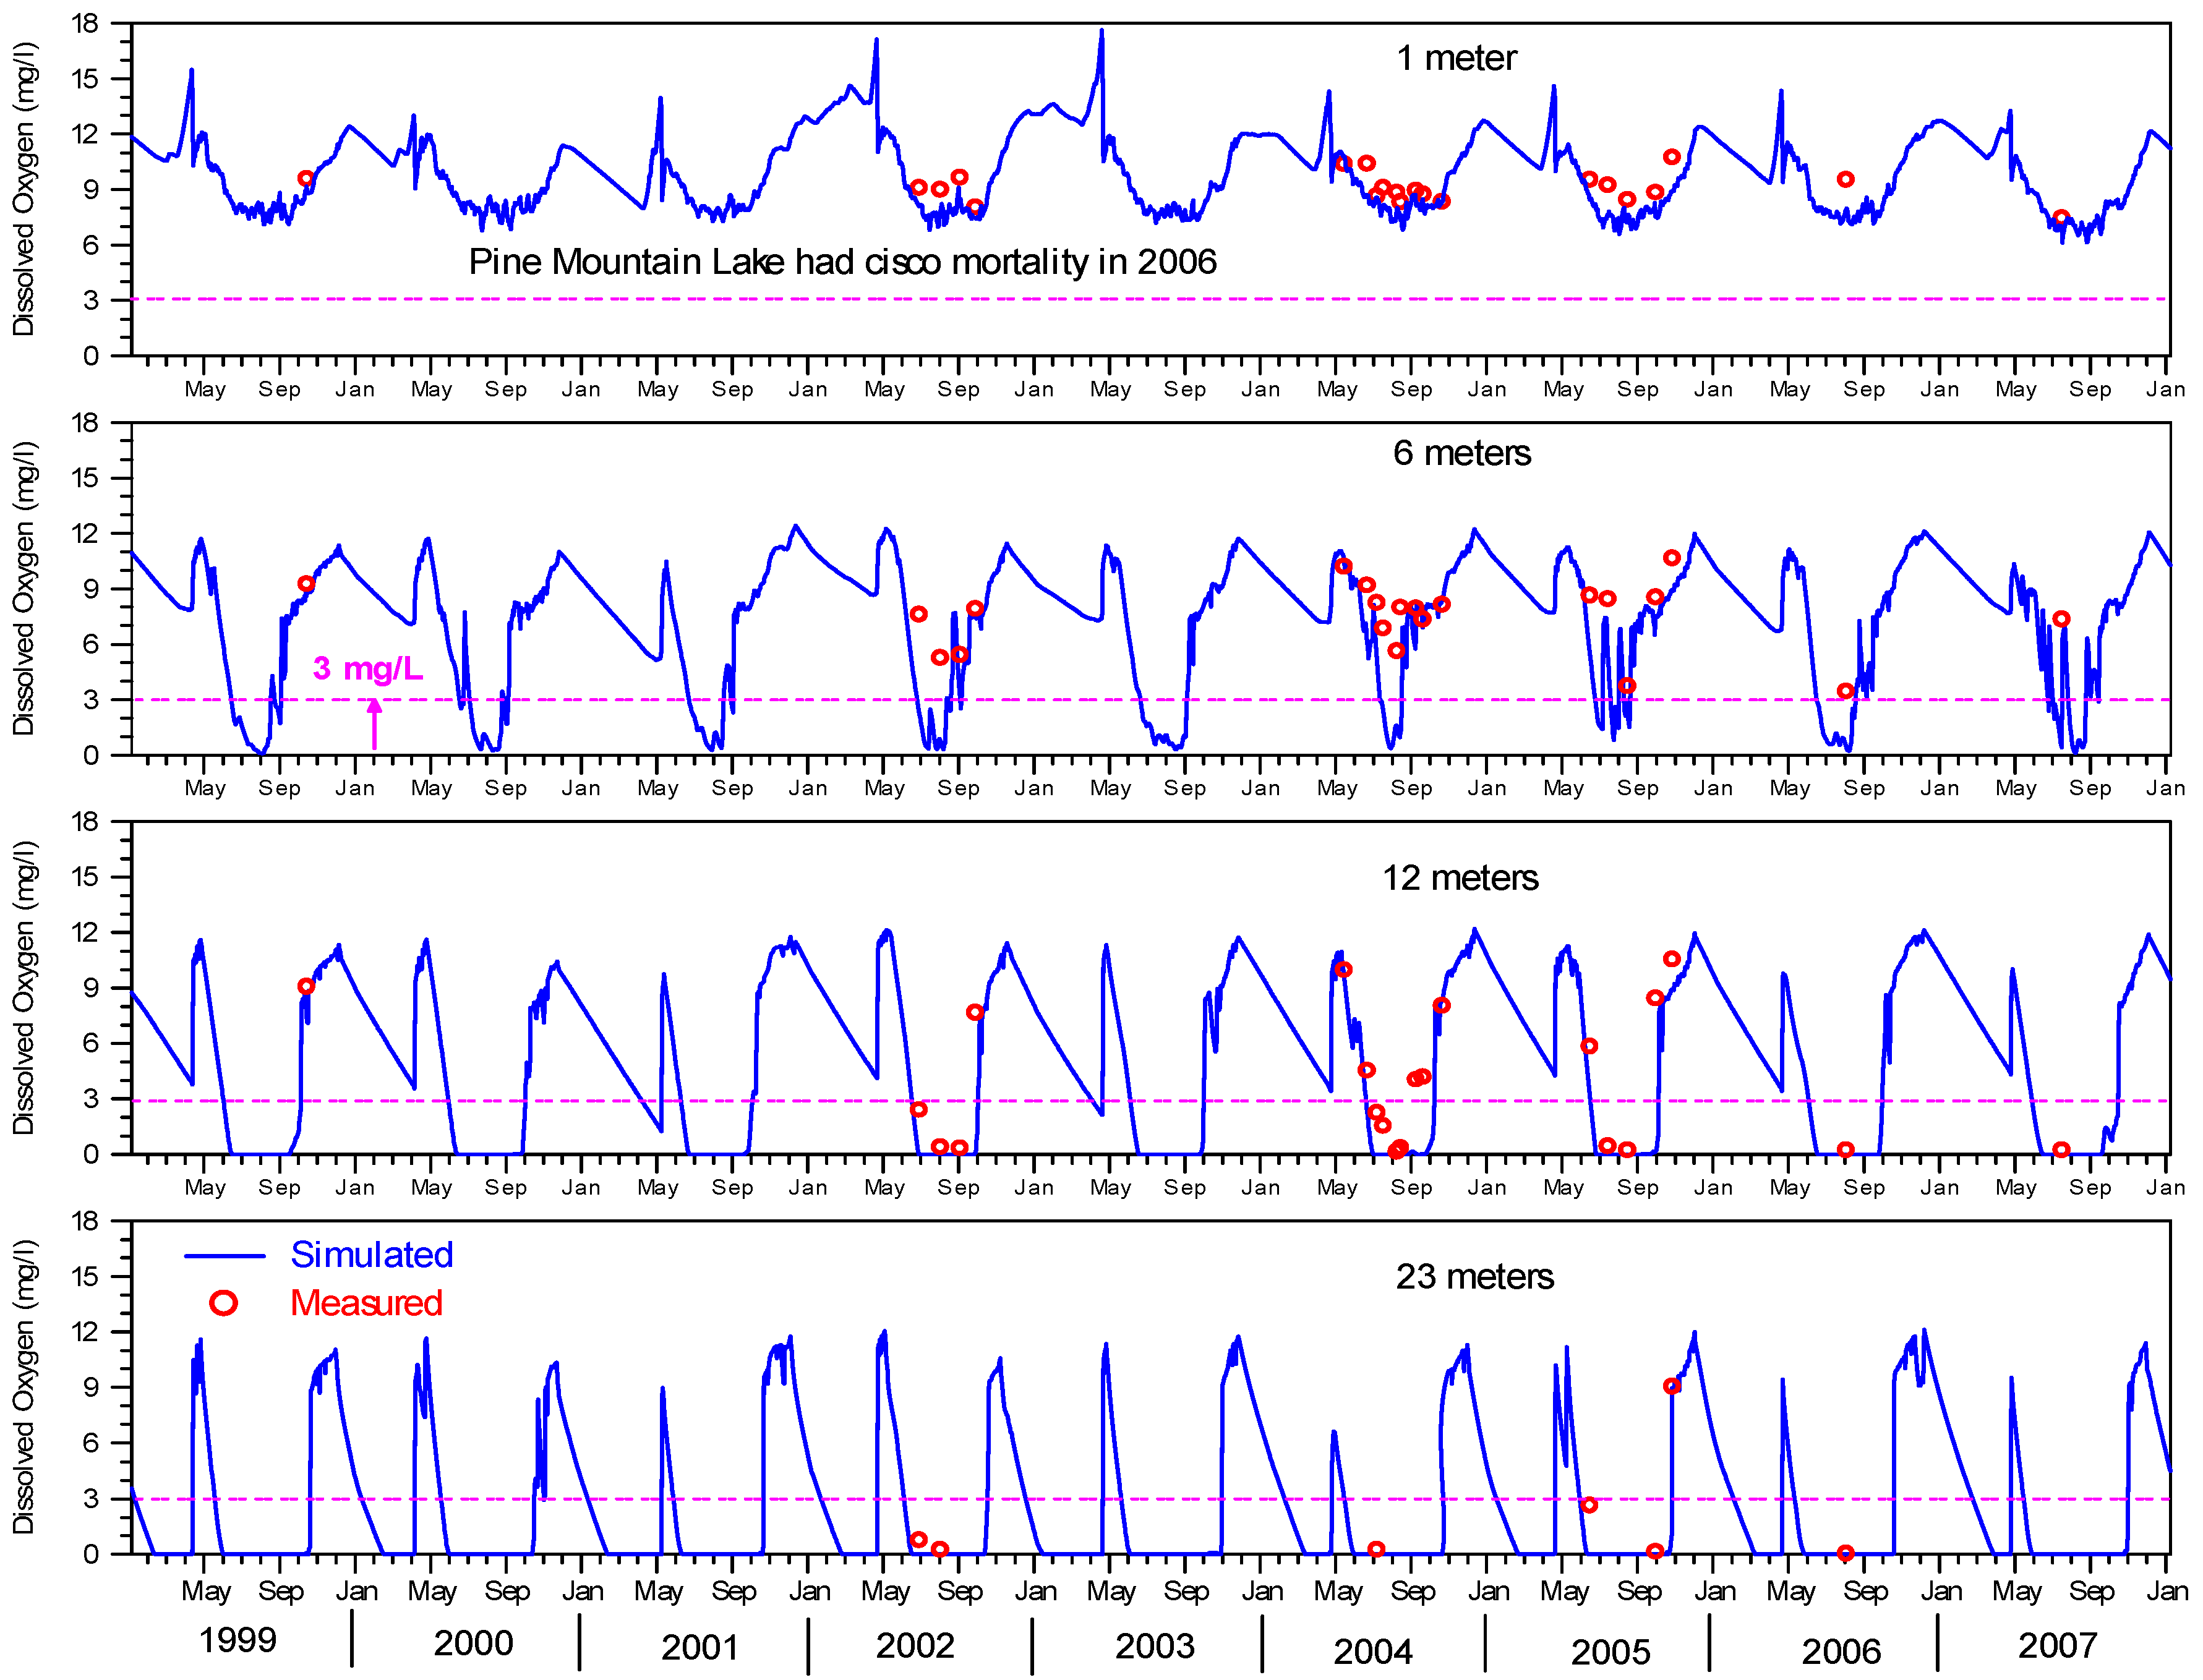
3.1. Temperature and DO Model Calibration and Simulation in 23 Minnesota Lakes

Information and results of model calibration for MINLAKE2012 are summarized in Table 1. Observed temperature and DO profiles used for model calibration range from 1 to 95 days, and simulated and measured data pairs from 14 to 2771 (Ten Mile). Six cisco-kill lakes and one reference lake without cisco kill had only one-day profile in 2006 collected by MN DNR for model calibration. The average root-mean-square errors (RMSE in Table 1) for T and DO of all 23 lakes are 1.57 °C and 1.72 mg/L, respectively. The average Nash-Sutcliff model efficiency (NSE in Table 1) for T and DO are 0.86 (11 lakes with NSE > 0.90) and 0.66 (10 lakes with NSE > 0.80). Bennis and Crobeddu [42] suggested that a good agreement between simulated and measured discharges is achieved when NSE exceeds 0.7. Model calibration results for 23 lakes are similar to magnitude of error parameters of one-dimensional lake model in previous studies [37]. Figure 6 shows simulated and measured water temperatures at four depths in Pine Mountain Lake and Big Trout Lake from 1999 to 2007. The first three depths are 1, 6, and 12 m for both lakes and the fourth depth is 23 m for Pine Mountain Lake (Hmax = 23.8 m) with cisco mortality in 2006 and 38 m for Big Trout Lake (Hmax = 39.0 m) without cisco mortality in 2006. Figure 7 and Figure 8 show simulated and measured DO concentrations at four depths in Big Trout Lake and Pine Mountain Lake, respectively. Simulated water temperature and dissolved oxygen match reasonably well with field data based on error parameters in Table 1 and graphic comparison (Figure 6, Figure 7 and Figure 8).
Both water temperature and DO concentrations at different depths vary with seasonal weather conditions and also depend on lake geometry ratio and trophic state (Figure 6, Figure 7 and Figure 8). Surface temperatures at 1 and 6 m in some years (Figure 6) were above cisco lethal temperature (22.1 °C, discussed in Section 3.2) but temperatures at deep depths are cool enough to support cisco habitat. Therefore, DO becomes a controlling factor to determine cisco habitat or survival conditions in these two lakes. Big Trout Lake is a deep mesotrophic/oligotrophic lake (mean Zs = 4 m) with DO above 3 mg/L lethal limit (Figure 7) and lower water temperature (<12 °C, Figure 6) at 12 m that would support cisco habitat for all those years (Figure 6 and Figure 7). Pine Mountain Lake is deep mesotrophic lake with Zs = 2.4 m that results in anoxic conditions at 12 m during the summer (Figure 8). DO concentrations at 6 m in Pine Mountain Lake were below 3 mg/L over number of days, and water temperatures at 6 m were hot enough to possibly result in cisco kill in some years.

3.2. Simulation and Validation of FishHabitat2013 for 23 Lakes in 2006

Figure 1 shows an example of FishHabitat2013 simulation results for determining 2006 cisco lethal conditions in Andrusia Lake using six combinations of constant LT and DO limits. First, constant LT = 22.1 °C and DOLethal = 3 mg/L were used to simulate cisco lethal conditions in 2006 in 23 Minnesota lakes after water temperatures and DO calibration against measured profiles, and the summary of simulation/validation results of cisco habitat conditions are given in Table 3 for each lake. It first lists the information of simulated lethal conditions in 2006 (hindcast or backtesting) including the first Julian Day, the last Julian Day, and the total number of days with cisco lethal conditions. It also lists the first Julian Day and the number of continuous days with cisco lethal conditions simulated in 2006. For example, Andrusia Lake has “192 (59)” under “simulated lethal days in 2006” (Table 3) that means lethal conditions were simulated on Julian Day 192 (11 July 2006) and the number of continuous cisco lethal days is 59 (Julian Days 192–250), which is also given in Figure 5. There are four lakes having more than one period of continuous lethal conditions and having some gaps (days) without lethal conditions between periods (Table 3).
The month/day in 2006 (Julian Day inside brackets) when cisco mortality was reported in each of 18 lakes is listed under “Observed mortality day in 2006” in Table 3 and used to examine model agreement with the observation. In the last column of Table 3, the first Yes/No gives the agreement of cisco lethal simulation and reported cisco mortality in 2006, and the second Yes/No inside brackets gives the agreement whether or not cisco lethal days from the model includes reported date with cisco mortality. For example, in Little Turtle Lake FishHabitat2013 simulated a total of 62 continuous days from 29 June (Julian Day 180) to 29 August (Julian Day 241) having cisco lethal conditions, which agree with reported cisco mortality in 2006; and the period of simulated cisco lethal conditions includes the reported date with cisco mortality, i.e., 19 July or Julian Day 200. Therefore, the model agreement with mortality observation is “Yes (Yes)” as listed in Table 3. The fish habitat model had the Yes (Yes) agreement in 13 of the 18 lakes that experienced cisco mortality in 2006.
For four lakes (Star, Bemidji, 7th Crow Wing, and Long), the model simulated cisco lethal conditions, but the simulated lethal periods did not include corresponding reported cisco mortality dates in 2006; these lakes have the Yes (No) agreement (Table 3). In the 7th Crow Wing Lake, cisco lethal conditions were simulated for 19 days to occur from Julian Day 197 to 215 (3 August) in 2006, and the cisco mortality was reported on 4 August. This case can be considered as Yes (Yes) agreement because cisco mortality might be reported one or a few days after cisco mortality occurred when study lakes were not constantly monitored and observed. Therefore, the fish habitat model with the constant lethal limits has “Yes (Yes)” agreement in all 12 medium-depth lakes with the maximum depth ranging from 8.5 to 19.2 m (Table 1).
For Lake Bemidji and Star, cisco lethal conditions were simulated to occur after the reported cisco mortality days in 2006. Long Lake was simulated with only three days (214–216) having lethal conditions, and the cisco mortality was reported on 6 August (Julian 218). Long Lake located in Otter Tail County, Minnesota has a maximum depth of 39.0 m (deep lake) and a surface area of 5.1 km2. Long Lake is a mesotrophic strongly stratified lake because of its mean Secchi depth 3.0 m, mean chlorophyll-a concentration 7.2 μg/L, and GR = 1.22. There was only one day in 2006 with observed temperature and DO profiles in Long Lake for model calibration.
There is only one lake–Lake Carlos–that the model did not simulate cisco lethal conditions, but it had cisco mortality in late August of 2006; the model has the No agreement with mortality observation (Table 3). Lake Carlos located in Douglas County, Minnesota has a maximum depth of 49.7 m and a surface area of 10.5 km2. Lake Carlos is a mesotrophic strongly stratified lake because its mean Secchi depth is 3.0 m; mean chlorophyll-a concentration is 5.0 μg/L, and GR = 1.15. The phenomenon called metalimnetic oxygen minima (MOM) occurs in late summer or fall in Lake Carlos where DO concentrations in the metalimnion are lower than ones in some depths below (hypolimnion), which may be related to oxidative consumption (respiration) of certain particulates and microcrustaceans accumulated in the metalimnion or low-oxygen water movement [43]. The MOM was the potential cause of the late summer cisco mortality event that occurred on 27 August in Lake Carlos. Because of MOM, the data of DO and temperature relationship in Lake Carlos did not fit the lethal-niche-boundary curve developed from the midsummer cisco-kill events in other 16 lakes (Table 1) [4]. A more advanced one-dimensional [44] or two-dimensional [45] lake water quality model has to be used to predict MOM in a lake, and MINLAKE2012 is for simulating temperature and DO in virtual lakes [37] and without special modifications would not predict MOM.
Jacobson et al. [4] also studied the 5 reference lakes that did not experience cisco mortality in 2006. These five reference lakes are all deep strongly stratified lakes (GR < 1.4 in Table 1). The fish habitat model using simulated temperature and DO profiles predicted no lethal conditions for cisco in all five references lakes (Table 3). Therefore, the fish habitat model has overall good agreement in the 23 cisco lakes with and without cisco mortality reported in 2006 using constant LT = 22.1 °C and DOLethal = 3 mg/L.
A sensitivity analysis of cisco habitat simulations was performed in 23 lakes (Table 4) using six different combinations (criteria) of LT and DOLethal, which include two LTs (22.1 and 23.4 °C) and three DO limits (2, 3, and 4 mg/L). Cisco kill days for Andrusia Lake in 2006 under six different criteria are given in Figure 1. The period of cisco lethal conditions for LT = 22.1 °C is longer than for LT = 23.4 °C when DO limit is fixed; when DO survival limits increase from 2 to 4 mg/L, days of lethal conditions increase also while LT is fixed (Figure 1 and Table 4). If the first two criteria (LT = 23.4 °C, DOLethal = 2 or 3 mg/L) were used, fish habitat model predicts zero days of lethal conditions in six of the 18 study lakes with cisco kill in 2006. Comparing all six criteria, the last two criteria (LT = 22.1 °C, DOLethal = 3 or 4 mg/L) show good agreement with field cisco kill observation in the hot summer of 2006, and both predict 17 lakes had lethal conditions out of 18 lakes. No lethal conditions were predicted by all six criteria for all 5 reference lakes that had no kill in 2006. Considering the study and recommendation by Jacobson in 2008 [4], we chose LT = 22.1 °C and DOLethal = 3 mg/L as the criteria for this study.

3.3. Simulated Cisco Lethal Conditions in 58 Virtual Lakes and 620 Cisoc Lakes

Fish kill parameters used/analyzed in this study include the total number of years with cisco kill and average cisco kill days for the years with kills. A cisco kill is assumed to occur when the number of continuous days of lethal conditions is 3 or greater [36]. Results for cisco lethal conditions are presented and discussed separately for shallow and medium-depth lakes and deep lakes [36].

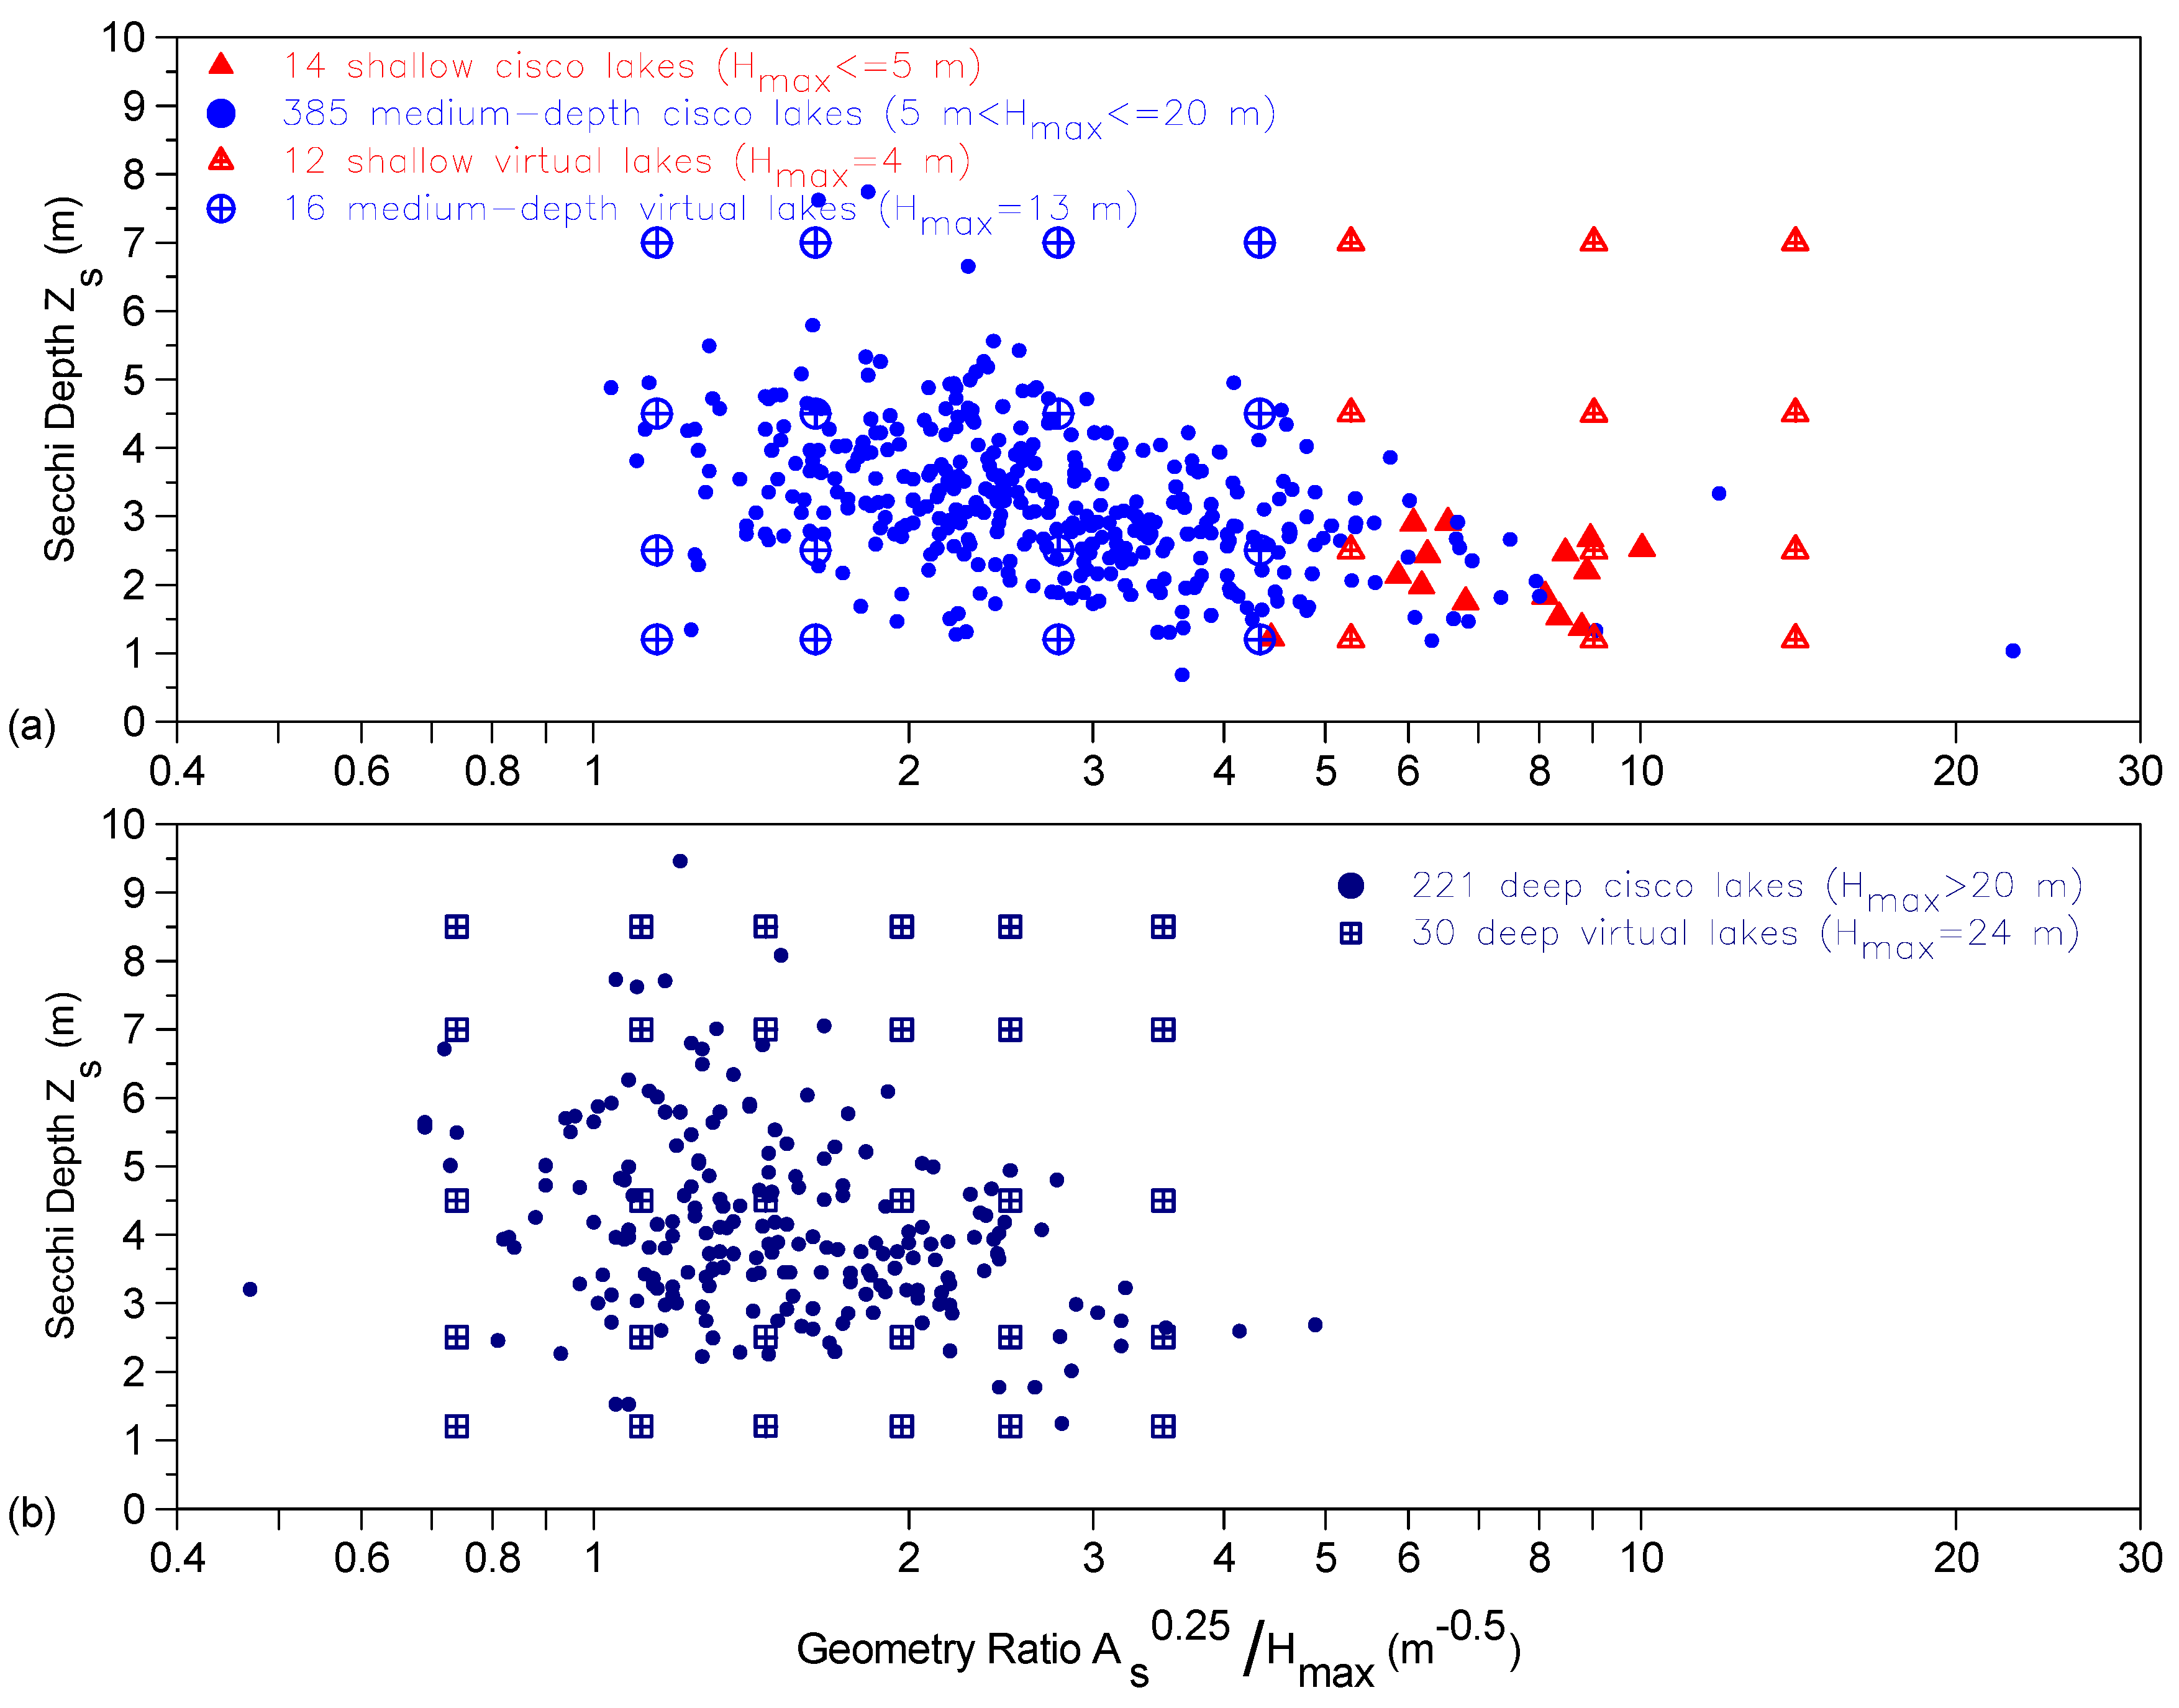
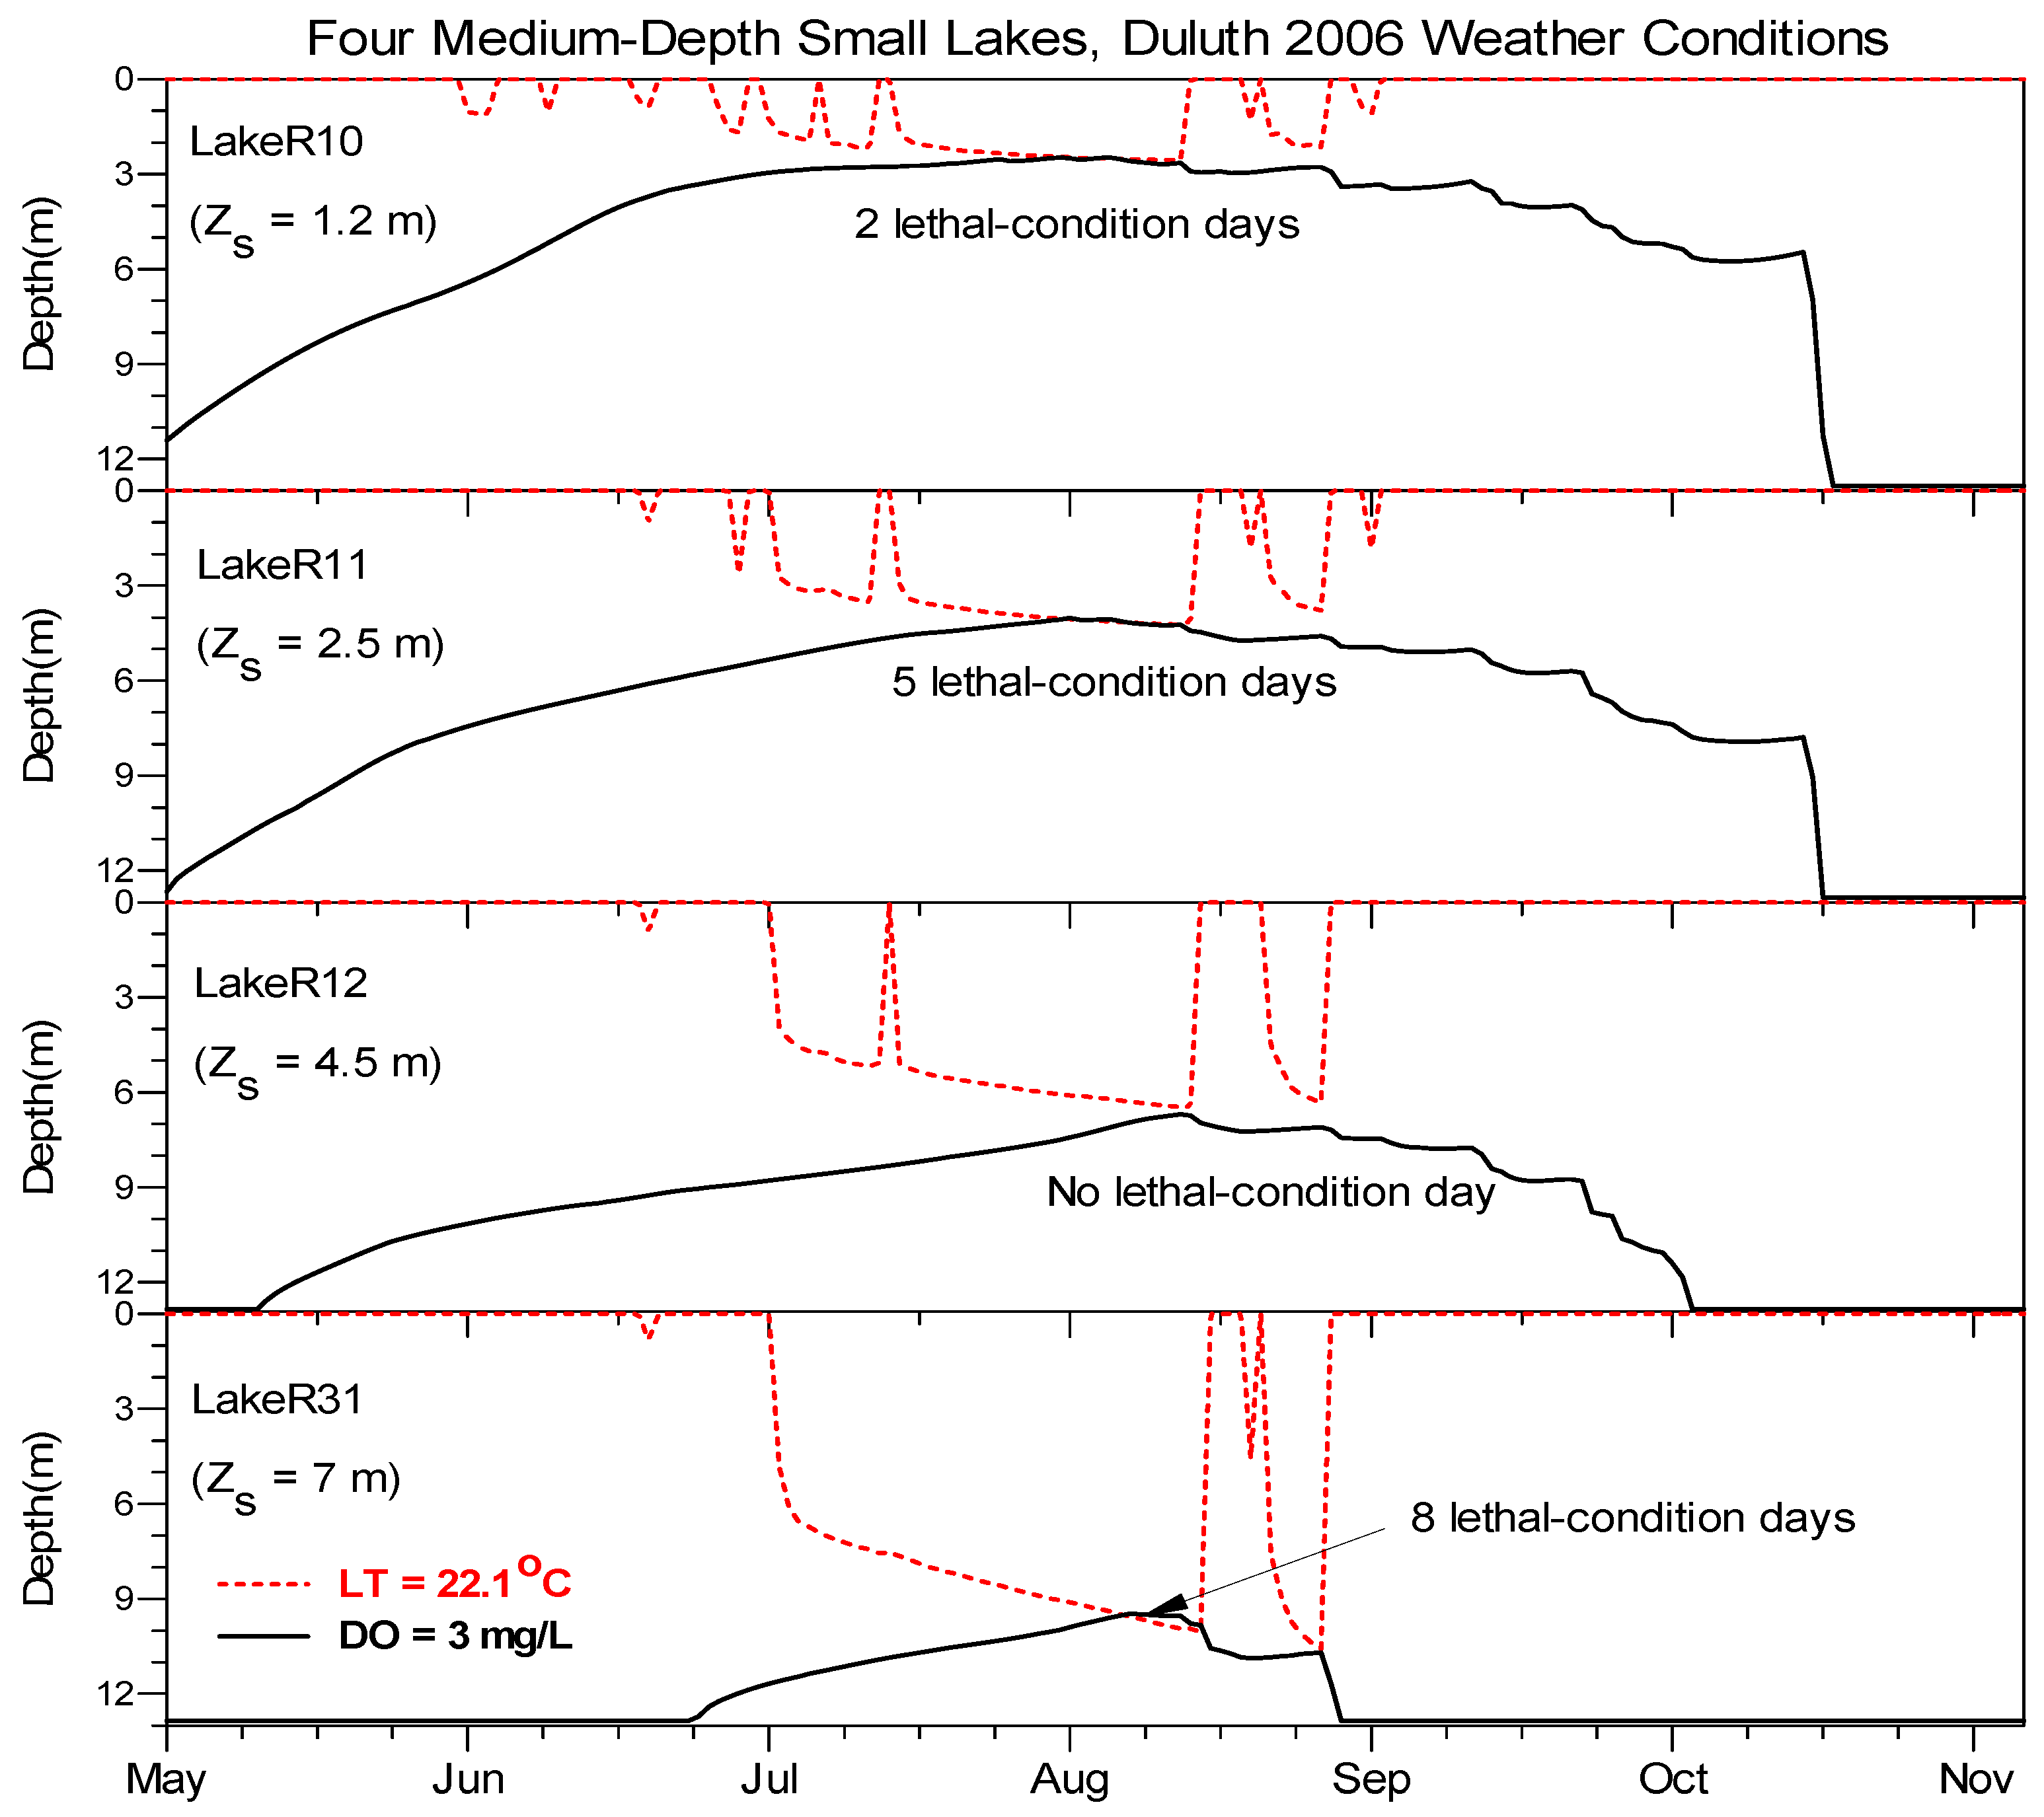
3.3.1. Results of Shallow and Medium-Depth Lakes

Before cisco habitat results are presented for 58 virtual lakes, sample results for 4 lakes (LakeR10, R11, R12, and R31, Table 2) are given in Figure 9 and simulated under 2006 Duluth weather conditions. These four lakes are medium-depth small lakes (Hmax = 13 m, As = 0.2 km2) and Secchi depth from 1.2 m to 7 m, which are eutrophic, mesotrophic, and oligotrophic lakes. Since their lake geometry ratio is 1.63 m−0.5 (Table 2), they are relatively strongly stratified lakes. When lakes change from eutrophic to oligotrophic lake, the light or radiation attenuation becomes smaller; therefore, more short-wave solar radiation is available to heat deep water and also provides more solar energy for photosynthesis to produce oxygen at deep depths. Figure 9 shows that LT isotherm is at shallower depth for eutrophic LakeR10 and much deeper in oligotrophic LakeR31 (Zs = 7 m), meanwhile isopleth of the DO survival limit (3 mg/L) also moves downward when there is more oxygen in deep layers. Resulting lethal conditions for cisco are 2, 5, 0, and 8 days; which are non-linear complex responses to the increase in Secchi depth when lake geometry and weather conditions are the same.
Figure 10 and Figure 11 show contour plots of simulated total number of years with cisco kill and average cisco kill days for the years with kills, respectively, under past climate conditions (a,c,e) and future MIROC 3.2 climate scenario (b,d,f) in shallow and medium-depth lakes. Corresponding results for deep lakes are presented separately in Figure 12. Contours were derived by interpolation from simulated values for either 12 shallow and 16 medium-depth virtual lakes (used 28 data points on Figure 10 and Figure 11) or 30 virtual deep lakes (Figure 12). Results for cisco kill (Figure 10, Figure 11 and Figure 12) are presented separately for three geographic regions: 165 northern cisco lakes using International Fall weather (a,b), 399 mid-latitude cisco lakes using Duluth weather (c,d), and 56 southern cisco lakes using St. Cloud weather (e,f). All 620 cisco lakes are grouped by maximum depths (shallow, medium-depth, and deep) and climate regions (northern, mid-latitude, and southern) and plotted in Figure 10 and Figure 11 (b,d,f), and 12 using lake geometry ratio GR and Secchi depth Zs as independent variables. Therefore, fish habitat results revealed by contour plots can be referred or extrapolated to each cisco lake group in Minnesota, an approach successfully used in previous studies [20,30].
The maximum number of years with cisco kill is 47 since the simulation period was 1961 to 2008 when simulated temperature and DO in 1961 were not used to derive fish habitat results (avoid the effect of initial conditions). The strength of lake stratification strongly affects or controls the total number of years with cisco kill, which is also affected by trophic status (Figure 10 and Figure 11). Shallow virtual lakes GR > 5 (Table 2), which are polymictic lakes, and have different results of cisco lethal conditions from ones of medium-depth virtual lake types (GR < 4.5). For example, the total number of years with cisco kill are 31–41 in northern shallow cisco lakes but less than 13 in northern medium-depth cisco lakes under the past climate conditions. Strongly stratified (GR < 2 m−0.5) mesotrophic and eutrophic medium-depth lakes are simulated to have less years with cisco kill, and very transparent medium-depth lakes (Zs > 4.5 m) can have a few more years with cisco kill in the northern and mid-latitude Minnesota (Figure 10), which is also illustrated in Figure 9.
Under MIROC 3.2 future climate scenario, the total number of years with cisco kill is 46–47 in northern shallow cisco lakes and 35–47 in northern medium-depth cisco lakes. For southern cisco lakes near St. Cloud, there are 12–47 years and projected 47 years with kills under past and future climate scenarios, respectively (Figure 10). Weather conditions at Duluth are affected by Lake Superior and had slightly less cisco kill years simulated using weather data at International Falls. Medium-depth cisco lakes are projected to have most strong impact from climate changes, e.g., average increase of 39, 37, and 16 years in cisco kill for northern, mid-latitude, and southern cisco lakes, respectively.
Average days with cisco kill were calculated for the years with fish kill in each simulated lake. When continuous lethal conditions last only 1 or 2 days, those lethal days were not included in calculating average cisco-kill days (ACKDs). For northern shallow lakes, ACKDs were 10–16 days for those 31–41 years under past climate conditions and are projected to be 38–50 days under MIROC 3.2 climate scenario. Mid-latitude and southern cisco lakes are projected to have 30–40 and 67–76 ACKDs under MIROC 3.2 future climate. This indicates shallow lakes (Hmax < 5 m) are definitely not good candidates for refuge lakes [20,30] that can support cisco under both the past and future warm climate. Fortunately, there are only 14 shallow cisco lakes in total 620 Minnesota cisco lakes (Figure 10 and Figure 11). Under the MIROC 3.2 climate scenario, medium-depth southern lakes are projected to have 37–70 ACKDs in all 47 years with cisco kill; northern and mid-latitude lakes have 13–36 and 12–30 ACKDs (Figure 11) over 35–47 and 30–45 years (Figure 10), respectively. Even though northern and mid-latitude cisco lakes have only 0–9 and 0–14 ACKDs under past climate conditions, these medium-depth lakes are also projected to not be good candidates for refuge lakes to support cisco in the future warm climate.

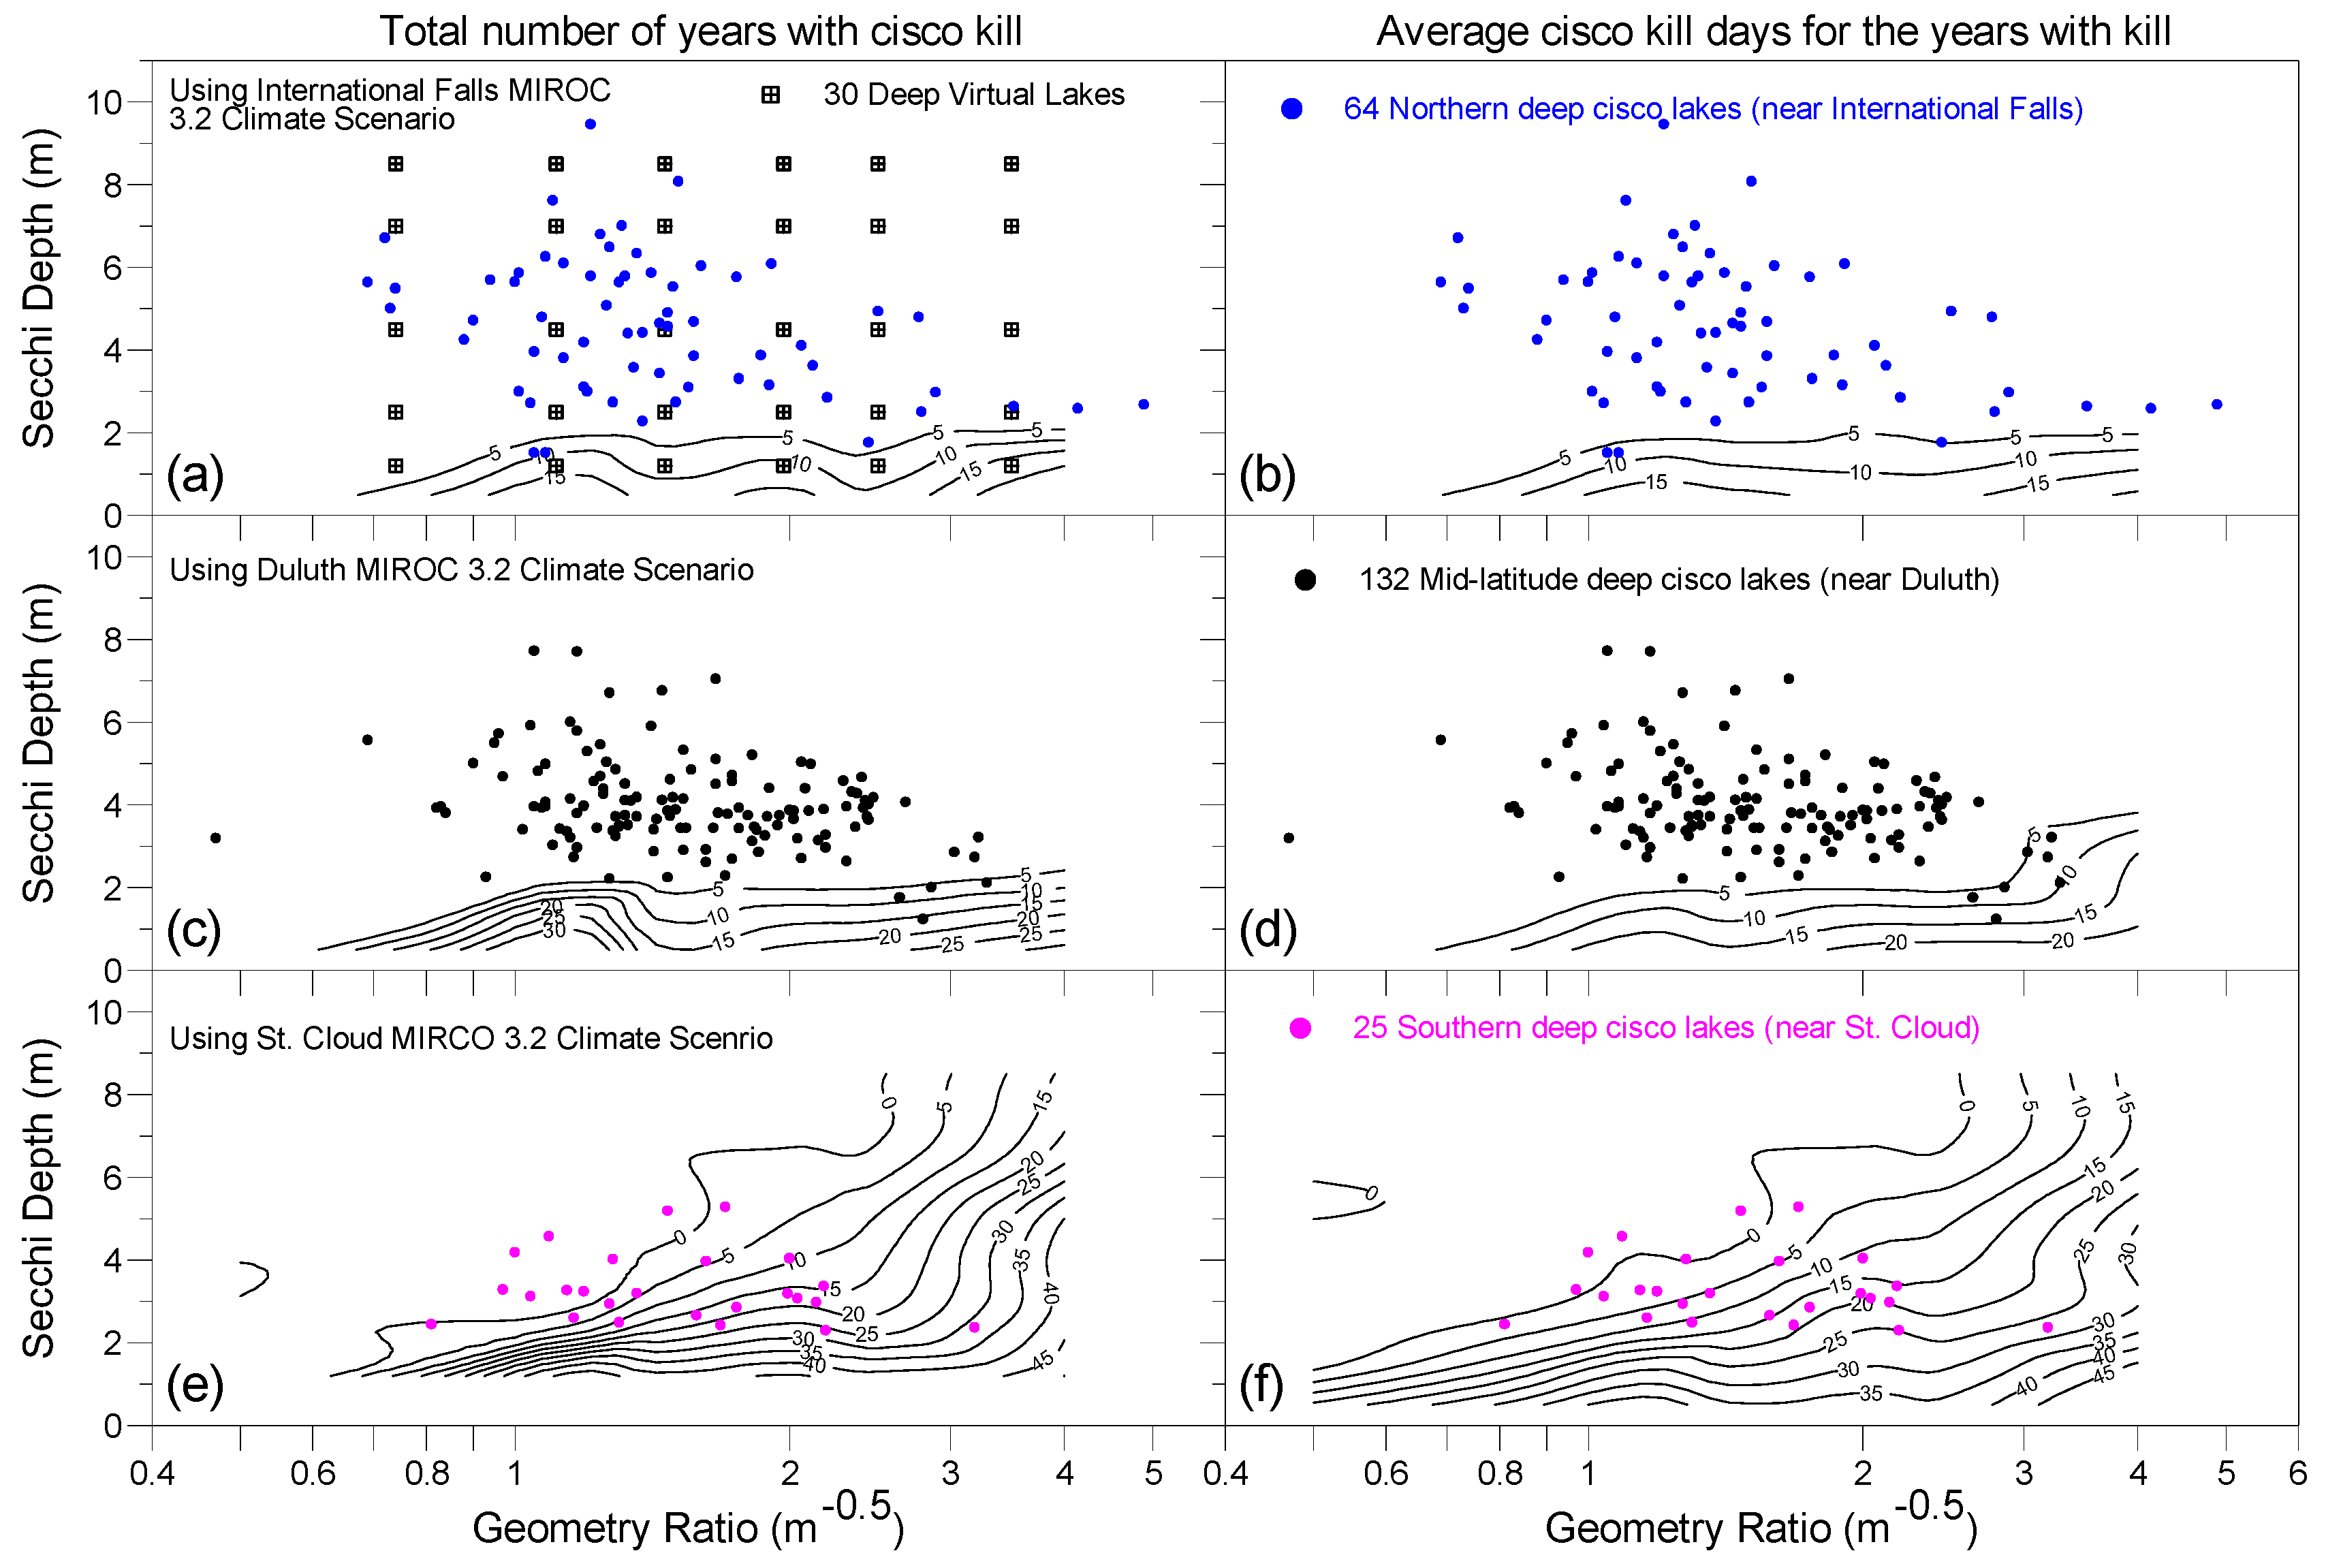
3.3.2. Results of Deep Lakes

Under past climate conditions in Minnesota (1962–2008), none of the 30 virtual lakes (Hmax = 24 m) was simulated to have cisco kill, and this means that 221 deep lakes out of 620 cisco lakes typically have better cisco habitat conditions compared with shallow and medium-depth lakes. Figure 12 shows contour plots of projected total number of years with cisco kill (a,c,e) and average cisco kill days for the years with kills (b,d,f), respectively, under future MIROC 3.2 climate scenario in deep Minnesota lakes. In northern and mid-latitude Minnesota, only relatively eutrophic lakes are projected to have 5 or more years with cisco kill and on average 5 or more days of cisco kill in those years. In southern Minnesota, because of warmer weather conditions, deeper lakes have on average 5–45 days of cisco kill over 5–45 years and show strong dependence on the strength of lake stratification and trophic status, meanwhile, there are a few deep southern lakes that may be able to support cisco in the future as refuge lakes.

4. Discussion

In previous studies [20,30], all 620 cisco lakes were not grouped into shallow, medium-depth, and deep lakes by maximum depth, but all lakes regardless of maximum depth were plotted on contour plots of TDO3 using lake geometry ratio and Secchi depth as independent variables for classify 620 cisco lakes into tier 1, 2, and 3 refuge lakes. The contour plots of TDO3 were generated using simulation results from all 30 virtual deep lakes. Therefore, there was a mismatch between shallow and medium-depth cisco lakes and simulated TDO3 from deep lakes. In this study, cisco lethal conditions were studied separately for shallow, medium-depth, and deep lakes; therefore, this provides more accurate information and consistent extrapolation among lakes with the same maximum depth with respect to cisco survival conditions under past and future climate scenario. The contour plots of total number of years with cisco kill and average cisco kill days for the years with kills simulated for 58 virtual lakes are tools to understand lethal conditions in 620 cisco lakes based on their locations (geometry ratio GR as x axis and Secchi depth Zs as y axis) on those plots (Figure 10, Figure 11 and Figure 12).
Fang et al. [30] used the fixed benchmark method and simulated T and DO profiles to determine multiple-year average annual TDO3, called AvgATDO3, to divide 620 Minnesota cisco lakes into Tier 1, Tier 2, and Tier 3 refuge cisco lakes. Lakes with AvgATDO3 ≤ 11 °C (Tier 1 lakes) were selected to be most suitable for cisco; lakes with 11 °C < AvgATDO3 ≤ 17 °C (Tier 2 lakes) had suitable habitat for cisco; and non-refuge lakes with AvgATDO3 > 17 °C (Tier 3 lakes) would support cisco only at a reduced probability of occurrence or not at all [30]. The 11 and 17 °C contours of AvgATDO3 for each region (northern, mid-latitude, and southern Minnesota) from Fang et al. [30] derived from 30 deep virtual lakes were included with Figure 10. All shallow cisco lakes were classified as non-refuge lakes. At the same time, some medium-depth cisco lakes were classified as Tier 1 and Tier 2 refuge lakes using these two contours from deep lakes. Based on lethal conditions projected using constant LT and DOLethal, these medium-depth lakes can possibly have many years with cisco kill (Figure 10) and have on average two weeks or more days with lethal conditions (Figure 11). Therefore, these medium-depth lakes are not good candidates for cisco refuge lakes.
For 221 deep cisco lakes, Figure 12 shows most of them are possibly good candidates for refuge lakes, but it is not feasible to use cisco kill parameters to classify them into tiered cisco refuge lakes. Some other good growth parameters, e.g., good-growth length, area, and volume used in previous studies [13,14], and TDO3 [30], may or can be used to classify them into tiered refuge lakes, which will be studied in the next step.
Comparing Figure 12 with Figure 10 and Figure 11, one can see that cisco kill parameters have a huge decrease from 13 m medium-depth lakes to 24 m deep lakes under future climate scenario, e.g., 37–47 years to zero years (Zs > 2 m) with cisco kill in northern Minnesota lakes. Because of non-linear complex relationship between lethal condition and lake characteristics (Figure 9), lethal conditions and potential cisco kills in lakes with other maximum depths, e.g., Hmax = 18 m, are currently unknown and should be studied further. We can propose that lakes with Hmax = 13 m represent lakes with Hmax between 11 to 15 m, lakes with Hmax = 18 m represent lakes with Hmax between 15 to 21 m, and lakes with Hmax = 24 m represent lakes with Hmax > 21 m for future study.
Simulation of lethal conditions under the past climate conditions and projection under the future climate scenario are affected by various model inputs, model simplification or assumptions, and boundary conditions. Only one future climate scenario (MINLAKE2012’s atmospheric boundary condition) was used to project cisco lethal conditions. Future climate projection (mean monthly increments over 30 years) has various uncertainties from the global circulation model. In a previous study, three future climate scenarios were used for lake fish habitat projections. Many hydrologic studies related to future projections use an assemblage of future climate scenarios, and the same method can be applied for the current study in the next step. Accuracy of T and DO simulation can directly affect the simulation of cisco lethal conditions in lakes and is affected by model calibration using limited data in some lakes (Table 1) and model parameter/coefficient generalization for simulations in virtual lakes. Model simplification, for example, MINLAKE2012, does not simulate chlorophyll-a but uses generalized seasonal patterns based on observational data from 56 lakes and reservoirs in Europe and North America [46], and can create uncertainties in DO simulation. This study does not focus on the uncertainty of model predication; therefore, uncertainties are not specifically quantified here. We believe the study with various uncertainties still provide useful information on future climate impact on cisco lethal conditions in 620 Minnesota lakes, which in turn provides useful information for future fish resource management.

5. Summary and Conclusions

Projected future climate warming can affect lake water temperature and dissolved oxygen distribution with depth, which can constrain fish habitat in lakes. In this study, a one dimensional (vertical), dynamic water quality model MINLAKE2012 was further calibrated in 23 Minnesota lakes that had observations of cisco mortality or survival in the unusually warm summer of 2006. The fish habitat simulation model FishHabitat2013 using simulated T and DO profiles, constant lethal temperature LT and DO survival limit as input was used to determine lethal conditions of cisco Corgenous artedi in Minnesota lakes. Cisco lethal conditions were simulated in 23 Minnesota lakes for model validation, and in 12 shallow and 16 medium-depth virtual lakes, and 30 virtual deep lakes for model predication/projection. Contour plots of total number of years with cisco kill and average cisco kill days for the years with kills using lake geometry ratio and Secchi depths as x and y axes were used as tools to understand/extrapolate climate impacts on 620 cisco lakes. The following conclusions were drawn.
(1)
When the cisco habitat model used constant LT = 22.1 °C and DOLethal = 3 mg/L, simulated cisco kill (lethal conditions) and having cisco habitat in 2006 had overall good agreement with observations in 23 lakes (18 lakes with “Yes (Yes)” agreement and 4 lakes with partial or “Yes (no)” agreement) (Table 3).
(2)
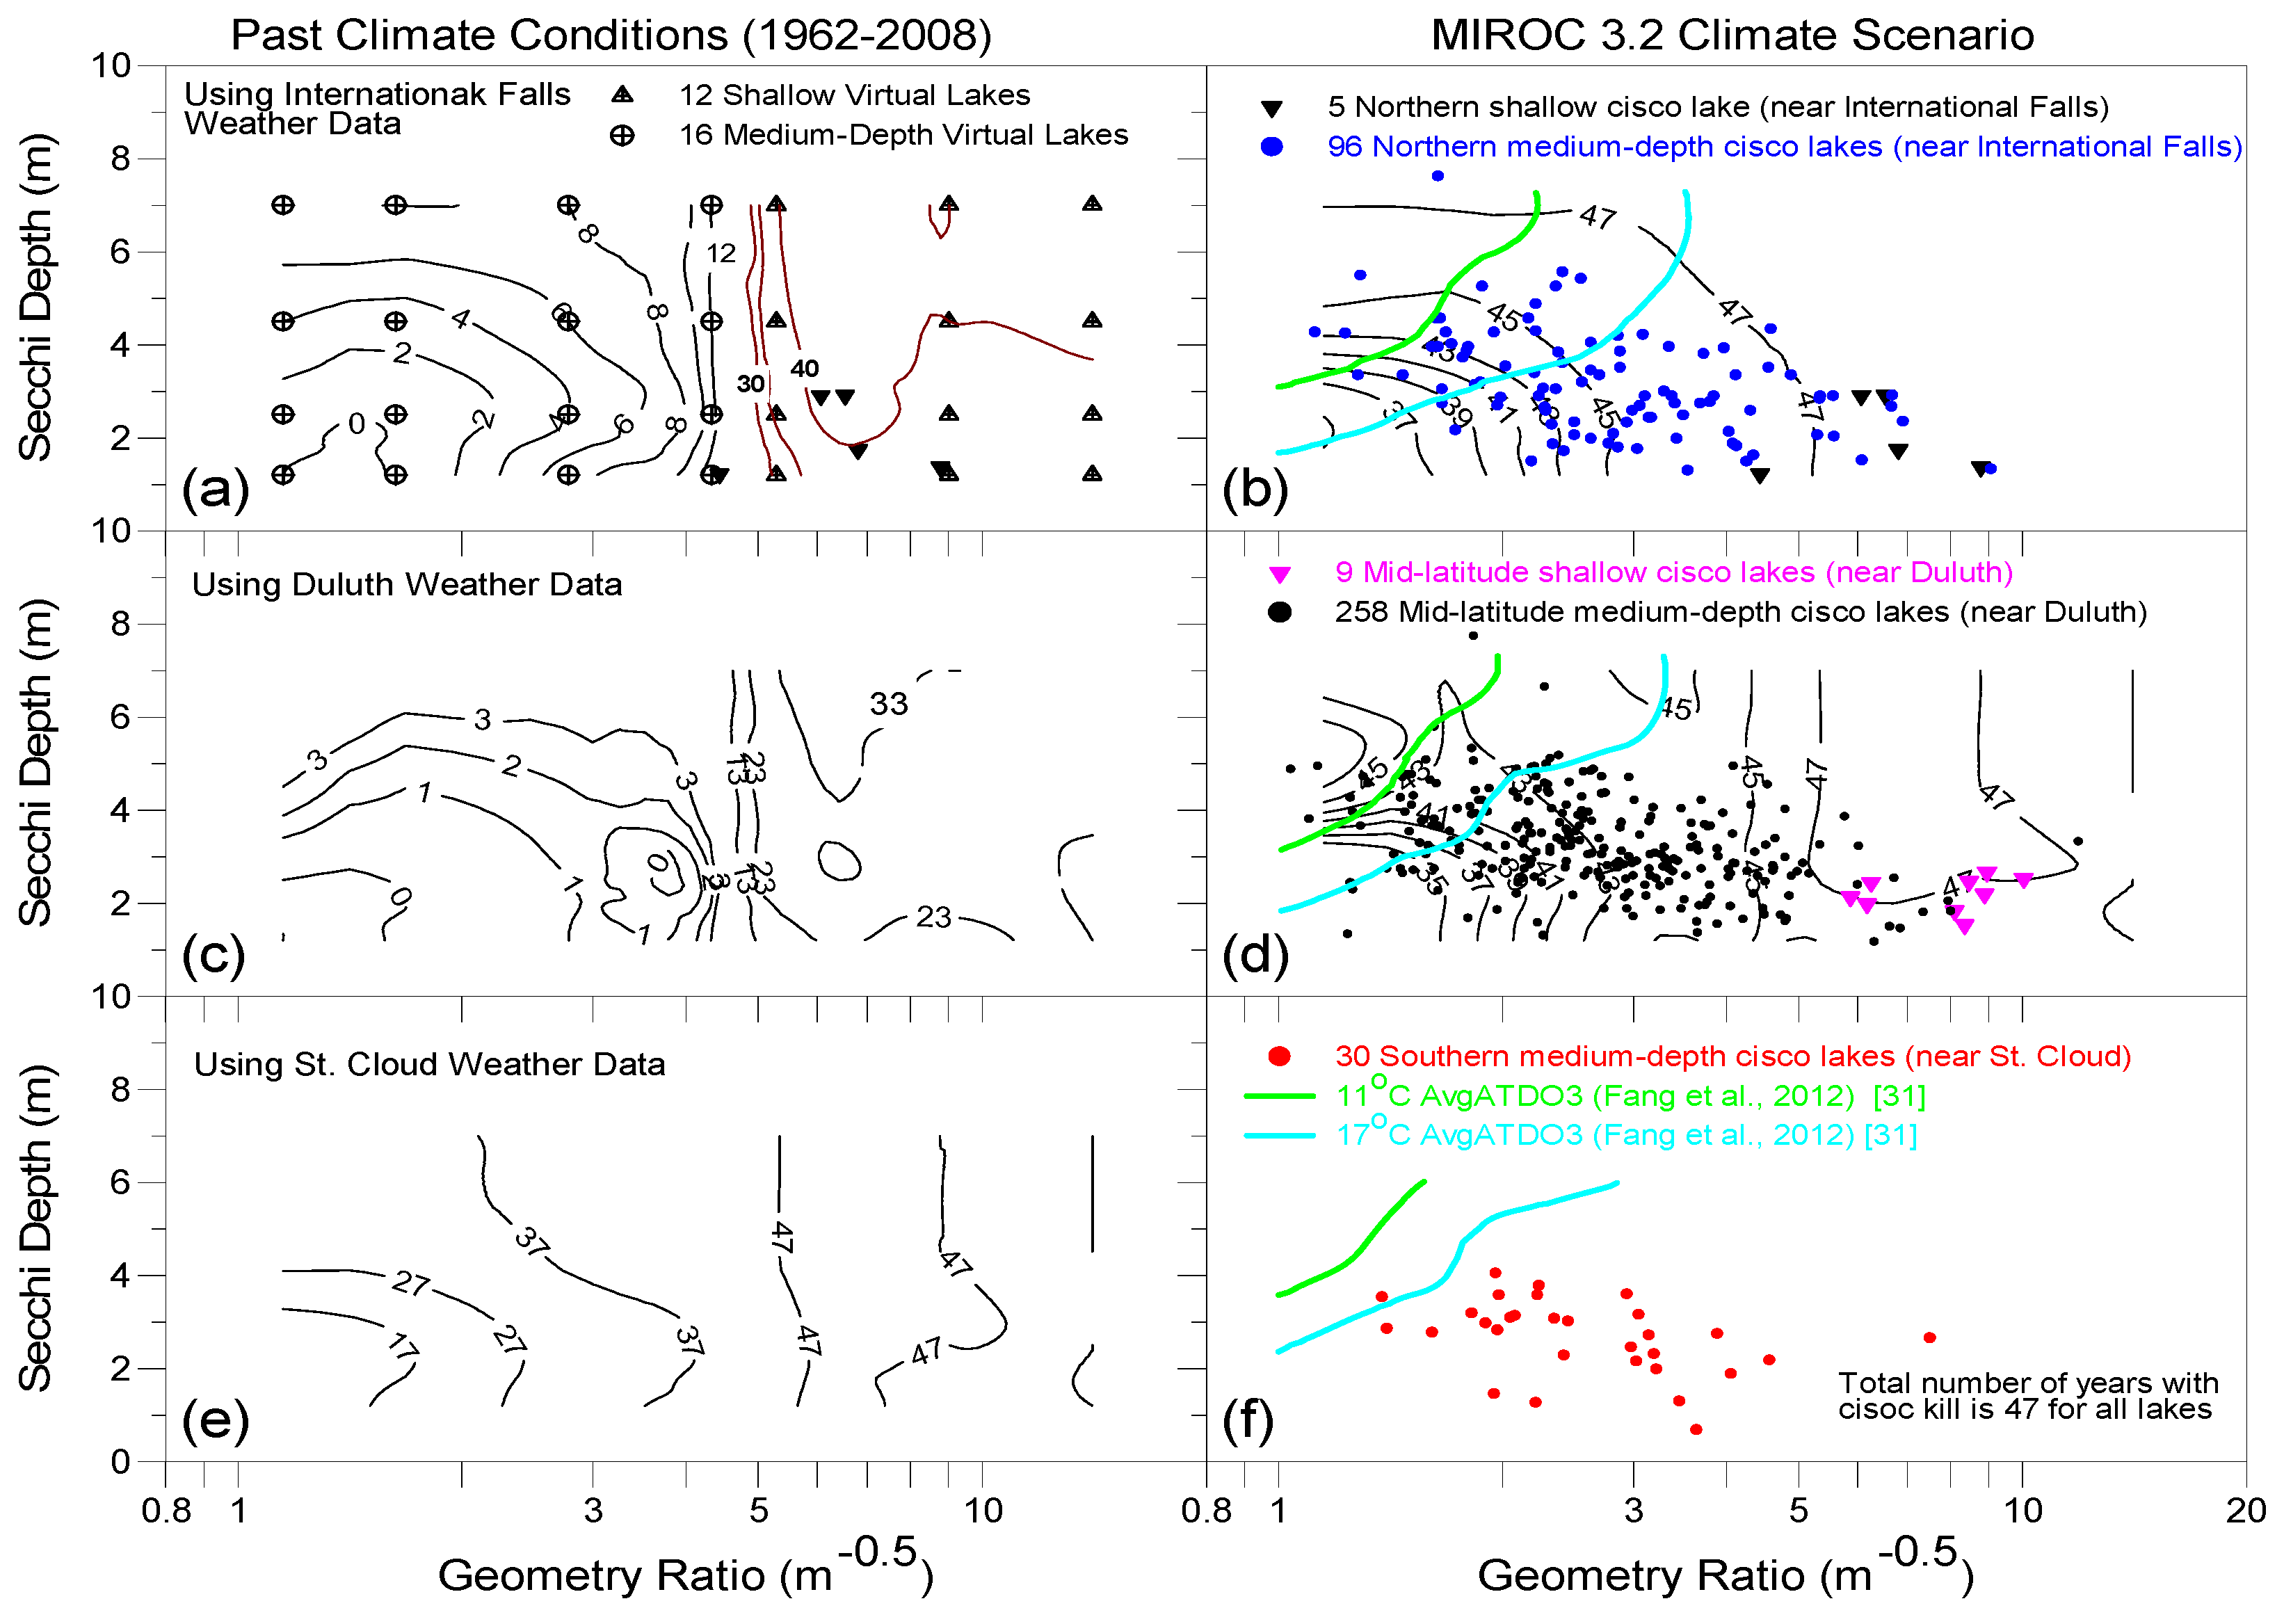
Number of days with lethal conditions strongly depend on the strength of lake stratification (related to lake geometry ratio) and also have a non-linear complex relationship with lake trophic status (represented by Secchi depth) (Figure 9). The total number of years with cisco kill are 31–41 in northern shallow cisco lakes but less than 13 in northern medium-depth cisco lakes under the past climate conditions.
(3)
Under the future MIROC 3.2 climate scenario, shallow cisco lakes are projected to have cisco kill in almost every year with on average more than 30 kill days; medium-depth lakes are projected to have 25–47 years with cisco kill and on average 12–70 kill days. Therefore, shallow and medium-depth lakes are not good candidates for cisco refuge lakes.
(4)
Under the future MIROC 3.2 climate scenario, only relatively eutrophic deep lakes (Secchi depth <2 m) in northern and mid-latitude Minnesota and many southern lakes (Figure 12) have 5 or more years with cisco kill, and all other deep lakes are potential good refuge lakes. Cisco kill parameters cannot be used to classify 221 deep lakes into tiered refuge lakes, and other fish growth parameters should be used for future study.

Acknowledgments

Original MINLAKE2012 and Fishhabitat2013 model enhancement was supported by a research project from the Minnesota Department of Natural Resources through a subcontract from the University of Minnesota.

Author Contributions

Authors collaborated together for the completion of this work. Liping Jiang planned the study, applied the MINLAKE2012 and Fishhabitat2013 models for the fish kill study, Liping Jiang ran the model for all fish kill cases, performed data analyses of model results and wrote the first draft of the manuscript. Xing Fang provided valuable instructions on study design, supervised the data analyses, and reviewed and revised the manuscript. Both authors contributed significantly to the writing of the manuscript.

Conflicts of Interest

The authors declare no conflict of interest.

References

  1. Magnuson, J.J.; Crowder, I.B.; Medvick, P.A. Temperature as an ecological resource. Am. Zool. 1979, 19, 331–343. [Google Scholar] [CrossRef]
  2. Coutant, C.C. Temperature-oxygen habitat for freshwater and coastal striped bass in a changing climate. Trans. Am. Fish. Soc. 1990, 2, 240–253. [Google Scholar] [CrossRef]
  3. Christie, C.G.; Regier, H.A. Measurements of optimal habitat and their relationship to yields for four commercial fish species. Can. J. Fish. Aquat. Sci. 1988, 45, 301–314. [Google Scholar] [CrossRef]
  4. Jacobson, P.C.; Jones, T.S.; Rivers, P.; Pereira, D.L. Field estimation of a lethal oxythermal niche boundary for adult ciscoes in Minnesota lakes. Trans. Am. Fish. Soc. 2008, 137, 1464–1474. [Google Scholar] [CrossRef]
  5. Coutant, C.C. Striped bass, temperature, and dissolved oxygen: A speculative hypothesis for environmental risk. Trans. Am. Fish. Soc. 1985, 14, 31–61. [Google Scholar] [CrossRef]
  6. Fry, E.F.J. The Effect of Environmental Factors on the Physiology of Fish; Academic Press: New York, NY, USA, 1971; Volume 6. [Google Scholar]
  7. National Research Council. Changing Climate: Report of the Carbon Dioxide Assessment Committee; National Research Council (NRC), National Academy Press: Washington, DC, USA, 1983. [Google Scholar]
  8. Intergovernmental Panel on Climate Change. Climate Change 2007—Synthesis Report. The Fourth Assessment Report of the Intergovernmental Panel on Climate Change (IPCC); Cambridge University Press: Cambridge, UK; New York, NY, USA, 2007; p. 127. [Google Scholar]
  9. Blumberg, A.F.; Di Toro, D.M. Effects of climate warming on dissolved oxygen concentrations in Lake Erie. Trans. Am. Fish. Soc. 1990, 119, 210–223. [Google Scholar] [CrossRef]
  10. Fang, X.; Stefan, H.G. Simulations of climate effects on water temperature, dissolved oxygen, and ice and snow covers in lakes of the contiguous United States under past and future climate scenarios. Limnol. Oceangr. 2009, 54, 2359–2370. [Google Scholar] [CrossRef]
  11. De Stasio, J.B.T.; Hill, D.K.; Kleinhans, J.M.; Nibbelink, N.P.; Magnuson, J.J. Potential effects of global climate changes on small north-temperate lakes: Physics, fish, and plankton. Limnol. Oceanogr. 1996, 41, 1136–1149. [Google Scholar] [CrossRef]
  12. Magnuson, J.J.; Webster, K.E.; Assel, R.A.; Bowser, C.J.; Dillon, P.J.; Eaton, J.G.; Evans, H.E.; Fee, E.J.; Hall, R.I.; Mortsch, L.R.; et al. Potential effects of climate changes on aquatic systems: Laurentian Great Lakes and precambrian shield region. Hydrol. Process. 1997, 11, 825–871. [Google Scholar] [CrossRef]
  13. Stefan, H.G.; Hondzo, M.; Fang, X.; Eaton, J.G.; McCormick, J.H. Simulated long-term temperature and dissolved oxygen characteristics of lakes in the north-central United States and associated fish habitat limits. Limnol. Oceanogr. 1996, 41, 1124–1135. [Google Scholar] [CrossRef]
  14. Fang, X.; Stefan, H.G.; Eaton, J.G.; McCormick, J.H.; Alam, S.R. Simulation of thermal/dissolved oxygen habitat for fishes in lakes under different climate scenarios: Part 2. Cold-water fish in the contiguous US. Ecol. Model. 2004, 172, 39–54. [Google Scholar] [CrossRef]
  15. Jacobson, P.C.; Cross, T.K.; Zandlo, J.; Carlson, B.N.; Pereira, D.L. The effects of climate change and eutrophication on cisco Coregonus artedi abundance in Minnesota lakes. Adv. Limnol. 2012, 63, 417–427. [Google Scholar]
  16. Cahn, A.R. An ecological study of southern Wisconsin fishes, the brook silverside and the cisco, in their relation to the region. Ill. Biol. Monogr. 1927, 11, 1–151. [Google Scholar]
  17. Frey, D.G. Distributional ecology of the cisco, Coregonus artedi, in Indiana. Investig. Indiana Lakes Streams 1955, 4, 177–228. [Google Scholar]
  18. Sharma, S.; Zanden, M.J.V.; Magnuson, J.J.; Lyons, J. Comparing Climate Change and Species Invasions as Drivers of Coldwater Fish Population Extirpations. PLoS ONE 2011, 6, e22906. [Google Scholar] [CrossRef] [PubMed]
  19. Jiang, L.; Fang, X.; Stefan, H.G.; Jacobson, P.C.; Pereira, D.L. Identifying cisco refuge lakes in Minnesota under future climate scenarios using variable benchmark periods. Ecol. Model. 2012, 232, 14–27. [Google Scholar] [CrossRef]
  20. Coutant, C.C. Thermal Resistance of Adult Coho (Oncorhynchus kisutch) and Jack Chinook (O. tshawitscha) Salmon and the Adult Steelhead Trout (Salmo gairdnerii) from the Columbia River; BNWL-1508; Battelle Memorial Institute, Pacific Northwest Laboratories: Richland, WA, USA, 1970. [Google Scholar]
  21. McCormick, J.H.; Hokanson, K.E.; Jones, B.R. Effects of temperature on growth and survival of young brook trout (Salvelinus fontinalis). J. Fish. Res. Board Can. 1972, 29, 1107–1112. [Google Scholar] [CrossRef]
  22. Hokanson, K.E.; Kleiner, C.F.; Thorslund, T.W. Effects of constant temperatures and diel temperatures on specific growth and mortality rates and yield of juvenile rainbow trout, Salmo gairdneri. J. Fish. Res. Board Can. 1977, 34, 639–648. [Google Scholar] [CrossRef]
  23. Eaton, J.G.; McCormick, J.H.; Goodno, B.E.; O’Brien, D.G.; Stefan, H.G.; Hondzo, M. A field information based system for estimating fish temperature requirements. Fisheries 1995, 20, 10–18. [Google Scholar] [CrossRef]
  24. Dillon, P.J.; Clark, B.J.; Molot, L.A.; Evans, H.E. Predicting the location of optimal habitat boundaries for lake trout (Salvelinus namaycush) in Canadian Shield lakes. Can. J. Fish. Aquat. Sci. 2003, 60, 959–970. [Google Scholar] [CrossRef]
  25. Stefan, H.G.; Fang, X.; Eaton, J.G. Simulated fish habitat changes in North American lakes in response to projected climate warming. Trans. Am. Fish. Soc. 2001, 130, 459–477. [Google Scholar] [CrossRef]
  26. United States Environmental Protection Agency. Quality Criteria for Water; United States Environmental Protection Agency (US EPA): Washington, DC, USA, 1976.
  27. Chapman, G. Ambient Aquatic Life Criteria for Dissolved Oxygen; U.S. Environmental Protection Agency: Washington, DC, USA, 1986.
  28. Jacobson, P.C.; Stefan, H.G.; Pereira, D.L. Coldwater fish oxythermal habitat in Minnesota lakes: Influence of total phosphorus, July air temperature, and relative depth. Can. J. Fish. Aquat. Sci. 2010, 67, 2003–2013. [Google Scholar]
  29. Nash, J.E.; Sutcliffe, J.V. River flow forecasting through conceptual models part I—A discussion of principles. J. Hydrol. 1970, 10, 282–290. [Google Scholar] [CrossRef]
  30. Fang, X.; Jiang, L.; Jacobson, P.C.; Stefan, H.G.; Alam, S.R.; Pereira, D.L. Identifying cisco refuge lakes in Minnesota under future climate scenarios. Trans. Am. Fish. Soc. 2012, 141, 1608–1621. [Google Scholar] [CrossRef]
  31. Fang, X.; Alam, S.R.; Jacobson, P.; Pereira, D.; Stefan, H.G. Characteristics of Minnesota's Cisco Lakes; St. Anthony Falls Laboratory, University of Minnesota: Minneapolis, MN, USA, 2009. [Google Scholar]
  32. Gorham, E.; Boyce, F.M. Influence of lake surface area and depth upon thermal stratification and the depth of the summer thermocline. J. Gt. Lakes Res. 1989, 15, 233–245. [Google Scholar] [CrossRef]
  33. Stefan, H.G.; Fang, X. Simulated climate change effects on ice and snow covers on lakes in a temperate region. Cold Reg. Sci. Technol. 1997, 25, 137–152. [Google Scholar] [CrossRef]
  34. Stefan, H.G.; Fang, X. Model simulations of dissolved oxygen characteristics of Minnesota lakes: Past and future. Environ. Manag. 1994, 18, 73–92. [Google Scholar] [CrossRef]
  35. Stefan, H.G.; Hondzo, M.; Fang, X. Lake water quality modeling for projected future climate scenarios. J. Environ. Qual. 1993, 22, 417–431. [Google Scholar] [CrossRef]
  36. Fang, X.; Jiang, L.; Jacobson, P.C.; Fang, N.Z. Simulation and validation of cisco habitat in Minnesota lakes using the lethal-niche-boundary curve. Br. J. Environ. Clim. Chang. 2014, 4, 444–470. [Google Scholar] [CrossRef] [PubMed]
  37. Fang, X.; Alam, S.R.; Stefan, H.G.; Jiang, L.; Jacobson, P.C.; Pereira, D.L. Simulations of water quality and oxythermal cisco habitat in Minnesota lakes under past and future climate scenarios. Water Qual. Res. J. Can. 2012, 47, 375–388. [Google Scholar] [CrossRef]
  38. Fang, X.; Stefan, H.G. Development and Validation of the Water Quality Model MINLAKE96 with Winter Data; St. Anthony Falls Laboratory, University of Minnesota: Minneapolis, MN, USA, 1996. [Google Scholar]
  39. Thiery, W.; Stepanenko, V.M.; Fang, X.; Jöhnk, K.D.; Li, Z.; Martynov, A.; Perroud, M.; Subin, Z.M.; Darchambeau, F.; Mironov, D.; et al. LakeMIP Kivu: Evaluating the representation of a large, deep tropical lake by a set of one-dimensional lake models. Tellus A 2014, 2014, 21390. [Google Scholar] [CrossRef]
  40. Yao, H.; Samal, N.R.; Joehnk, K.D.; Fang, X.; Bruce, L.C.; Pieson, D.C.; Rusak, J.A.; James, A. Comparison of lake ice dynamics model performance: Harp Lake, Ontario, Canada. Hydrol. Process. 2014, 24, 4587–4601. [Google Scholar] [CrossRef]
  41. Hasumi, H.; Emori, S. K-1 Coupled GCM (MIROC) Description; Center for Climate System Research, University of Tokyo: Tokyo, Japan, 2004; p. 34. [Google Scholar]
  42. Bennis, S.; Crobeddu, E. New runoff simulation model for small urban catchments. J. Hydrol. Eng. 2007, 12, 540–544. [Google Scholar] [CrossRef]
  43. Cole, G.A. Textbook of Limnology, 3rd ed.; Mosby: St. Louis, MO, USA, 1994; p. 401. [Google Scholar]
  44. Joehnk, K.D.; Umlauf, L. Modelling the metalimnetic oxygen minimum in a medium sized alpine lake. Ecol. Model. 2001, 136, 67–80. [Google Scholar] [CrossRef]
  45. Smith, E.A.; Kiesling, R.L.; Galloway, J.M.; Ziegeweid, J.R. Water Quality and Algal Community Dynamics of Three Deepwater Lakes in Minnesota Utilizing CE-QUAL-W2 Models; U.S. Geological Survey Scientific Investigations Report 2014-5066; 2014; p. 37. Available online: http://dx.doi.org/10.3133/sir20145066 (accessed on 6 July 2016).
  46. Marshall, C.T.; Peters, R.H. General patterns in the seasonal development of chlorophyll a for temperate lakes. Limnol. Oceanogr. 1989, 34, 856–867. [Google Scholar] [CrossRef]
Figure 1. Simulated isopleths of lethal temperatures (LT) and DO lethal limits in 2006 for Andrusia Lake. Selected LT are (a) 22.1 °C and (b) 23.4 °C, and selected DO lethal limits are 2, 3, and 4 mg/L for sensitivity analysis (a,b).
Water 08 00279 g001
Figure 2. Geographic distribution of 23 cisco lakes (red dots) for model calibration and seven weather stations (stars) and grid center point (crosses) of MIROC 3.2 model output on the Minnesota map (with county border lines). Two color horizontal lines are used to separate 620 cisco lakes into northern, mid-latitude, and southern cisco lakes that are associated with three weather stations (International Falls, Duluth, and St. Cloud).
Water 08 00279 g002
Figure 3. Distribution of (a) 12 medium-depth lakes and (b) 11 deep lakes of 23 cisco lakes in Minnesota [4] including (a) 28 shallow and medium-depth virtual lakes (Table 2) and (b) 30 deep virtual lakes [20] plotted using Secchi depth and lake geometry ratio as independent vaiariables.
Water 08 00279 g003
Figure 4. Distribution of (a) 14 shallow and 385 medium-depth cisco lakes and (b) 221 deep cisco lakes from 620 cisco study lakes in Minnesota including 58 virtual lakes plotted using Secchi depth and lake geometry ratio as independent vaiariables.
Water 08 00279 g004
Figure 5. Conceptual flowchart of modeling steps implemented in the study.
Water 08 00279 g005
Figure 6. Time series of simulated temperature and measured temperature at different depths for Pine Mountain Lake and Big Trout Lake in 1999–2007. Pine Mountain Lake had cisco kill and Big Trout Lake did not have cisco kill in 2006. The lethal temperature of 22.1 °C is presented as horizontal lines.
Water 08 00279 g006
Figure 7. Time series of simulated DO and measured DO at different depths in 1999–2007 for Big Trout Lake that had no cisco kill in 2006. DO lethal limit of 3 mg/L is presented as horizontal lines.
Water 08 00279 g007
Figure 8. Time series of simulated DO and measured DO at different depths in 1999–2007 for Pine Mountain Lake that had cisco kill in 2006. DO lethal limit of 3 mg/L is presented as horizontal lines.
Water 08 00279 g008
Figure 9. Simulated isopleths of LT and DO survival limit in four medium-depth small virtual lakes (Hmax = 13 m, As = 0.2 km2) using depth versus time plots showing cisco lethal-condition days. The Secchi depths of four lakes (top to bottom frames) are 1.2, 2.5, 4.5, and 7 m, respectively.
Water 08 00279 g009
Figure 10. Contour plots of total number of years with cisco kills under past climate conditions (a,c,e) and future MIROC 3.2 climate scenario (b,d,f). International Falls (a,b), Duluth (c,d), and St. Cloud (e,f) weather data were used for model simulations. Contours were derived by interpolation from simulated points for 12 shallow and 16 medium-depth virtual lakes. The 11 and 17 °C contours of AvgATDO3 from Fang et al. [30] are included.
Water 08 00279 g010
Figure 11. Contour plots of average cisco kill days for the years with kills under past climate conditions (a,c,e) and future MIROC 3.2 climate scenario (b,d,f). International Falls (a,b), Duluth (c,d), and St. Cloud (e,f) weather data were used for model simulations. Contours were derived by interpolation from simulated values (points) for 12 shallow and 16 medium-depth virtual lakes.
Water 08 00279 g011
Figure 12. Contour plots of total number of years with cisco kills (a,c,e) and average cisco kill days for the years with kills (b,d,f) in deep lakes under future MIRCO 3.2 climate scenario. International Falls (a,b), Duluth (c,d), and St. Cloud (e,f) weather data were used for model simulations. Contours were derived by interpolation from simulated points for 30 virtual deep lakes.
Water 08 00279 g012
Table 1. Weather stations and field data used in MINLAKE2012 model calibrations and water temperature and dissolved oxygen calibration results of 23 cisco lakes.
Lake Name (Hmax (m), GR, (m−0.5)) 1Weather Station UsedField Data Used in SimulationTDO
YearsDays (Data Pairs 4)RMSE 5NSE 6RMSENSE
Little Turtle (8.8, 4.21)Grand Rapids061 (14)0.340.902.270.48
Star (28.7, 2.26)Fargo73, 00, 063 (43)2.160.811.150.90
Mille Lacs (13.0, 11.89)Brainerd81,90–92, 00, 0170 (699)1.880.861.300.17
Andrusia (18.3, 2.75)Bemidji76–78, 86, 0611 (95)2.470.812.290.66
Little Pine (19.2, 2.77) 2Fargo80, 85, 86, 066(100)1.970.772.710.50
Cotton (8.5, 6.07)Bemidji99, 065 (53)0.920.931.190.82
Pine Mountain (24.4, 2.11)Brainerd98, 99, 01, 02, 04–0727 (519)1.850.822.580.58
Leech (13.0, 10.91)Bemidji061 (14)0.360.731.86−0.1
Bemidji (23.2, 3.13)Bemidji061 (23)2.080.880.840.95
Itasca (12.2, 3.32)Bemidji06, 0818 (208)2.890.702.490.56
Gull (24.4, 3.26)Brainerd76–78, 89, 91, 92, 04, 0631 (480)1.690.861.240.90
Woman (16.5, 4.02)Grand Rapids88, 01–04, 0621 (392)2.100.811.990.60
Straight (19.2, 1.94)Bemidji06, 072 (33)0.880.981.360.93
Little Pine (11.0, 2.90) 3Brainerd92–96, 98–02, 0647 (465)3.610.532.460.63
7th Crow Wing (12.8, 2.49)Bemidji061 (12)0.910.880.870.95
8th Crow Wing (9.1, 4.11)Fargo73, 00, 063 (43)1.060.912.170.12
Long (39.0, 1.22)Fargo061 (18)0.830.971.170.90
Carlos (49.7, 1.15)St. Clouds79, 80, 86, 06, 0817 (394)1.620.931.380.86
Total or Average (above 18 lakes with cisco kill in 2006)266 (3605)1.650.841.740.64
Reference lakes without cisco kill
Big Trout (39.0, 1.24)Brainerd92–02, 0647 (938)1.660.921.570.67
Kabekona (40.5, 1.38)Bemidji94, 066 (130)1.310.950.770.93
Scalp (27.4, 1.15)Fargo85, 86, 064 (75)1.250.972.890.57
Ten Mile (63.4, 1.06)Bemidji01, 02, 06, 0895 (2771)1.600.911.500.69
Rose (41.8, 1.12)Fargo061 (25)0.680.991.590.80
Total or Average (above 5 lakes without cisco kill in 2006)153 (3939)1.300.951.660.73
Total or Average (all 23 lakes)419 (7544)1.570.861.720.66
Notes: 1 Hmax is the maximum lake depth and GR is the lake geometry ratio (GR) = As0.25/Hmax (As is surface area in m2); 2 Little Pine Lake at Otter Tail County; 3 Little Pine Lake at Crow Wing County; 4 number of pairs of simulated and observed T or DO data (at different days and at different depths) for computing model error parameters; 5 Root-mean-square error (RMSE) between simulated and measured (https://en.wikipedia.org/wiki/Root-mean-square_deviation); and 6 Nash-Sutcliff model efficiency (NSE) coefficient [19].
Table 2. Morphometric characteristics and “names” of the 12 shallow and 16 medium-depth virtual lakes simulated with the MINLAKE2012 and FishHabitat2013 models.
Maximum Depth (m)Surface AreaSecchi Depth Zs (m)Geometry Ratio
As (km2)1.22.54.57.0GR = As0.25/Hmax 1
Hmax = 4 (Shallow)0.2LakeR01LakeR02LakeR03LakeR28 25.29
1.7LakeR04LakeR05LakeR06LakeR29 29.03
10LakeR07LakeR08LakeR09LakeR30 214.06
Hmax = 13 (Medium-depth)0.05LakeR37 2LakeR38 2LakeR39 2LakeR40 21.15
0.2LakeR10LakeR11LakeR12LakeR31 21.63
1.7LakeR13LakeR14LakeR15LakeR32 22.78
10LakeR16LakeR17LakeR18LakeR33 24.33
Notes: 1 As is the lake surface area in m2 when it is used to compute the geometry ratio GR; and 2 10 new virtual lakes added for the study (LakeR19–R27 and LakeR34–R36 are virtual lakes used in other studies).
Table 3. 2006 lethal conditions of cisco in 23 lakes simulated using the constant value method with lethal temperature of 22.1 °C and DO lethal limit of 3 mg/L and validation results against 2006 cisco mortality or survival conditions.
Lake NameLethal ConditionsSimulated Continuous Lethal Days in 2006Cisco Mortality Day (Julian Day)Model Agreement
First DayLast DayNo. of Days
Little Turtle18024162180 (62) 37/19 (200)Yes (Yes) 4
Star20421613204 (13)7/19 (200)Yes (No)
Mille Lacs20425148204 (48)7/23 (204)Yes (Yes)
Andrusia19225059192 (59)7/21 (202)Yes (Yes)
Little Pine 120221615202 (15)7/22 (203)Yes (Yes)
Cotton18424158184 (58)7/24 (205)Yes (Yes)
Pine Mountain19325053193 (36); 232 (13); 247 (4)7/26 (207)Yes (Yes)
Leech18822535188 (3); 193 (30); 224 (2)7/30 (211)Yes (Yes)
Bemidji2122176212 (6)7/27 (208)Yes (No)
Itasca18924149189 (2); 192 (34); 227 (10); 239 (3)7/28 (209)Yes (Yes)
Gull20622520206 (20)7/29 (210)Yes (Yes)
Woman18324159183 (59)7/29 (210)Yes (Yes)
Straight2112155211 (5)8/01 (213)Yes (Yes)
Little Pine 2762507176 (20); 187 (1); 192 (34); 227 (2); 231 (6); 238 (4); 247 (4)8/02 (214)Yes (Yes)
7th Crow Wing19721519197 (19)8/04 (216)Yes (No)
8th Crow Wing18824154188 (54)8/04 (216)Yes (Yes)
Long2142163214 (3)8/06 (218)Yes (No)
Carlos08/27 (239)No (No)
Five reference lakes without cisco kills in 2006
Big Trout0No KillNo KillYes
Kabekona
Scalp
Ten Mile
Rose
Notes: 1 Little Pine Lake at Otter Tail County; 2 Little Pine Lake at Crow Wing County; 3 stands for a Julian Day in 2006 and number of continuous cisco lethal days after the day predicted by the fish habitat model; and 4 the first Yes/No gives the agreement of cisco lethal prediction and reported cisco mortality in 2006 and Yes/No inside brackets gives the agreement whether or not cisco lethal days from the model include reported date with cisco mortality or not.
Table 4. 2006 lethal days simulated in the 23 cisco lakes using the constant value method with six different combinations of lethal temperatures and DO limits.
Lake NameLT = 23.4 °CLT = 22.1 °C
DO = 2 mg/LDO = 3 mg/LDO = 4 mg/LDO = 2 mg/LDO = 3 mg/LDO = 4 mg/L
Little Turtle272929556263
Star00601319
Mille Lacs363636484848
Andrusia192529505965
Little Pine (Otter Tail)13541520
Cotton373737575858
Pine Mountain122335295369
Leech242424353535
Bemidji0000612
Itasca262728434954
Gull001722048
Woman272829505961
Straight0050518
Little Pine (Crow Wing)1850683671105
7th Crow Wing31019121921
8th Crow Wing282930525454
Long0000310
Carlos000000
Big Trout, Kabekona, Scalp, Ten Mile, Rose000000

