1. Introduction
In September 2000, eight Millennium Development Goals (MDGs) were outlined during the UN Millennium Summit in New York [
1]. Essential to these goals were plans to achieve significant improvements in access to safe drinking water, basic sanitation, and adequate water resources for agricultural and income-generating activities in the world’s poorest nations. Water was both directly and indirectly related to all eight of the MDGs, and is for this reason a critical component of global sustainability. These MDGs expired in 2015 and were replaced by the Sustainable Development Goals (SDGs), which strive to achieve the water related MDGs where they fell short and continue to increase the number of people with access to potable water [
2,
3]. The Millennium Village Project (MVP) was conceived in 2004 as a method of testing the ability to achieve the MDGs at the village level [
4]. The MVP operates in 80 villages organized into 14 clusters throughout Africa.
Although Koraro, a Millennium Village (MV) located in semiarid highlands of Ethiopia, faces water development challenges common to many rural, arid areas including scarcity, poor access, long travel times due to low density settlement patterns, soil erosion, and resource degradation, specific local needs were undocumented at the start of the MVP project. Without a nuanced understanding of local need and opportunities, aid workers face difficulty in calibrating local interventions for maximum sustainability impact. This work was motivated by a goal of infusing local knowledge into the planning, design, and implementation of water interventions in Koraro. More generally, we posit that a poor understanding of local needs has hindered progress not only on the MDGs, but also on other efforts to promote sustainable development worldwide.
Approaches that feature singular solutions to complex water security problems like the one faced by Koraro have often proved ineffectual. Designed and implemented from afar, these plans often overlook the local constraints, opportunities, and needs of specific places and populations, leading to the failure on many fronts, not least the marginalization and demoralization of the intended beneficiaries [
5,
6]. For example, ignoring the concomitant ecological management of the water temple system in Bali led to an influx of pests during top-down implementation of the Green Revolution [
7]. Likewise, the failure of soil and water conservation planning in the Chemoga watershed of rural Ethiopia was due in large part to unwilling and disinterested participation of local farmers in a top-down plan to construct structures widely perceived as ineffective [
8].
In contrast, stakeholder participation, the information exchange between developers and those most likely to be affected by an intervention, is now widely recognized as an essential part of development for all nations [
9,
10,
11]. Stakeholder participation was identified as a key component of integrated water resource management planning efforts in Uzbekistan [
12], and was reported as crucial to successful and sustainable water resource management efforts in Tanzania [
13]. Household involvement in decision-making was found to have had a positive impact on residents’ satisfaction, equal access, and time savings in rural water supply projects in India [
14]. In the Netherlands, the Netherlands Environmental Assessment Agency developed their
Guidance for Stakeholder Participation as an attempt to standardize budding theory in the field and put them into practice [
15].
In a similar fashion, though not technically specified as such, legislation in the European Union and the US requires public participation in water policy development and implementation [
16,
17]. In Arizona, a stakeholder engagement project included resident input into the development of a hydrologic model, linking participation with groundwater governance [
18].
This paper demonstrates one methodology for rapidly assessing local needs in advance of the planning and design of water resource projects. The methodology seeks to uncover highly relevant, interconnected social and environmental factors, teasing out differences in needs and goals between different stakeholder groups [
19]. At the outset, it appeared that such a model might reveal that current groundwater utilization in Koraro is completely reasonable, given the variability in regional precipitation and, further, indicate specific approaches to its use that would encourage safe and effective use of the resource.
The goals of the research were: (1) to assess the efficacy of a stakeholder workshop framework for the collection of stakeholder data in a rural setting to evaluate the distribution of “viable” water sources; (2) to evaluate the stakeholder data with regards to the MDG implemented water infrastructure to understand if needs could be met; and (3) to design a water intervention strategy that addresses the needs of the stakeholders. Ultimately, data from the workshop were used to evaluate the resultant physical and social changes that stemmed from implementation of water resource interventions.
The paper presents the workshop findings and subsequent development activities in Koraro and evaluates the degree to which implemented strategies met the stated needs of residents. Only now, with the conclusion of major interventions occurring as part of the MVP, can the importance of stakeholder engagement in water access planning undergo proper evaluation with respect to its role in development practices, especially as they relate to the expired MDGs and the new SDG agenda.
3. Results and Discussion
A general timeline of the work completed as part of this research is included in
Table 2. The bulk of the discussion will focus on the participatory workshop findings as well as evaluations of implemented interventions.
Participant solicitation for the workshop was challenging. The population of the area is nearly equally divided between men and women (51% and 49%, respectively); yet, the project was unable to reflect the same gender spread in the workshop. The workshop, instead, was primarily male with only 29% female participants. This is most likely due to the minimum literacy requirement for participation. According to the Ethiopia Demographic and Health Study (EDHS), 38% of women in Ethiopia are literate, but in rural settings this number drops to less than 30%, whereas 65% of men are literate with 60% of rural population males literate [
27]. Due to the literacy disparities, the workshop sample is more representative of the literacy rates than the gender ratio for the area. Despite these literacy requirements, many still could not read complete paragraphs.
In total, 45 residents participated, with 19, 14, and 12 participants from the Koraro, Talla, and Tenskua Kushet, respectively. The participants were comprised of the following: village administrators (5); priests and religious representatives (5); female heads of home (8); students (9); water, health, and development sector personnel (10); community/agricultural facilitators (2); community elders (3); farmers (2); and a non-specified community member (1). The participant pool represented major water users and community decision makers for the area.
Participants provided stirring and, in many cases, highly personal accounts of water difficulties. Participants often related water quality to water source and health outcomes. For example, a young female participant bathed, out of professed necessity, using water from a pool she suspected to be contaminated and the girl later developed a rash she attributed to use of the pool source. Other participants attributed dysentery or other illnesses to consumption of water from pools used by livestock and wildlife.
A second recurring theme in the anecdotes was extreme thirst leading to measures not usually taken for acquisition of drinking water. In many cases, the extreme thirst occurred during migration, such as that which took place during the 1983–1984 drought, during periods of military service, during illness, or under conditions such as being lost. In numerous anecdotes, participants were forced to drink their urine or consume discharge from a sewage system, as no other water sources were available.
Difficulties in acquiring water were cited by many participants as their worst water-related anecdote. Difficulties encountered were physical hazards (well collapse, attempted rape, and attack by wild animals) in addition to other difficulties such as long times allocated to water acquisition and conflicts that arose at water points during periods of scarcity. In several cases, clay pots used for transporting water to households broke in transit, resulting in no household water for that day. One respondent provided an overview of water resource availability and coping strategies used by Koraro villagers during the 1983–1984 drought. Because drought and its response are central to the well-being of people in Koraro, a translation of this participant’s description is provided in full below.
In 1984 were dark days. Our crops started better. In the beginning of August, there was a huge dark cloud. I watched hoping for rain but it did not pour. We migrated to Western Tigray. Our animals got water and pasture. We returned but the same happened the following year. There was no rain. The groundwater had dried up. All the springs dried except those under the cliffs. Animals were also thirsty. There was no water on the flood lands. We had to migrate. We had to go early to water one animal at a time. There was conflict and competition for water. Some people were scaring people to go away from the water. We used to drink dark brown water that the animals even rejected. There were cases when people went to other villages and borrowed or bartered water for grains. Sometimes it was easier to get food than water. Sometimes we could not get both. In the past water was really scarce.
The severity of the 1983–1984 drought and the compounding political issues that lead to widespread famine and the fact that most of the worst memories come from water scarcity issues related to that time period is important to consider in water resources planning moving forward. In an investigation of the spatial distribution of rainfall in Ethiopia, Cheung, Senay, and Singh [
28] found little variability in the nation’s rainfall between 1960 and 2002, even though the years of the drought were among the lowest rainfall in the study. Most of the North and Northeastern parts of the country saw higher variability in the Belg rainfall season, the lighter rainfall season lasting from March to May preceding the main rainfall season (Kiremt) from June through September [
28]. The Kiremt season is susceptible to El-Nino Southern Oscillation influences, marked by suppressed rainfall [
29], potentially making drought conditions and the ensuing economic impact for the area a regular occurrence. Implemented water development projects must, therefore, consider climate forecasts and predictions to sustainably supply water into the future.
3.1. Water Uses
The water uses identified by workshop participants are listed in
Table 3. Additional information on the use of particular water sources was developed based on discussions among participants and with the facilitators. For example, hygiene-related water activities (bathing and clothes-washing) are generally performed concurrently by different individuals at surface water sources. The categories into which uses were grouped were developed by workshop facilitators (independent of participants) and were based on activity location and not the intended use; hence “dilution of pesticides” is listed under household use as most reported physically conducting this activity at the house and not out in the field. These categories were chosen to make subsequent activities practical.
3.2. Water Sources
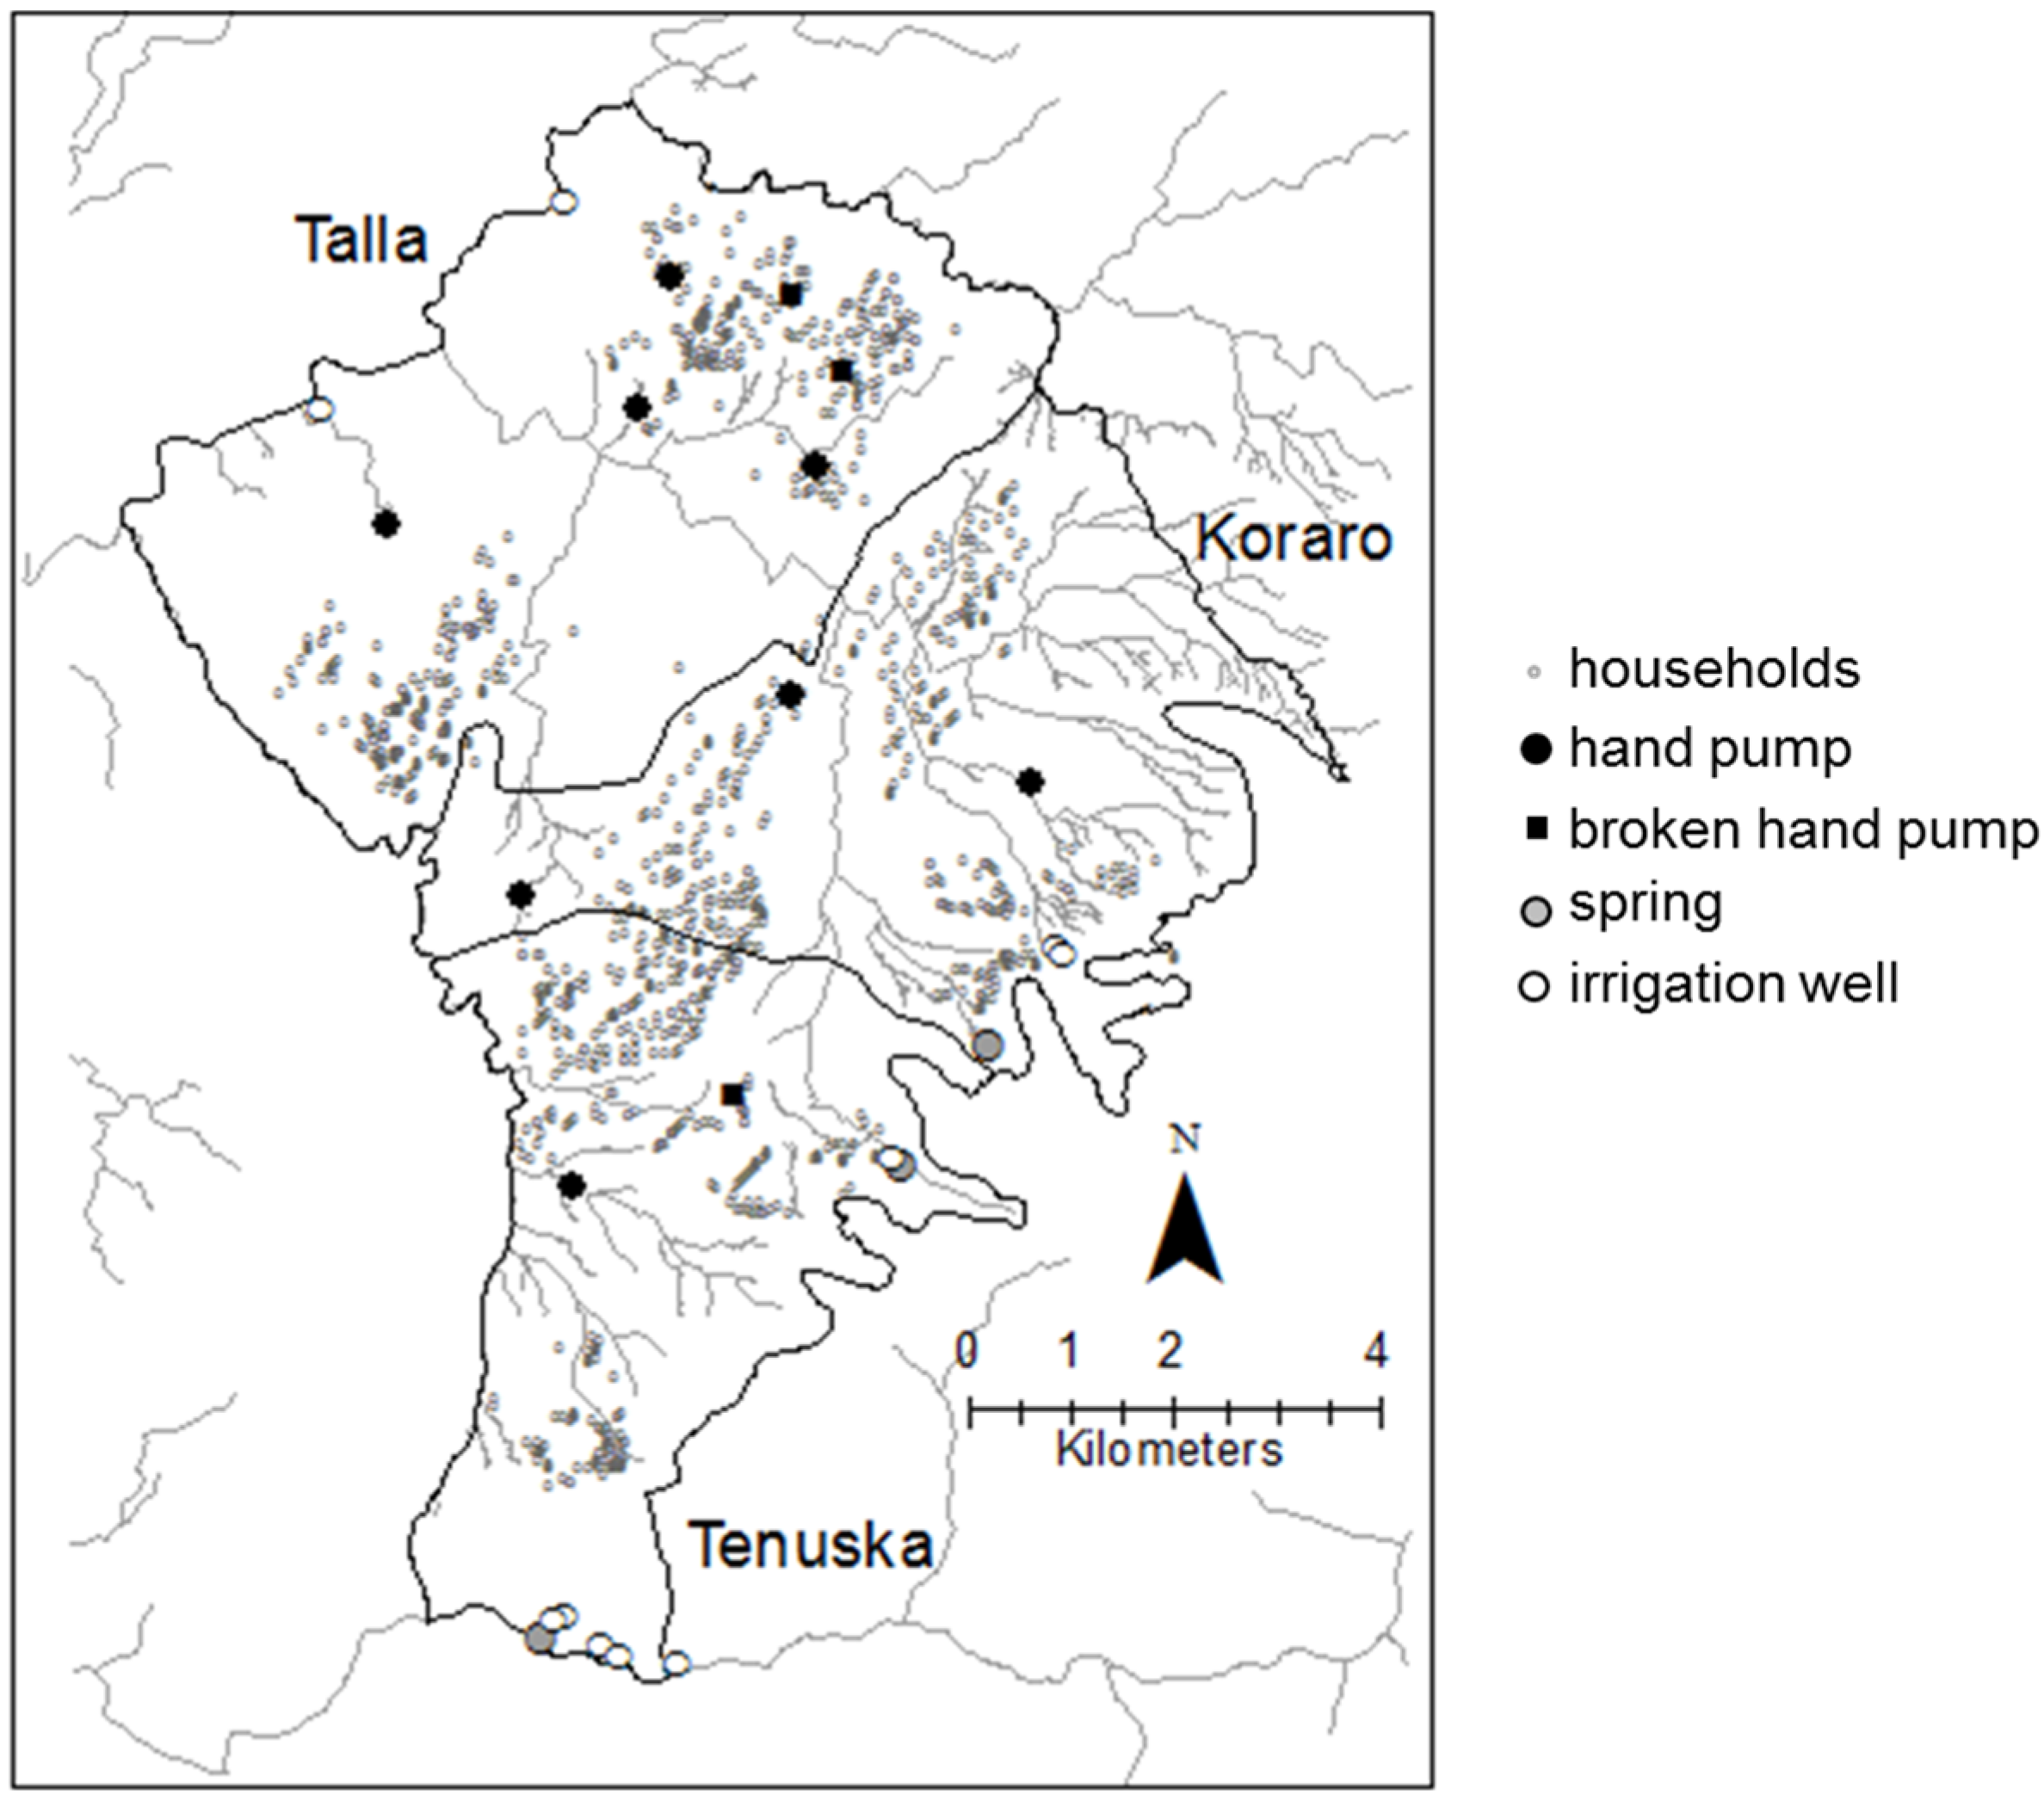
Koraro residents generally refer to particular water sources by a specific name, often preceded by “mai,” the Tigrina word for water. General water source types identified include developed springs, undeveloped springs, one river with year-round flow (the Agefet River), one river with flow only in the rainy season and part of the dry season (the Werei River), wells with hand pumps, wells without hand pumps, constructed rainwater storage, and beds of ephemeral streams. All of the water sources in the Koraro region are depicted in
Figure 1. Streams depicted in
Figure 1 include ephemeral and permanent streams extracted from available world stream datasets and created by manually tracing riverbeds using satellite imagery. Similarly, no GIS shape layer existed for the Koraro Kushets requiring the manual creation of all three using administrative maps obtained from Ethiopia. The only stream with year-round flow in the study area is the Agefet River, which forms the southern boundary of the region under review. The Werei River, forming the northwest boundary of Talla Kushet, typically flows eight or nine months of the year. All other streams flow only for a short period after rain events.
Water points constructed immediately downstream from spring sources allow access and encourage spring protection. Undeveloped springs are generally found near the cliffs that form the eastern edge of the study area, and along the banks of the Werei and Agefet Rivers. The undeveloped springs are commonly located in a rapidly-eroding gulley approximately 50 m from the discharge of the gulley to the Agefet River. One such spring in the gully was reported to be used extensively by residents of the Tensuka Kushet.
Riverbeds of ephemeral streams were cited as an important source of water in the study region. The streams are filled with coarse sands and store runoff from the nearby cliffs. Water can be found in the streambed within 50 cm of the ground surface immediately at the end of the rainy season. Toward the end of the rainy season, the depth to water may be 2 m or greater below ground, based on information drawn from interviews with Koraro residents. Livestock were not mentioned to have restricted access to riverbeds.
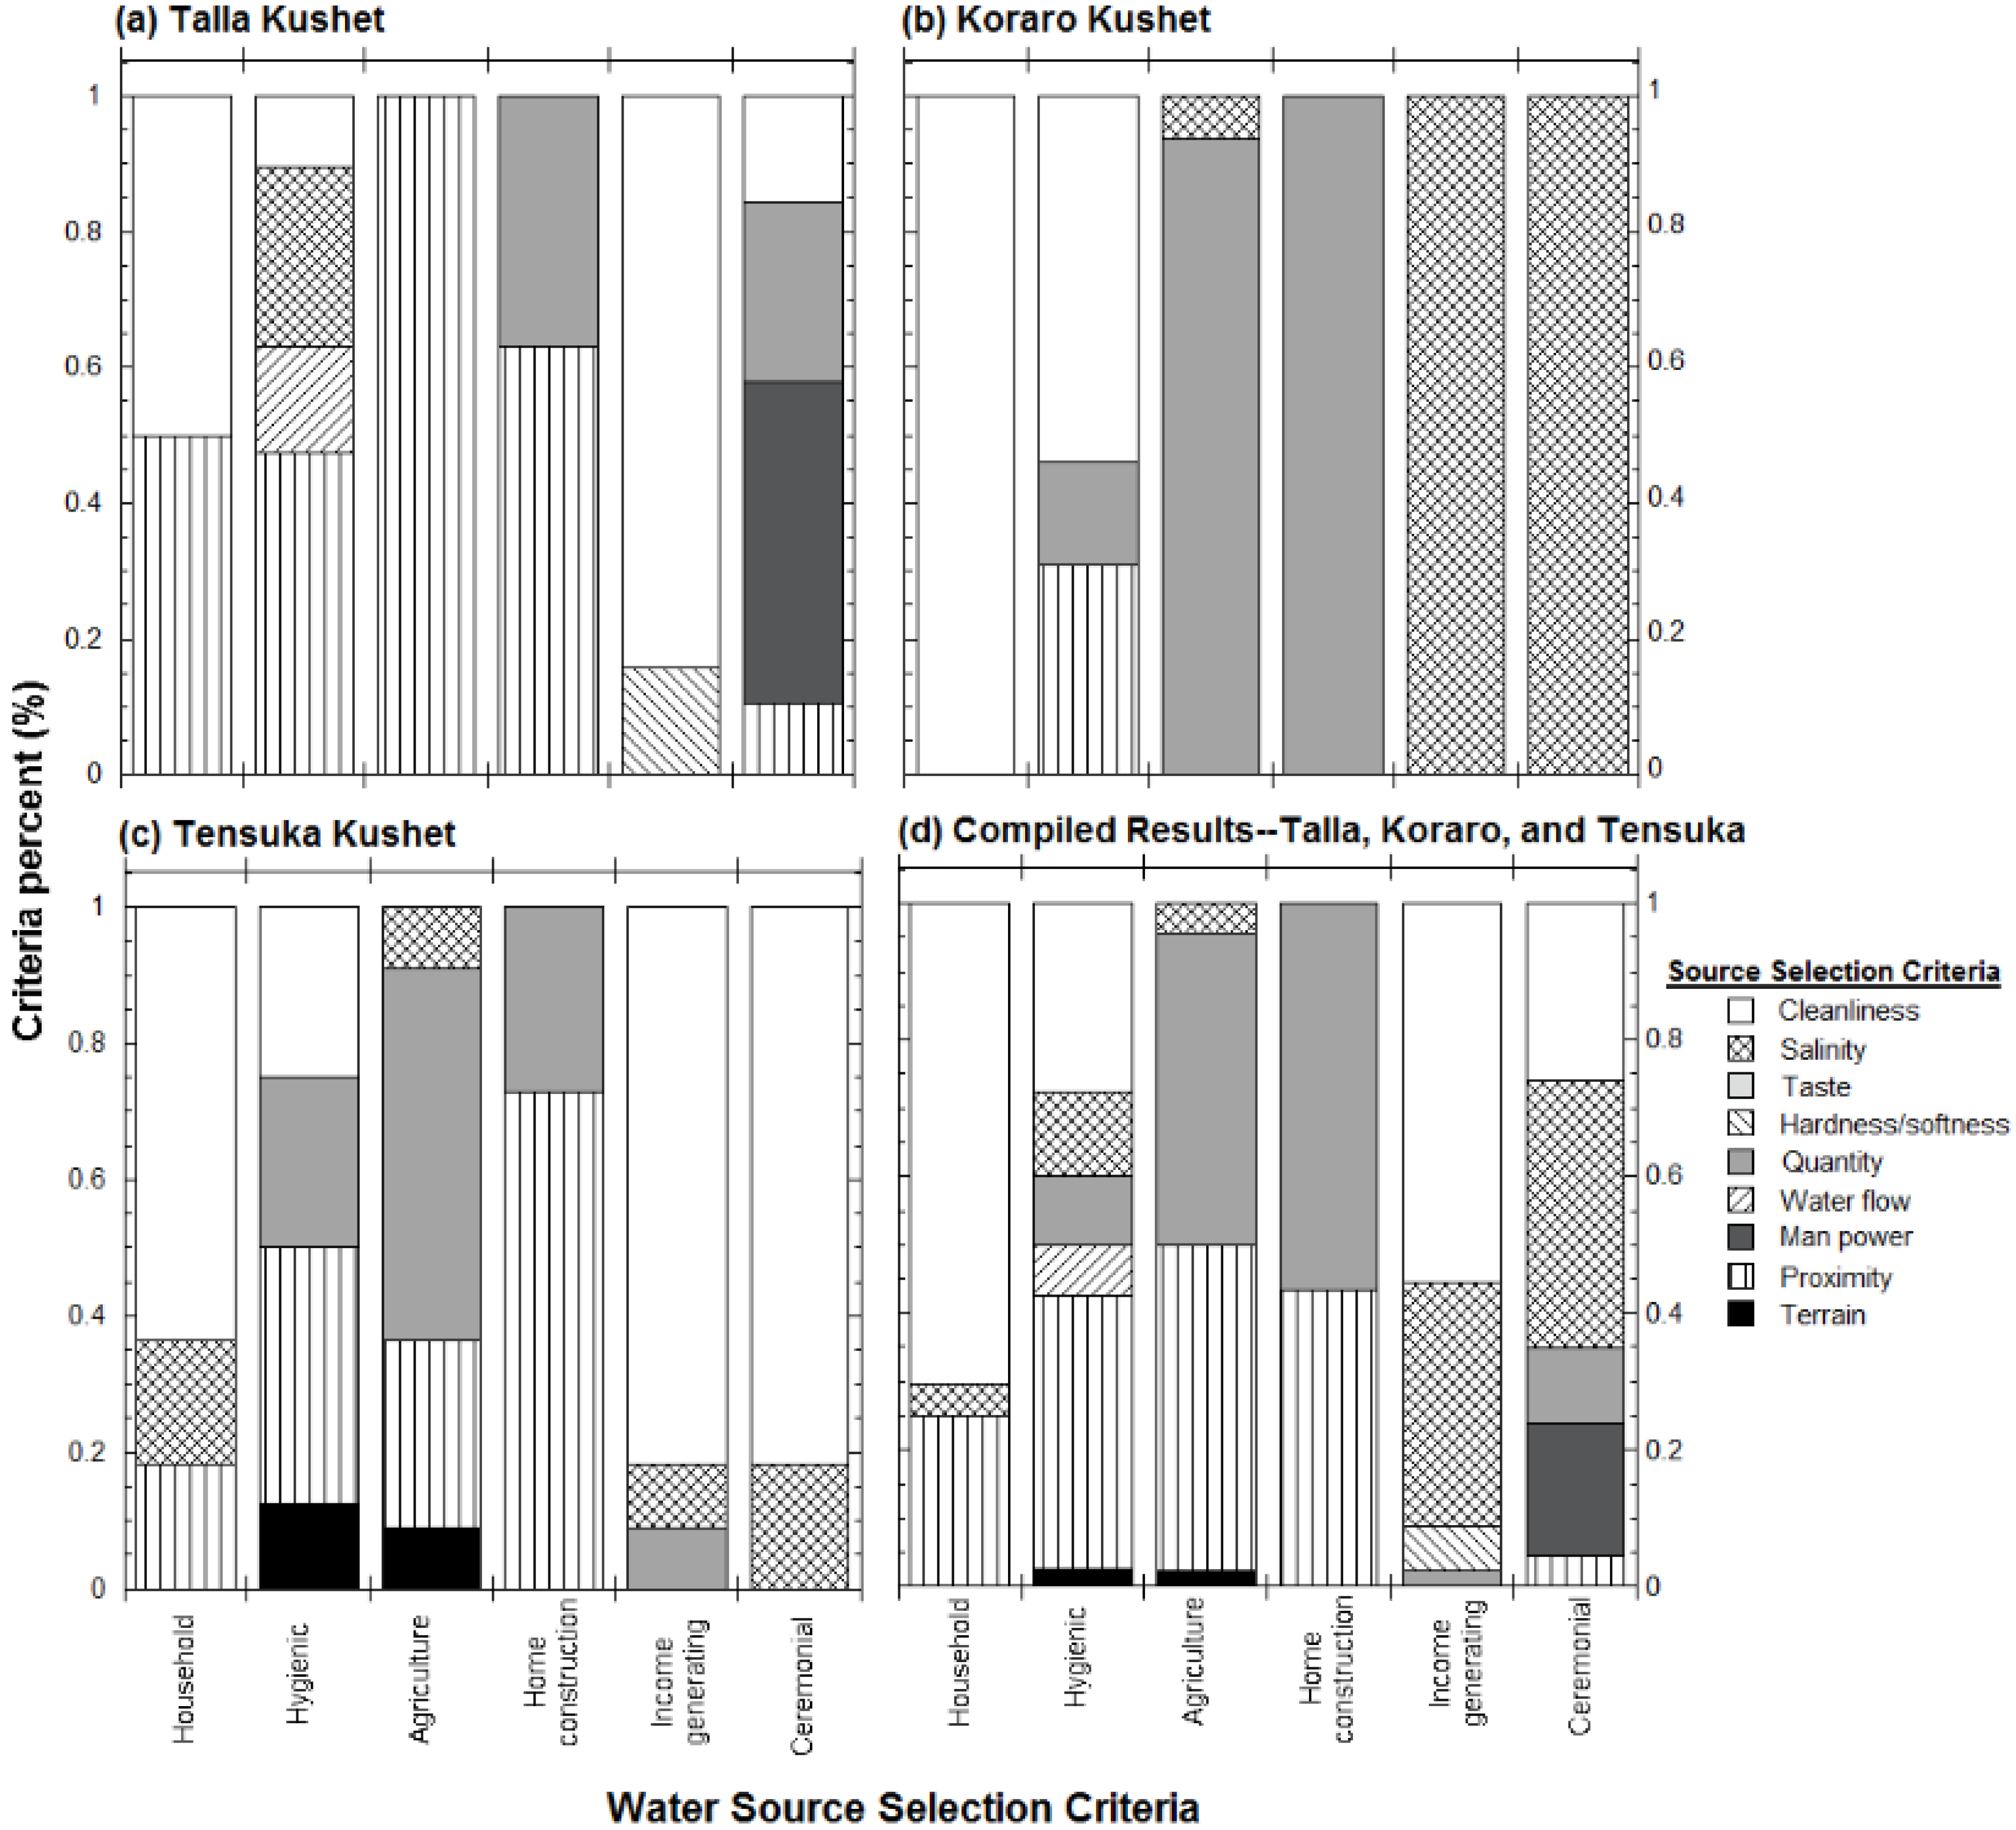
3.2.1. Water Source Selection Criteria
The criteria used for selecting water for the six general use categories (from
Table 3) are summarized in
Figure 2. The criteria chosen for selection of household water indicates that the source selection process is more complex than evaluation of distance to the water point which the MDGs and other development standards often use to gauge access. Since “cleanliness” was the dominant reason presented for selection of household water in all locations, the perception of cleanliness must be evaluated. A hypothesis of this research was that villagers would associate water from constructed water points with higher water quality (cleanliness) especially given the surrogate use of “improved” water sources as a means to quantify access to potable water by the MDGs [
30]. Discussion with workshop participants and observation of water use during field data collection indicated this assumption is not necessarily valid. Villagers were observed collecting water from shallow (<1 m) holes dug in sand in empty streambeds within 50 m of a constructed well that had a hygienic pad and hand pump. In light of the distribution of selection criteria for household uses, this choice of water source (between two alternatives with nearly identical proximity to houses) indicates that the people using the riverbed source consider the riverbed’s water quality to be equivalent or better than that of the well’s. While evaluating water coverage, this perception detail is often neglected when, from a practical standpoint, it should weigh more heavily in resultant discussions regarding access to safe water. In studies investigating well switching behavior of residents in Bangladesh choosing between an arsenic contaminated well and a well free of arsenic, the perceived taste and health of the water were often the determining factor influencing the act of switching to the new, safer source [
31]. If the nearby hand pump is not used because the streambed water is favored, simply providing more hand pump wells might not increase access.
Another conclusion drawn from the source selection criteria activity is that certain taste aspects and the perceived presence of salinity play a larger role in source selection than was anticipated. Salinity is often a concern of farmers when discussing agricultural water; however, salinity was a concern not only for agriculture and income generating water uses, but also for ceremonial water uses in all Kushets except for Talla. When asked the reason for using the riverbed for water within a short distance of a developed source, the women drawing water attributed their choice to the “salty” taste of the water from the developed source. It is hypothesized that the water in the developed well and the riverbed come from the same shallow aquifer. If one considers cleanliness, salinity, hardness, and taste (other than “salty”) all as indicators of “quality,” then perceived water quality is the dominant concern in almost every use category except for hygiene, agriculture, and construction. When considering the entire Koraro region, collectors for hygienic uses of water are as equally concerned with water quality (40%) as proximity to the source (40%); however, considering the response of “flowing water” to be yet another indicator of water quality, quality concerns (47.5%) begin to dominate this decision as well.
Finally, proximity and quantity are the primary determinants of sources selected for agricultural uses and home construction. Agricultural uses include livestock uses and small-scale irrigation of kitchen gardens.
Satisfaction Criteria
Results from this activity allowed estimation of parameters such as average and range of per capita water consumption, time allocated for water fetching, family size, livestock holdings and land use. Insights into seasonal differences in water consumption and transportation were also documented.
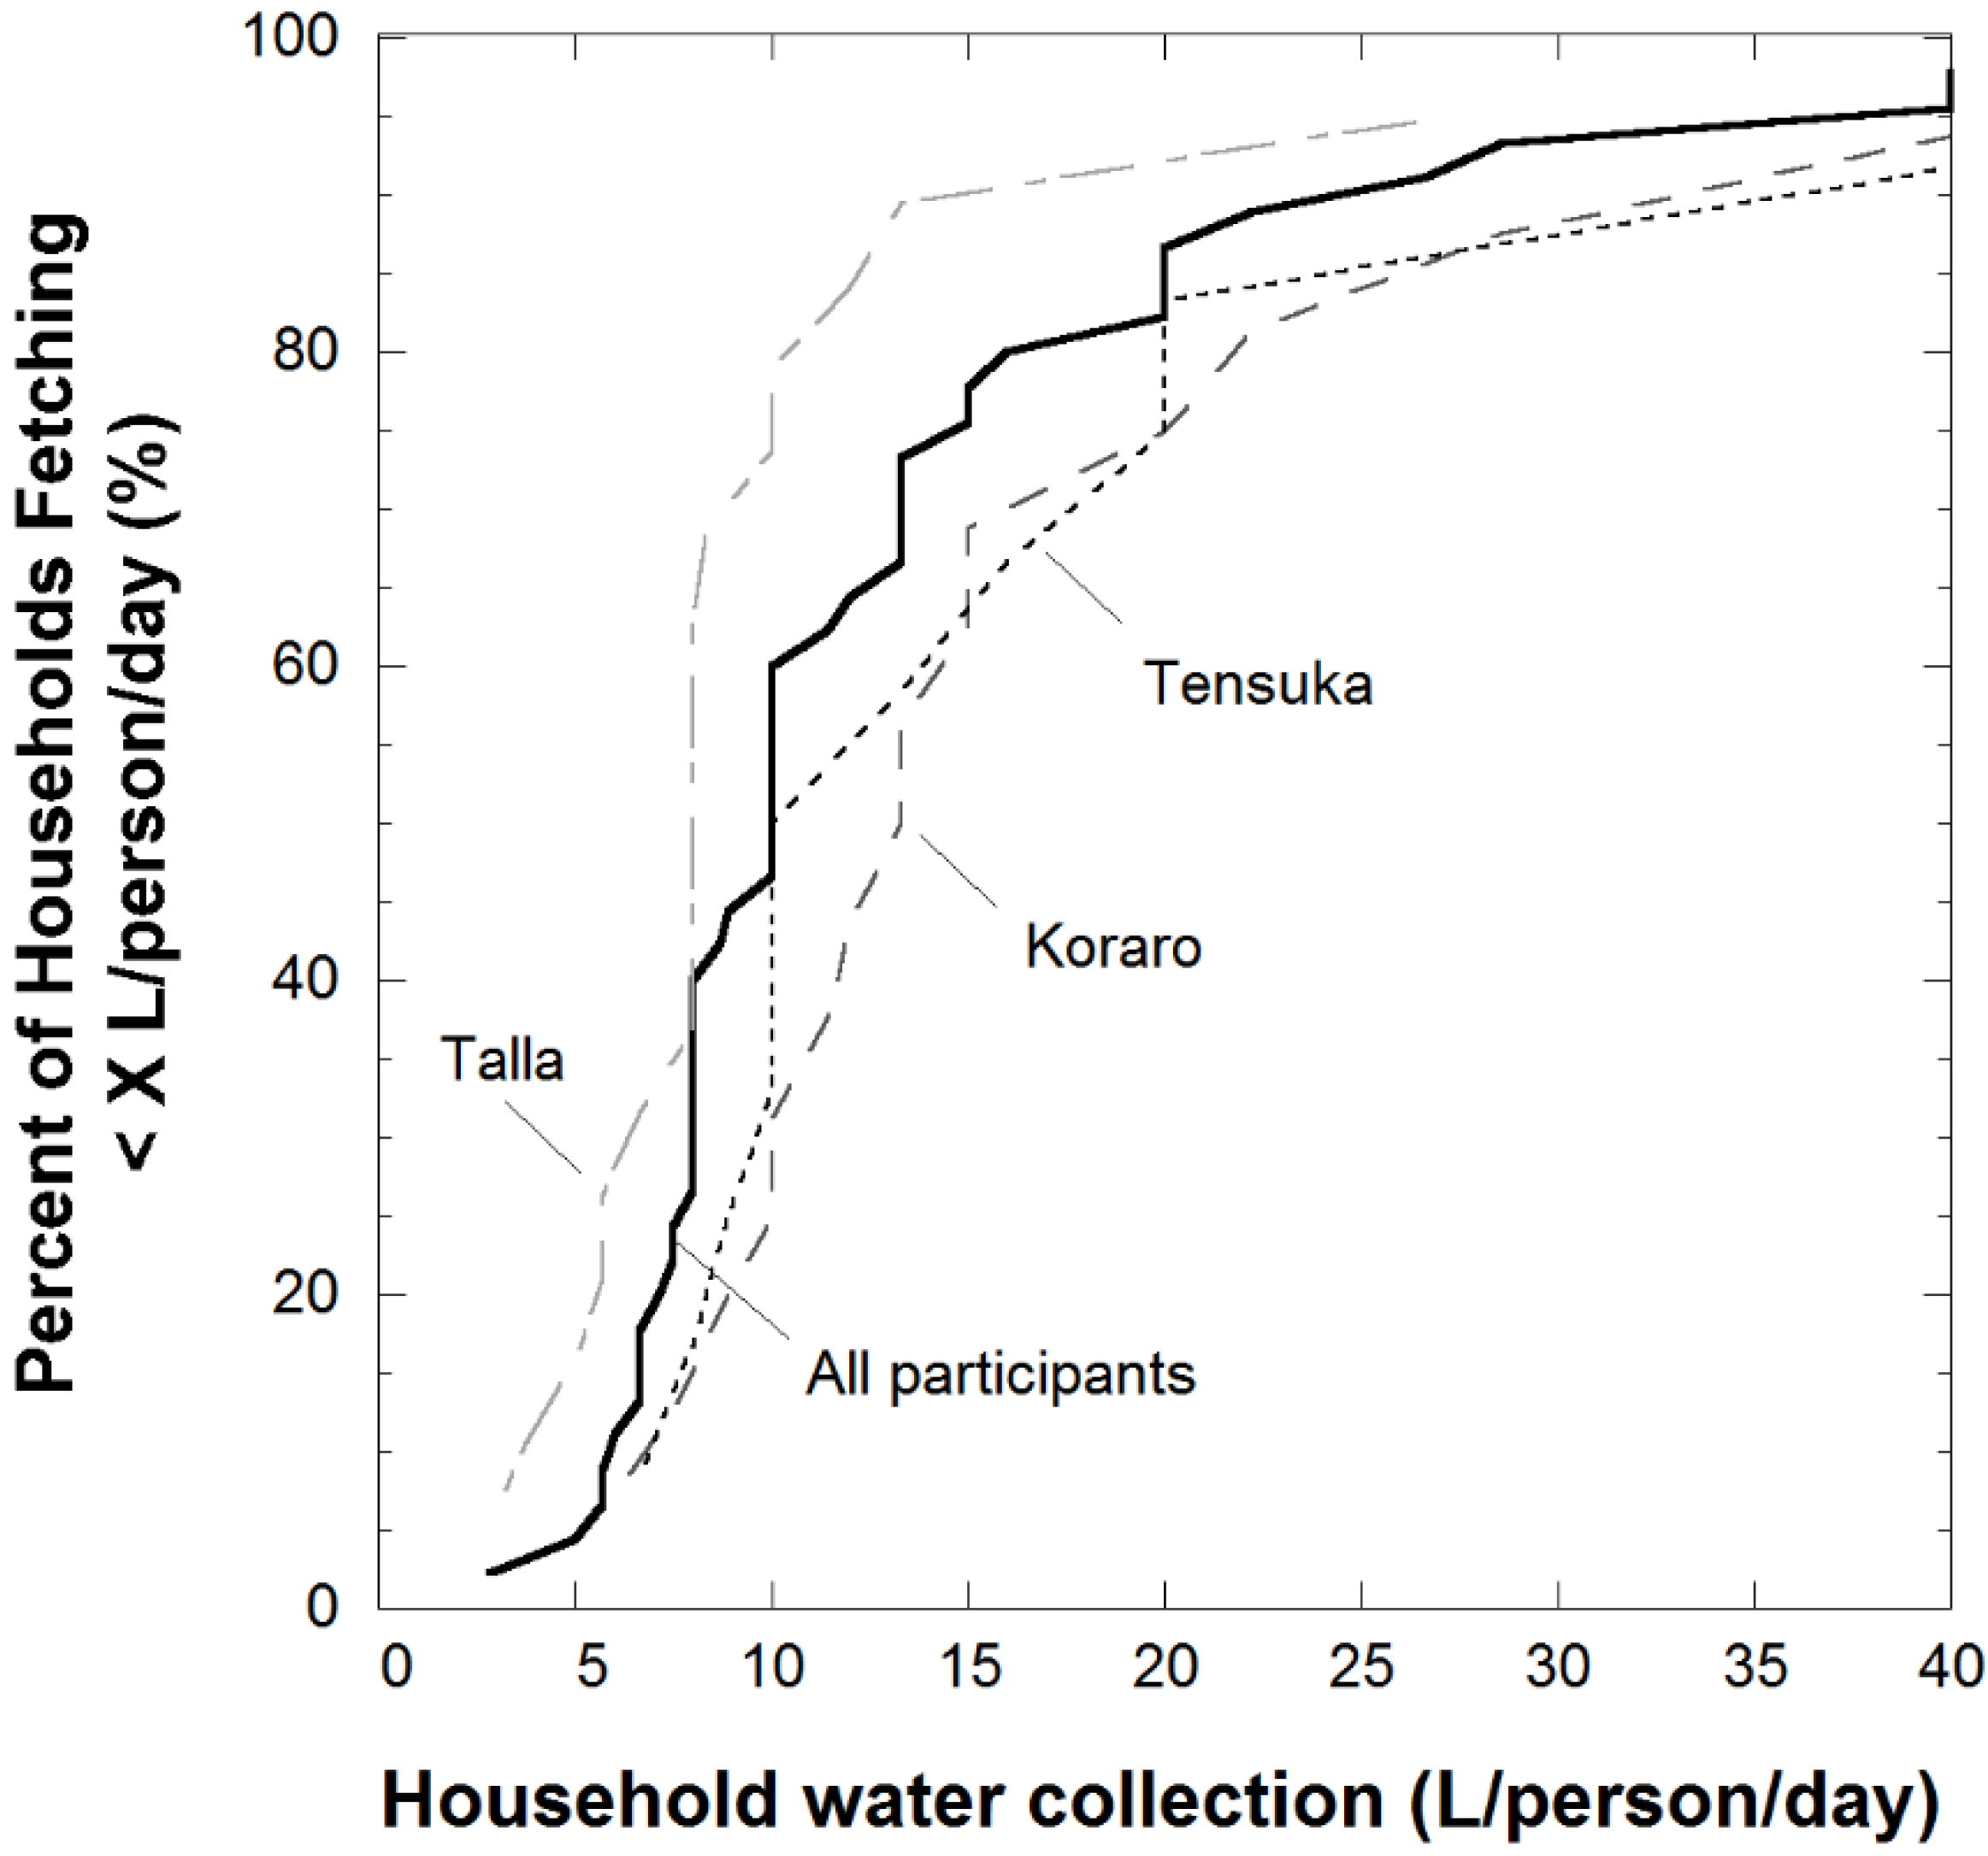
Assuming jerrycans each hold 20 L, the median per capita water consumption in households of all participants is 10 L/capita/day. This value is at the lower range cited for daily use for sub-Saharan Africa of 10–20 L/person/day), [
32], but, considering a more recent study by [
33], wherein, families in Bongo, Ghana collected higher volumes of water per household at about 25–30 L/person/day, this value appears even more modest for the Koraro community.
The cumulative frequency distribution gathered from responses for household volume in terms of water fetched per person per day for each Kushet and for all Koraro is shown in
Figure 3. Over 80% of residents collect one jerrycan or less per person per day. On average, households collect three jerrycans a day. If, perhaps, a single trip can satisfy all household activities, then there is little expectation that a separate trip to a hand pump will occur simply for drinking and cooking water, especially when taste factors are driving source selection for household needs.
Proximity to a source was a major contribution to source selection as discussed earlier and represented in
Figure 2. As seen in
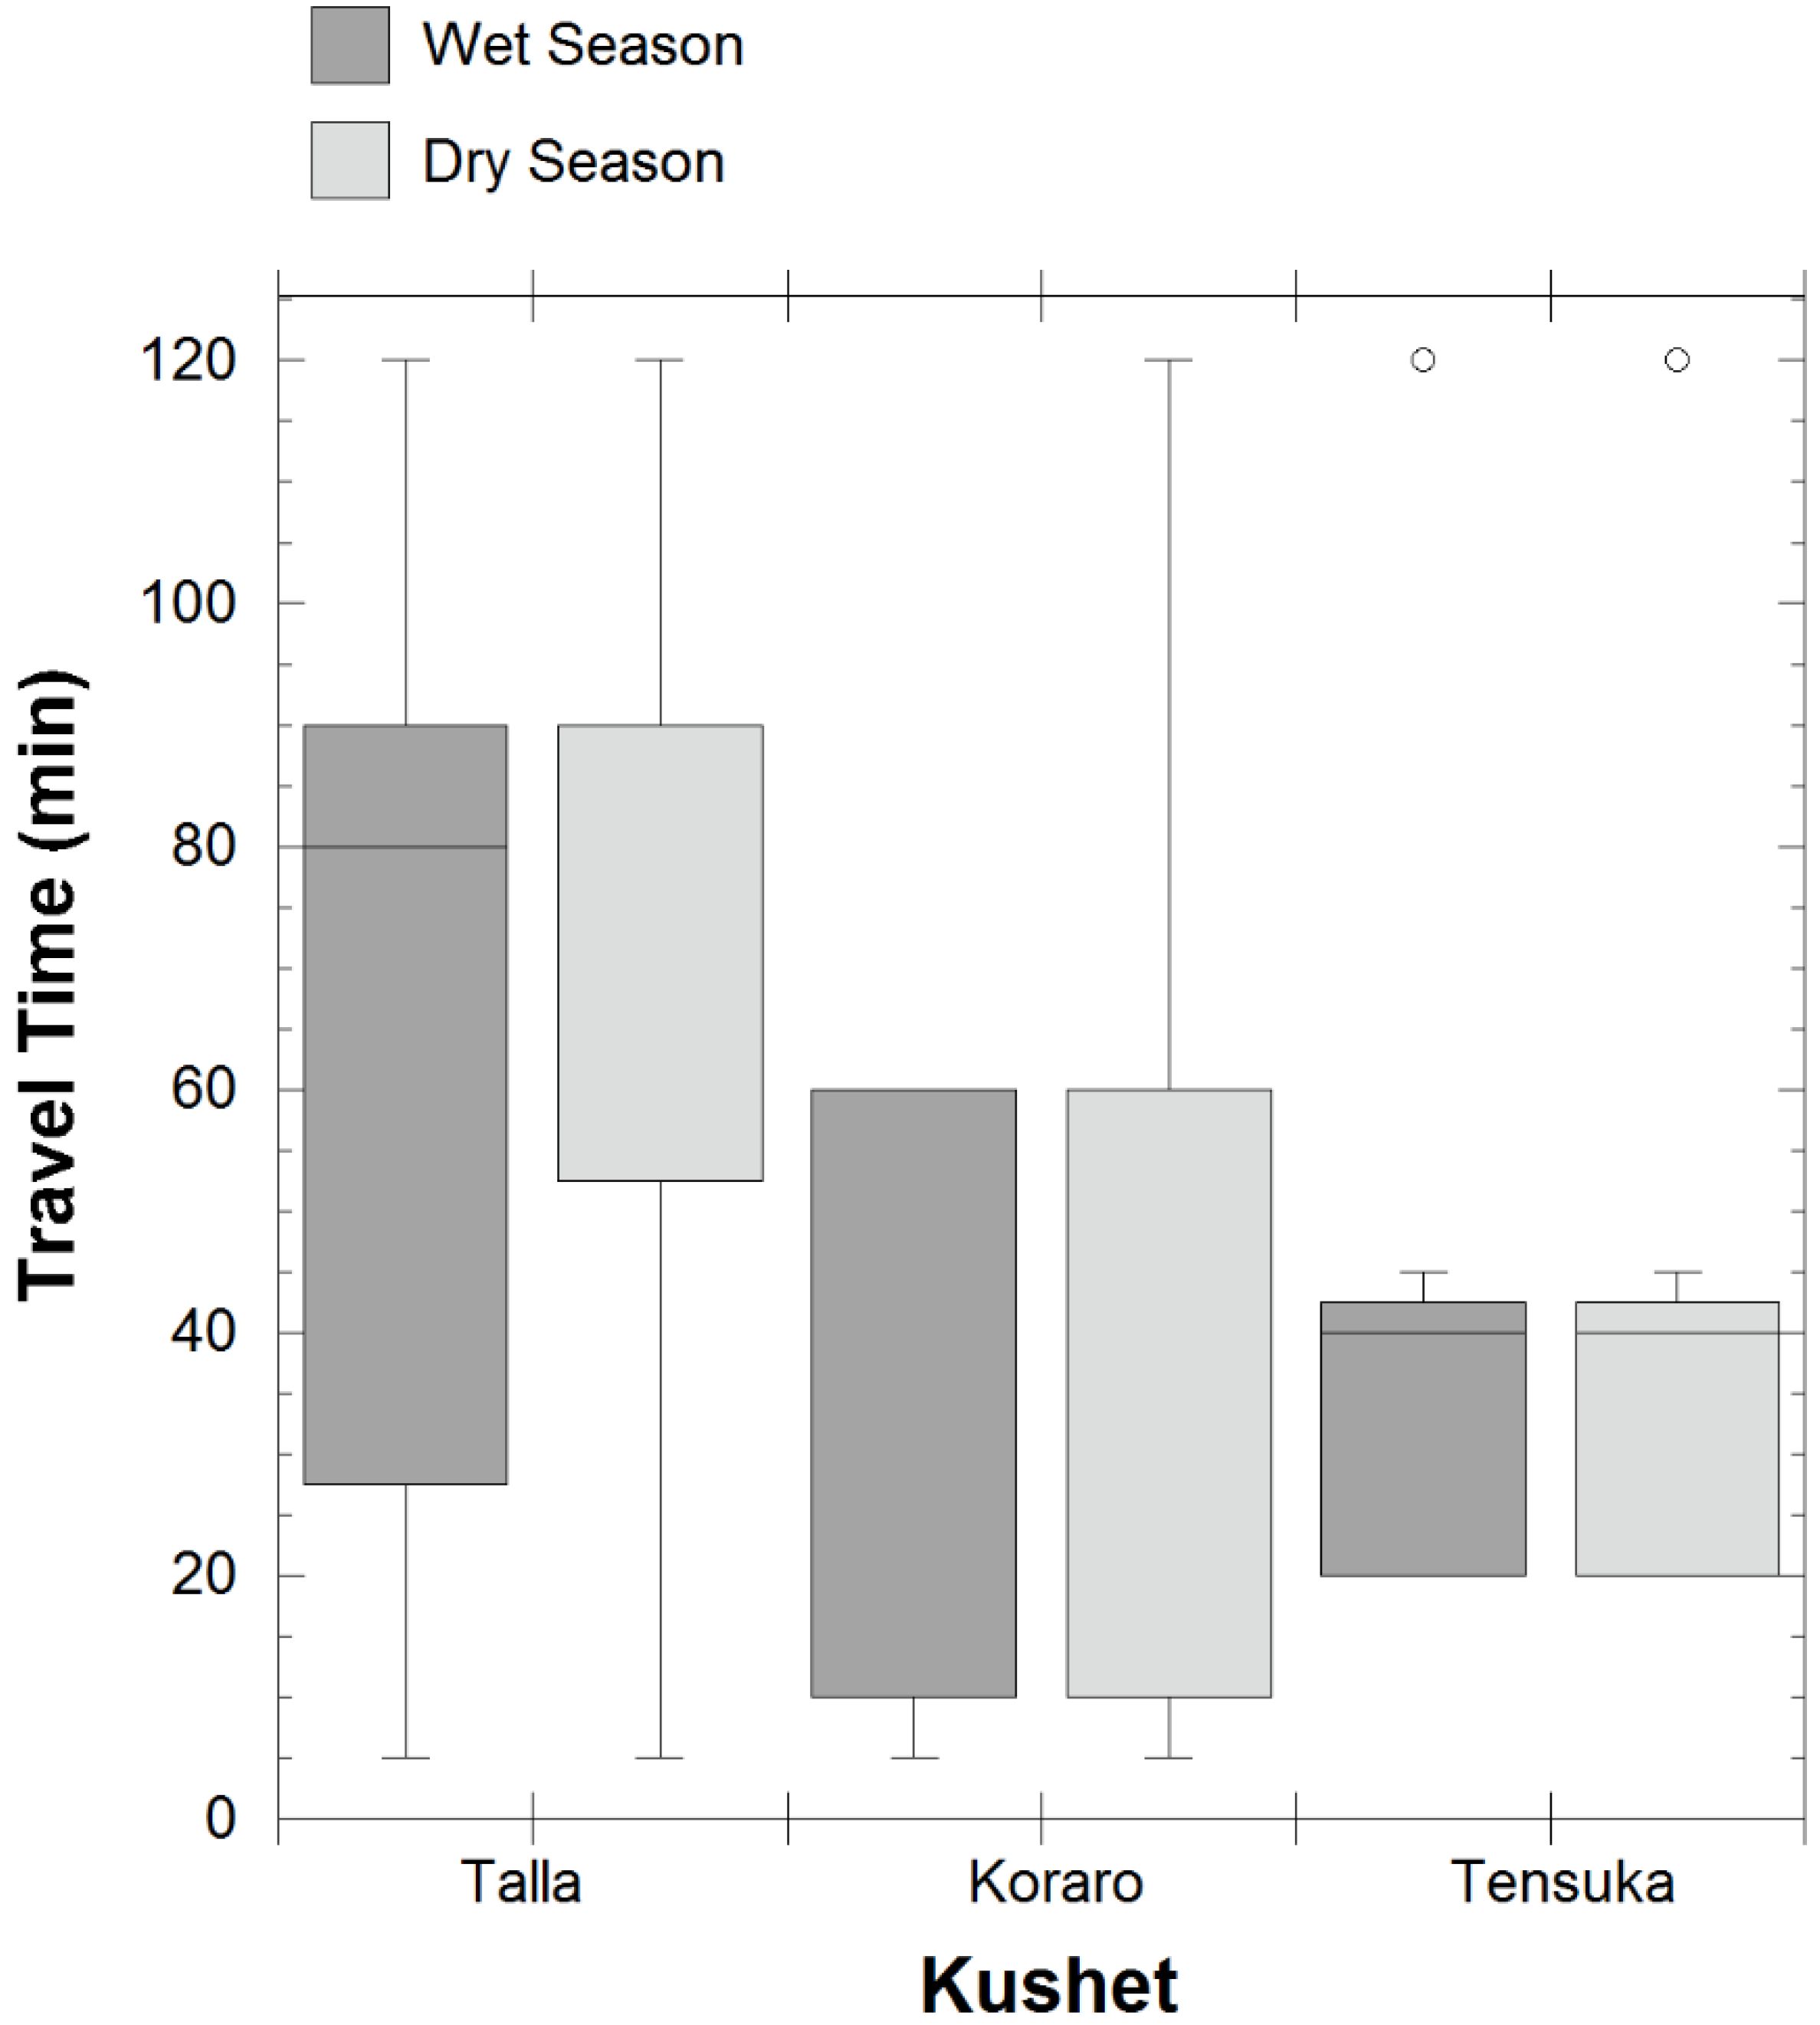
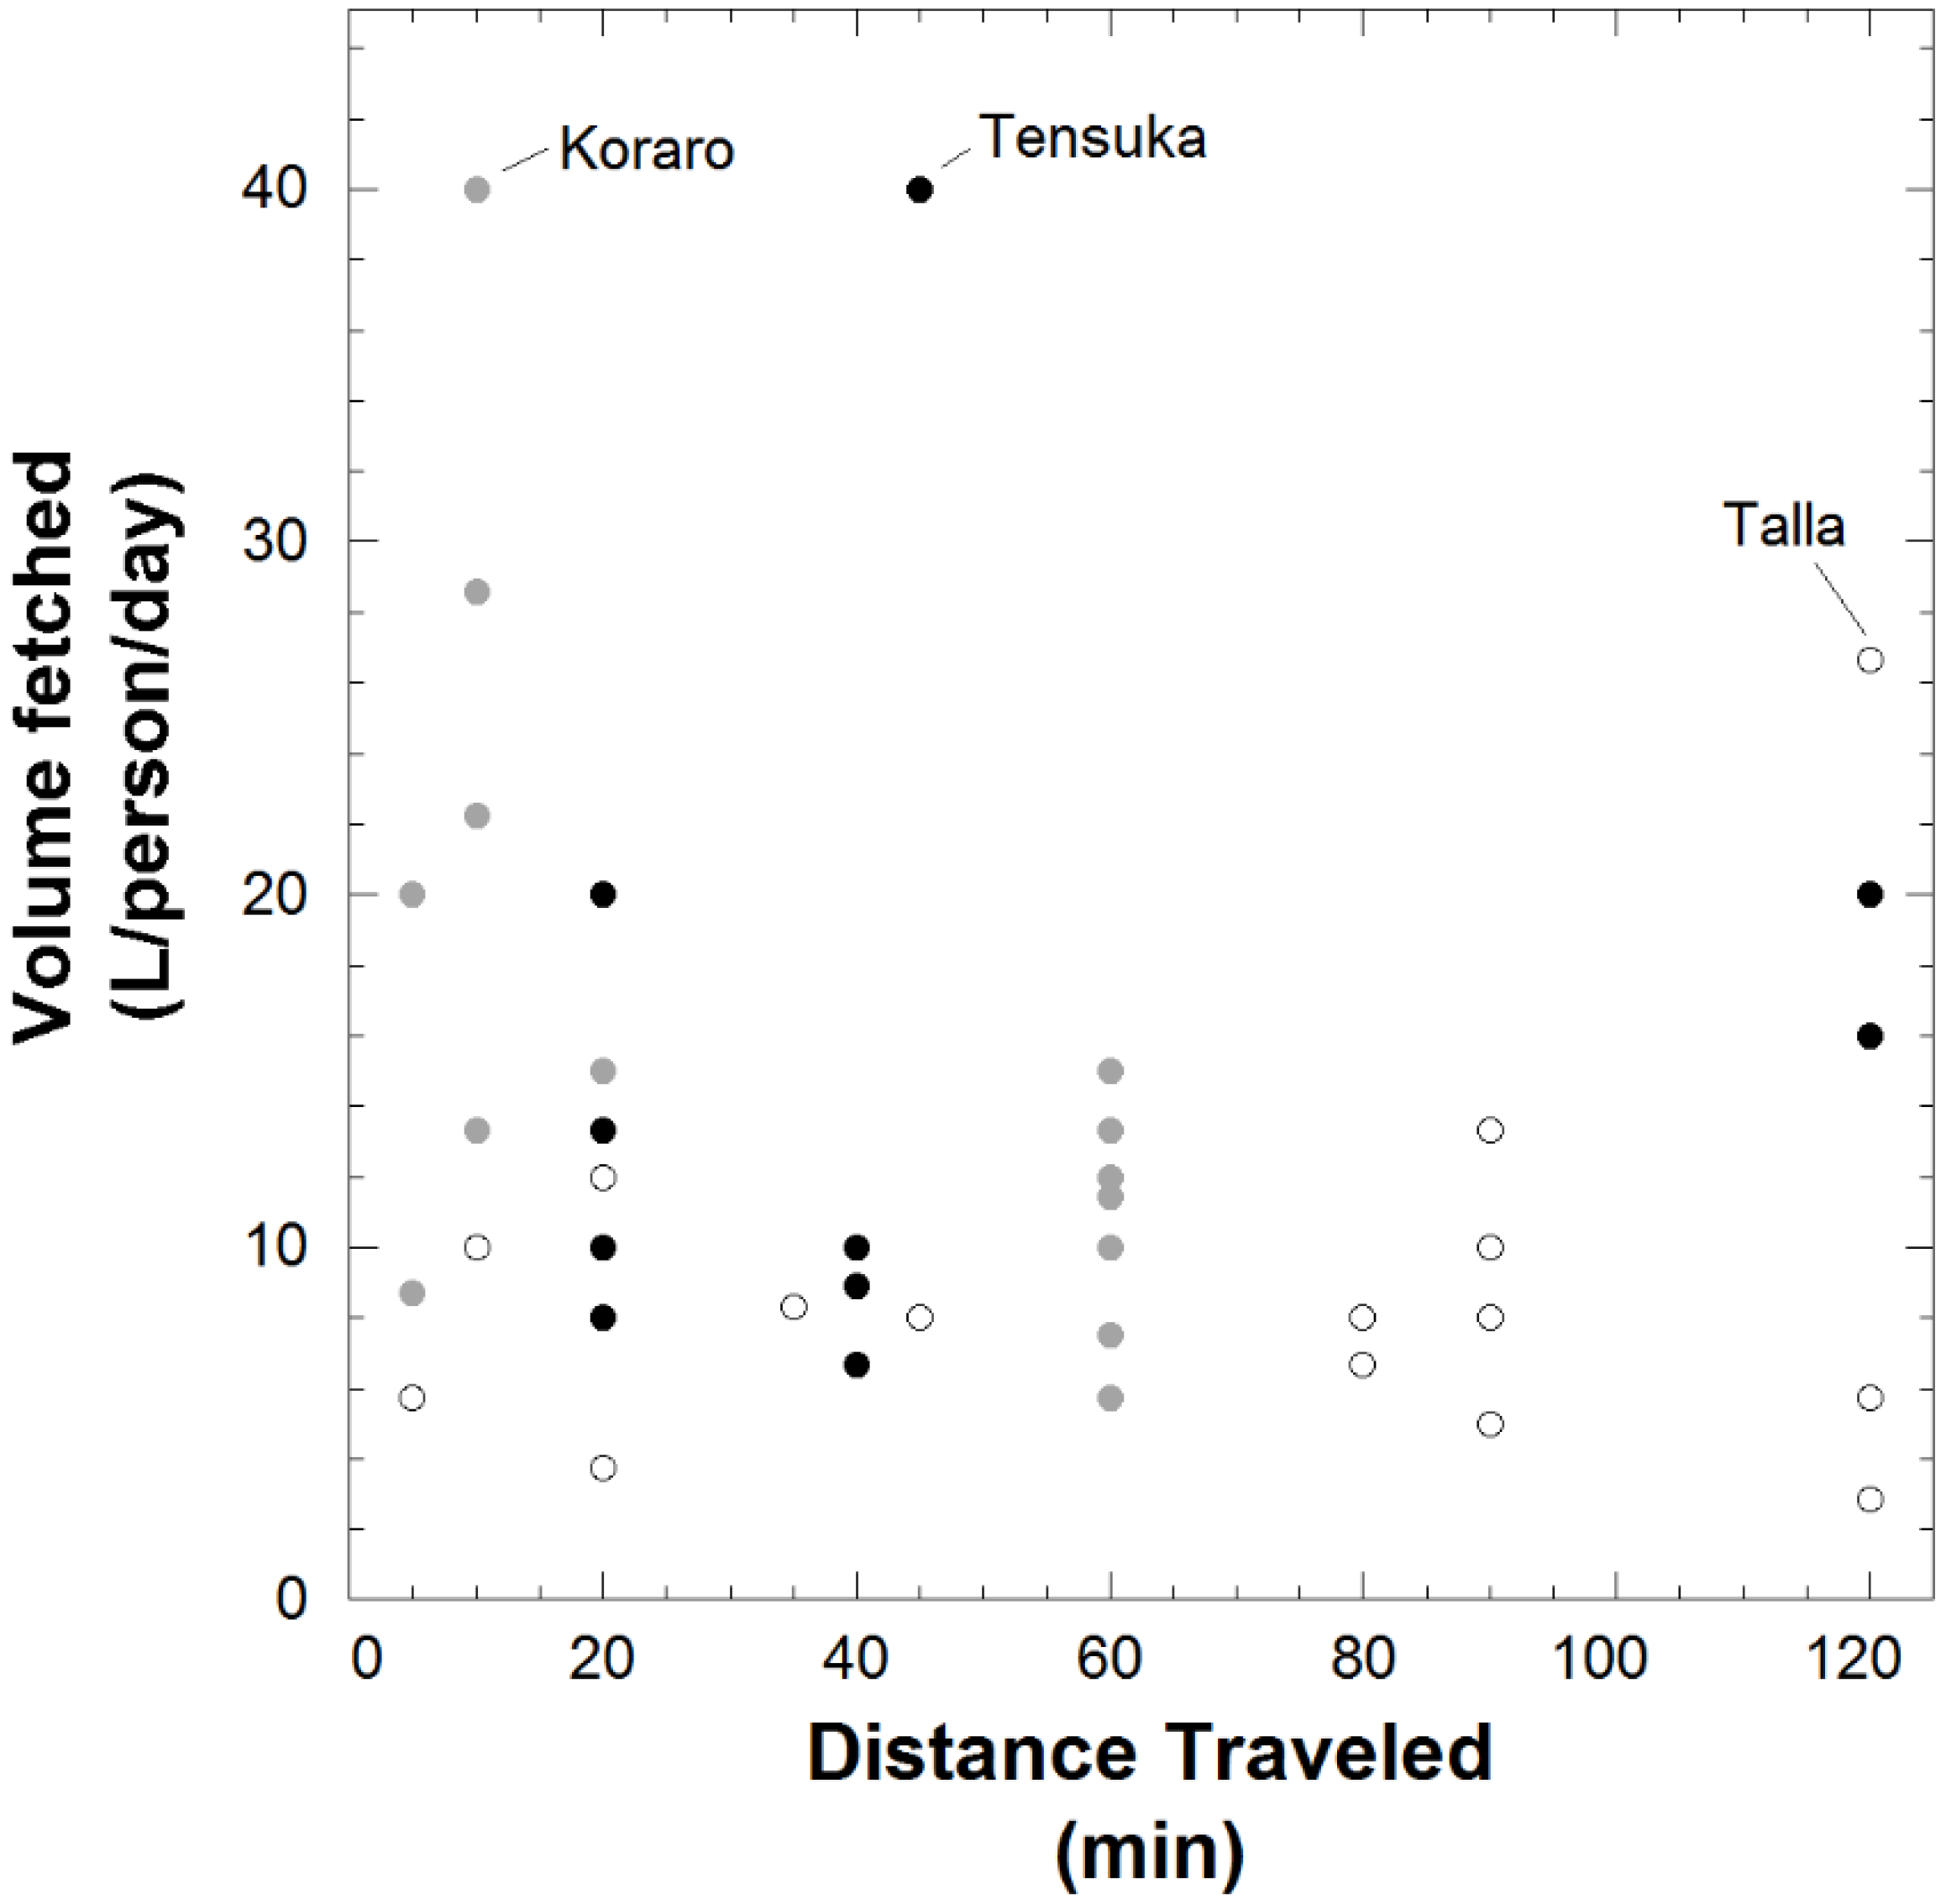
Figure 2a, the Talla Kushet values proximity the most of the Kushets when considering water source selection. While Talla residents fetch the greatest amount of water per person per day, they also spend the most time, on average, traveling to collect water (
Figure 4). Therefore, meeting the needs of residents in Talla will require properly differentiated interventions.
Collection times for fetching water ranged from five to 120 min. Per capita consumption (in L/person/day) is plotted against time to fetch water in
Figure 5. Contrary to expectations, there does not appear to be a correlation between time to fetch water and per capita consumption. One interpretation of this result is that household water consumption is determined more by household use and conservation practices than by distance to the source and water-use activities.
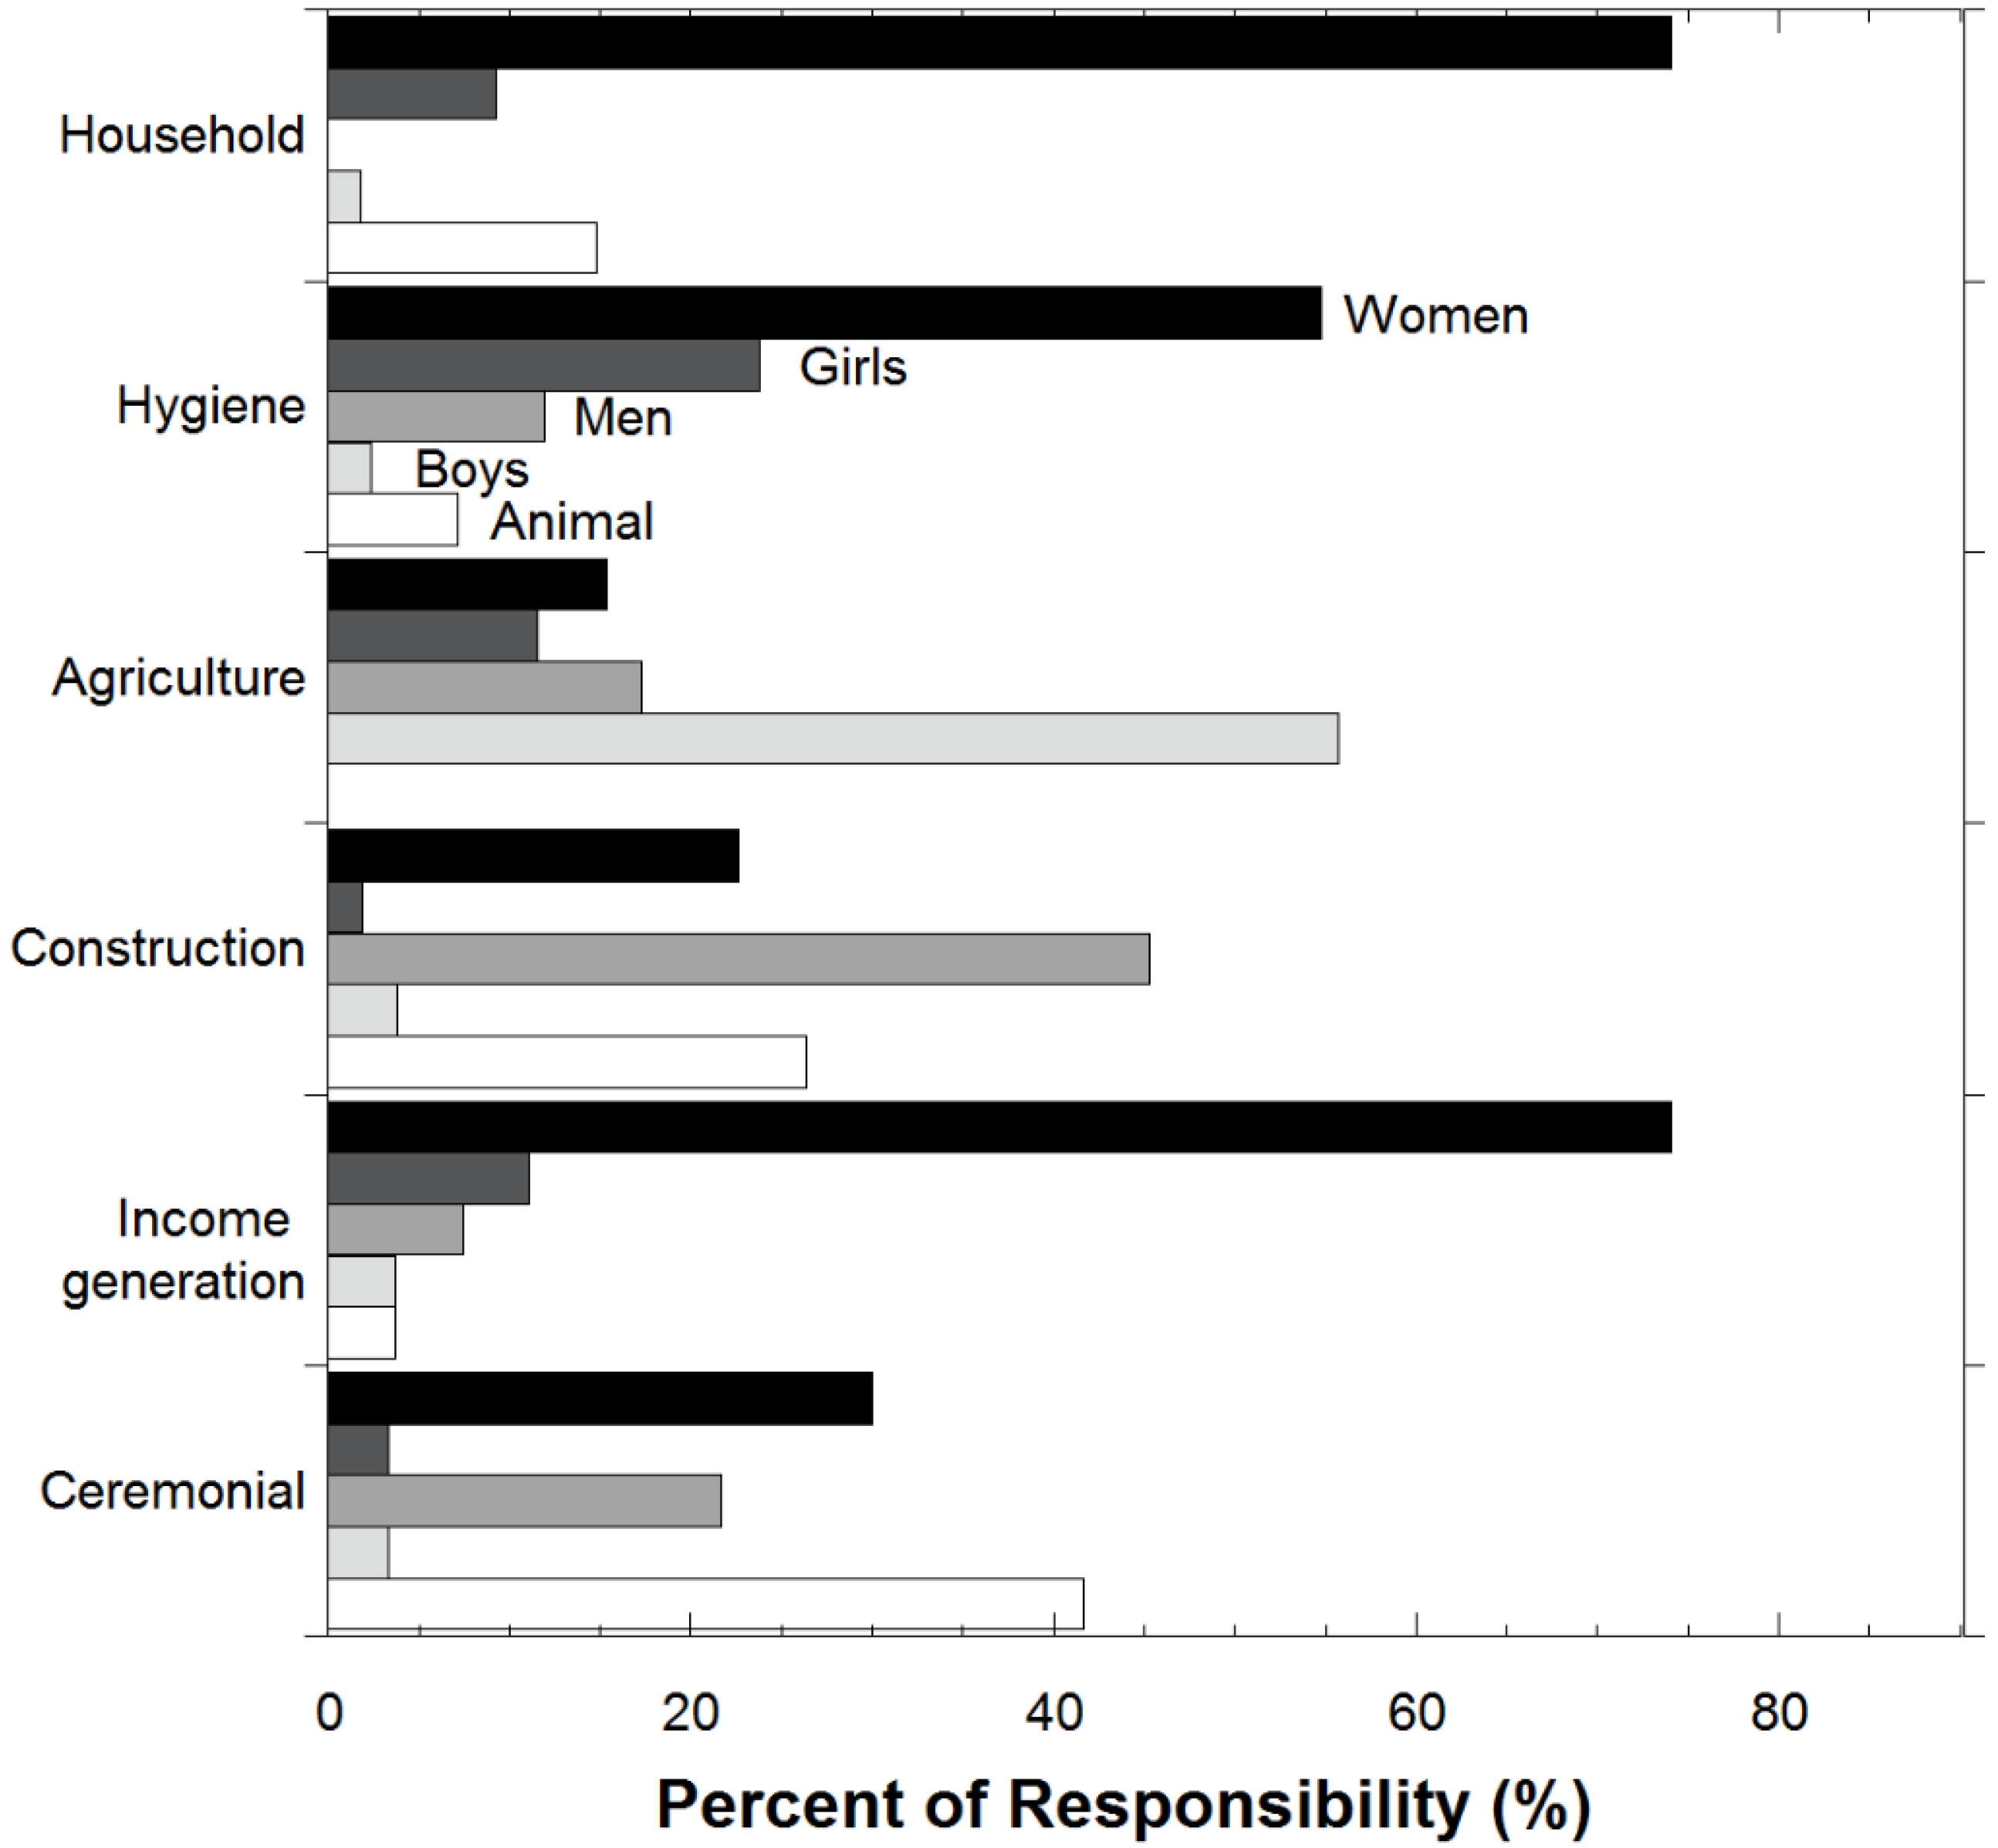
Labor and Traditional Roles
All data collected during the activity are presented in
Figure 6. In general, there was little variation in results between Kushets, potentially indicating that traditional roles are the primary determinants in the division of water acquisition labor. Of interest is the selection of animal as the party with primary responsibility for fetching water. This choice was not listed among responsible persons on the flip charts used to record answers, but the answer “donkey” appeared for all three Kushets. The person from the household who brings the donkey to collect the water was not recorded.
Approximately 75% of the household water collection responsibility was that of the adult females of the household, consistent with previous studies of sub-Saharan Africa [
33,
34]. This study, however, also highlights the importance of women in collecting water for hygienic and income generating activities. As interventions that alter the water landscape are introduced to Koraro, understanding the primary demographic that will interact with the source and soliciting their opinion is important. If, for example, a source that would provide many residents with income generating and household water is planned, understanding that women are the primary users of both but that source selection criteria are variously influenced will determine whether sources closest to the activity or the perceived salinity is most important.
The results from the workshop highlight the complex nature of source selection and use categories, even when the primary water users are exactly the same. Future research to identify the selection criteria of primary water users will further highlight the factors influencing choice of source for each activity.
3.3. Seasonal Diagramming
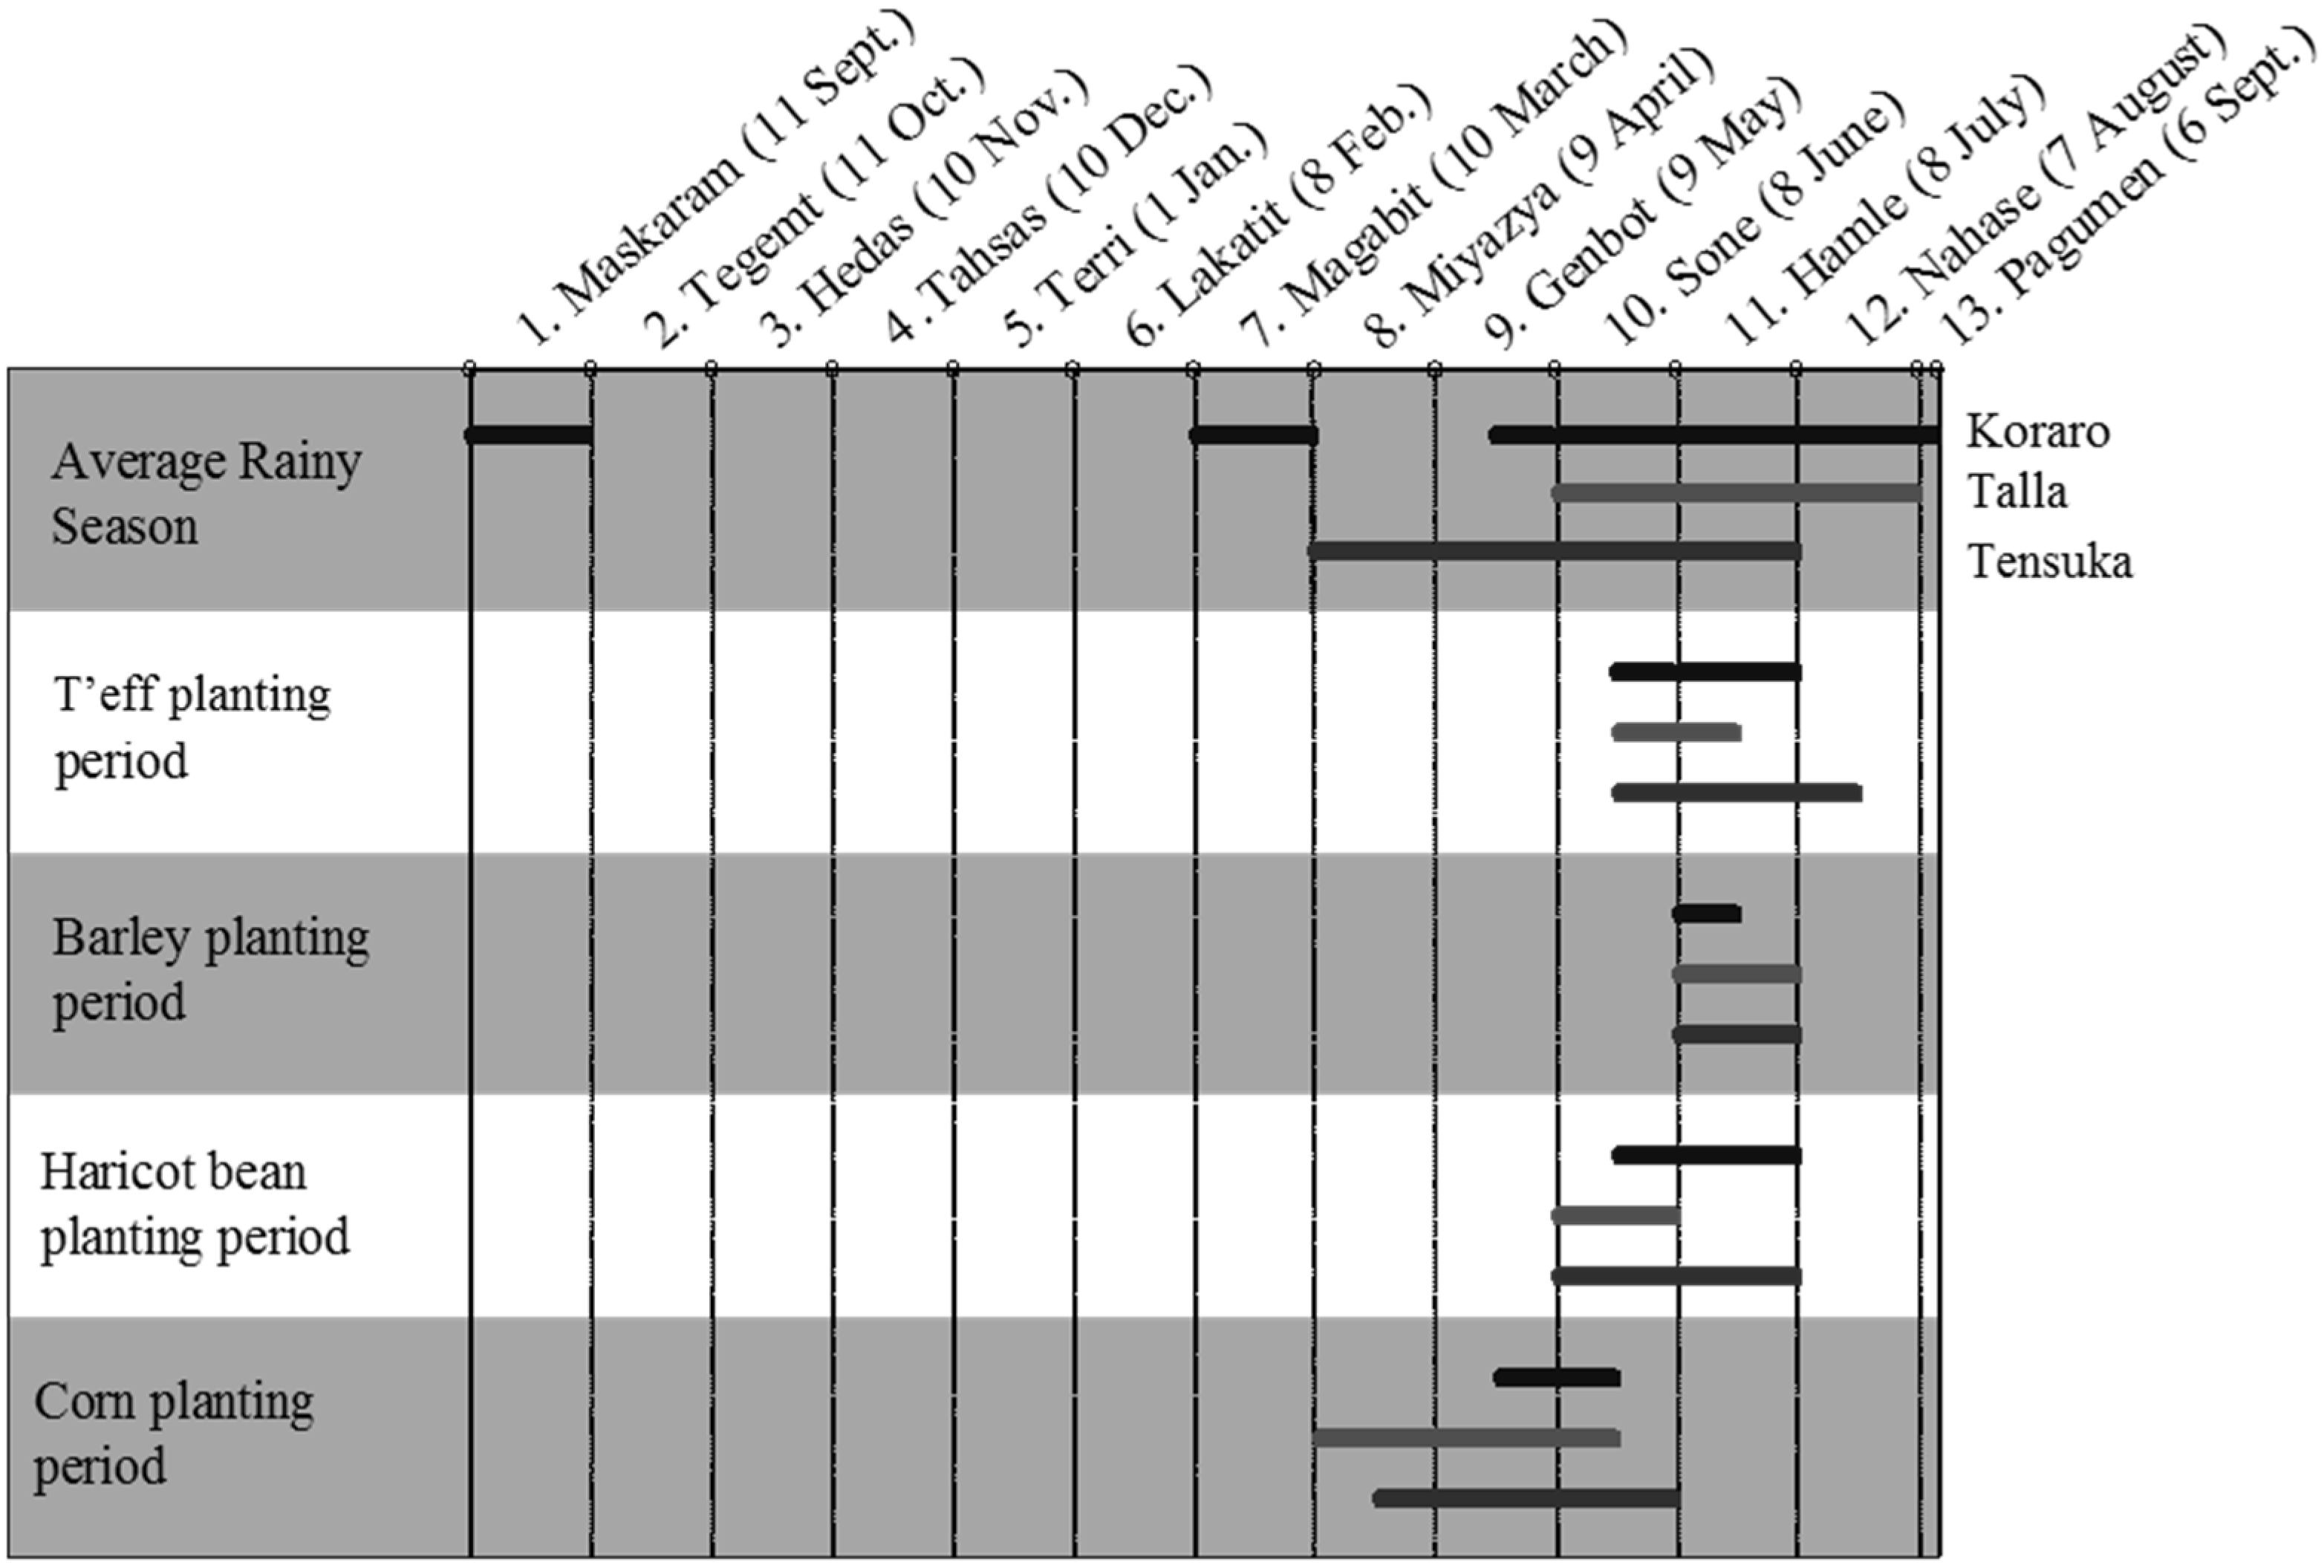
Figure 7 contains the participants’ depictions of duration of an average rainy season and the distribution in the planting periods of four important crops: teff; barley; local beans (adengor); and corn. The Ethiopian calendar has 13 months (12 of which are 30 days long, and one, the thirteenth of the year, lasting five days) and those months are shown at the top of the figure, along with the corresponding day of the start of the month in the Julian calendar. Teff is a particularly important crop because it is a high-value crop and is the main ingredient for the local bread (injera) that accompanies meals. Barley is important as a relatively drought resistant crop and because it is used in production of local beer. The crop reported as having the earliest planting date, according to the resident participants, is the dark sorghum grown in Talla Kushet—planting occurs approximately three months before the onset of the average rainy season as reported by the Talla Kushet participants.
The estimates of the span of an average rainy season were surprisingly different for the three Kushets. Anecdotes from experts in the region and from workshop participants indicate that there are often interruptions in the rain during the rainy season. Prolonged interruptions are particularly detrimental to crop production.
Estimates of the range of planting times for the crops were similar from Kushet to Kushet. The timing of the crop plantings appears to coincide with the arrival of rains, corn with the Belg rains in March and the other crops with the Kiremt in June. Corn and millet (not shown) were reported as being planted at the earliest rains, with local beans planted later into the rainy season when there is more consensus among participants regarding consistent rainfall patterns.
In general, Koraro residents indicated that water is available year-round in most sources, even in years of low rainfall. In riverbeds, water can be obtained in shallow holes (<1 m) at the end of the rainy season but only in deeper holes at the end of the dry season. Despite reports of failing pond water storage systems, the participants indicate that operational ponds yield water through much of the growing season, drying only before the most arid part of the year. Two water sources were identified as seasonal: the Werei River and the Koakih Riverbed. All springs (developed and undeveloped) were reported to flow year-round in normal years.
3.4. Merging Data Collected in the Workshop with Engineering Design and Decision
The purpose of the workshop was to evaluate water needs and preferences to enable the investigation of MDG interventions as well as those implemented by the Columbia Water Center. This screening process presents an alternative to specification-oriented engineering design, in which the goal of design is to meet criteria that were developed as general guidelines. If the accepted definitions of the MDGs for access to safe water are used, then many residents would be classified as not having access since sources currently being used are not all improved (MDG indicator 30: “
proportion of population with sustainable access to an improved water source”). While the MDGs helped to increase the efforts related to water, broader and more context-specific frameworks were needed for the post-2015 water development agenda [
30]. The language in the new SDGs is less prescriptive than the MDGs (SDG Goal 6.1: “
achieve universal and equitable access to safe and affordable drinking water for all”), addresses the need to consider water quality (SDG Goal 6.3: “
improve water quality by reducing pollution, eliminating dumping and minimizing release of hazardous chemicals and materials”) and requires local participation (SDG Goal 6b: “…
support and strengthen the participation of local communities in improving water and sanitation management”) [
30]. No longer is the standard (yet vague) metric of “improved source” being used as a marker of “safe” water since water quality and wastewater management are both primary target areas under the SDG [
30]. Using this sustainability assessment approach to design may allow improved intervention selection and design through participatory community decision-making and integrated and scaled-up interventions that consider cross-sector impacts.
To contrast the use of specifications and sustainability in intervention selection and design, a relatively simple analysis based on the access criteria of distance and source type was performed. Then, the determination of the number of wells that would have to be added to ensure “adequate” access to water for all Koraro residents was calculated. The process used was similar to that used by Hassan [
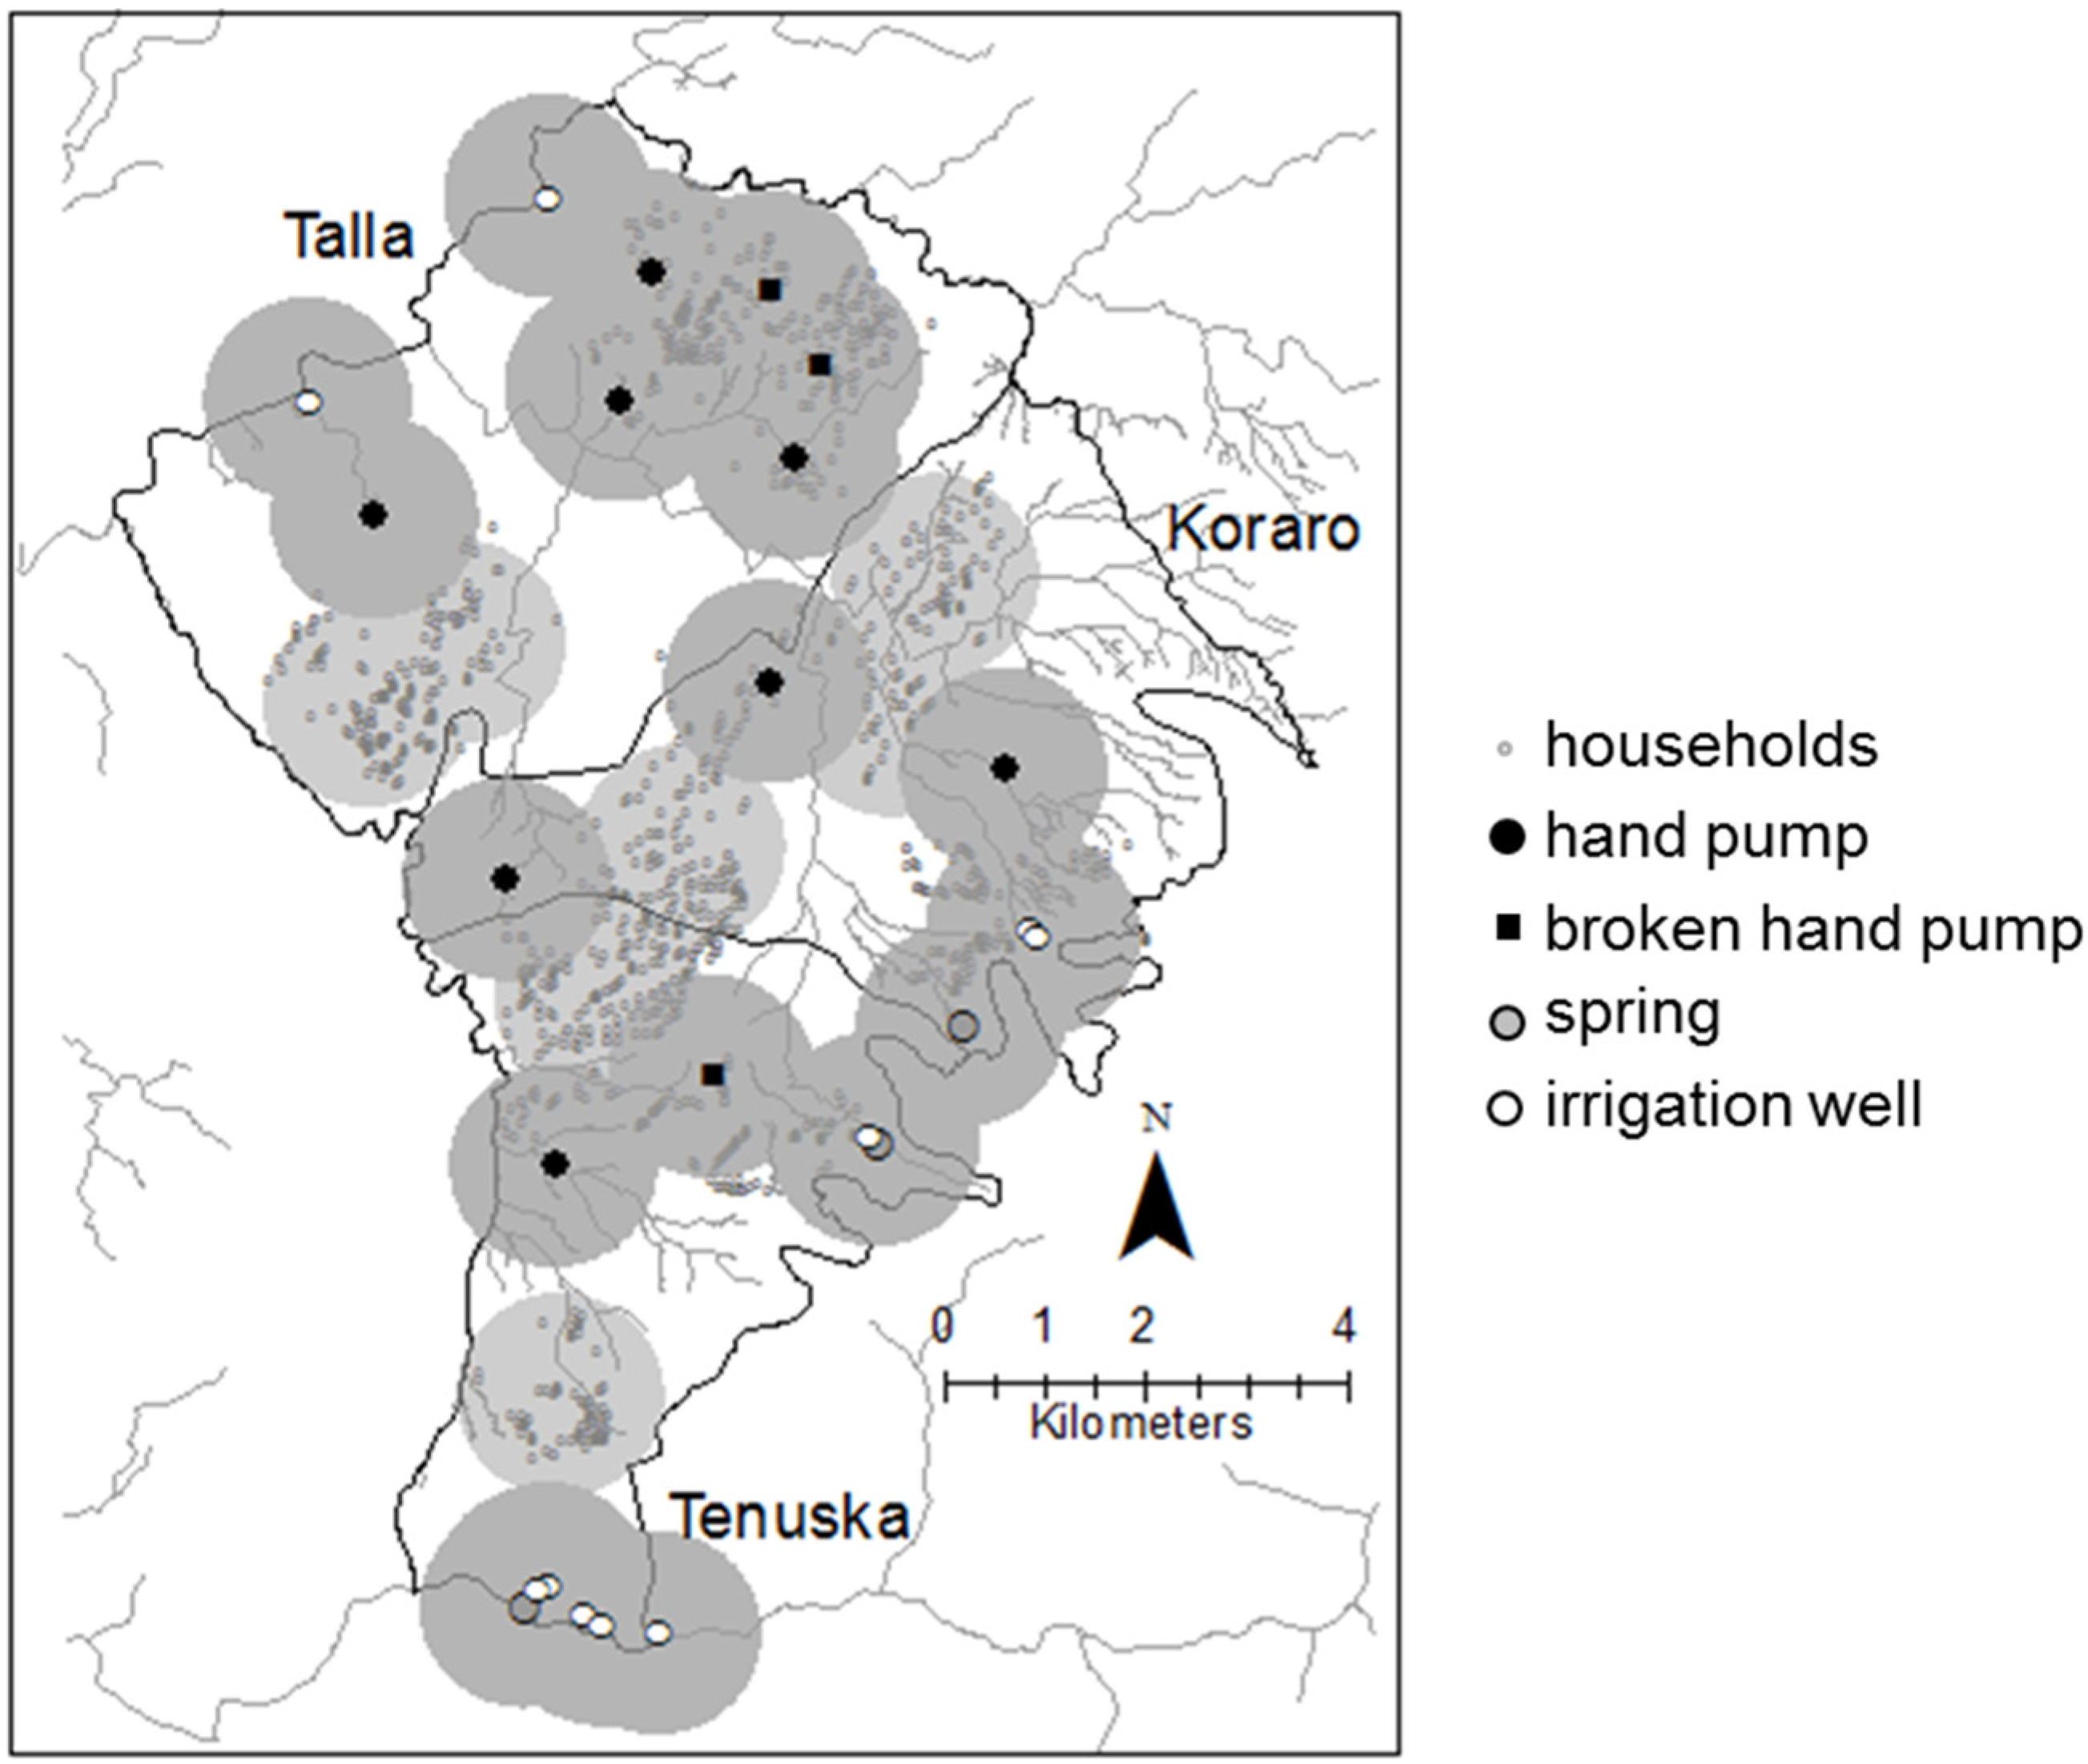
35] in selection of deep well location for providing improved access to safe drinking water in Bangladesh. A geographic information system (GIS) model was used to generate service zones for existing water sources, where the service zones were buffers of 500 m, 1000 m, 1500 m and 2000 m around each of the water sources. The service zones for existing wells for a 1000 m service area around each water point are shown in
Figure 8. Even this process overestimates the number of sources deemed acceptable by the MDG metrics as all constructed sources were used in the analysis. Expert judgment was used to determine the minimum number of additional wells that would be required to satisfy the service zone specifications that all houses be within 500 m, 1000 m, 1500 m and 2000 m of a water source. The resulting well field for a 1000 m service area is also depicted in
Figure 8.
Maps similar to those in
Figure 8 were developed to illustrate service areas with 500 m, 1500 m and 2000 m radii from water points. The number of additional wells required to achieve the design specification corresponding to 500 m, 1000 m, and 1500 m are 30, 7, and 4 wells, respectively. If a 2000 m service area radius were adopted, no new wells are required. Of course, this approach ignores the fact that many of the current sources being used by Koraro residents are not “improved” sources.
In 2007, the typical cost for installation and drilling of individual shallow wells such as those used in the Koraro region was $38,000. Thus, for the well fields proposed, construction and development costs associated with a 500 m service radius are approximately $840,000, or around $170 per Koraro resident. As of the 2008 MVP report, 16 new wells, out of a planned 39, were drilled in the region [
36]. From these numbers, sustainability of access aligns closely to the 500 m radius analysis and distance threshold and might not reflect the actual perceptions of residents. Moving forward, particular attention must be paid to these metrics and the community specified needs as the SDGs begin to implement development plans and design evaluation metrics.
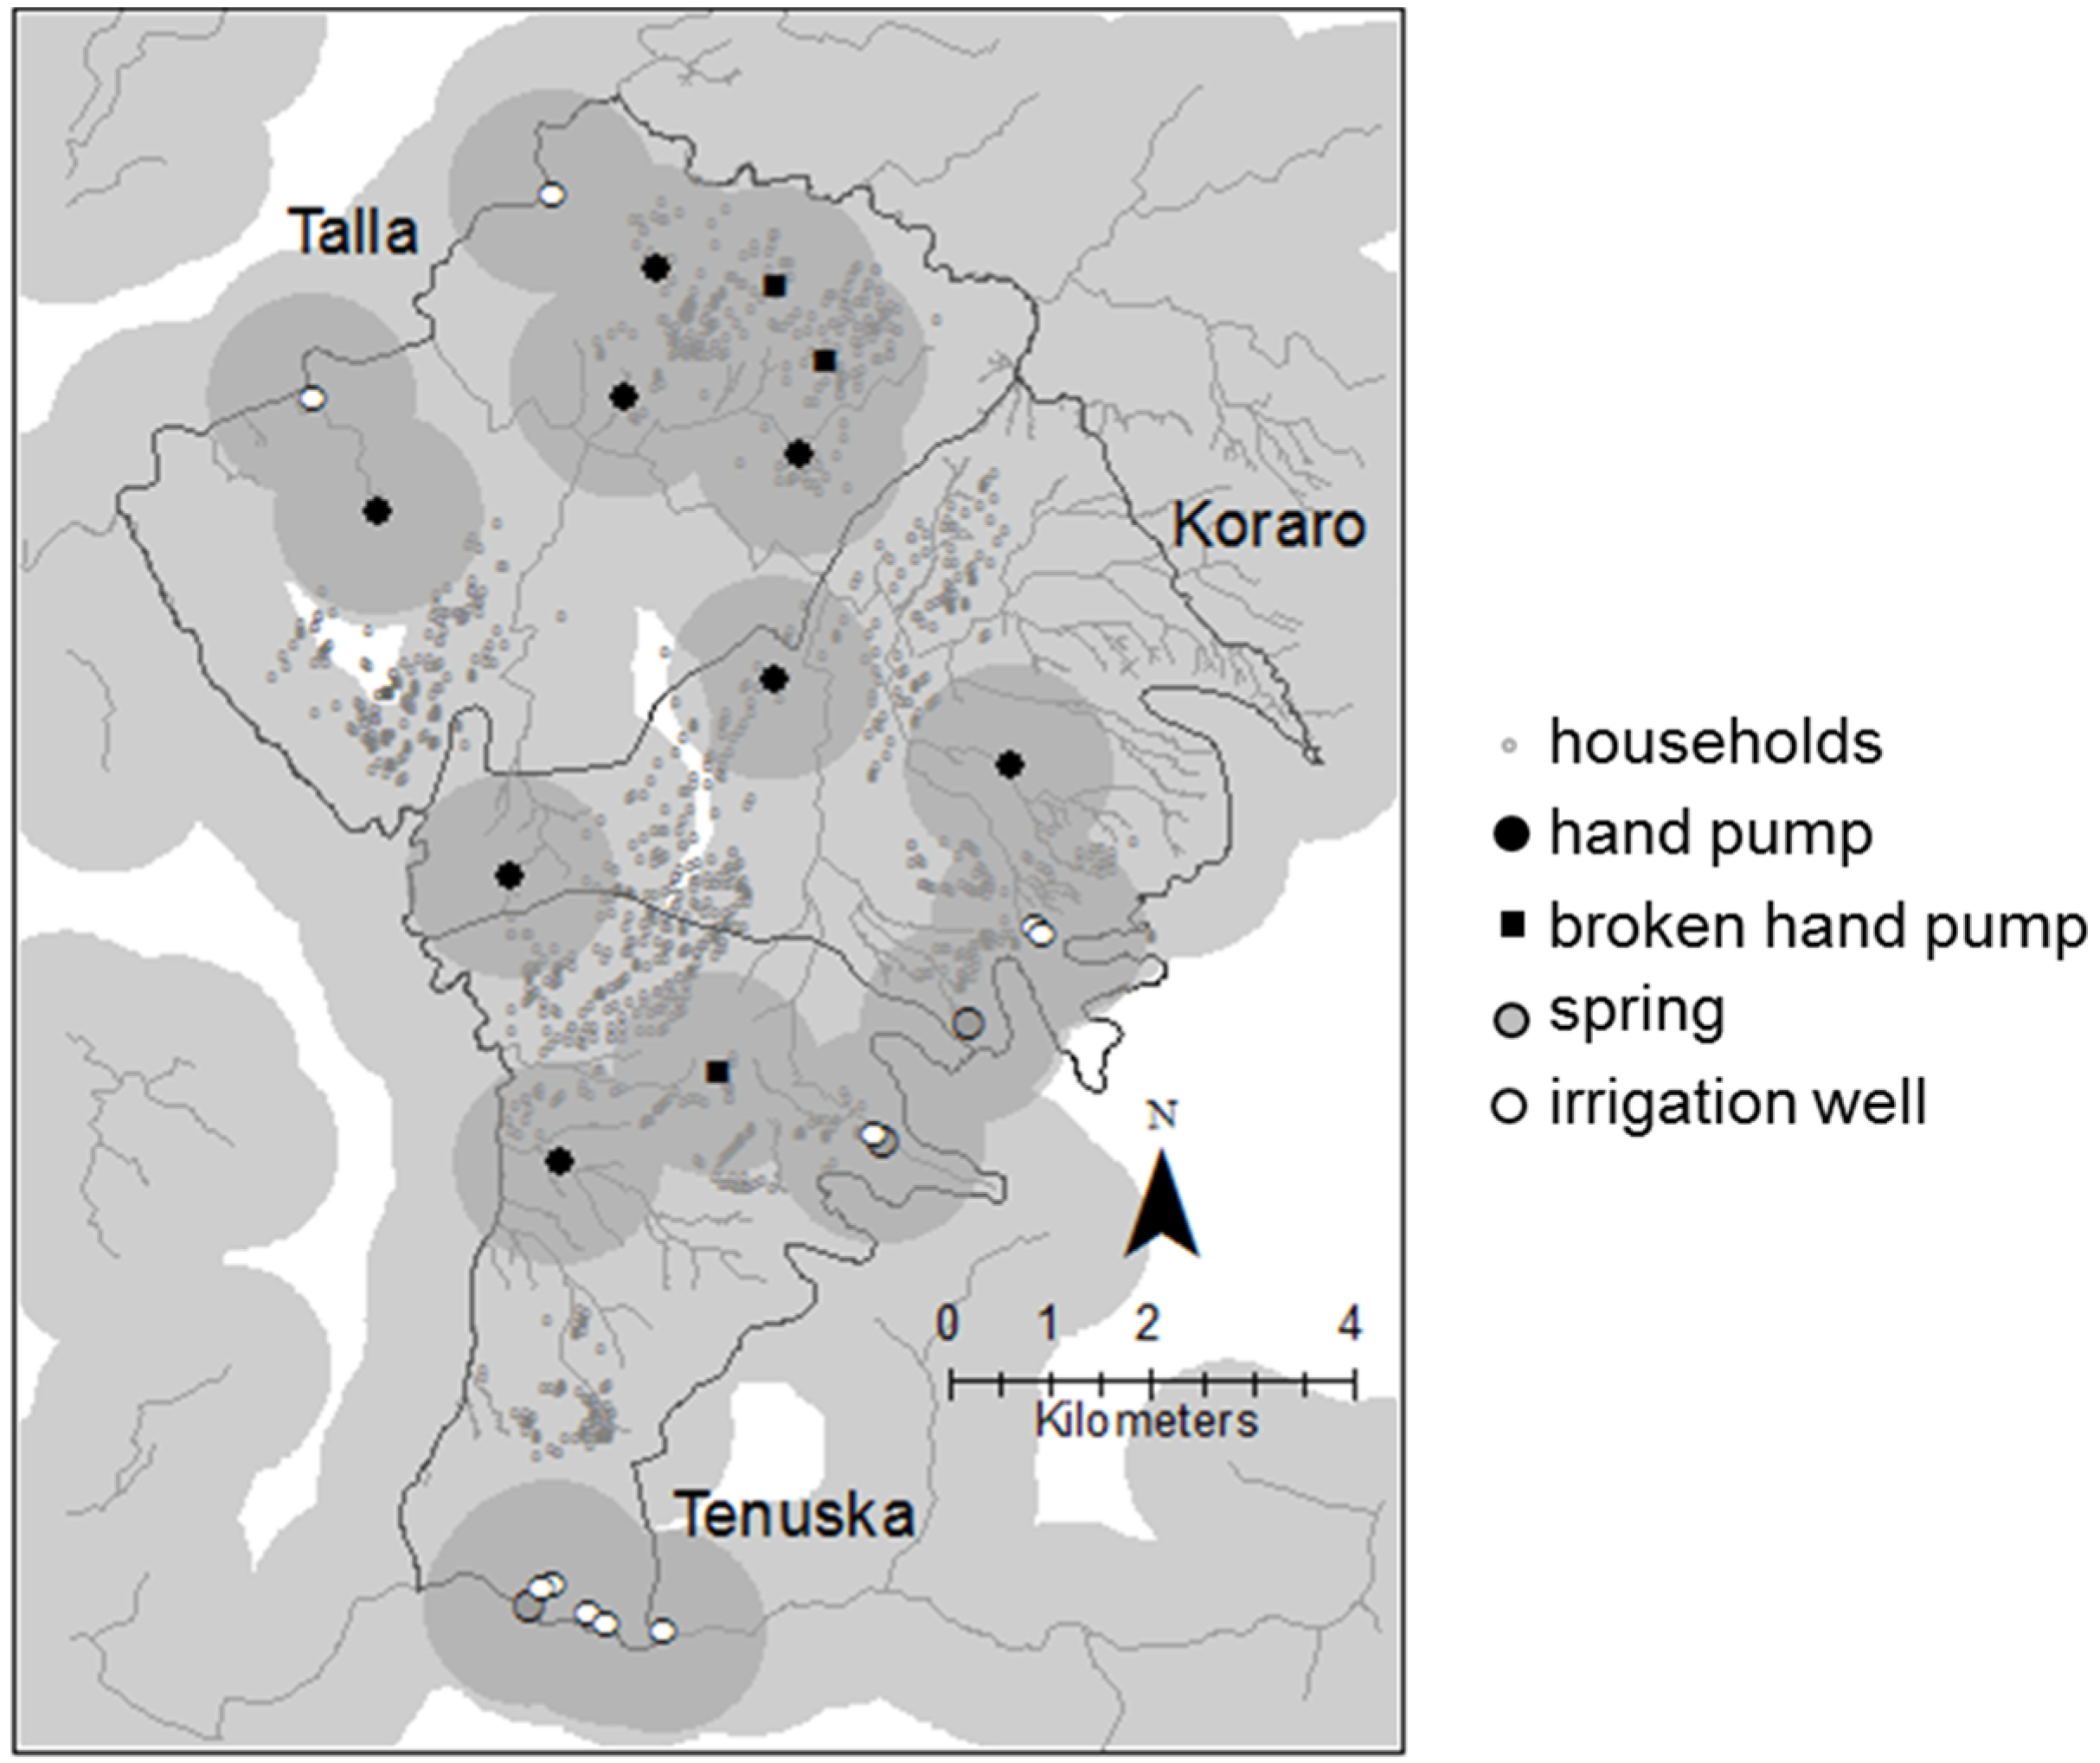
To determine whether the expense of adding wells is “worth it,” the anticipated impact of the wells on individuals’ activities and contribution to sustainability in the region, an alternate map was created in which 1 km buffers were generated around current water sources and riverbeds (
Figure 9). The justification of buffering riverbeds stems from the observed incidence of use of riverbeds as a household water source as reported in the workshop, even when a constructed water source is available at the same location. The reported presence of water in river sediments year-round (reported in the seasonal diagramming activity) and the association villagers appear to make between riverbed water, cleanliness, and agreeable taste makes the riverbed a source that must be considered in development activities in Koraro. As few as two additional wells would be needed to achieve a goal of each household being within 1 km of a water source when riverbeds are considered as viable water sources. This approach, while it contradicts the MDG format, might be more acceptable under the new SDG guidelines. It is apparent that the goals need more flexibility in determining adequate water sources and additional attention to actual water quality at the source, water quality from household containers, and household treatment practices is required to understand the quality of consumed water.
It is realized that the preceding analysis is simplistic. Not all of the riverbeds provide easy access to water. For example, it is expected that in the regions where stream density is high (the headwater streams with intermittent flows in the higher elevations in the Eastern portion of Koraro) storage may be limited and water may not be available year-round. Regardless, the depiction of served areas better reflects use patterns observed and reported in the Koraro region and it illustrates that any addition of wells based on buffers around only constructed water points does not necessarily generate the greatest impact per expenditure in terms of contribution to the global sustainability of the region.
In light of the workshop results and the above analysis, the construction of several diversion and infiltration structures as well as irrigation wells (a total of eight) was completed between 2009 and 2013 as part of the MVP project. Gullies were situated along the eastern part of Koraro where the presence of several springs is coupled with high probability of enhanced recharge. Given the workshop discussions, water needs, and preferences expressed, it was hypothesized that properly planned recharge infrastructure would increase water availability to all water sources in the region (wells and streambeds) and thereby increase drinking water and irrigation potential. From the workshop it is known that agricultural water source selection is predominately based on quantity and proximity; therefore, increasing the quantity to all sources might satisfy both criteria. The goal was to ensure water availability during the driest period before the rains return in March.
3.5. Implementing and Evaluating One Solution: Irrigation Diversion and Percolation Ponds
The first diversion and infiltration structures were constructed in 2009 in Tonseka. In 2011, the Mai-Megab and Tsegei-Koraro trench were completed along with eight irrigation wells. The success of the project was evaluated in 2011 through 2013 through harvest benefits, MVP self-evaluation reports, and visits by the Columbia Water Center team to verify assessments. Prior to the installation of irrigation measures, average yields were approximately 800 kg/ha barley, 1200 kg/ha maize, 700 kg/ha millet, 1000 kg/ha sorghum, and 600 kg/ha teff as reported by the MVP project staff. Additionally, in the 2008 Annual Report for the Koraro Millennium Village Project, 98% of the households surveyed had insufficient food [
36].
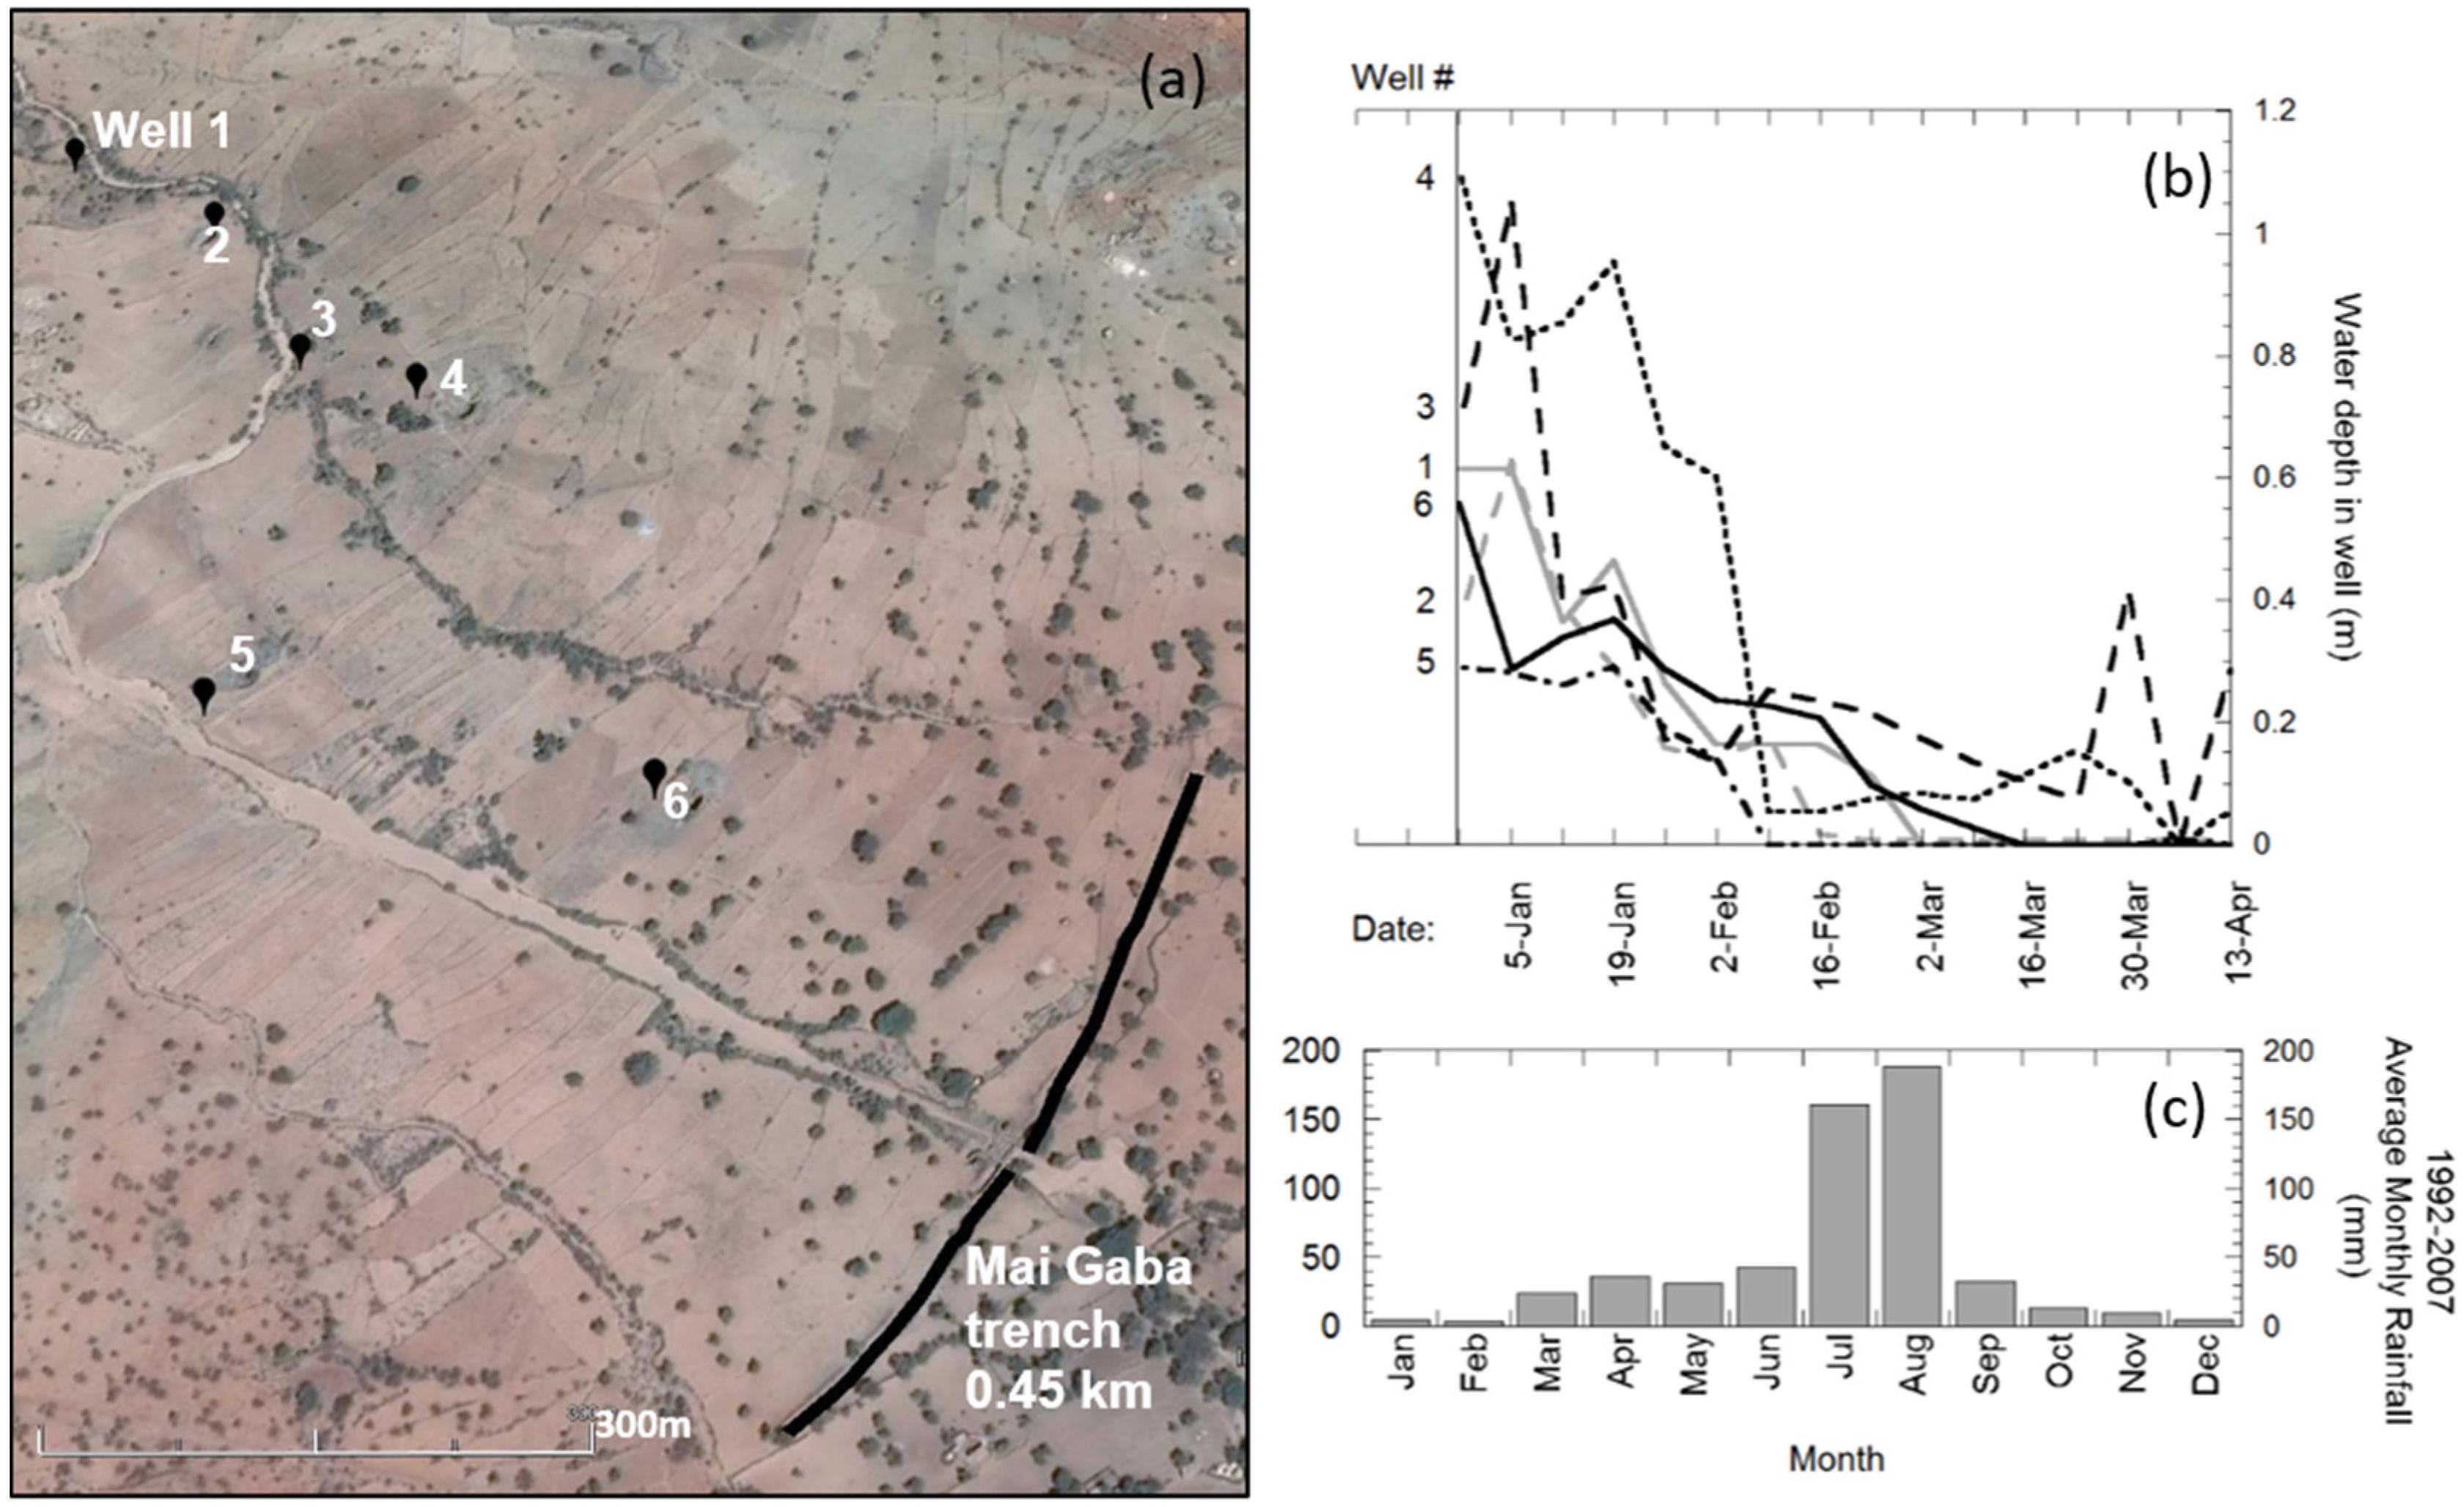
Given the lack of baseline information regarding measured stream flows, it is not possible to determine the extent of the increase in water availability; however, increased flows in seasonal streams were reported by both farmers and the MVP team. Tracking water in the wells downgradient from the installed Mai Gaba trench was a more accurate measure of groundwater recharge from the constructed trenches and a more reliable marker of increased water viability in the region (see
Figure 10). In
Figure 10, location of the wells are presented in the Google Earth plot (
Figure 10a), as well as time series well depth measurements (
Figure 10b) and average monthly rainfall for 2012–2013 (
Figure 10c) from the nearby meteorological station in Gondor (data downloaded from KNMI Data Explorer [
37]). In 2013, six wells were tracked weekly from the last week in 2012 until the second week of April 2013. During the team visit in December 2012, several wells that were previously dry in 2008 contained water. In the first week of March, the well furthest downstream (1.07 km away aerially, approximately 1.33 km away from the trench via the streambed) was the first to go dry. The well closest to the trenches (0.35 km, both aerially and via the streambed, away from the trench) maintained at least 0.2 m of water until going dry by the third week of March. Furthermore, it appears that small amounts of rainfall in the area might directly result in groundwater recharge. More monitoring of the observation wells and local precipitation is needed to definitively assess recharge potential for the area. Similarly, the eight irrigation wells constructed in the area all held water during visits in December 2012.
Direct farmer benefit was measured in increased hectare of productivity as well as availability of water. Irrigable area in Koraro has increased, however, this increase is a direct result of all the interventions and impossible to attribute to one intervention alone. One additional economic benefit as a consequence of increased water availability is the establishment of a sericulture (silkworm) cooperative.
3.6. Future Approaches for Development Interventions
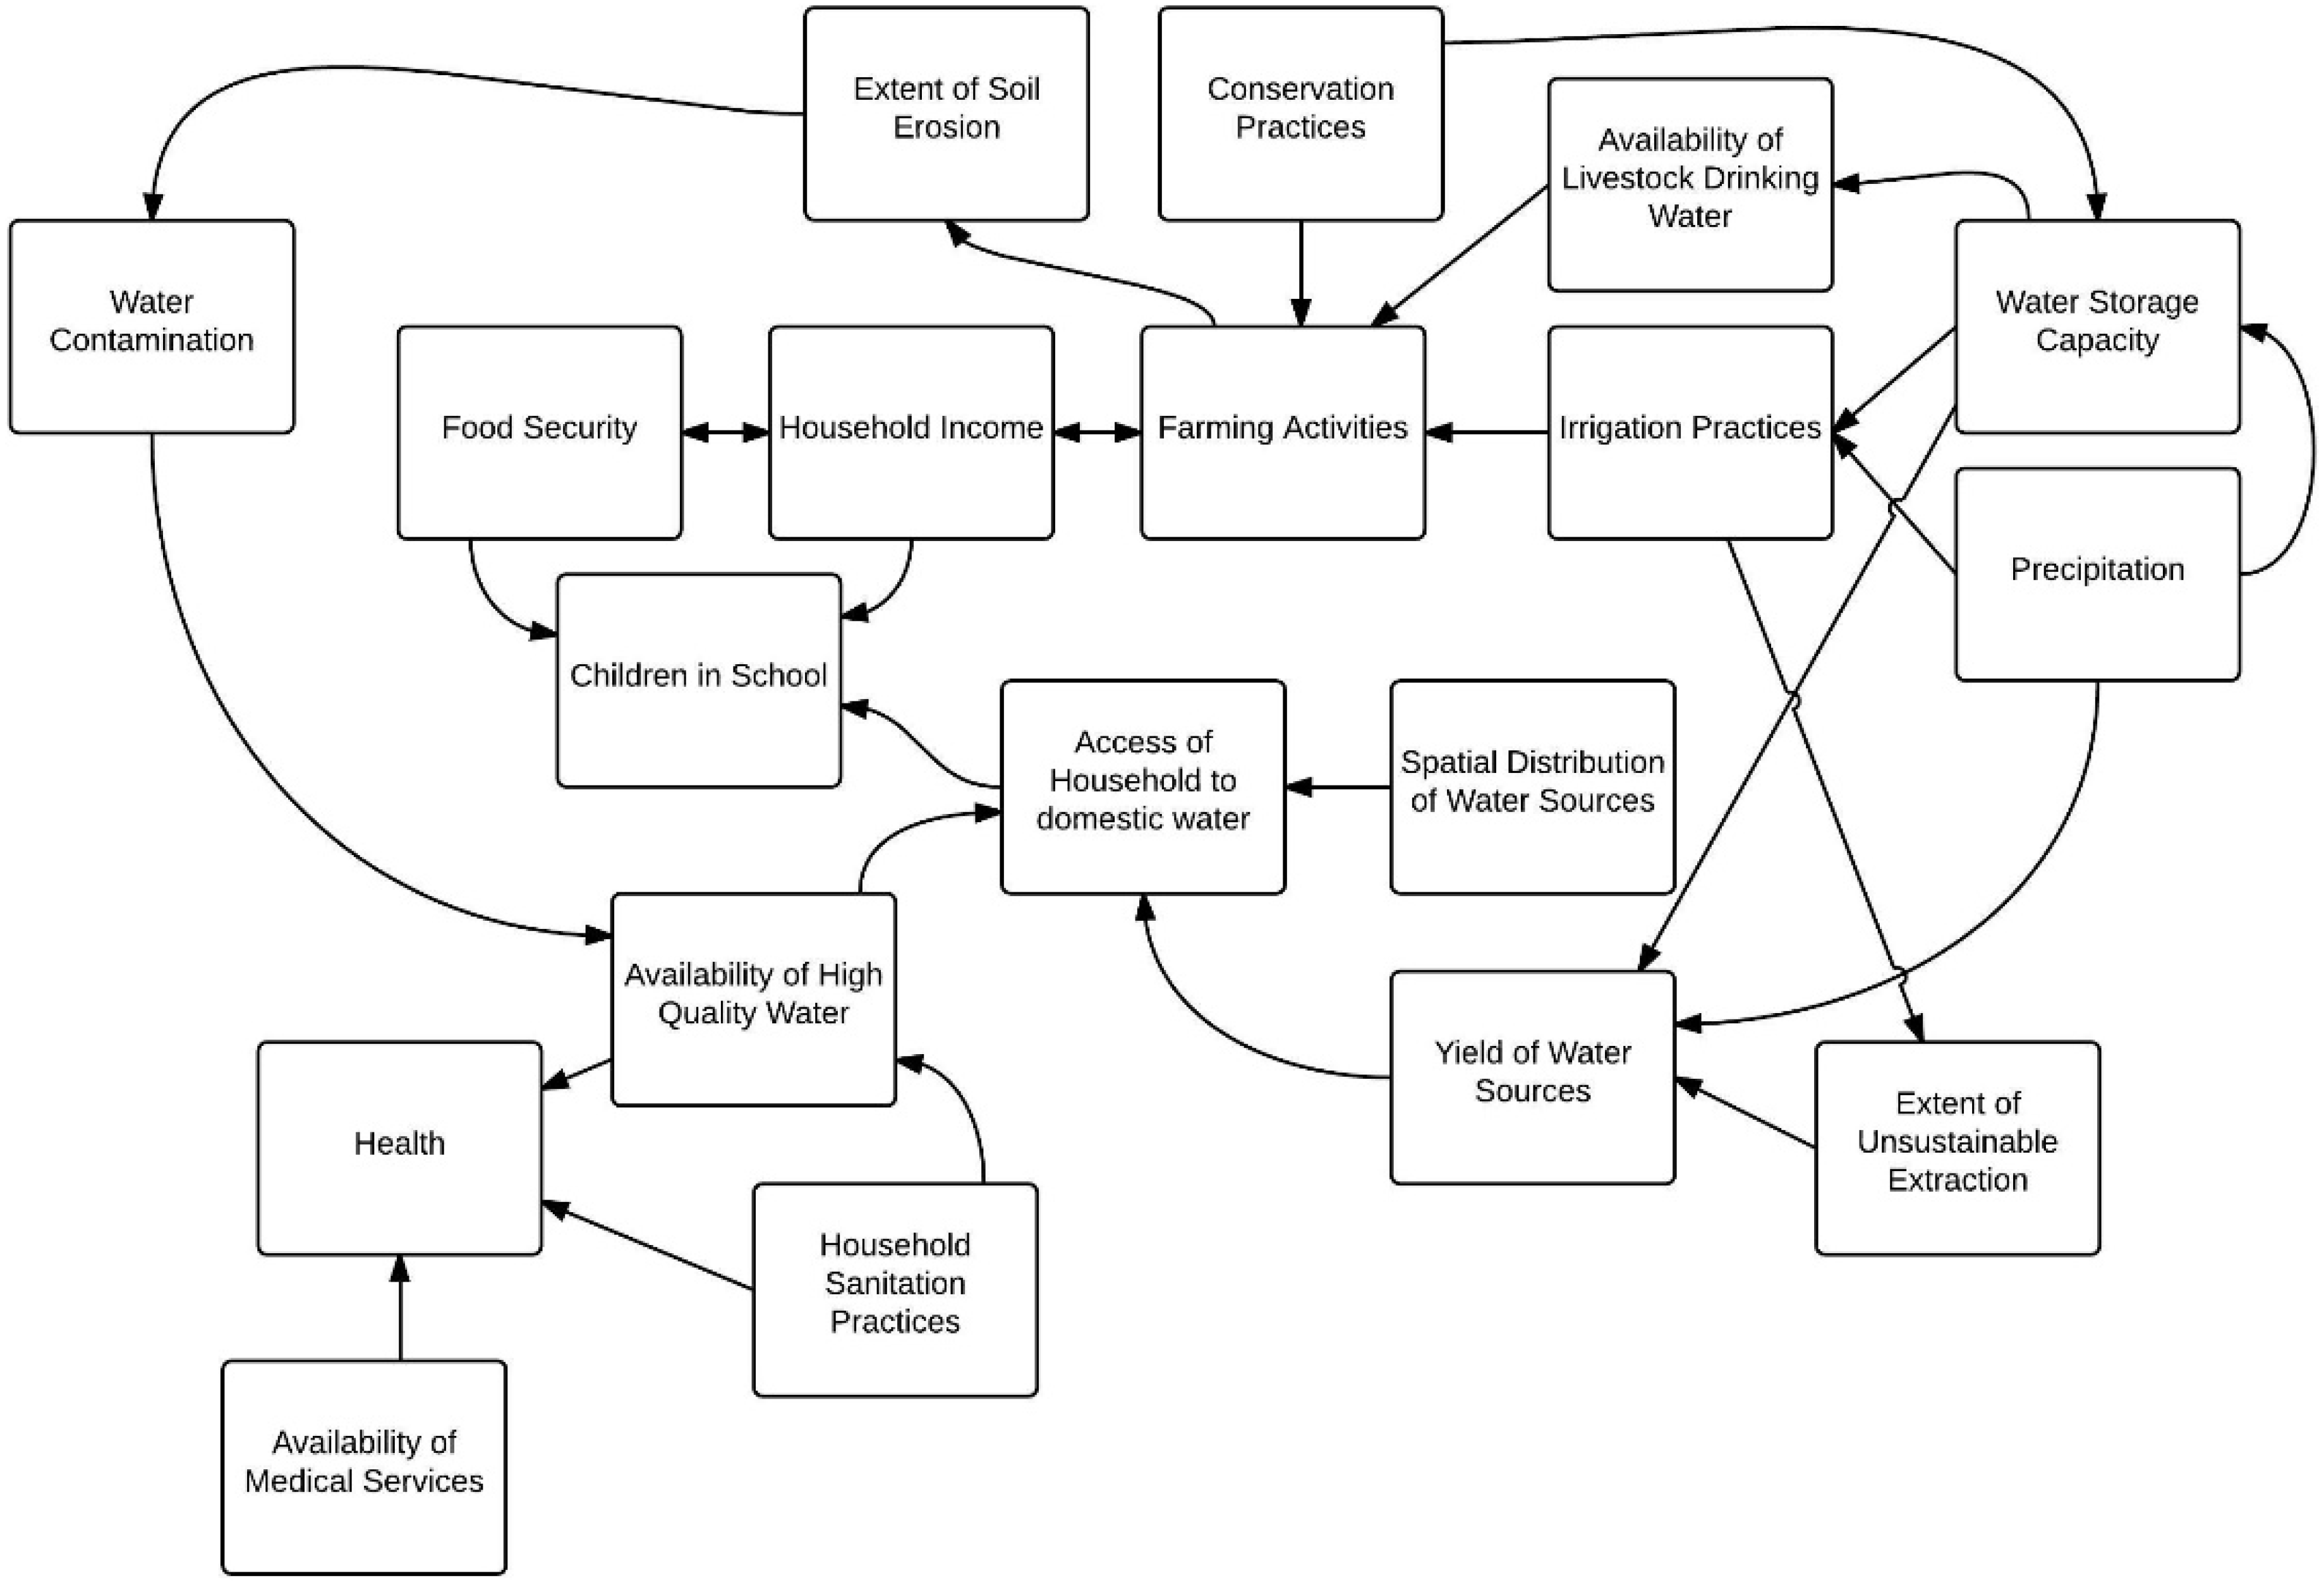
The process of evaluating water needs and development interventions has resulted in a complex diagram of water needs for the area, as depicted in
Figure 11. Representing all the dynamics in a single water assessment model is complex, yet is required for future interventions. As the SDGs continue into the future, models that attempt to understand the complexity surrounding water use and the impacts of implemented techniques are required. For a place like Koraro, the complex interactions depicted in
Figure 11 can be subdivided into three main interaction systems: the community user, the hydrologic, and the agricultural production system. Future research is required to properly understand the interactions as development interventions are introduced.
The authors conclude that using the stakeholder meeting as outlined in this paper to inform development can help to address many of the inputs required by the SDGs, and are crucial to successful implementation of future waterworks, but more and prolonged research is needed to adequately assess the success of this approach to data gathering.
4. Conclusions
From the information collected by the Koraro stakeholder meeting, it is apparent that a one-size solution is not even applicable for the differing Kushets let alone the region. The reliance on streambeds for water and the perceived cleanliness and salinity requires further analysis, but does shift a development initiative’s focus away from the normative, prescriptive approach of constructing boreholes. Interventions that improve or increase streambed water resources appear to be most desirable among residents of the Koraro region and those that were implemented are increasing water availability and potential earning power for many residents. If a 500 m buffer to an “improved” water source were the only criteria used to satisfy “reliable water provisions,” the area would need to spend over $800,000, but doing so may not actually serve the needs of the community as determined by the selection criteria voiced in the workshop. The irrigation and recharge projects constructed as a direct result of the workshops helped to increase water availability in the available sources.
Finally, considering only the gender of the responsible individual to collect would not necessarily determine the criteria for source selection. By conducting the activities associated with the workshop that highlight the selection criteria, the gender roles, and the distance of sources, it is apparent that all impact the volume of water collected by households and which sources are favored. Even though the MDGs are no longer in use, access to clean water remains a prominent focus of the SDGs, indicating that there is a still considerable progress needed in solving the water access problems, especially in water scarce regions like Koraro. Development must consider the complex interactions of all systems using water within a location. This paper documents one method that can be used to assist in customizing interventions to maximize multi-domain sustainability benefits and understand the community user perspective. The only way in which the SDGs can meet the objective of achieving equitable access to safe and affordable drinking water for all is if stakeholders are involved in the process and all voices are considered and documented in the process.


 ,
, 


