1. Introduction
Water resources are being intensively exploited and polluted, and it is estimated that, in a few years, the level of water stress will be high worldwide [
1,
2,
3,
4]. With the pressure on water supplies continuing to increase due to the rapid urbanization, industrialization and intensive agriculture of growing economies, interest in the use of alternative water sources, such as rainwater and recycled wastewater, is also growing [
5,
6,
7,
8]. Rainwater harvesting (RWH) is a widely known and used technique in Asia, Africa, and is more technologically developed in some European countries. Worldwide, regulations and incentives to foster the use of rainwater have been reported [
9]. The feasibility of rainwater harvesting in a particular locality depends greatly on rainfall magnitude and intensity. In regions characterized by low precipitation rates, rainwater harvesting alone is not enough to meet the water supply demands of rural and urban population [
10]. However, rainwater harvesting may be an effective supplementary water source because of its many benefits and affordable costs [
11,
12,
13,
14,
15].
On the other hand, the interest in greywater reuse (GWR) is rapidly growing in cities located in arid and semiarid zones of growing economies because of freshwater scarcity, the increasing water demand associated with the increase of population, and rapid industrialization. In these regions, greywater reuse may contribute to alleviate water shortage and stress on existing water sources, exacerbated by the climate change. Greywater treatment and reuse is an alternative to provide non-potable water to households and reduce the water usage per person by up to 50%, or even more [
10,
16,
17,
18]. Greywater is the major fraction of domestic wastewater, representing more than 70% of the total wastewater volume in Mexico and in some other Latin-American countries [
1]. Greywater reuse has been promoted and fostered in several countries around the world; Australia, USA (Arizona, California and Texas), Japan, Spain, Korea, China, and Cyprus are some examples. Establishment of guidelines, mandatory regulations, financial incentives and programs, and subsidies are some the instruments used by the authorities of such countries [
19]. Several treatment methods have been applied for greywater, and among them can be found physical systems, such as filtration and screening with membrane filtration; chemical systems, such as coagulation–flocculation and ion exchange resins; biological systems, such as constructed wetlands, rotating biological reactors (RBC), membrane bioreactors (MBR), and sequencing batch reactors (SBR). Physical treatment systems alone do not provide the desired microbial quality, and they are used together with disinfection steps or combinations of other methods [
20]. Under certain conditions, GWR for toilet flushing can be economically feasible, even to the user, depending on the treatment method selected, on the population served, and on the price of water [
21,
22].
Integration of rainwater harvesting and greywater reuse systems can result in significant water savings. Studies to evaluate the potential for potable water savings by using rainwater and greywater in houses and multi-story residential buildings have been conducted, showing water savings on the order of 36% in houses and 42% in multi-story residential buildings [
22,
23]. Those studies have also shown that approaches for individual houses are not cost effective due the fact that the amortization periods were very high (more than 17 years); meanwhile, for multi-story residential buildings, the approaches were economically viable with payback periods lower than eight years. On the other hand, it is important to mention that most water-saving schemes found in the literature, including rainwater harvesting, alone or combined with greywater reuse, deal mainly with the water demand reduction and costs, ignoring the benefits derived from wastewater minimization. Wastewater minimization may postpone the enlargement of existing sewer systems, allow the construction of new sewers with smaller pipe diameters, and reduce energy consumption for sewage pumping and wastewater treatment [
21]. Moreover, wastewater minimization may also signify less activated sludge production, less necessity of treatment and disposal, and, finally, less environmental and health impacts associated with its management and disposal. Therefore, integrating schemes have to show reliability, not only in terms of water savings, but also in terms of wastewater minimization; furthermore, they need to be easily operated, maintained, cost effective, and not compromise treated effluent quality, the environment and public health [
24].
Thus, in this study, the reliability of integrating rainwater harvesting with greywater reuse to reduce, not only the water consumption, but also to minimize the wastewater generation in the Tecnológico de Monterrey, Campus Monterrey, was assessed. Furthermore, a cost–benefit analysis was conducted to determine the economic viability of the proposed strategy. Potable water consumption and greywater generation in main facilities of the campus were determined. Rainwater that can be potentially harvested on roofs and parking areas of the campus was estimated by conducting a rainfall statistical analysis. Based on these data, potential water savings and wastewater minimization were calculated. Characterization of rainwater and greywater was carried out to determine the capacity of the storage tanks and the treatment technologies needed for each water source. The Monterrey Campus was selected for this study for the following reasons, (1) Monterrey is an industrial city located in Northeastern Mexico with a population of 5.1 million inhabitants [
25], an annual rainfall of 580 mm [
26], and with water scarcity problems; (2) the campus is an important water user and wastewater generator, with a total population of more than 20,000 persons, including students, professors, and workers; (3) the campus possess a wastewater treatment plant, which treats most of the wastewater generated; and (4) the institution is interested in replicating the strategy presented in this study on 30 additional campuses, distributed throughout Mexico, to reduce the impact on regional water resources.
2. Materials and Methods
2.1. Rainwater Potentially Harvestable in Roofs and Parking Lots
Digital constructions plans of buildings and facilities of the Monterrey Campus were provided by institution authorities.
Figure 1 shows Monterrey Campus and groups of catchment surfaces of buildings, esplanades and parking lots considered in this study. The surfaces were clustered in five groups based on the closeness among them and the configuration of the sewage and rainwater drains, which ease the collection of rainwater and greywater. Using AutoCAD
® (Autodesk, San Rafael, CA, USA), the areas of the catchment surfaces were estimated.
Rainfall was determined based on meteorological data collected from the nearest climatological station (No. 019049, “Monterrey”). Daily precipitation registered from 1984 to 2014 (30 years) was used. Kendall, Mann-Kendall, and Grubbs and Beck tests were applied to the data to determine the independency, homogeneity, and the presence of outliers that could deviate erroneously the monthly rainfall values. These tests were conducted by using the SEAF software (Expert System for At-Site Frequency Analysis of Hydrologic Variables) [
27]. The monthly rainfall was estimated for a confidence interval with a significance level of 95%. Lower and upper limits were calculated using Equation (1).
where
is the monthly precipitation for the period 1984 to 2014, where the outliers are discarded;
the standard deviation; and
the standard value of the normal distribution with a significance level of 95%.
Once the monthly rainfall was estimated, the rainwater volumes were calculated using Equation (2):
where
Vi,j is the volume of the
i month for the roof or parking lot
j;
Pi the precipitation of the month
i;
Aj the surface area of the roof or parking lot
j; and
Cr is the runoff coefficient, which represents the ratio of runoff to rainfall and depends on several factors, such as surface type, storage of water in surface depressions, infiltration, antecedent moisture, roof cover, and roof slope. For concrete and asphalt surfaces, a value of 0.85 is recommended [
28].
2.2. Potable Water Consumption and Greywater Generation
Historical data, provided by the authorities of the Tecnológico of Monterey, were used to determine the potable water consumption of Monterrey Campus. Analyses of the data were conducted to identify the water source (well or pumping network), type of use (services, irrigation or cooling systems), and determine the monthly and annual consumptions.
Greywater generation from handwashing basins and showers available in buildings and facilities of the campus was determined based on the discharge capacity of the appliances, frequency, and time of use. To estimate the frequency and time of use of the appliances, a survey was conducted among the campus community. The discharge of the appliances was determined based on volumetric measurements conducted directly in 95% of the appliances located in buildings and facilities of the campus. The greywater generation was calculated with respect to only the days in which the appliances were really used. Thus, vacations and holidays were excluded, and only a fraction of weekends was taken into consideration.
2.3. Characterization of Rainwater and Greywater, and Determination of Treatment Necessities
Physical, chemical and bacteriological characteristics of rainwater and greywater were determined to assess the necessities of treatment to reuse them in non-potable uses. Quality parameters were selected from Mexican Official Standards for drinking water [
29] and wastewater reuse with direct and indirect contact [
30]. Each parameter was measured based on the protocols described in the Standard Methods for the Examination of Water and Wastewater [
31]. Rainwater samples were taken from discharges of two representative buildings, one with air conditioning equipment on the roof, and the second free of them. Additionally, rainwater samples from the drain of a representative parking lot were taken. Greywater samples were obtained from handwashing basins and showers located in toilet and shower rooms for women and men. Based on the rainwater and greywater characterization results and the quality requirements set in the Mexican standards for drinking water [
29] and wastewater reuse with direct and indirect contact [
30], the necessity of treatment for rainwater and greywater was determined.
2.4. Selection and Design of Treatment Processes for Rainwater and Greywater
The operations, processes, and systems needed to achieve the level of treatment required were selected according to the following criteria, final use of the treated water, efficiency to remove contaminants, cost effectiveness, and applicability on onsite/decentralized systems. Once selected, the treatment systems were designed to determine the investments needed for their implementation. Furthermore, operation and maintenance costs of such systems were also estimated. Because the design of the systems is not included in the scope of this paper, details of the design process are not presented; only main results, such as dimensions of the systems and selected equipment, are included.
2.5. Sizing of Water Storage Tanks
For each group of buildings, esplanades, and park lots (
Figure 1), the dimensions of the tanks needed to store the rainwater and greywater were determined. Because 100% of the potable water demand is not satisfied by treated rainwater and greywater, scenarios with different percentages of coverage for each group were set. Then, the size of the tank for each group of catchment surfaces was estimated by conducting daily water balances, where rainwater and greywater contributions were the inputs, and potable water demands for buildings services and irrigation of green areas of the campus were the outputs. Daily precipitation obtained from data over 30 years (1984–2014), daily greywater generation, and daily potable water demand were used to conduct the water balances, based on the equation reported by the authors of [
32]:
where
St+1 is the storage volume in the tank at the end of the day;
St the storage value at the beginning of the day;
Qt, the runoff from the roof plus the greywater collected on the day;
Dt, the total demand of water on the day; and
C is the active tank capacity.
The storage volume in the tank at the end of the day (St+1) was plotted for consecutive days for the 30-year period. Then, pairs of consecutive maximum and minimum peaks were identified along the plot for the 30-year period, and the absolute difference between the peaks was determined. The pair with the greatest volume difference between the peaks was set as the storage tank capacity. Overflows of the storage tanks in times of high water production were taken into consideration during the daily water balances.
Additionally, a water distribution network and a pumping system were designed to distribute the treated rainwater and greywater into the buildings. Conventional hydraulic procedures and the International Plumbing Code [
33] were applied for the design. Pumps were selected based on the flowrate, hydraulic loads, and power required.
2.6. Economic Assessment
2.6.1. Determination of the Investment and Operation Costs of the Selected Treatment Systems
The investment needed to implement the treatment systems for rainwater and greywater was estimated. Based on the designs of the rainwater and greywater treatment systems, water storage tanks, and the new water distribution network, the costs of equipment, construction, and implementation of the treatment systems were determined. Additionally, operation and maintenance costs associated with those systems were also estimated.
2.6.2. Determination of Benefits
The economic benefits expected to be obtained with the implementation of the systems for rainwater harvesting and greywater treatment and reuse were determined in terms of potable water savings and wastewater reduction. The benefits associated with the potable water savings were calculated based on the reduction of pumping costs due to the fact that 99% of the water supply to Monterrey Campus is provided by ground water. The benefits linked to the wastewater reduction were determined based on the economic savings associated with the wastewater treatment.
2.6.3. Cash Flows and Metrics
Based on the investments, operation and maintenance costs, and previously-estimated benefits, the cash flows were prepared. Net present value (NPV), the internal rate of return (IRR), and the benefits–investment ratio (B/I) were used as metrics to conduct the economic assessment of the technological alternatives proposed in this study to reduce water consumption and minimize wastewater generation. The minimum acceptable rate of return (MARR) used in this evaluation was estimated as follows:
The inflation rate was set at 3%, based on the information provided by the Bank of Mexico [
34], and the risk was fixed at 3% due to the low risk associated with this type of investment project [
35]. The NPV was estimated using Equation (5):
where
I0 is the initial investment; NCF the net cash flow of the year
n, corresponding to the net benefits after taxes of the year
n; and
i the reference interest rate, set as MARR [
35].
The IRR is the interest rate that makes the NPV zero, and was estimated using Equation (6):
3. Results and Discussion
3.1. Rainwater Potentially Harvestable in Roofs and Parking Lots
The city of Monterrey has a population of approximately 5.1 million inhabitants and is located in the northeast of Mexico. This region is a semiarid zone, with a rainfall of 580.0 mm/year. Daily precipitation data from the meteorological station No. 019049 “Monterrey” for the period from 1984 to 2014 were used to estimate the rainwater volumes that were potentially harvestable by catchment surfaces. These data were treated to determine their independency and homogeneity and eliminate outliers that could erroneously deviate the monthly rainfall values. The Kendall, Mann-Kendall, and Grubbs and Beck tests were conducted by using the SEAF software (Expert System for At-Site Frequency Analysis of Hydrologic Variables) [
27]. Due to the fact that the median resulted more representative than the average, the median was used to determine the monthly rainfall for a confidence interval with a significance level of 95%. The lower and upper limits were determined by using Equation (1). The rainwater volumes were calculated using Equation (2) for a total catchment area of 65,768.75 m
2 that included roofs, esplanades, and parking lots.
Table 1 summarizes the results of these calculations.
As seen in
Table 1, September is the month with the highest precipitation and, consequently, with the highest rainwater volume; meanwhile, December is the month with the lowest rainwater volume that can be harvested. The annual rainwater volume potentially harvestable from building roofs, parking lots and esplanades of the Monterrey Campus was on the order of 32,426.3 m
3 with a minimum of 21,943.7 m
3 and a maximum of 42,909.0 m
3.
3.2. Potable Water Consumption and Greywater Generation
The potable water consumption of Monterrey Campus was estimated based on the historical data provided by the authorities of the Tecnológico of Monterey. The annual water consumption was 236,117 m
3. Ninety-nine percent of this volume is supplied by pumping from groundwater sources (wells) and only 1% is provided by the public water network of the city of Monterrey.
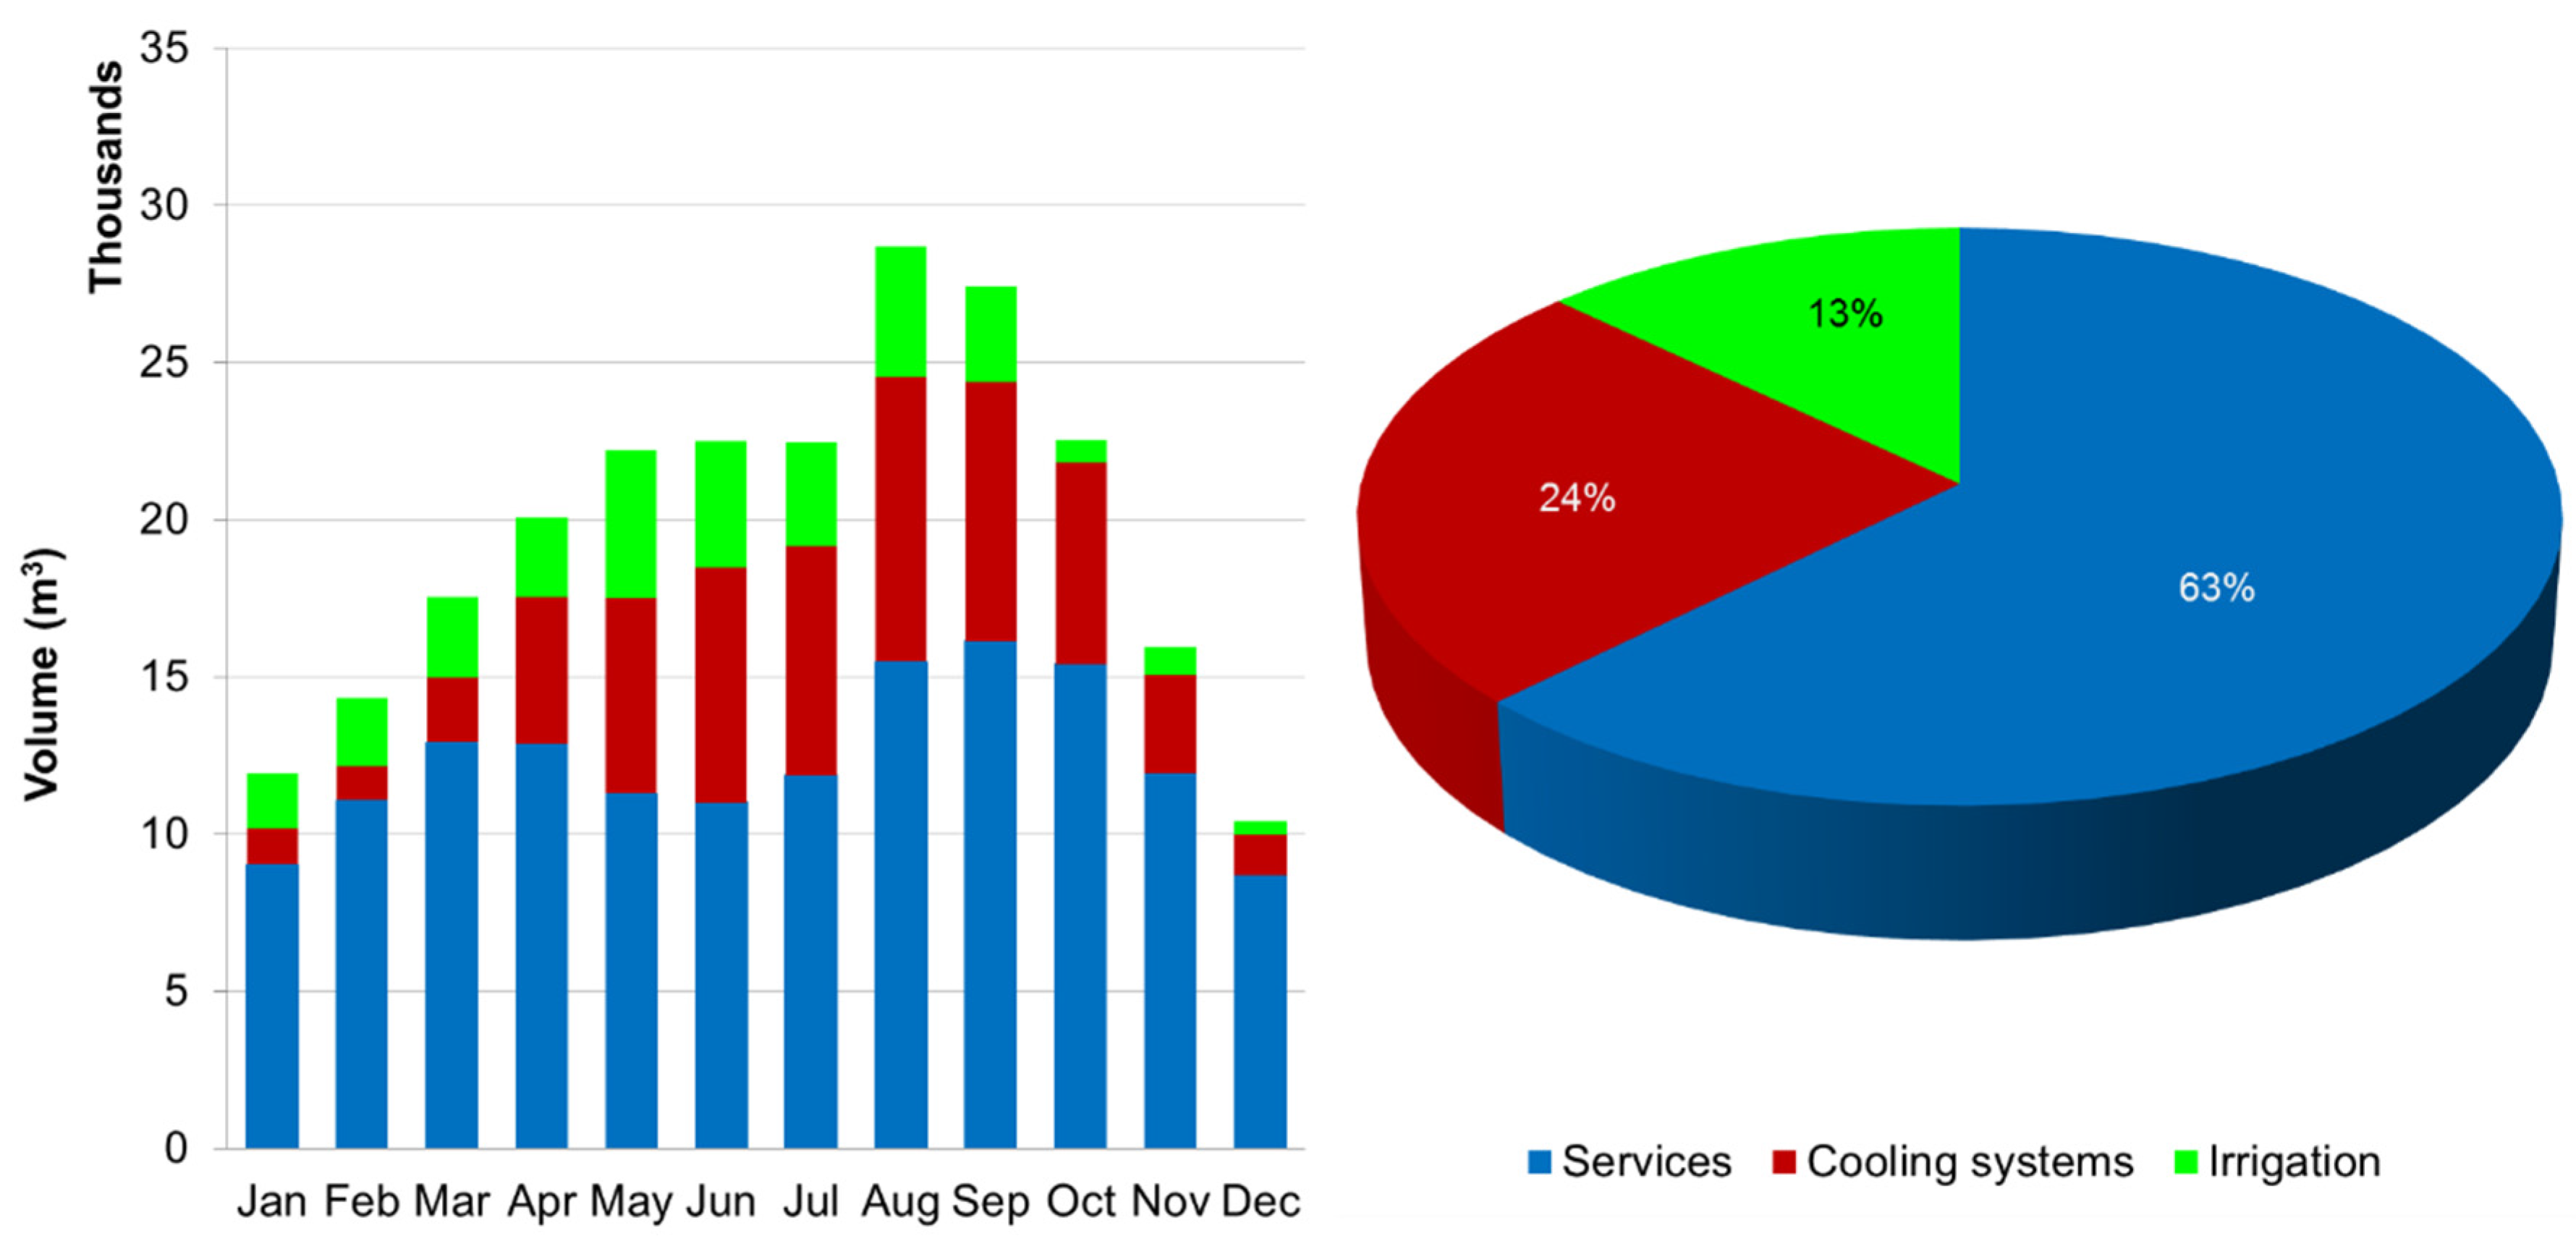
Figure 2 shows the monthly potable water consumption of Monterrey Campus. As can be seen, the main water consumption (63%) was associated to buildings services, such as drinking, cooking in restaurants, toilets flushing, pools filling, laboratories supply, handwashing, floors cleaning, laundry and showering in student dormitories. The cooling systems consumed 24% and irrigation of green areas demanded only 13% of the potable water. In the Monterrey area, air conditioning is needed because high temperatures prevail from April to September; therefore, cooling systems are needed on the campus to provide air conditioning to buildings and facilities. The percentage of irrigation is low because green areas are normally irrigated with treated wastewater from the treatment plant of the campus and potable water is only used as a complement.
Regarding the greywater generated by handwashing basins and showers in the buildings and facilities of the campus, from a survey applied to 107 members of the community, it was found that the effective time of use of appliances was 287.5 days a year, 65% of the community used the sanitary facilities two or three times/day, 23% four times/day, and 12% once/day. Furthermore, 63% of the community used 5–20 s for hand washing, 34% used 20–40 s, and only 3% used more 40 s. In relation to the use of showers, 30% of the students used them once or twice in a day, 65% took a shower three to five times/day and only 5% used such appliances six or more times. Moreover, 39% of the students took a shower in 1–5 min, 44% in 6–10 min and 17% used 11 min or more. The high frequency of showering, compared with other countries, is caused by the climate of Monterrey, where temperatures greater than 30 °C occur from April to October, with periods exceeding 40 °C in summer. Based on these results, and on the volumetric measurements of appliance discharges, the greywater generation rates were calculated for a confidence interval with a significance level of 95% (
Table 2). As can be seen, the men generated 43,457 L/day, meanwhile the women 13,492 L/day, totaling 56,948 L/day. Men’s generation was greater than that of women due to the fact that the campus community is composed of mostly men.
Figure 3 shows the monthly greywater generation of Monterrey Campus. As can be seen, showers were responsible of 66% of the greywater generation, while handwashing basins contributed 34%. Furthermore, two periods of lower generation were observed, in December and January, and from May to July, which correspond with the vacation periods of students. The greatest greywater generation from showers occurred from August to October, as a consequence of the high temperatures and humidity present in the region, which causes an increase of showering frequency. Handwashing basins generated approximately 16,556 m
3/year, while the showers of gyms, swimming pool, and student dormitories produced 35,863 m
3/year, totaling in 52,219 m
3/year of greywater.
3.3. Characterization of Rainwater and Greywater, and Determination of Treatment Necessities
Physical, chemical and bacteriological characteristics of rainwater and greywater are presented in
Table 3. Two representative roofs of the campus were selected to sample rainwater, one with air conditioning equipment and the other free of it. Additionally, rainwater collected from a representative parking lot was also characterized. Values that did not meet the permissible limits of the standards are written in italics. As was observed, concentrations of total and fecal coliforms in rainwater and greywater were much greater than the permissible values; rainwater from parking lots presented the greatest concentration. On roofs and parking lots, the sources of both coliforms were feces of wild fauna that exist on campus, such as birds, small mammals, and reptiles. Greywater showed less concentration of total and fecal coliforms than rainwater.
Regarding the physical characteristics, color, and turbidity of the rainwater and greywater samples did not meet the standard values in most cases, especially the rainwater from parking lots, which, in fact, was the most concentrated in suspended solids, with 2678.6 mg/L. Greywater presented the highest concentration of dissolved solids and, consequently, the greatest values of electrical conductivity.
In relation to the chemical quality, all rainwater and greywater samples did not meet the permissible limits of parameters, such chemical oxygen demand (COD), aluminum, and ammonia nitrogen. In the case of the rainwater samples from roofs, values of phenolic compounds, nitrites, and sulfates were greater than the limits established by the standard. High values of COD and the presence of ammonia nitrogen, nitrites and sulfates in rainwater samples were the result of biological activity due to the presence of trash (leafs) from trees and the growth of lichens on the roofs. Moreover, the contribution of fossil fuel combustion from automobiles and industry was expected. Parking lot rainwater also resulted in high levels of hardness, grease and oils, and sulfates, beyond the standard values.
The presence of aluminum, grease, and oils in rainwater samples of parking lots was associated to the leakages of automobiles engines. As expected, greywater did not meet the standard values of methylene blue active substances, due to the surfactants contained in soaps and detergents, used during hand washing and showering.
Based on the characterization results, it is clear that treatment of greywater and rainwater is required before these water sources can be used in buildings and facilities of the campus. Thus, nuisance problems and health risks to the community will be avoided.
3.4. Selection and Design of Treatment Processes for Rainwater and Greywater
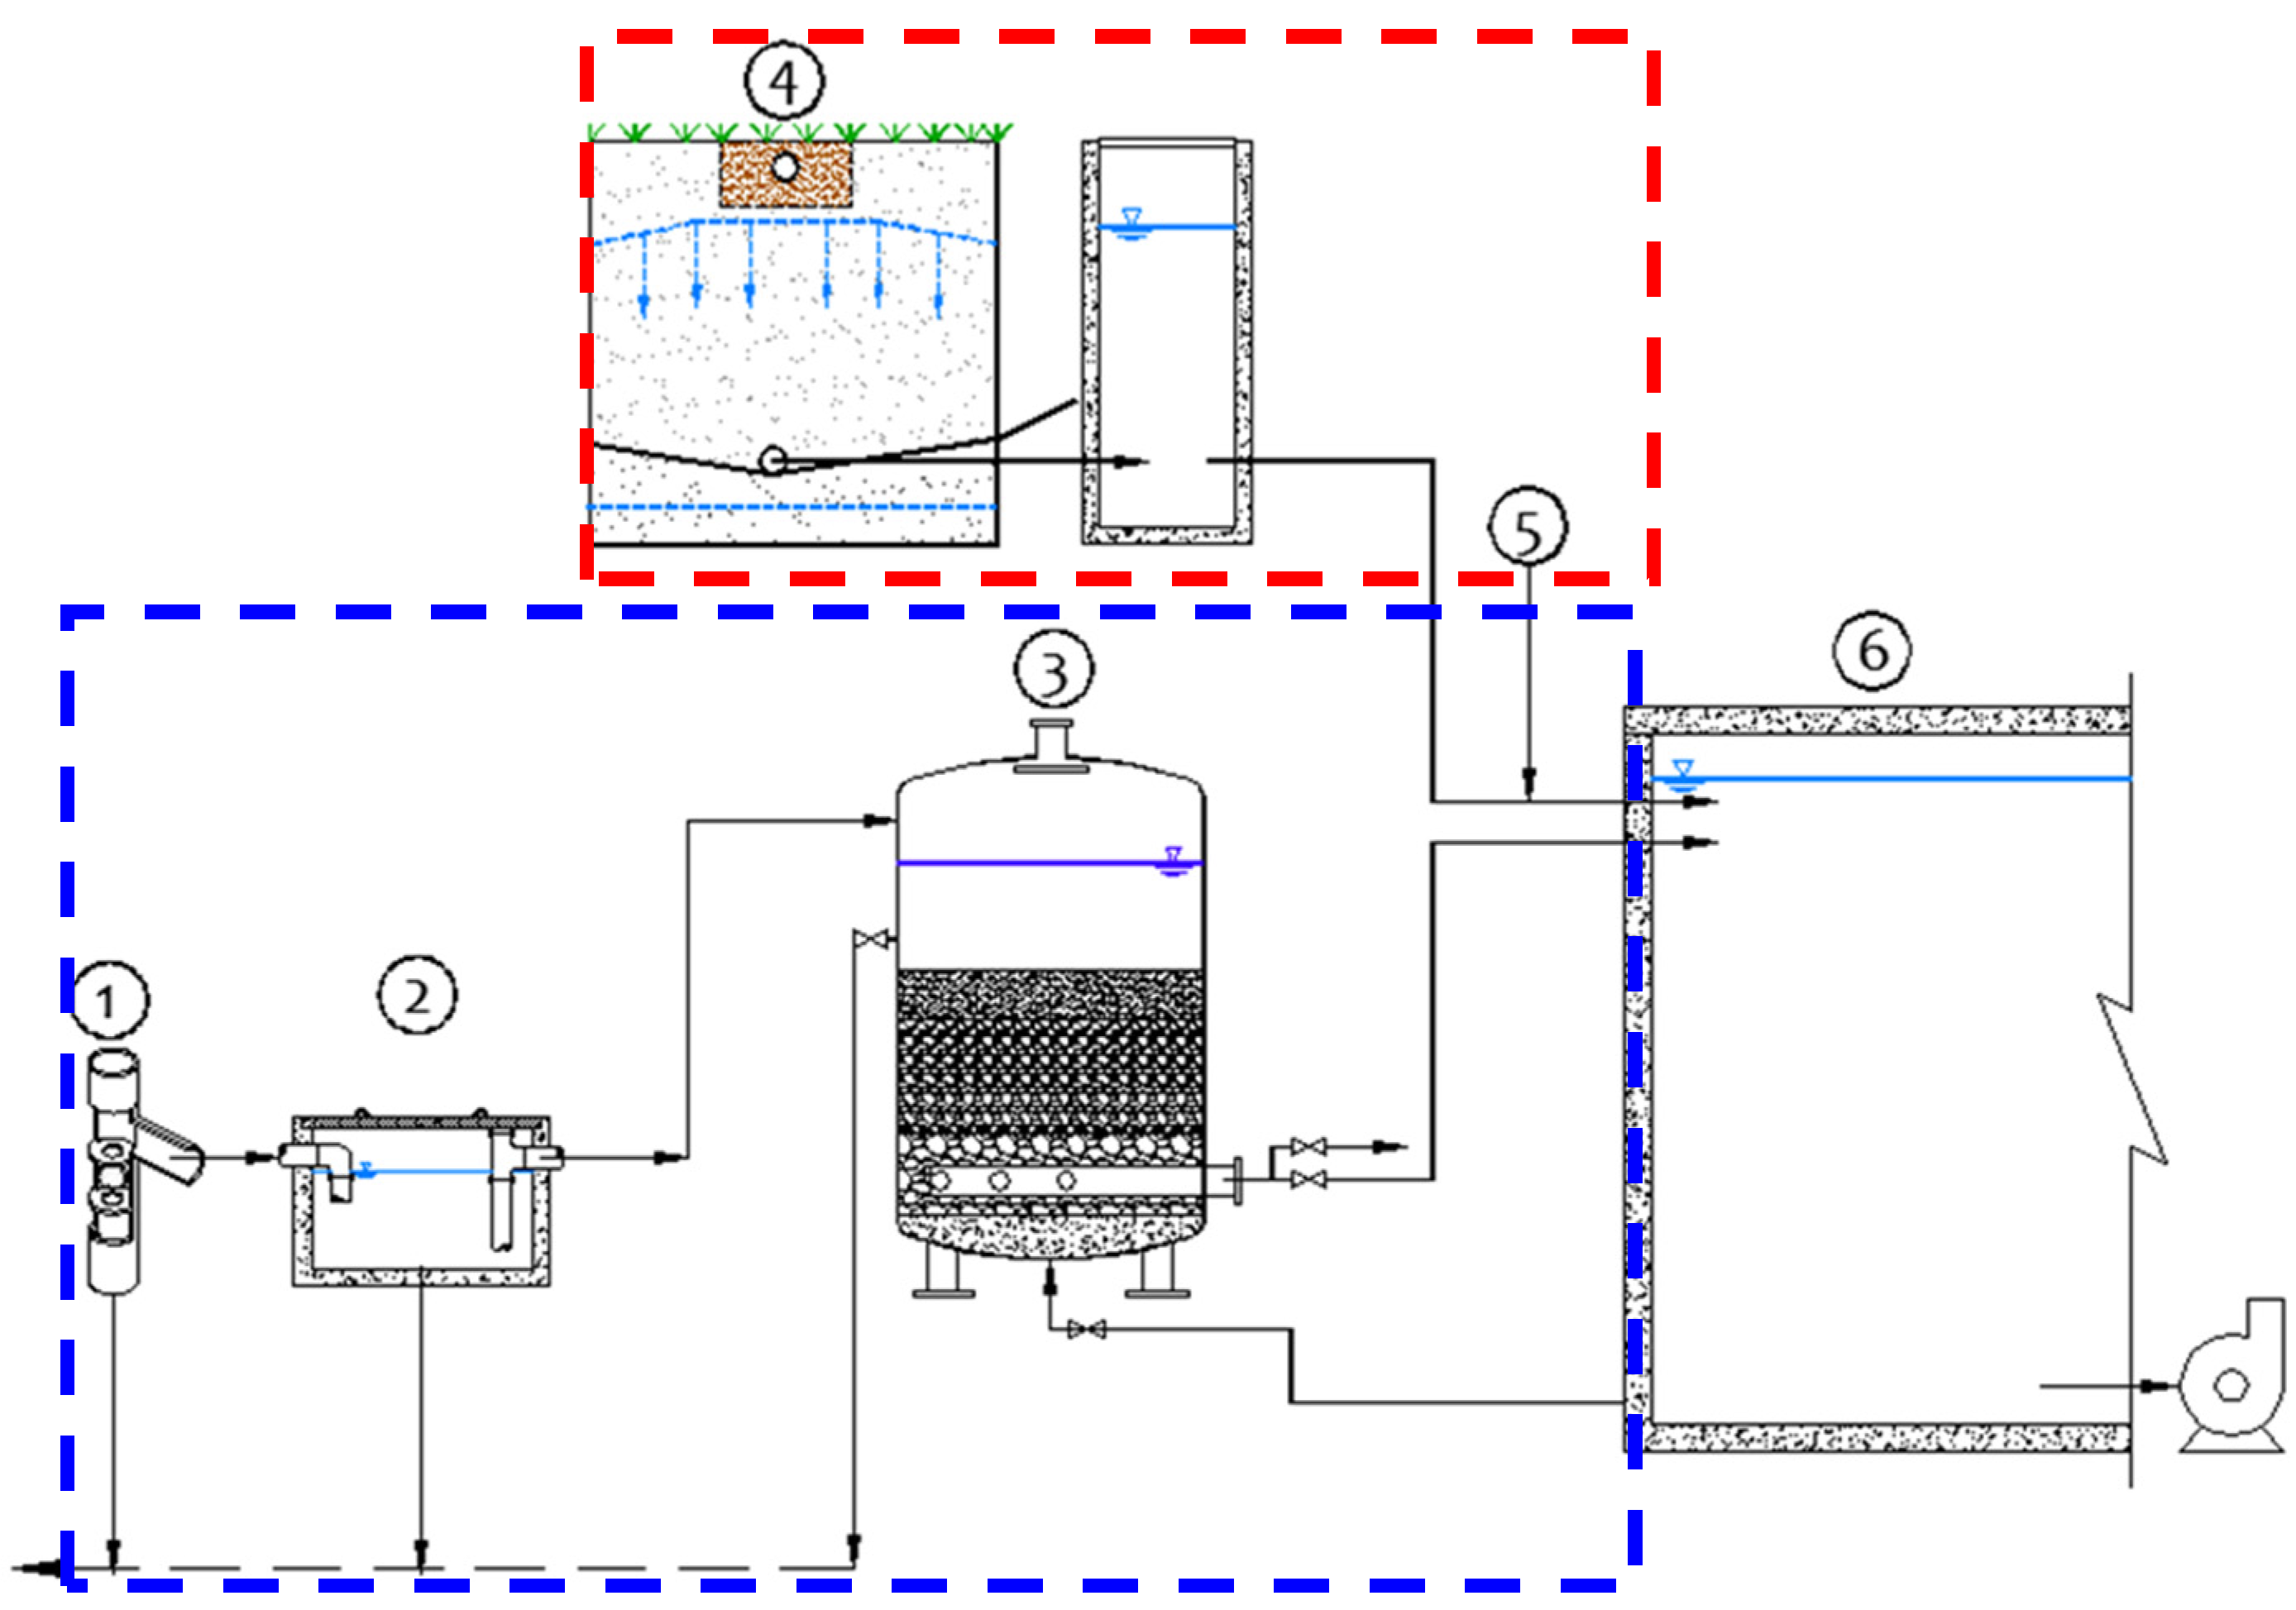
The operations, processes, and systems needed to achieve the water quality, or level of treatment required, were selected according to the following criteria; final use of the treated water, efficiency in removing contaminants, cost effectiveness, and applicability to onsite/decentralized systems. According to these criteria, it was decided to use the rainwater and greywater after treatment for non-potable uses, such as toilet and urinal flushing, floor cleaning, fire control, green area irrigation, and others. Thus, the systems proposed in this study to treat and use rainwater and greywater are represented schematically in
Figure 4.
In
Figure 4, ① represents a first-flush diverter of rainwater, which will be used to convey the first flow of rainwater from the catchment surface away from the storage tank. The flushed water will be routed to a green area. While leaf screens will remove the larger debris, such as leaves, twigs, and blooms that fall on the roof, the first-flush diverter will allow the system to rid itself of smaller contaminants, such as dust, pollen, and bird and rodent feces. A volume of 2.5 L for every square meter was considered to be diverted as a first flush [
36]. ② Corresponds to grease and oil traps, which were designed to remove these contaminants and settle grit from parking lots. Three grease traps of galvanized steel with a capacity of 90 L/min each were designed.
③ Deep bed filters of anthracite and sand, which were designed to remove suspended solids and particulate matter, color, and odors from rainwater. As mentioned in
Section 2.5, the buildings roofs, parking lots and esplanades of the campus were organized into five groups, based on the closeness among them and the configuration of the sewage and rainwater drains to ease the collection of rainwater and greywater.
Table 4 summarizes the characteristics of the deep bed filters required to treat the rainwater of each group.
④ The soil natural treatment system (SNTS) was designed based on the guidelines of López Zavala
et al. [
37] in order to remove the organic load, nitrogen, surfactants, solids, and pathogens from the greywater generated on campus. SNTS is an effective system to treat low-loaded greywater, such as the discharge from handwashing basins and showers. Removals on the order of 98% for COD, 95% for nitrogen, and 90% for surfactants have been reported by the authors of [
37,
38,
39]. SNTS consisted of a network to collect shower and handwashing basin greywater, a subsurface greywater distribution network, filtering media, impermeable geomembrane that confines the filtering media, inspection manhole, storage tank, and pumping system. Collection of greywater and its distribution in the filtering media were designed to be conducted by gravity.
Table 5 shows the characteristic of SNTS for each group of buildings.
⑤ Disinfection by chlorination was selected to eliminate pathogens (virus, bacteria, and protozoa) from rainwater and greywater. Sodium hypochlorite pentahydrate (NaOCl·5H2O) was selected as disinfectant with doses of 4.4 mg/L for rainwater and 5.7 mg/L for greywater, ensuring a free residual chlorine concentration of 1.5 mg/L. A dosing pump (Chem-Tech 120 GPD 80 psi, AquaQuality, Acapulco, Mexico) was selected to conduct the application of disinfectant. ⑥ Represents the storage tanks for rainwater and greywater, after disinfection.
3.5. Sizing of Water Storage Tanks
Summary of water inputs and outputs, maximum water savings, and coverage of water demands in building services and green area irrigation are presented in
Table 6. As can be seen, the water savings are different for each group of buildings. Rainwater and greywater contributions, and water demands affect the magnitude of the savings.
The dimensions of the storage tanks resulting from the daily water balances, conducted as described in
Section 2.5, are presented in
Table 7. The inputs of the balance were the rainwater and greywater contributions, and the outputs were the potable water consumptions in buildings services and green area irrigation. To minimize the costs, the storage tanks were conceived as lining water reservoirs made of 1-mm-thickness polyvinyl chloride (PVC) geomembranes, and covered by concrete slabs. The cross section of the reservoirs was trapezoidal, with 1:1 sloped embankments.
The dimensions of the tanks seem to be very large, which could considerably increase the investment costs. Several researchers have tried, through the application of different methods, to reduce the dimensions of the tanks and increase their reliability [
13,
14,
15]. Therefore, in addition to the method used in this study, others methods for sizing the water storage tanks could be evaluated in future studies with the aim of reducing the dimensions of the tanks without sacrificing reliability. If achieved, this will contribute to having schemes that are more feasible and economically viable.
On the other hand, the water distribution network and the pumping system required to distribute the rainwater and greywater, after treatment, into the different buildings and facilities were designed and selected, respectively. Conventional hydraulic procedures and the International Plumbing Code [
33] were applied to design the water distribution network. Pumps were selected based on the flowrate, hydraulic loads, and power required. Details of such designs are not presented in this paper because it was not within the scope; however, their results were used to estimate the investment and operation costs.
3.6. Economic Assessment
3.6.1. Determination of the Investment and Operation Costs of the Selected Treatment Systems
Based on the results of
Section 3.4 and
Section 3.5, the investment needed to implement the treatment systems for rainwater and greywater were estimated. Additionally, operation and maintenance costs linked to the systems were calculated.
Table 8 summarizes the investment associated with the implementation of the systems. The investment linked to the grease and oil traps was determined based on the prices provided by Helvex (Mexico D.F., Mexico) for the systems designed. The investment of the soil natural treatment system (SNTS) included the costs associated with soil excavation, placement of the polyvinyl chloride (PVC) geomembrane, greywater distribution network, and the manhole. Costs were calculated based on the unit prices included in the cost catalog of the Mexican Chamber of Construction Industry. The costs of the deep bed filters (DBF) were calculated based on the prices provided by a local company (Albercas y Equipos de Monterrey, Monterrey, Mexico) for the filters described in
Table 4. The cost of chlorine dosifiers were determined based on the prices provided by AquaQuality (Acapulco, Mexico) for the dosing pump selected in
Section 3.4. The investment associated with the WSTs included the costs linked to the following concepts: Soil excavation, construction of embankments, placement of the PVC geomembrane, concrete structures (slabs and columns), and others. Such costs were calculated based on the unit prices included in the cost catalog of the Mexican Chamber of Construction Industry. The pumping systems cost was determined based on the prices provided by a local company (Hidroservicios Ambientales-Sistemas de Bombeo, Monterrey, Mexico). The costs of the water distribution system (WDS) included concepts such as excavation, pipes and accessories, and modifications in buildings. The costs were calculated based on the unit prices included in the cost catalog of the Mexican Chamber of Construction Industry. As can be seen, the total investment required was approximately US $363,281.76. The most costly component was the water storage tanks at 67% of the total investment; meanwhile, the water distribution network represented 14% and the deep bed filters 11%. These results are in agreement with those reported by the literature in the sense that the storage tank cost represents 50% to 70% of the total cost of the rainwater-harvesting systems [
40]. Several studies have been conducted with the aim of reducing the dimensions of the water storage tanks and enhancing their reliability in order to reduce their contributions to the total investment costs of the systems [
13,
14,
15,
32]. Despite these efforts, sometimes, the tanks dimensions seem to be excessive and make stakeholders and authorities less eager to implement them.
Annual operation and maintenance costs of the systems were estimated in US $15,036.36. These costs included those associated with chlorination, pumping, backwash of filters, and maintenance of the systems. Chlorination, backwash of filters and maintenance costs of equipment were estimated based on the information provided by the technology providers. The pumping costs were estimated based on the power of pumps, time of operation, and the regional electricity tariffs. Other maintenance costs were determined based on the unit prices included in the cost catalog of the Mexican Chamber of Construction Industry.
3.6.2. Determination of Benefits
The benefits derived from the implementation of the systems for rainwater harvesting and greywater treatment and reuse were estimated based on the economic savings associated with the reduction of potable water consumption and the decrease of the volume of wastewater to be treated (
Table 9). The costs of potable water and wastewater treatment considered in the calculations were US $0.625/m
3 and US $0.40/m
3, respectively. As can be seen, 48% of potable water consumption can be reduced by using treated rainwater and greywater, with a consequent saving of approximately US $53,028.5/year. The water savings determined in this study are greater than those reported in the literature for individual houses (36%) and multi-story residential buildings (42%) [
22,
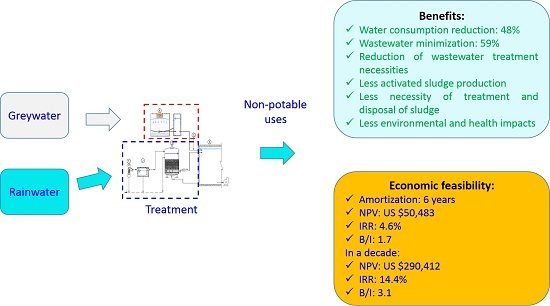
23]. It seems that the greater the number of water users, the greater the water savings that can be achieved. Furthermore, 59% of the treated wastewater volume can be reduced by collecting the greywater, which will imply a savings of US $20,967.7/year. Thus, a total saving of US $73,996.3/year can be achieved by integrating rainwater harvesting and greywater treatment and reuse on Monterrey Campus. It is important to mention that only 84% of the collected wastewater is treated by the treatment plant of the campus; the other 16% is disposed of in the public sewage system because of the topographical constraints of the collecting system.
3.6.3. Cash Flows and Metrics
Cash flow, prepared based on
Table 8 and
Table 9, is presented in
Table 10. The metrics used to conduct the economic assessments were the NPV, IRR, and B/I. The NPV and IRR were calculated using Equations (5) and (6). The minimum acceptable rate of return (MARR) used in this evaluation was 6%, calculated using Equation (4), and for inflation rate and risk an amount of 3% was set, based on the information provided by the Bank of Mexico [
34,
35]. As can be seen, the amortization of the investments will occur in six years, where the NPV will be on the order of US $50,483.2, the IRR of 4.6%, and the B/I of 1.7. From the seventh year, the project will present an IRR greater than the MARR. In a decade, the IRR, NPV and the B/I will be 14.4%, more than twice the MARR, US $290, 412.1 and 3.1, respectively, denoting economic feasibility. The amortization period obtained in this study is shorter than those reported in the literature for schemes incorporating rainwater and greywater reuse for individual houses (above 17 years) [
22] and multi-story residential buildings (eight years) [
23]. It seems that the greater the number of water users, the greater the economic viability and the shorter the amortization period. Based on these results, it is clear that the integration of rainwater harvesting and greywater reuse, resulted in a scheme that was more feasible and reliable than strategies based only in rainwater harvesting or greywater reuse. Furthermore, incorporating the benefits associated with wastewater minimization, normally ignored, such schemes become more economically viable and the investments can be amortized in a shorter period of time.
It is important to mention that future changes in occupancy rates, user behavior, and technological efficiency will modify, not only the potable water demand, but also the greywater generation, and, consequently, the reductions on water consumption and volumes of wastewater to be treated. Application of dual approaches, such as technological efficiency measures (via adopting water-saving accessories) and user behavior (how users interact with and use the technologies) in residential and office buildings, allowed water demand reductions of 80% [
41]. Thus, these strategies, combined with those applied in this study, could considerably increase the water savings and the economic viability of the approaches; however, their feasibility, reliability, and economic viability should be evaluated in future studies.
4. Conclusions
Integration of rainwater harvesting and greywater treatment and reuse is presented in this study as a potential alternative to reduce, not only potable water consumption, but also to minimize wastewater generation at the Tecnológico de Monterrey, Monterrey Campus. In cities like Monterrey, located in semiarid regions, rainwater harvesting alone is not enough to meet the water supply demand, due to the low rate and great variability of precipitation; however, by integrating such technique with greywater treatment and reuse, almost half of the potable water demand can be met. Greywater contribution as a water source can be 1.8-times greater than that of rainwater. Furthermore, greywater reuse can potentially reduce more than half of the wastewater volume, which consequently reduces the necessity of treatment. Furthermore, additional benefits, such as less activated sludge production, less necessity of treatment and disposal, and less environmental and health impacts, associated with its management and disposal, are expected. However, to use rainwater and greywater as a water source for non-potable uses, they must be conditioned or treated to meet the quality criteria set by local standards and regulations. Appropriate technological alternatives must be selected based on the final use of the treated water, efficiency of removing contaminants, cost effectiveness, and applicability in onsite/decentralized systems.
Integrating rainwater harvesting with greywater treatment and reuse will contribute, not only in reducing potable water consumption and decreasing the necessities of treatment of wastewater, but will also contribute to achieving important economic savings for water users and water and wastewater system operators; denoting that integrating rainwater harvesting and greywater reuse becomes a more feasible and reliable strategy than strategies based only in rainwater harvesting. Furthermore, incorporating the benefits associated with wastewater minimization, normally ignored, such schemes become more economically viable and the investments can be amortized in a shorter period of time.
Costs associated with the water storage tanks represent more than half of the total investment cost of the schemes for implementing rainwater harvesting and greywater reuse systems. Therefore, in addition to the method used in this study, others methods for sizing the water storage tanks should be evaluated in future studies expecting to reduce dimensions without sacrificing reliability. If achieved, this will contribute to having schemes that are more feasible and economically viable. Nonetheless, the results obtained in this study show that, despite the high costs of water storage tanks, the approach is feasible, reliable, and economically viable when, in addition to the water savings, wastewater minimization benefits are considered.
Futures studies should also consider factors in addition to the schemes of rainwater and greywater reuse, the application of approaches, such as technological efficiency measures and user behavior, to further increase water savings, minimize wastewater generation, and enhance the economic viability of the approaches. Furthermore, these schemes must be promoted and fostered among stakeholders and authorities to incentivize their implementation.


