Article

A New Practical Method to Simulate Flood-Induced Bridge Pier Scour—A Case Study of Mingchu Bridge Piers on the Cho-Shui River

1
Hydrotech Division, Taiwan Typhoon and Flood Research Institute, National Applied Research Laboratories, 11 F., No. 97, Sec. 1, Roosevelt Rd., Taipei City 10093, Taiwan
2
School of Civil and Environmental Engineering, Nanyang Technological University, Singapore 639798, Singapore
*
Author to whom correspondence should be addressed.
Water 2016, 8(6), 238; https://doi.org/10.3390/w8060238
Submission received: 13 April 2016 / Revised: 20 May 2016 / Accepted: 30 May 2016 / Published: 3 June 2016

Abstract

:
The evolution of bridge pier scour is very important for bridge safety warning and assessment. During typhoon seasons in Taiwan, the torrential river flow often causes scour monitoring instruments to fail in their attempt to measure the temporal variations of pier scour depths. To better understand the scouring phenomenon during a large flood event, this study proposes a fast and reliable method for bridge pier scour simulation. The proposed method consists of two main components: (1) a robust finite-volume hydraulic model that simulates the flow depth and velocities; and (2) two scour depth computation algorithms that predict the temporal development of the general and local scour depths. The greatest advantage of this method is that it is very straight-forward and reliable, giving bridge managers sufficient time to make an informed decision for bridge safety warning. Only a few hydraulic flow conditions near the bridge are necessary to simulate the scour depth evolution. Moreover, the method can be applied for both general and local scour simulations. To demonstrate the accuracy of the proposed method, field data collected using the “numbered-brick” method were performed at the Mingchu Bridge, which is located along an incised channel reach of the Cho-Shui River in Taiwan. The simulated water levels and total scour depths are in good agreements with the field data. Finally, to help bridge authorities responsible for making a decision towards bridge scour warning, a bridge safety curve (scoured bed level-discharge relationship) is proposed. Based on the results of two flood events, the study shows that the proposed method can quickly and accurately simulate the bridge pier scour.

1. Introduction

Bed scour at bridge foundations induced by floods is the leading cause of bridge failures. In the USA, Shirhole and Holt [1] reported that approximately 60% of bridge failures were hydraulics-related. In Taiwan, two major bridge failures occurred in 2000 and 2008. The Kaoping Bridge failed at approximately 3 P.M. on 27 August 2000, several days after the flood induced by Typhoon Bilis had receded. In that event, 16 vehicles fell into the Kaoping River, causing injury to 30 people. In 2008, the failure of the Houfeng Bridge caused three vehicles to fall into the Da-Chia River, resulting in the death of six persons [2]. The bridge collapsed during the peak flow induced by Typhoon Sinlaku (i.e., at approximately 7 P.M. on 15 September 2008). Such disasters may be prevented if scour-critical bridges that have insufficient capacity to withstand the designed flood were identified and appropriate remedial work carried out. In the event that remedial works are delayed, a bridge safety warning system must at least be established so that vehicles can be prevented from crossing the bridge when the stability of the bridge is under threat during typhoon seasons.
The Central Mountains that run from the north to south of Taiwan divide the country into two parts, with most of the population living in the western part of the country. Rivers in the western part of Taiwan usually flow from east to west before entering the Taiwan Strait. Infrastructures such as major highways and railways normally are built in the north-south direction, and encroachment structures, such as bridges and levees, must inevitably be built near or across the waterways. During typhoon seasons, floods that accompany extreme rainfall events cause high flow discharge in rivers, often compromising the integrity of the foundations of these structures, subjecting them to serious scour problems and threatening failure.
In addition, dams and reservoirs are commonly used for storing fresh water used for municipal, irrigation and industry needs in Taiwan. However, serious bed degradation that often extends kilometers downstream of the dam has been reported, primarily due to the reduced sediment supply from upstream. This could seriously expose the foundations of cross-river bridges, resulting in failure. This study investigated the Mingchu Bridge, which is subjected to an incised river reach.
In recent decades, several approaches for investigating the dynamic processes of bridge scouring have been developed. These approaches are based on theoretical, experimental and numerical methods; with field measurements and numerical simulations being the most commonly used tools adopted in field river engineering analysis. Considering field measurements for pier scour, Lu et al. [3] had reviewed and compared the most commonly used instruments, including sonar; acoustic Doppler current profiler (ADCP); ground-penetrating radar (GPR); fiber bragg grating sensor (FBG); sliding magnetic collar (SMC); steel rod, and numbered bricks, for measuring pier scour at cross-river bridges. The theories, advantages, weaknesses and costs of each of these methods are briefly summarized in the following paragraph.

1.1. Field Instrument for Scour Depth Measurement

Sonar sensors are mounted in front of a bridge pier at an elevation that can be reached by the flow. This method, which has been widely used in the United States, is reported to provide high-quality data. However, the sound waves may be affected by the high concentration of sediment; rendering uncertainty in the accuracy of the data if the suspended sediment concentration is high, particularly in Typhoon-induced floods. The ADCP, which is used to measure the flow depth and three-dimensional (3D) velocity field, also can provide information on the scour depth. However, ADCPs face the same problem as sonar sensors do in that high sediment concentration affects the accuracy of the scour measurement. Based on the experience in Taiwanese rivers, Lu [4] reported that the penetration of sonar and ADCP is insufficient when sediment concentration exceeds 30,000 ppm, which is not uncommon in typhoon-induced floods. The main operation principle of GPR, which may be used for measuring riverbed profiles, is based on wave reflection from different materials to detect the interface of the materials. The U.S. Geological Survey had used GPR to measure the depth of a pier scour hole. However, the signal of the reflected waves is likewise sensitive to the high sediment concentration in a local scour hole. Consequently, only a limited number of studies on GPR have been conducted to measure pier-scour depth. The FBG sensor was developed for determining the temperature in different materials to identify their interface. However, since it is installed in front of a pier it may be damaged by floating debris and saltating stones/rocks if not properly protected. In addition to the weaknesses of all these methods stated above, the cost of the installation and operation of ADCPs, GPRs and FBGs for measuring pier-scour depth is relatively high. Comparatively lower-cost instruments, such as SMCs, steel rods and “numbered-brick” columns, could be used. Since the SMC and steel rod are installed and exposed in the upstream section of a pier, the risk of being damaged by floating debris is high.
Measuring the general scour depth by using sonar sensors, ADCP or GPR requires a different setup. For example, a boat or cable is required to carry these instruments to perform the measurements. Another option is to use the “numbered-brick” technique, which necessitates numbered bricks to be placed beneath the river bed by using excavators prior to the flood event. The location of the “numbered-brick” column can be accurately identified by using a total-station transit. After the flood has receded, excavators are again deployed to dredge the location of the preinstalled bricks to determine the number of bricks that had been washed away during the flood. To this end, one can then evaluate the maximum scour depth at the measuring location based on the remaining number of bricks. It is clear that this labor-intensive “numbered-brick” technique can be used to measure both general scour and pier scour successfully because it is not subjected to the weaknesses of the more sophisticated measuring instruments discussed earlier. Lu et al. [3] commended that before a robust scour-measurement instrument is developed, the “numbered-brick” approach may be considered even though it can provide only information related to the maximum scour depth.

1.2. Hydrodynamic and Sediment Transport Modeling

Regarding the hydrodynamic and sediment transport modeling, different numerical models with varying degrees of complexity and success on the scour processes have hitherto been attempted. One-dimensional (1D) numerical models are generally used to evaluate the degradation or aggradation of a river reach or estimation of scour pattern downstream of a rigid bed in a straight channel (see e.g., Dodaro et al. [5]). Two-dimensional (2D) numerical models could provide improved descriptions of the approach flow information in the vicinity of a bridge site. The 3D numerical models have been developed to facilitate analyses of the flow field around a local scour hole. Amongst these numerical models, the 1D models generally can provide a substantive prediction for long-term general scour. It is, however, unable to provide the detailed bed deformation around bridge foundations.
Recently, several studies have adopted 3D numerical models for simulating the flow field and bed deformation around a bridge pier [6,7,8]. Although these 3D numerical models claimed to have simulated the result well, they were only compared with laboratory and not field data. This is because 3D numerical models not only require accurate sediment supply rate at the upstream boundary but also pier-scour depth collected in the field for verification. This information is particularly difficult to obtain. Furthermore, only limited 3D models have thus far been developed for simulating the evolution of pier-scour depth under unsteady flows because it is a notoriously time-consuming exercise.
Since 1D numerical models cannot provide accurate flow conditions for individual pier foundations and 3D numerical models are time-consuming and requires much field data to prove their capability, an alternative method for estimating bed deformation associated with pier scour is the 2D numerical approach with empirical scour formulas [9]. This approach, however, is known to produce highly conservative results. Hence, a new method to determine bridge scour depth efficiently is still required.
This paper investigates flood-induced bridge pier scour by using the field data collected with the “numbered-brick” method for general and total scour depths under two flood events. Based on the measured field data, a dimensional analysis is conducted to propose a general-scour computation equation. In addition, a new method that incorporates the advantages of a comprehensive analysis of the general, local and total scour evolution is proposed. The method is efficient and requires only a small number of hydraulic parameters for simulating the detailed evolution of pier-scour depths. The primary assumption of this method is that the total scour at bridge pier (Ts) is simply an arithmetic summation of the general scour (Gs) and local scour (Ls). The former is estimated by using a proposed 2D finite-volume hydraulic model coupled with a general scour-computation equation. The latter is in the form of a simple local-scour computation algorithm. The accuracy of the proposed method is verified using the measured field data. The proposed method is then applied by simulating nine different return period discharges to investigate the relationship between the total scour depth and discharge at the bridge pier.

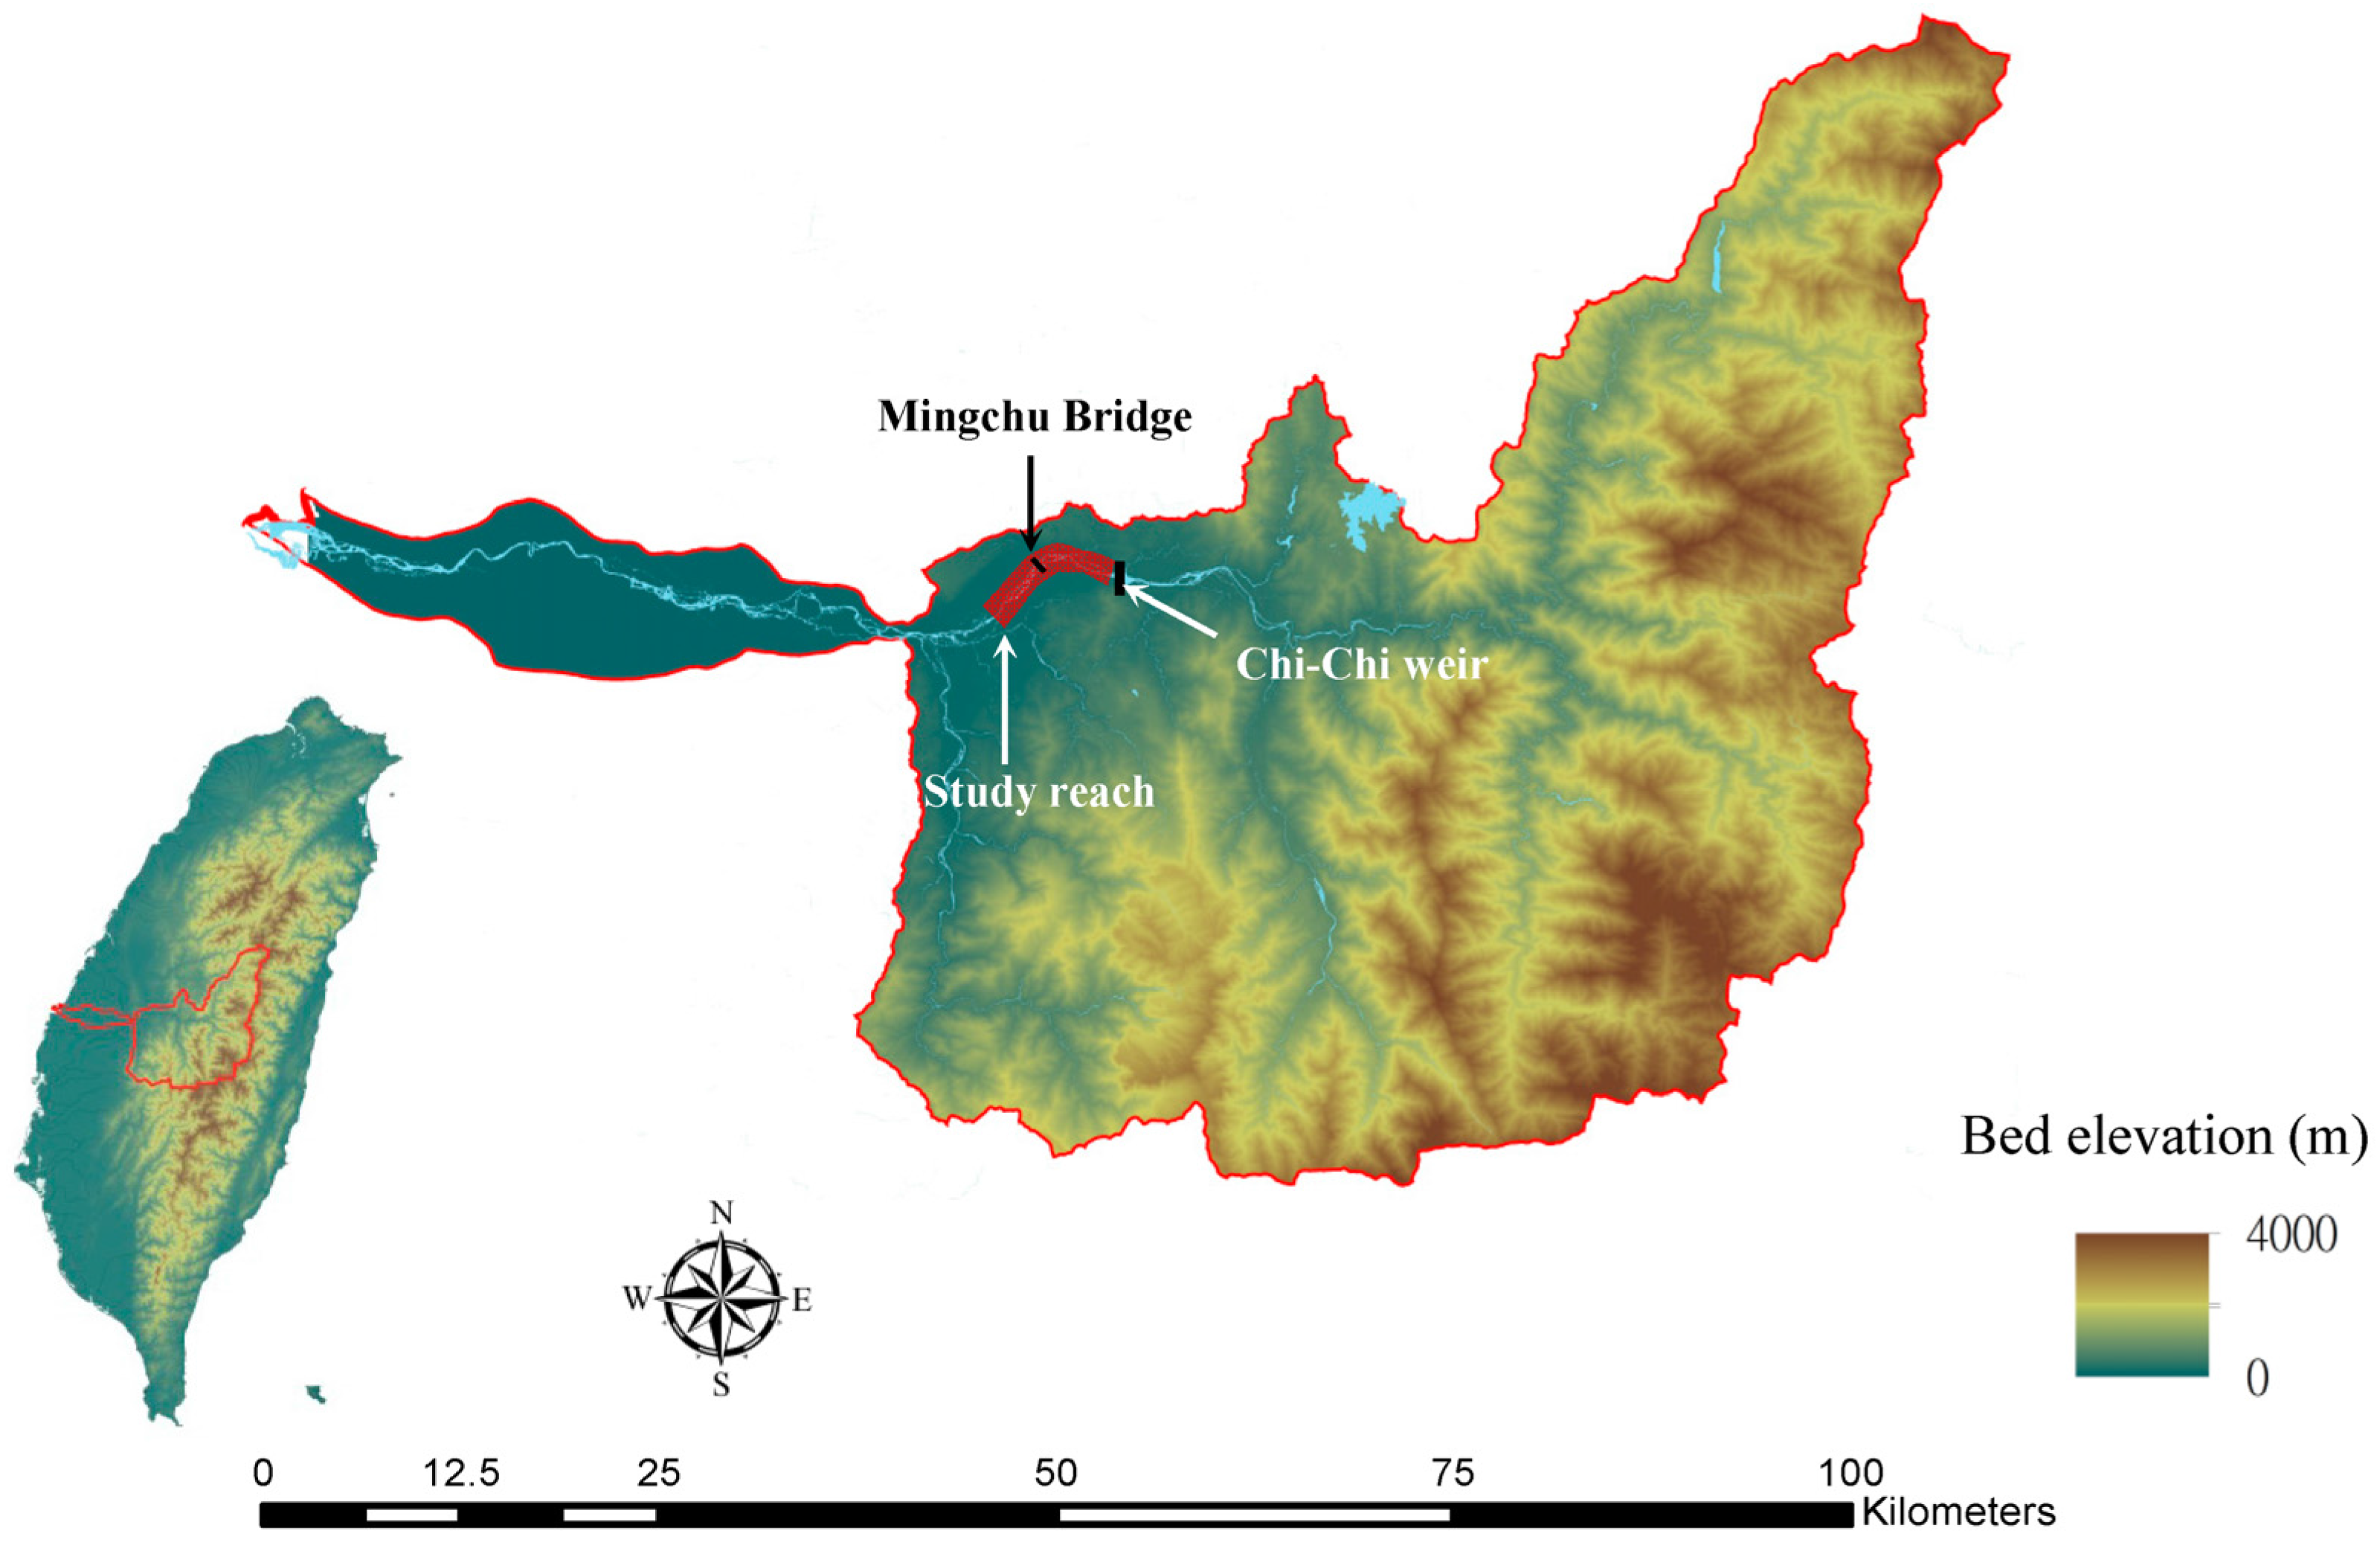
2. Field Measurements, Procedures and Results

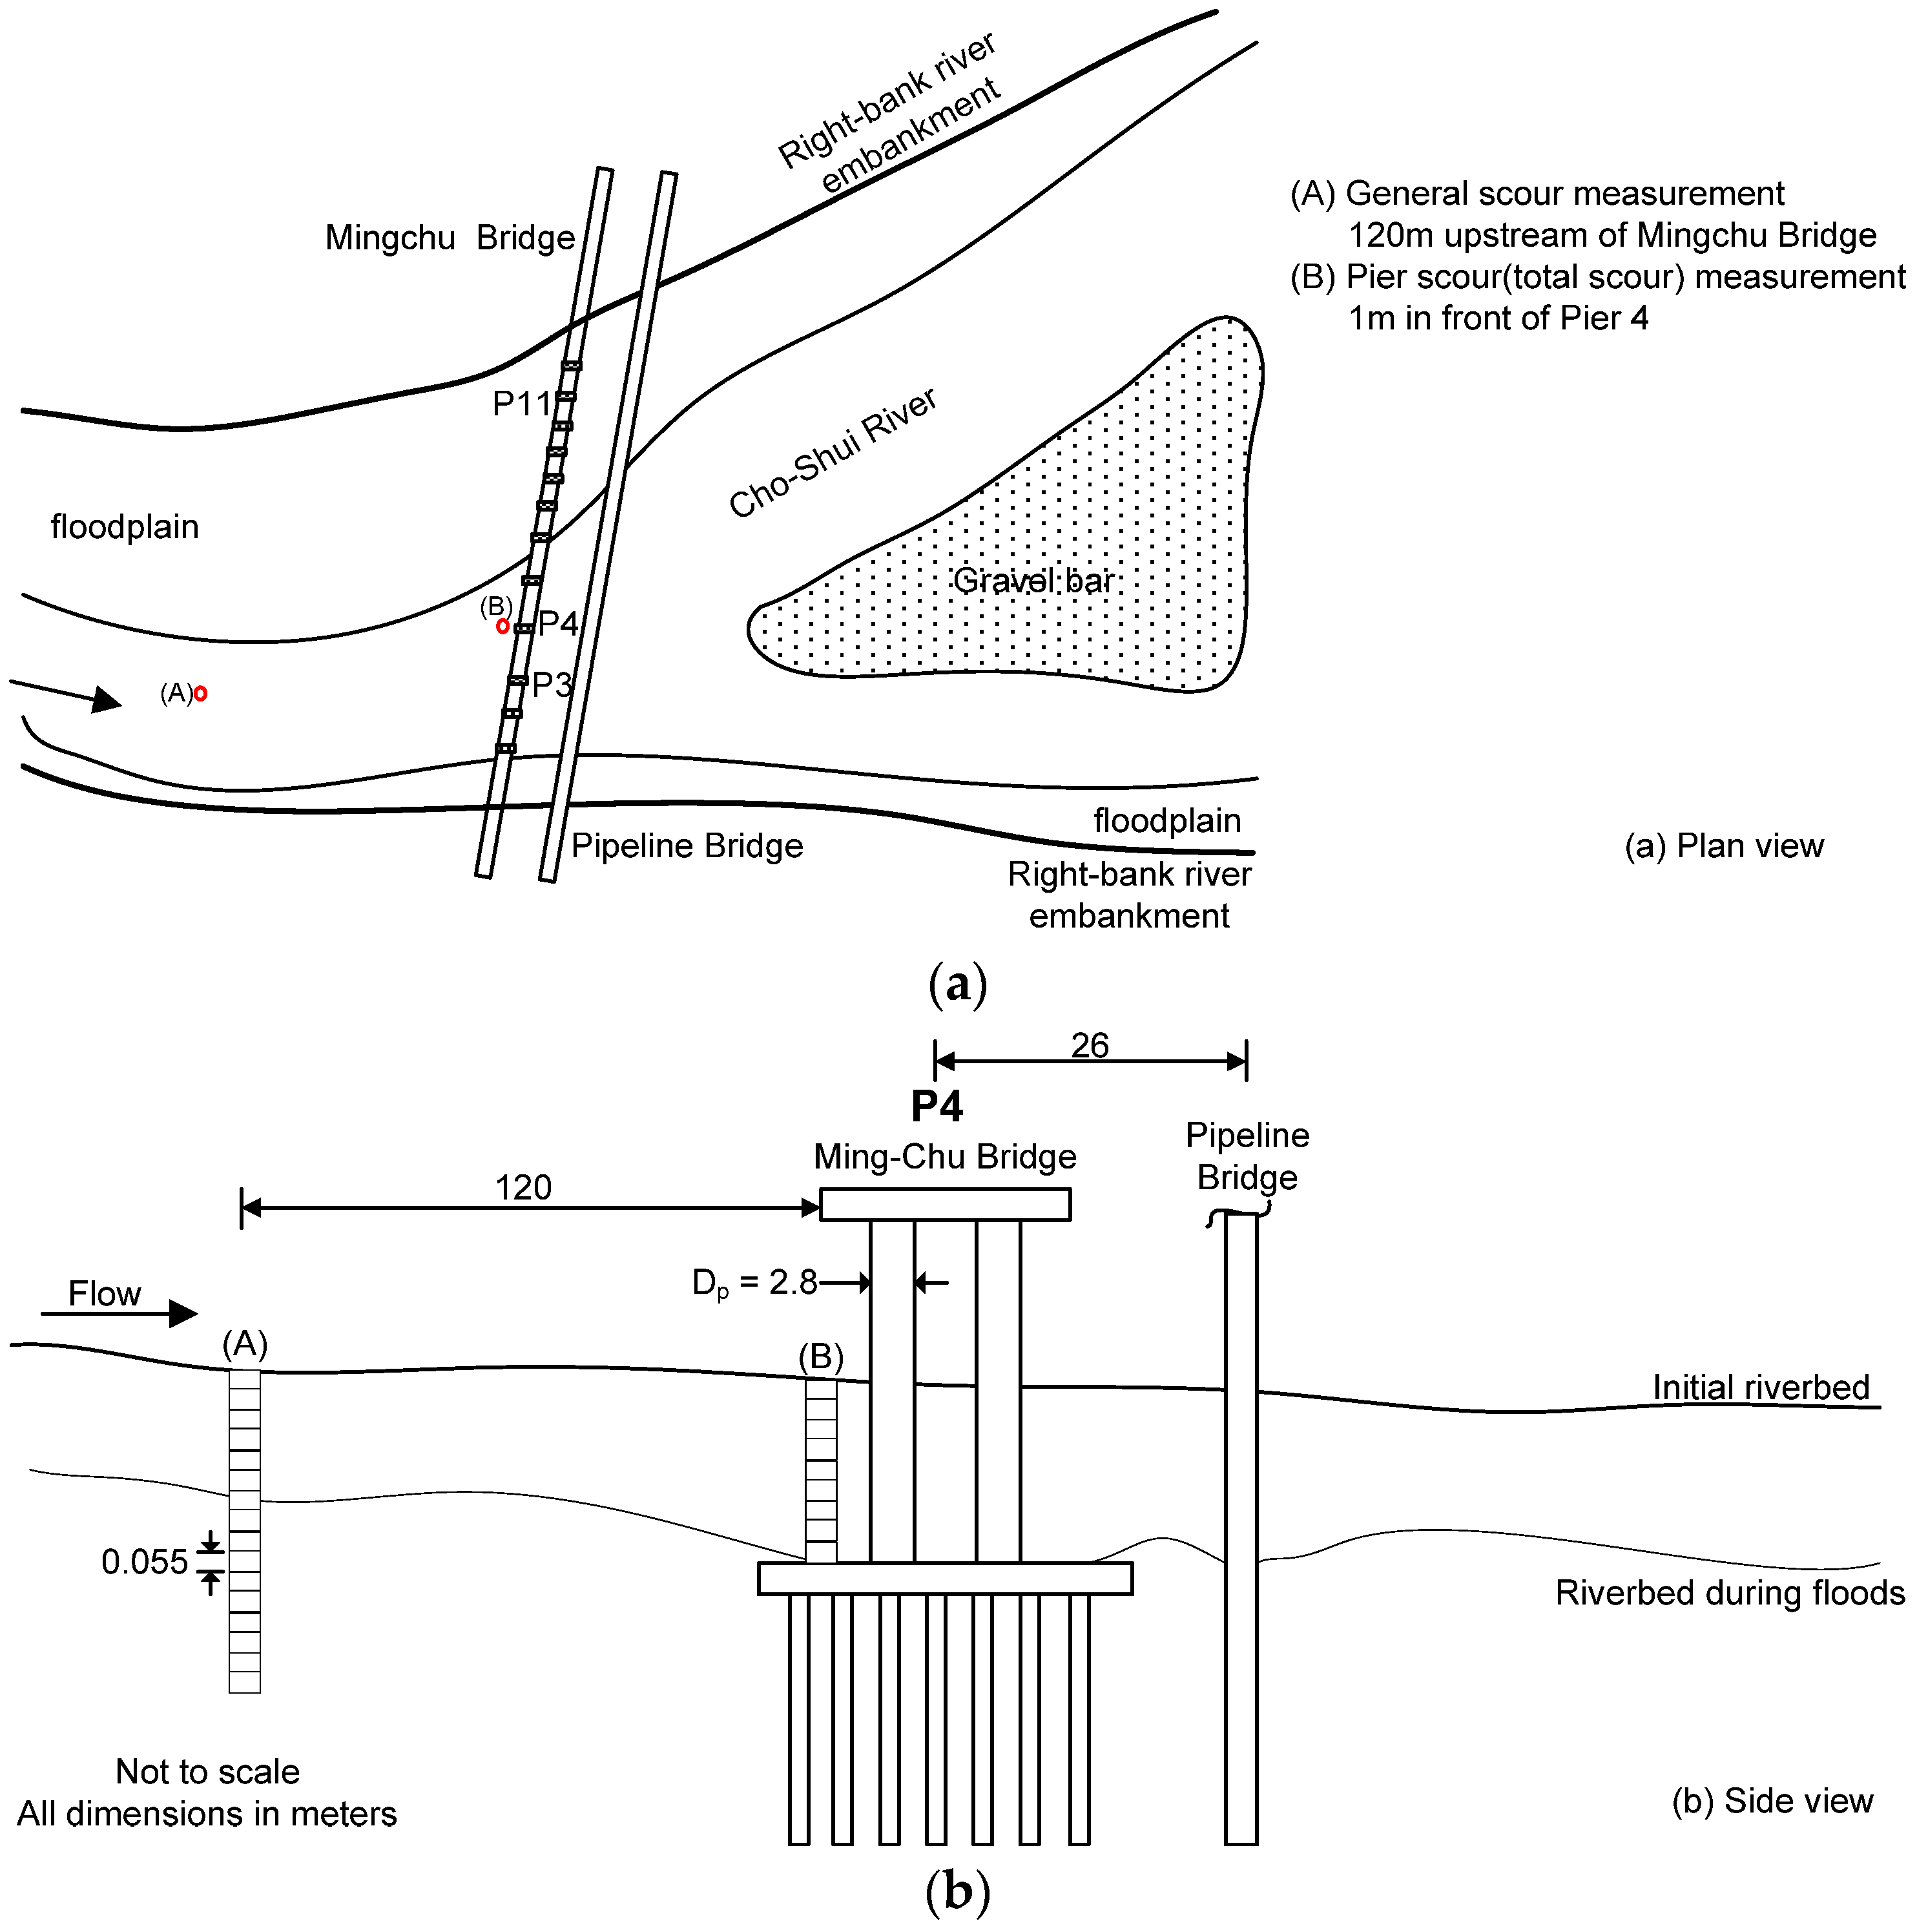
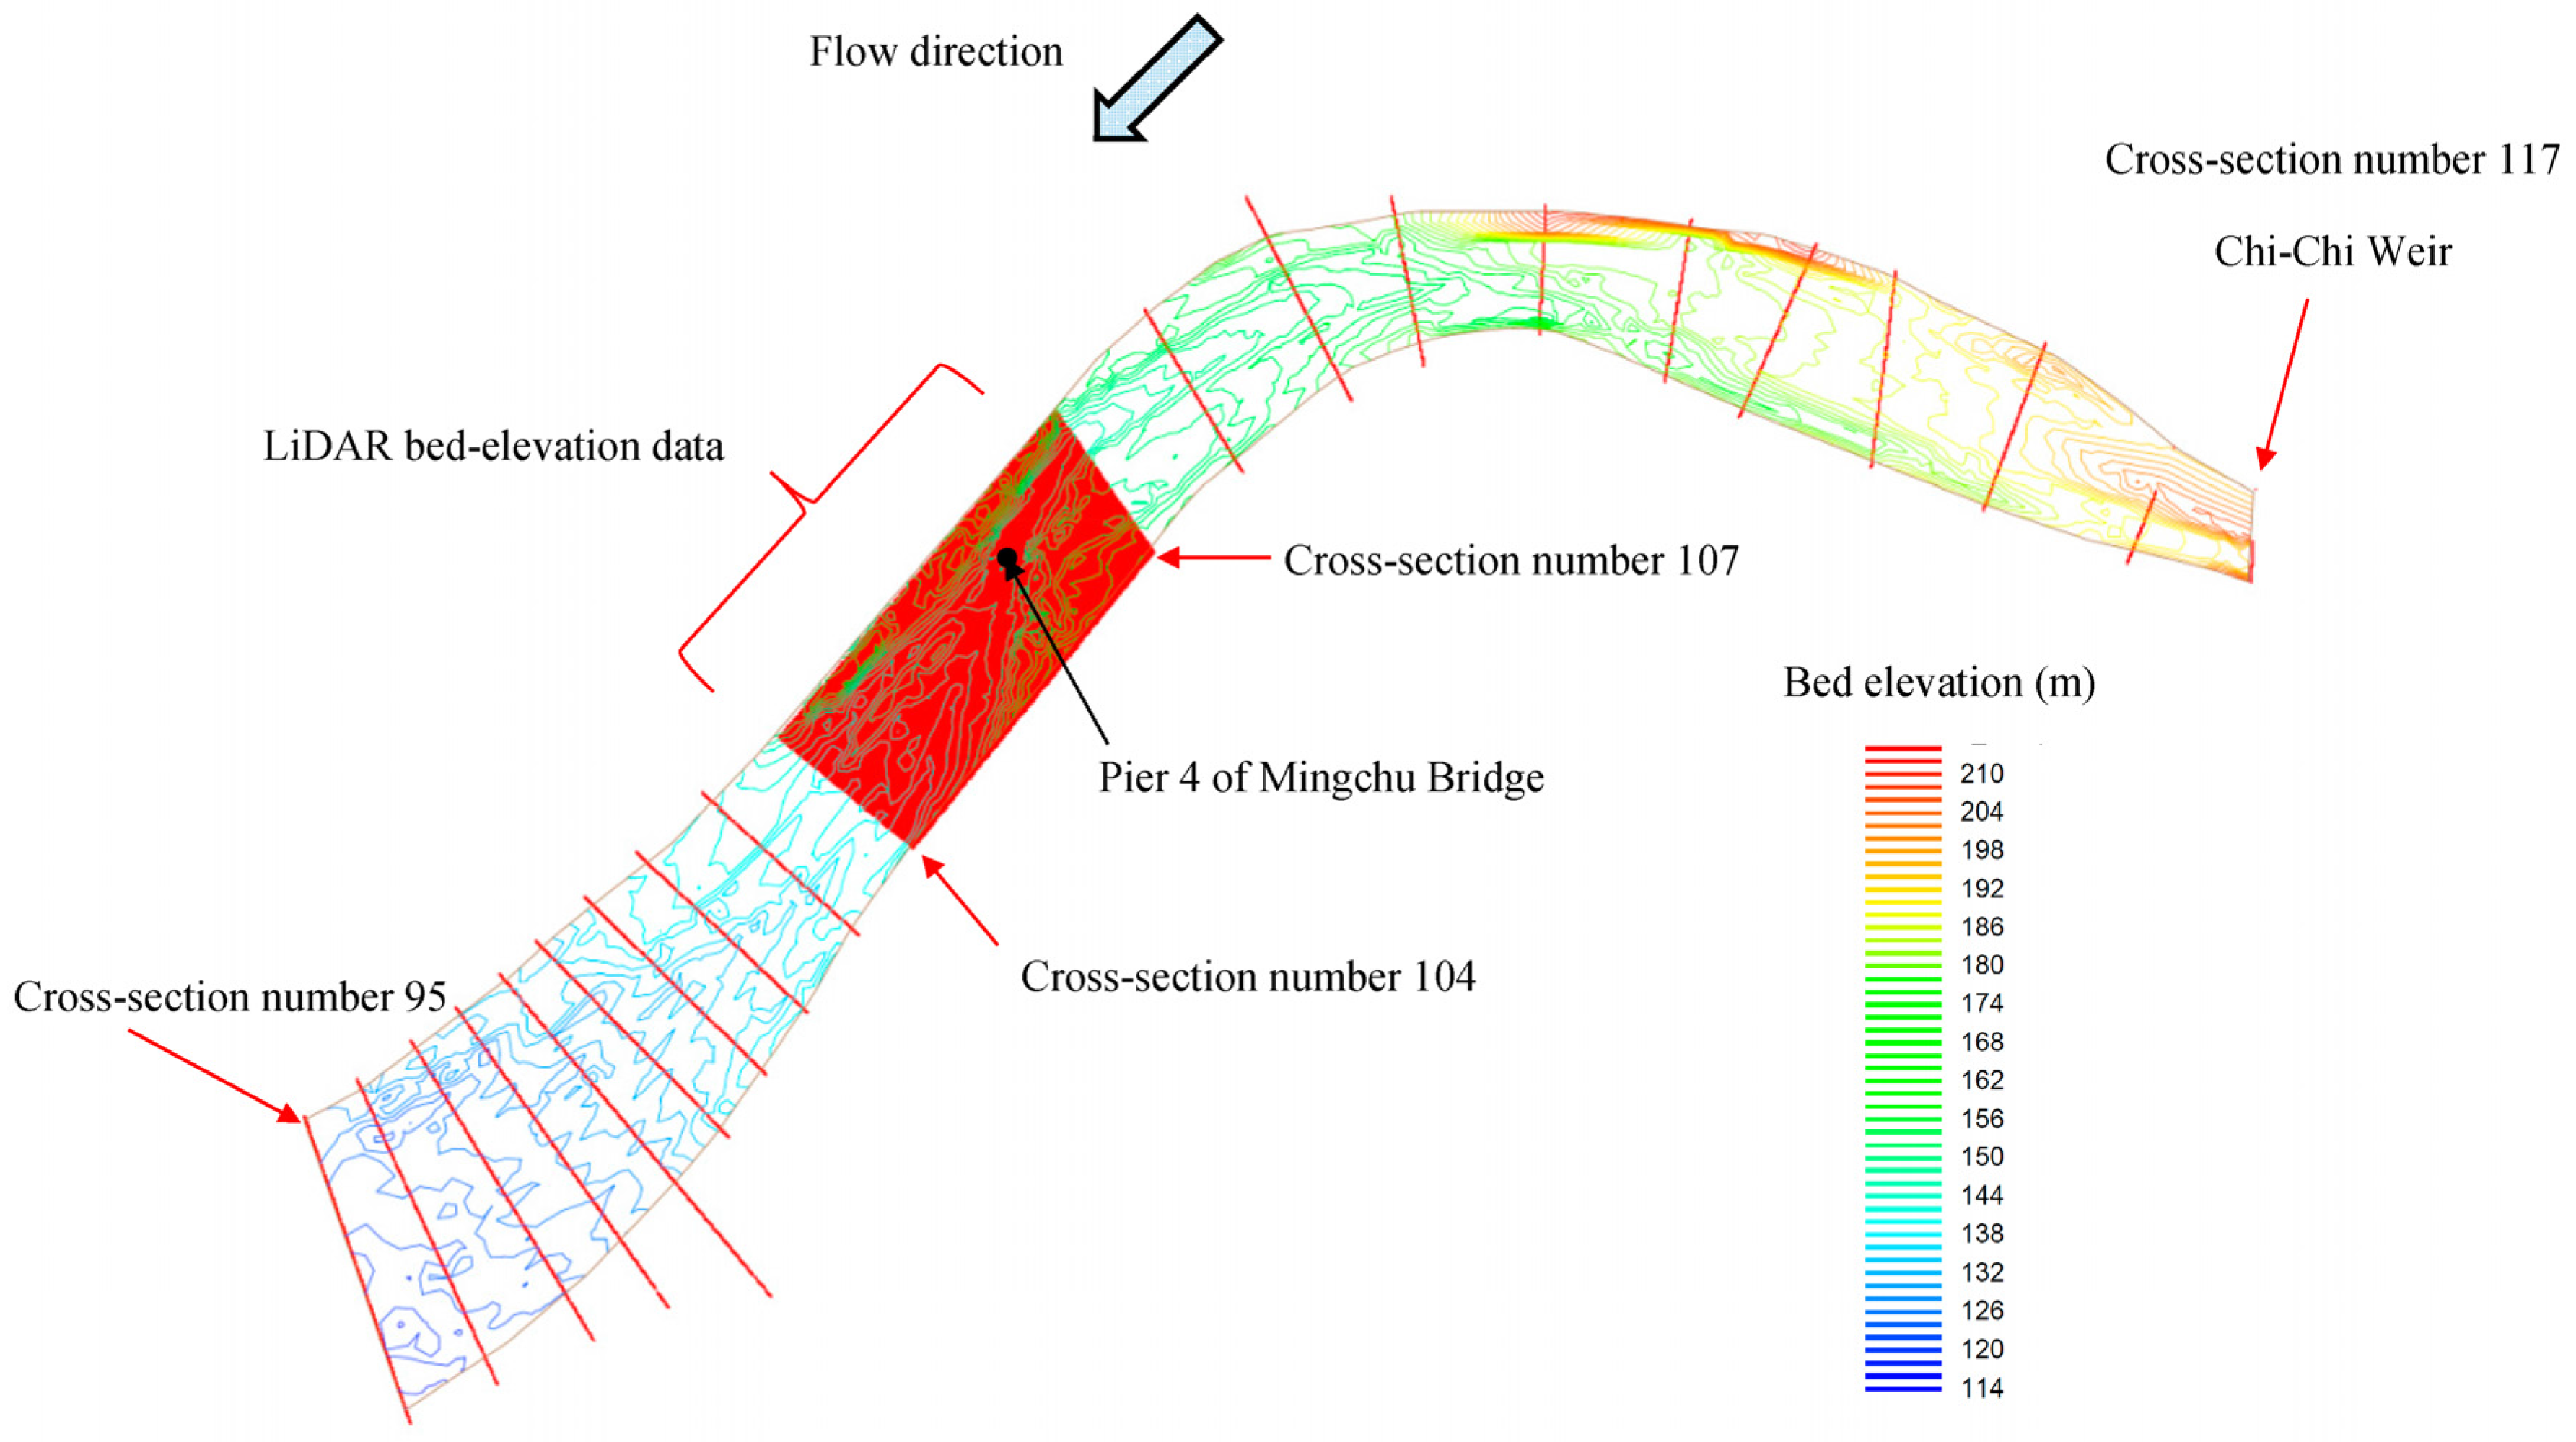
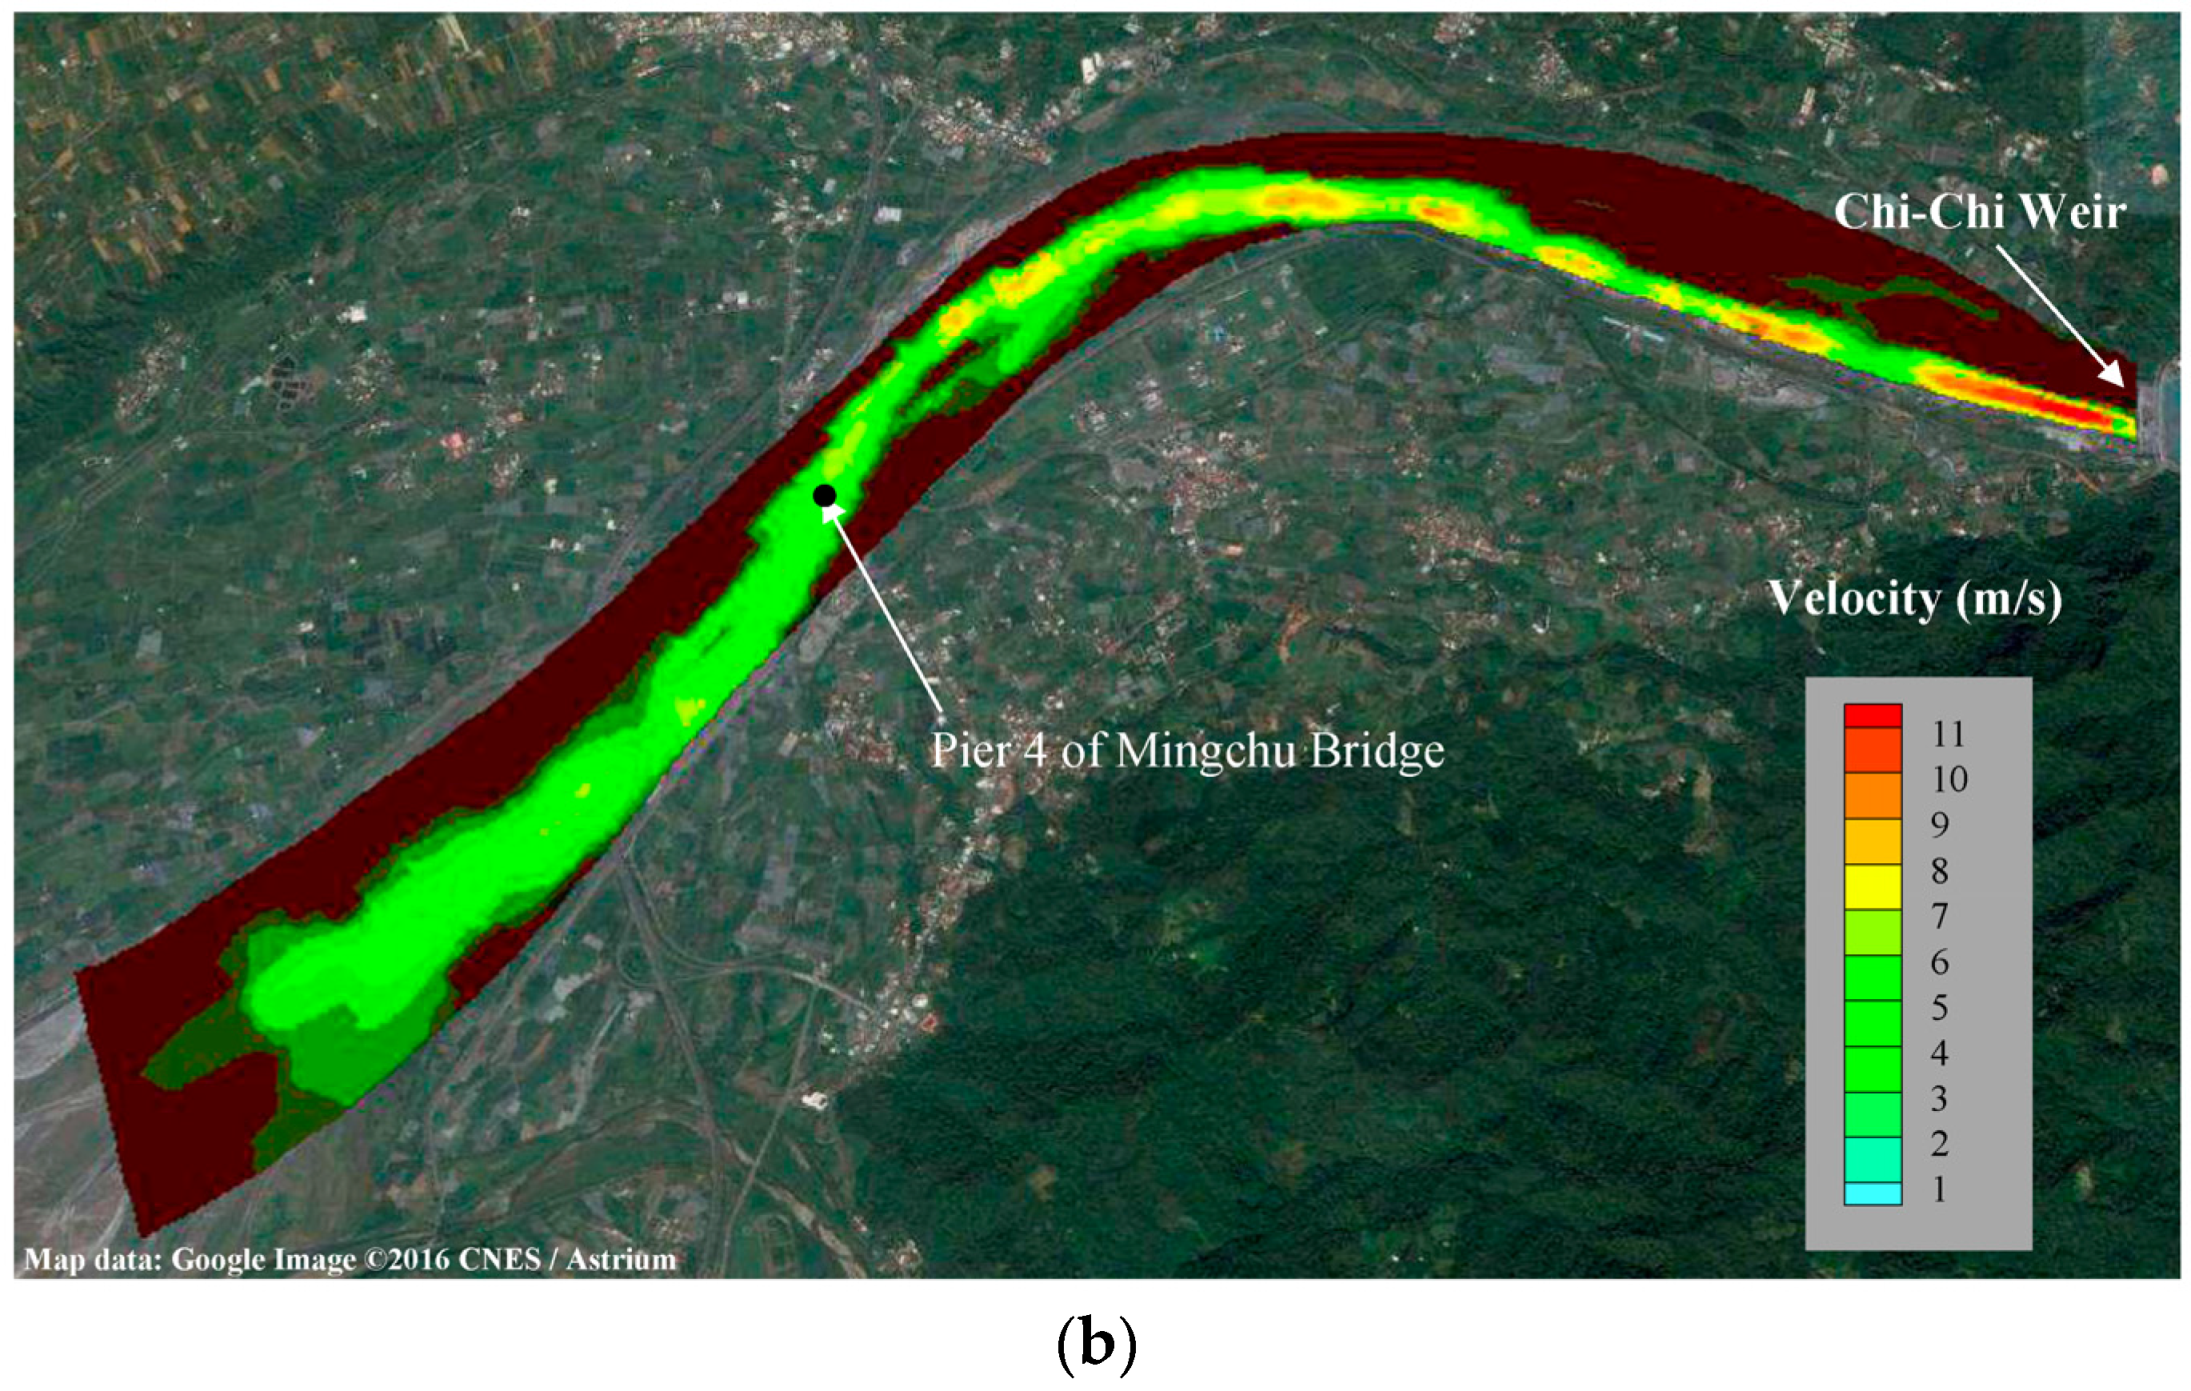
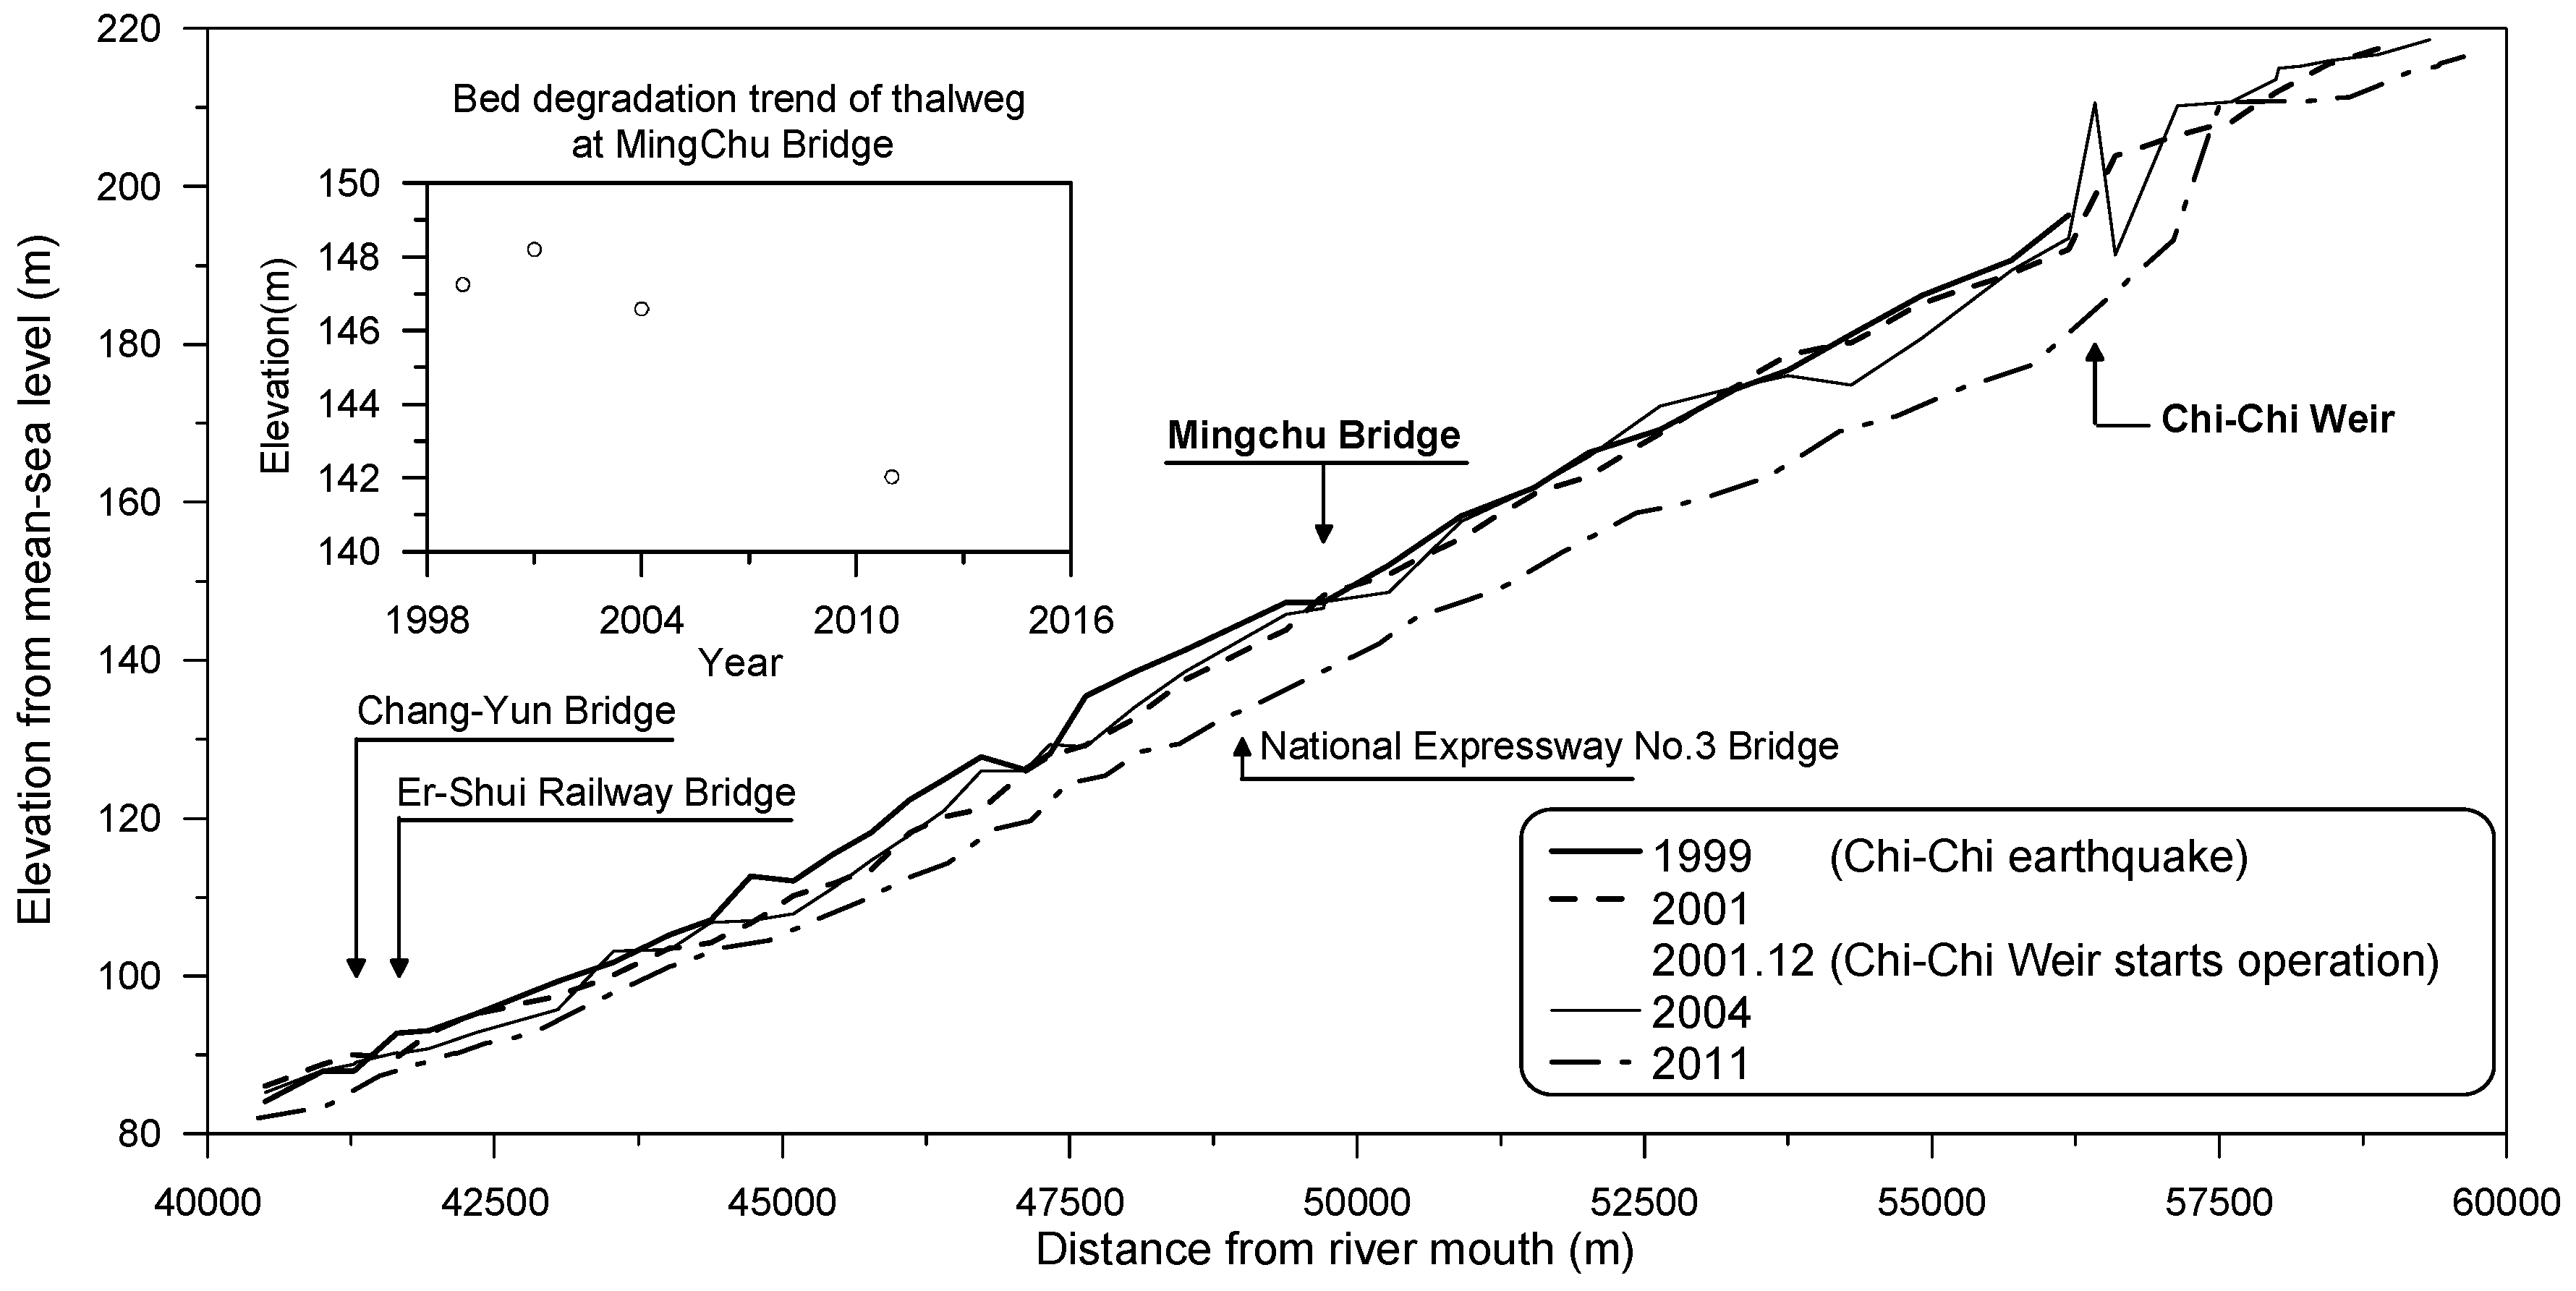
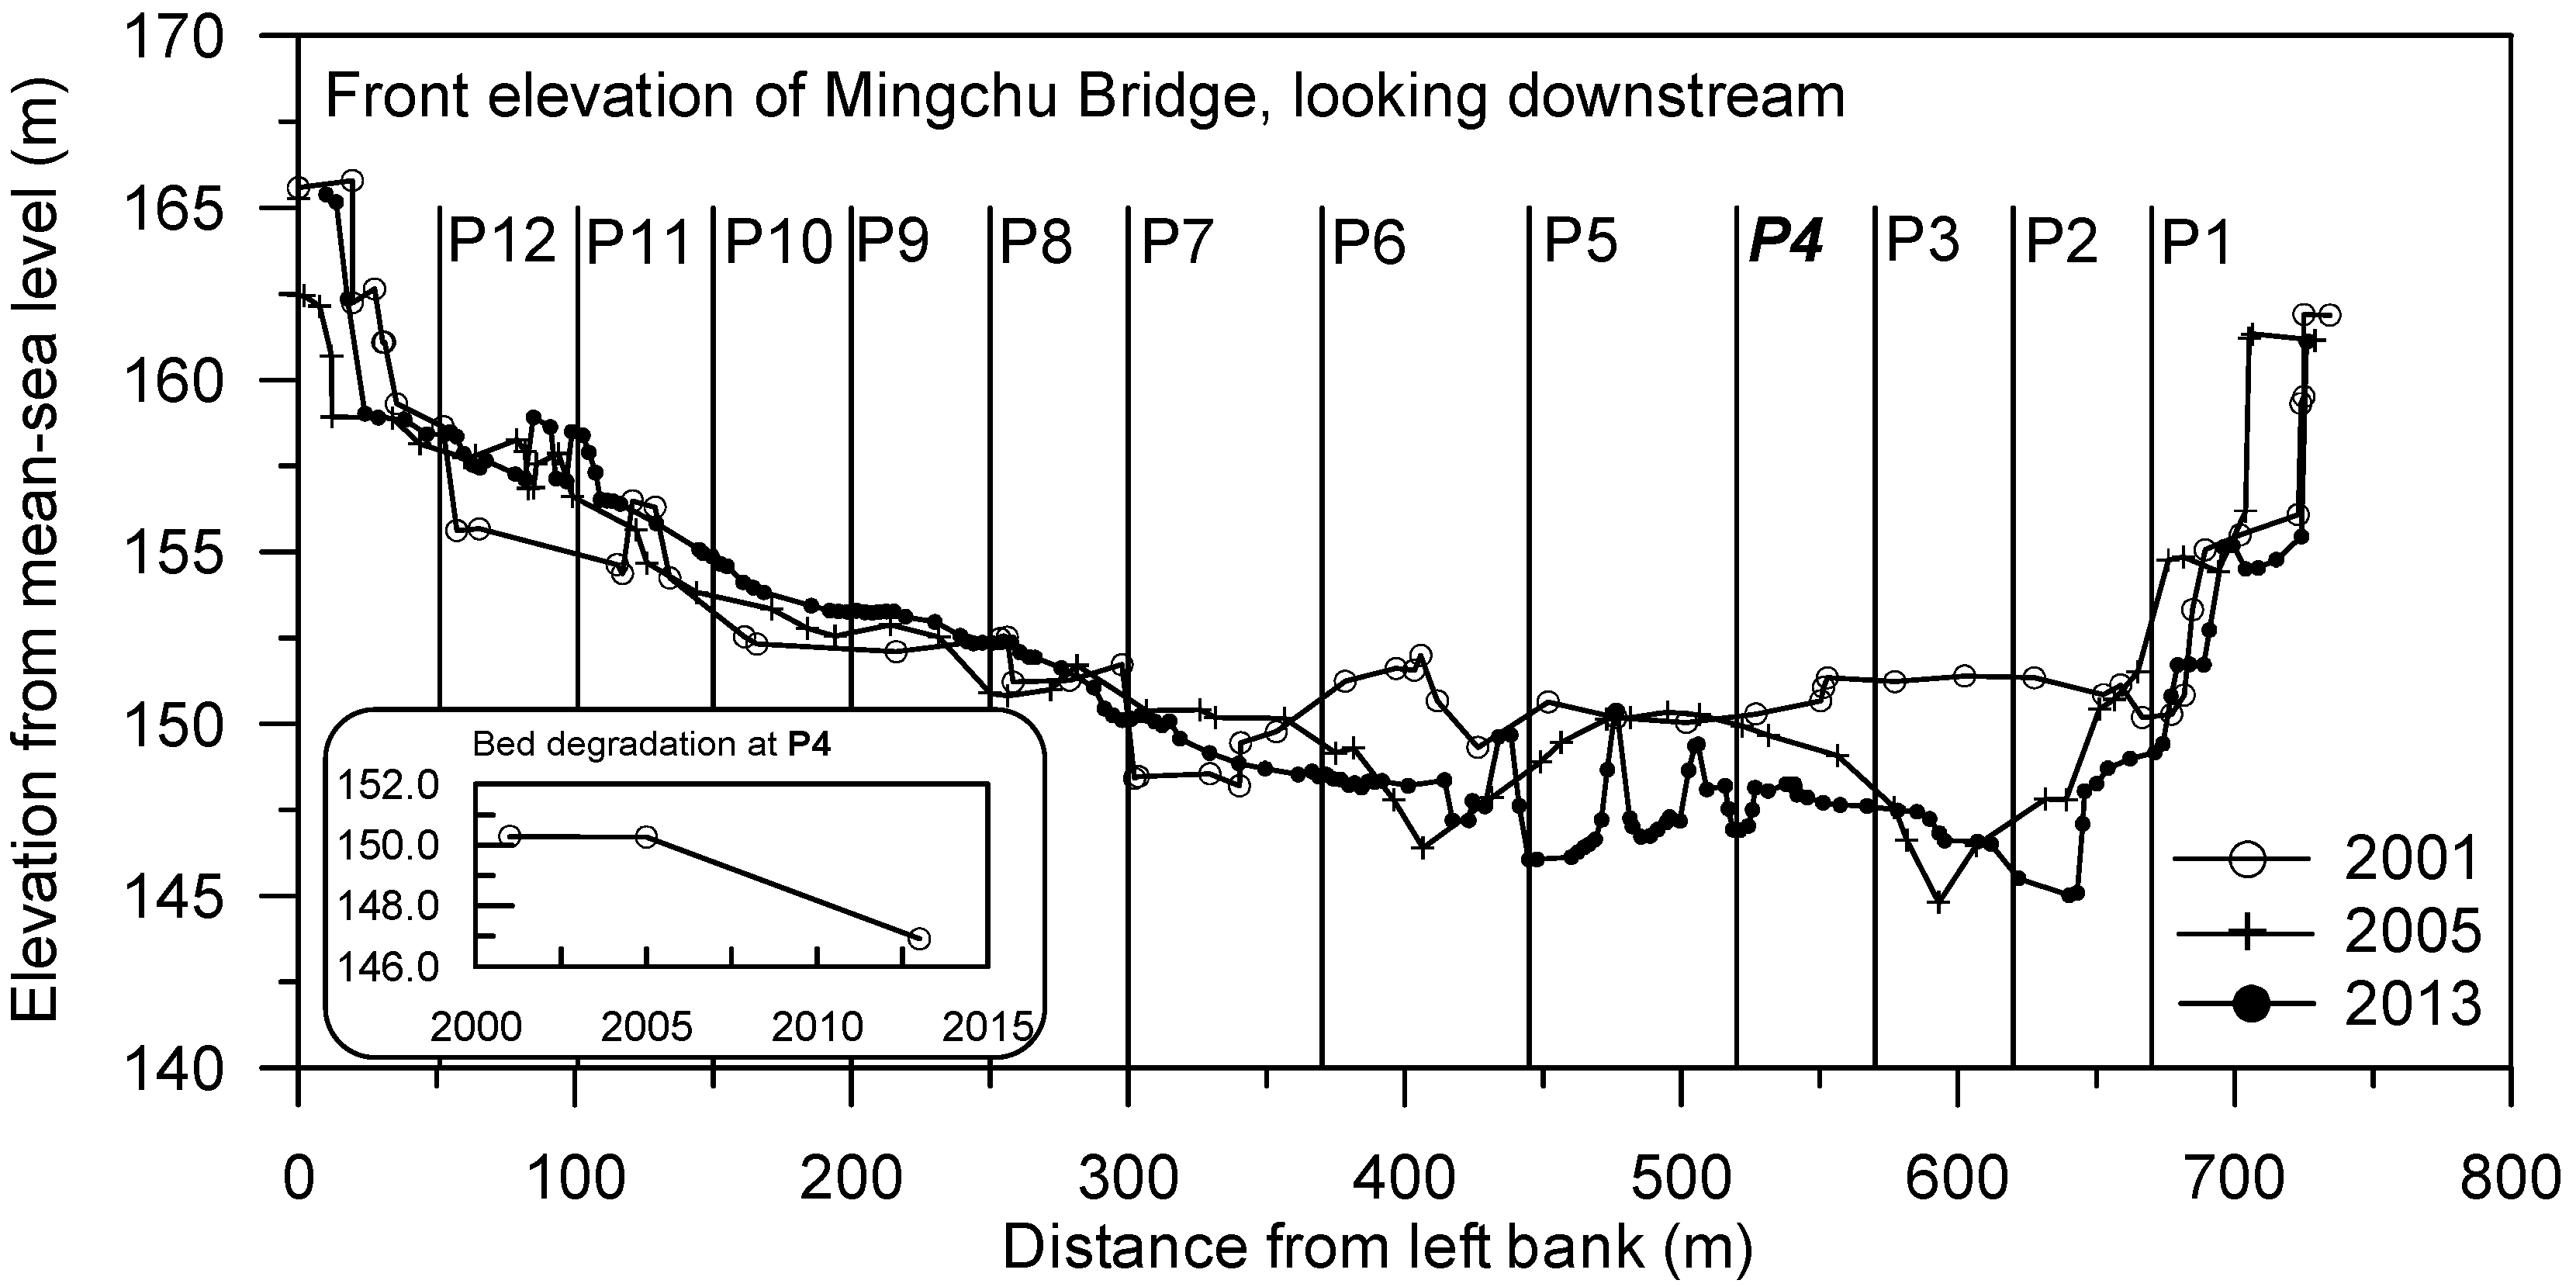
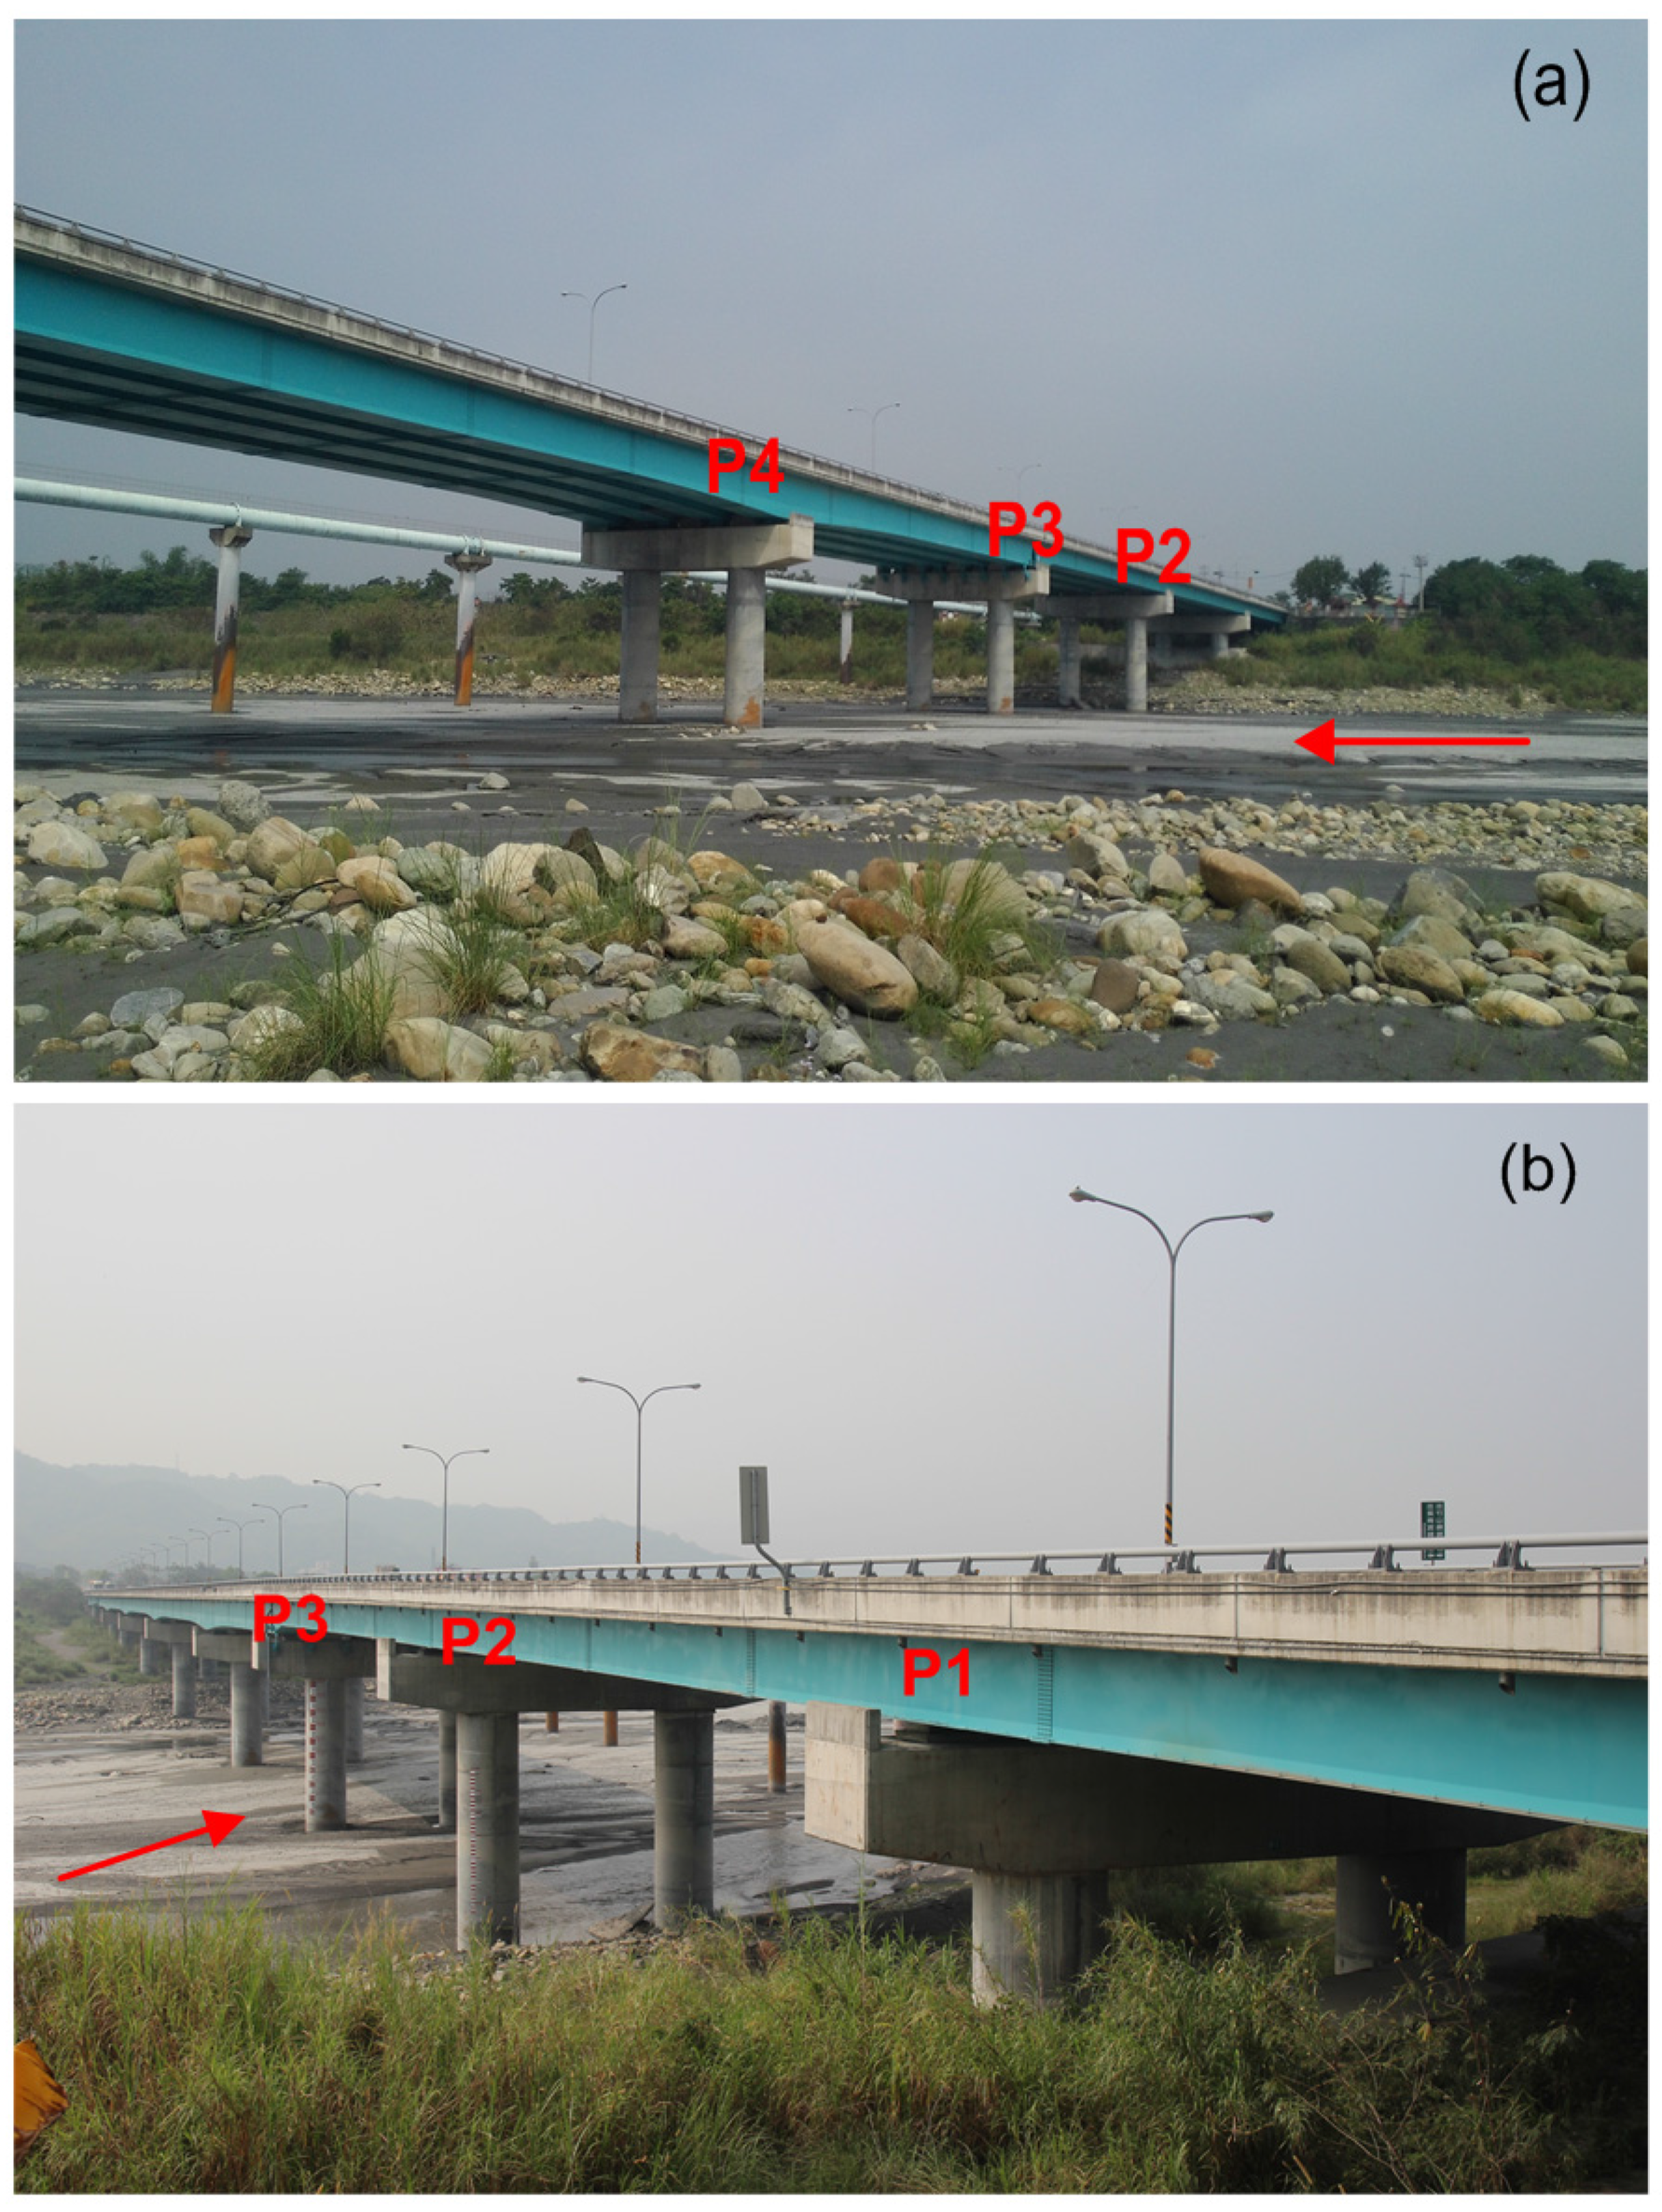
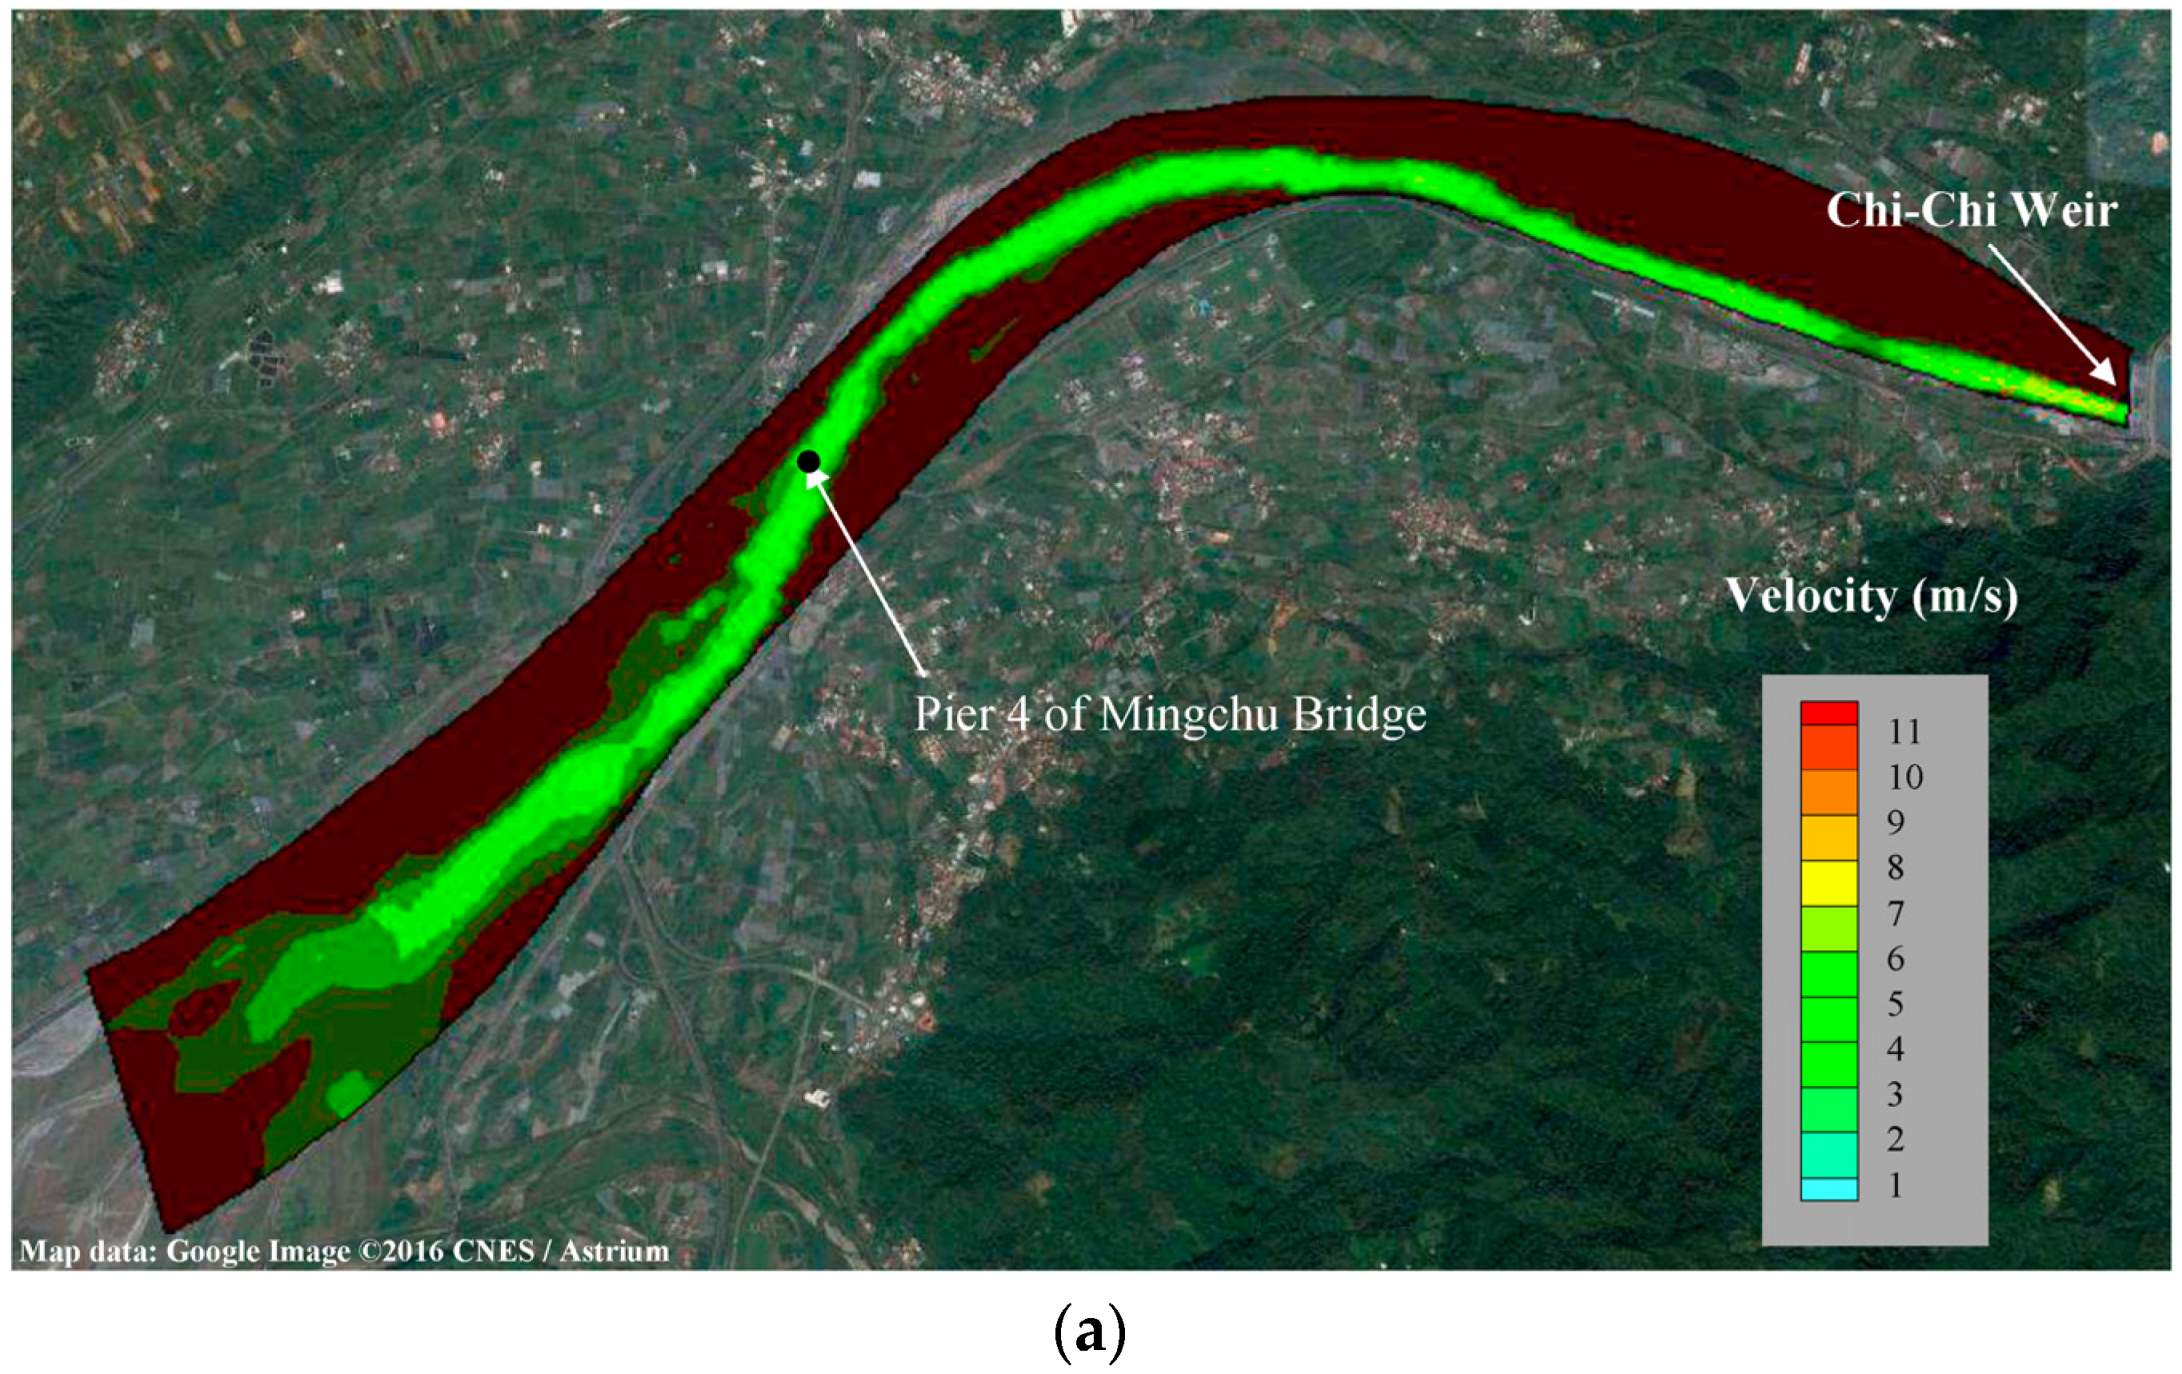
2.1. Site Description

Figure 1 shows the map of Cho-Shui River basin, the longest river in Taiwan. The study site, Mingchu Bridge, located downstream of the Chi-Chi Weir in the middle reach of the Cho-Shui River, was re-constructed in 1999. Figure 2 shows variations of the longitudinal riverbed profiles downstream of the Chi-Chi Weir from 1999 to 2011. A small inset attached in Figure 2 reveals that substantial bed degradation had occurred around the bridge. The mean bed level has dramatically decreased by approximately 6.5 m from 2001 to 2011. Channel incision had exposed the pier foundation and reduced the flood resistance of the Mingchu Bridge; the Director General of Highways (DGH) decided to refurbish the substructure of the Mingchu Bridge in 2011. The channel slope at the site is approximately 0.7%. The 720-m-long bridge comprises 13 concrete-beam spans. Seven spans are located in the main channel, which has a width of approximately 300 m at the northern end (right bank) of the bridge (Figure 3). The piers are supported on octagonal pile caps with reinforced-concrete piles driven 32 m below its underside. Each pier was designed to be supported by five rows of 17 piles. The dimensions of each pier pile cap are 26.5 m × 12 m × 3 m (thickness). The Chi-Chi Weir is located approximately 6.5 km upstream from the bridge; the river flows 56 km downstream from the bridge to the Taiwan Strait. As previously mentioned, riverbed degradation near the Mingchu Bridge is largely attributed to the Chi-Chi Weir as the weir inhibits the natural supply of sediment to the bridge site. During floods, some bridges may encounter clogging due to floating debris, resulting in additional pier-scouring, as is discussed in Pagliara and Carnacina [10,11]. In this study, the span of the bridge foundations of Mingchu Bridge is more than 50 m, and no significant debris effect on pier scour has been observed. Therefore, the effect of floating debris on pier scour is no considered in this study.
The bed sediment consists of coarse alluvial gravels together with sands. Figure 4 shows a close-up view of the Mingchu Bridge, indicating that the bed material at this bridge is characterized by a wide range of sediment particle distribution. Furthermore, Figure 5 shows the sediment particle size distributions around Pier 4 of the Mingchu Bridge obtained in 2003 and 2014, respectively. The results of the survey conducted in 2003 indicated a median sediment size of d50 = 35 mm, with a geometric standard deviation of sediment size ( σ g = ( d 84 / d 16 ) ) 15.33, where d16 and d84 = particle size for which 16% and 84% are finer by weight, respectively. However, the survey results in 2014 indicated a median sediment size of d50 = 1.52 mm, with a geometric standard deviation of sediment size σg = 7.45. The data show that the sediment particle distribution at the bridge site clearly has become more uniformly distributed. Moreover, the median grain size has changed from that of coarse gravel to coarse sand. The change in the bed material composition at the Mingchu Bridge over the past decade is significant as it reflects the effect of the Chi-Chi Weir in reducing sediment supply.

2.2. Procedures of Scour Measurements

As was stated in the Introduction section, there is no suitable instrument for measuring scour in a steep channel during typhoon-induced floods in Taiwan. This study used the “numbered-brick” method to measure the general scour upstream of and total scour depth in front of Pier 4 at the Mingchu Bridge. The length, width, and thickness of a single brick were approximately 20 cm, 10 cm, and 5.5 cm, respectively.
Two “numbered-brick” columns were installed approximately 120 m upstream and 1 m in front of Pier 4; these columns were used for measuring the general scour depth of the riverbed and total scour depth at Pier 4, respectively. Before the flood, the location of each “numbered-brick” column was accurately identified by using a total-station transit after the installation process. After the flood, the precise location of the two brick columns was determined by conducting a survey using the same total-station transit. Excavators were then used to carefully remove the deposited bed materials above the brick column. The number on the first brick of the brick column was recorded. Thus, the maximum general scour and total scour depths were determined by evaluating the number of bricks that were washed away during the flood. Figure 6a,b show the plan and side views, respectively, of the scour measurement system near the Mingchu Bridge.

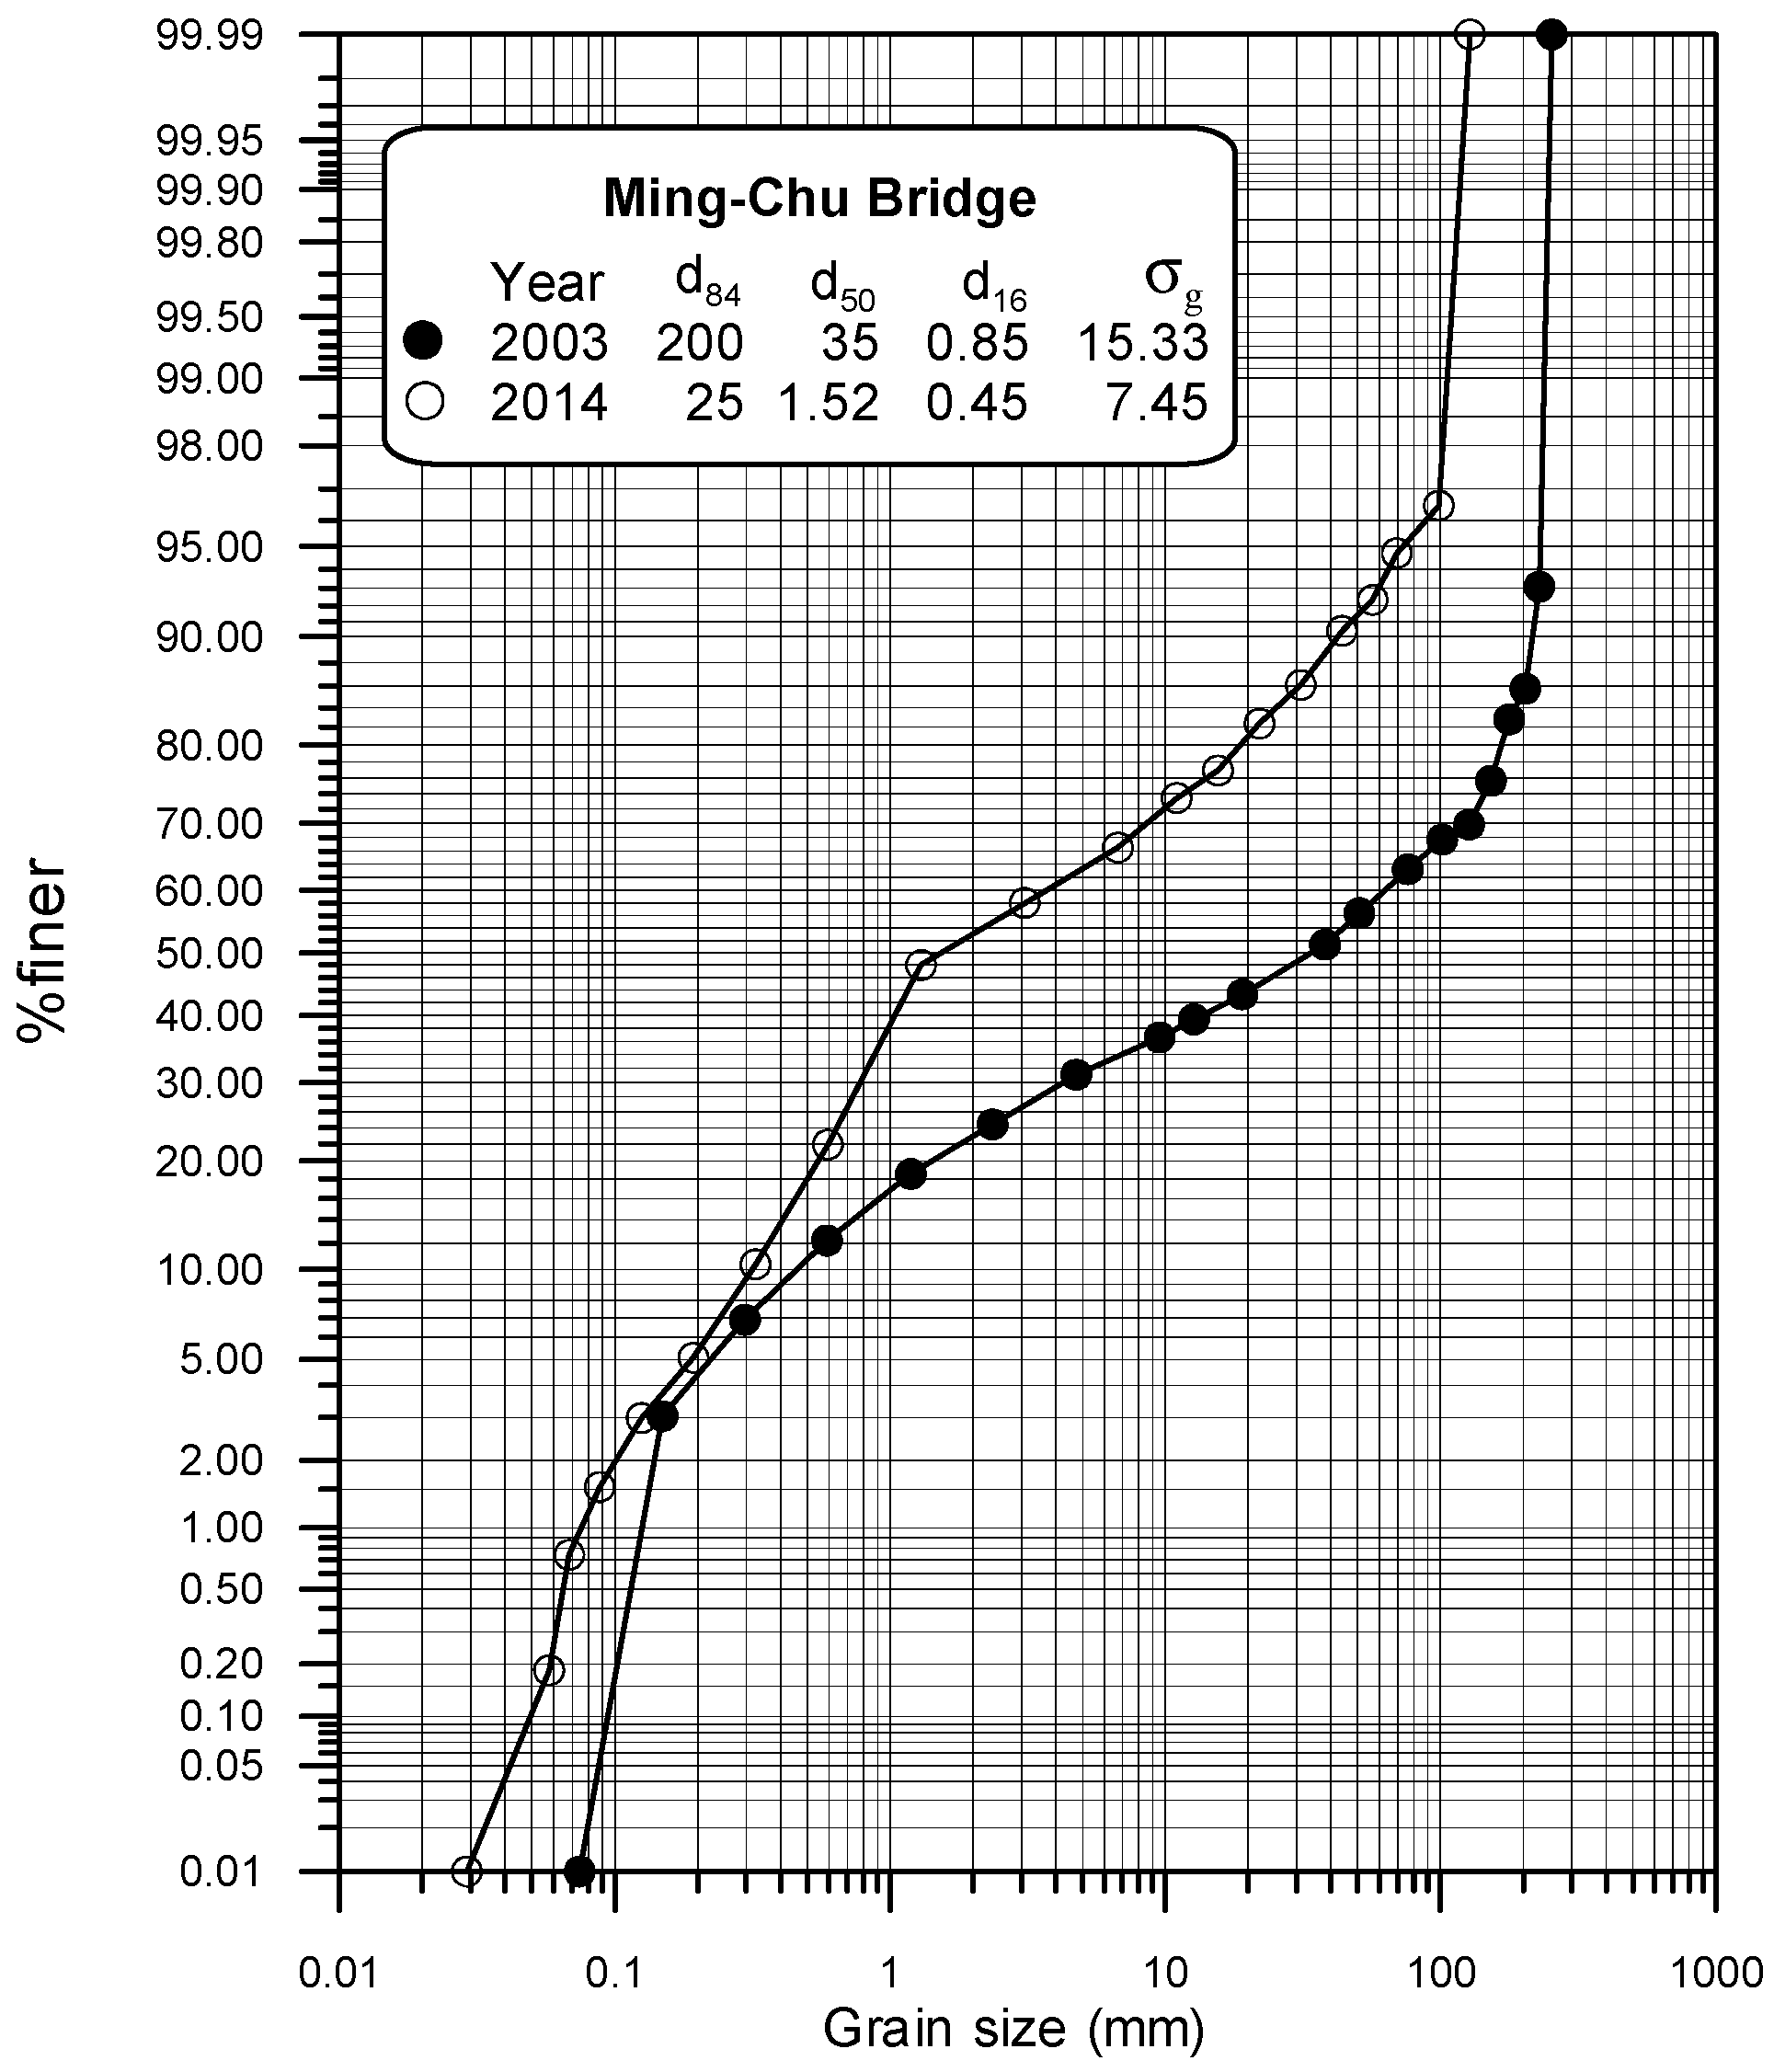
2.3. Results of Scour Measurements

Because there is no tributary between the Chi-Chi Weir and Mingchu Bridge and that the channel slope in the river reach is relatively steep, it is assumed that the flow discharge at the Mingchu Bridge is close to that released from the Chi-Chi Weir. Figure 7 shows the flood discharge hydrographs resulted from a Monsoon (May, 2014) and Typhoon Matmo (July, 2014). The data reveal that the hydrographs of both flood events were simple, essentially with just one dominant peak. The peak flow discharge of the flood induced by Typhoon Matmo was 4980 m3/s, whereas the Monsoon yielded a peak flow discharge of 1446 m3/s, which is nearly one-third that of Typhoon Matmo. The scour depth, including the general and total scour depths, was related to the magnitude of the peak flow discharge and duration of the flood hydrograph. The duration of the hydrograph associated with Typhoon Matmo is evidently longer than that with the Monsoon.
Table 1 shows details of the general scour depth measurements obtained from numerous studies. It includes the two field measurements conducted in this study (Monsoon, 2014; Typhoon Matmo, 2014). In addition, the measurement conducted by the Taiwan Typhoon and Flood Research Institute (TTFRI) at the same site in 2013 (Typhoon Soulik) is also shown in the table. For comparison, the results of Lu et al. [3] and Su and Lu [12] supported by Water Resource Agency (WRA) are also summarized in the table although not all of them were data obtained at the Mingchu Bridge. However, all the general scour depths were measured using the same “numbered-brick” method. The measured maximum general scour depths ranged from 1.2 m to 4.5 m, and the flow intensity (unit flow discharge) ranged from 4.48 m2/s to 33.1 m2/s. The median sediment particle size ranged from 1.52 mm to 136 mm. For most of the measured data, the median particle size of the bed materials exceeds 2 mm; therefore, the bed may be classified as a gravel bed. However, at the field site at the Silo Bridge, which is located in the lower Cho-Shui River with a channel bed slope of approximately 0.001, the bed is a sandy bed. Furthermore, at the field site of the current study (Mingchu Bridge), the bed sediment varies from gravel to gravel with large-grained sand because the bed has been incised over the recent 10 years (Figure 3, Figure 4 and Figure 5).
The results of general scour depth measurements are used to propose a reliable general-scour computation equation as described in Section 2.4. In addition, the measured results of total scour depth at Mingchu Bridge were adopted to verify the accuracy of the proposed method as described in Section 4.2.

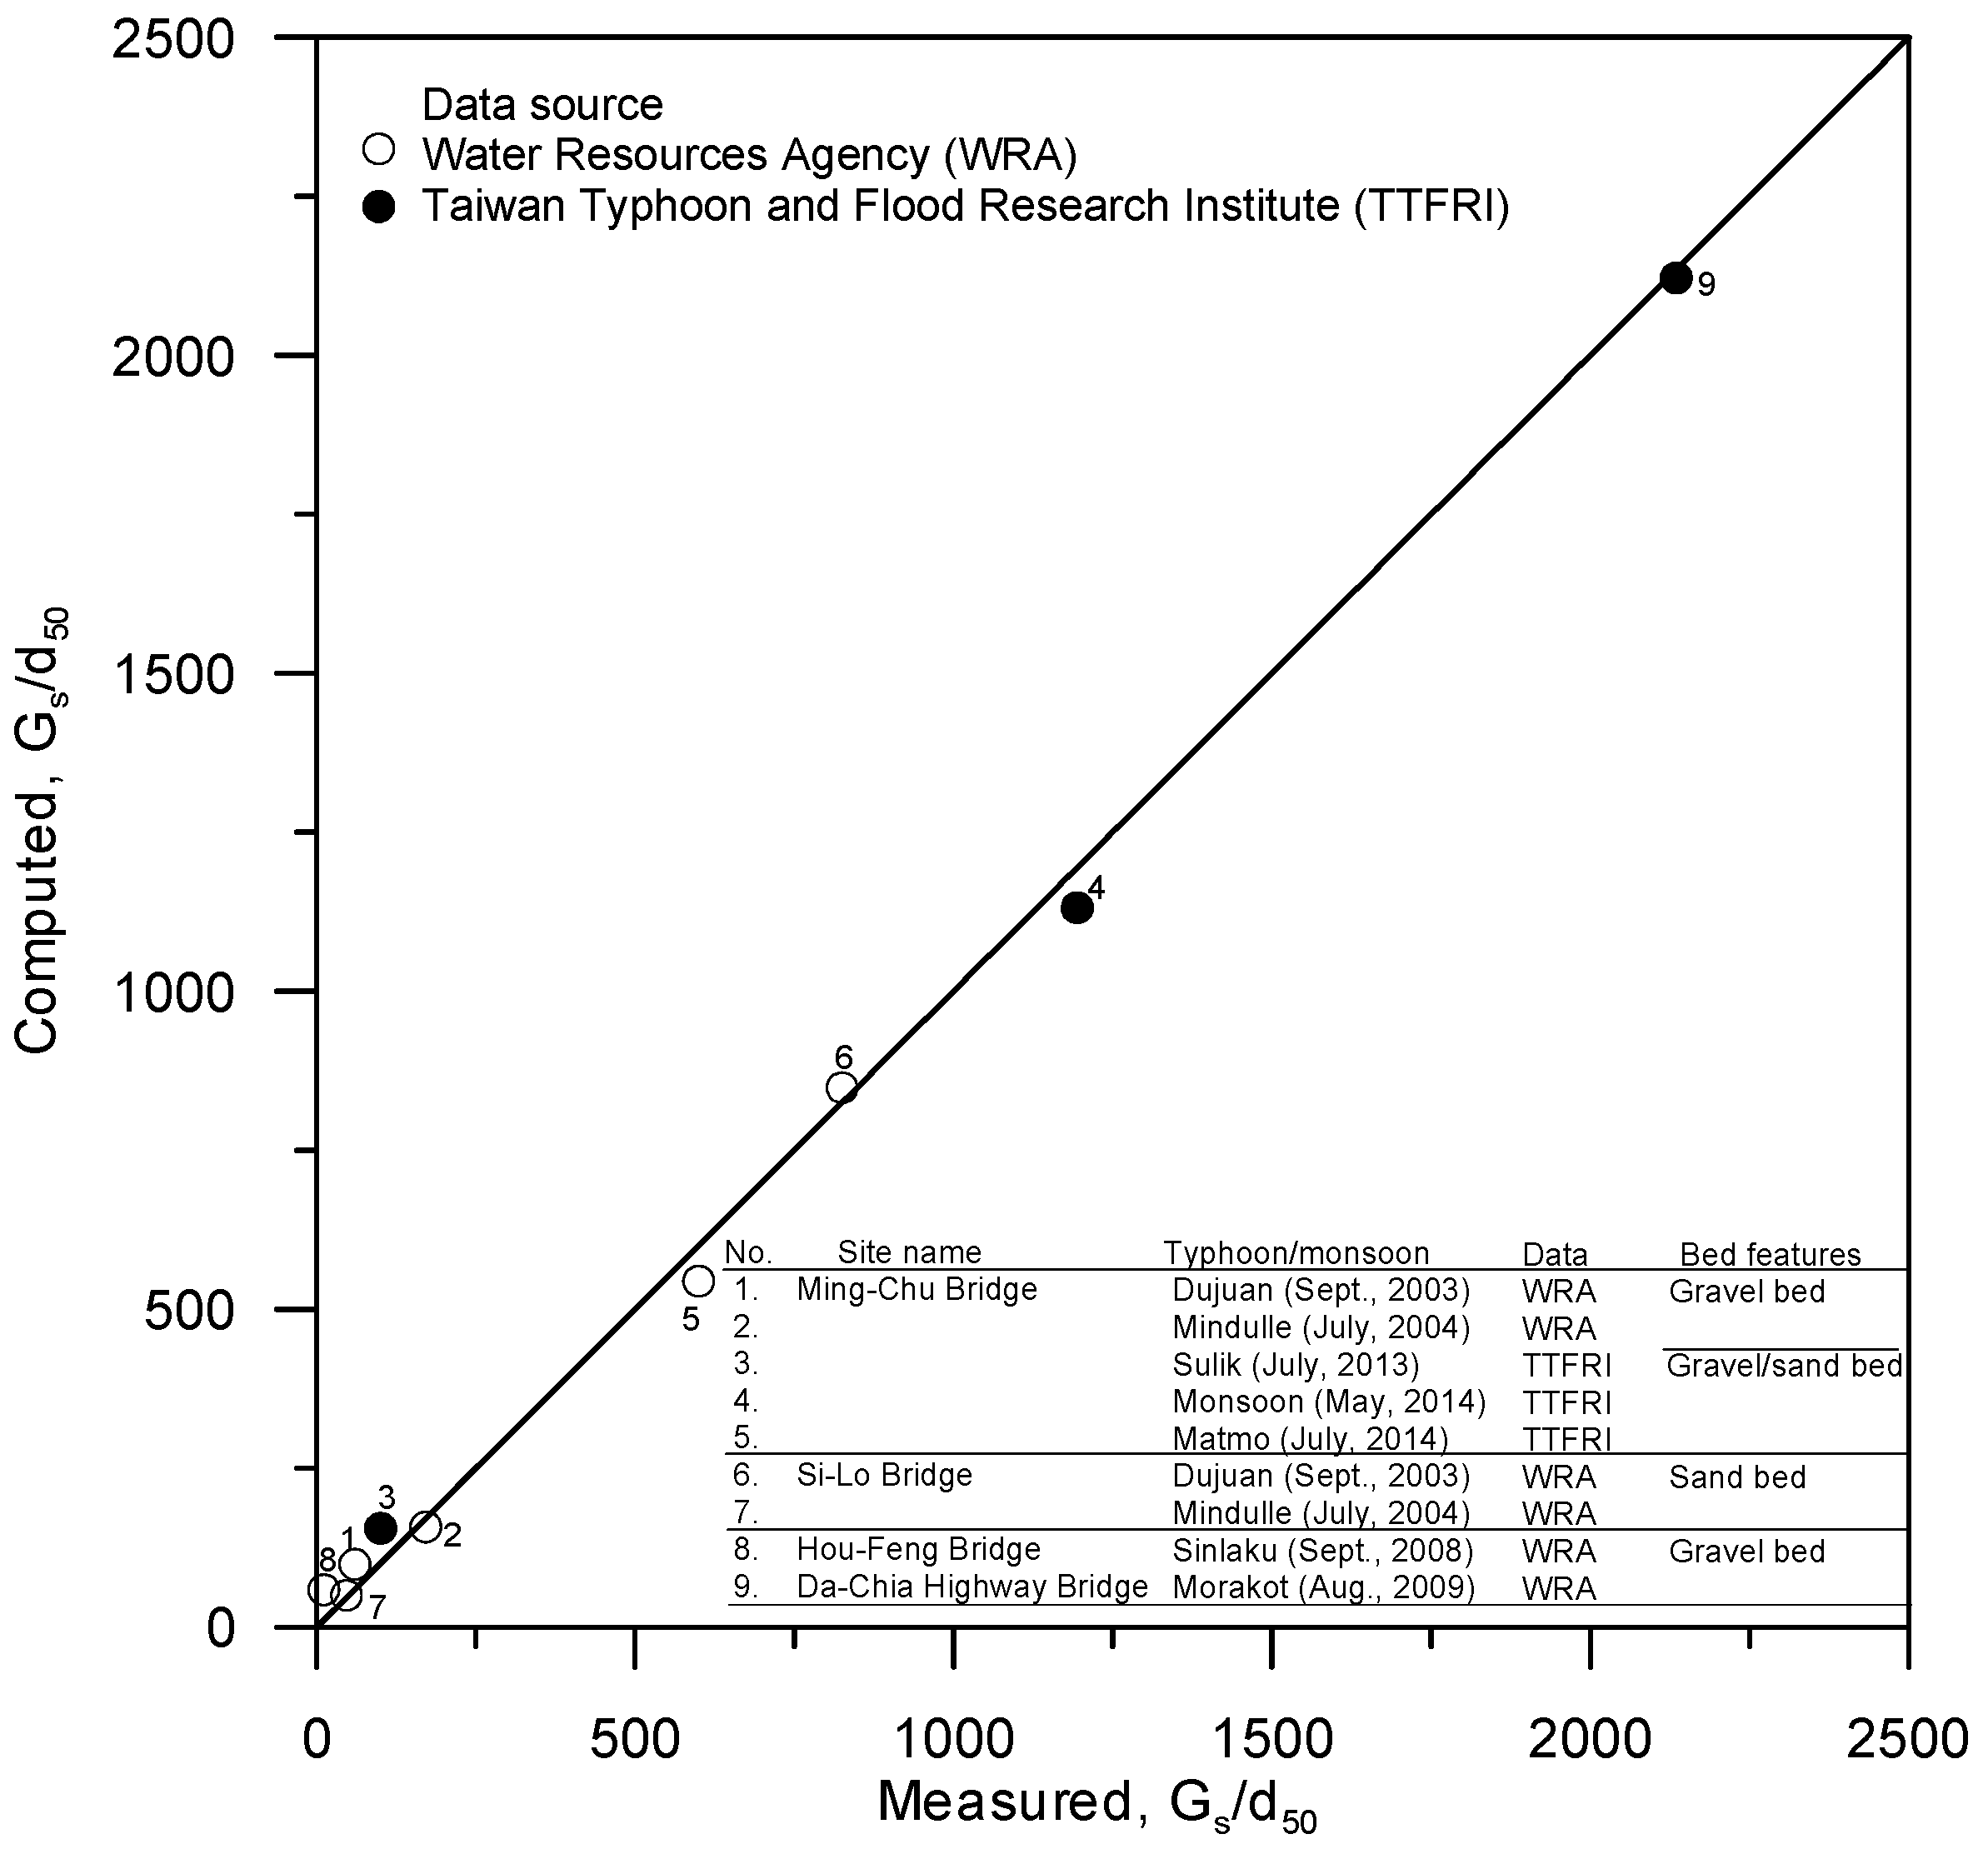
2.4. Proposed General-Scour Computation Equation

Most published empirical equations developed for the computation of general scour utilized the unit flow rate and sediment size as the primary parameters [13]; and the formula is a power-type equation. However, based on the data obtained in this study, the channel slope and standard deviation of particle size distribution are found to significantly affect the general scour depth. Therefore, to determine the general scour depth, the parameters influencing the short-term general scour depth, Gs induced by a flood may be expressed in a functional form as follows:
ϕ ( G s , q , S , g , d 50 , σ g )
where q is the unit discharge; g is the gravitational acceleration; S is the channel slope; d50 is the median particle diameter; σg is the geometric standard deviation of the particle size distribution. Using Buckingham’s π theorem, Gs in Equation (1) may be expressed in the following dimensionless form:
G s d 50 = ϕ ( q g d 50 3 , S , σ g )
By including the submerged specific gravity of sediment particles, Equation (2) is modified to
G s d 50 = ϕ ' ( q ( ρ s / ρ 1 ) g d 50 3 , S , σ g )
where ρs is the density of sediment particles and ρ is the density of fluid. Analyses of the field data indicate that Equation (3) may be expressed in the following form:
G s d 50 = a 0 ( q ( ρ s / ρ 1 ) g d 50 3 ) a 1 S a 2 σ g a 3
where a0, a1, a2, and a3 are coefficients. The field data shown in Table 1 were used in the regression analysis to obtain the coefficients in Equation (4). The equation thus obtained is
G s d 50 = 7.271 ( q ( ρ s / ρ 1 ) g d 50 3 ) 0.514 S 0.071 ( σ g ) 0.014
Figure 8 shows the comparison of the field data and dimensionless general scour depth obtained from Equation (5). The coefficient (R-squared value) between the measured and computed short-term general scour depths is 0.996, indicating that Equation (5) fits the field data well. Moreover, the exponents of the unit discharge q and channel slope S are positive, indicating that the scour depth is expectedly directly proportional to these two parameters. However, it is inversely proportional to the geometric standard deviation, which likely is due to the large particle size distribution of the bed material that causes the formation of an armor layer during floods, thus reducing the general short-term scour depth in comparison with a uniform sediment. It must be stated that since all the data used to determine Equation (5) were collected in Taiwan in association of typhoon-induced floods on rivers that comprise sand to gravel beds, using the equation beyond such conditions must be carried out with care. Moreover, more data are needed to verify the accuracy of Equation (5).

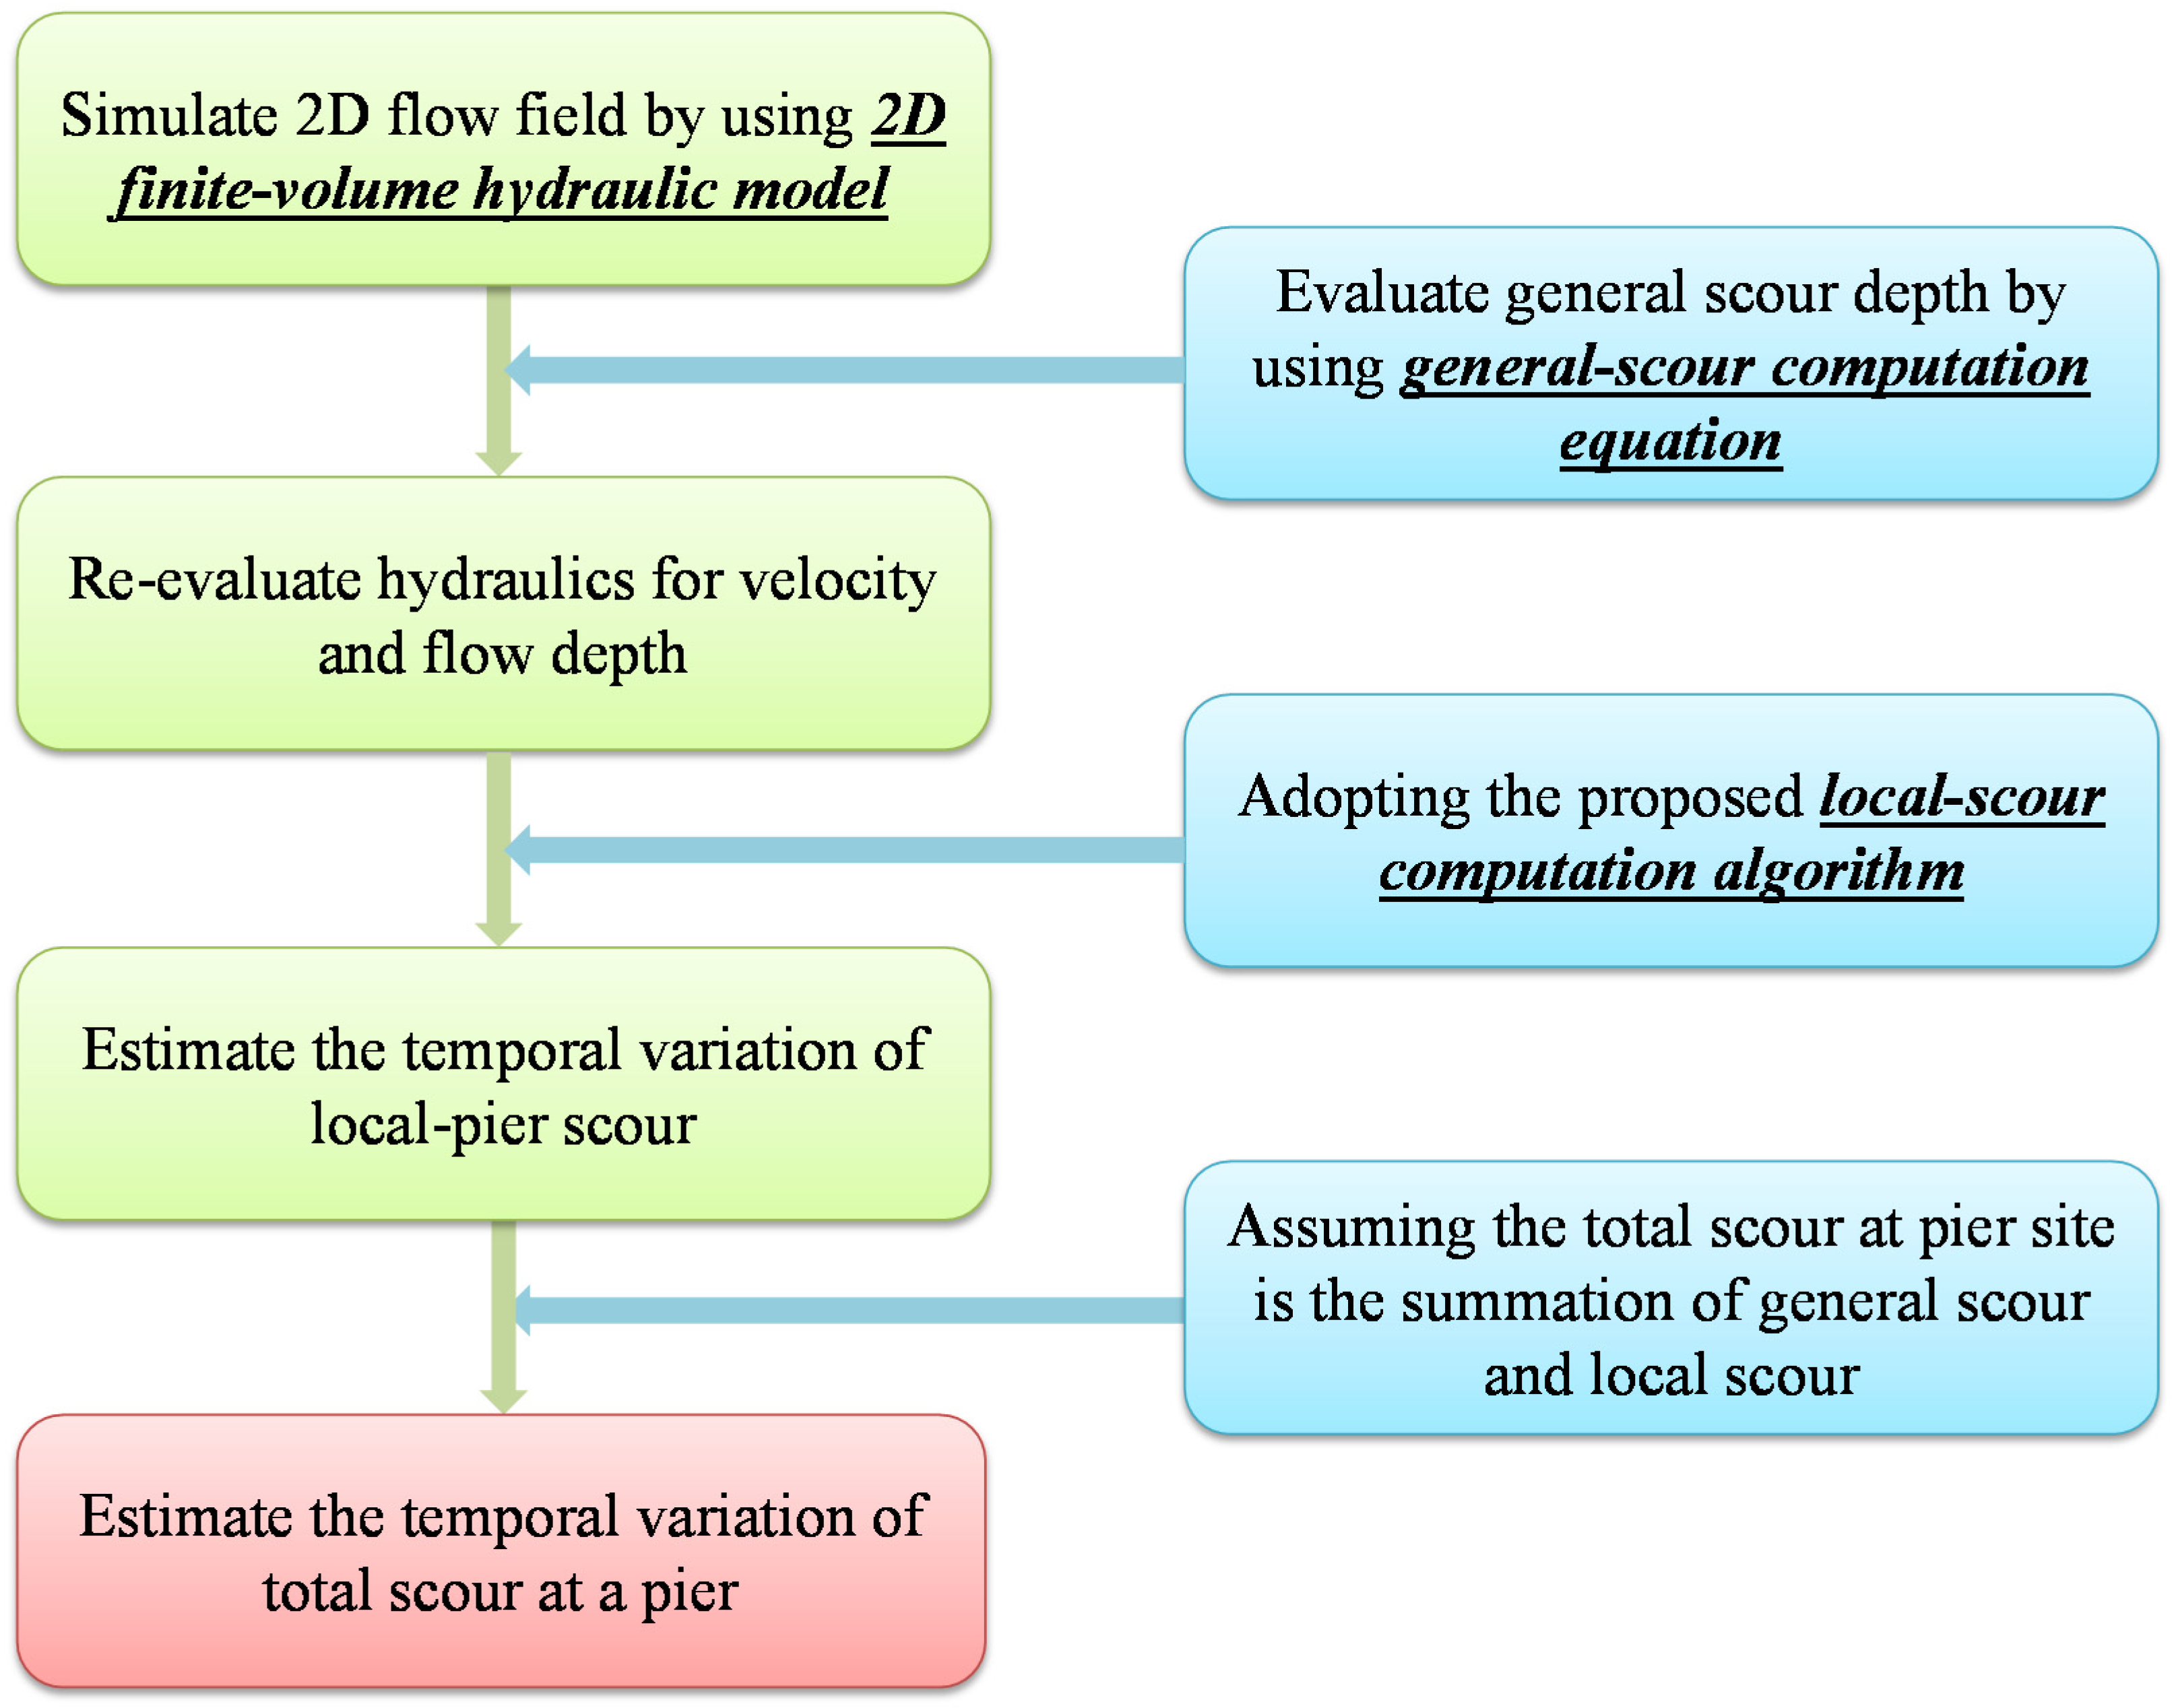
3. Method for Bridge Scour Simulation

In general, the total scour at a bridge site comprises three components: general scour, contraction scour, and local scour [2,13]. General scour may occur in a river reach far from the local structures. In contrast to general scour, contraction scour and local scour (collectively call localized scour) are attributed to the presence of the bridge structure in a riverbed. Contraction scour is mainly due to the reduction of the channel width, thus restricting the waterway, while the flow obstruction caused by the bridge foundation is of primary importance in the local scour process. According to the guideline for bridge scour analysis by the Federal Highway Administration [14] and bridge scour texts such as, Melville and Coleman [13], all scour components of scour depths at a bridge site may be assumed to be independent. Based on this assumption, the total scour depth is simply the arithmetic sum of all scour components. In this study, since the ratio of the pier width to span between two piers is small, the contraction-scour component is ignored. Both the short-term general and local scour depths are considered for simulating the total scour depth. In addition, the new method is proposed under the assumption that there is no sediment deposition.
To determine the evolution of total scour depth at a bridge foundation, a simple and reliable method based on the combination of 2D finite-volume hydraulic model and scour computation equation/algorithm was proposed. First, the proposed general-scour computation equation, Equation (5), is combined with the proposed finite-volume hydraulic model to simulate evolution of the general scour depth. For each time step, the finite-volume hydraulic model can give the local flow velocity and flow depth to obtain the unit discharge at each grid. Based on the unit discharge and the proposed general-scour computation equation, the approach flow conditions (upstream of the bridge) are modified. The modified approach flow depth and velocity are then used for the estimation of the local-pier scour. Considering local scouring, this study adopts the local-scour computation algorithm proposed by Hong et al. [15]. The total evolution of the scour depth is finally obtained by simply adding the general and local scour depths.

3.1. 2D Finite-Volume Hydraulic Model

The finite-volume hydraulic model proposed by Lai et al. [16] and Guo et al. [17,18] is used herein. The model had been tested for river engineering applications in Taiwan and was found to be able to predict the process of flood propagation reasonably well. Therefore, the model was applied herein to simulate the hydraulic properties such as the water levels, water depths, and velocities, which were used for estimating the evolution of the general scour depth.
In the model, the finite volume method and the hydrostatic reconstruction method were used and coupled to solve the 2D shallow water flow equations:
Q t + F I x + G I y = F V x + G V y + S
in which
Q = [ h , h u , h v ] T
F I = [ h u , h u 2 + 1 / 2 g h 2 , h u v ] T ; G I = [ h v , h u v , h v 2 + 1 / 2 g h 2 ] T
F V = [ 0 , h T x x / ρ , h T x y / ρ ] T ; G V = [ 0 , h T x y / ρ , h T y y / ρ ] T
S = [ 0 , g h ( s 0 x s f x ) , g h ( s 0 y s f y ) ] T
where Q is the conserved physical vector; FI and GI are the inviscid flux vectors in the x- and y-directions, respectively; FV and GV are the viscous flux vectors in the x- and y-directions, respectively; S is the source term; h is the water depth; u and v are the depth-averaged velocity components in the x- and y-directions, respectively; ρ is the density of water; Txx, Txy and Tyy are the depth-averaged turbulent stresses; g is the gravitational acceleration; s0x and s0y are the bed slopes in the x- and y-directions, respectively; sfx and sfy are the friction slopes in the x- and y-directions, respectively.
Following the discretization of the finite volume method, one obtains the algorithm consists of two steps:
Q = Q n Δ t A [ m = 1 M T ( θ ) 1 F ( Q ¯ ) L m ]
Q n + 1 = Q + Δ t S ( Q )
where n is the time index; ∆t is the time step; A is the area of the cell; m is the index that represents the side of the cell; M is the total number of the sides for the cell; Lm is the length of the m side for the cell; T(θ)−1 is the inverse of rotation matrix corresponding to the m side; θ is the angle between the outward unit vector n and the x-axis; n is the outward unit vector normal to the boundary of the control volume; Qn is the vector of conserved variables for a cell at time index n.
Q′ is the vector of conserved variables at the predictor step; F ( Q ¯ ) = F I ( Q ¯ ) F V ( Q ¯ ) is the numerical flux; F I ( Q ¯ ) represents the inviscid numerical flux; F V ( Q ¯ ) denotes the viscous numerical flux; S ( Q ) is the well-balanced source term:
S = [ 0 , - g h u n Mann 2 u 2 + v 2 h 4 / 3 , - g h v n Mann 2 u 2 + v 2 h 4 / 3 ] T
where h′ is the water depth at the predictor step; u′ and v′ are velocities at the predictor step and nMann is the Manning roughness coefficient.
To avoid the generation of numerical errors due to strong bed topography variations, the inviscid numerical flux function of the model is improved as:
F I ( Q ¯ ) = F I ( Q ¯ L R L , Q ¯ L R R ) + ( 0 g 2 h L 2 g 2 ( h L R L ) 2 0 )
In Equation (10), an upstream flux-splitting finite-volume scheme [16] is used to obtain the numerical flux F I ( Q ¯ L R L , Q ¯ L R R ) . In addition, to achieve balance between the fluxes and source terms, the left Q ¯ L R L and right Q ¯ L R R transformed conserved variables at cell-interface LR should be reconstructed as:
Q ¯ L R L = [ h L R L h L R L u x ¯ h L R L v y ¯ ] L ; Q ¯ L R R = [ h L R R h L R R u x ¯ h L R R v y ¯ ] R
in which u x ¯ = ucosθ + vsinθ and v y ¯ = v cos θ u sin θ are respectively the velocity components in 1D local coordinate system; and the cell-interface water depths, h L R L and h L R R , are reconstructed as:
h L R L = max [ 0 , h L + ( z b ) L ( z b ) L R ] ; h L R R = max [ 0 , h R + ( z b ) R ( z b ) L R ]
where (Zb)LR = max[(Zb)L, (Zb)R] is the bed elevation at the cell interface LR.
The main flow solver of the model is based on the finite volume method with the well-balanced source term treatment. Guo et al. [17] had earlier presented a detailed description of the numerical analysis method for the model, which has the following major capabilities:
  • The model is suitable for modeling flow hydraulics involving irregular bed topography;
  • Both steady or unsteady flows can be simulated;
  • The solution is accurate and the numerical algorithm is efficient;
  • An unstructured arbitrarily shaped mesh is used; and
  • All flow regimes (i.e., subcritical, transcritical, and supercritical flows) can be resolved.

3.2. Local-Scour Computation Algorithm

The algorithm for calculating the evolution of the local scour depth proposed by Hong et al. [15] is briefly presented in this section. The temporal variations of local pier-scour depth under steady flow conditions have been widely investigated [19,20,21,22,23,24,25,26,27,28,29]; however, only a limited number of studies have examined the temporal evolutions of local-pier scour depth under unsteady flow conditions [22,25,26]. Therefore, efforts on this topic are required to develop a suitable model for simulating the temporal variations of local pier-scour depth under unsteady flow conditions. Hong et al. [15] had proposed a semi-empirical-based algorithm for predicting the time evolution of the local scour depth. First, a regression equation is used to calculate the scour depth under steady flow conditions:
L s / D p = k [ log T R ] 1.302
where
k = 0.235 ( h D p ) 0.008 ( D p d 50 ) 0.282 F d 1.078 σ g 1.065
T R = t / [ D p / ( g d 50 ) 0.5 ]
where LS is the local pier-scour depth; Dp is the pier diameter; F d ( = U / g d 50 ) is the densimetric particle Froude number; g′[=(ρs/ρ − 1)g] is the reduced gravitational acceleration; σg is the geometric standard deviation of the distribution of sediment particles; and t is the time.
Figure 9 shows a schematic diagram of the evolution of scour depth under an unsteady flow condition that was computed using the method of superposition; the corresponding calculating steps are detailed as follows:
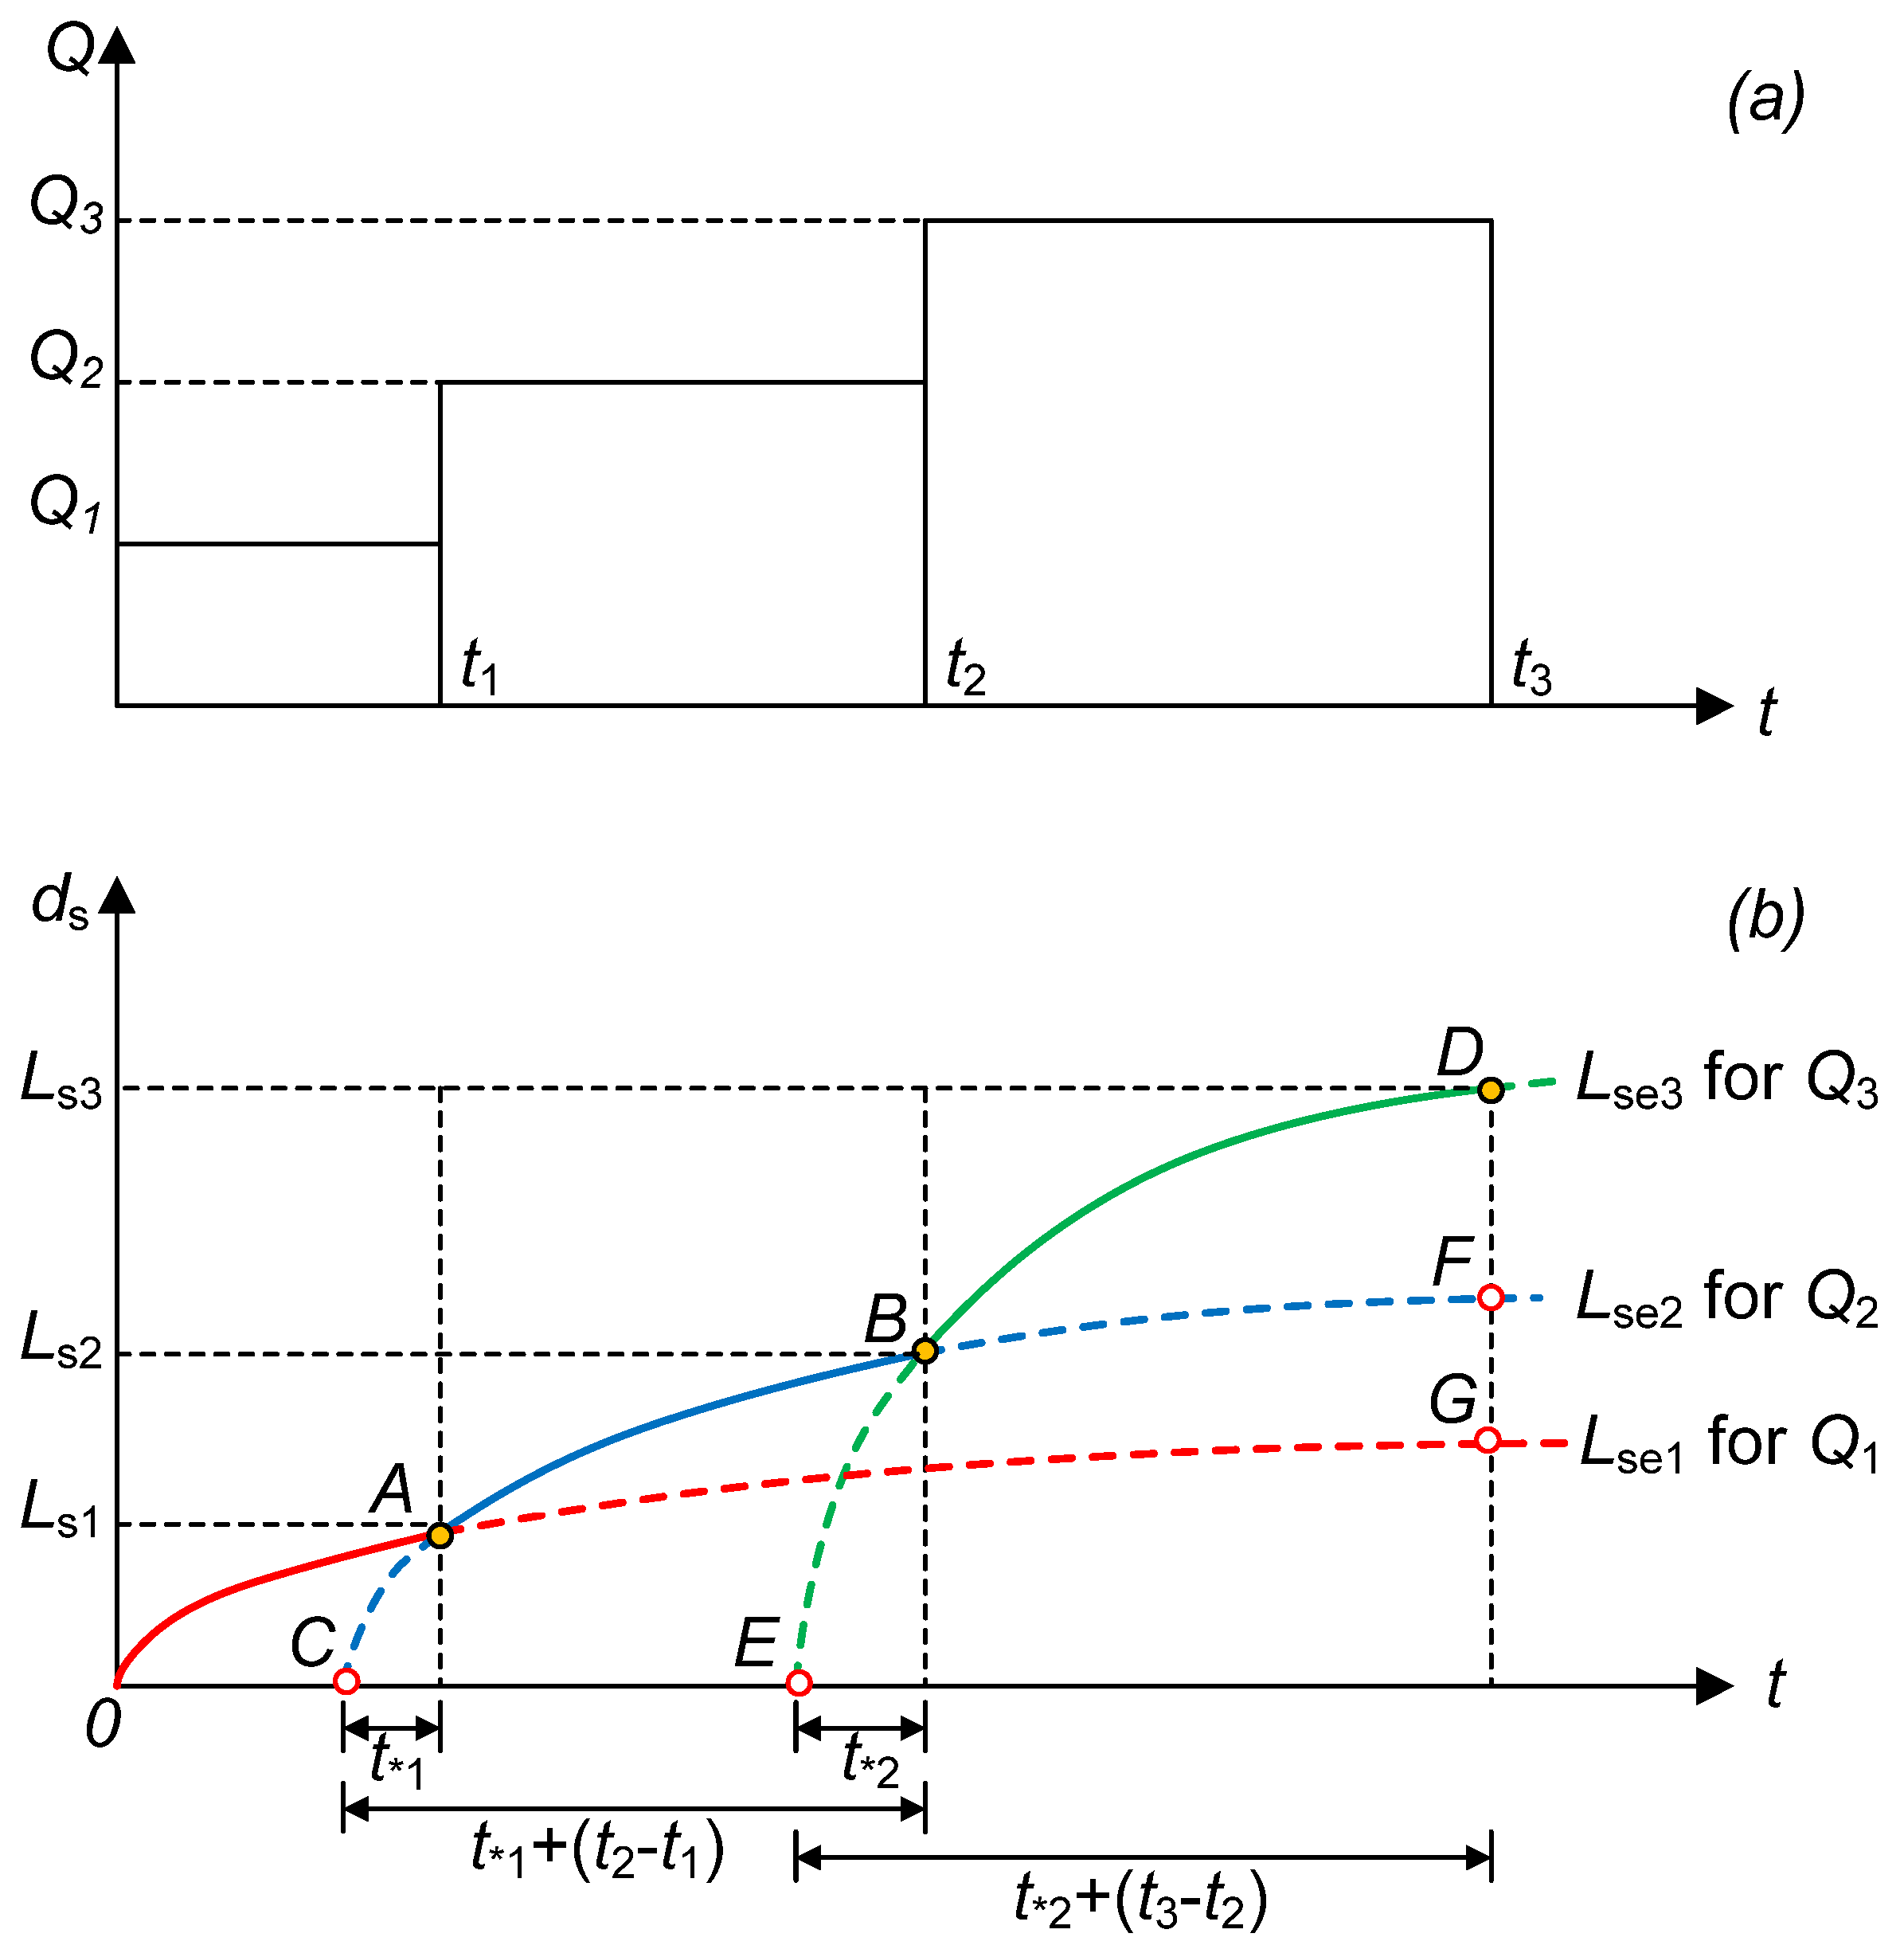
  • For the first flow discharge Q1 with duration t1, the evolution of the scour depth follows the OA curve under a steady flow condition. The cumulative scour depth is denoted as Ls1. If the duration of flow discharge Q1 is sufficiently long, the local scour hole may reach the equilibrium condition, and the corresponding scour depth is Lse1, where Lse1 > Ls1.
  • When the flow discharge increases from Q1 to Q2, the evolution of the scour depth follows the AB curve under the steady flow condition. Point C represents the virtual origin for the scouring process associated with the discharge Q2. Because the scouring process can “memorize” the previous scour depth, and because Q2 > Q1, the time (t*,1) required for the scour depth to reach Ls1 is less than t1. The AB curve represents the corresponding evolution of the scour depth from t1 to t2.
  • Similar to the calculation procedure (2), when the flow rate increases from Q2 to Q3 (> Q2), the evolution of the scour depth follows the BD curve under the steady flow condition. Likewise, Point E represents the virtual origin for the scouring process associated with the discharge Q3. Because Q3 > Q2, the time (t*,2) required for the scour depth to reach Ls2 is less than t*,1 + (t2t1). The BD curve indicates the corresponding evolution of the scour depth from t2 to t3.
  • Repeat the preceding procedure until all of the subdivisions are completed.
  • Obtain the temporal variation of scour depth under unsteady flow conditions.

3.3. Method for Simulating Total Scour-Depth Evolution

As shown in Figure 10, the new proposed method that enables a quick simulation of the evolution of the total scour depth can now be summarized as follows:
  • Using the proposed 2D finite-volume hydraulic model to simulate the 2D flow field near the bridge piers, one obtains the hydraulic properties including the water levels, velocities, and water depths upstream of the bridge piers.
  • The evolution of the general scour is obtained when these hydraulic properties are inputted to the proposed general-scour computation equation (i.e., Equation (5)).
  • On the basis of the evolution of the general scour depth and the revised approach flow conditions, the local-scour computation algorithm, i.e., Equations (13)~(15), can be used to estimate the evolution of the local scour depth.
  • The evolution of the total scour depth can be obtained by summing the general depth and local scour depth.

4. Hydraulic and Bridge Scour Simulations

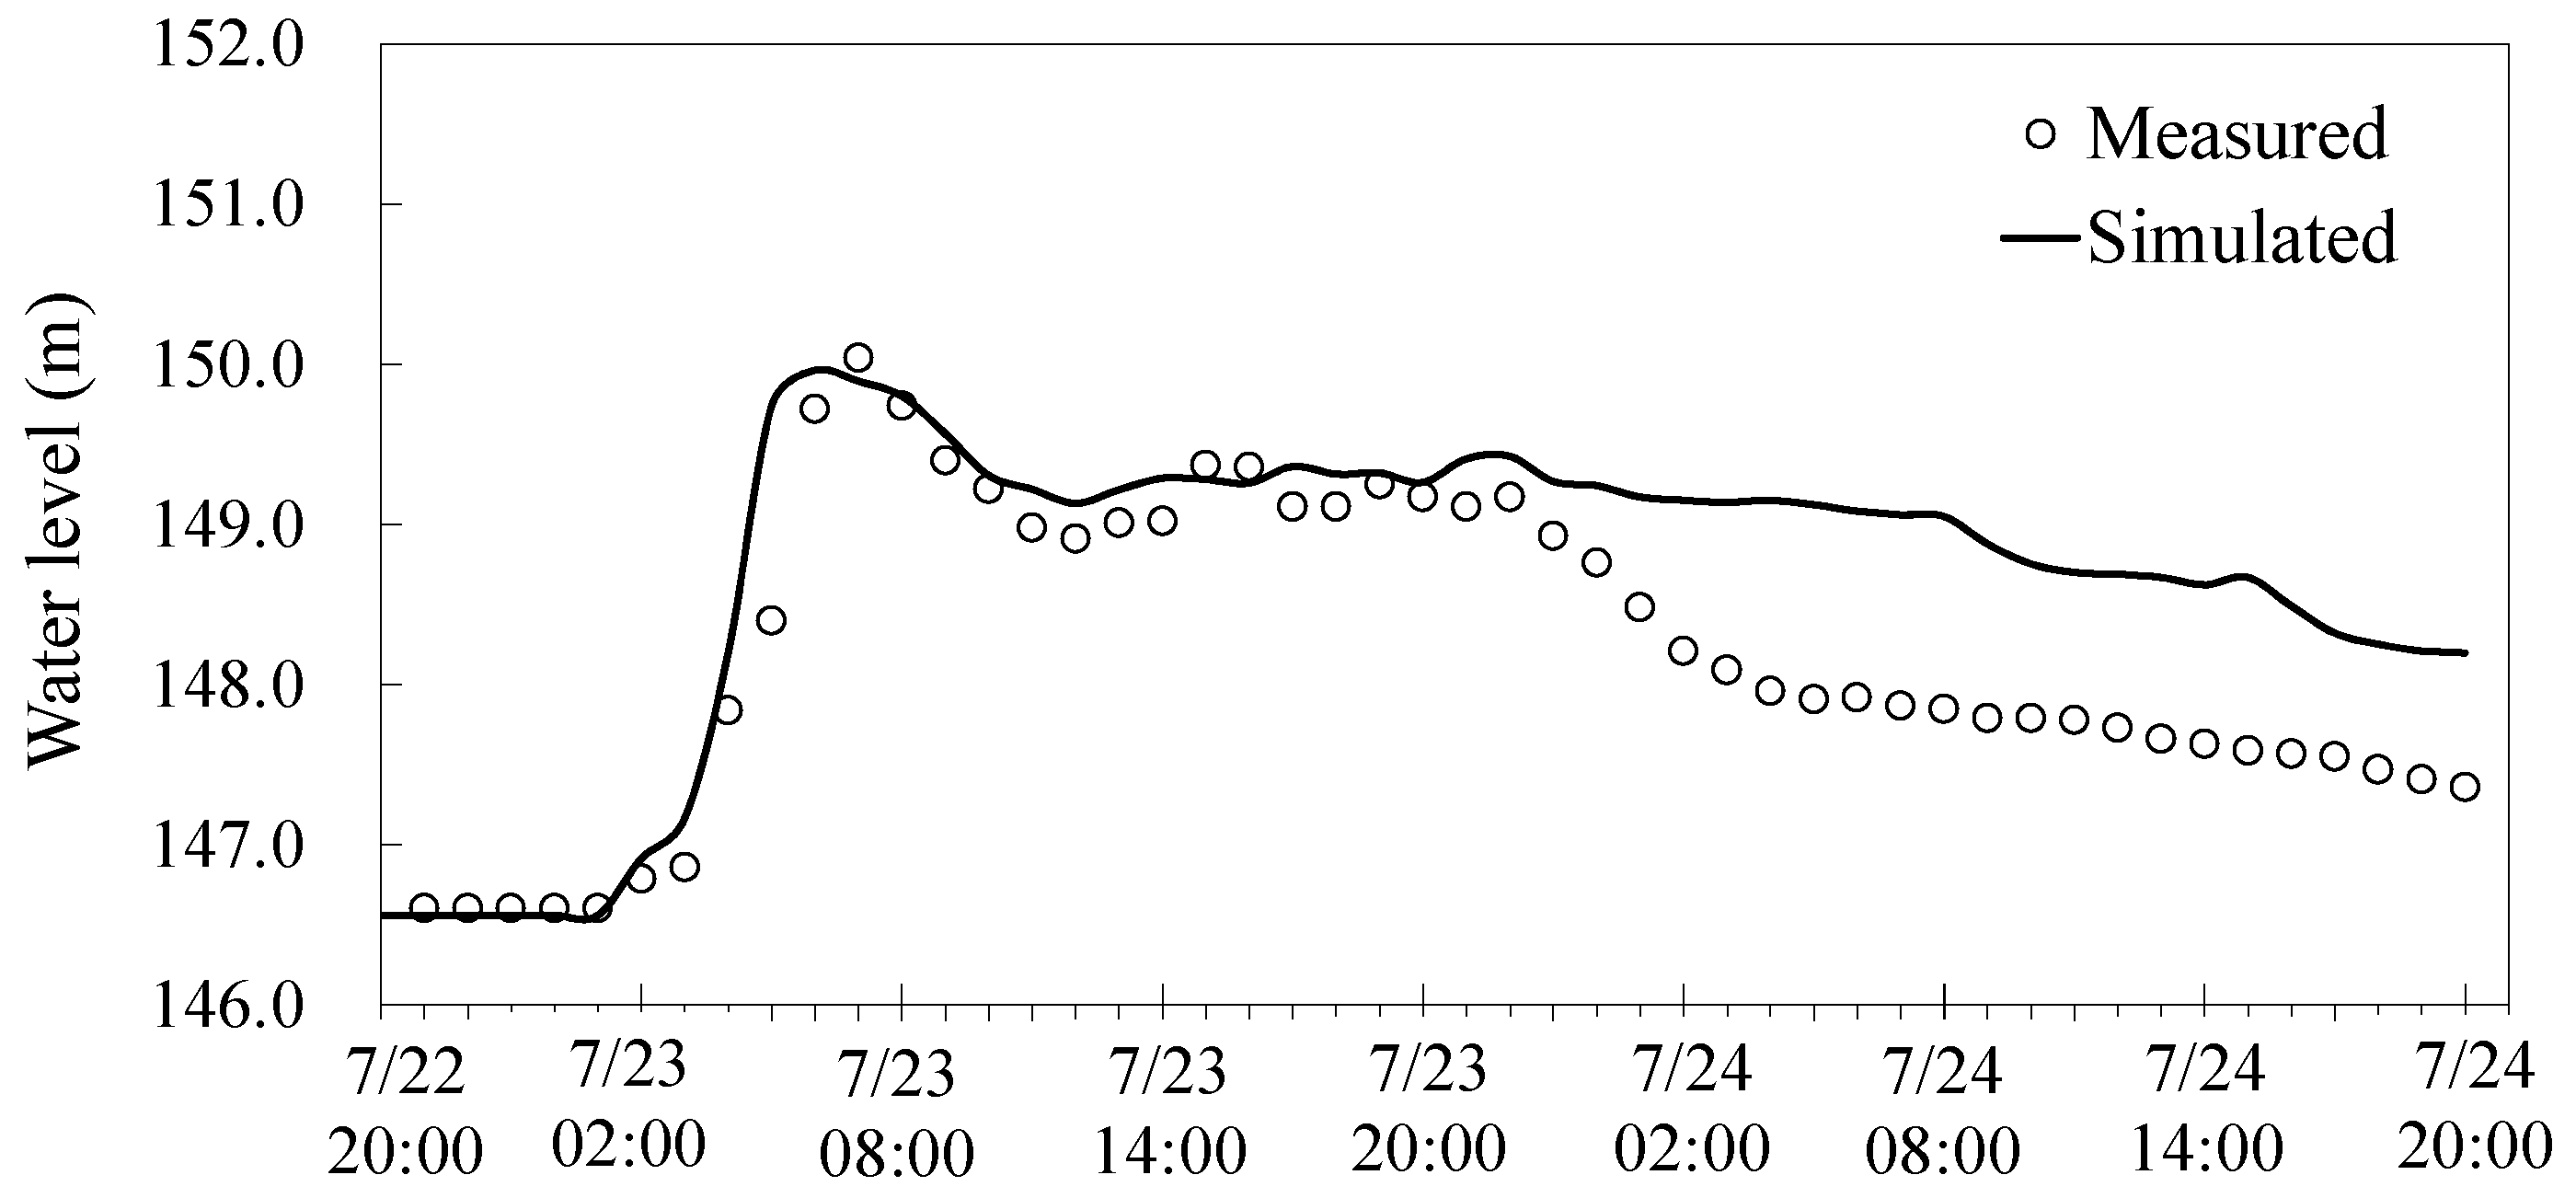
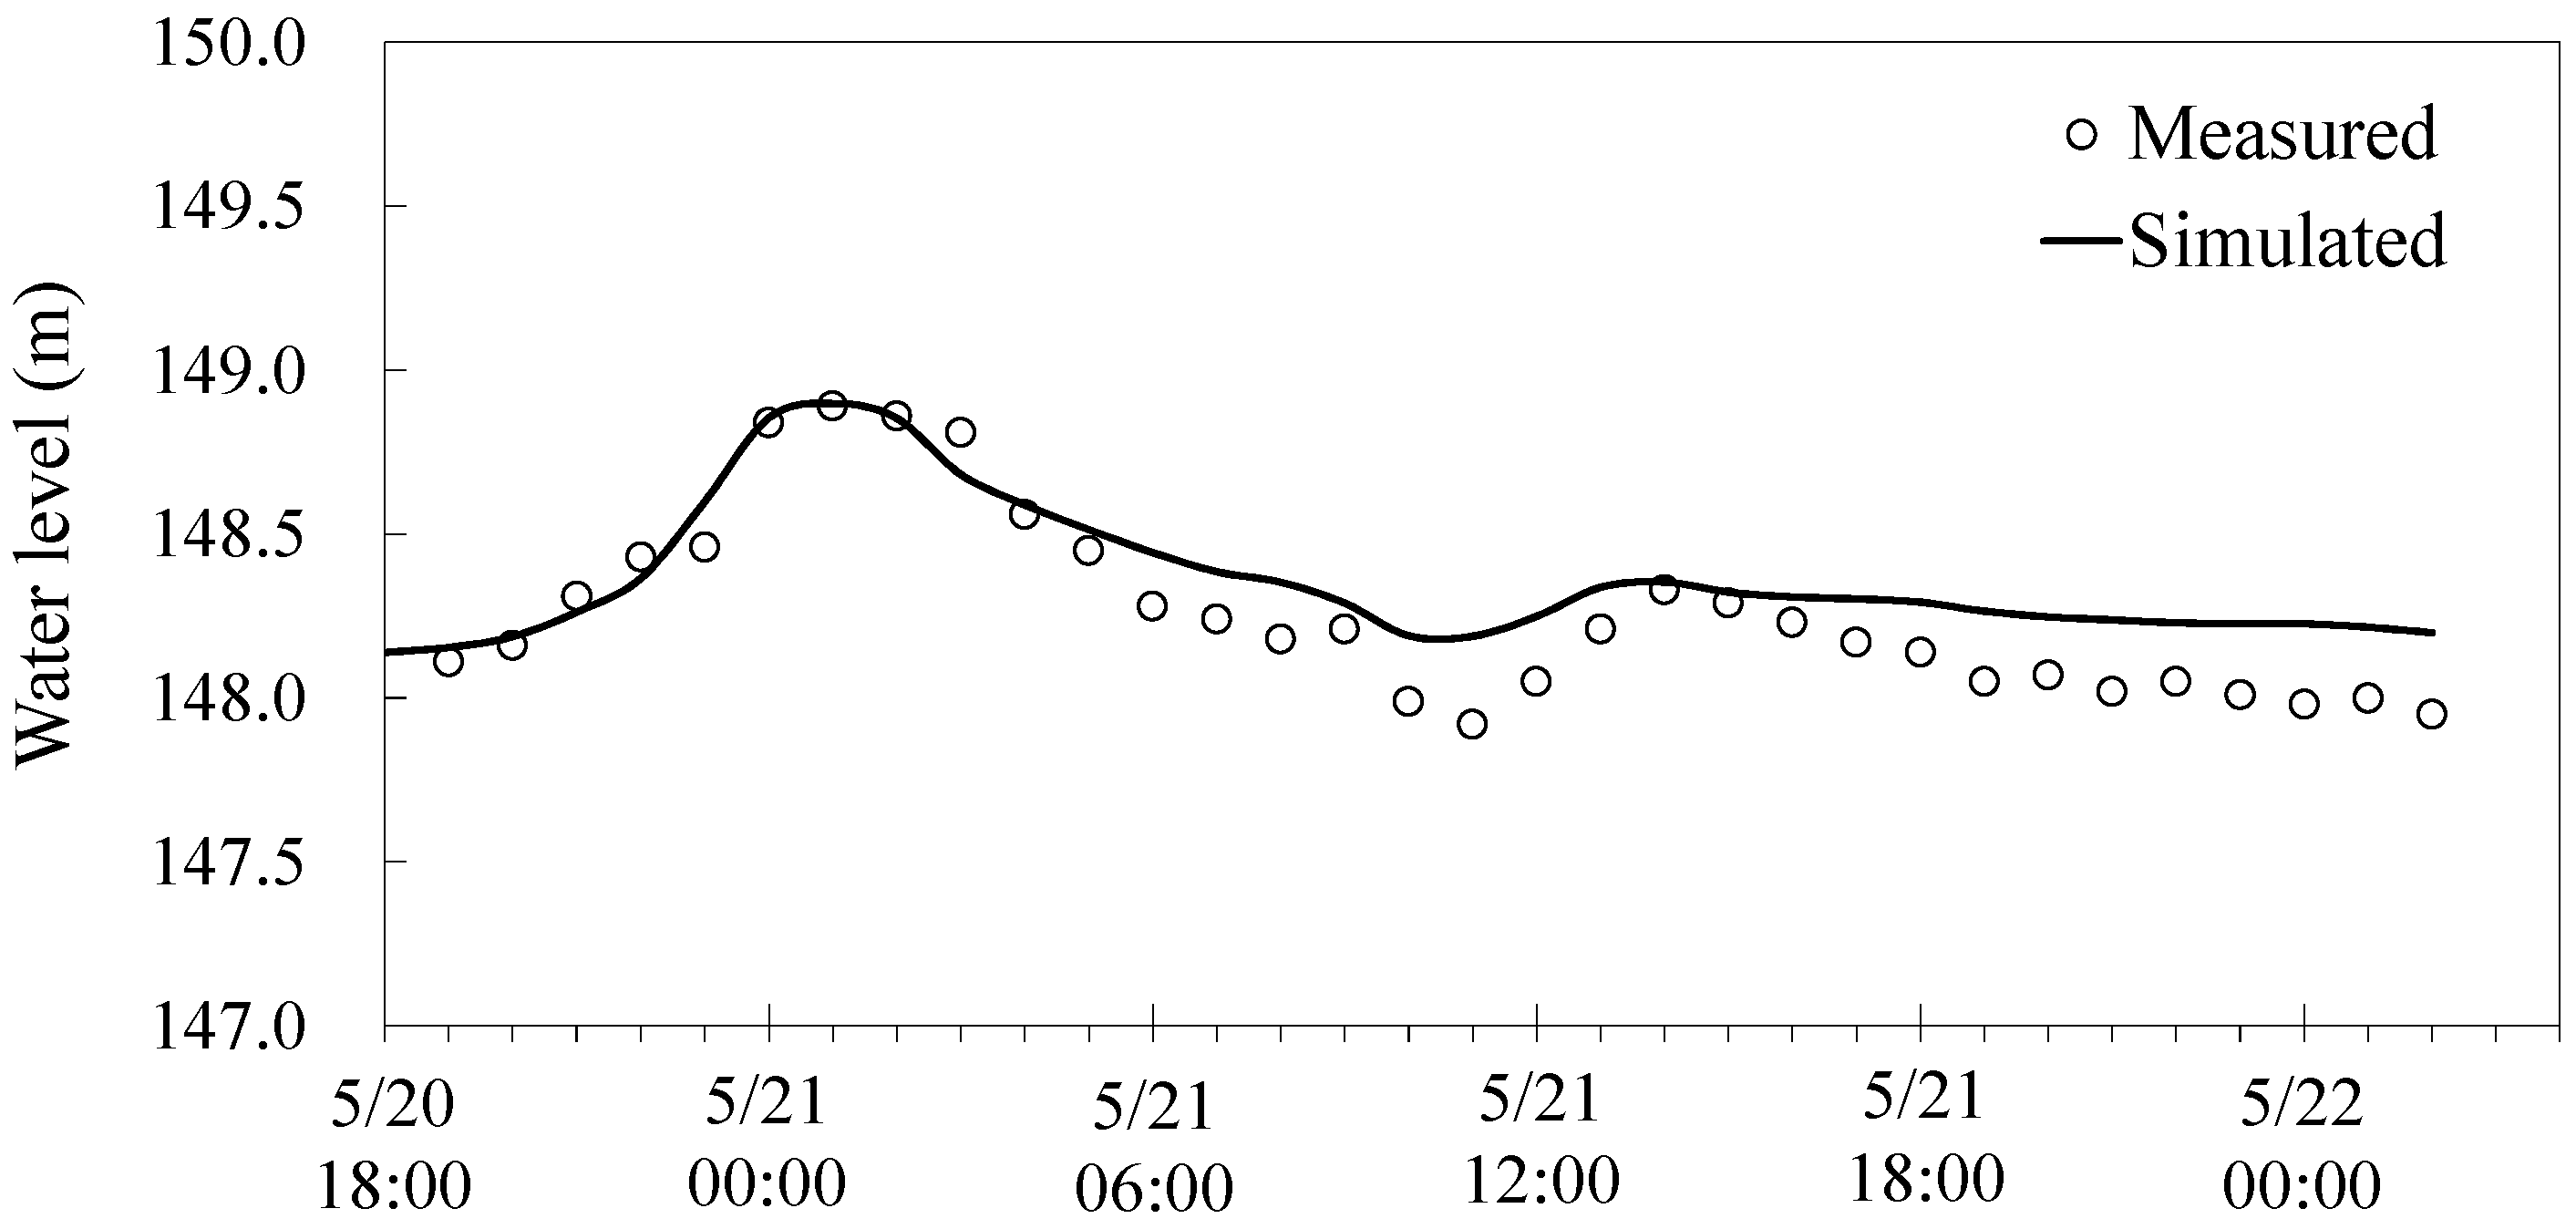
4.1. Verification of Finite-Volume Hydraulic Model

The flow hydraulics needs to be estimated accurately before the bridge pier scour simulation. Therefore, the model verification was presented herein. Figure 11 shows the simulation domain and bed elevation of the study reach, showing a significant channel bend and irregular bed variations ranging from 114 m to 210 m above sea level. The Mingchu gauging station, located between Pier 3 and Pier 4, provides the field-measured water level data required for Manning roughness coefficient calibration and model verification. The study reach, as shown in Figure 11, is about 9 km long between cross-section 117 (as the upstream inflow boundary) and cross-section 95 (as the downstream outflow boundary). To achieve better resolution for the numerical simulation, the LiDAR bed-elevation data (0.5 m × 0.5 m) are used to describe bed-elevation variations between cross-section 107 and cross-section 104. Two flood events induced by Monsoon (in May, 2014) and Typhoon Matmo (in July, 2014) are simulated. For the upstream inflow boundary conditions of both simulations, the flow discharge hydrographs, as shown in Figure 7, are used. The time step is set to be 0.5 s. To calibrate the Manning roughness coefficient, the measured data of the Monsoon event are used to adjust the value of the Manning roughness coefficient until a reasonable match is obtained between the measured and simulated water-level hydrographs. The best fit was for a Manning roughness value of 0.025. This value is then used to simulate Typhoon Matmo for model verification. Figure 12 shows the comparison of the measured water levels with the simulated results at the Mingchu gauging station. The result indicates that the proposed model can simulate the water level reasonably well, particularly around the peak flow. For Typhoon Matmo, the Manning roughness coefficient is given by the calibrated result in the Monsoon event. Figure 13 shows that the simulated data after 20:00 on 7/23 significantly deviate from the measured data. This may be due to the assumption that the flow is calculated by assuming a “fixed” bed at each time step. However, Figure 13 shows a good match between the simulated peak value of water level and measured data. Moreover, the finite-volume hydraulic model combined with two scour depth computation algorithms achieved good agreement between the simulated scour depths with the measured data (see next Section 4.2 and Table 3). Therefore, the adopted assumption of “fixed” bed may not affect the simulation results (scour depths) significantly, particularly at the peaked flow condition.
To evaluate the model performance quantitatively, two criteria, Eηp and ETp are used herein. The peak water level error Eηp is defined as follows:
E η p ( % ) = | η p s i m η p m e a | η p m e a × 100
in which η p s i m and η p m e a are the simulated and measured peak water levels, respectively. The error of time to peak water level ETp is defined as:
E T p = T p s i m T p m e a
where T p s i m and T p m e a denote the simulated and measured time to peak water level, respectively.
Table 2 summarizes the results at the Mingchu gauging station for two flood events. From the results of ETp value, the proposed model presents good solutions in capturing the time to peak water level. The peak water level errors, Eηp indicate that the proposed model performs good solutions near the peak flow. Figure 14a,b present the simulated results under peak-flood condition, showing the velocity contours for the Monsoon and Typhoon Matmo, respectively. Comparing to the flood event of the Monsoon, the value of the simulated velocity during Typhoon Matmo is higher. The results also show that the velocity in the braided channel can be reasonable simulated. In addition, the proposed model is capable of resolving the flow hydraulics in irregular bed topography.

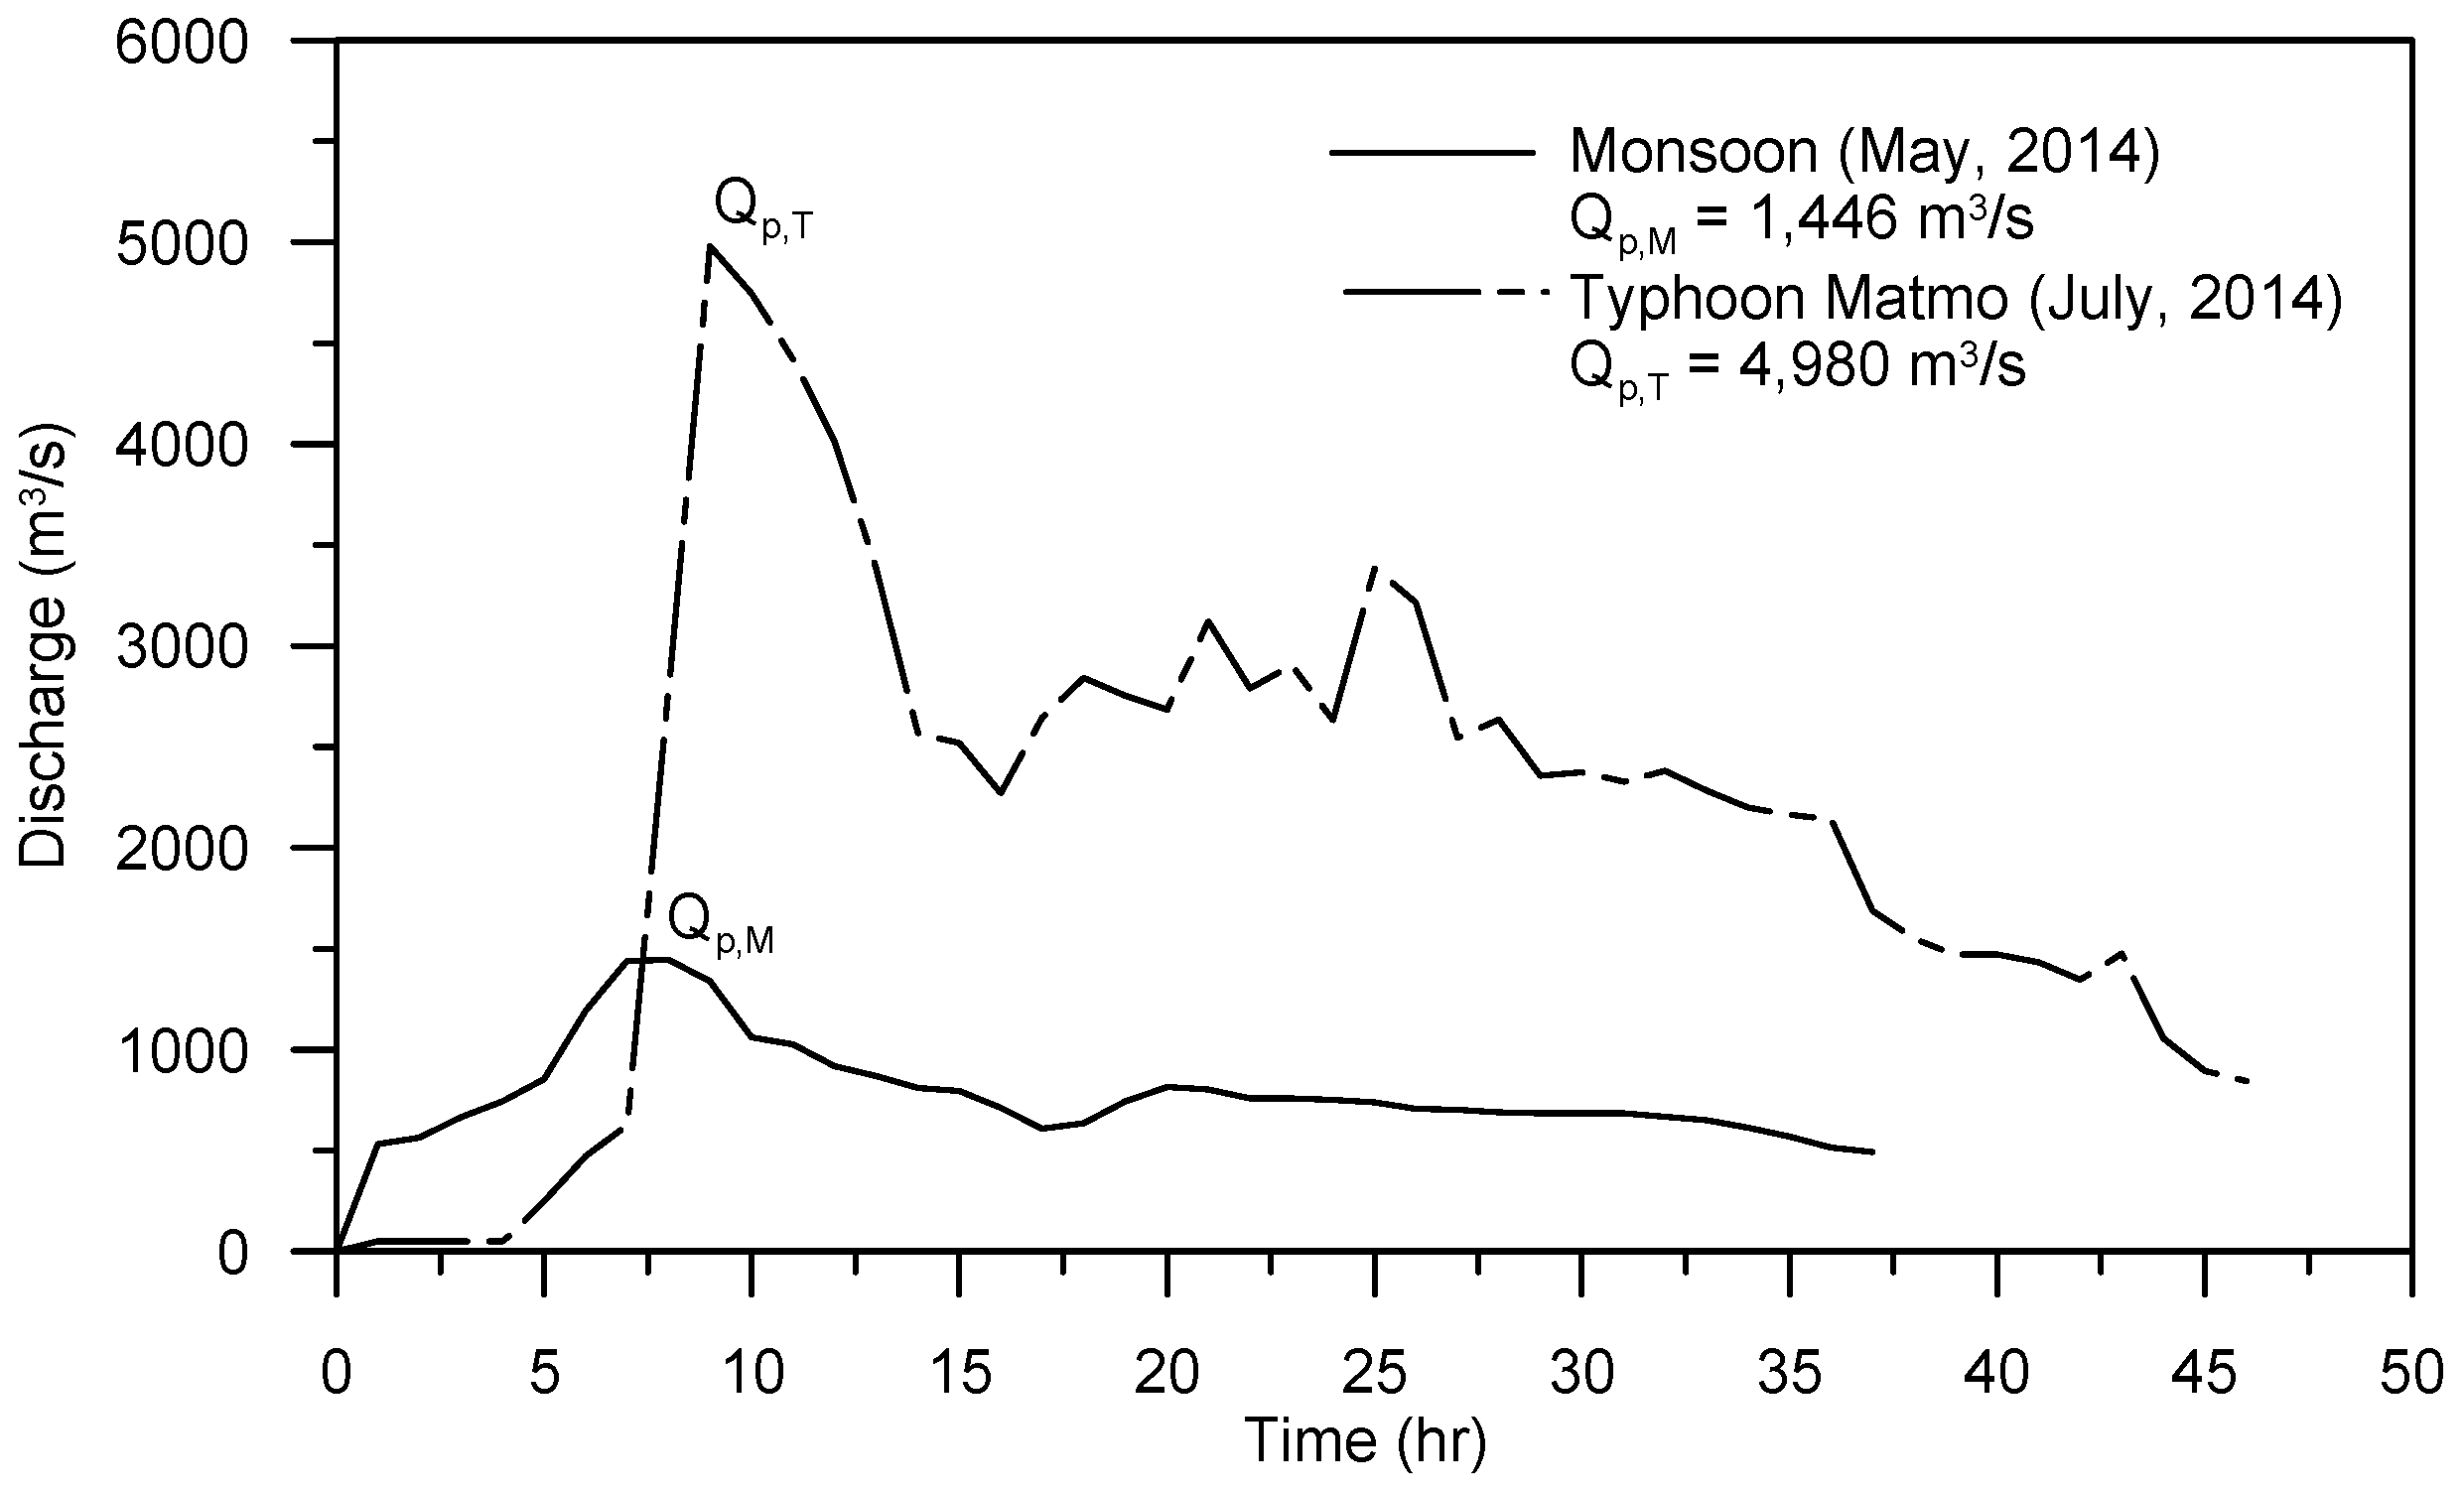
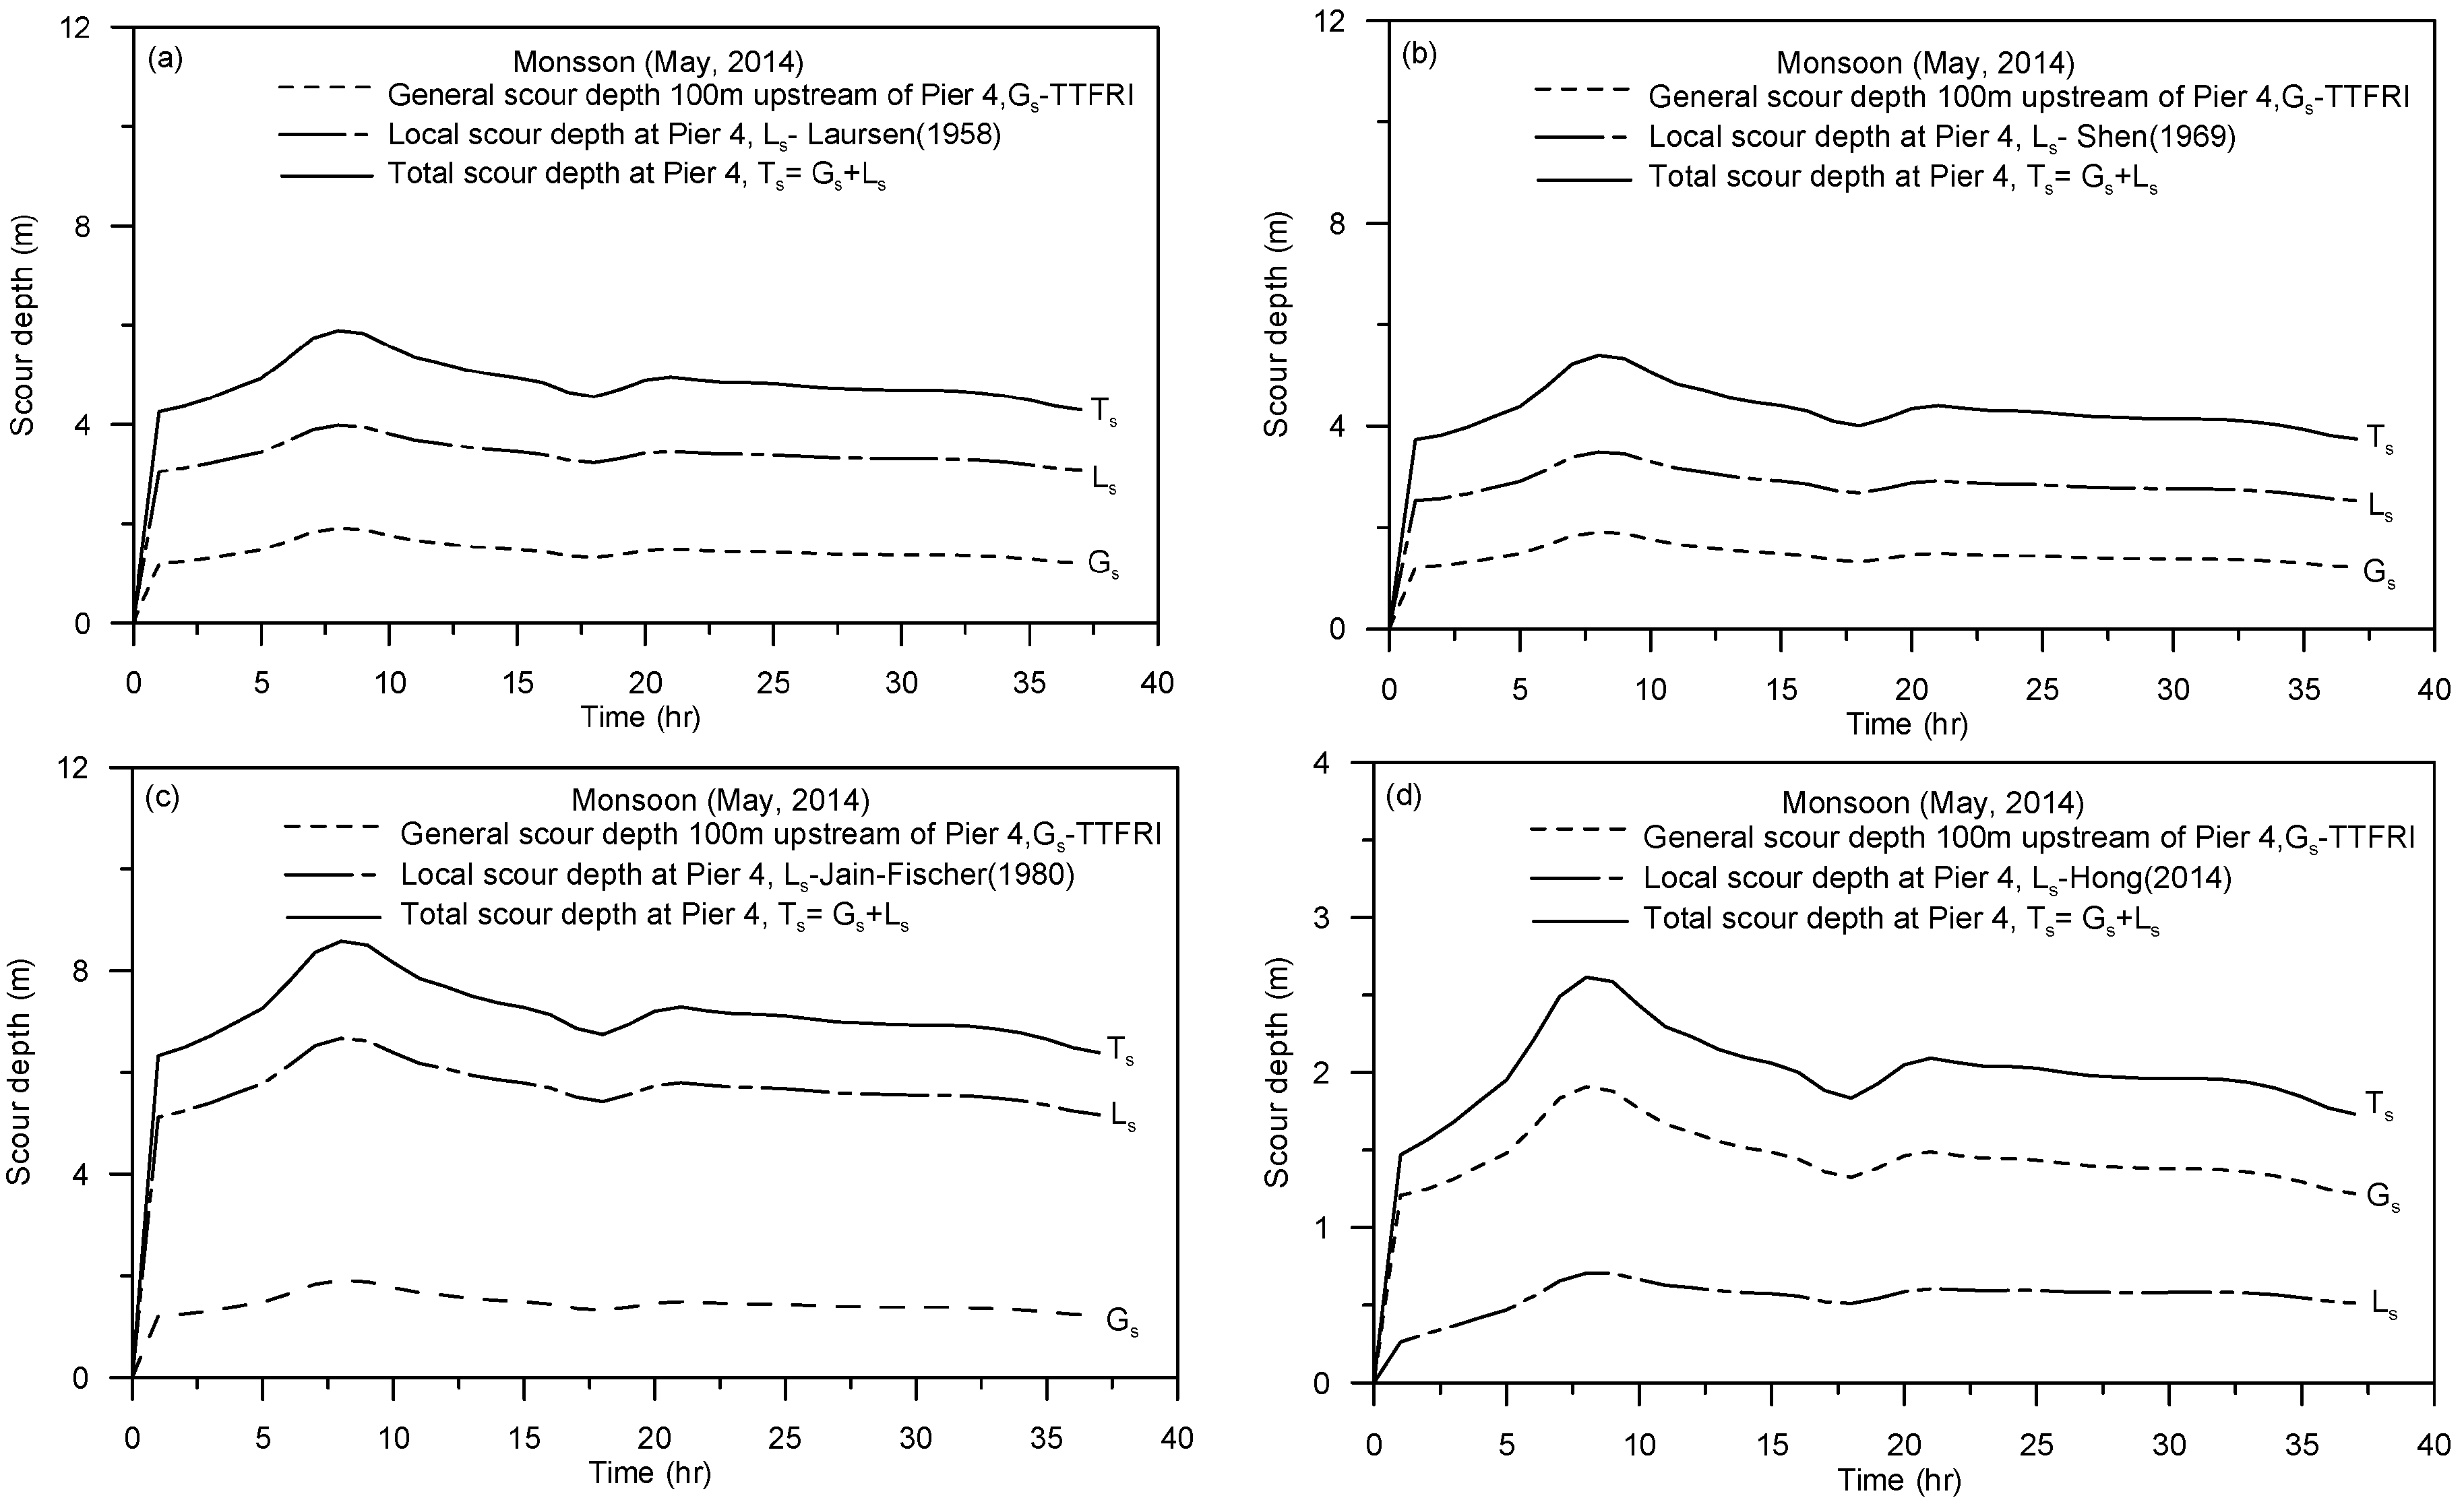
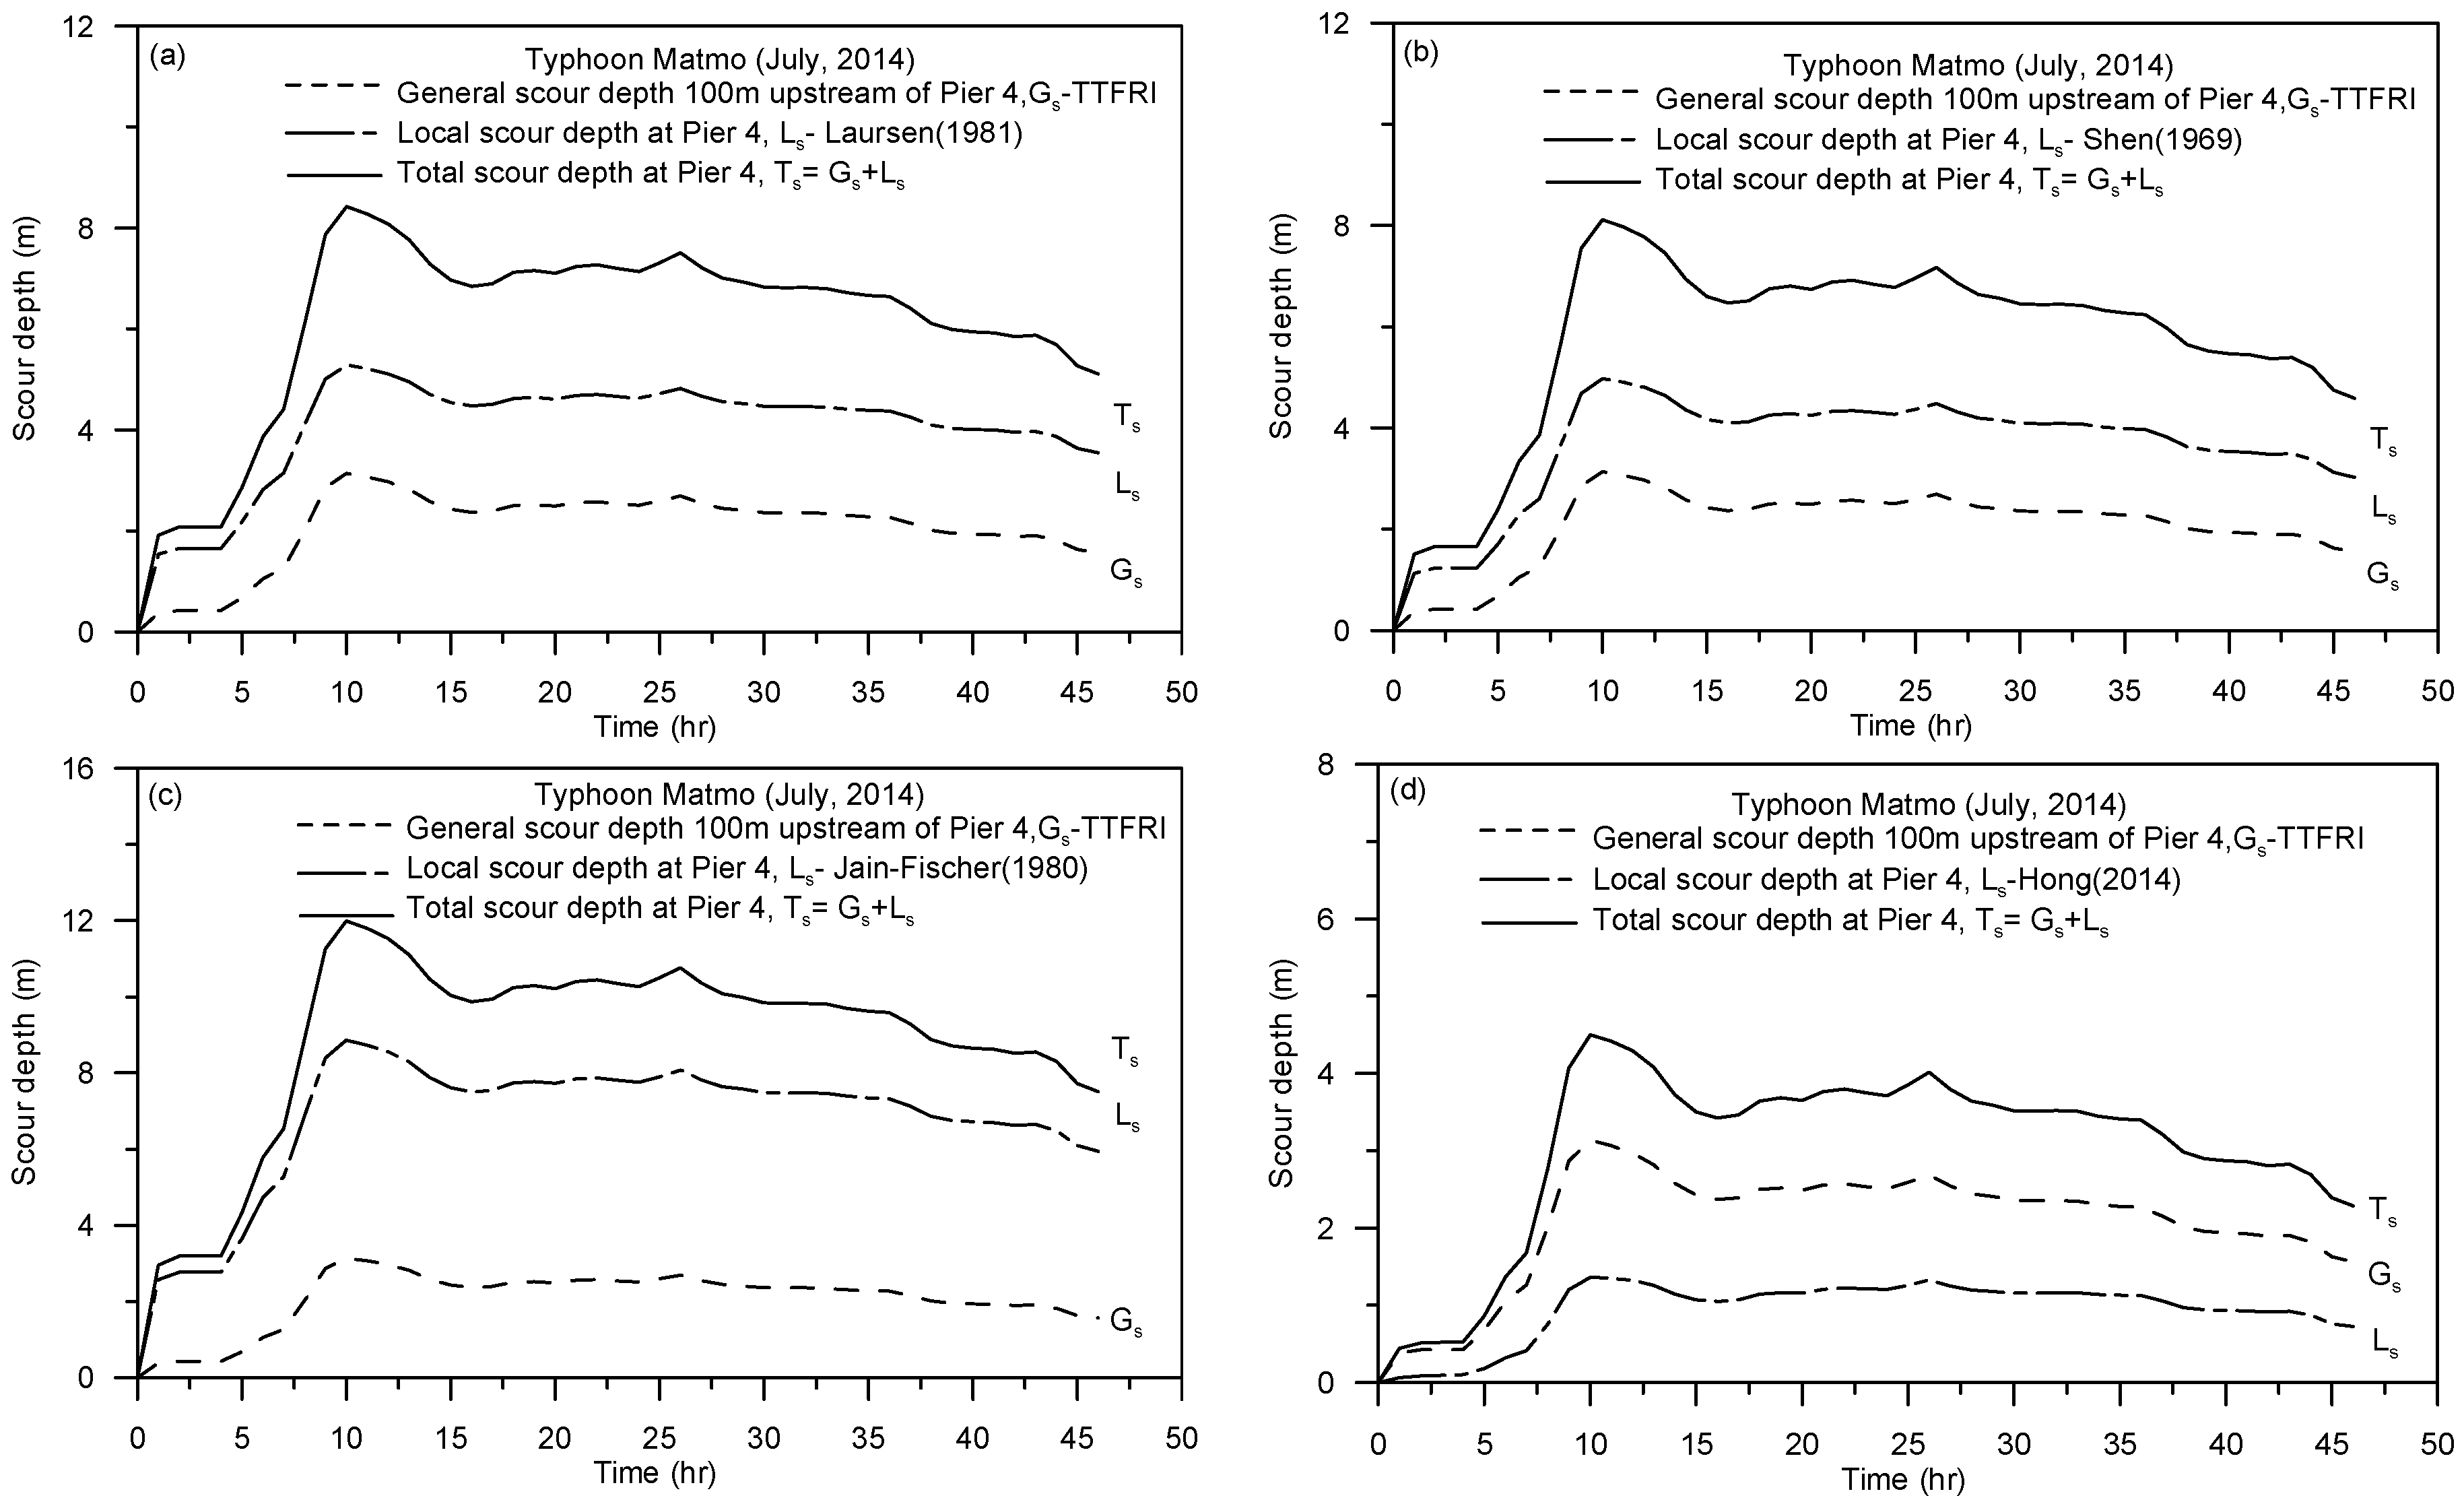
4.2. Simulations of Total Scour-Depth Evolution

After verifying the accuracy of the finite-volume hydraulic model, the total scour depth is determined by independently evaluating the general scour and local pier-scour depths (i.e., the total scour depth Ts is the sum of the general scour Gs and local pier-scour depths Ls). To compare the local pier-scour depth with the estimated depths by using different formulas, the measured local pier-scour depth was first calculated by subtracting the measured total scour depth at Pier 4 from the general scour depth. Following the proposed method shown in Figure 10, the general scour depth was calculated by using Equation (5), whereas the local pier-scour depth was evaluated using Equations (13)~(15). Numerous equations have already been derived for estimation of the maximum pier scour depth (see Gaudio et al. [27] and Gaudio et al. [28]). In the present study, four formulas (Laursen [29], Shen et al. [30], Jain and Fischer [31] and Hong et al. [15]) were selected for comparison.
Figure 15 and Figure 16 show the simulated results of the evolutions of the general scour, local pier-scour, and total scour depths at the Mingchu Bridge during Monsoon (May, 2014) and Typhoon Matmo (July, 2014), respectively. In general, all four methods show a similar trend and that the maximum scour depths occur around the peak flow. However, the simulated pier-scour depths are somewhat different, with that predicted using Jain and Fisher’s method [31] showing significantly higher value.
Table 3 shows a summary of the measured scour depths and simulated results using the proposed method associated with the two flood flows. The results show that the error percentages of the general scour depth simulated using the proposed method associated with Monsoon and Typhoon Matmo are 3.64% and −3.33%, respectively when compared with the measured values. Furthermore, the error percentages of the total scour depth associated with the flood events induced by Monsoon and Typhoon Matmo were 0.12% and 9.07%, respectively. The results show that use of the proposed method for estimating the general and total scour depths is reliable when compared with the measured data. Table 3 also shows that the ratio of the measured general scour depth to the measured total scour depth for the two flood events ranges from 70% to 79%, whereas that of the measured local pier-scour depth to the measured total scour depth from 30% to 21%. The data clearly reveal that the general scour depth accounted for most of the total scour depth, signifying that the measurement of the general scour depth are more critical than that of the pier-scour depth. In establishing a bridge scour safety warning system, information on the general scour under the approach flow condition may be required for predicting the evolutions of the total scour depth.

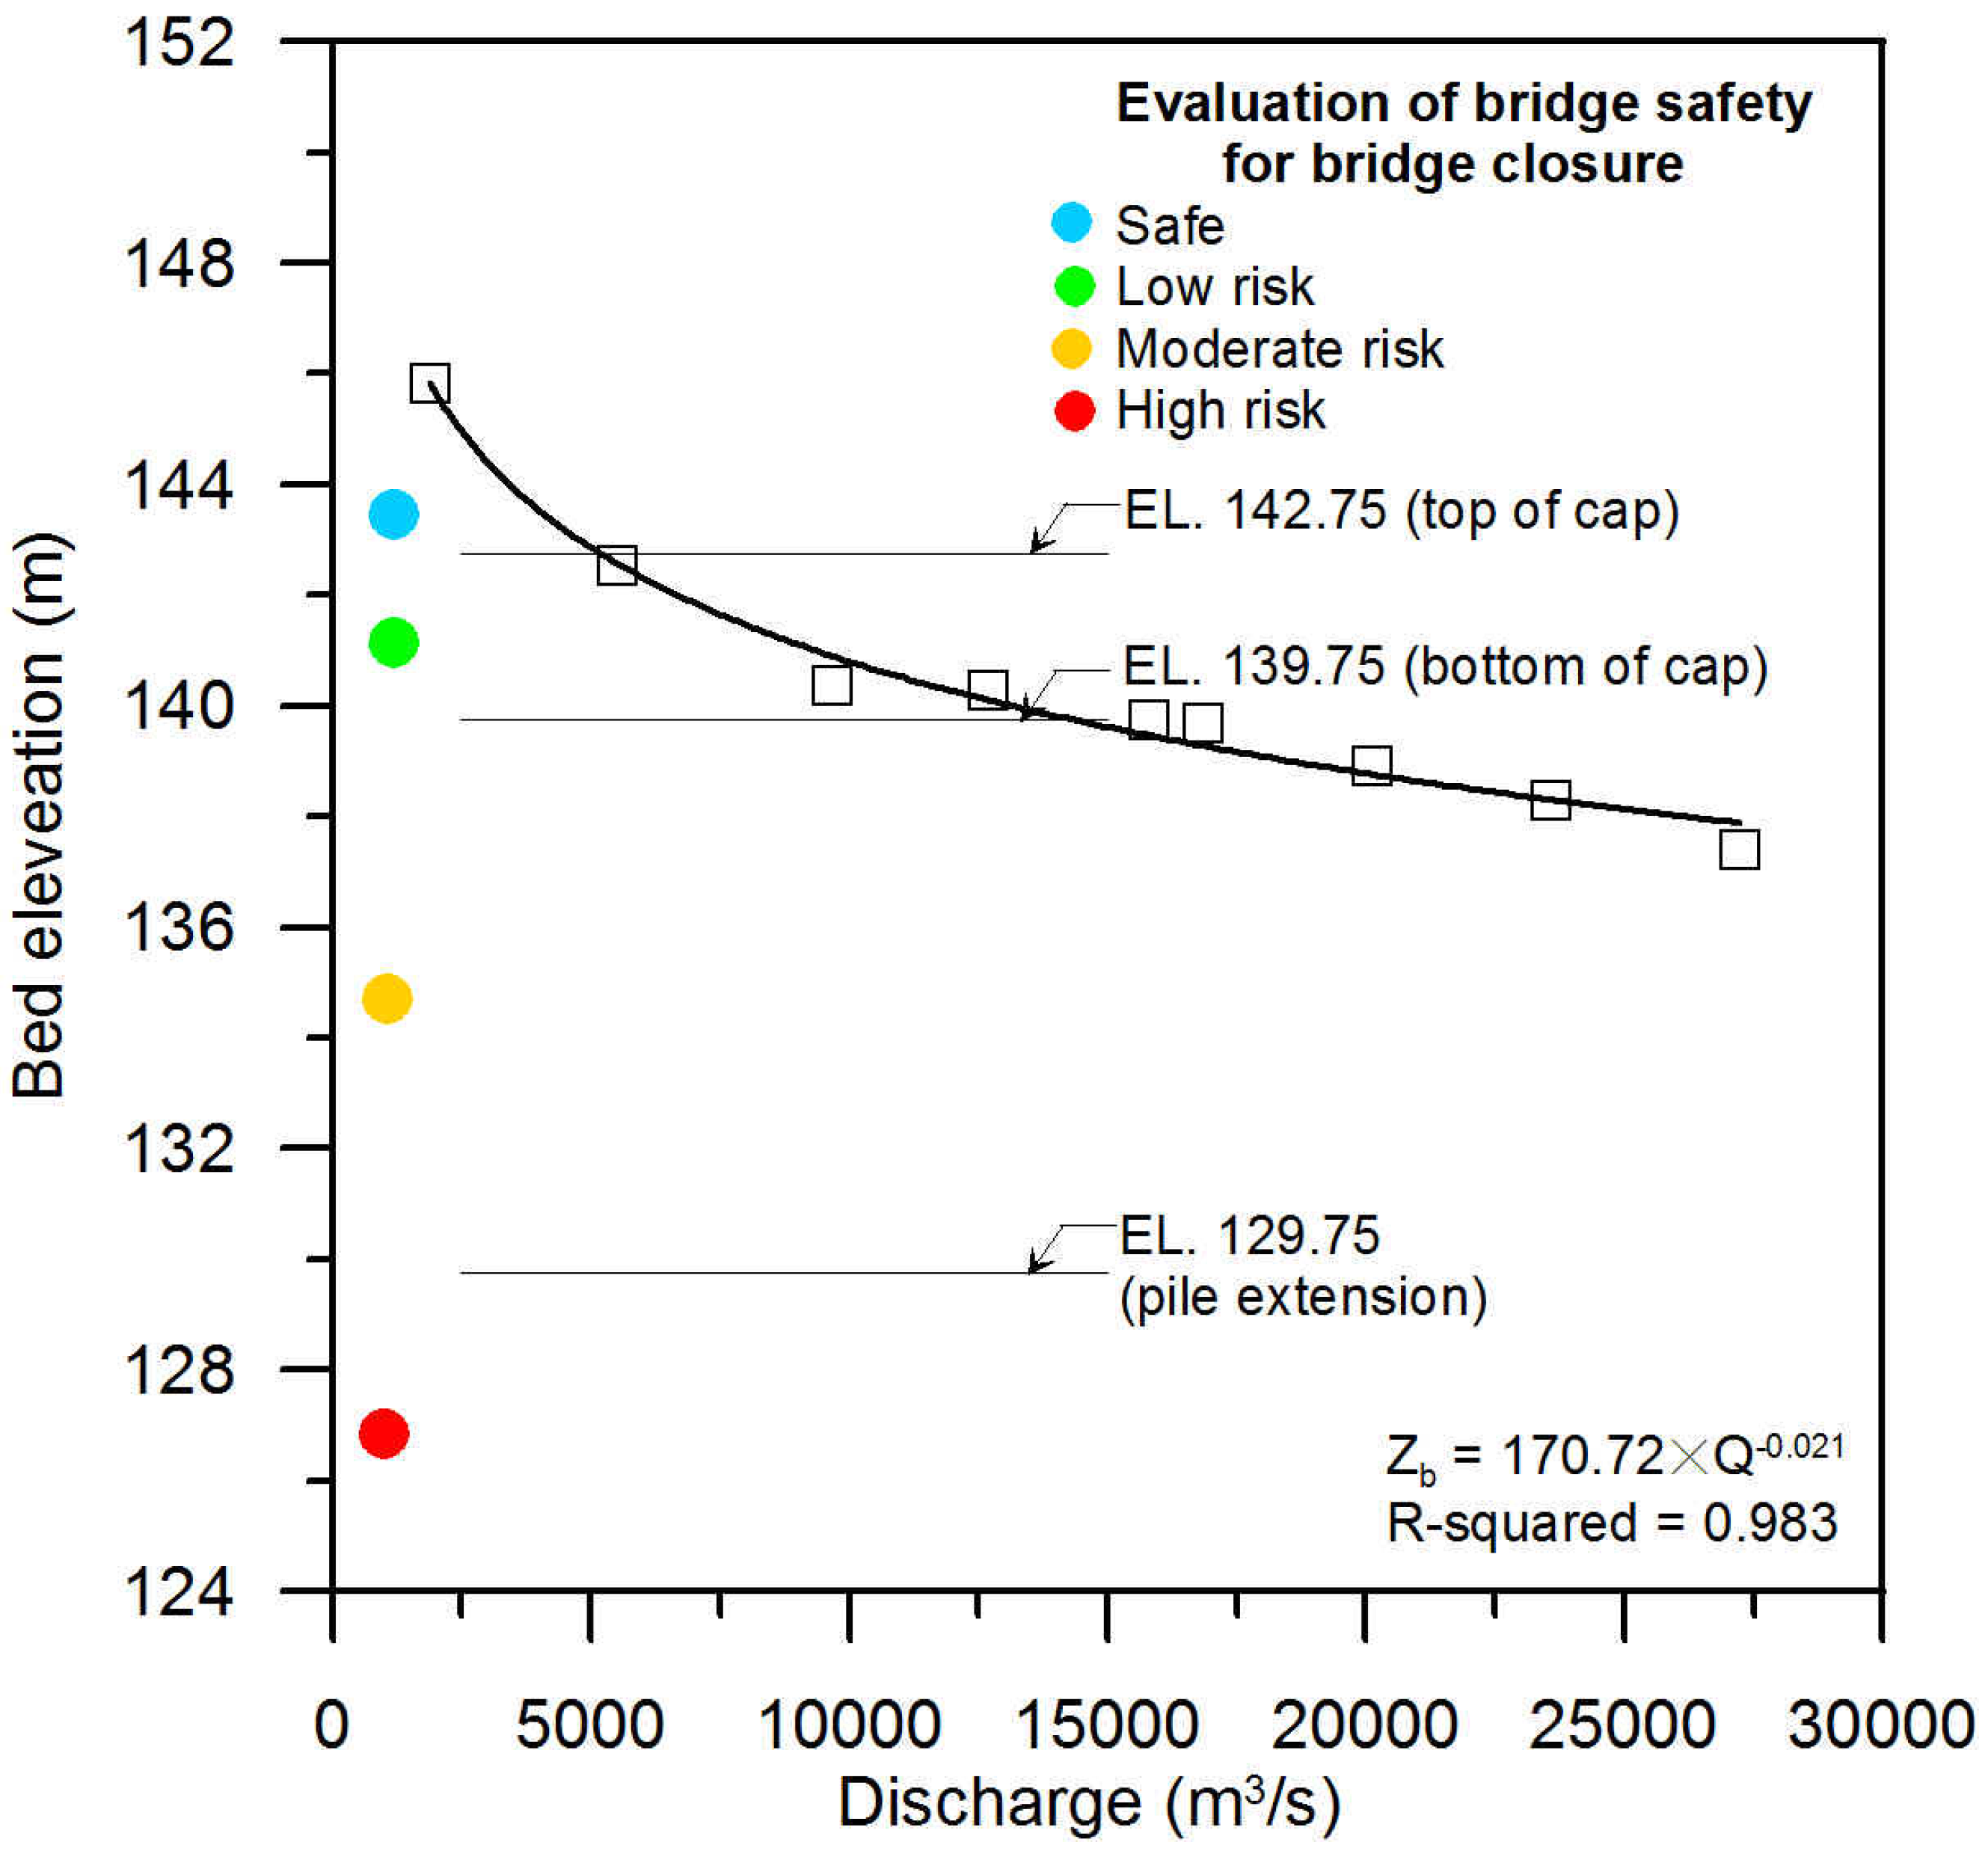
4.3. Scoured Bed Level-Discharge Relationship

During typhoon seasons in Taiwan, the bridge manager, viz., DGH will need to make a decision for bridge closure, customarily based on the discharge in the river. The premise of this practice is that a high discharge will lead to a deeper scour hole even though the precise relationship between flow depth and total scour depth at the pier generally is not known. By using the proposed method, this study attempts to provide a rational approach to evaluating the influence of discharge on the scoured bed level at the pier. Based on the initial bed level, the calculated total scour depth at the bridge pier is assumed to take place on the approach bed. The numerical experiments are then carried out to evaluate the relationship between the scoured bed level and the corresponding discharge around the Mingchu Bridge in Cho-Shui River in Taiwan. Nine different discharges with 1.11-, 2-, 5-, 10-, 20-, 25-, 50-, 100-, and 200-year return period floods were simulated. A statistical regression analysis is then used to develop the relationship between the scoured bed level with discharge. As shown in Figure 17, the scoured bed level (zb) is uniquely related to discharge (Q) and can be fitted to zb = 170.72Q−0.021 (R2 = 0.983), showing that zb decreases with an increase in the discharge. Using this equation, one can easily deduce the scour depth for a given flow discharge. To provide a reference of the scoured bed level at the Mingchu Bridge, three meaningful levels, namely the top and bottom levels of the pile cap (142.75 m and 139.75 m), and the level of the pile extension (129.75 m), also are superimposed in Figure 17. With these three reference levels, four bridge warning stages, namely safe, low risk, moderate risk and high risk, are identified. For instance, when discharge = 10,000 m3/s, the scoured bed level, zb = 170.72Q−0.021, yielding zb = 140.69 m. The computed scoured bed level lies between the top and bottom levels of the pile cap, which constitutes the “low risk” condition. It is to be noted that for a complex foundation shape as shown in Figure 6b a more accurate prediction of scour depth may be obtained through the methods presented in Ferraro et al. [32]. In summary, the proposed bridge safety curve (Figure 17) enables DGH to make a rational decision on bridge closure during typhoon seasons based solely on the value of discharge because a determinate relationship between discharge and scour has been established.

5. Conclusions

This study involves performing field measurements to investigate the scouring process associated with short-term general and total scour depths at a cross-river bridge in an incised river reach. To simulate the evolution of the total scour depth, a new reliable method, which incorporates a 2D finite-volume hydraulic model, a general-scour computation equation and a local-scour computation algorithm was proposed for a comprehensive analysis of the flow, general, local and total scouring around bridge piers. The following conclusions are drawn from the results obtained in this study:
  • The “numbered-brick” method is a useful tool for measuring the total scour and general scour depth, especially for ephemeral/intermittent rivers even though it only can provide the maximum scour depth after a flood event. However, it should be noted that the stability of the pier may be threatened by digging around the pier foundation to place the bricks. To this end, extreme care must be taken when digging around the pier foundation. A dimensionless formula was established for calculating the general scour depth using the measured field data and based on the unit width peak flow discharge, sediment particle size and standard deviation of the particle size distribution. The dimensionless general scour formula gives a reasonably good prediction compared with the field data. The formula may be used for the assessment of general scour under a design flood with certain return period, and this information may be further used for the design of protection for bridge piers or the toe of levees.
  • For practical engineering practices, the total scour depth at a bridge pier may be the sum of the general scour, contraction scour and local-pier scour depth. When the contraction scour is ignored, the total scour is then the sum of general scour and local scour. The percentage of flood induced short-term general scour is found to increase (percentage of local scour decreases) with the flow discharge. It may therefore be inferred that for high flow conditions, the contribution of general scour to the total scour is more important, thus rendering a careful monitoring of the evolution of general scour to be essential.
  • For simulating the total scour evolution, this study proposed a straight-forward and accurate estimation method. The accuracy of the proposed method is verified from both short-term general scour and total pier-scour depth collected from field measurements. The satisfactory simulated results show that the method can be successfully used to evaluate the development of the total pier-scour depth. In future studies, this method can be coupled with hydro-meteorological modeling for bridge scour forecasting, which can be applied to a real-time bridge scour warning system. This development will provide bridge owners with a superior method to estimate the scoured bed level towards a rational approach for bridge closure decision with a higher level of confidence.

Acknowledgments

The authors would like to thank Fourth River Management Office, Water Resources Agency, Ministry of Economic Affairs for providing the flow discharge hydrographs at Chi-Chi Weir of Cho-Shui River.

Author Contributions

Jian-Hao Hong and Wen-Dar Guo performed the model construction, validated the model performance and wrote the paper. Yee-Meng Chiew gave technical and conceptual advice. Cheng-Hsin Chen collected and analyzed data. All authors commented on the paper and modified the manuscript at all stages.

Conflicts of Interest

The authors declare no conflict of interest.

References

  1. Shirhole, A.M.; Holt, R.C. Planning for a comprehensive bridge safety assurance program. Transp. Res. Rec. 1991, 1290, 137–142. [Google Scholar]
  2. Hong, J.H.; Chiew, Y.M.; Lu, J.Y.; Lai, J.S.; Lin, Y.B. Case study: Houfong Bridge failure in Taiwan. J. Hydraul. Eng. 2012, 138, 186–199. [Google Scholar] [CrossRef]
  3. Lu, J.Y.; Hong, J.H.; Su, C.C.; Wang, C.Y.; Lai, J.S. Field measurements and simulation of bridge scour depth variations during floods. J. Hydraul. Eng. 2008, 134, 810–821. [Google Scholar] [CrossRef]
  4. Lu, J.Y. Experimental Study of Sediment Transport Relationships for the Lower Cho-Shui River after the 921 Chi-Chi Earthquake (2/2); Water Resources Planning Institute, Water Resources Agency, Ministry of Economic Affairs: Taichung, Taiwan, 2007. (In Chinese)
  5. Dodaro, G.; Tafarojnoruz, A.; Stefanucci, F.; Adduce, C.; Calomino, F.; Gaudio, R.; Sciortino, G. An experimental and numerical study on the spatial and temporal evolution of a scour hole downstream of a rigid bed. In Proceedings of the International Conference on Fluvial Hydraulics, River Flow, Lausanne, Switzerland, 3–5 September 2014; pp. 1415–1422.
  6. Yen, C.L.; Lai, J.S.; Chang, W.Y. Modeling of 3D flow and scouring around circular piers. Proc. Natl. Sci. Counc. A Phys. Sci. Eng. 2001, 25, 17–26. [Google Scholar]
  7. Nagata, N.; Hosoda, T.; Nakato, T.; Muramoto, Y. Three-dimensional numerical model for flow and bed deformation around river hydraulic structures. J. Hydraul. Eng. 2005, 131, 1074–1087. [Google Scholar] [CrossRef]
  8. Roulund, A.; Sumer, B.M.; Fredsoe, J.; Michelsen, J. Numerical and experimental investigation of flow and scour around a circular pile. J. Fluid Mech. 2005, 534, 351–401. [Google Scholar] [CrossRef]
  9. Guo, W.D.; Hong, J.H.; Lee, F.Z.; Lai, J.S. Bridge scour prediction using 2D hydraulic model with empirical equations—A case study of Shuangyuan Bridge piers on the Kao-Ping River. In Proceedings of the 6th World Conference on Structural Control and Monitoring, Barcelona, Spain, 15–17 July 2014.
  10. Pagliara, S.; Carnacina, I. Temporal scour evolution at bridge piers: Effect of wood debris roughness and porosity. J. Hydraul. Res. 2010, 48, 3–13. [Google Scholar] [CrossRef]
  11. Pagliara, S.; Carnacina, I. Influence of wood debris accumulation on bridge pier scour. J. Hydraul. Eng. 2011, 137, 254–261. [Google Scholar] [CrossRef]
  12. Su, C.C.; Lu, J.Y. Measurements and prediction of typhoon-induced short-term general scours in intermittent rivers. Nat. Hazards 2013, 66, 671–687. [Google Scholar] [CrossRef]
  13. Melville, B.W.; Coleman, S.E. Bridge Scour; Water Resources Publications: Highlands Ranch, CO, USA, 2000. [Google Scholar]
  14. Richardson, E.V.; Davis, S.R. Evaluating Scour at Bridges, 3rd ed.Rep. No. FHWA-IP-90-17, Hydraulic Engineering Circular No. 18 (HEC-18); U.S. Department of Transportation: Washington, DC, USA, 1995.
  15. Hong, J.H.; Chiew, Y.M.; Yeh, P.H. Comparisons of time-dependent pier-scour models under unsteady flow conditions. In Proceedings of the 7th International Scour and Erosion Conference, Perth, Australia, 2–4 December 2014.
  16. Lai, J.S.; Guo, W.D.; Lin, G.F.; Tan, Y.C. A well-balanced upstream flux-splitting finite-volume scheme for shallow-water flow simulations with irregular bed topography. Int. J. Numer. Methods Fluids 2010, 62, 927–944. [Google Scholar] [CrossRef]
  17. Guo, W.D.; Lai, J.S.; Lin, G.F.; Lee, F.Z.; Tan, Y.C. Finite volume multi-stage scheme for advection-diffusion modeling in shallow water flow. J. Mech. 2011, 27, 415–430. [Google Scholar] [CrossRef]
  18. Guo, W.D.; Yang, T.H.; Chang, Y.C.; Shih, D.S.; Chen, C.H.; Ho, J.Y.; Lee, K.T.; Lin, G.F.; Hsiao, L.F.; Lee, C.S. Real-time scour depth predicting system based on ensemble quantitative precipitation forecast. In Proceedings of the 35th IAHR World Congress, Chengdu, China, 8–13 September 2013.
  19. Shen, H.W.; Schneider, V.R.; Karaki, S.S. Mechanics of Local Scour; Pub. No. CER66-HWS22; Colorado State University, Civil Engineering Department: Fort Collins, CO, USA, 1966. [Google Scholar]
  20. Hjorth, P. A Stochastic model of progressive scour. In Proceedings of the International Symposium on Stochastic Hydraulics, University of Lund, Lund, Sweden, 2–4 August 1977.
  21. Yanmaz, A.M.; Altinbilek, H.D. Study of time-dependent local scour around bridge piers. J. Hydraul. Eng. 1991, 117, 1247–1268. [Google Scholar] [CrossRef]
  22. Kothyari, U.C.; Garde, R.J.; Ranga, R.K.G. Temporal variation of scour around circular bridge piers. J. Hydraul. Eng. 1992, 118, 1091–1106. [Google Scholar] [CrossRef]
  23. Melville, B.W.; Chiew, Y.M. Time scale for local scour at bridge piers. J. Hydraul. Eng. 1999, 125, 59–65. [Google Scholar] [CrossRef]
  24. Mia, M.F.; Nago, H. Design model of time-dependent local scour at circular bridge pier. J. Hydraul. Eng. 2003, 129, 420–427. [Google Scholar] [CrossRef]
  25. Chang, W.Y.; Lai, J.S.; Yen, C.L. Evolution of scour depth at circular bridge piers. J. Hydraul. Eng. 2004, 130, 905–913. [Google Scholar] [CrossRef]
  26. Oliveto, G.; Hager, W.H. Further results to time-dependent local scour at bridge elements. J. Hydraul. Eng. 2005, 131, 97–105. [Google Scholar] [CrossRef]
  27. Gaudio, R.; Grimaldi, C.; Tafarojnoruz, A.; Calomino, F. Comparison of formulae for the prediction of scour depth at piers. In Proceedings of the First European IAHR Congress, Edinburgh, UK, 4–6 May 2010; p. 6.
  28. Gaudio, R.; Tafarojnoruz, A.; de Bartolo, S. Sensitivity analysis of bridge pier scour depth predictive formulae. J. Hydroinform. 2013, 15, 939–951. [Google Scholar] [CrossRef]
  29. Laursen, E.M. Scour at Bridge Crossings; Bulletin No. 8; Iowa Highway Research Board: Ames, IA, USA, 1958. [Google Scholar]
  30. Shen, H.W.; Schneider, V.R.; Karaki, S.S. Local scour around bridge piers. J. Hydraul. Div. 1969, 95, 1919–1940. [Google Scholar]
  31. Jain, S.C.; Fischer, E.E. Scour around Bridge Piers at High Froude Numbers; Report No. FH-WA-RD-79–104; Federal Highway Administration, U.S. Department of Transportation: Washington, DC, USA, 1980.
  32. Ferraro, D.; Tafarojnoruz, A.; Gaudio, R.; Cardoso, A.H. Effects of pile cap thickness on the maximum scour depth at a complex pier. J. Hydraul. Eng. 2013, 139, 482–491. [Google Scholar] [CrossRef]
Figure 1. Map of Cho-Shui River basin in Taiwan, showing the location of the study.
Water 08 00238 g001
Figure 2. Variations of longitudinal riverbed profiles of Cho-Shui River near Mingchu Bridge.
Water 08 00238 g002
Figure 3. Cross section elevation of the Mingchu Bridge, looking downstream.
Water 08 00238 g003
Figure 4. The near field of Mingchu Bridge (a) looking downstream; (b) looking upstream, photos taken in May 2014.
Water 08 00238 g004
Figure 5. Size distribution of sediment particles around P4 of Mingchu Bridge.
Water 08 00238 g005
Figure 6. Schematic site plan of the Mingchu Bridge for the installation of numbered-brick columns (a) Plan view; (b) Site view.
Water 08 00238 g006
Figure 7. Flood hydrographs for Monsoon and Typhoon Matmo.
Water 08 00238 g007
Figure 8. Comparison of general scour depth between measured data and computed results.
Water 08 00238 g008
Figure 9. Schematic diagram of superposition for computing local pier-scour evolution under a stepwise hydrograph: (a) stepwise hydrograph; (b) evolution of scour depth.
Water 08 00238 g009
Figure 10. Flow chart of the proposed method for simulating total scour-depth evolution.
Water 08 00238 g010
Figure 11. Simulated domain and the corresponding bed elevation.
Water 08 00238 g011
Figure 12. Comparison of the measured water level and the simulated result at Mingchu gauging station during Monsoon (May, 2014).
Water 08 00238 g012
Figure 13. Comparison of the measured water level and the simulated result at Mingchu gauging station during Typhoon Matmo (July, 2014).
Water 08 00238 g013
Figure 14. Simulated velocity contours in the study reach under peak-flood condition for (a) Monsoon and (b) Typhoon Matmo.
Water 08 00238 g014aWater 08 00238 g014b
Figure 15. Simulated time variations of scour components during Monsoon (May, 2014).
Water 08 00238 g015
Figure 16. Simulated time variations of scour components during Typhoon Matmo (July, 2014).
Water 08 00238 g016
Figure 17. Bridge safety curve (scoured bed level-discharge relationship).
Water 08 00238 g017
Table 1. Field data collection for short-term general scour induced by floods.
RiverSiteFlood EventQp (m3/s)B (m)qp (m2/s)Sd50 (mm)Gs (m)Bed FeaturesRemark
Cho-Shui RiverMingchu Bridge1. Typhoon Dujuan (September 2003)21462478.690.01352.1Gravel bedLu et al. [3]
2. Typhoon Mindulle (July 2004)725027521.540.01356Lu et al. [3]
3. Typhoon Soulik (July 2013)728530024.280.00737.733.80Gravel/sand bedCurrent study
4. Monsoon (May 2014)1446148.59.740.005181.521.82Current study
5. Typhoon Matmo (July 2014)4980150.433.10.005181.523.25Current study
Silo Bridge6. Typhoon Dujuan (September 2003)22685064.480.00121.2Sand bedLu et al. [3]
7. Typhoon Mindulle (July 2004)805075810.620.00121.65Lu et al. [3]
Da-Chia RiverHoufeng Bridge8. Typhoon Sinlaku (September 2008)541023023.520.0111361.56Gravel bedSu and Lu [12]
Dachia Highway Bridge9. Typhoon Morakot (August 2009)422540010.560.011964.5Su and Lu [12]
Table 2. Comparisons of simulated water levels with measured results by using 2D finite-volume hydraulic model.
EventsTwo Criteria
Eηp (%)ETp (h)
Monsoon (May, 2014)0.00570
Typhoon Matmo (July, 2014)0.05211
Table 3. Summary of measured scour depths and simulated results for Monsoon and Typhoon Matmo.
VariablesMonsoon (May, 2014)Typhoon Matmo (July, 2014)
Qp (m3/s)14464980
MeasuredSimulatedError (%)MeasuredSimulatedError (%)
Gs (m)1.8151.8813.643.2453.137−3.33
LS (m)0.7700.707−8.180.8801.36254.77
Ts (m)2.5852.5880.124.1254.4999.07
Gs/Ts0.700.734.290.790.70−11.39
Ls/Ts0.300.2710.000.210.3042.86
Notes: Gs: General scour upstream of Mingchu Bridge; LS: Local pier-scour at the pier foundation of Mingchu Bridge; Ts: Total scour at the pier foundation of Mingchu Bridge.

