Article

Variations in the Runoff-Sediment Relationship of the Weihe River Basin Based on the Copula Function

State Key Laboratory Base of Eco-hydraulic Engineering in Arid Area, Xi’an University of Technology, Xi’an 710048, China
*
Author to whom correspondence should be addressed.
Water 2016, 8(6), 223; https://doi.org/10.3390/w8060223
Submission received: 26 January 2016 / Revised: 17 May 2016 / Accepted: 18 May 2016 / Published: 25 May 2016
(This article belongs to the Special Issue Tackling Complex Water Problems in China under Changing Environment)

Abstract

:
This study investigates the runoff-sediment relationship (RSR) of the Weihe River, a sandy waterway originating from the Loess Plateau, and considers the potential variations in RSR under an evolving environment. The double mass curve method was used to investigate RSR inflection points at six hydrologic stations located in the Weihe River basin (WRB) spanning the period from 1956 to 2010. Because of its ability to accurately define nonlinear and asymmetric correlations between variables, the Copula function provided the joint probability distributions and revealed the joint probabilities of annual runoff and sediment yield through different periods. The results indicated: (1) The sediment yield and runoff exhibit decreasing trends, which was principally related to human activity such as soil and water conservation measures, water projects and industrial and domestic water use, (2) the RSR inflection points principally occurred around 1983 at the Weijiabu, Xianyang, Huaxian and Zhuangtou stations, whereas they were non-significant at the Linjiacun and Zhangjiashan stations. Changes in RSR are attributed to the irregular effect of human activity reducing the runoff and sediment output; and (3) the joint probability distributions of annual runoff and sediment yield varied under an evolving environment and were characterized by spatial variability, which is more evident in the mainstream areas of the Weihe River than in the tributary regions.

1. Introduction

The Runoff-Sediment Relationship (RSR) relates to water and soil resource planning and management, the construction and operation of hydraulic infrastructures and the evolution of the watershed system [1,2,3]. In recent years, considerable research has been conducted on variations in runoff and sediment deposition throughout the globe [4,5]. For instance, Dunjó et al. (2004) [6] investigated the effect of land use and land cover on the variations of runoff and sediment yield at a micro level. Zhang et al. (2008) [7] applied the wavelet approach to analyze the periodicity of runoff and sediment load in the Yangtze River basin. Mayor et al. (2011) [8] established empirical relationships for runoff and sediment yields in different vegetation covers present in a semi-arid Mediterranean catchment. Gebremicael et al. (2013) [9] investigated long-term variations of runoff and sediment fluxes in the upper Blue Nile River. Nadal-Romero et al. (2015) [10] studied the correlation between runoff, sediment, weather change and soil erosion in small catchments and experimental land plots of the Iberian Peninsula. Tian et al. (2015) [11] detected the inflection point of runoff and sediment yield in the Beiluohe River basin and applied the linear regression method to decipher the runoff-sediment relationship during different periods of flooding. However, few studies investigated the long-term evolution rule of RSR in large basins and the synchronous-asynchronous joint probabilities of high-low runoff and sediment yield under the changing environment [12,13,14] which influence the coordinative distribution of water and sediment in sandy rivers.
The Copula function has been widely used in recent years to study the synchronous-asynchronous joint probabilities of hydrologic variables due to its ability to accurately predict nonlinear and asymmetric correlations and allow different marginal distributions [15,16,17]. Grimaldi and Serinaldi (2006) [18] used the asymmetric Copula function to investigate the correlation among peak, volume and duration of a flood event. Zhang and Singh (2007) [19] analyzed the trivariate flood frequency in the Amite River basin using the Gumbel-Hougaard Copula function. Yan and Chen (2013) [20] investigated the synchronous-asynchronous joint probabilities of high-low precipitation for the Middle Route of South-to-North Water transfer project in China. Mazouz et al. (2012) [21] analyzed the correlation of duration, timing, frequency and variability of maximum magnitude spring flows to detect any change related to climate warming.
The Weihe River flows from the Loess Plateau of Northern China and is the largest tributary of the Yellow River. This sandy river shows a complex RSR under changing environmental conditions. Furthermore, variations in water flow and sediment yield produced negative effects on its ecological development and flood control [11]. The principal objectives of this paper are to (1) explore the trends of annual runoff and sediment; (2) detect the inflection point(s) in the RSR; and (3) analyze the synchronous-asynchronous joint probabilities of high-low runoff and sediment yield above and below the RSR inflection point(s).

2. Study Area and Dataset
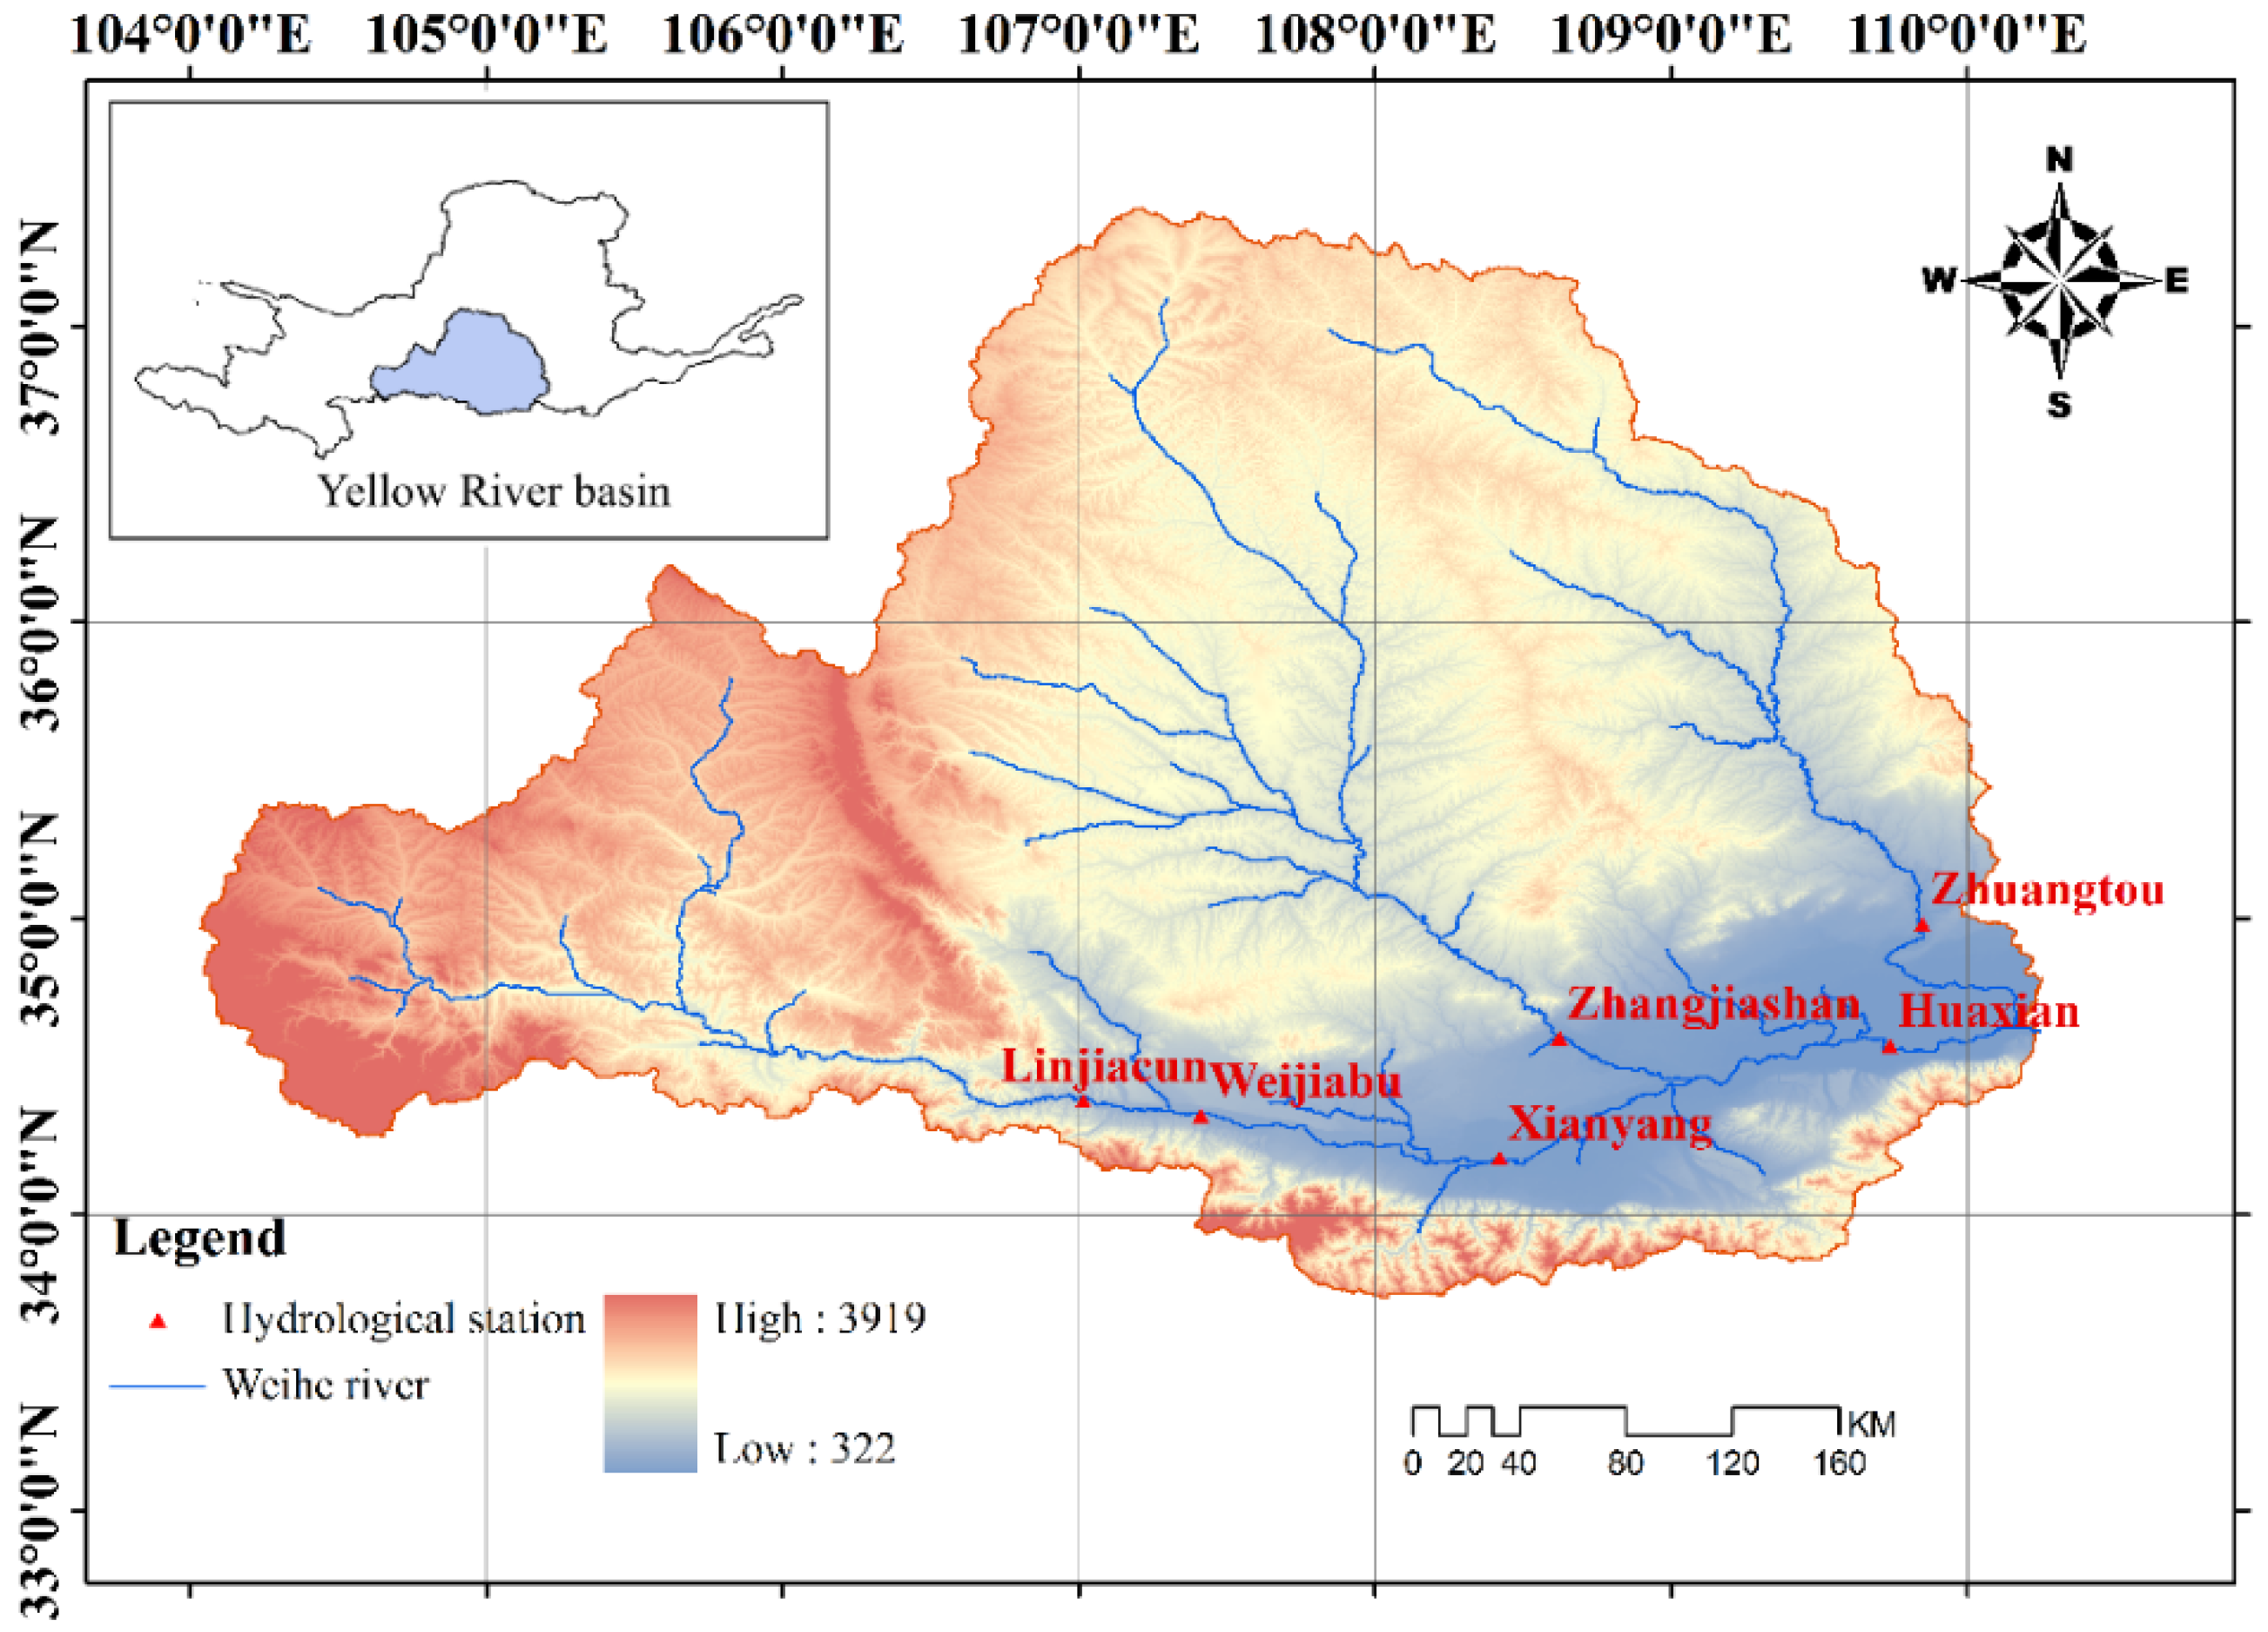
2.1. Study Area

The Weihe River (104–110° E, 33–37° N) is 818 km long with a drainage area of 134,800 km2. It is a seasonal sandy river located in a semi-humid to semi-arid transitional climatic zone (Figure 1). Mountainous and plain areas constitute 84% and 16% of the total WRB, respectively. In 2005, the cultivated and forest land areas reached 38.15 and 39.60 thousand km2, respectively. The Weihe River originates from the mountains of the southern Gansu Province and flows through 502 km of the Shaanxi Province. It is the primary water supply for 0.93 million hm2 of fertile land in the Guanzhong Plain and supports more than 61% of the Shaanxi province’s population. The south bank of Weihe River lies in the granitic area of the northern Qinling Mountains slope and is one of the three main sources of flooding in the mid-lower reaches of the Yellow River. The main lithology is granite in this region. The north bank is located in the hilly area of Loess Plateau dominated by shales. The loose soil and poor vegetal cover makes the Loess Plateau the primary sediment source of the Weihe and Yellow River basins. Deep loess blankets most sections of the WRB, with cinnamon and brown-colored soil being the dominant layers of the northern and southern basins. The mean annual natural runoff calculated by the hydrology bureau of the Yellow River Conservancy Commissions that is less impacted by human intervention is 10.4 billion m3 and forms 17.3% of the Yellow River’s total discharge. The July and October runoff yields approximately 65% of the mean annual runoff. During the last 50 years, the runoff in Weihe River has dramatically decreased; principally in the late 1990s when the average was only 3.60 billion m³ compared to 6.20 billion m³ in the 1950s [22,23]. The mean annual sediment contribution of the Weihe River to the Yellow River is 390 billion kg, and in the flood season occurring between June-September it reaches approximately 90% of the mean annual sediment yield [4]. The average sediment yield in the 2000’s was reduced to 160 billion kg, principally due to human activity and climate change, compared to 680 billion kg in the 1950’s [24].

2.2. Dataset

Fifty-five years of records of annual runoff and sediment yield (from 1956 to 2010) were obtained from six gauging stations throughout the WRB, including Linjiacun, Weijiabu, Xianyang and Huaxian stations located in the mainstream WRB, and Zhangjiashan and Zhuangtou stations in the Jinghe and Beiluohe River basins, respectively. These data series were provided by the hydrology bureau of the Yellow River Conservancy Commission (Figure 1), which has the main responsibility of monitoring, collecting and disseminating hydrological information on the Yellow River basin. The data quality of runoff and sediment was strictly controlled before the data were released.

3. Methodology

3.1. The Double Mass Curve Method

The double mass curve method proposed by Merriam (1937) [25] is a simple and practical method widely used for testing long-term shifts in hydrological and meteorological components. Searcy et al. (1960) [26] provided detailed analyses of this method and applied it to check the consistency of the precipitation, streamflow and sediment. The theory of the double-mass curve is based on the fact that a graph of the cumulation of one quantity against the cumulation of another quantity during the same period will plot as a straight line so long as the data are proportional; the slope of the line will represent the constant of proportionality between the quantities. A break in the slope of the double-mass curve means that a change in the constant of proportionality between the two variables has occurred or perhaps that the proportionality is not a constant at all rates of cumulation. If the possibility of a variable ratio between the two quantities can be ignored, a break in the slope indicates the time at which a change occurs in the relationship between the two quantities. The difference in the slope of the lines on either side of the break in the slope indicates the degree of change in the relationship [26].

3.2. The Archimedean Copula Function

Given two random variables X and Y and a corresponding vector of bivariate observations {xi,yi} (I = 1,…,n), where n is the sample size, let F(x) and G(y) be their marginal distributions and H(x,y) the cumulative joint distribution function. If F(x) and G(y) are continuous, then there is a unique copula Cq(u,v) [27], such that H can be written as Equation (1), where q is a parameter vector and u = F(x) and v = G(y).
H ( x , y ) = C q ( F ( x ) , G ( y ) ) , x , y
Assuming F(x) and G(y) are continuous, the joint probability density function can be written:
h(x, y) = f(x) × g(y) × C12(F(x), G(y))
where f(x) and g(y) represent the density functions and C12 can be defined by:
C 12 ( u , v ) =   u   v C ( u , v )
In hydrology research, Archimedean copula functions are widely used because the explicit functional forms, including the Clayton, Frank, and Gumbel-Hougaard copulas, are flexible and allow differences in tail behavior [17]. Three Copulas functions used in this study are shown in Table 1.
Estimating the parameter q is the key to generate a Copula function. There are several methods to estimate copula parameter(s) such as functions for margins (IFM), exact maximum likelihood (EML), and canonical maximum likelihood (CML) methods [28]. The IFM and EML methods require preliminary or simultaneous estimation of the marginal distributions and are prone to marginal misspecification, whereas the CML method, which we adopted in this study, relies on the empirical marginals and can be applied independently of marginal specification. Details of the CML method can be found in [28].
The goodness-of-fit for copula functions is assessed by employing the Cramér-von Mises test statistic Sn. The approximate p-value for the test statistic is computed using a parametric bootstrapping approach [29,30]. Large p-values indicate that there is no evidence to reject the null hypothesis and the model can be used as a possible candidate to describe the data [31].

3.3. The Combinations of High-Low Runoff and Sediment

The Copula function is applied to investigate the joint probabilities of different scenarios of high-low annual runoff and sediment yield. Table 2 presents nine possible scenarios determined by the frequency of pf = P(Xx) = 25% and pk = P(Xx) = 75%, respectively, where P(Xx) denotes the probability of event Xx.

4. Results and Discussion

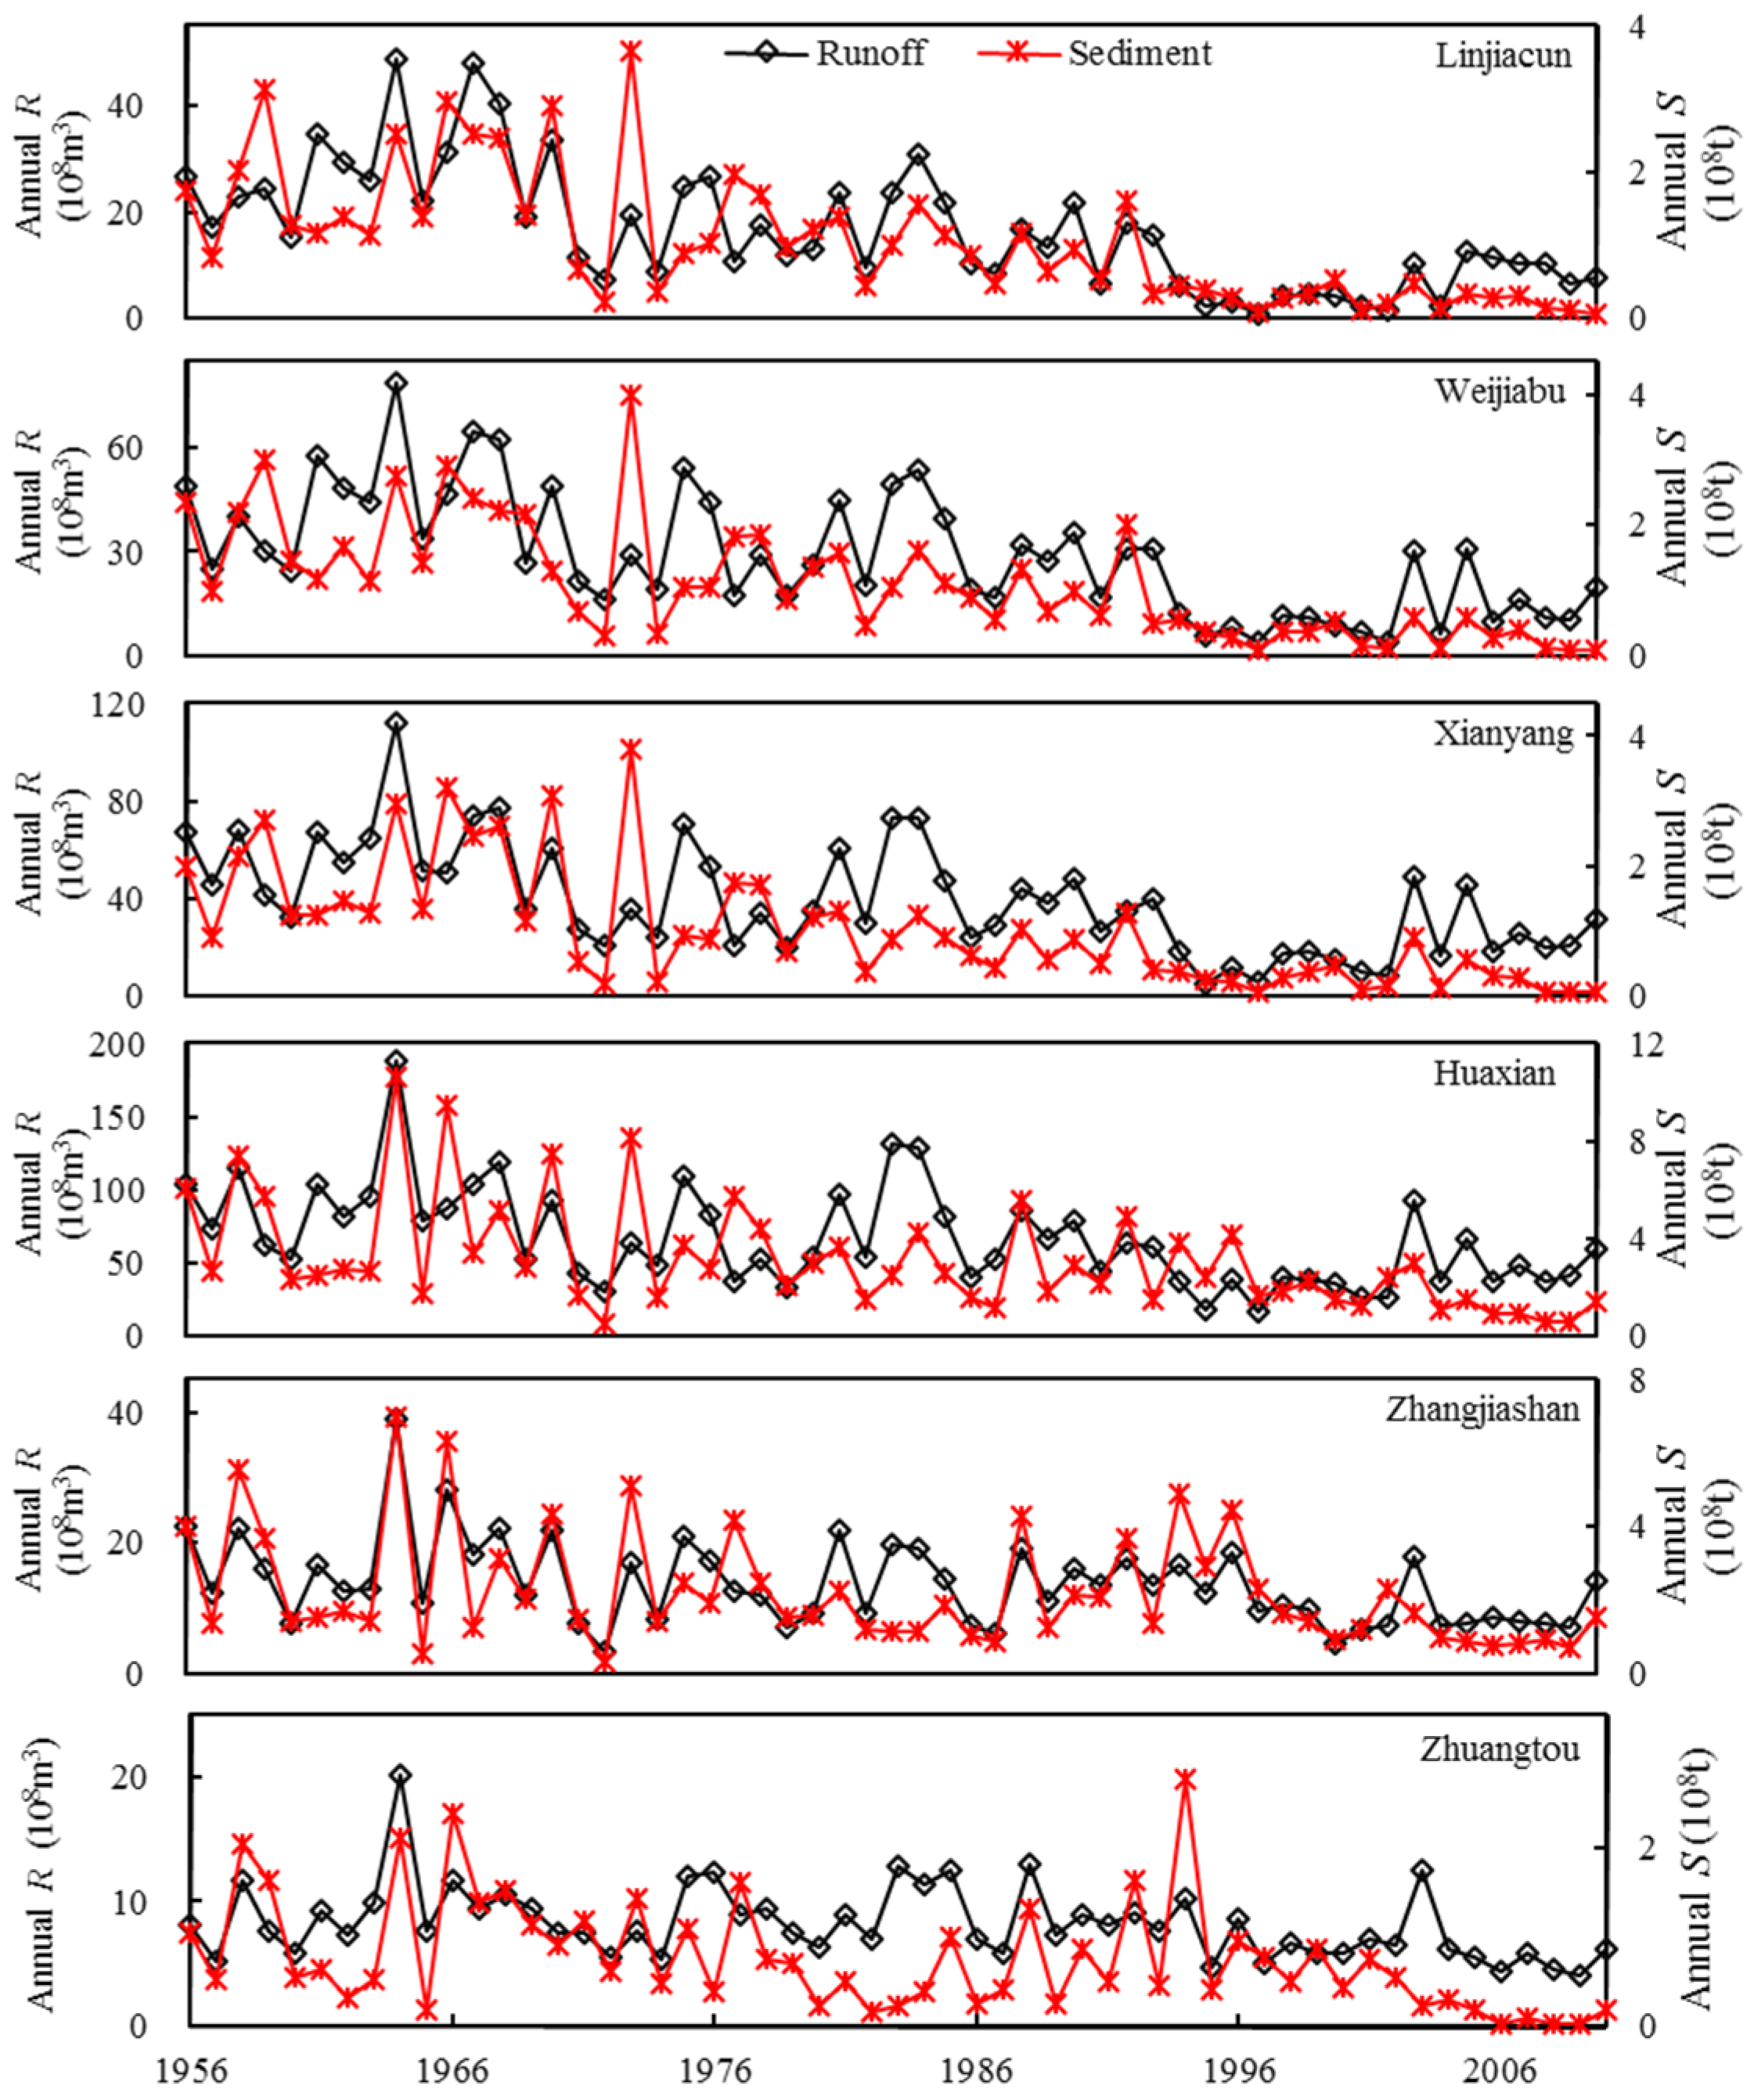
4.1. Variations in Annual Runoff and Sediment

Long-term variations in annual runoff and sediment yield from six gauging stations along the WRB and spanning the 1956–2010 period are shown in Figure 2. Overall, all gauging stations display a broad decrease with time in annual runoff and sediment yield. Note the period from 1956 to 1970 witnessed a peak in runoff and sediment yield, whereas from 1970 to 1996, the WRB experienced normal runoff and sediment yield. However, there was a strong decrease in runoff and sediment yield from 1996 to 2014, which is more pronounced from 1996 to 2002.
Prior research has been conducted to explain the causes of decreasing runoff and sediment yield in the WRB [4,22,32]. These studies concluded that climate change, especially the variations in precipitation and anthropogenic activity, were the main culprits. Precipitation and human activity have had a different effect on runoff and sediment yield throughout the years. The consensus is that human activity related principally to soil and water conservation measures, tied to the construction of large/medium-sized multipurpose water control projects, generated an increasing demand for water resources since the 1970’s. Table 3 presents the decrease in runoff and sediment yield from the 1960’s to the 1990’s at the Huaxian station related primarily to anthropogenic activity. The data reveal a 300% decline in runoff and sediment yield from soil and water conservation programs from the 1970’s to the 1990’s relative to the 1960’s. Water projects, such as reservoirs and dams, disturb the runoff by increasing the evaporation, the drinking water supply and the agricultural irrigation while enhancing the deposition of sediment in reservoirs. The rapid regional economic development from the 1960’s to the 1990’s enhanced the runoff decrease brought about by gradual expansion of industrial and domestic water use. Decrease in sediment yield and runoff in the 1990’s caused by human activity was 19.26% and 65.04%, respectively.

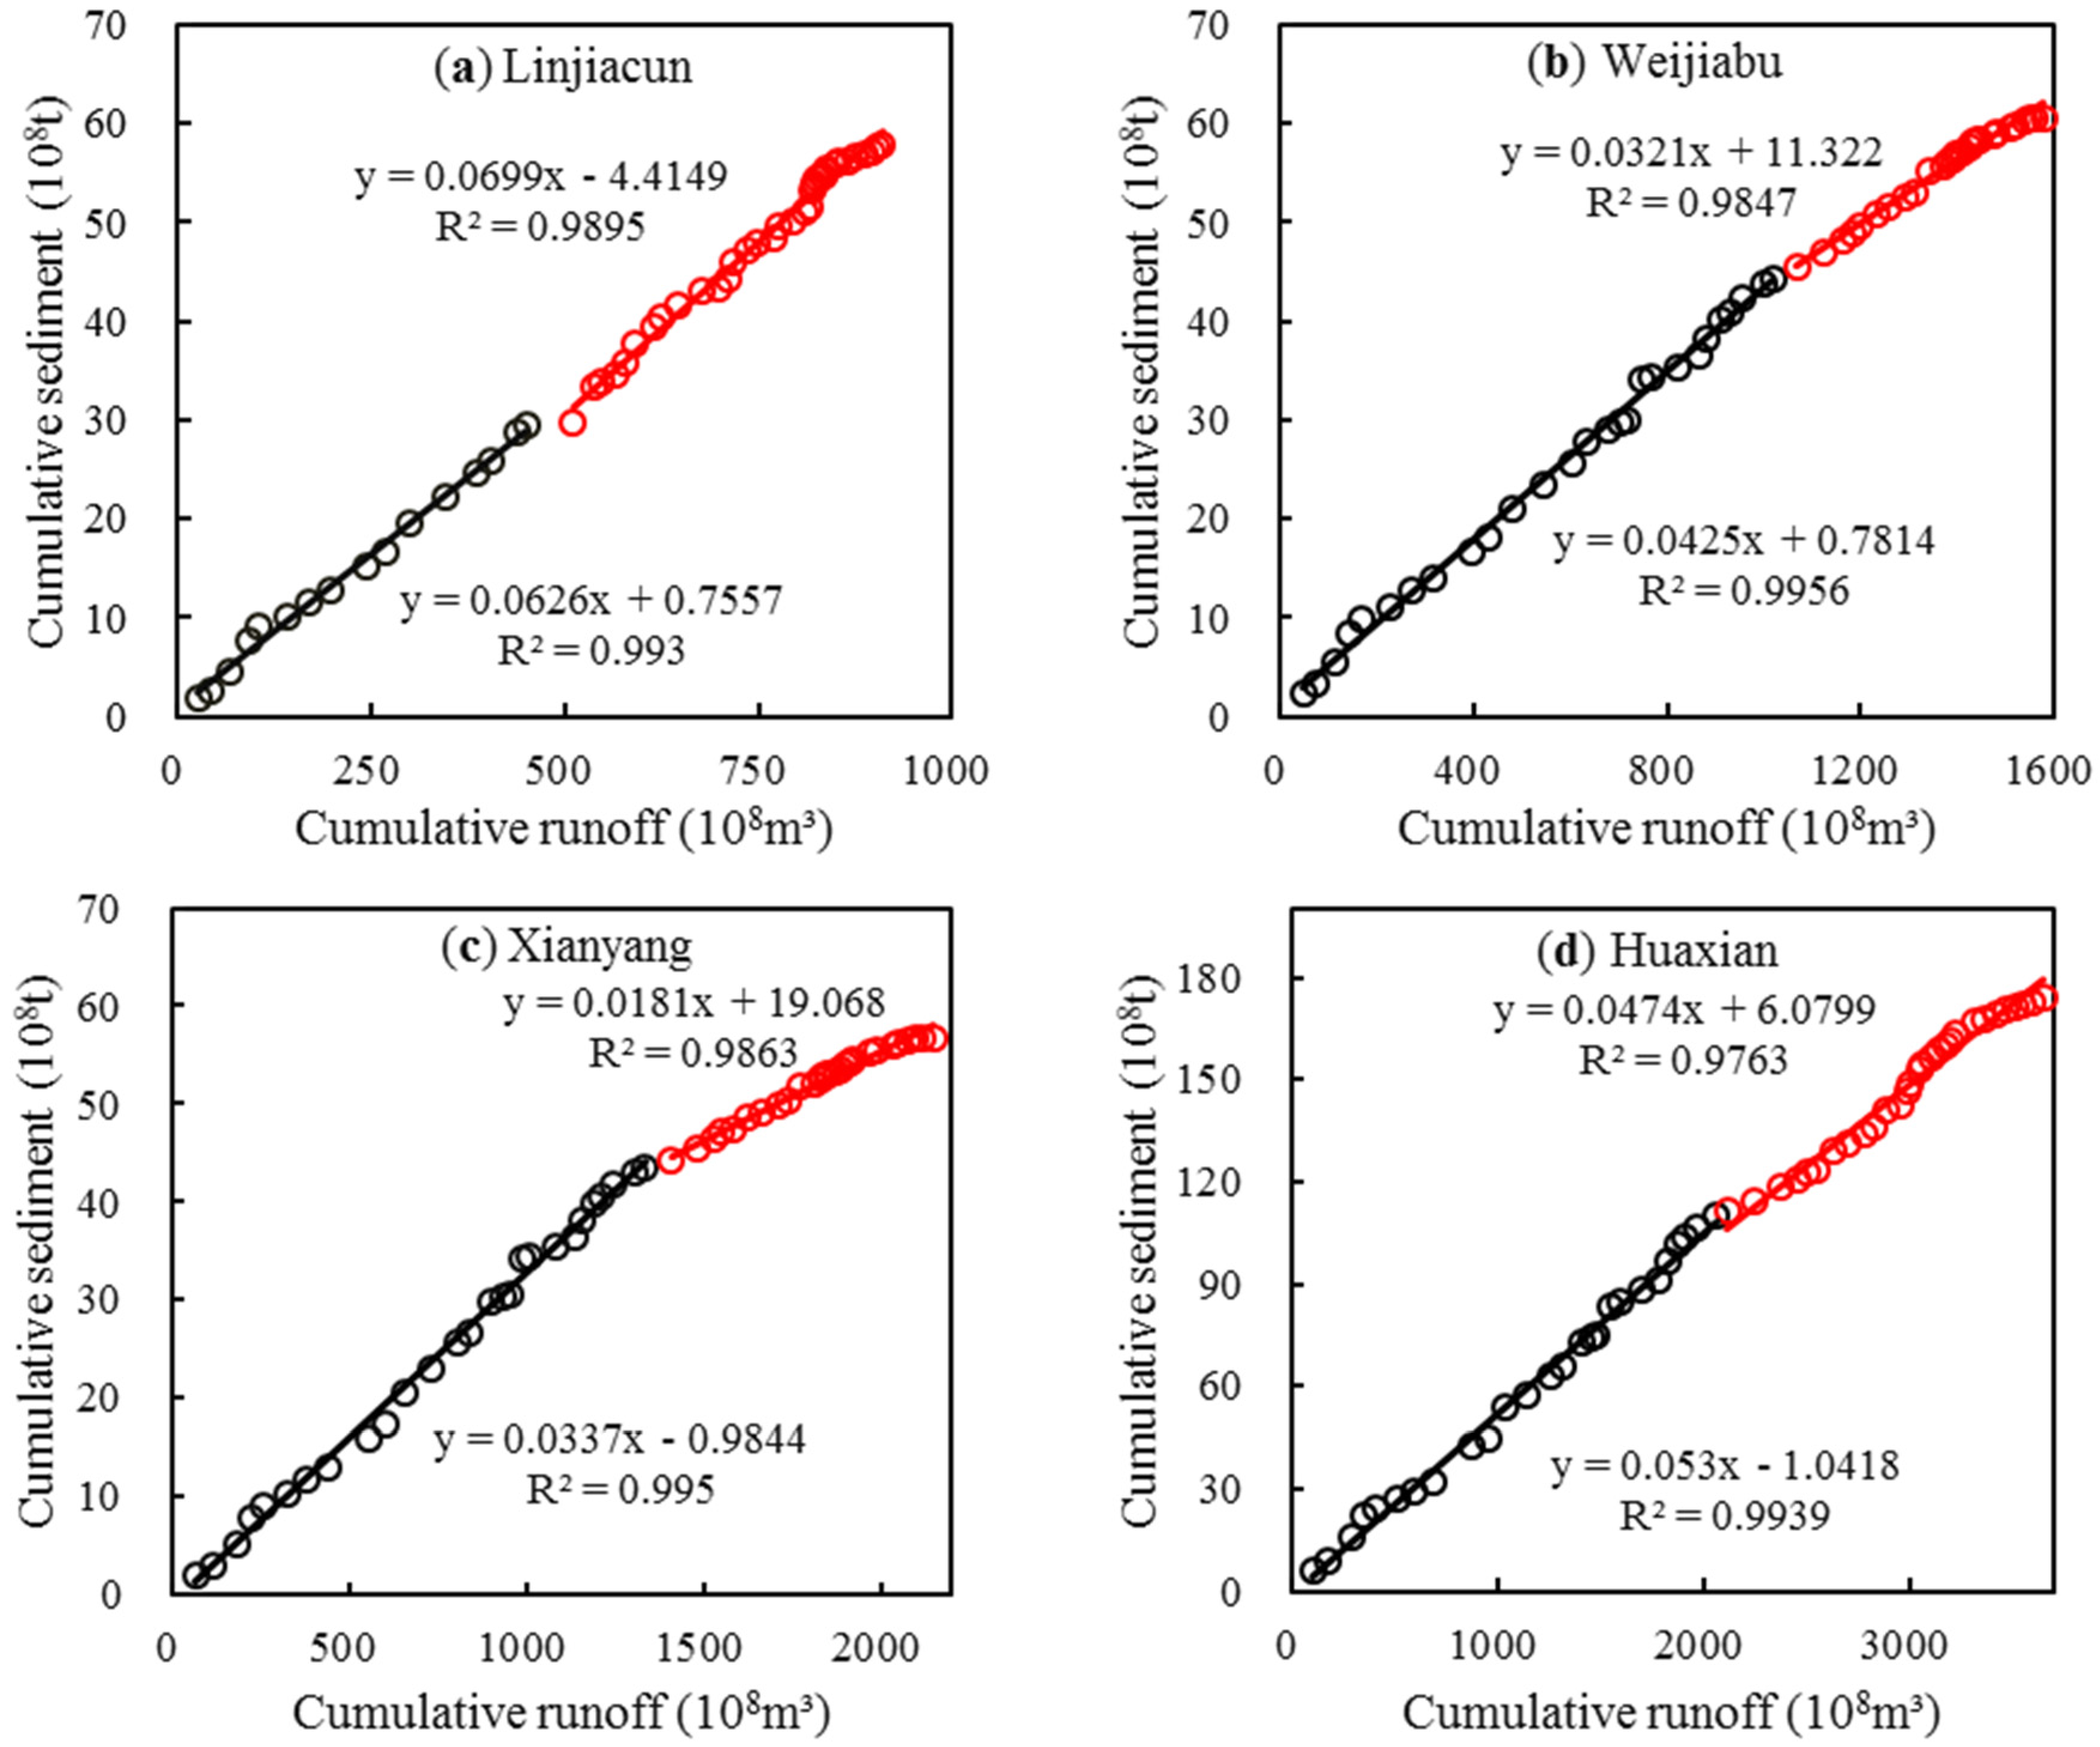
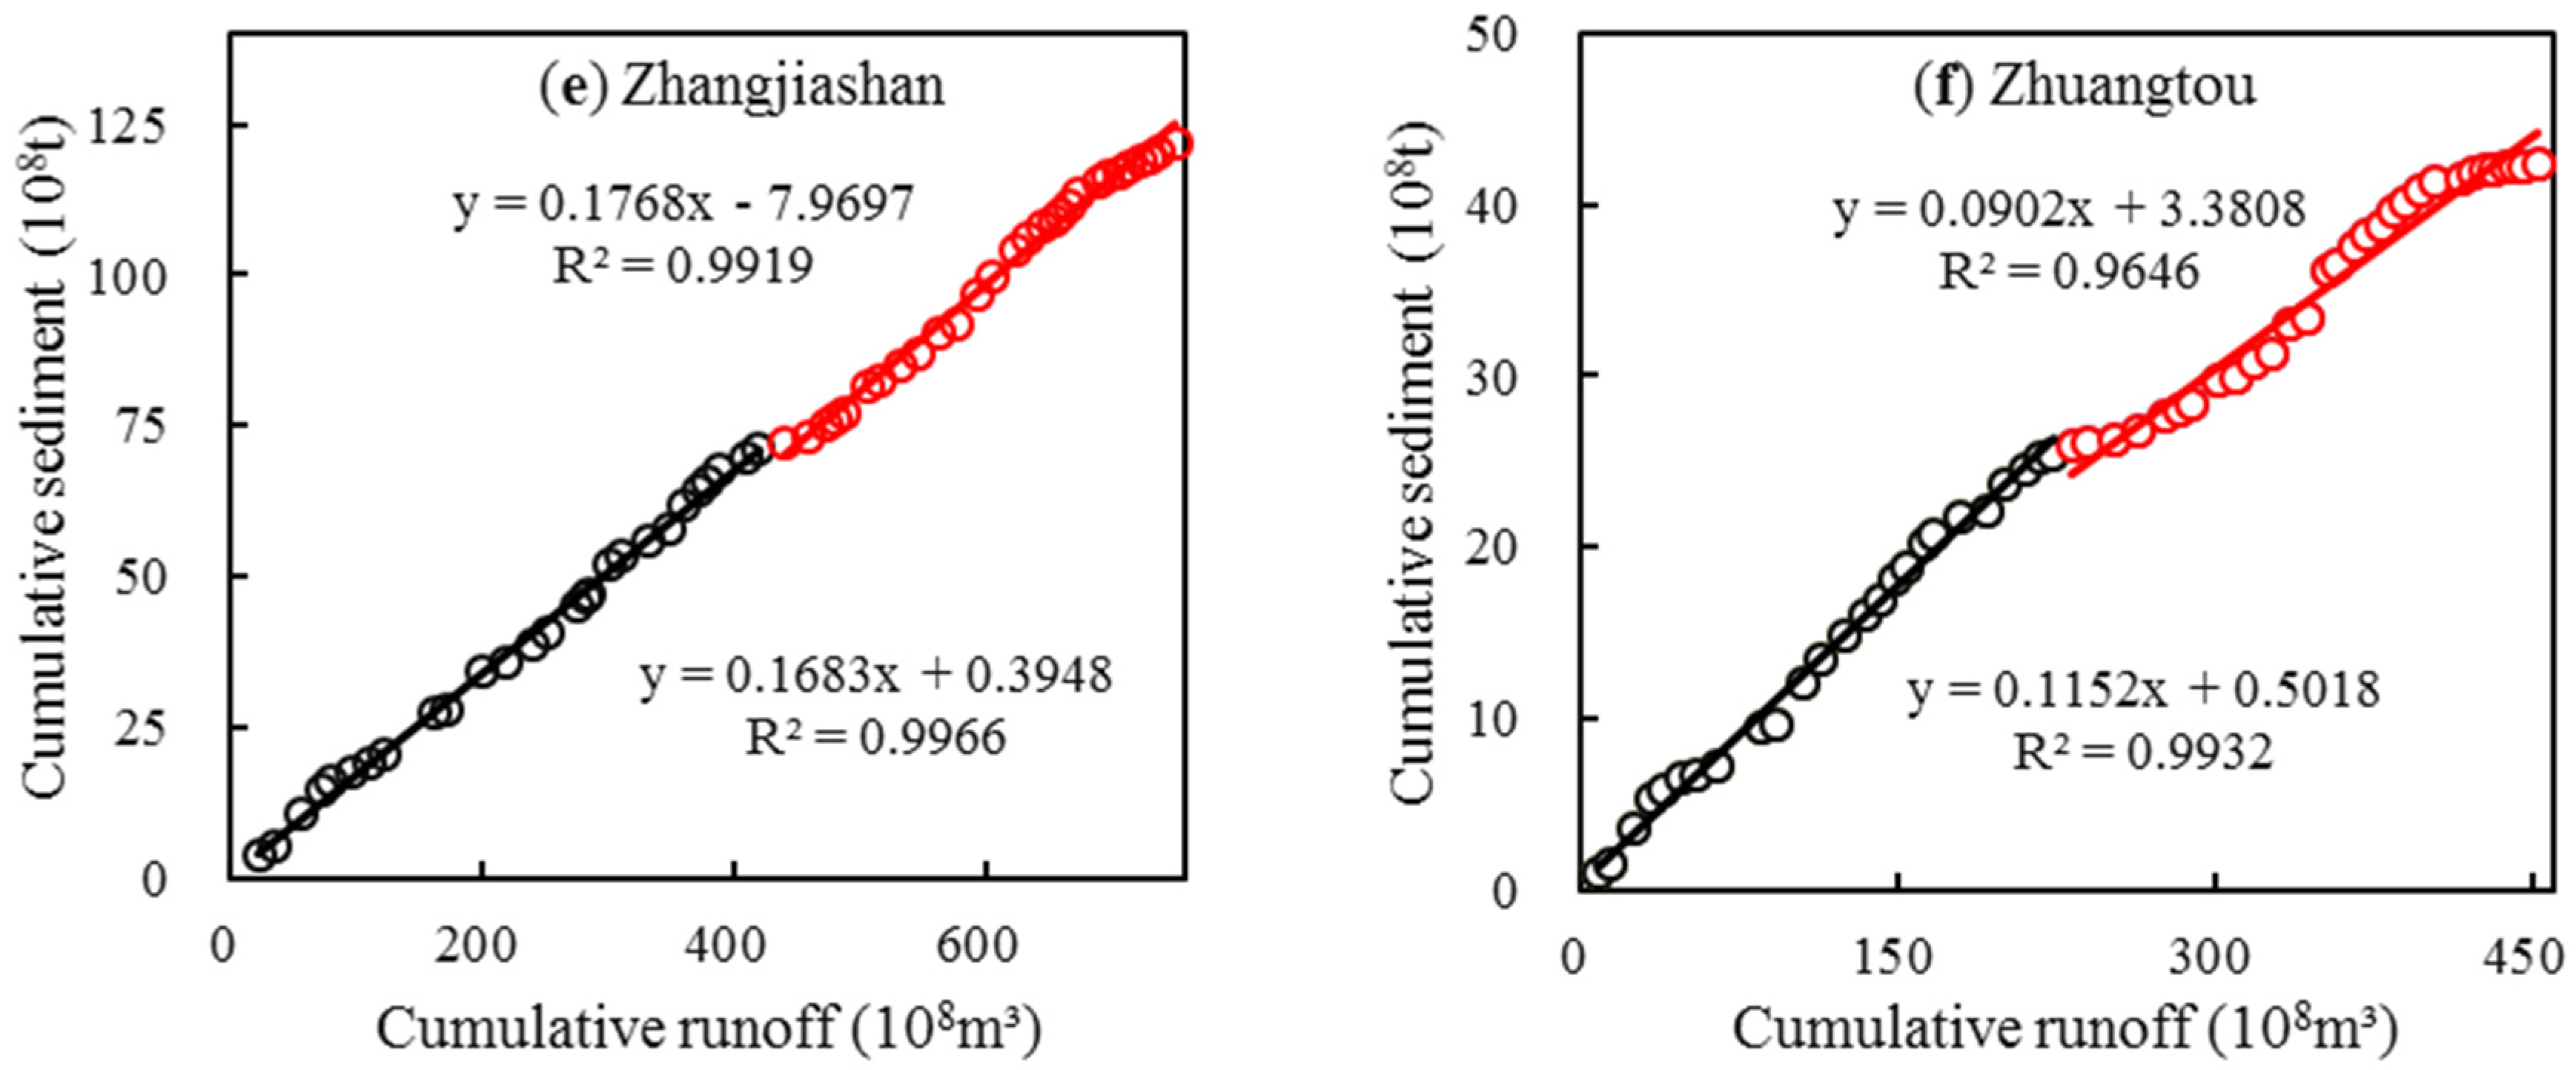
4.2. Detection of RSR Change Points

The double mass curve method is applied to detect the RSR inflection points in the WRB. Figure 3 presents the cumulative plot of the mass of annual runoff and sediment yield provided by the six gauging stations accompanied by the best linear fit. The inflection point in RSR is given by the changing slope determined by the best linear fit above and below the inflection point. Each plot presents the best two linear correlations separated by the inflection point. All correlation coefficients are >0.9 and the slopes of the linear equations below the inflection point are commonly higher than that above.
The data presented in Figure 3 and Table 4 clearly define RSR inflection points occurring around 1983, with the exception of the Linjiacun station, which happened in 1975. The different correlations observed at the Linjiacun station may be attributed to less human activity occurring in the region above the Linjiacun station. To evaluate the significance of the change points of RSR, a statistical method (variance-ratio test) proposed by [35] was applied in this study. Details of the variance-ratio test are found in [26]. The test results show that RSR inflection points at the Weijiabu, Xianyang, Huaxian and Zhuangtou stations did not pass the significance test, which means that the inflection points are significant at the 5% significance level. Moreover, the RSR inflection points at the Linjiacun and Zhangjiashan stations are not significant at the 5% significance level.
Most hydrological studies of the WRB suggested a variable contribution from human activity to runoff and sediment yield leading to changes in RSR [4,32]. These studies indicated: (a) a reduced runoff producing a much lower capacity of sediment transport and an increase in the probability of sediment deposition; and (b) check dams, water reservoirs and the conversion of cropland to grassland leading to larger trapping of sediment than runoff. However, Table 3 shows that soil and water conservation programs caused the increasing reduction of runoff and sediment yield over time, except for the dam building, at the Huaxian station. Decreasing runoff took place from the 1960’s to the 1990’s due to water projects, whereas the latter generated a decrease in sediment yield between the 1970’s and 1980’s due to lower reservoir capacity produced by sediment deposition. Furthermore, a decline in sediment yield from human activity happened between the 1970’s and 1980’s with a decrease in runoff from the 1960’s to 1990’s. The timing of the non-synchronous variations in decreasing runoff and sediment yield corresponds to the RSR inflection point at the Huaxian station, which seems to confirm the validity of the double mass curve method.

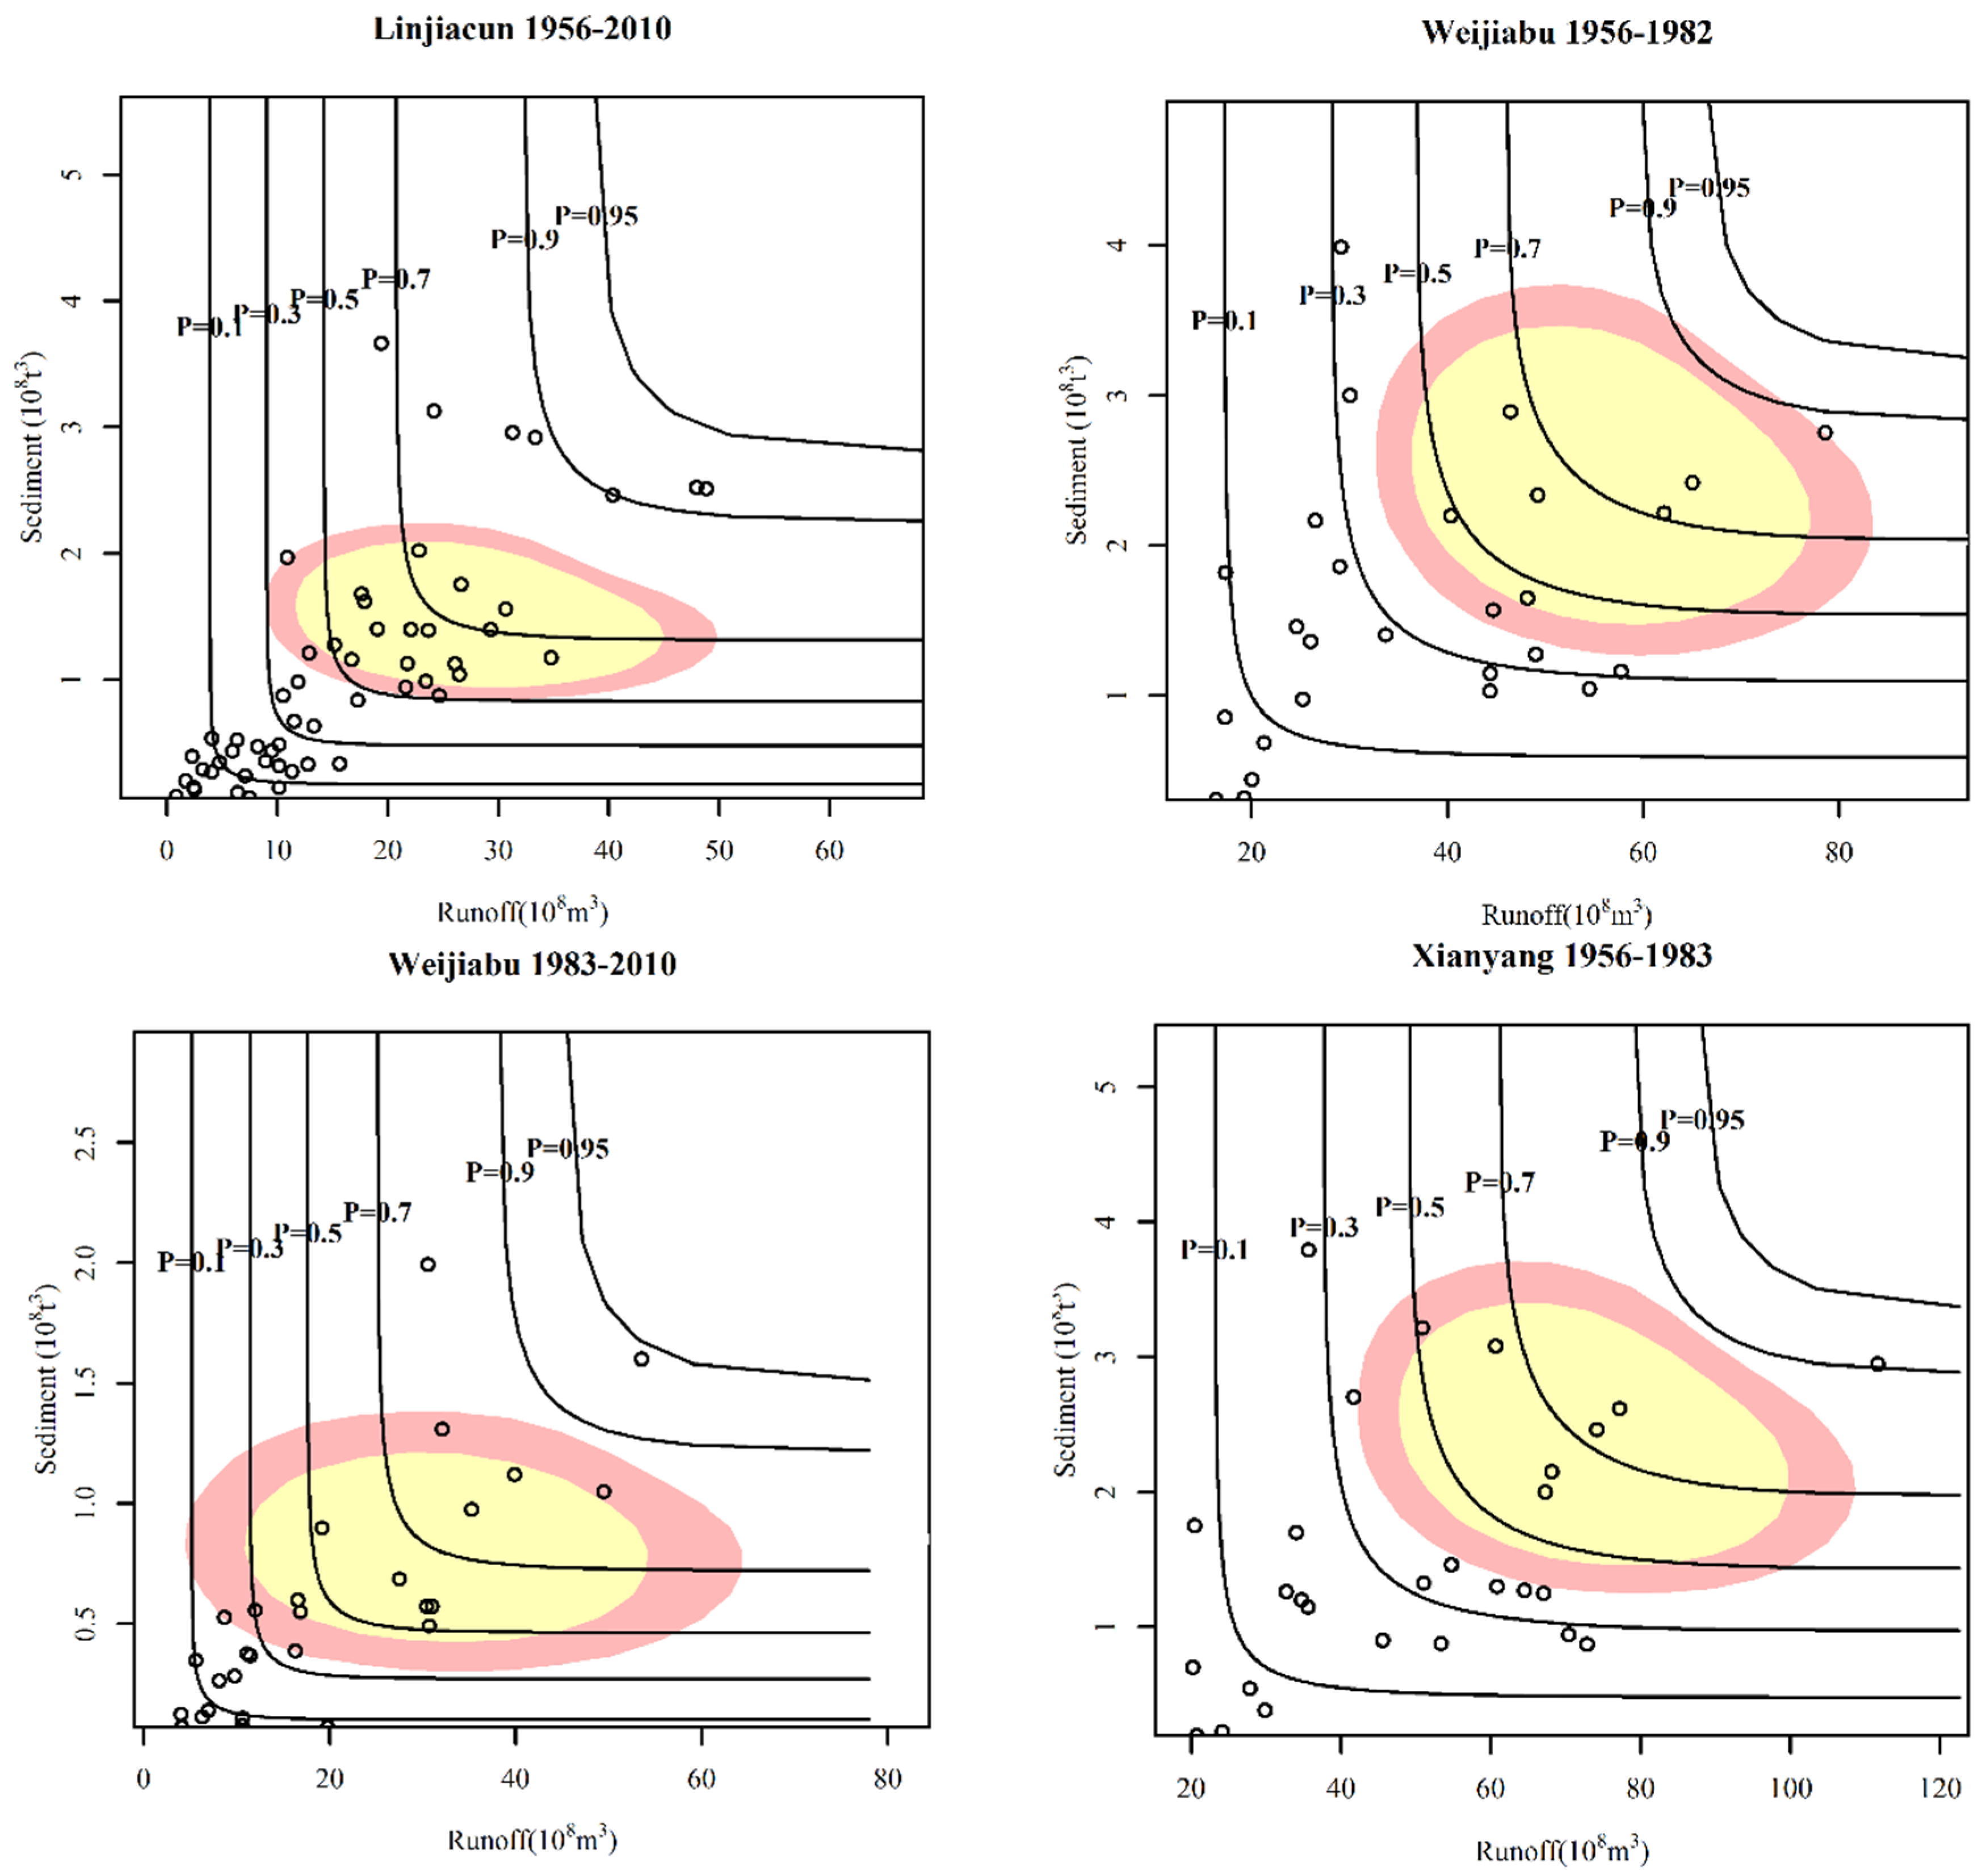
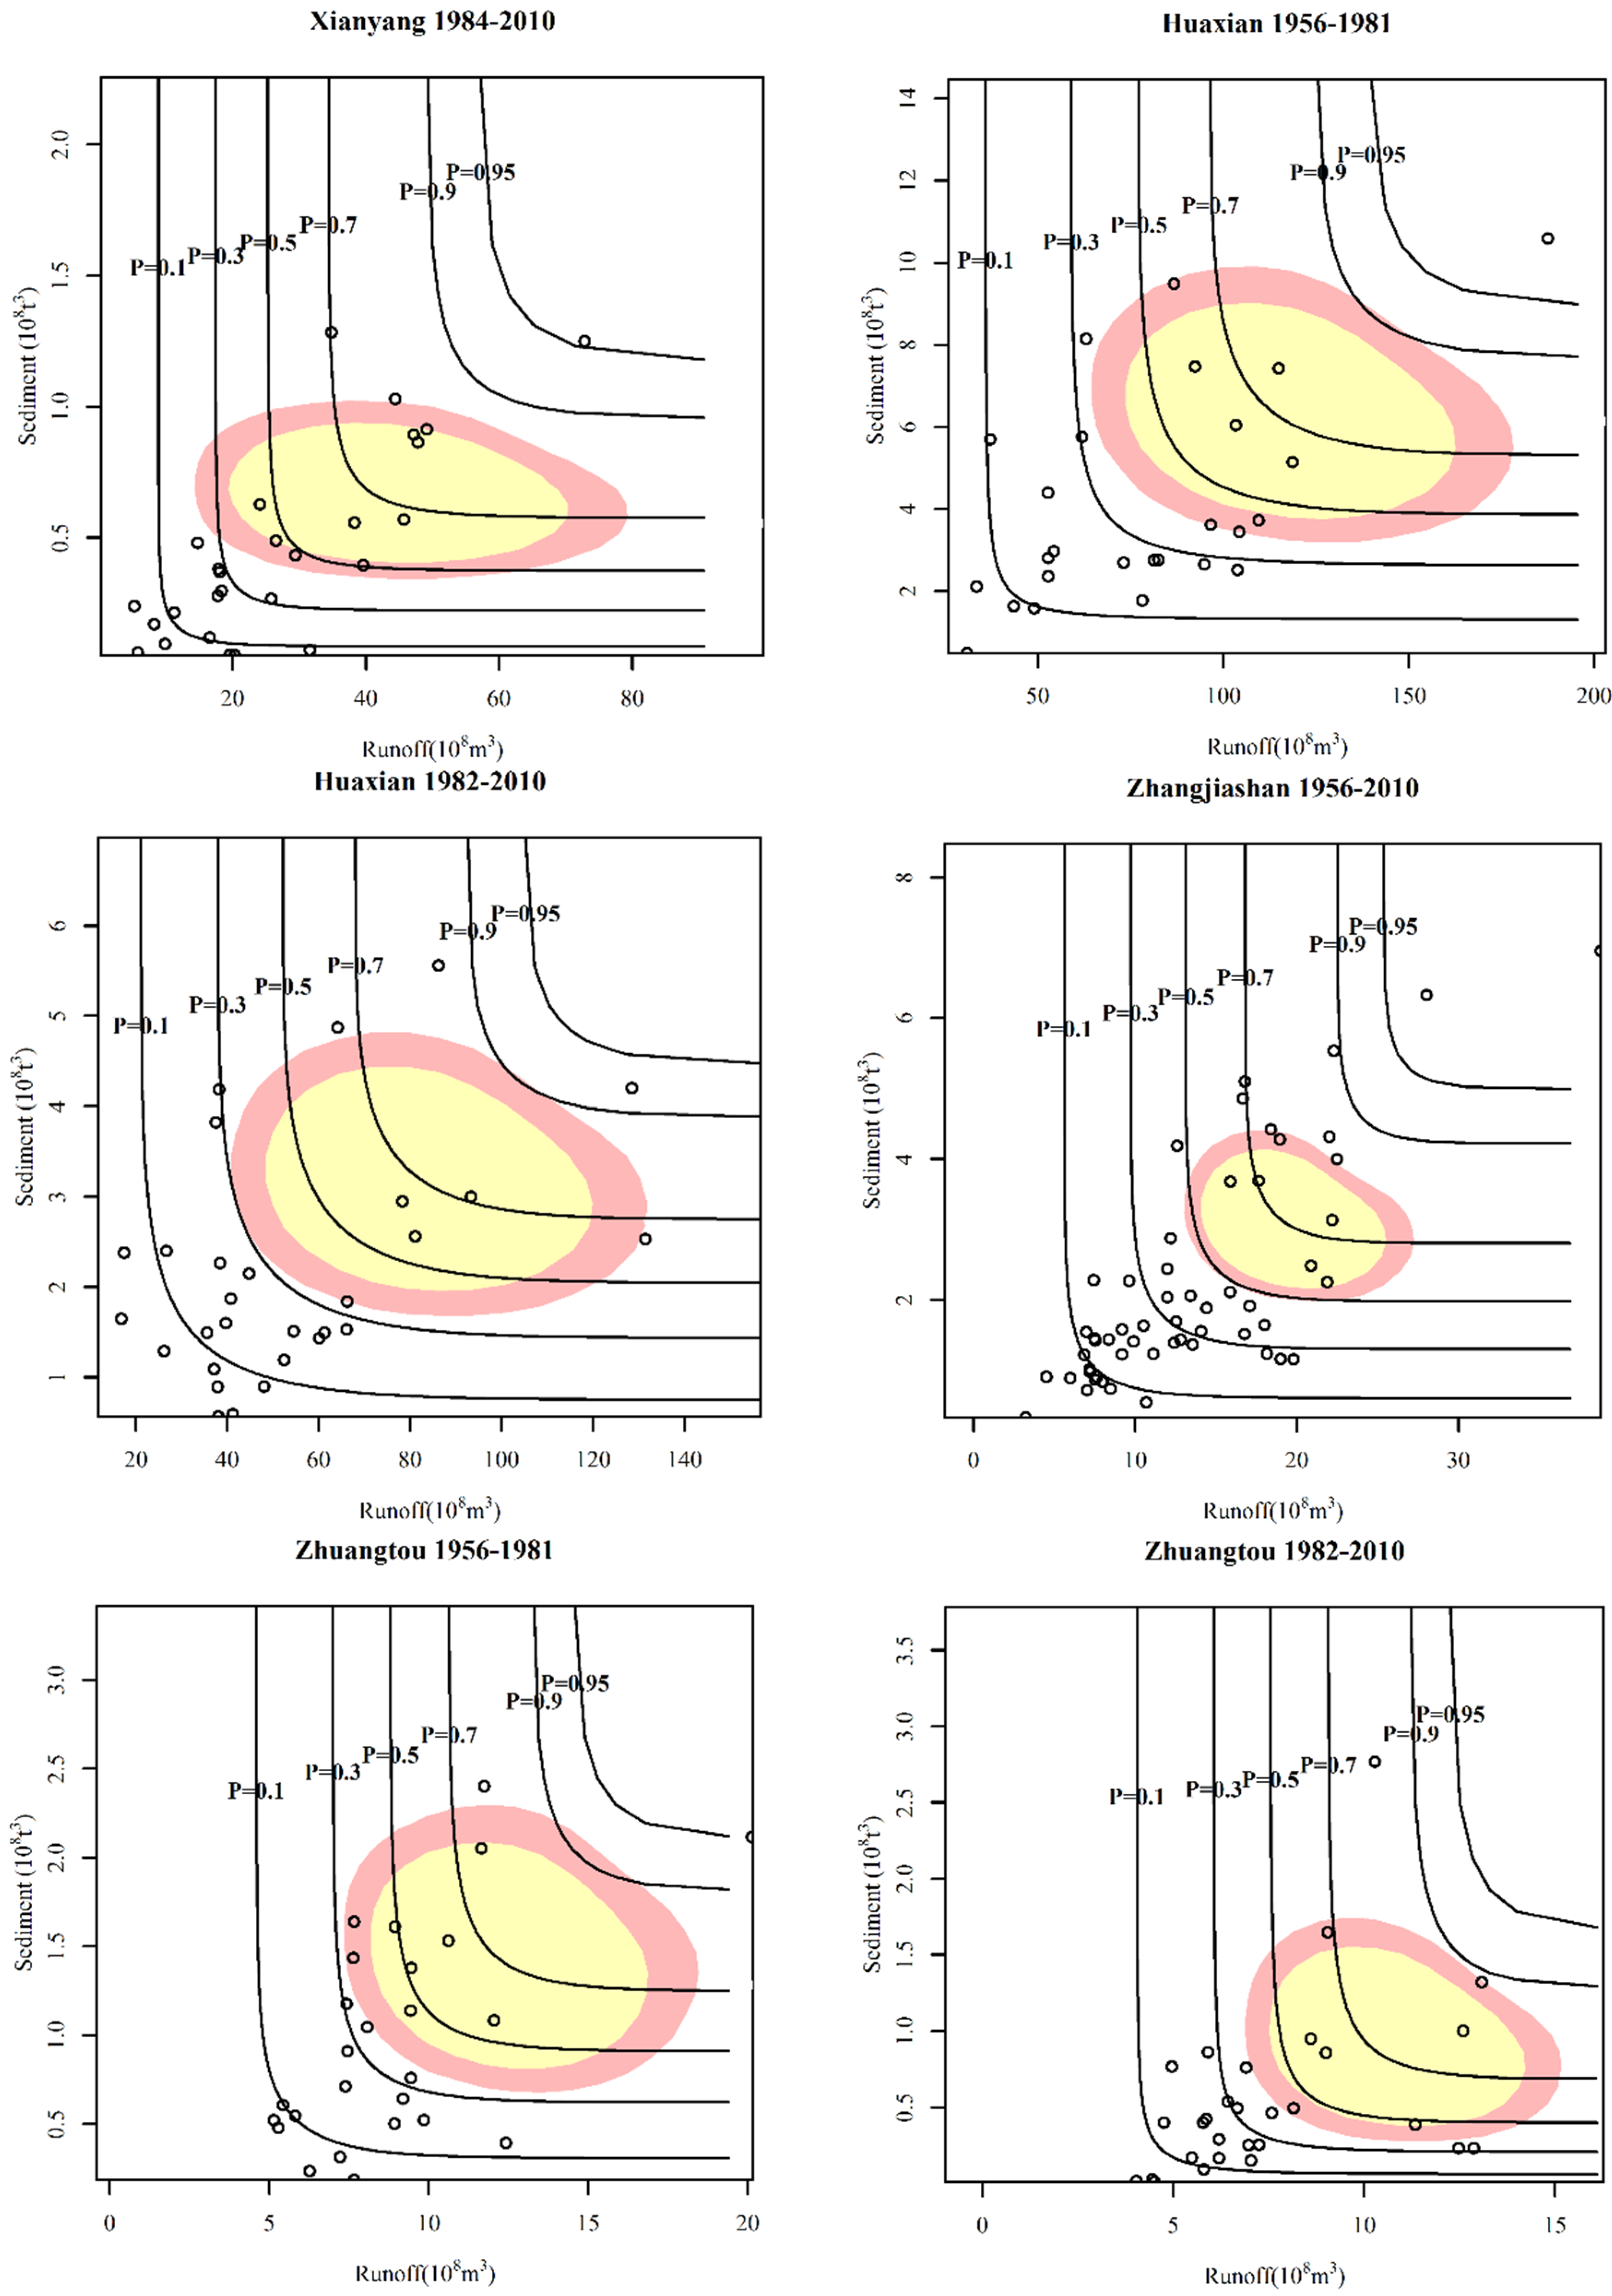
4.3. Copula Function of Runoff-Sediment before and after the Change Points of RSR

Time series of runoff and sediment were divided into two periods separated by the change points of RSR passing the significance test at the Weijiabu, Xianyang, Huaxian and Zhuangtou stations. The two periods are abbreviated to P1 and P2, corresponding to the the periods before and after the change points of RSR. The θ parameter of the joint function obtained by the CML method, the Cramér-von Mises statistic Sn and p-values are listed in Table 5. The p-value of the selected copula should be larger than 0.05. To select the appropriate copula function, the AICc (corrected Akaike Information Criterion) [36] was also used, which is more strict than the classical Akaike Information Criterion (AIC) [37]. Burnham and Anderson (2002) [38] argued that AICc should be preferred over AIC in the case of small sample sizes. These statistical results are listed in Table 5. Clayton copula is the appropriate one for P1 at Weijiabu, Xianyang and Huaxian stations located in the mainstream WBR. Gumbel-Hougaard and Frank copula functions peform better at the Zhangjiashan and Zhuangtou stations respectively located in the tributary regions. The appropriate copula function is Frank copula at Linjiacun (1956–2010), Weijiabu (P2) and Xianyang (P2) stations.
In order to test the significance of the difference in the dependence structures between runoff and sediment yield in P1 and P2, the copula-based likelihood-ratio test (CLR) method [39] was applied to the Weijiabu, Xianyang, Huaxiang and Zhuangtou stations. The log likelihood ratio statistic Zn was obtained by using the CLR method, which was 2.72, 15.38, 8.24 and 1.51 for the Weijiabu, Xianyang, Huaxiang and Zhuangtou stations, respectively. The threshold of the Zn statistic is 9 at the 5% significance level based on [40]. Hence, the results of Zn indicates that the difference in the dependence structures between runoff and sediment yield in P1 and P2 is significant at the Xianyang station, whereas it is non-significant at the remaining stations.

4.4. The Synchronous-Asynchronous Joint Probability of High-Low Runoff and Sediment

Any estimation has associated uncertainty [41]. In particular, the sampling uncertainty of hydrological data must be clearly assessed and taken into account in design applications [42,43]. In recent years, there have been a few studies [41,44] discussing this issue and proposing some algorithms for uncertainty estimation of joint probability based on the research of Serinaldi (2013, 2015) [42,45]. We applied a modified version of ALGO-C of Serinaldi (2013) [42] designed by Dung et al (2015) [41] for uncertainty estimation of joint probability. The method of highest density regions (HDR) proposed by Hyndman et al (1996) [46] was used to define the (1 − α)-level confidence areas, implemented by the R package hdrcde [47].
The joint probabilities of annual runoff and sediment yield for all WRB stations are shown in Figure 4 containing the 95% and 99% joint confidence areas with the joint probability P = 0.7. The joint probabilities of various runoff and sediment yield combinations at various frequencies can be obtained in Figure 4 along with possible combinations of annual runoff and sediment yield at a given joint probability. However, it can also be seen from Figure 4 that the confidence intervals are very large for the six hydrological stations in the WRB, which are relatively smaller at the Linjiacun and Zhangjiashan stations. Even so, they cover several curve levels, thus alerting us to the large variability of the estimate of joint probability. These large uncertainties also pose great challenges for water and soil resource planning and management.
Using nine different combinations of high-low runoff and sediment yield provided in Table 2, we calculated the joint probabilities listed in Table 6. The corresponding 95% confidence intervals were built by the modified ALGO-C metioned above.
It is commonly agreed a higher joint probability of elevated runoff and sediment yield is more beneficial to the joint control of water flow and sediment deposition. However, a greater joint probability of low runoff and high sediment yield will result in sedimentation of the river channel and the reservoir, increasing the risk of flooding and decreasing the efficiency in reservoir usage. Table 6 illustrates the synchronous-asynchronous joint probabilities of high-low runoff and sediment yield in P2, showing significant variations relative to the P1 scenario at the mainstream WRB Weijiabu and Xianyang stations. The differences observed at the Huaxian and Zhuangtou stations between P1 and P2 are relatively smaller.
Table 6 also provides the following conclusions:
  • The symmetry of the Clayton, Frank and Gumbel-Hougaard copulas generates asynchronous joint probabilities of the RH-SL combination equal to that of the RL-SH combination, which are similar to that of RH-SN, RN-SH, RN-SL and RL-SN combinations.
  • The synchronous joint probabilities of the RN-SN combination, varying from 27.46% to 35.61%, are the highest within the nine different combinations in the P1 and P2 scenarios. The sum of synchronous joint probabilities in P2 is larger than that in P1 at the Weijiabu, Xianyang and Zhuangtou stations, while it is opposite at the Huaxian station.
  • The asynchronous joint probabilities of the RH-SL and RL-SH combinations, which vary from 0.12% to 2.79%, are the lowest within the nine different possible combinations in P1 and P2. The joint probabilities of the RH-SL and RL-SH combinations are small, underlying a close relationship between runoff and sediment yield. The small joint probabilities of the RL-SH combination can provide an advantage in jointly operating runoff and sediment yield. The sums of the asynchronous joint probabilities are smaller compared with those of the synchronous joint probabilities obtained for P1 and P2, with the exception of P2 at the Huaxian station. The asynchronous joint probabilities of six different combinations (i.e., RH-SL, RH-SN, RN-SH, RN-SL, RL-SH and RL-SN) in P2 are lower compared with those in P1 at the mainstream WRB Weijiabu and Xianyang stations with the exception of the RN-SL and RL-SN combinations at the Xianyang station. The asynchronous joint probabilities at the Huaxian station for six different combinations are higher in P2 relative to P1.
  • The difference between the sum of synchronous or asynchronous joint probabilities in P1 and P2 is largest at the Weijiabu station, following the Xianyang station, while the change is small at the Huaxian and Zhuangtou stations located downstream of the Weihe River.

5. Conclusions

The runoff-sediment relationship (RSR) of the entire Weihe River basin (WRB) was studied using data collected from 1956 to 2010. The Copula function was used to assess the synchronous-asynchronous joint probabilities of high-low runoff and sediment yield, yielding the following conclusions:
(1)
The annual runoff and sediment yield display decreasing trends throughout the WRB. Human activity mainly defined by soil and water conservation measures, water projects and industrial and domestic water use is the main culprit of the decreasing runoff and sediment yield.
(2)
The RSR inflection points principally occurred around 1983 at the Weijiabu, Xianyang, Huaxian and Zhuangtou stations, which failed to pass the significane test at the Linjiacun and Zhangjiashan stations. The inflection points are largely the result of the irregular effects of human activity on runoff and sediment yield.
(3)
The synchronous joint probability values of the combined normal runoff and normal sediment yield, which vary from 27.46% to 35.61%, are the highest of the nine different combinations. The high correlation between annual runoff and sediment yield produces particularly low asynchronous joint probabilities (i.e., 0.12% to 2.79%) for the combination of high (or low) runoff and low (or high) sediment yield. The sum of synchronous joint probabilities in P2 is larger than that in P1 at the Weijiabu, Xianyang and Zhuangtou stations, while it is opposite at the Huaxian stations.
In general, the synchronous-asynchronous joint probabilities differ more significantly between periods above and below the RSR inflection points at the Weijiabu and Xianyang stations than those at the Huaxian and Zhuangtou stations located downstream of the Weihe River.

Acknowledgments

This work was supported by the National Natural Science Foundation of China (Granted No: 51190093, 51309188, 51409210), Key Innovation Group of Science and Technology of Shaanxi (2012KCT-10), Key Laboratory of science and technology innovation project of Shaanxi Province (2013SZS02-Z02), Key Laboratory of education department of Shaanxi Provincal government (13JS069), and governmental public industry research special funds for projects.

Author Contributions

Aijun Guo did the detailed work and wrote the paper; Jianxia Chang guided the entire study and provided the suggestions and improvements to the manuscript; Yimin Wang contributed to the results and discussion part; Qiang Huang provided suggestions to the manuscript and reviewed it critically.

Conflicts of Interest

The authors declare no conflict of interest.

References

  1. Arnell, N.W. Climate change and global water resources. Glob. Environ. Chang. 1999, 9, 31–49. [Google Scholar] [CrossRef]
  2. Walling, D.E. Human impact on land–ocean sediment transfer by the world’s rivers. Geomorphology 2006, 79, 192–216. [Google Scholar] [CrossRef]
  3. Wang, F.; Hessel, R.; Mu, X.M.; Maroulis, J.; Zhao, G.J.; Geissen, V.; Ritsema, C. Distinguishing the impacts of human activities and climate variability on runoff and sediment load change based on paired periods with similar weather conditions: A case in the Yan River, China. J. Hydrol. 2015, 527, 884–893. [Google Scholar] [CrossRef]
  4. Gao, P.; Geissen, V.; Ritsema, C.J.; Mu, X.M.; Wang, F. Impact of climate change and anthropogenic activities on stream flow and sediment discharge in the Wei River basin, China. Hydrol. Earth Syst. Sci. 2013, 17, 961–972. [Google Scholar] [CrossRef]
  5. Ye, Z.X.; Chen, Y.N.; Zhang, X. Dynamics of runoff, river sediments and climate change in the upper reaches of the Tarim River, China. Quat. Int. 2014, 36, 13–19. [Google Scholar] [CrossRef]
  6. Dunjó, G.; Pardini, G.; Gispert, M. The role of land use–land cover on runoff generation and sediment yield at a microplot scale, in a small Mediterranean catchment. J. Arid Environ. 2004, 57, 239–256. [Google Scholar] [CrossRef]
  7. Zhang, Q.; Chen, G.Y.; Su, B.D.; Disse, M.; Jiang, T.; Xu, C.Y. Periodicity of sediment load and runoff in the Yangtze River basin and possible impacts of climatic changes and human activities. Hydrol. Sci. J. 2008, 53, 457–465. [Google Scholar] [CrossRef]
  8. Mayor, A.G.; Bautista, S.; Bellot, J. Scale-dependent variation in runoff and sediment yield in a semiarid Mediterranean catchment. J. Hydrol. 2011, 397, 128–135. [Google Scholar] [CrossRef]
  9. Gebremicael, T.G.; Mohamed, Y.A.; Betrie, G.D.; Zaag, P.; Teferi, E. Trend analysis of runoff and sediment fluxes in the Upper Blue Nile basin: A combined analysis of statistical tests, physically-based models and landuse maps. J. Hydrol. 2013, 482, 57–68. [Google Scholar] [CrossRef]
  10. Nadal-Romero, E.; González-Hidalgo, J.C.; Cortesi, N.; Desir, G.; Gómezd, J.A.; Lasantae, T.; Lucíaf, A.; Marínc, C.; Martínez-Murillog, J.F.; Pachecoh, E.; et al. Relationship of runoff, erosion and sediment yield to weather types in the Iberian Peninsula. Geomorphology 2015, 228, 372–381. [Google Scholar] [CrossRef]
  11. Tian, P.; Zhai, J.Q.; Zhao, G.J.; Mu, X.M. Dynamics of runoff and suspend sediment transport in a highly erodible catchment on the Chinese Loess Plateau. Land Degrad. Dev. 2015, 27, 839–850. [Google Scholar] [CrossRef]
  12. Zhang, J.P.; Ding, Z.H.; You, J.J. The joint probability distribution of runoff and sediment and its change characteristics with multi-time scales. J. Hydrol. Hydromech. 2014, 3, 218–225. [Google Scholar] [CrossRef]
  13. Zhang, J.P.; Ding, Z.H.; Guo, B.T. Study on evolution trends and encounter risk of runoff and sediment in Jinghe river. J. Hydrol. Eng. 2015, 34, 11–16. (In Chinese) [Google Scholar]
  14. Zhou, N.Q.; Zhao, L.; Shen, X.P. Copula-based probability evaluation of rich-poor runoff and sediment encounter in Dongting Lake Basin. Sci. Geogr. Sin. 2014, 34, 242–248. [Google Scholar]
  15. Guo, A.J.; Chang, J.X.; Liu, D.F.; Wang, Y.M.; Huang, Q.; Li, Y.Y. Variations in the precipitation–runoff relationship of the Weihe River Basin. Hydrol. Res. 2016. [Google Scholar] [CrossRef]
  16. Sraj, M.; Bezak, N.; Brilly, M. Bivariate flood frequency analysis using the copula function: a case study of the Litija station on the Sava River. Hydrol. Process. 2014, 29, 225–238. [Google Scholar] [CrossRef]
  17. Xu, K.; Yang, D.W.; Xu, X.Y.; Lei, H.M. Copula based drought frequency analysis considering the spatio-temporal variability in Southwest China. J. Hydrol. 2015, 527, 630–640. [Google Scholar] [CrossRef]
  18. Grimaldi, S.; Serinaldi, F. Asymmetric copula in multivariate flood frequency analysis. Adv. Water Resour. 2006, 29, 1115–1167. [Google Scholar] [CrossRef]
  19. Zhang, L.; Singh, V.P. Trivariate Flood Frequency Analysis Using the Gumbel–Hougaard Copula. J. Hydrol. Eng. 2007, 12, 431–439. [Google Scholar] [CrossRef]
  20. Yan, B.W.; Chen, L. Coincidence probability of precipitation for the middle route of South-to-North water transfer project in China. J. Hydrol. 2013, 499, 19–26. [Google Scholar] [CrossRef]
  21. Mazouz, R.; Assani, A.A.; Quessy, J.F.; Légaré, G. Comparison of the interannual variability of spring heavy floods characteristics of tributaries of the St. Lawrence River in Quebec (Canada). Adv. Water Resour. 2012, 35, 110–120. [Google Scholar] [CrossRef]
  22. Chang, J.X.; Wang, Y.M.; Istanbulluoglu, E.; Bai, T.; Huang, Q.; Yang, D.W.; Huang, S.Z. Impact of climate change and human activities on runoff in the Weihe River Basin, China. Quat. Int. 2015, 380, 169–179. [Google Scholar] [CrossRef]
  23. Wang, Z.Y.; Wu, B.S.; Wang, G.Q. Fluvial processes and morphological response in the Yellow and Weihe Rivers to closure and operation of Sanmenxia Dam. Geomorphology 2007, 91, 65–79. [Google Scholar] [CrossRef]
  24. Zheng, S.; Wu, B.; Thorne, C.; Tan, G. Case Study of Variation of Sedimentation in the Yellow and Wei Rivers. J. Hydraul. Eng. 2015, 141, 05014009. [Google Scholar] [CrossRef]
  25. Merriam, C.F. A comprehensive study of the rainfall on the Susquehanna Valley. Trans. Am. Geophys. Union 1937, 18, 471–476. [Google Scholar] [CrossRef]
  26. Searcy, J.K.; Hardisoni, C.H.; Langbein, W.B. Double Mass Curves, Geological Survey Water Supply Paper 1541-B; US Geological Survey: Washington, DC, USA, 1960.
  27. Nelsen, R.B. An Introduction to Copulas (Lecture Notes in Statistics 139); Springer: New York, NY, USA, 1999. [Google Scholar]
  28. Jiang, C.; Zhang, W.; Wang, B.; Han, X. Structural reliability analysis using a copula-function-based evidence theory model. Comput. Struct. 2014, 143, 19–31. [Google Scholar] [CrossRef]
  29. Genest, C.; Rémillard, B.; Beaudoin, D. Goodness-of-fit tests for copulas: A review and a power study. Insur. Math. Econ. 2009, 44, 199–213. [Google Scholar] [CrossRef]
  30. Kojadinovic, I.; Yan, J.; Holmes, M. Fast large-sample goodness-of-fit tests for copulas. Stat. Sin. 2011, 21, 841–871. [Google Scholar] [CrossRef]
  31. Masina, M.; Lamberti, A.; Archetti, R. Coastal flooding: A copula based approach for estimating the joint probability of water levels and waves. Coast. Eng. 2015, 97, 37–52. [Google Scholar] [CrossRef]
  32. Zhu, H.Y.; Han, C.B.; Jia, Z.F.; Liu, Y.; Li, P.C. Analysis on characteristics of runoff and sediment of Zhangjiashan hydrological station and case study for Jing he River. Trans. CSAE 2012, 28, 48–55. [Google Scholar]
  33. Ma, Y.; Qin, B.S.; Wang, H.; Zhao, J.X. Variations of water and sediment of the Weihe River and impact factors analysis. Soil Water Conserv. China 2002, 8, 18–20. (In Chinese) [Google Scholar]
  34. Ran, D.C. Water and sediment variation and ecological protection measures in the middle reach of the Yellow River. Resour. Sci. 2006, 28, 93–100. (In Chinese) [Google Scholar]
  35. Weiss, L.L.; Wilson, W.T. Evaluation of significance of slope changes in double-mass curves. Trans. Am. Geopphys. Union 1953, 34, 893–896. [Google Scholar] [CrossRef]
  36. Hurvich, C.M.; Tsai, C.L. Regressionand time series model selection in small samples. Biometrika 1989, 76, 297–307. [Google Scholar] [CrossRef]
  37. Machado, M.J.; Botero, B.A.; López, J.; Francés, F.; Díez-Herrero, A.; Benito, G. Flood frequency analysis of historical flood data under stationary and non-stationary modelling. Hydrol. Earth Syst. Sci. Discuss. 2015, 12, 525–568. [Google Scholar] [CrossRef]
  38. Burnham, K.P.; Anderson, D.R. Model Selection and Multimodel Inference: A Practical Information-Theoretic Approach; Springer: Berlin, Germany, 2002. [Google Scholar]
  39. Xiong, L.H.; Jiang, C.; Xu, C.Y.; Yu, K.X.; Guo, S.L. A framework of change-point detection for multivariate hydrological series. Water Resour. Res. 2015, 51, 8198–8217. [Google Scholar] [CrossRef]
  40. Dias, A. Copula Inference for Finance and Insurance. Ph.D. Thesis, Eidgenössische Technische Hochschule Zürich, Zürich, Switzerland, 2004. [Google Scholar]
  41. Dung, N.V.; Merz, B.; Bárdossy, A.; Apel, H. Handling uncertainty in bivariate quantile estimation—An application to flood hazard analysis in the Mekong Delta. J. Hydrol. 2015, 527, 704–717. [Google Scholar] [CrossRef]
  42. Serinaldi, F. An uncertain journey around the tails of multivariate hydrological distributions. Water Resour. Res. 2013, 49, 6527–6547. [Google Scholar] [CrossRef]
  43. Serinaldi, F. Assessing the applicability of fractional order statistics for computing confidence intervals for extreme quantiles. J. Hydrol. 2009, 376, 528–541. [Google Scholar] [CrossRef]
  44. Zhang, Q.; Xiao, M.; Singh, V.P. Uncertainty evaluation of copula analysis of hydrological droughts in the East River basin, China. Glob. Planet. Chang. 2015, 129, 1–9. [Google Scholar] [CrossRef]
  45. Serinaldi, F. Can we tell more than we can know? The limits of bivariate drought analysis in the United States. Stoch. Environ. Res. Risk Assess. 2015, 60, 1–14. [Google Scholar]
  46. Hyndman, R.J.; Bashtannyk, D.M.; Grunwald, G.K. Estimating and visualizing conditional densities. J. Comput. Graph. Stat. 1996, 5, 315–336. [Google Scholar]
  47. Hdrcde: Highest Density Regions and Conditional Density Estimation. Available online: http://www.robjhyndman.com/software/hdrcde (accessed on 19 May 2016).
Figure 1. Locations of hydrological stations in the WRB.
Water 08 00223 g001
Figure 2. The annual runoff and sediment data series from six gauging stationsi n the WRB. R and S denote the runoff and sediment, respectively.
Water 08 00223 g002
Figure 3. The double mass curves of annual runoff and sediment for the hydrological stations in the WRB. (a) Linjiacun station; (b) Weijiabu station; (c) Xianyang station; (d) Huaxian station; (e) Zhangjiashan station; (f) Zhuangtou station.
Water 08 00223 g003aWater 08 00223 g003b
Figure 4. Uncertainty of joint probability for annual runoff and sediment with the joint probability P = 0.7 in different periods at the six gauging stations in the WRB. The colors of the filled regions indicate 95% and 99% joint confidence areas. The observed runoff and sediment data are shown as empty circles.
Water 08 00223 g004aWater 08 00223 g004b
Table 1. Three common Archimedean copula functions in the field of hydrology research.
Archimedean Copula C q ( u , v ) Range
Clayton ( u q + v q 1 ) 1 / q q > 0
Frank 1 q l n [ 1 + ( e q u 1 ) ( e q v 1 ) e q 1 ] q R
Gumbel-hougaard e x p [ ( ( l n u ) q + ( l n v ) q ) 1 / q ] q 1
Table 2. The combinations of high-low annual runoff and sediment yield.
CombinationSHSNSL
RH P ( R r p f , S s p f ) P ( R r p f , s p k < S < s p f ) P ( R r p f , S s p k )
RN P ( r p k < R < r p f , S s p f ) P ( r p k < R < r p f , s p k < S < s p f ) P ( r p k < R < r p f , S s p k )
RL P ( R r p k , S s p f ) P ( R r p k , s p k < S < s p f ) P ( R r p k , S s p k )
Notes: R, runoff; S, sediment yield; RH, RN and RL are the high, normal and low runoff respectively; SH, SN and SL mean the high, normal and low sediment yield respectively; rpf (spf) denotes the high runoff (sediment) determined by the frequency of 25%;. rpk (spk) means the low runoff (sediment) determined by the frequency of 75%.
Table 3. Runoff and sediment reduction from primary anthropogenic activities at Huaxian station from 1960s to 1990s.
MeasureTerraceAfforestationGrass PlantingDam BuildingWater ProjectsIndustrial and Domestic Water
1960s
S reduction(104 t)181131414611620
R reduction(104 m3)90532084137850217260
1970s
S reduction(104 t)700842986643120
R reduction(104 m3)363011182138482222639419
1980s
S reduction(104 t)142819012555528350
R reduction(104 m3)8418387082352822720411102
1990s
S reduction(104 t)184133127129825820
R reduction(104 m3)83384063154330425682213756
Note: S and R denote sediment yield and runoff, respectively. The data were collected from [33,34].
Table 4. Inflection points of runoff-sediment relationship at the six hydrological stations in the WRB.
StationLinjiacunWeijiabuXianyangHuaxianZhangjiashanZhuangtou
Change point19751982 *1983 *1981 *19831981 *
Note: * denotes that the inflection point of RSR is significant at the 5% significance level.
Table 5. The goodness-of-fit test, AICc and parameters of copula functions.
StationPeriodClaytonGumbel-HougaardFrank
θAICcSnp-ValueθAICcSnp-ValueθAICcSnp-Value
Linjiacun1956–20101.88−171.130.1010.0032.23−180.880.0530.0028.26−195.320.0220.495
Weijiabu1956–19821.55−82.970.0330.4161.63−76.630.0480.0733.81−78.750.0500.076
1983–20101.75−80.610.1100.0012.49−91.530.0360.1608.66−95.120.0300.479
Xianyang1956–19831.05−87.420.0310.4863.32−65.200.0330.4581.44−87.3260.0340.479
1984–20101.15−78.150.1150.0012.12−87.970.0300.4106.42−90.200.0270.471
Huaxian1956–19811.39−86.020.0320.4331.61−82.690.0310.6483.77−85.080.0340.462
1982–20100.41−89.040.0850.0201.36−94.180.0470.1122.50−92.980.0560.027
Zhangjiashan1956–20101.50−185.840.0700.0102.14−200.350.0170.7936.00−200.090.0270.290
Zhuangtou1956–19811.22−81.310.0490.0981.61−81.630.0330.5583.87−83.000.0380.366
1981–20101.24−81.160.0490.0352.00−74.080.0340.3453.92−82.780.0410.159
Table 6. Synchronous-asynchronous joint probability of high-low runoff and sediment in the WRB.
StationPeriodSynchronous Joint Probabilities (%)Asynchronous Joint Probabilities (%)
RH-SHRN-SNRL-SLRH-SLRH-SNRN-SHRN-SLRL-SHRL-SN
Linjiacun1956–201017.41
(15.84, 19.34)
35.12
(32.50, 38.71)
17.41
(15.84, 19.34)
0.15
(0.03, 0.59)
7.44
(5.94, 9.30)
7.44
(5.94, 9.30)
7.44
(5.94, 9.30)
0.15
(0.03, 0.59)
7.44
(5.94, 9.30)
Weijiabu1956–198211.51
(8.01, 13.02)
30.14
(26.08, 32.41)
16.63
(10.43, 18.50)
1.00
(0.65, 4.21)
12.48
(11.98, 13.24)
12.48
(11.98, 13.24)
7.38
(6.61, 11.06)
1.00
(0.65, 4.21)
7.38
(6.61, 11.06)
1983–201017.69
(15.22, 20.11)
35.61
(31.57, 40.22)
17.66
(15.22, 20.11)
0.12
(0.05, 0.72)
7.20
(6.31, 9.59)
7.20
(6.31, 9.59)
7.20
(6.31, 9.59)
0.12
(0.05, 0.72)
7.20
(6.31, 9.59)
Xianyang1956–198310.14
(7.91, 12.69)
28.32
(26.00, 31.90)
14.54
(10.21, 18.12)
1.81
(0.85, 5.68)
13.04
(12.30, 13.24)
13.04
(12.30, 13.24)
8.65
(7.07, 12.14)
1.81
(0.85, 5.68)
8.65
(7.07, 12.14)
1984–201015.90
(13.15, 18.78)
32.56
(28.91, 37.64)
15.90
(13.15, 18.78)
0.40
(0.14, 1.60)
8.71
(7.34, 10.88)
8.71
(7.34, 10.88)
8.71
(7.34, 10.88)
0.40
(0.14, 1.60)
8.71
(7.34, 10.88)
Huaxian1956–198111.10
(8.25, 14.05)
29.55
(26.29, 34.06)
16.03
(10.96, 19.55)
1.21
(0.31, 4.26)
12.69
(11.08, 13.24)
12.69
(11.08, 13.24)
7.76
(5.57, 11.11)
1.21
(0.31, 4.26)
7.76
(5.57, 11.11)
1982–201011.95
(6.25, 15.98)
27.46
(25.00, 31.32)
9.95
(6.25, 13.49)
2.79
(0.93, 6.25)
10.27
(8.09, 12.50)
10.27
(8.09, 12.50)
12.26
(10.59, 12.62)
2.79
(0.93, 6.25)
12.26
(10.59, 12.62)
Zhangjiashan1956–201017.14
(13.90, 19.06)
32.93
(29.03, 36.20)
14.67
(11.55, 16.80)
0.56
(0.35, 3.01)
7.30
(6.65, 10.44)
7.30
(6.65, 10.44)
9.77
(9.06, 12.35)
0.56
(0.35, 3.01)
9.77
(9.06, 12.35)
Zhuangtou1956–198112.89
(9.52, 17.00)
28.62
(25.91, 34.40)
12.89
(9.52, 17.00)
1.42
(0.46, 4.26)
10.69
(8.93, 12.29)
10.69
(8.93, 12.29)
10.69
(8.93, 12.29)
1.42
(0.46, 4.26)
10.69
(8.93, 12.29)
1982–201012.95
(9.97, 16.07)
28.68
(26.17, 32.86)
12.95
(9.97, 16.07)
1.39
(0.55, 4.49)
10.66
(9.18, 12.34)
10.66
(9.18, 12.34)
10.66
(9.18, 12.34)
1.39
(0.55, 4.49)
10.66
(9.18, 12.34)

