1. Introduction
Numerous reservoirs have been constructed for the purpose of flood control and meeting the increasing energy demand. These reservoirs have impacted on the natural runoff [
1] and the flow regime [
2]. To understand the impact of these changes on the natural environment, many indicators were proposed to assess the hydrologic alterations.
The Indicators of Hydrologic Alteration (IHA) method, which contains 33 hydrologic parameters, has been widely used to evaluate the ecological effect of the hydrologic alteration [
3,
4]. Clausen and Biggs [
5] studied flow variables for ecological analysis in temperate streams. Pettit
et al. [
6] identified the natural flow regime in two western Australian rivers and compared their relationships with riparian vegetation. Maingi and Marsh [
7] used the IHA method combined with statistical methods to compare the incoming flow of Tana River in Kenya before and after construction of reservoirs; their results showed that the construction of reservoirs increased the minimum discharge, reduced the peak discharge, and affected the hydrologic regime. Shieh
et al. [
8] applied IHA for assessing rivers in southern Taiwan, and obtained similar conclusions. Olden and Poff [
4] used long-term flow records from 420 locations across the USA and found that the IHAs adequately represented the entire ordination space by using 171 hydrologic factors (including the seasonal patterning of flows; timing of extreme flows; frequency, predictability, and duration of floods, droughts, and intermittent flows; daily, seasonal, and annual flow variability; rates of change; and so on).
Gao
et al. [
9] analyzed the correlation between the eco-flow metrics and IHA parameters, proposing the 25th to 75th percentile range as river management targets. Zhang
et al. [
10] used the SWAT model to simulate stream flow for quantifying the impact of human activities on stream flow. Li
et al. [
11] analyzed the hydrological regime after the joint operation of four cascade reservoirs in the Yellow River basin and found that greater changes occurred.
Based on the IHA method, the Range of Variability Approach (RVA) is proposed by Richter
et al. [
12,
13] to describe the degree of change on the flow regimes. Black
et al. [
14] proposed using the Dundee Hydrological Regime Alteration (DHRA) method to evaluate the degree and range of alterations of hydrological regimes caused by human interference. Zhou
et al. [
15] found that the construction of reservoirs greatly increased the degree of complexity of hydrological processes, and this influence became less obvious with the increase of distance between water reservoirs and hydrological stations. Chen
et al. [
16] evaluated hydrological alterations along the upper and middle portions of East River with the use of RVA, and suggested that a sufficiently long hydrological record would improve the accuracy of IHA. Zhang
et al. [
17] analyzed hydrological alterations and environmental flow in the East River basin using the RVA technique and found that the hydrological regimes of the East River had been severely affected by hydropower generation. Rheinheimer
et al. [
18] explored the potential trade-offs between optimal environmental releases from the Three Gorges Reservoir (TGR) and hydropower generation using three performance indicators. Furat
et al. [
19] integrated IHA and generic formulas to assess the hydrological changes in the Lesser Zab River, and found that more changes were perceived between 1999 and 2013. However, most of these studies have focused on the impact of a single reservoir on a river hydrologic regime [
11]. It is now common to find the cascaded-reservoirs group in a basin such as the Yangtze and Yellow River basins in China. Therefore, quantifying the impacts of cascade reservoir group operation on hydrological regime will be important for water resources management, particularly for ecological scheduling.
The purpose of this study is to investigate the impact of 24 large reservoirs on the flow regime at Yichang and Datong hydrological stations in the Yangtze River (Changjiang) basin, China. Using IHA, RVA, and DHRA methods to analyze the effects of reservoirs on downstream flow regimes is common. However, these methods require long data series that are difficult to collect in practice. A new typical year assessment method that can avoid the requirement for a long data series is proposed to count the number of IHA factors within the normal ranges and study the variation of hydrologic regime in recent years.
The research procedures are described as follows. Firstly, the Mann–Kendall rank correlation test is used for significance analysis of observed flow series possibly affected by the reservoir operation, during which the flow series are divided into pre- and post-dam construction periods. Secondly, the IHA method is used to calculate the hydrologic regime factors, while the RVA and DHRA methods are used to assess the alternation of flow regime. Thirdly, a new typical year assessment method is proposed to study the variation of hydrologic regime in recent years. Finally, the results of these methods are compared and discussed.
2. Study Basin and Data
The Yangtze River, with a length of 6300 km and drainage area of 1.8 million km
2, flows from west to east and is the largest river in China. It is located in a subtropical monsoon region. Annual mean precipitation is about 1100 mm, decreasing from southeast to northwest. In the middle and downstream of the Yangtze River, flooding is mainly caused by heavy rainfall and upstream floods. According to historical records from 185 BC to 1911, 214 large floods occurred in the middle and lower reaches of the Yangtze River, approximately once every 10 years. In the 20th century, major floods occurred in 1931, 1935, 1954, 1981, 1996, and 1998 [
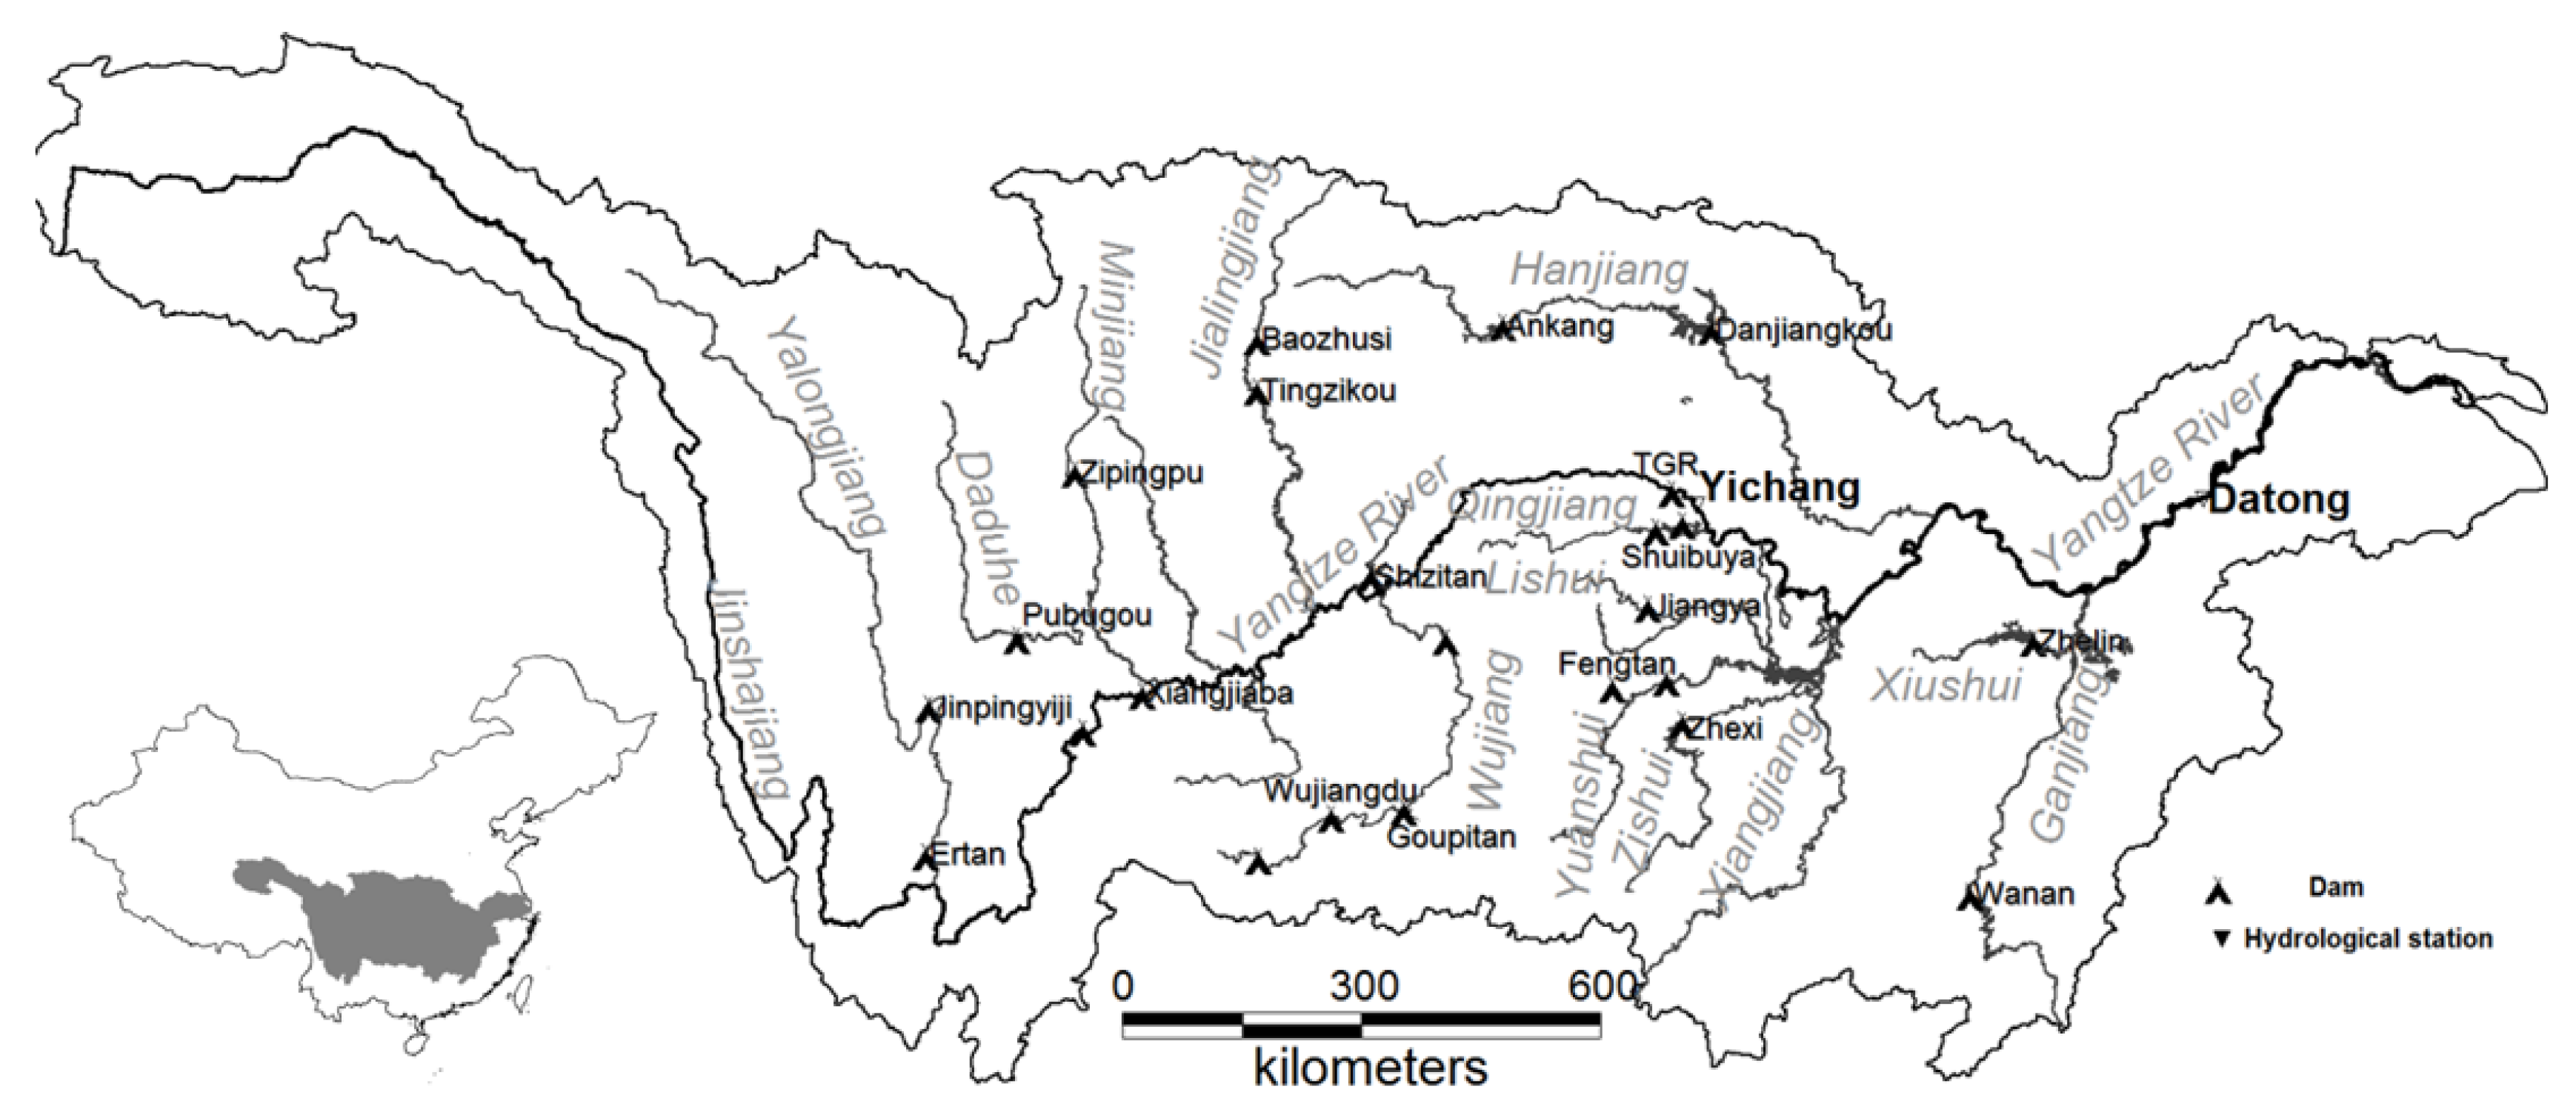
20]. Large reservoirs can be effective tools to control floods in the Yangtze River. In recent years, numerous reservoirs have been built (see
Figure 1) and put into operation in the upper Yangtze River basin. These reservoirs can store flood water, provide clean energy, and change natural runoff characteristics downstream.
2.1. Hydrological Stations
Yichang station is a representative hydrological station in the upper Yangtze River reach, covering an area of about 1 million km
2. It is located 43 km downstream of TGR. Water level and flow have been observed since 1877 and in 1946, respectively [
21]. In 1870, the flood peak discharge reached 105,000 m
3/s, the largest flood in the historical record [
20]. The construction and operation of large reservoirs in the upper Yangtze River reach could greatly lighten the pressure of flood control in the middle and lower reaches. According to incomplete statistics, the total storage capacity of large reservoirs planned in the upper reaches of the Yangtze River is over 160 billion m
3 [
22], which accounts for more than one third of total annual runoff at Yichang Station.
Datong is a representative hydrological station in the Yangtze River estuary. It is located in Guichi County, Anhui Province (as shown in
Figure 1), was established in 1922, and has provided continuous flow data since 1947. Its runoff reflects the amount of flow volume from the Yangtze River into the East China Sea).
Discharge data at Yichang and Datong stations were provided by Changjiang (Yangtze River) Water Resources Commission (CWRC). The mean daily discharge data from 1949 to 2014 were used in this study.
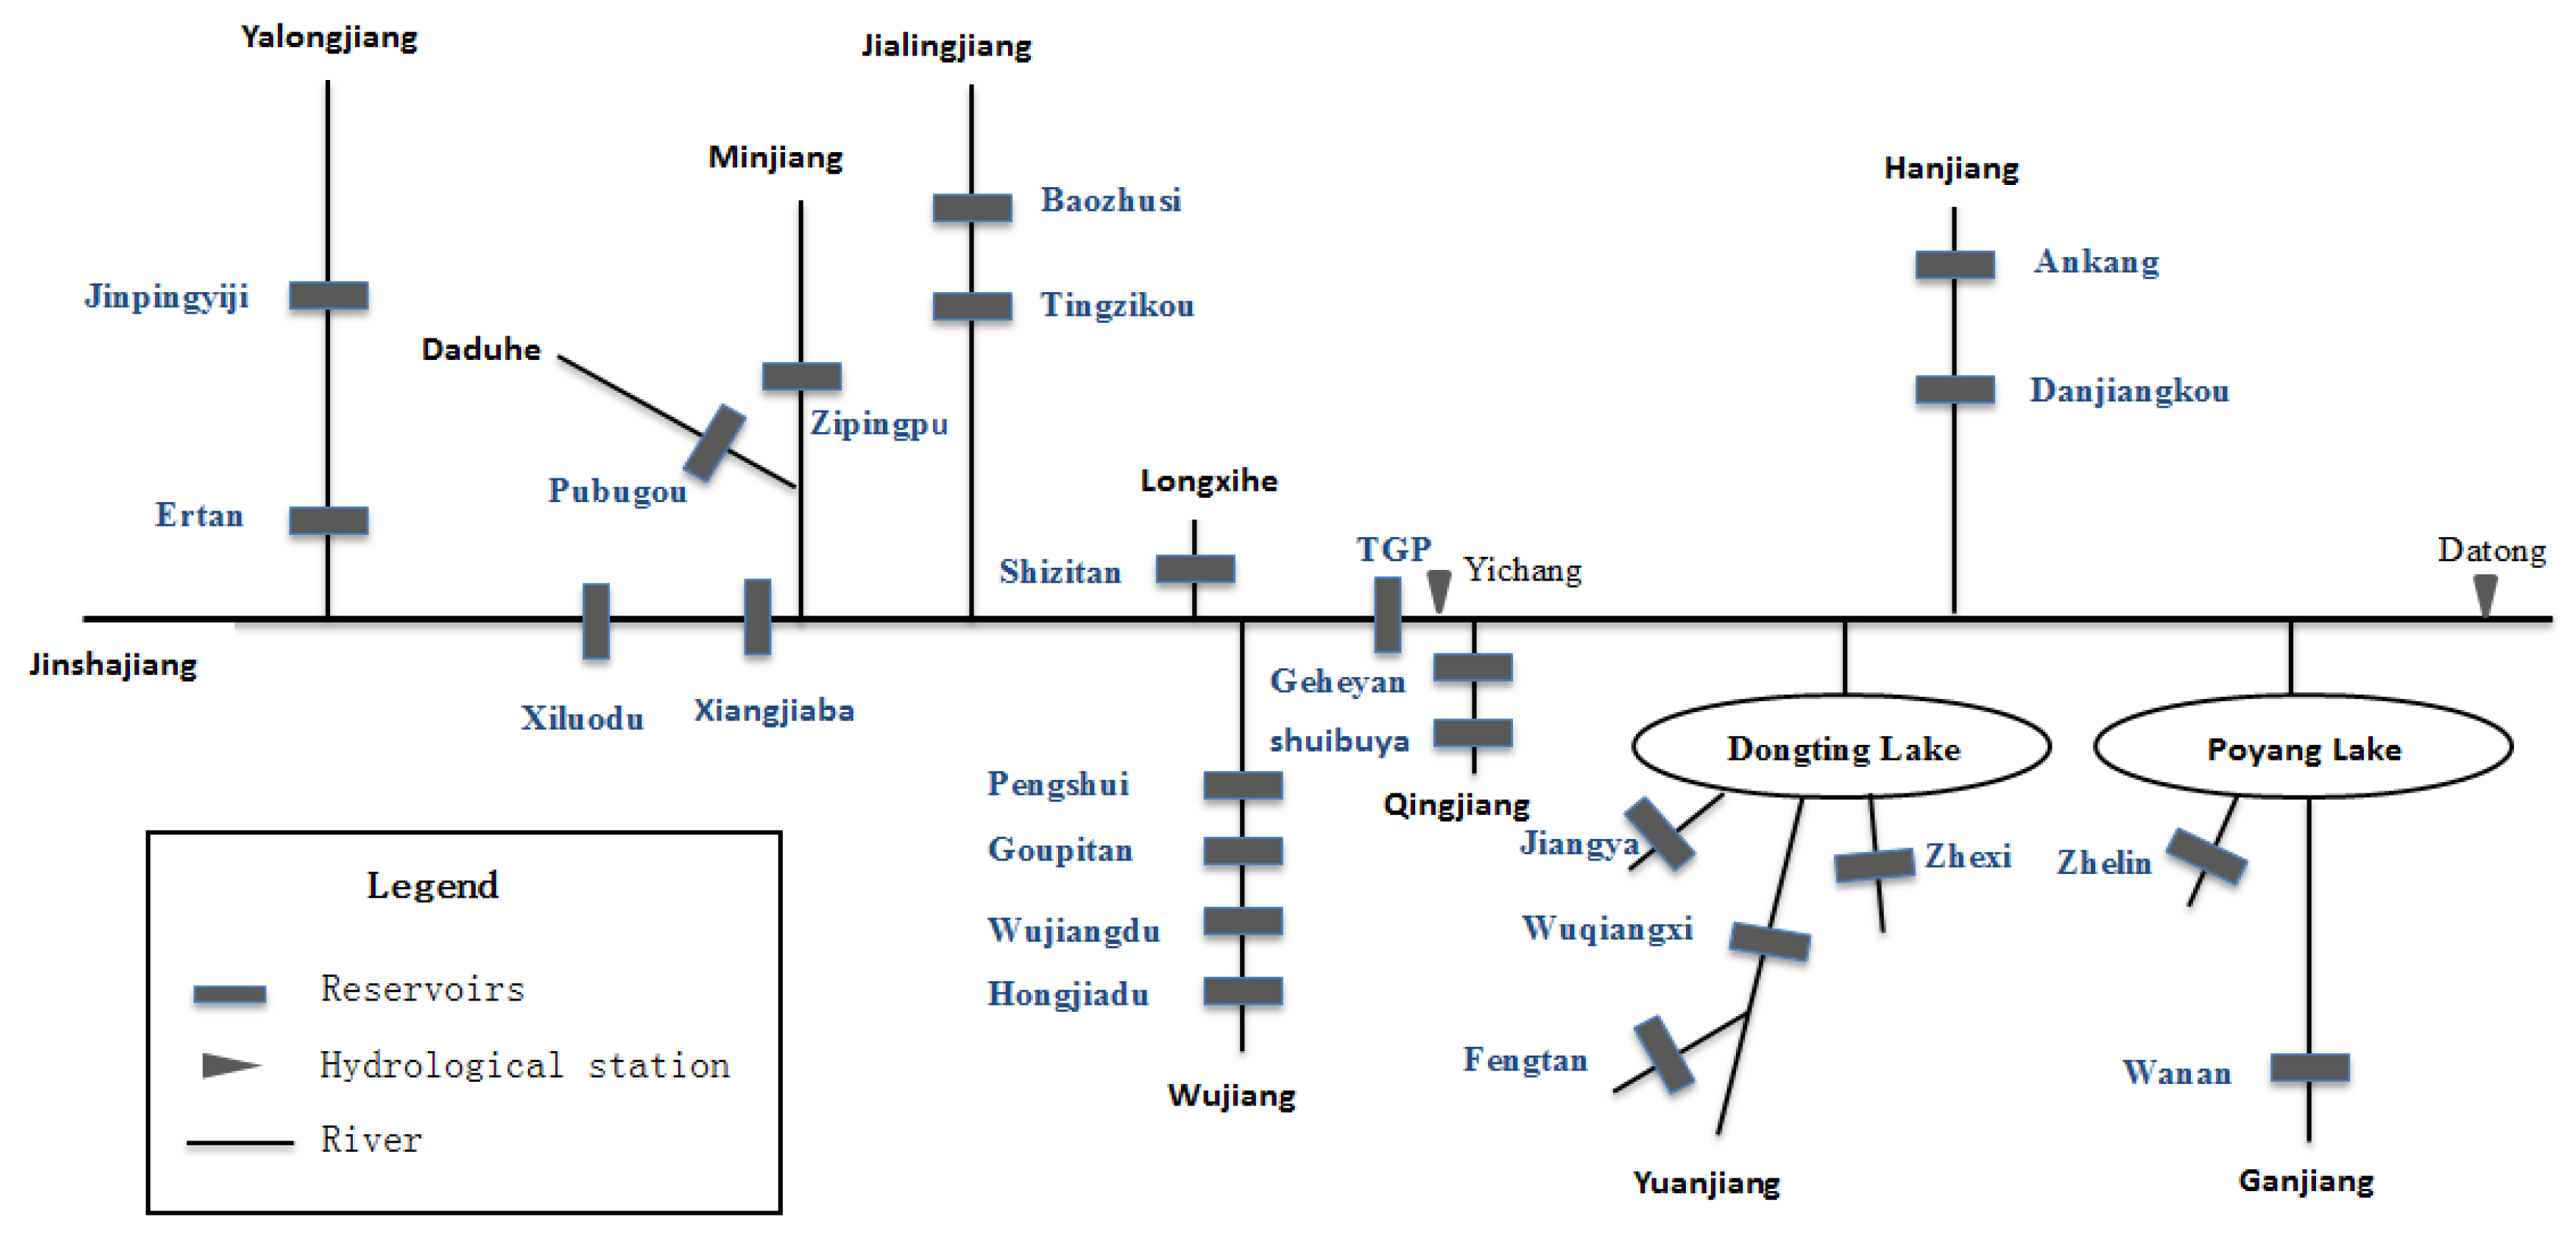
2.2. Reservoirs
Numerous large-scale reservoirs have been planned and constructed in the Yangtze River basin. Since these hydraulic constructions are owned by different management departments and companies, it is very difficult to collect data for all reservoirs. Given the fact that some reservoirs have limited effects on the runoff at Yichang and Datong stations, 24 large-scale reservoirs that have a significant impact on the spatial and temporal distribution of water resources in the Yangtze River were selected. The regulating storage capacity of each reservoir is greater than 500 million m
3. The characteristics of selected reservoirs and restore period are summarized in
Table 1. A sketch map of the main large reservoirs in the Yangtze River basin is shown in
Figure 2.
The operation policy and observed data (water level, inflow, outflow,
etc.) of 24 reservoirs were used to analyze the operation rules for factors’ change. These reservoirs are mainly located in the Jinsha River, Yalong River, Minjiang River, Wujiang River, and Yangtze River mainstream, as shown in
Figure 1. According to the operation rules, reservoirs located in the Jinsha River, Yalong River, and Minjiang River basins begin to store water in August and September, and become full at the end of September. The next stage is the water releasing stage, from October to the next year. The water level in the reservoir falls to dead water level until April and May and then rises again to the flood control limited water level in June. The reservoirs in the Wujiang River operate below the flood-limited levels in the flood season and start to impound water in September. The releasing stage lasts from October to May of the next year. The Baozhusi and Tingzikou reservoirs in the Jialing River basin are generally below the flood control limited level from July to September, impound water to the normal–high level in October, enter the releasing stage until late May, and return to the flood control limited level in June. The TGR generally begins to store water in September and impounds water to the normal level by the end of October. The water level falls rapidly in January, then more rapidly in late May, and reaches the flood control limited water level on 10 June.
Considering the overall impact of reservoirs in the upper Yangtze River reach, the runoff at Yichang station increases from January to May and slightly increases in December, but is reduced from July to October and drastically reduced during the refill period from September to October.
The reservoirs in the middle and lower Yangtze River basin are mainly distributed in the Qingjiang River, Hanjiang River, Dongting Lake (Xiangjiang River, Yuanjiang River, Zishui River,
etc.), and Poyang Lake river systems (Xiushui River, Ganjiang River,
etc.), as shown in
Figure 1.
Reservoirs in the Qingjiang River basin keep water levels below the flood control limited levels in June and July. The refill stage begins at August and completes in late October. The water level starts to fall in November and reaches the lowest point in March to April of the next year. Reservoirs in the Hanjiang River basin keep the water levels below flood control limited levels in July and August, and start to impound water in September to reach the highest water level in October. The water levels fall in late October, fall more rapidly in February of the next year, and approach the dead water level in late May. The flood season for Dongting Lake and Poyang Lake generally comes early in March or April. The water level of reservoirs in the Xiangjiang River, Yuanjiang River, and Zishui River basins generally rises in April or May and reaches the flood control limited levels in June. The reservoirs begin to store water in August, and achieve the highest level in September and October. The water levels fall in November, more rapidly from December to the next January, and to the lowest water levels in March and April. Reservoirs in the Xiushui River and Gan River basins gradually store water in June, reach to the normal high water levels; begin to fall in January of the following year and below the flood control limited levels in late April.
Based on the above analysis, the water releasing stage of the reservoirs in the middle and lower Yangtze River basin are basically consistent with those in the upper reach, but they impound water much earlier in the late flood season. These water releasing and storing processes have altered the natural flow in the downstream.
2.3. Division of Observed Flow Data Series
Since the construction of reservoirs in the upper Yangtze River is a gradual process, no clear timeline has been detected before and after the construction. As shown in
Table 1, the 24 large reservoirs selected for this study were mostly built after the 1990s, except for six, namely Wujiangdu, Shizitan, Danjiangkou, Fengtan, Zhexi, and Zhelin. The flood peak interception during the flood season and water storage at post-freshet period by the reservoirs affects the annual maximum flow, and the runoff from September to October; these reservoirs also impact on the average flow from January to March and the annual minimum flow.
The Mann–Kendall rank correlation test (referred to as the MK test) was used to determine the number of paired values appearing in the series and construct the test statistic MK to verify whether significant change occurred in the hydrologic series [
23]. The statistic MK is calculated by:
where
P is the number of paired observed values in the runoff series, and
N is the length of series. The reliability α was set to 0.05 and the corresponding critical value MK is 1.96. If
< 1.96, then runoff series is considered without trend change.
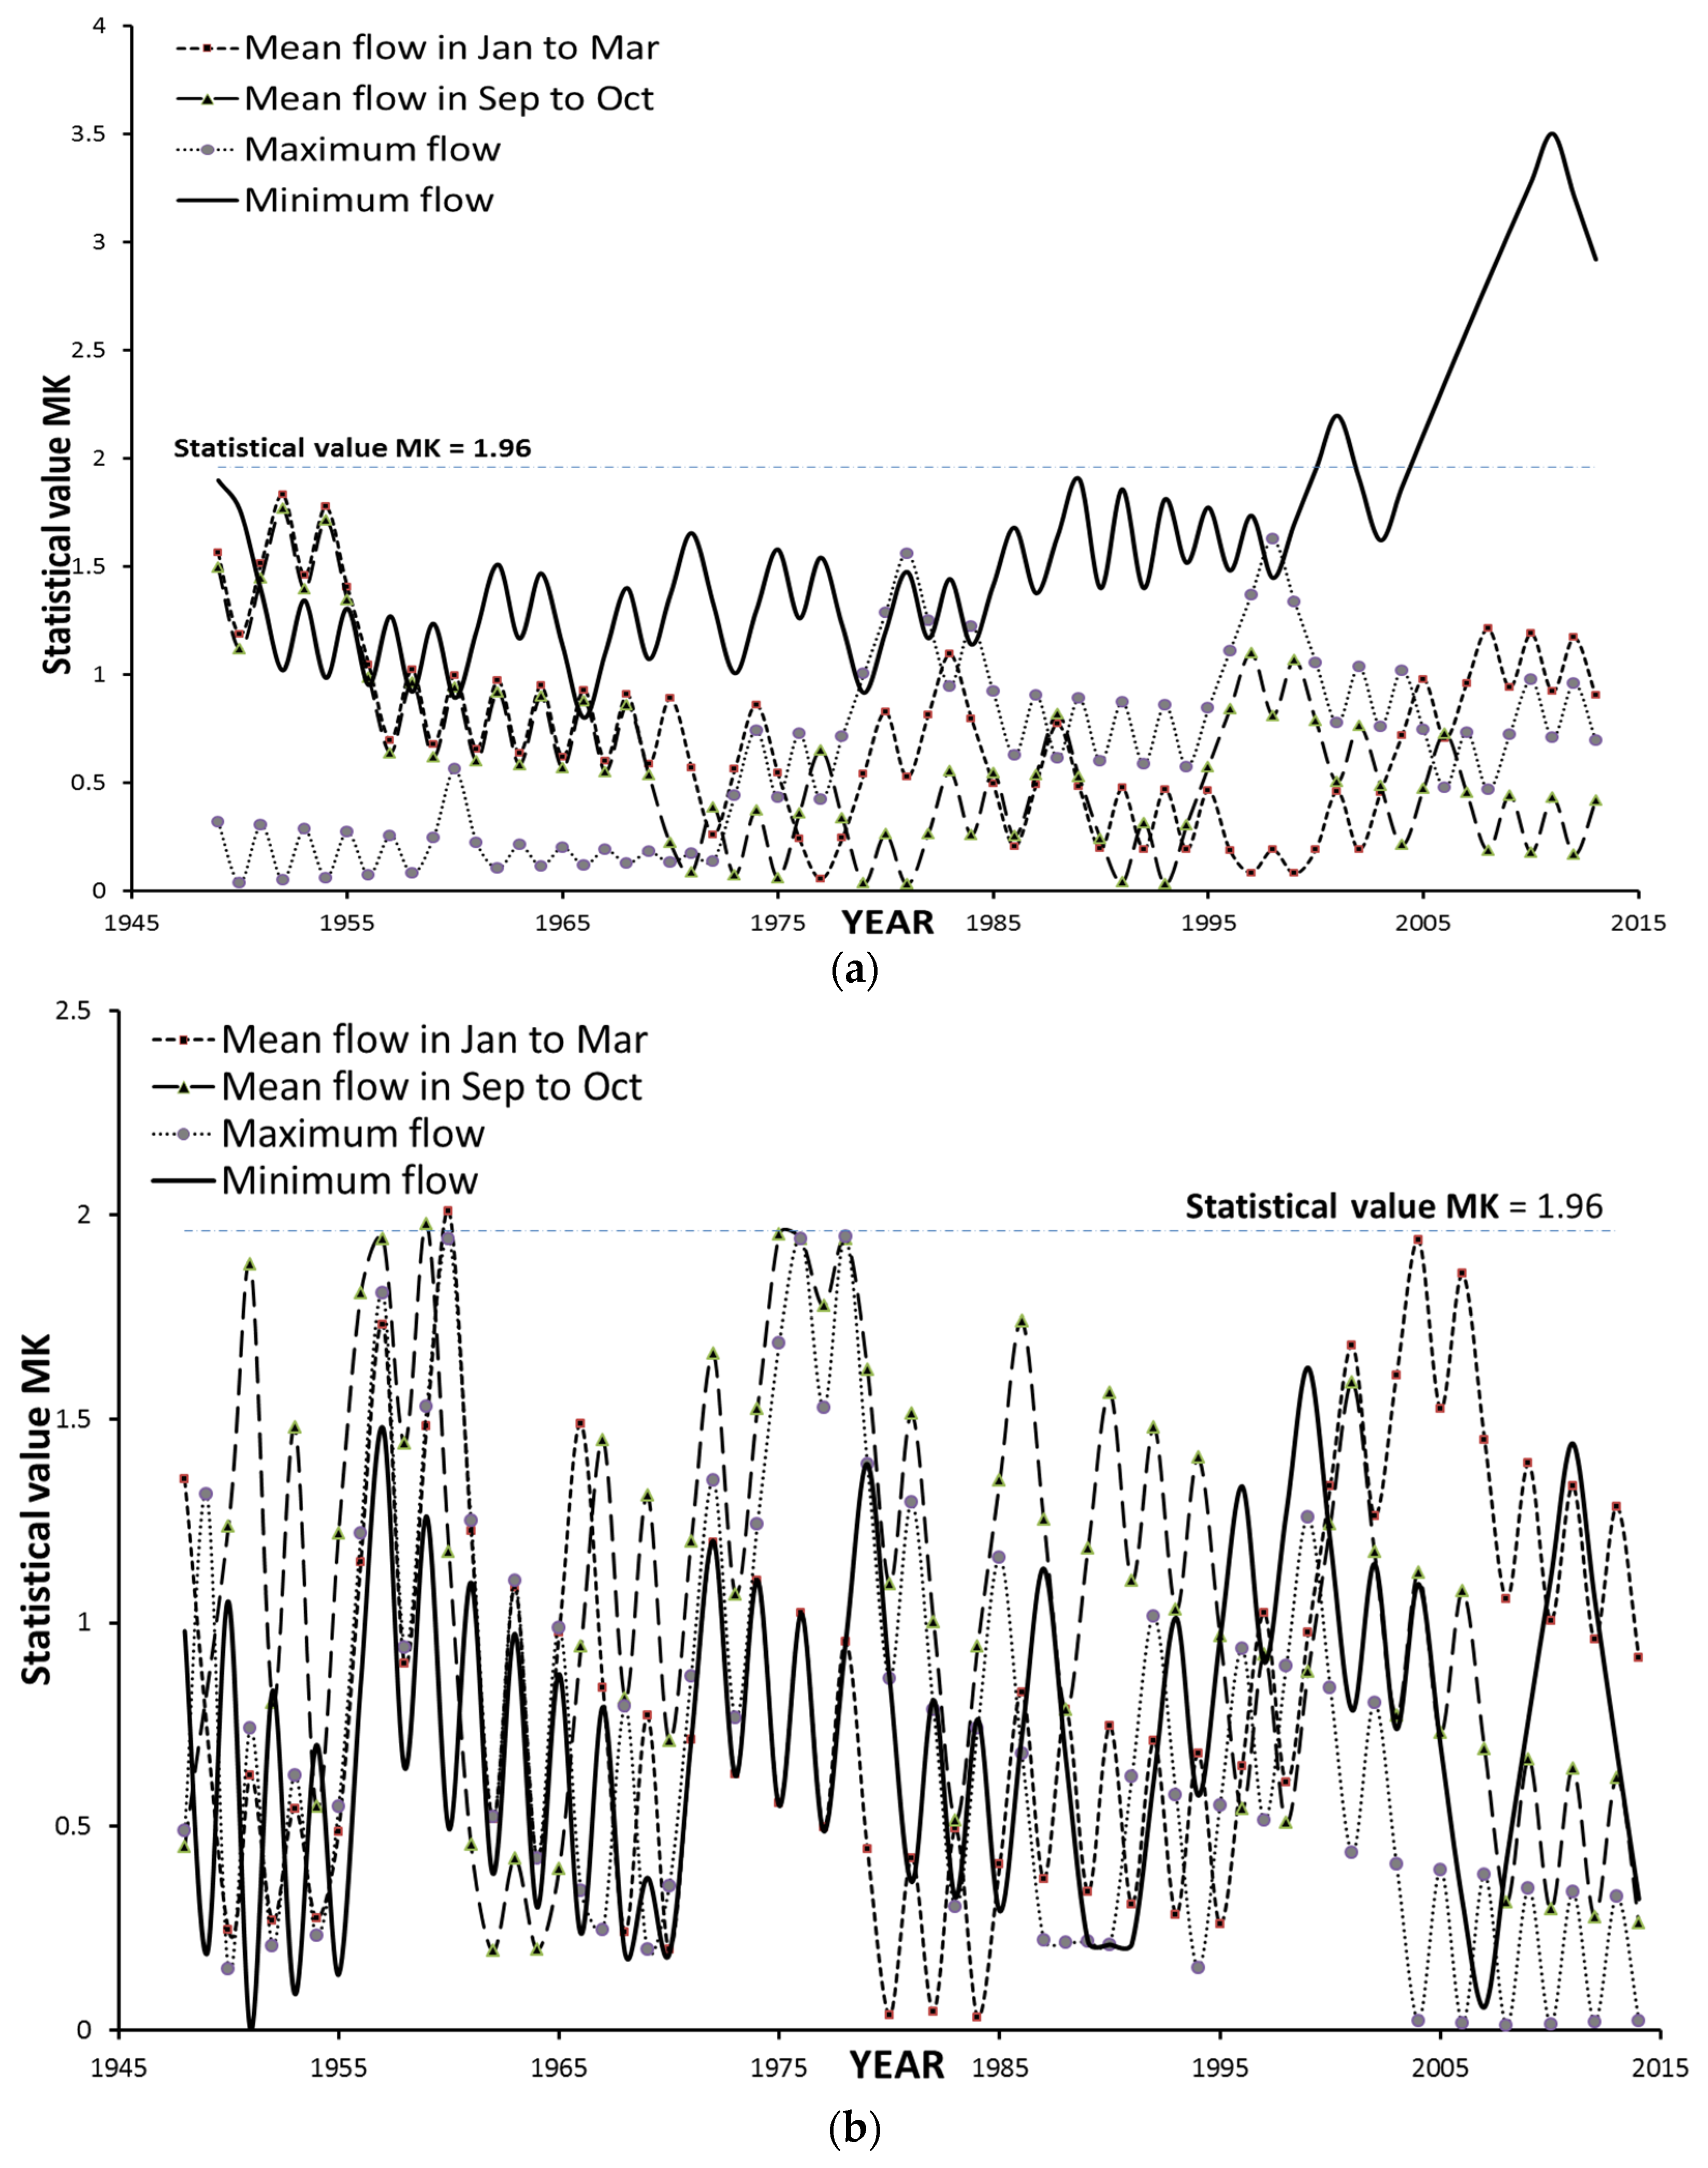
The trend tests were conducted for the flow series during the dry season (January to March), the flow series at the post-freshet period (from September to October), annual maximum flow series, and annual minimum flow series at Yichang and Datong stations. The changing trends of the test statistic were plotted in
Figure 3.
Figure 3 shows that no significant change has been detected in the series of mean flows during the dry season, the post-freshet period, or the annual maximum flow at Yichang station. However, the annual minimum flow has undergone significant change after 2000, as it has increased after 2004 with the MK value above 3.5.
The Ertan reservoir with total storage capacity of 6.14 billion m3 started to store water in 1999, and the minimum flow of Yichang has been affected by the Ertan reservoir operation since early 2000. Therefore, the year 1999 is taken as the dividing year for pre- and post-dam construction, i.e., 1949–1998 data series as natural stream flow and 1999–2014 data series as the changed series at Yichang station. The dividing year for pre- and post-dam construction at Datong station is considered the same as that of Yichang station since it is located downstream and there were no larger reservoirs constructed in the middle Yangtze River basin before 1999.
Meanwhile, Three Gorges Reservoir (TGR), near Yichang station, is the largest water resources project in the world. It first impounded water to the normal level (175 m) in 2008 [
18]. In order to fully understand the impact of TGR on the hydrologic regime of Yichang and Datong stations, the daily flow series during 2008–2014 are also used as extra data to provide a reference for the analysis of recent hydrologic regime changes.
2.4. Restoring Natural Flow Data Series
If changes in the hydrograph are mainly caused by the construction of reservoirs, it is possible to calculate the reservoirs’ impacts on observed discharge based on water balance and the river flow routing method. It is considered that natural river flow is the sum of routed discharge and observed discharge. The routed discharge can be calculated by routing the reservoir holdouts (increments of stored water) to a downstream station. The water balance equation is usually used to restore natural flow [
22,
24],
i.e., the stored water flow discharge of the reservoir is:
where
Vt and
Vt−1 are reservoir storages at the end of interval
t and
t − 1, respectively (m
3); Δ
t is the length of time interval (s); and
QS is the stored water flow discharge (m
3/s).
The natural river flow discharge at the gauge station is:
in which
where
Qn and
Qo are the natural and observed river flow discharges at the gauge station, respectively (m
3/s);
QR is the reservoir stored water flow routed to the gauge station by the Muskingum method (m
3/s); and
C1,
C2, and
C3 are routing coefficients that are defined in terms of Δ
t,
K, and
x:
in which
K and
x rating by the measured data.
As
Table 1 shows, there are four reservoirs (Ertan, Baozhusi, Wujiangdu, Shizitan) locate in the upper Yangtze River basin, and eight reservoirs (Geheyan, Fengtan, Wuqiangxi, Zhexi, Ankang, Danjiangkou, Zhelin, Wanan) locate in the middle and lower Yangtze River basin, which started operation before 1998. Therefore, the observed flow series at Yichang and Datong stations need to be restored to natural flows through Equations (2)–(5). The impound water periods of these reservoirs are listed in
Table 1.
Before 1998, only the 10-day data series of water level were collected from the Ertan, Geheyan, Ankang, and Danjiangkou reservoirs. Equations (2)–(5) are used to convert these data into the affected flow. The monthly mean flow comparison is shown in
Table 2.
The comparison results of the flow series at Yichang station before and after data restoration show that the reservoirs have slight impacts on the stream flow and runoff since all of them were constructed before 1998 and located at tributaries. In most years, the runoff variation is small in both series.
The monthly mean flow at Datong station decreased slightly from December to February after the data series was restored. Analysis reveals that many reservoirs in the middle and lower Yangtze River reaches cannot attain the normal–high water level most years, and these reservoirs are located on tributaries with small impacts on the main river flow.
Unless otherwise specified, the restored flow series during period of 1949–1998 are regarded as the natural flow series in this study.
3. Methodologies
3.1. IHA Method
The IHA method includes 33 parameters, which are divided into five categories as follows: the magnitude of monthly flow, magnitude and duration of annual extreme flow, time of annual extreme flow, frequency and duration of high and low pulses, and rate and frequency of flow changes [
3].
The IHA method provides a systematic tool to analyze the historical hydrological changes in a river. It represents the entire ordination space occupied by the 171 hydrologic indices, and can be simply implemented when long series of gauged data have been collected on the same reaches of the river.
3.2. RVA Method
Based on the IHA method, the RVA is implemented to evaluate the change degree of flow. The RVA consists of the following steps [
12,
25]:
- (1)
The natural range of stream flow during 1949–1998 is calculated using the 33 parameters of the IHA method.
- (2)
The RVA targets for each 33 IHA parameters are set. In general, the normal range was defined as 25%–75% [
9,
17,
25]. Since most of the reservoirs in the upper Yangtze River reach were built in the past 20 years, the data series is short after construction. If an indicator falls outside the RVA targets, it may have a great impact on the analysis of variability. Therefore, 90% and 10% of the probability of occurrence before change of each indicator are selected as the RVA targets.
- (3)
The values of the 33 parameters are calculated with flow series from 1999 to 2014.
- (4)
Based on the difference between the RVA targets and calculated values, the measure of hydrologic alteration is obtained as a percentage
Di as follows [
25]:
where
Y0i is the calculated or observed frequency and
Yf is the targeted frequency.
The RVA method is divided into three levels of hydrological variability: a Di value between 0% and 33% is a low degree of change; the 33% ~ 67% range implies moderate change; and 67% ~ 100% is a high level of change.
The RVA method can only calculate the change in individual factors. How many factors can represent the overall variation of rivers has been studied by some scholars. Shiau
et al. [
26] proposed assessing the holistic variation of hydrological characteristics using the weight average method, but this method highlighted the indicators with a large degree of change, neglecting those with moderate and low change. Shiau
et al. [
27] put forward a new assessment method in which the change degree is calculated by:
where
D0 represents the overall change degree of the rivers and
Di denotes the change of degree for each factor. Taking into account the large stream of the Yangtze River basin, a single factor change does not reflect the overall change of the river. This study uses Equation (7) to calculate the overall degree of hydrologic alteration.
3.3. DHRA Method
The DHRA method proposed by Black
et al. [
14] is used to evaluate the degree and range of alterations of hydrological regimes due to human interference. A larger percentage value indicates a larger alteration in the hydrological regime and hence a higher damage risk of the flow regime. The IHA method provides descriptors of regime change in five groups [
3]. For each of the 33 descriptors, the absolute percentage changes in mean and coefficient of variation (CV) are generated. According to the variation of factors in each group and CV, the alteration can be assessed for each factor (1 to 3, where 1 denotes the lowest alteration degree and 3 the highest alteration degree), then the total alteration value of each group of factors is summarized to assess the degree of change in the flow regime.
In the DHRA method, the hydrological impact is assessed through the IHA descriptors. The final output is a DHRA method class between Class 1 (Un-impacted condition) and Class 5 (Severely impacted condition), as shown in
Table 3.
In this study, the RVA and DHRA methods were both used to evaluate the degree of hydrological alterations.
3.4. Proposed Typical Year Assessment Method
From the foregoing analysis, it is shown that when the RVA and DHRA methods are used to evaluate the degree of hydrological alternation for a river, observed flow data series must be long enough in order to avoid the occurrence of extreme hydrological events in some years [
28]. If the length of a data series is short, it is difficult to explain the regime variations of rivers only by adopting the RVA and DHAR methods. A new typical year assessment method for analyzing IHA factors is proposed and described as follows:
- (1)
Calculate IHA factors of natural flow in each year before the reservoirs been constructed;
- (2)
Rank the IHA factor series and delineate a range of normal values. In this study, a range of 10%–90% after factor ranking has been selected as normal value;
- (3)
Select a year of normal runoff as a typical series and calculate its IHA factors after the reservoirs been constructed;
- (4)
Judge the number of IHA factors falling into the range of normal values in this typical year (referred to as number of factors).
According to the above judgment criteria, if the number in the range is few, then the river flow regime is considered to have significantly changed in this year. Therefore, the first key step is to select a normal year as the typical year.
The criteria and procedures of selecting normal runoff year are described as follows:
- (1)
Calculate the rainfall and total runoff for each year after the reservoir was constructed, select the years with normal rainfall and runoff as the anomaly percentage not exceeding 10% of the average;
- (2)
Calculate the mean flows during flood and dry seasons of the previously selected normal years. If the anomaly percentage is less than 15%, go to the next step;
- (3)
Calculate the monthly mean flow. If there are more than nine monthly mean flows, which shows the anomaly percentages are less than 20%, then this year is considered as a normal runoff year;
- (4)
If the data series are sufficient, further calculate the maximum/minimum flow by Equations (2)–(5) and the time of their occurrences in a typical year. If the anomaly percentage is less than 20% different from the average value, this year is considered as a typical year with normal runoff.
The method of selecting a typical normal year is a comprehensive approach that has considered the most factors of the IHA method including the monthly flow, annual extreme flow, and the time of occurrence of extremes in the IHA factors. If calculated IHA factors of the selected typical normal year fall into the range of first 10%, the river regime is un-impacted or has a low degree of change; if it is within 10%–50%, moderate–low change occurred; within 50%–90%, severe–moderate change happened; above 90%, severe change was detected.
4. Results and Discussions
4.1. Results of IHA and RVA Methods
The IHA factors as well as the variation of these factors were calculated for different periods (
i.e., 1949–1998, 1999–2014, and 2008–2014).
Table 4 lists the IHA factors of five groups of hydrological indicators at Yichang station and the degree of change before and after reservoirs been constructed.
It is observed from
Table 4 that during the period 1999–2014 at Yichang station, six factors (mean flow in February, minimum flow and number of reversals,
etc.) have a high degree of changes; the mean flow in March, October, and November, and the low pulse frequency have moderate changes; four factors (mean flow in January, Julian date of minimum flow, duration of low pulses, and flow rate increase) turn from moderate change to severe change; the maximum one-day flow turns from low change to moderate change. For the 2008–2014 data series, the minimum one-day, three-day, seven-day, 30-day, and 90-day flows have severely changed and the change degree reaches 1. The overall change at Yichang station is moderate during 1999–2014 and becomes severe during 2008–2014.
Table 5 summarizes five groups of hydrological indicators at Datong station and the change degree before and after reservoirs been constructed. It is observed from
Table 5 that five factors have changed at Datong station during 1999–2014. The change of the minimum one-day, three-day, and seven-day flow goes from moderate to high, and the minimum 30-day flow goes from low to moderate; the base flow index experiences moderate but increasing change. The overall degree of change for the 1999–2014 data series is lower, while that of the 2008–2014 data series is close to the critical value of moderate change.
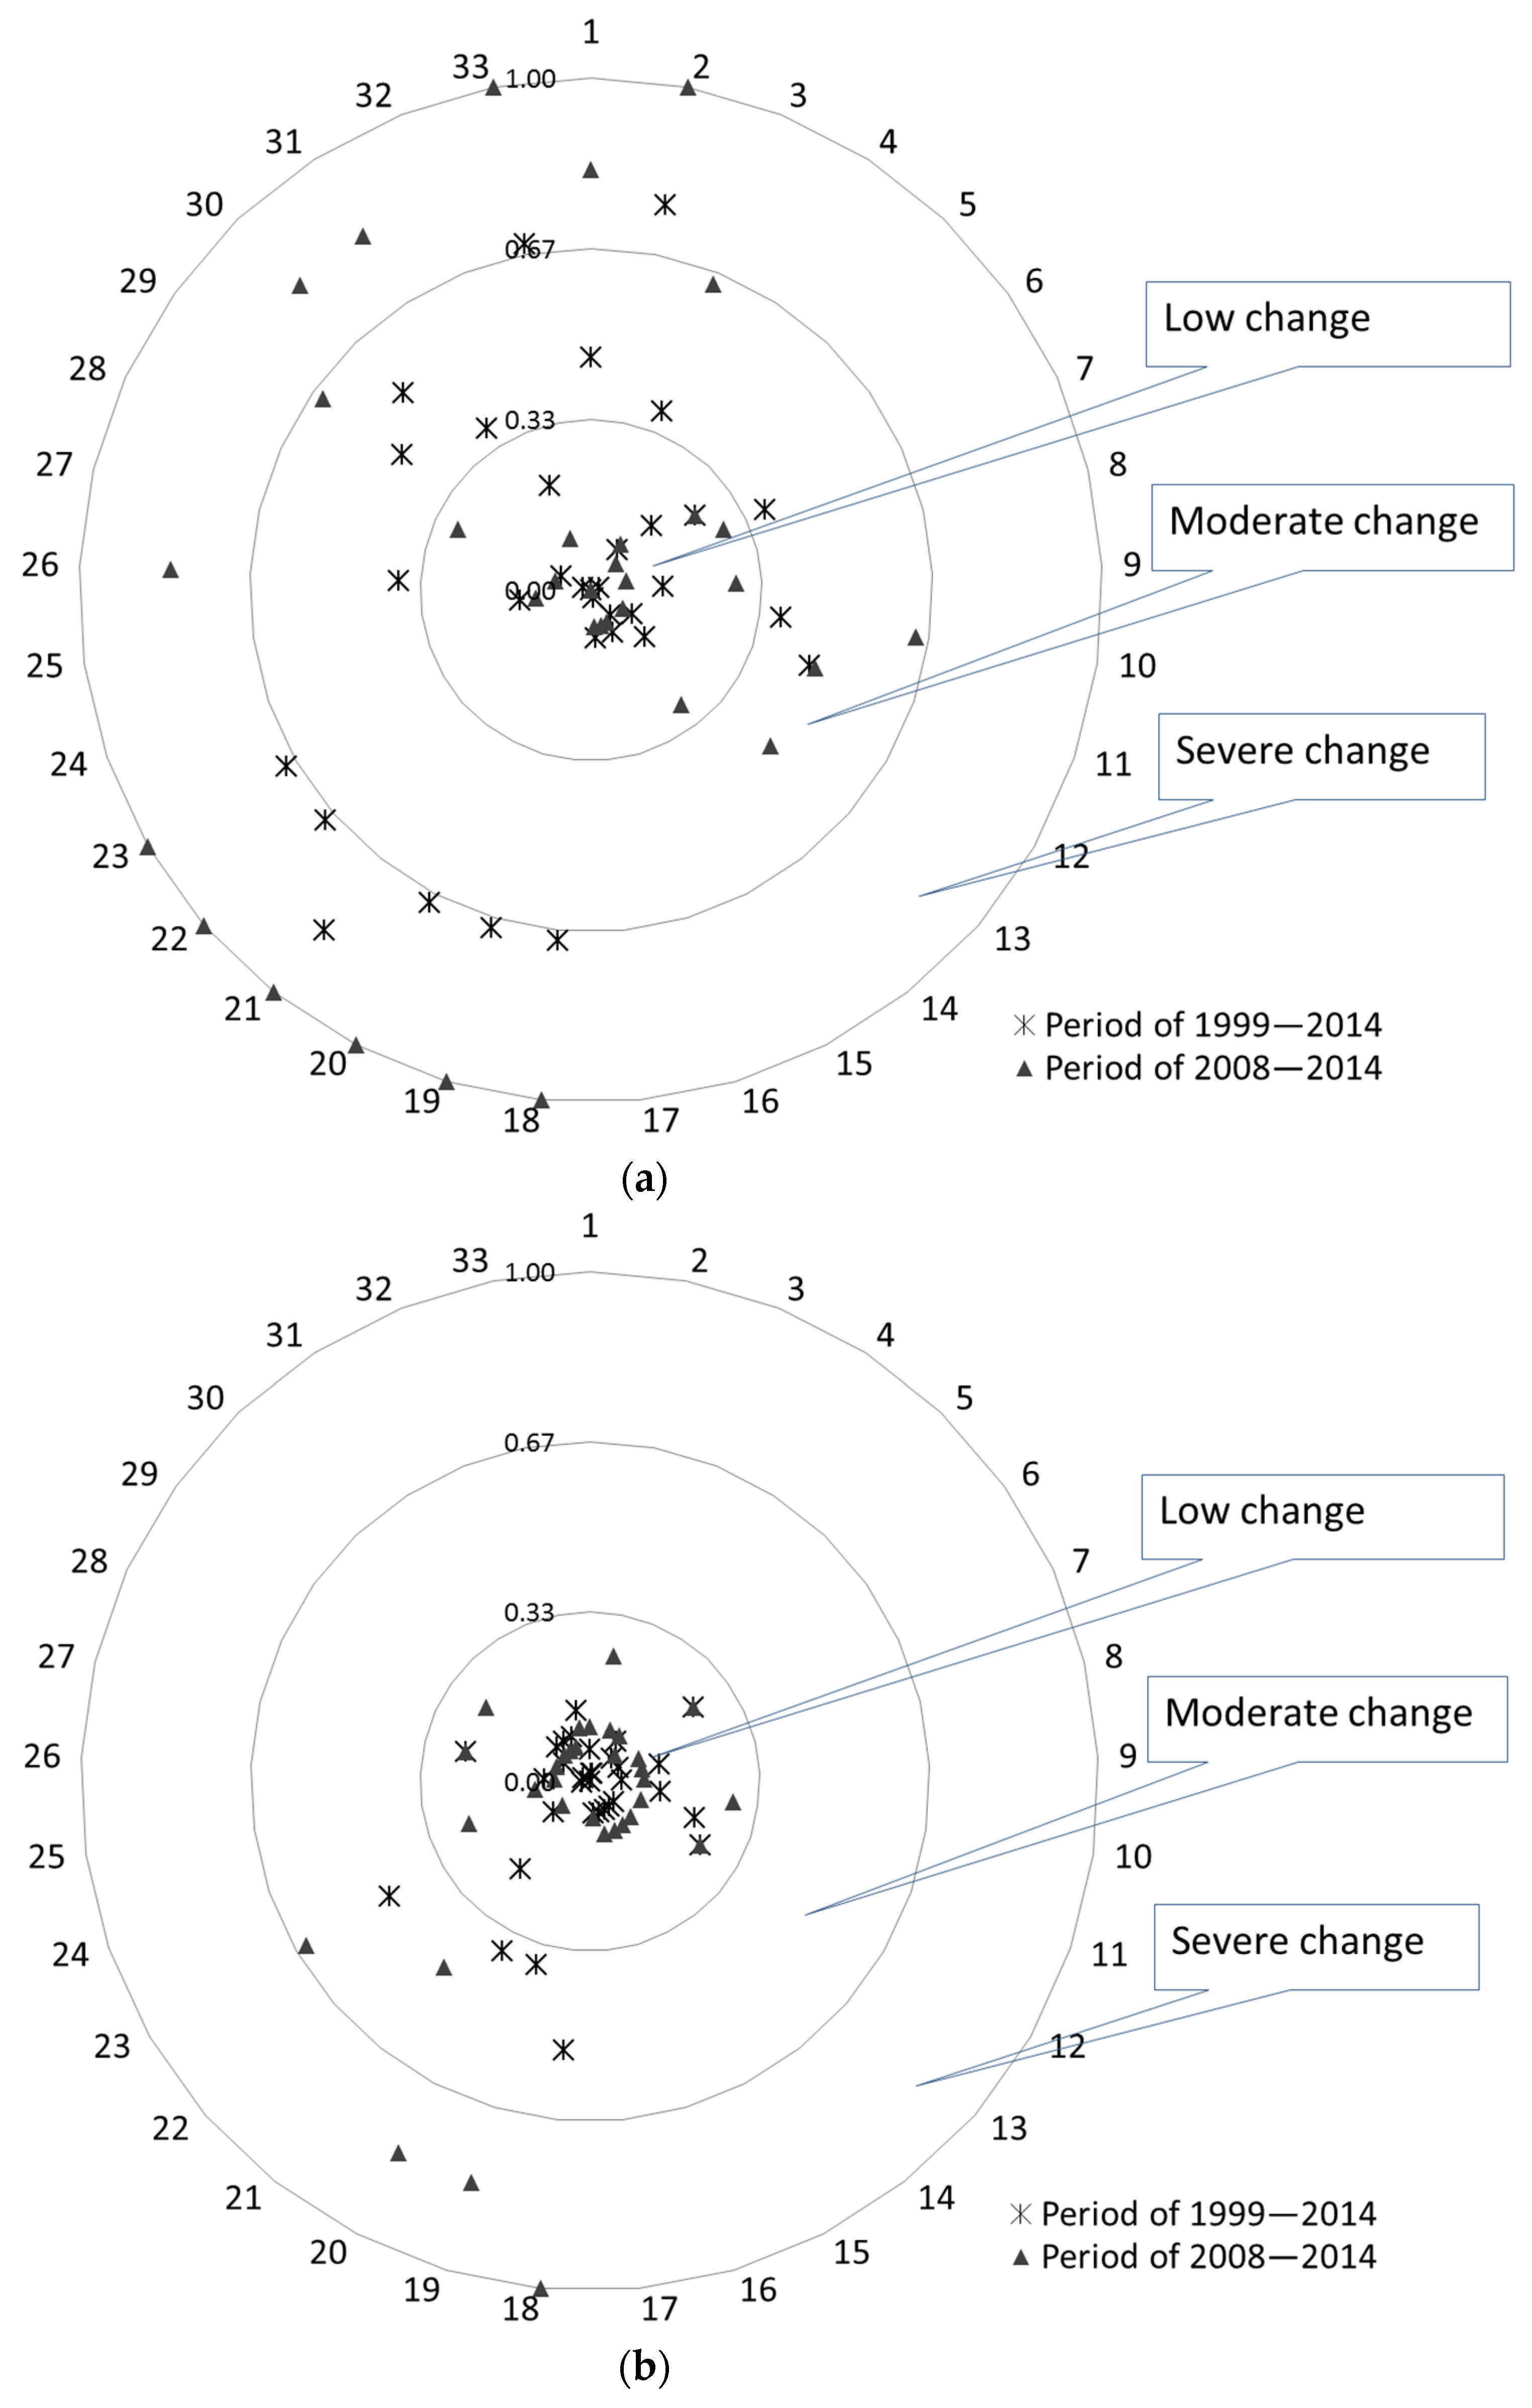
The change degrees of 33 IHA factors during 1999–2014 were plotted in
Figure 4. These factors are divided into different clusters,
i.e., low change factors close to the center, moderate change factors in the middle, and severe change factors in the outermost. The sequence of 33 IHA factors in
Figure 4 is the sequence of five groups of factors listed in
Table 4.
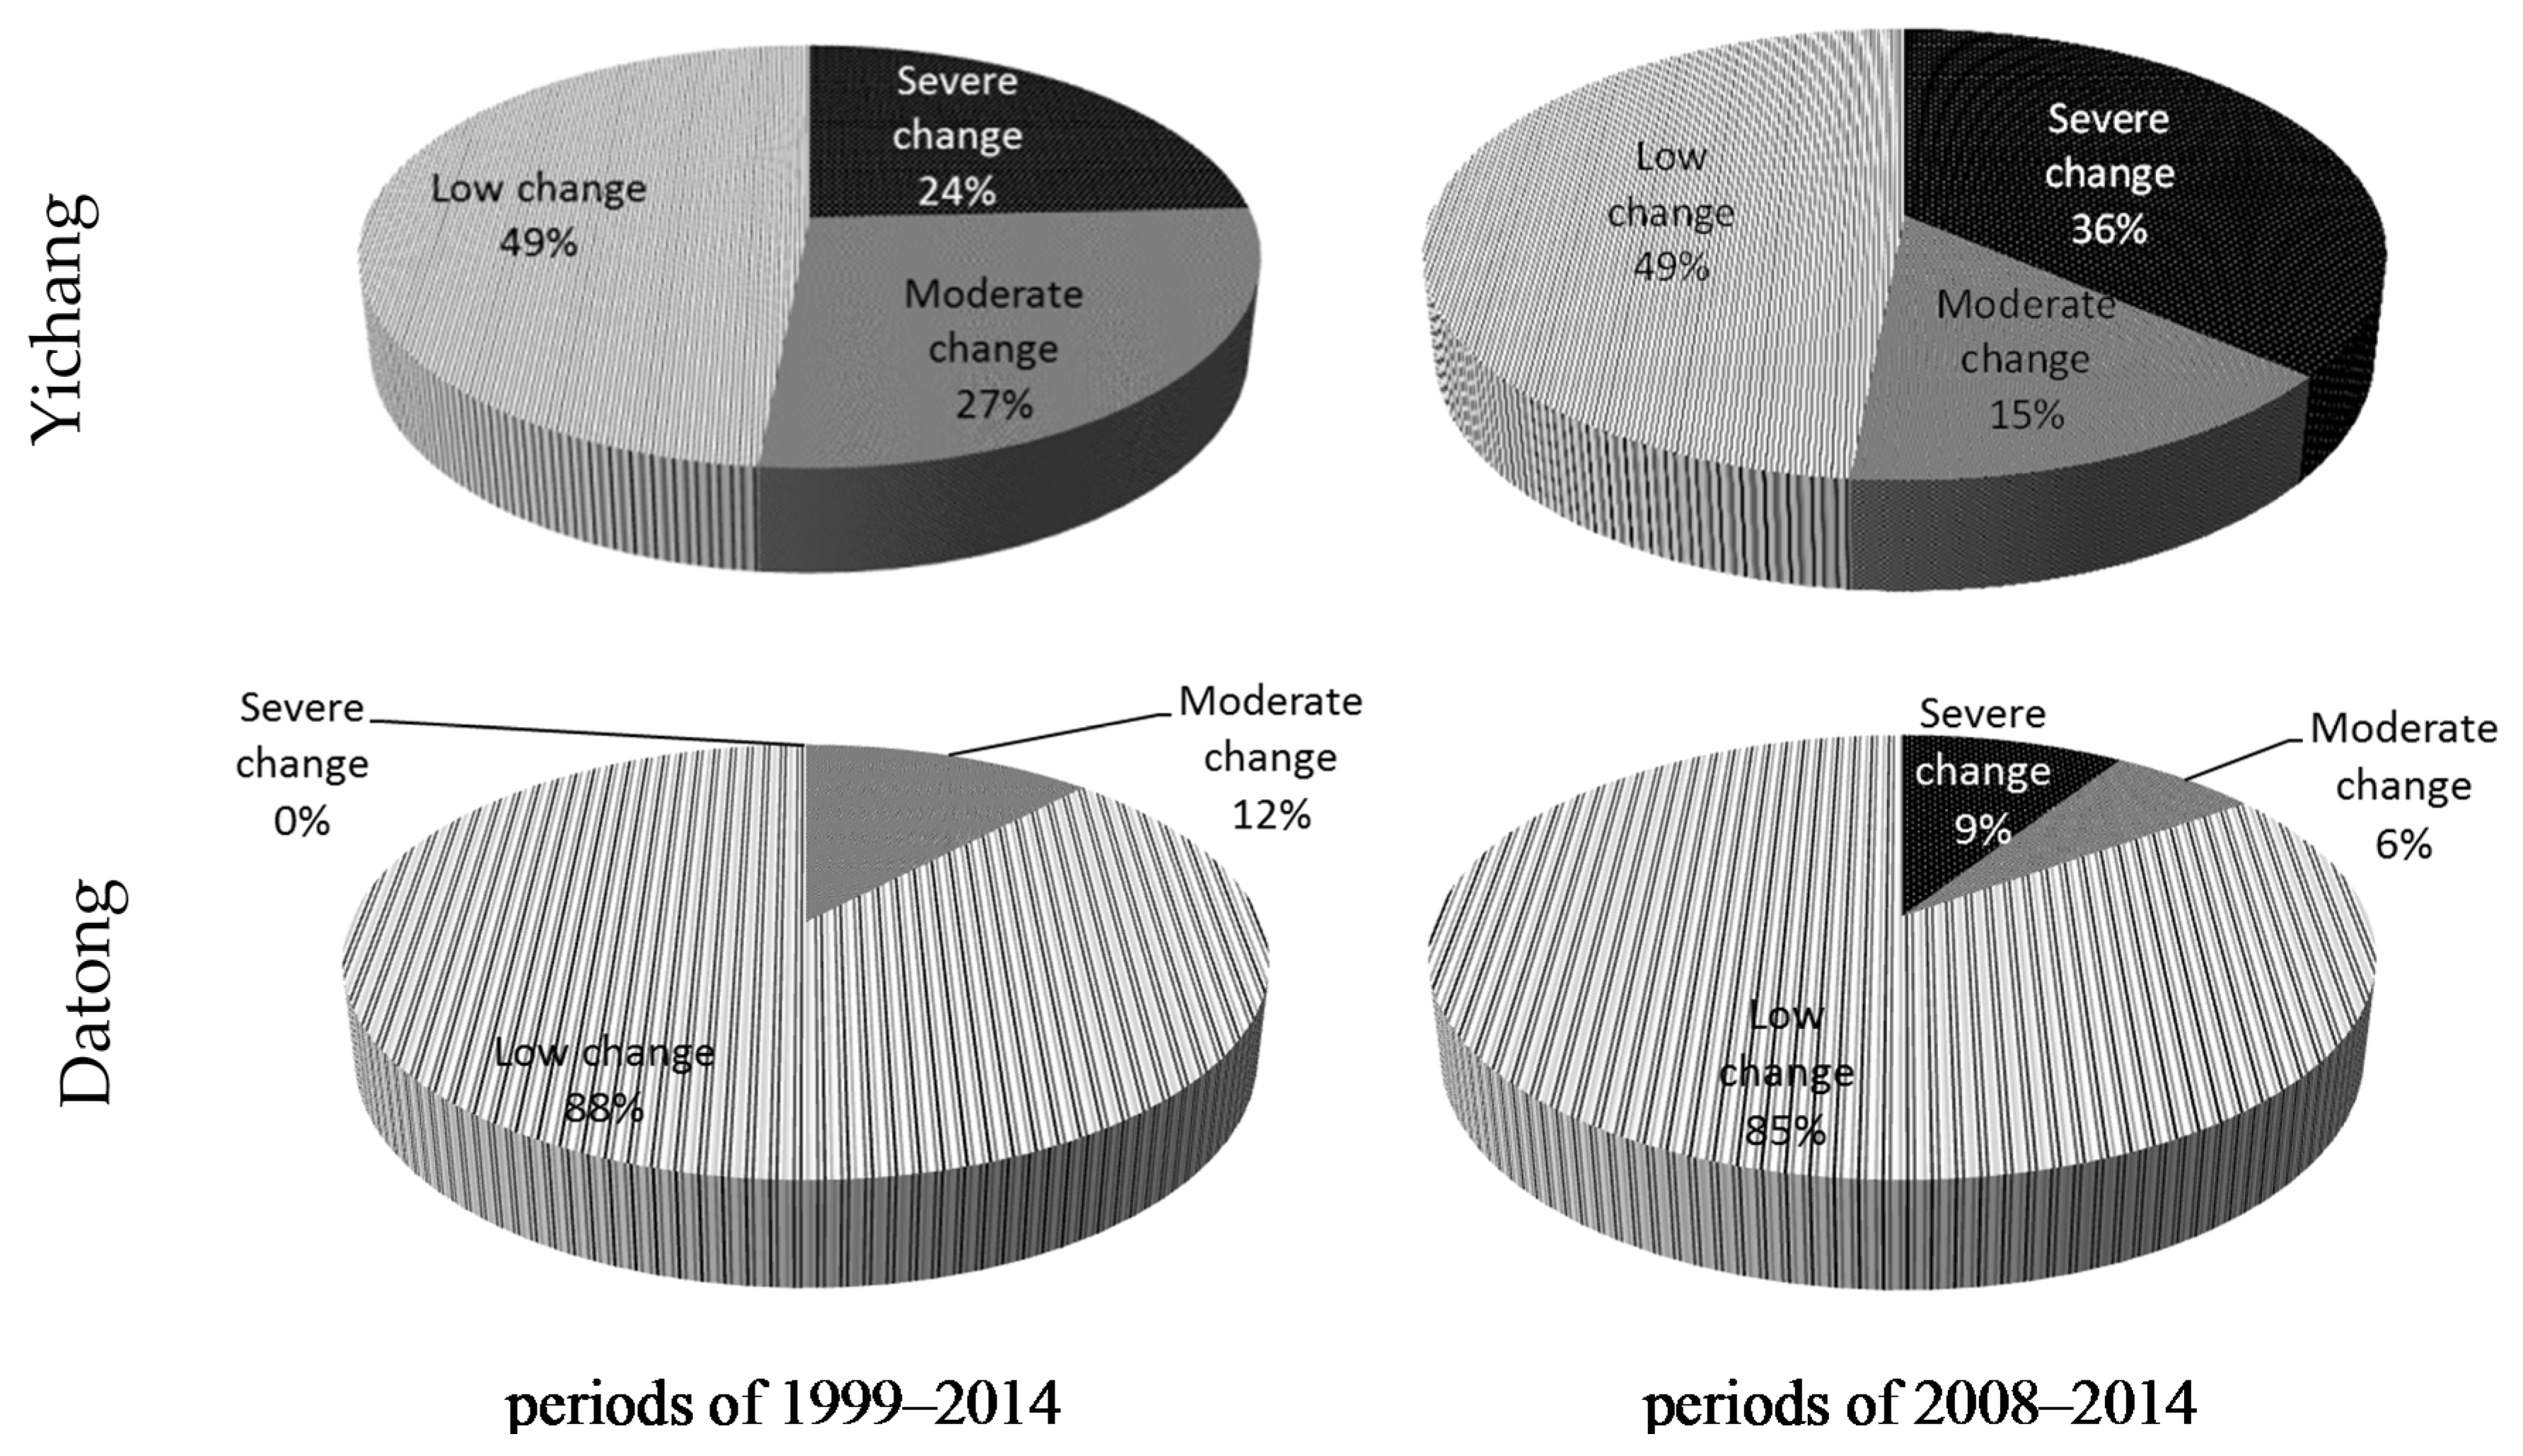
The factors with low, moderate, and severe changes during 1999–2014 at Yichang and Datong stations are plotted in
Figure 5.
It is observed from
Figure 5 that 16 IHA factors of two series have low changes and 17 factors have moderate or severe changes. The factors with severe change during 2008–2014 are more than those in the 1999–2014 series at Yichang station. At Datong station, moderate change occurred to four factors during 1999–2014 but no factors experienced severe change. In the 2008–2014 data series, three factors went from moderate change to severe change, and one factor went from low change to moderate change.
The factors with high level change, such as minimum one-day, three-day, and seven-day flows, are related to the indicators of low flow, i.e., these reservoirs’ regulation has changed the dry season flow at Yichang and Datong stations. This is consistent with the real situation: the increasing number of reservoirs in operation has had an increasingly greater impact on the hydrological regime in the middle and lower Yangtze River reaches.
On the other hand, the minimum flow of the Yangtze River has increased in the dry season, which has a positive impact on the utilization of water resources in the middle and lower Yangtze River basin. For example, a salt tide intrusion event occurred near Shanghai in early 2014, which made it very difficult for residents to access fresh water. The Changjiang Water Resources Commission made a special decision to dispatch TGR by increasing the outflow discharge, which suppressed the salt tide to a certain extent.
4.2. Results of DHRA Method
The DHRA method was also used to assess the flow regime change at Yichang and Datong stations, respectively. According to the absolute percentage change in the mean and CV, the integrated hydrological alteration was calculated and listed in
Table 6.
It can be seen from
Table 6 that the third and fourth groups of IHA at Yichang station (timing of annual extreme water conditions, frequency and duration of high and low pulses) are subject to larger degrees of alteration, reaching moderate to higher degrees of alteration. The third group of IHAs was subject to larger degrees of alteration at Datong station during 2008–2014.
Based on the scores and evaluation results of the DHRA method, the total score of both periods at Yichang station is 9 and the alteration degree is level 3, i.e., moderate risk of impact. The total score at Datong station is 4 and the alteration degree is level 1, low risk during 2008–2014.
4.3. Results of Typical Year Assessment Method
According to the procedure described in
Section 3.4, the IHA factors in a typical year were assessed to analyze the variation of river flow regimes at Yichang and Datong stations. Based on the calculation from a normal year, it was found that about 10% of the inputs belong to the normal runoff years. The year of 2014 was selected as a typical normal runoff year. Because the Jinpingyiji, Xiluodu, Xiangjiabaand Tingzikou reservoirs, located at the upper Yangtze River, were put into operation during 2013–2014, no reservoirs with larger regulating storage capacity will be put into operation in the next five years. Hence, the observed flow data in 2014 at Yichang and Datong stations can be selected as a typical year for the IHA factor analysis (although the runoff has been impacted by those newly-built reservoirs).
According to the calculated IHA factors, the assessment criteria for number of factors in a typical year at the two stations are listed in
Table 7. In addition, the IHA factors for of 2014 and the normal ranges (10%–90%) are listed in
Table 8.
Table 8 shows that 17 factors at Yichang station fall within the normal range for 2014. Even excluding the occurrence of maximum flow (mainly caused by meteorological reasons), only 18 factors fall into this range. However, during the period 1949–1998, 25 factors fell within this range on average each year. More than 20 factors fell within the normal range in 90% of the 50-year observation data series; because the number of factors falling in the range was only 17 in 2014, it can be concluded that the hydrological regime at Yichang station varies greatly.
Specifically, most factors are related to the minimum flow, such as January to April monthly mean flow, December mean flow, magnitude and duration of minimal flow, mean duration, and numbers of low pulses.
Twenty-nine IHA factors at Datong station fell within the normal range of 80% for 2014, while 28 factors are within this range for the data series between 1949 and 1998. According to the criteria in
Table 4, the river variation at Yichang station undergoes severe change, and moderate–low change occurs at Datong Station. This is consistent with the conclusions made by the RVA and DHRA methods. The flow regime change results calculated by the three methods are compared in
Table 9.
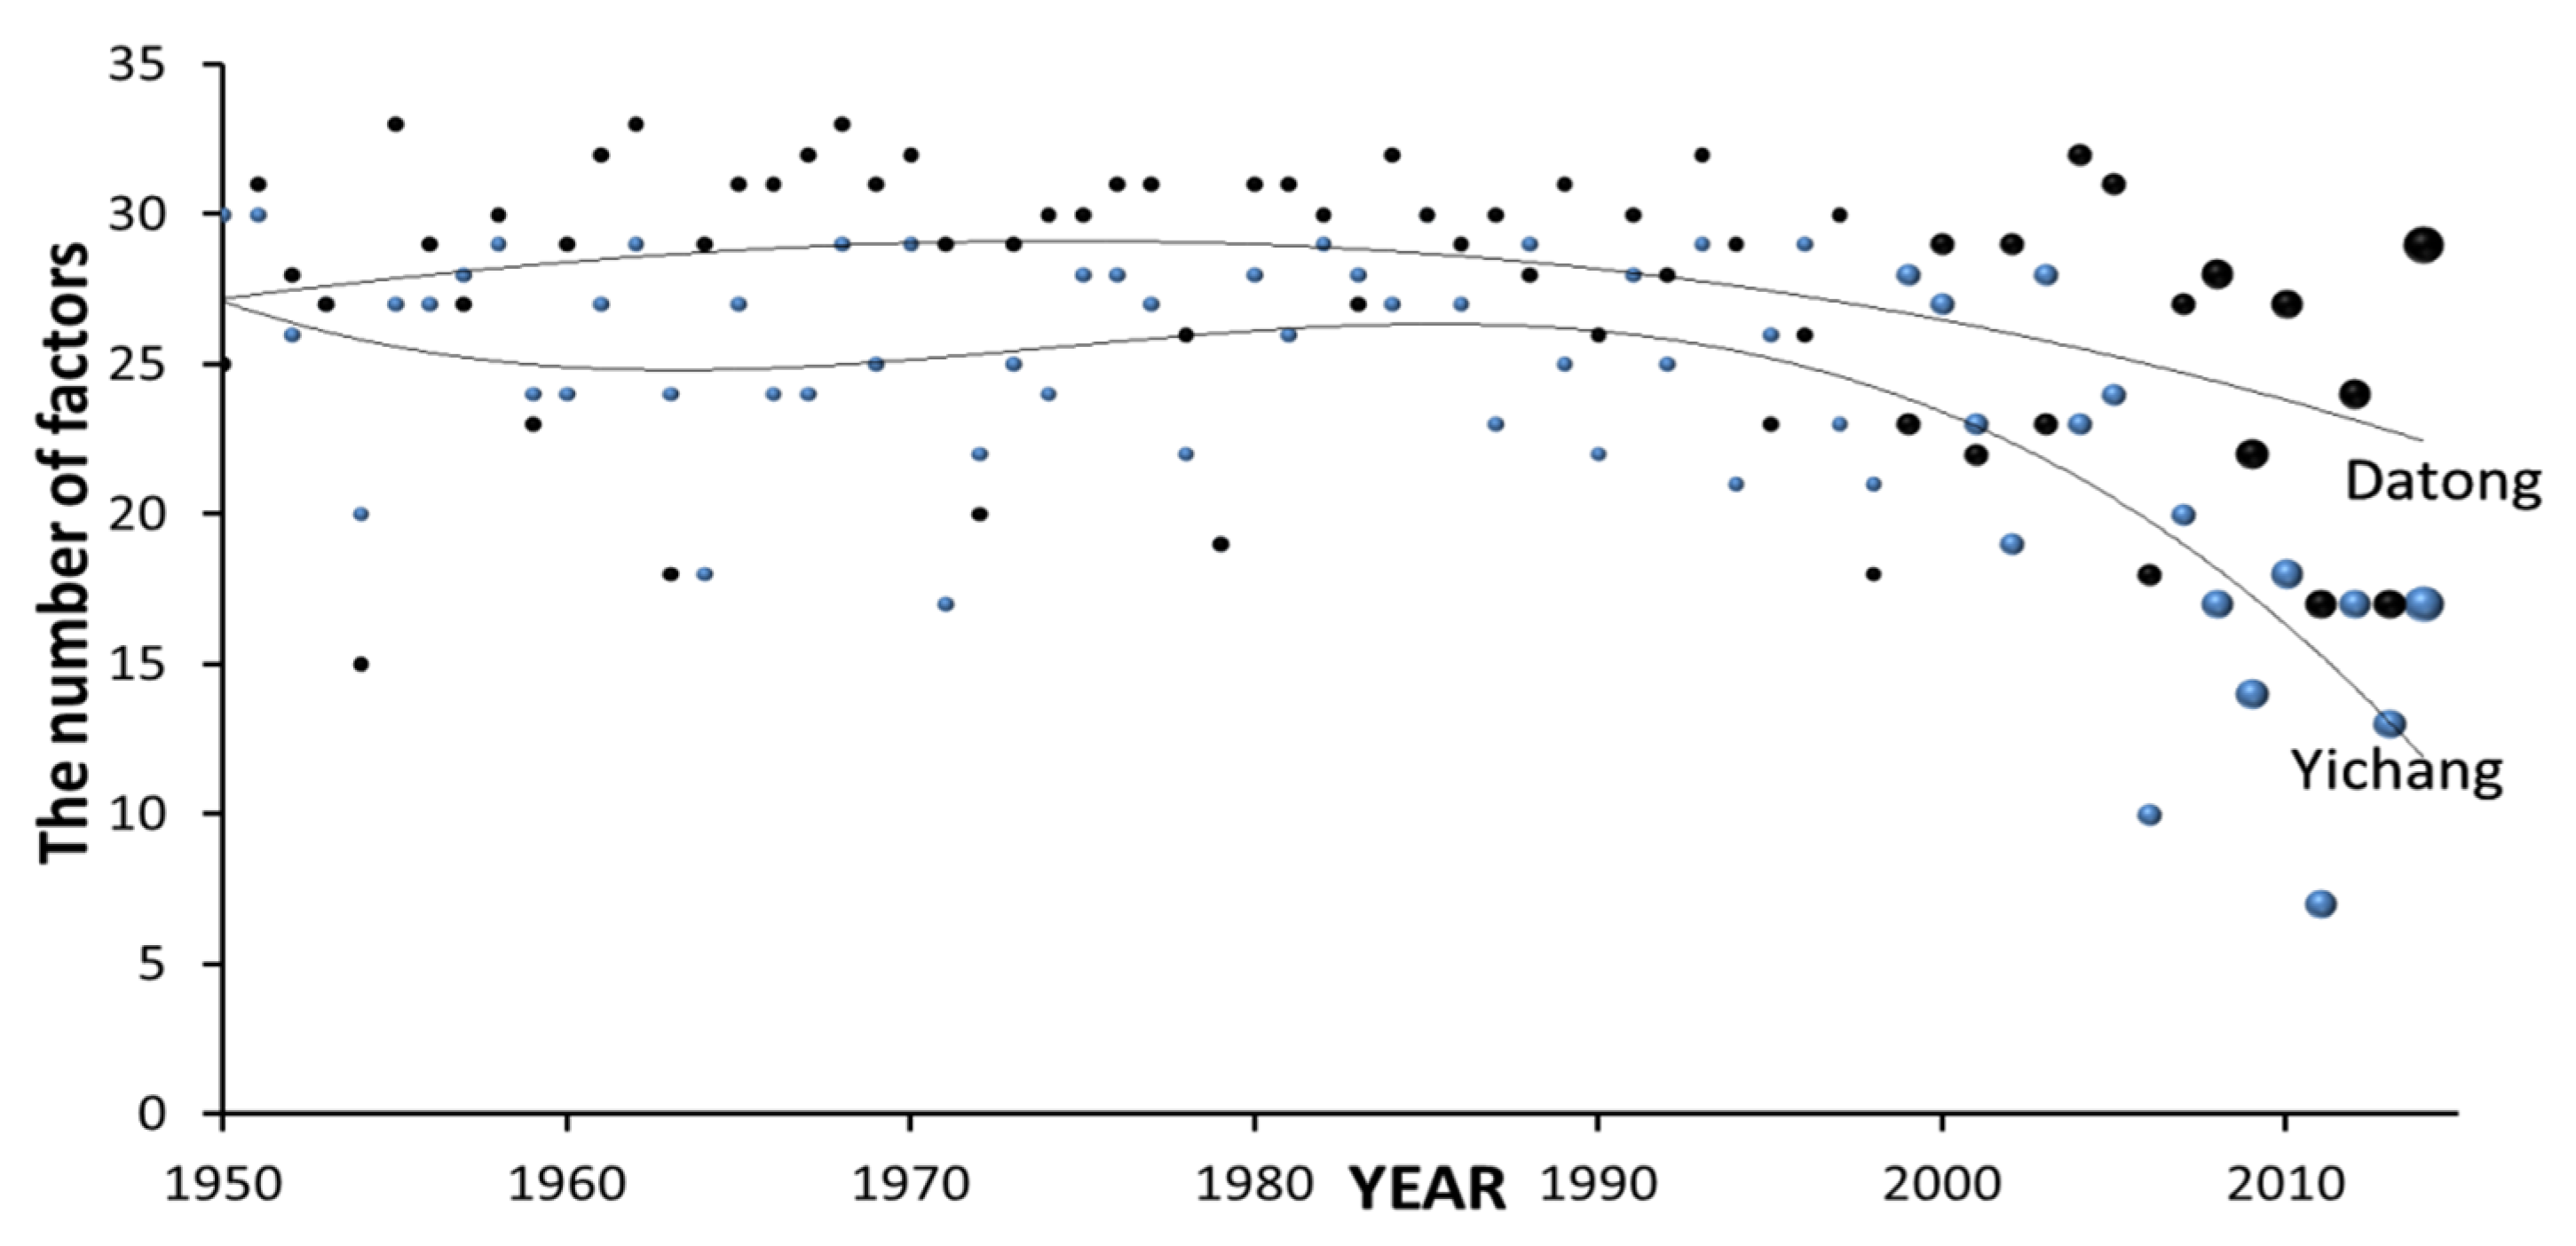
During the period 1949–2014, the variation in number factors in each year is shown in
Figure 6. The gray dots show the number of factors at Yichang station, and the black dots denote the number of factors at Datong station in the normal range. In order to highlight the trend in recent years, the number of factors is marked with larger dots, as shown in
Figure 6.
According to the trend line in
Figure 6, the number of factors at Yichang station before 2000 was stable, and then decreased. It decreases further after 2008. In 2011, only seven factors fell into the normal range. The number of factors is at the low level in history.
The number of factors at Datong station changed slightly before 2000 and then decreased after 2000. The overall change tendency is not particularly evident.
4.4. Comparison of Monthly Mean Flow
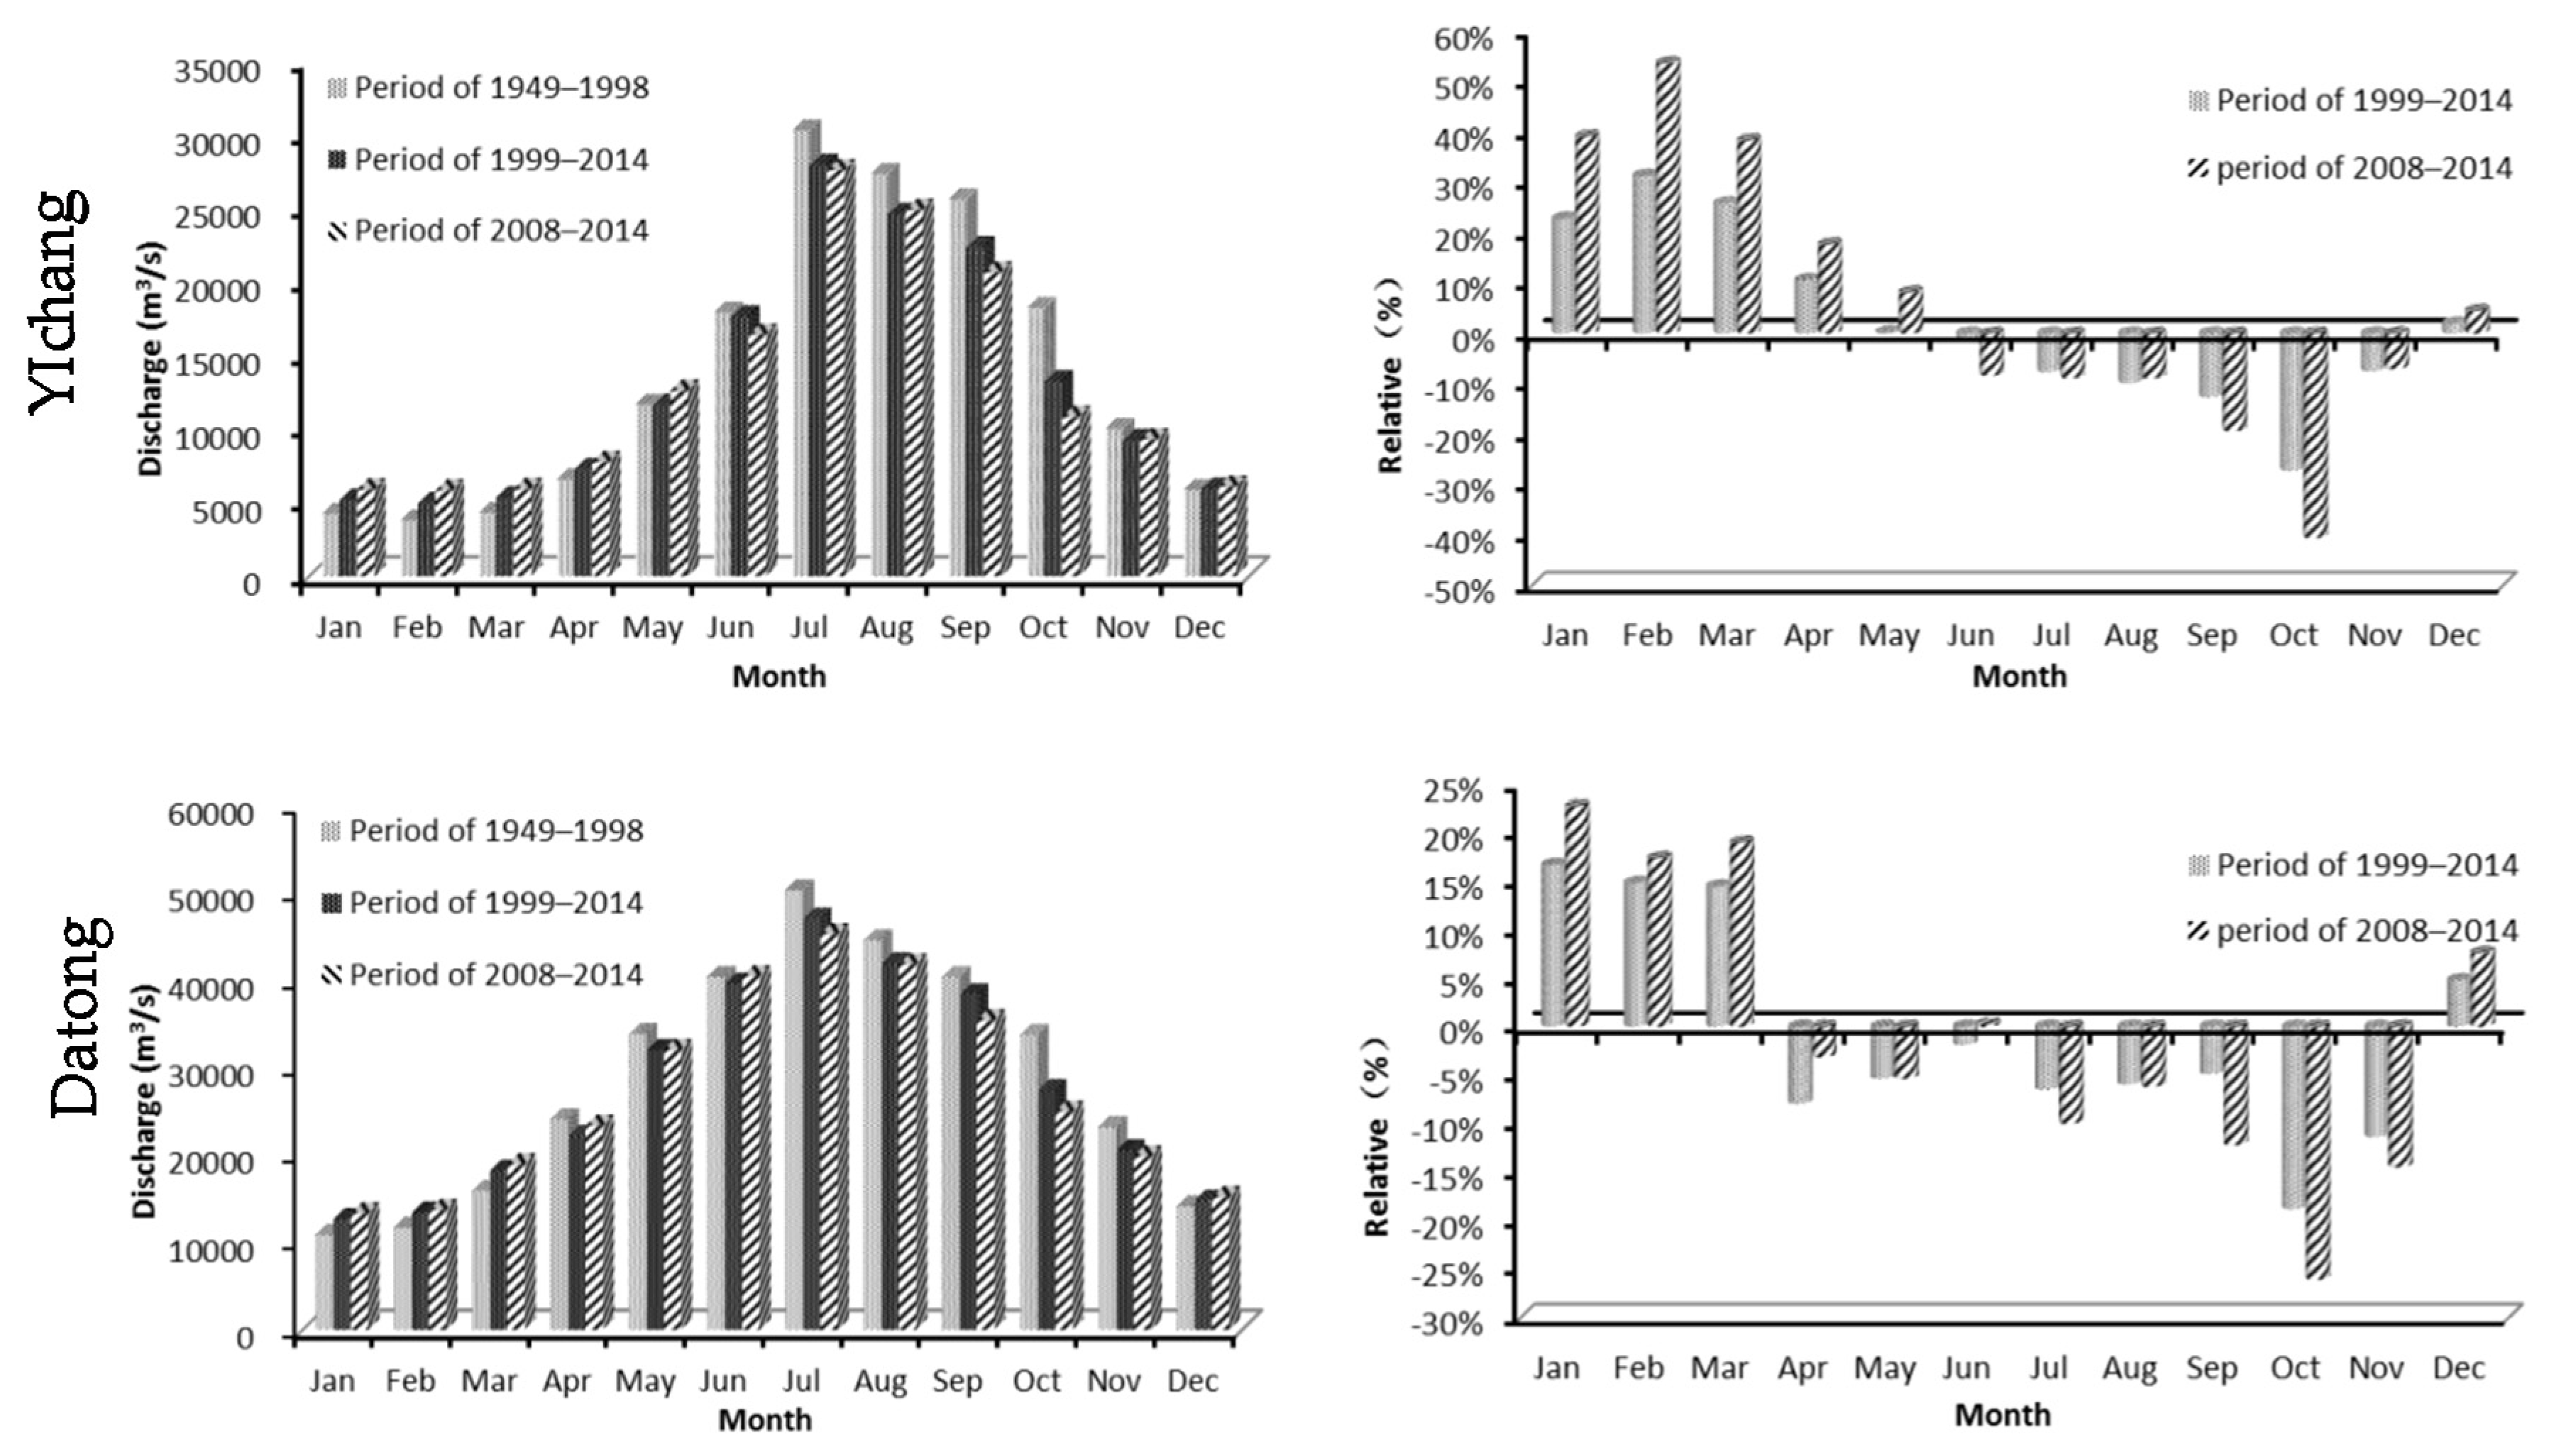
The comparison and anomaly of monthly mean flow during 1999–2014 as well as 1949–1998 at Yichang and Datong stations are shown in
Figure 7.
It can be seen that the mean flow at Yichang and Datong stations increased from January to March during 1999–2014 compared to the natural runoff; the monthly flow changed little from April to June, decreased from July to November, and underwent little change in December. The change during 2008–2014 is more obvious. The mean flow increased from January to March, decreased from July to September, and experienced a 30%–40% reduction in October; the flow slightly increased in December.
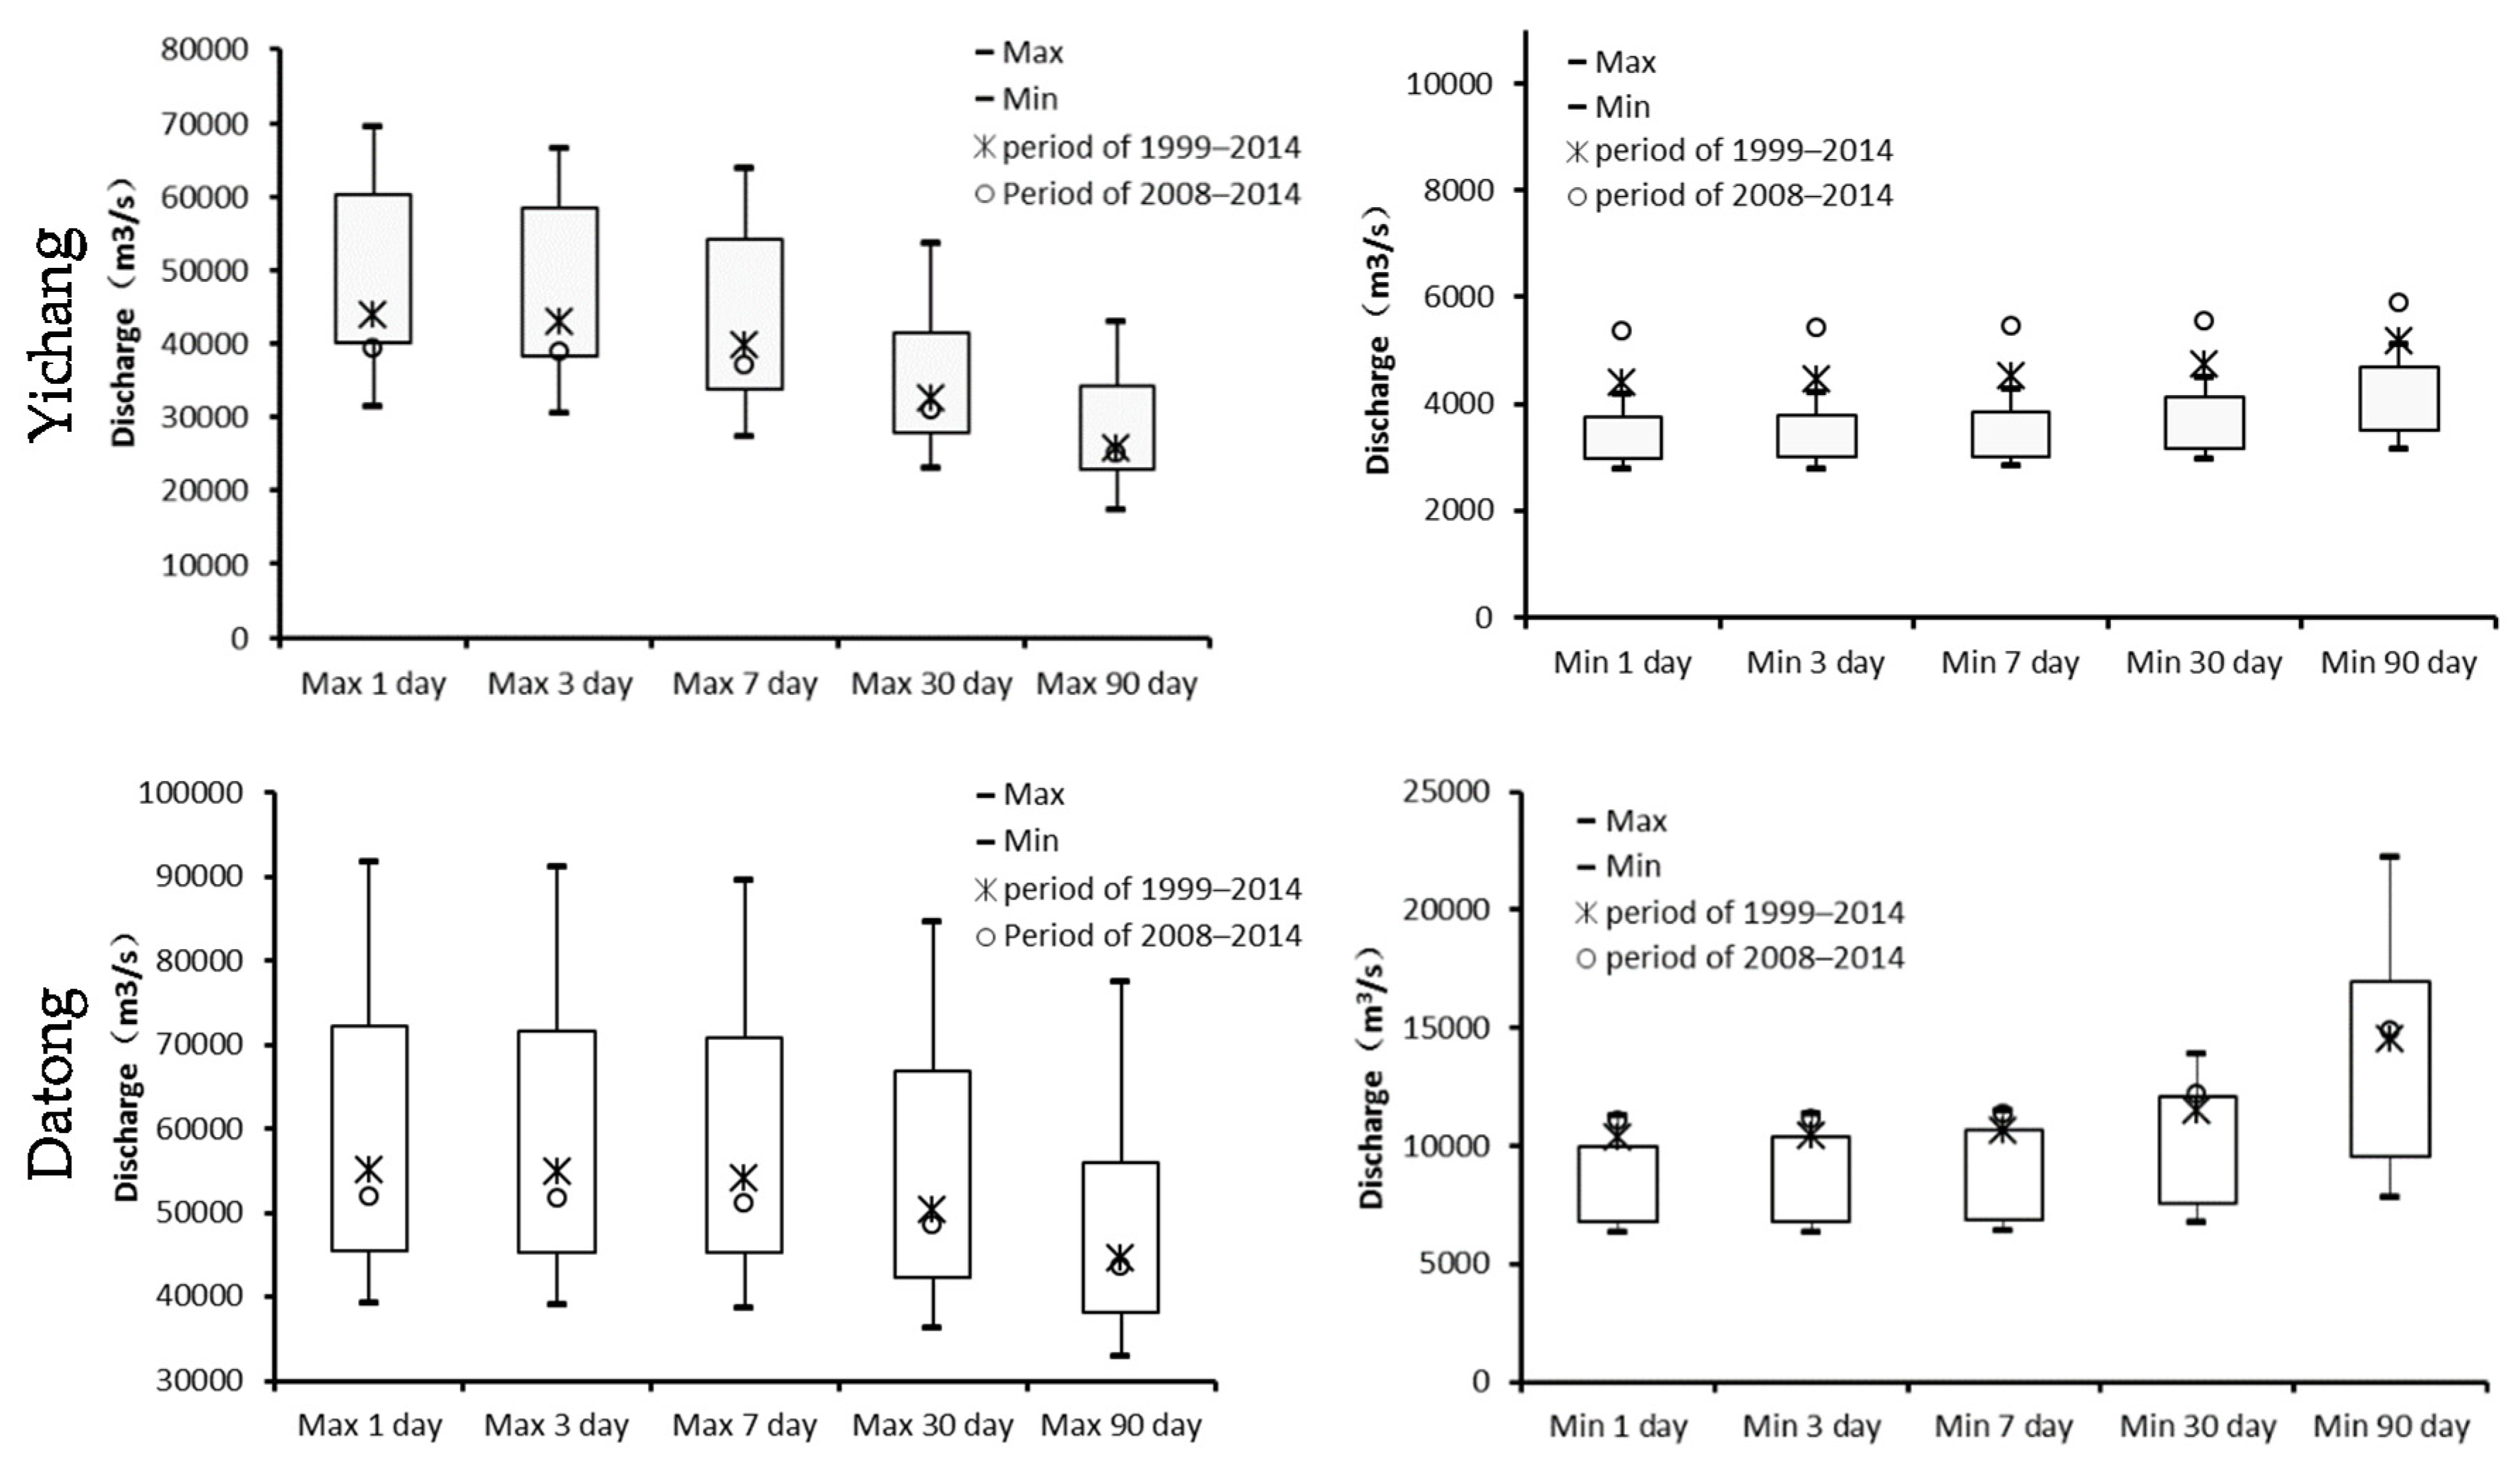
4.5. Comparison of Extreme Values
The comparison of extreme discharges and normal range of natural runoff during 1999–2014 are shown in
Figure 8, in which the rectangular section represents the range of 80% IHA factors.
As can be seen from
Figure 8, the maximum flow at Yichang station during 1999–2014 fell into the normal range, but was located in the lower end of the normal range (the normal value is small for natural runoff). The maximum one-day flow during 2008–2014 was already at the lower end of the normal range of natural runoff, indicating that the upstream reservoirs play an important role in flood retention in the flood season; five factors of minimum flow cannot fall into the normal range, indicating that significant change has occurred to the minimum flow. The results are consistent with those from the MK test. The maximum flow factor at Datong station fell into the normal range, but the minimum one-day, three-day, seven-day, and 30-day flow values did not fall within the normal range or at the edge of it.
The maximum flow at Yichang and Datong stations generally occurs in late July. This factor is almost the same as the historical mean, which indicates that the reservoirs do not impound water on a large scale since no extreme floods have happened in recent years and the occurrence time of maximum flow does not change much compared to the natural runoff.
The minimum flow at Yichang station often occurs in late February, and in later years moved to late December or early January, especially during 2008–2014. The minimum flow of at least six years occurred in this period; only in one year (2014) was it close to that of natural runoff. This indicates that the factor changed greatly. In addition, the low pulse frequency and duration have also been altered. The minimum flow at Datong station often occurred in late January, but has now shifted to early or mid-January.
A large degree of factor change at Yichang and Datong stations in recent years is caused by the operation of the TGR and the upstream reservoirs. Taking TGR as an example, in a general runoff year (full storage year), TGR maintains operation at high water level in November and December. The outflow of TGR in January to April is controlled at around 6000 m3/s, which results the extremely small flow factor increasing. Naturally the minimum flow time occurred from January to March, but now it is generally from December to February. The flow reversals also increase due to regulation of reservoirs. Based on the above analysis, it is found that the hydrological regime has already been changed due to the dispatching of upstream reservoirs; changes showed in the alteration of the following factors: the minimum flow correlation factor, occurrence time, low pulse frequency, and duration factors. Because Datong station is far from the reservoirs, the change degree is lower than that of Yichang station.


