Article

Suitability Evaluation of River Bank Filtration along the Second Songhua River, China

College of Environment and Resources, Jilin University, Changchun 130000, Jilin, China
*
Author to whom correspondence should be addressed.
Water 2016, 8(5), 176; https://doi.org/10.3390/w8050176
Submission received: 17 February 2016 / Revised: 19 April 2016 / Accepted: 20 April 2016 / Published: 30 April 2016
(This article belongs to the Special Issue Tackling Complex Water Problems in China under Changing Environment)

Abstract

:
The Second Songhua River is the biggest river system in Jilin Province, China. In recent years, the rapid economic development in this area has increased the prominence of water resources and water-related environmental problems; these include surface water pollution and the overexploitation of groundwater resources. Bank infiltration on the floodplains of the Second Songhua River is an important process of groundwater-surface water exchange under exploitation conditions. Understanding this process can help in the development of water resource management plans and strategies for the region. In this research, a multi-criteria evaluation index system was developed with which to evaluate the suitability of bank filtration along the Second Songhua River. The system was comprised of main suitability indexes for water quantity, water quality, the interaction intensity between surface water and groundwater, and the exploitation condition of groundwater resources. The index system was integrated into GIS (Geographic Information System) to complete the evaluation of the various indicators. According to the weighted sum of each index, the suitability of river bank filtration (RBF) in the study area was divided into five grades. Although the evaluation index system and evaluation method are applicable only to the Second Songhua River basin, the underlying principle and techniques it embodies can be applied elsewhere. For future generalization of the evaluation index system, the specific evaluation index and its scoring criteria should be modified appropriately based on local conditions.

1. Introduction

With its rich and stable water quantity, good water quality, and easy access and management, river bank filtration (RBF) is widely adopted in many countries and has become an important means of groundwater exploitation [1,2]. In Holland, Germany, Slovakia and Hungary, the proportion of total drinking water supplied by RBF water supply has reached 5%, 16%, 50% and 45%, respectively [3]. The northern regions of China have established a number of RBF waterworks since the early 1950s; these include the Songhua River waterworks in Heilongjiang Province, the Hunhe River waterworks in Liaoning Province, the Jiuwutan and Beijiao waterworks in Henan Province, and the Hanzhong waterworks in Shanxi Province [4]. To date, more than 300 large riverside RBF waterworks [5,6,7,8] have been established in China.
The combined use of surface water and groundwater resources can be realized through RBF, which can stimulate and increase the recharge of river water to the aquifer [9]. However, the unreasonable exploitation of groundwater resources will lead to a continually descending groundwater level, the disruption of the hydraulic connection between groundwater and surface water, saltwater intrusion and land subsidence [10]. From the perspective of the surface water infiltration process and runoff variation along the river, Qin (1995) proposed a vertical seepage method by combining Manning’s Formula and Darcy’s law to calculate the water recharge capacity of river water [11]. The riverbed clogging issue was thought to be an important factor that affects the performance of the riverbank filtration system [12]. Han (1996), according to the landform unit of different RBF waterworks, divided water sources into four types, including intermountain valley, intermountain basin, alluvial-proluvial fan and coastal plain [4]; the researchers concluded that the infiltration capacity calculation of surface water is the key link during the water resources evaluation of RBF waterworks. Grischek and Ray (2009) presented the surface-groundwater interaction issues at various geomorphologic settings, from the headwaters of a river to its confluence with oceans/lakes [13].
The quality of surface water can be improved by the physical, chemical and biological processes that take place in RBF process. As surface water infiltrates groundwater, the total organic carbon, turbidity, heavy metals, inorganic substances, viruses, parasites and some microorganisms in surface water can be effectively reduced. In RBF systems, 60% of the total organic carbon and 90% of the turbidity can be removed [3,14]. Likewise, 90% of chromium and arsenic, and 50% of cadmium, zinc, lead, copper and nickel can be removed [15]. The removal of ammonia nitrogen can reach 95% [16], and the removal of bacteria, parasites, and viruses can reach 100% [14].
In the past, a large number of studies have been conducted mainly for specific RBF waterworks. Different methods were developed to analyze the feasibility of RBF systems [17,18,19]. For the feasibility research of RBF sites in a regional setting, Sandhu et al. (2011) provided the analysis results in India [14]. So far, there are only few publications on the suitability evaluation of RBF on the scale of a river basin, because a generalization of site selection criteria is very difficult.
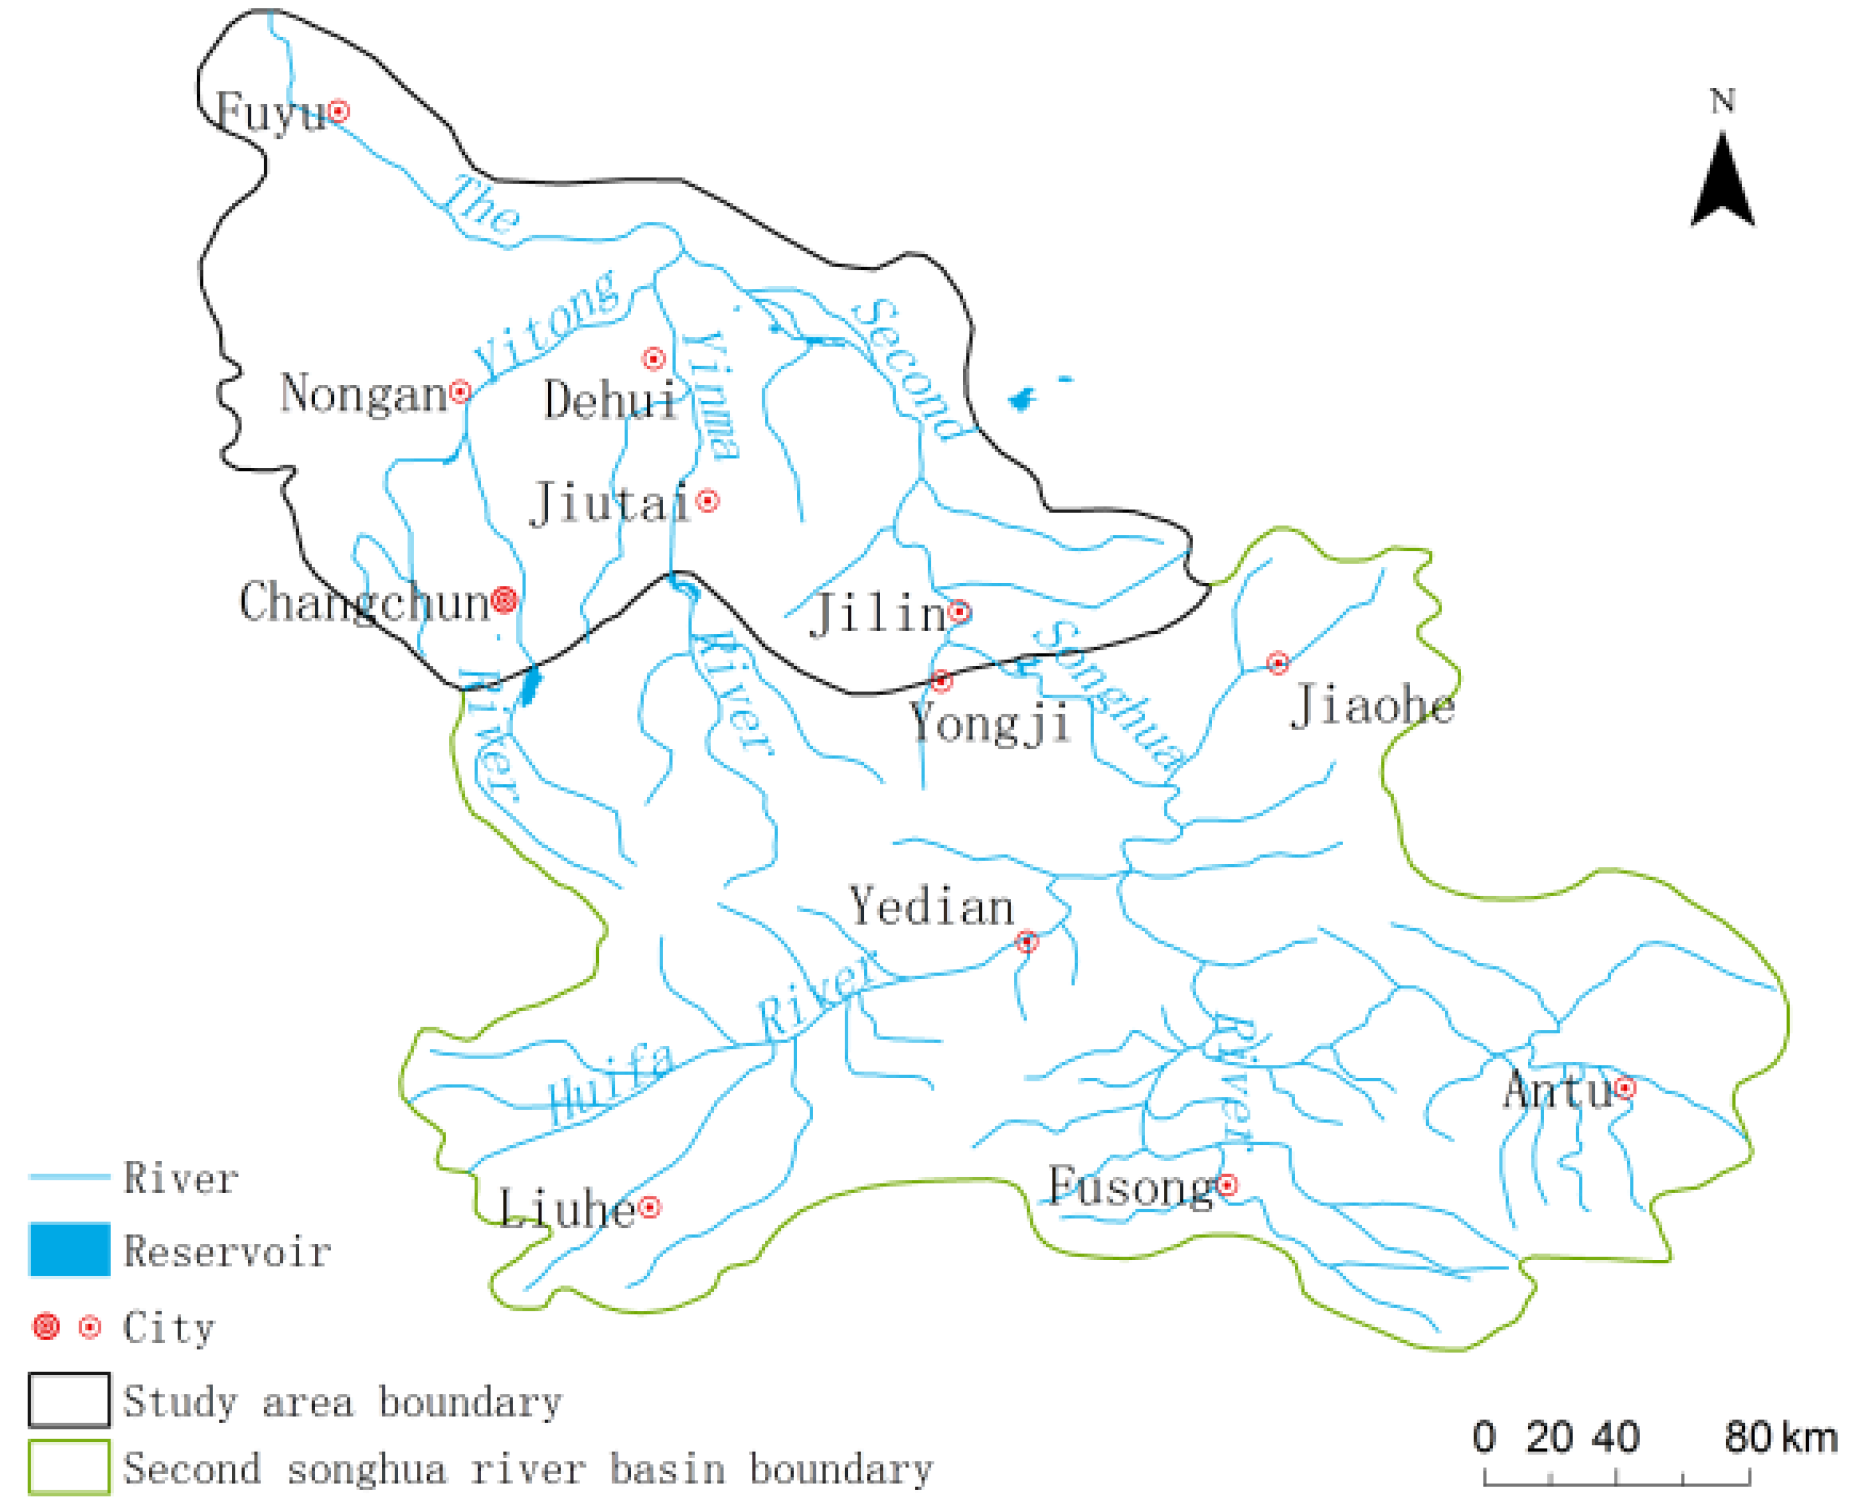
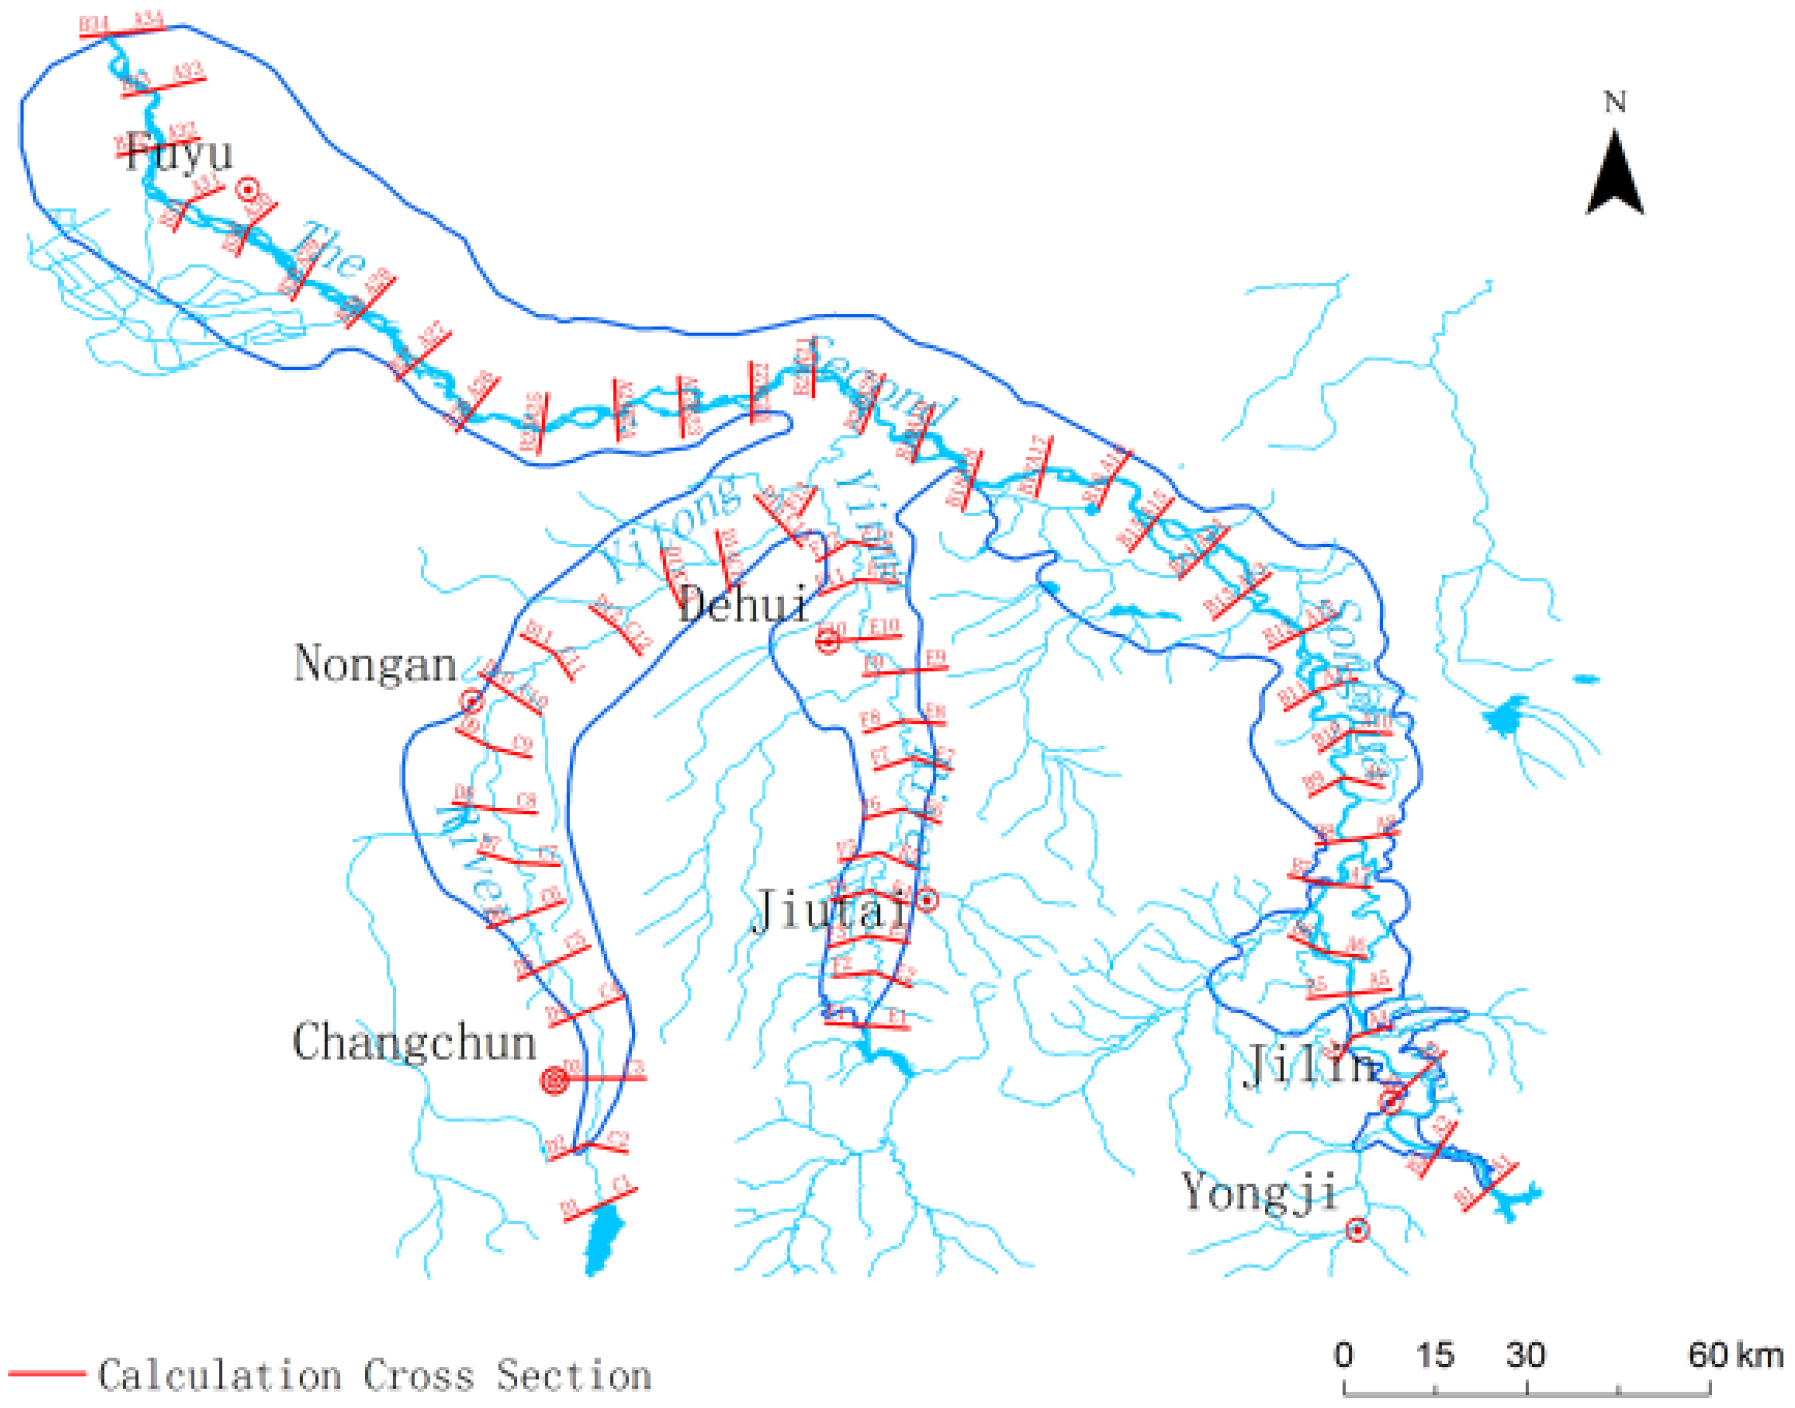
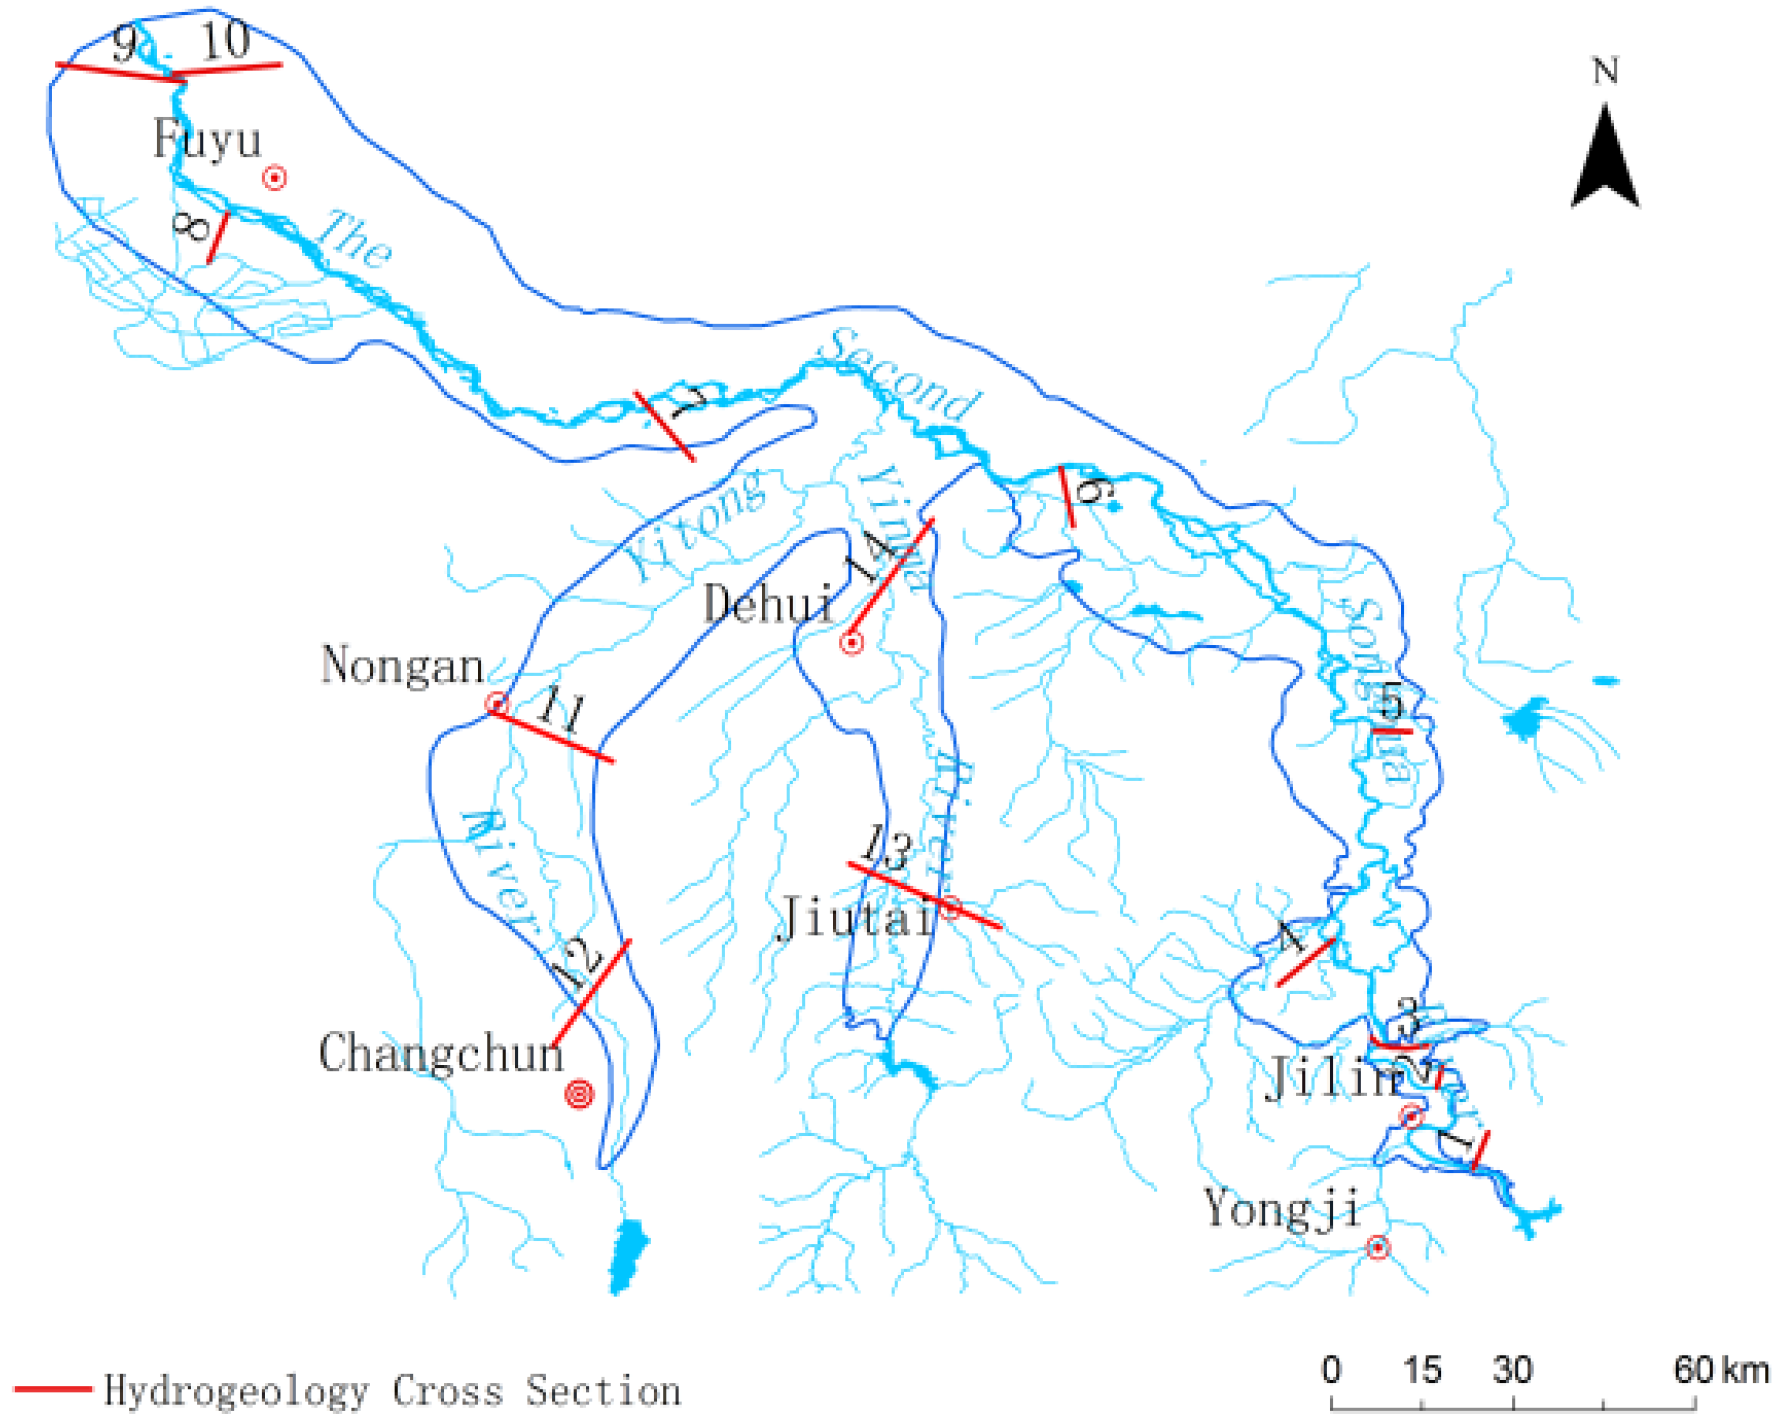
In this research, the downstream river basin of the Second Songhua River was set as the study area and the potential suitable area for RBF was evaluated. Based on the analysis of regional natural geography and hydrogeological conditions, an index system was established to evaluate the suitability of RBF along the main stem of the river in the study area.

2. Study Area

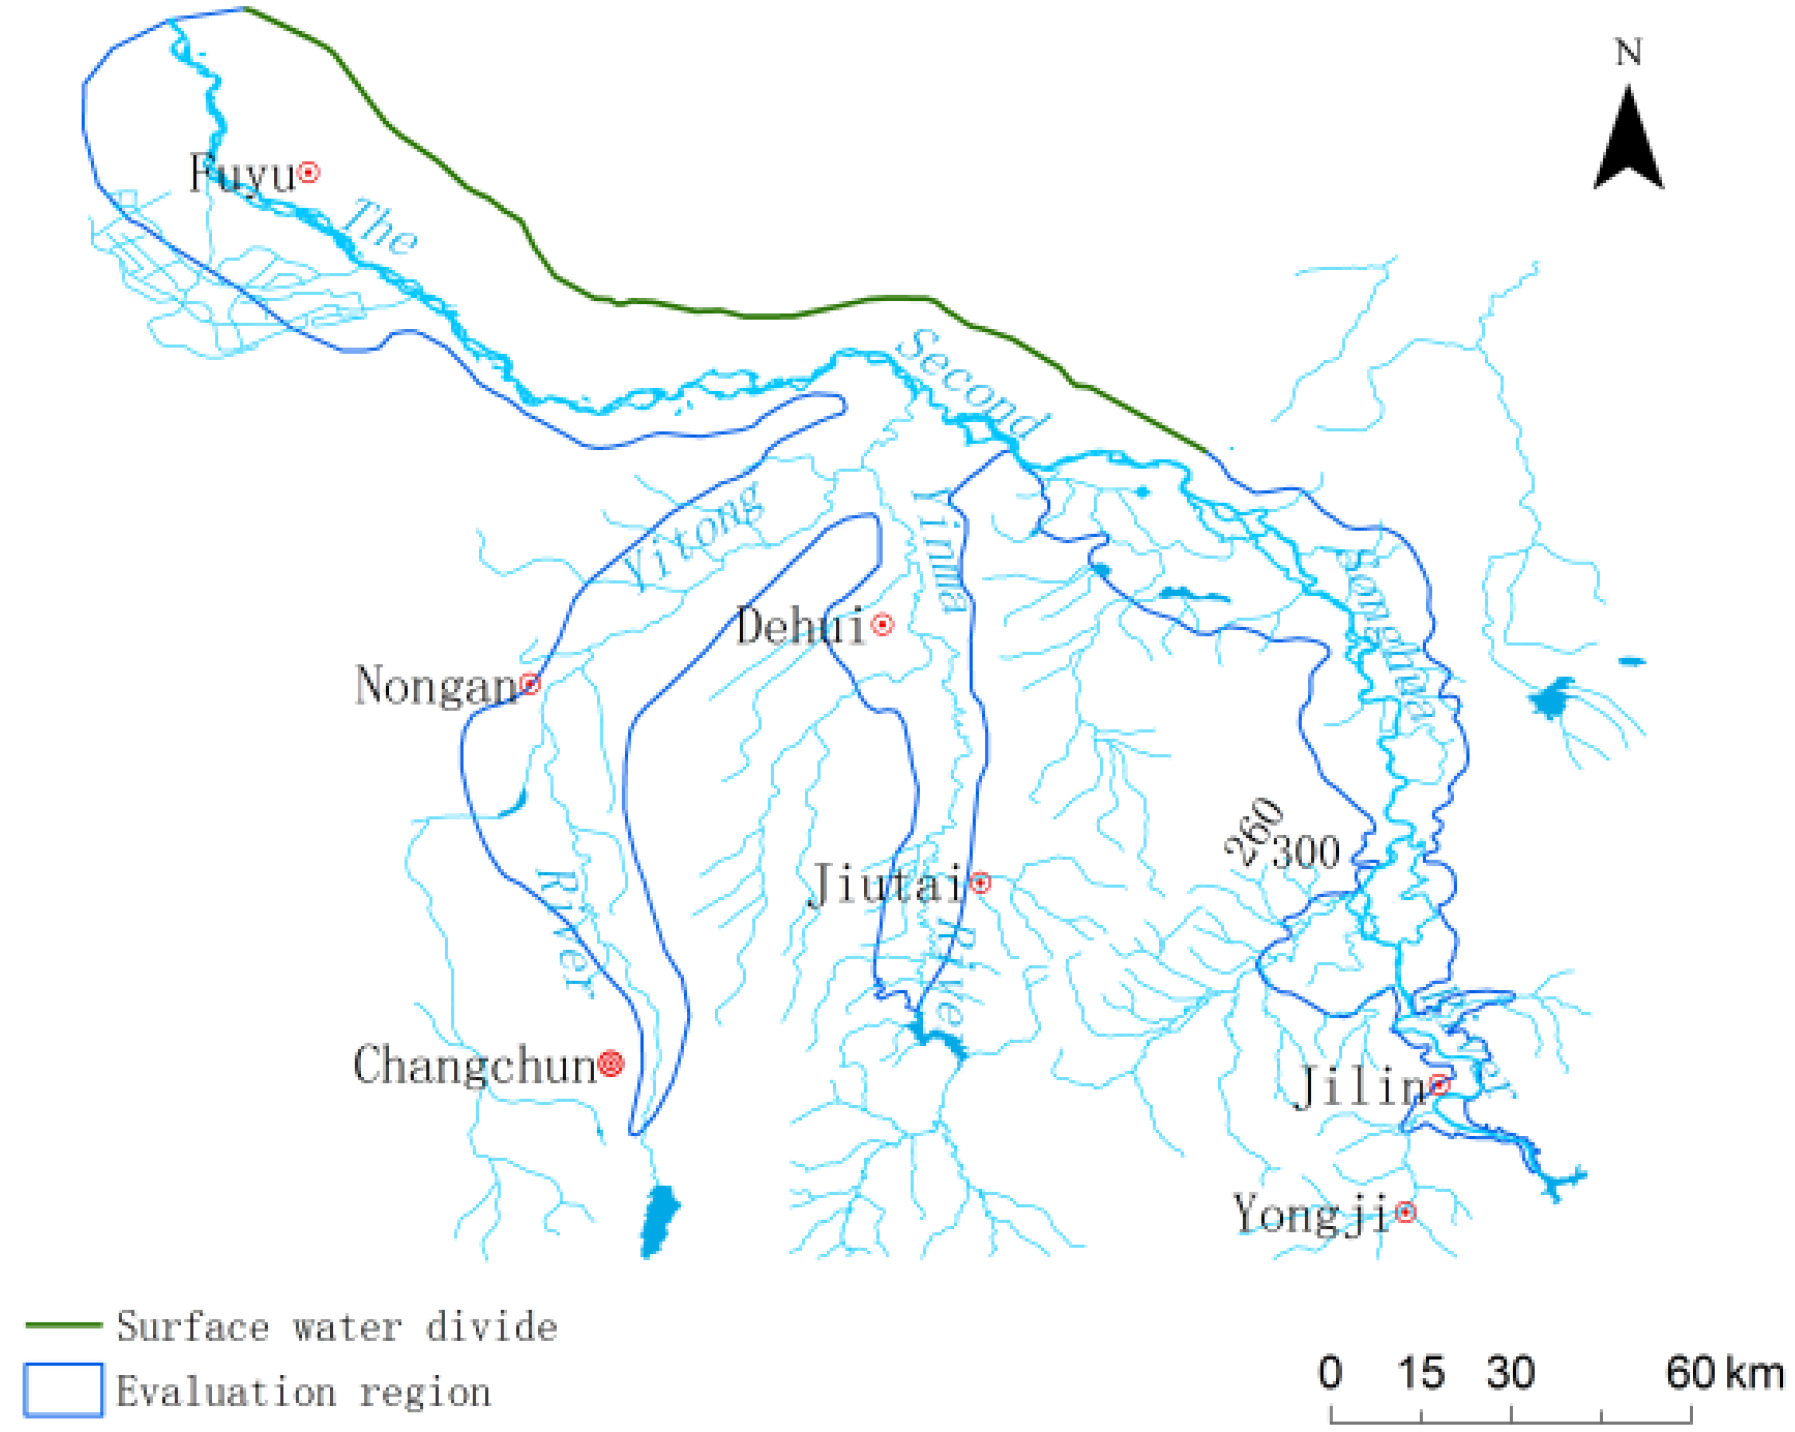
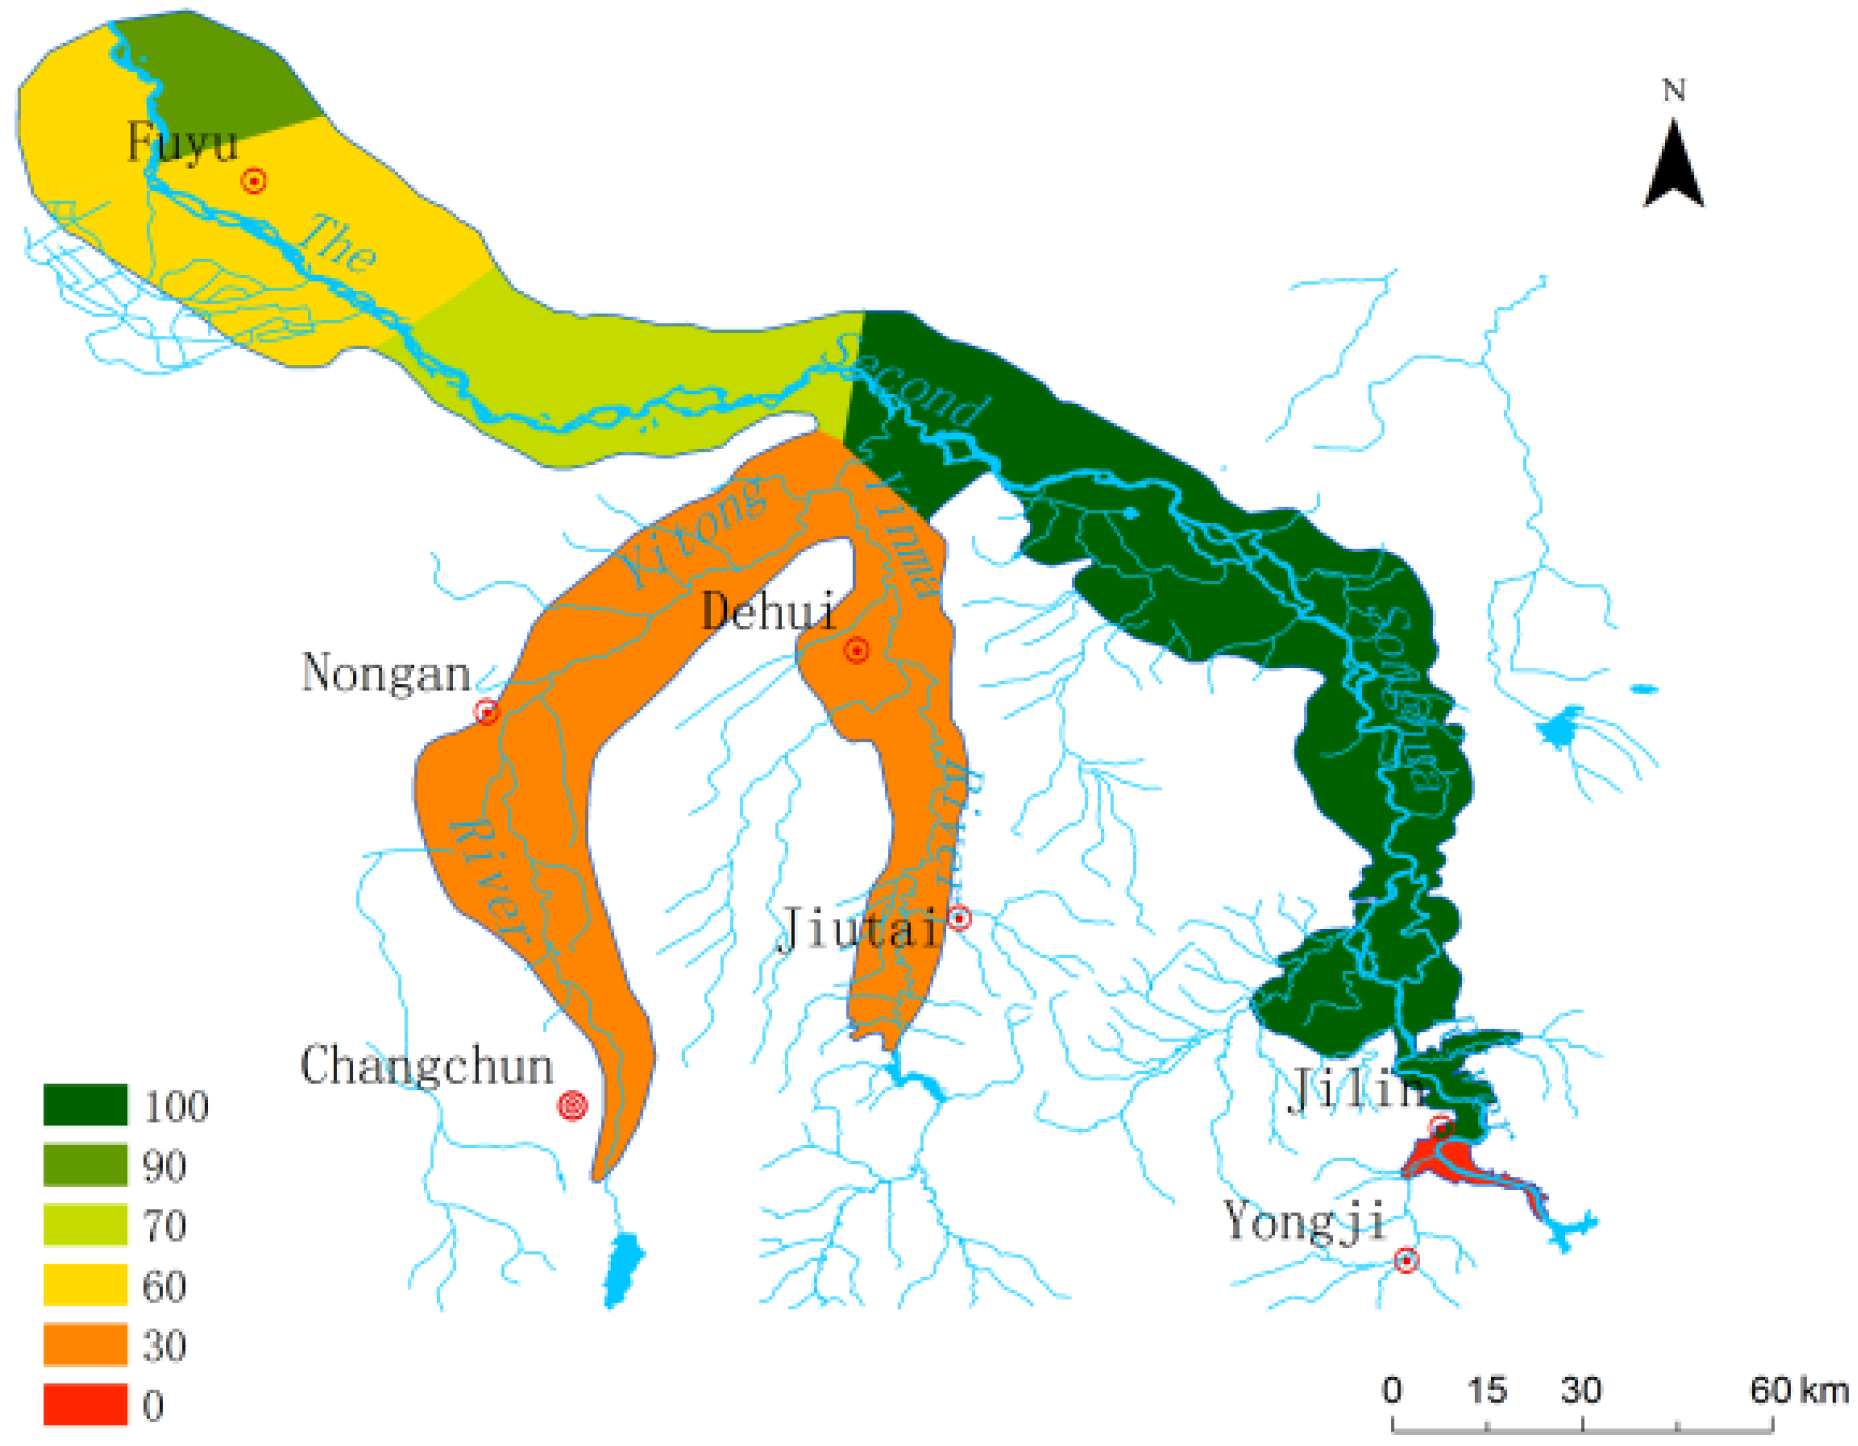
The Second Songhua River is the largest river in Jilin Province, and originates from Tianchi Lake in the Changbai Mountains. The catchment area is 7.3 × 10⁴ km2, including the tributaries of the Yitong River, Yinma River, Mangniu River and others, and accounts for 38.2% of the total province area. The study area focuses on the plain area of the Second Songhua River catchment with a total area of 2.46 × 10⁴ km2 (Figure 1).
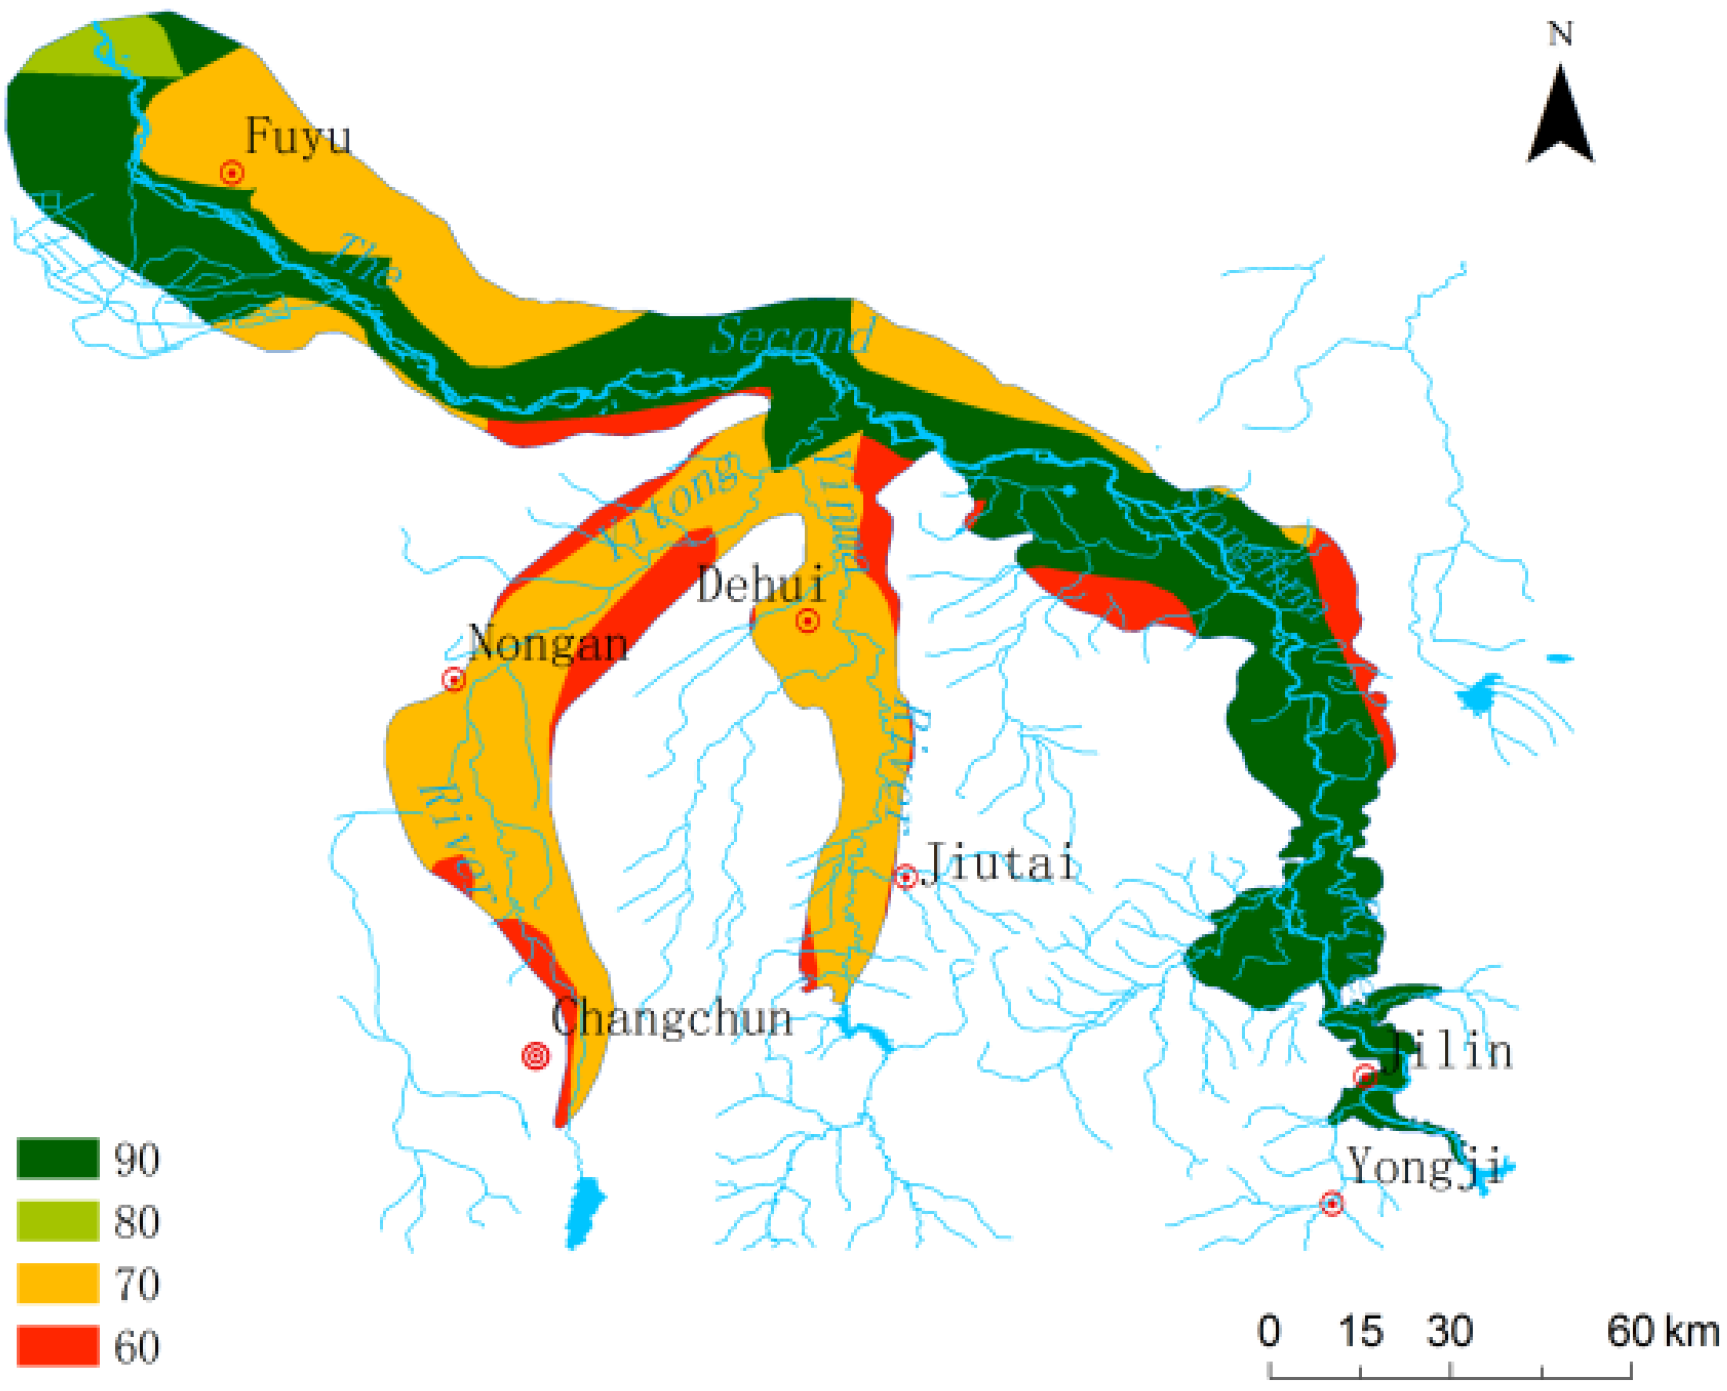
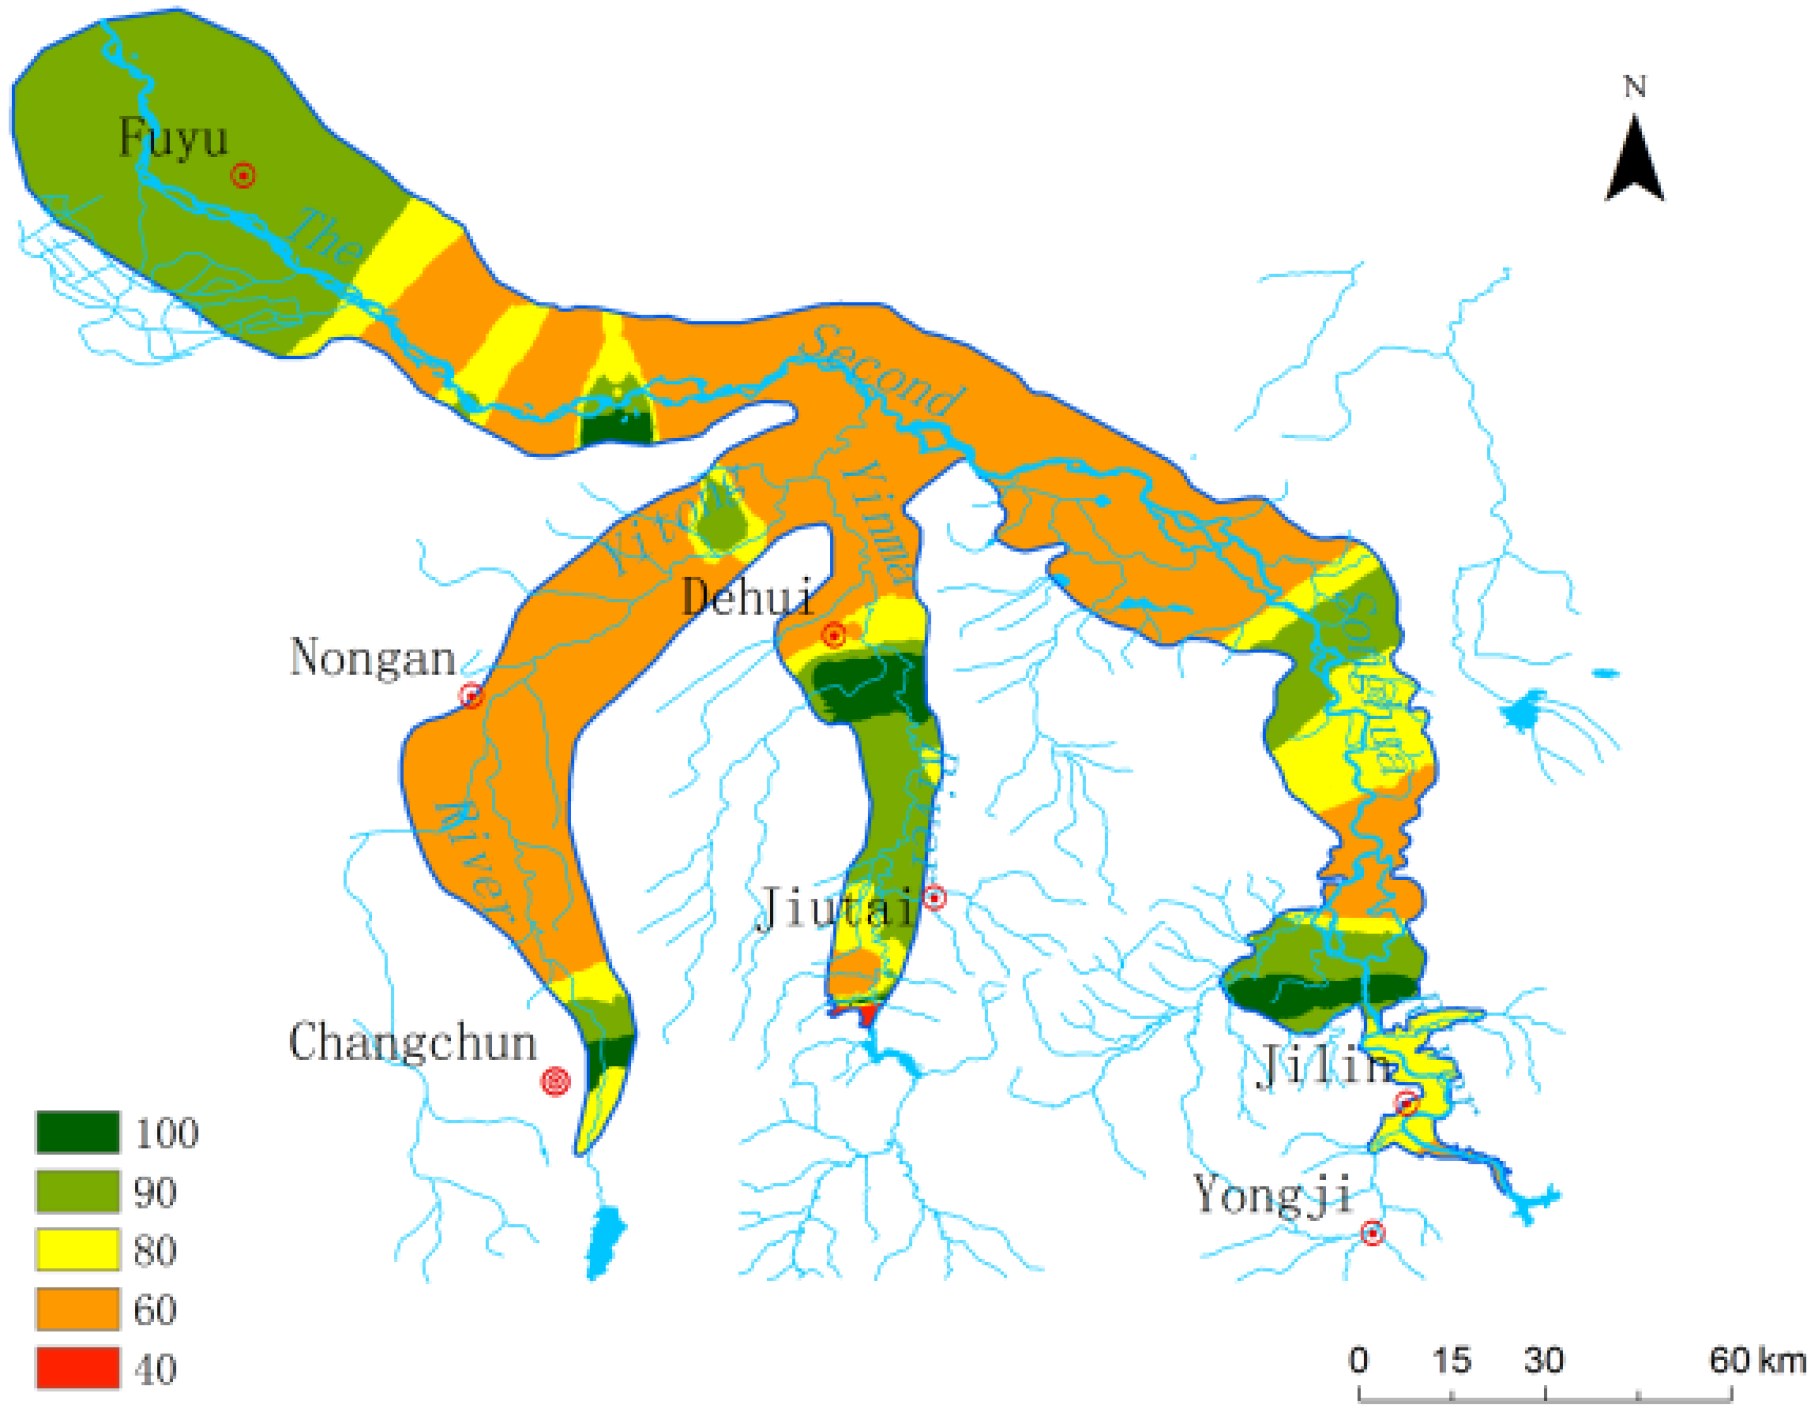
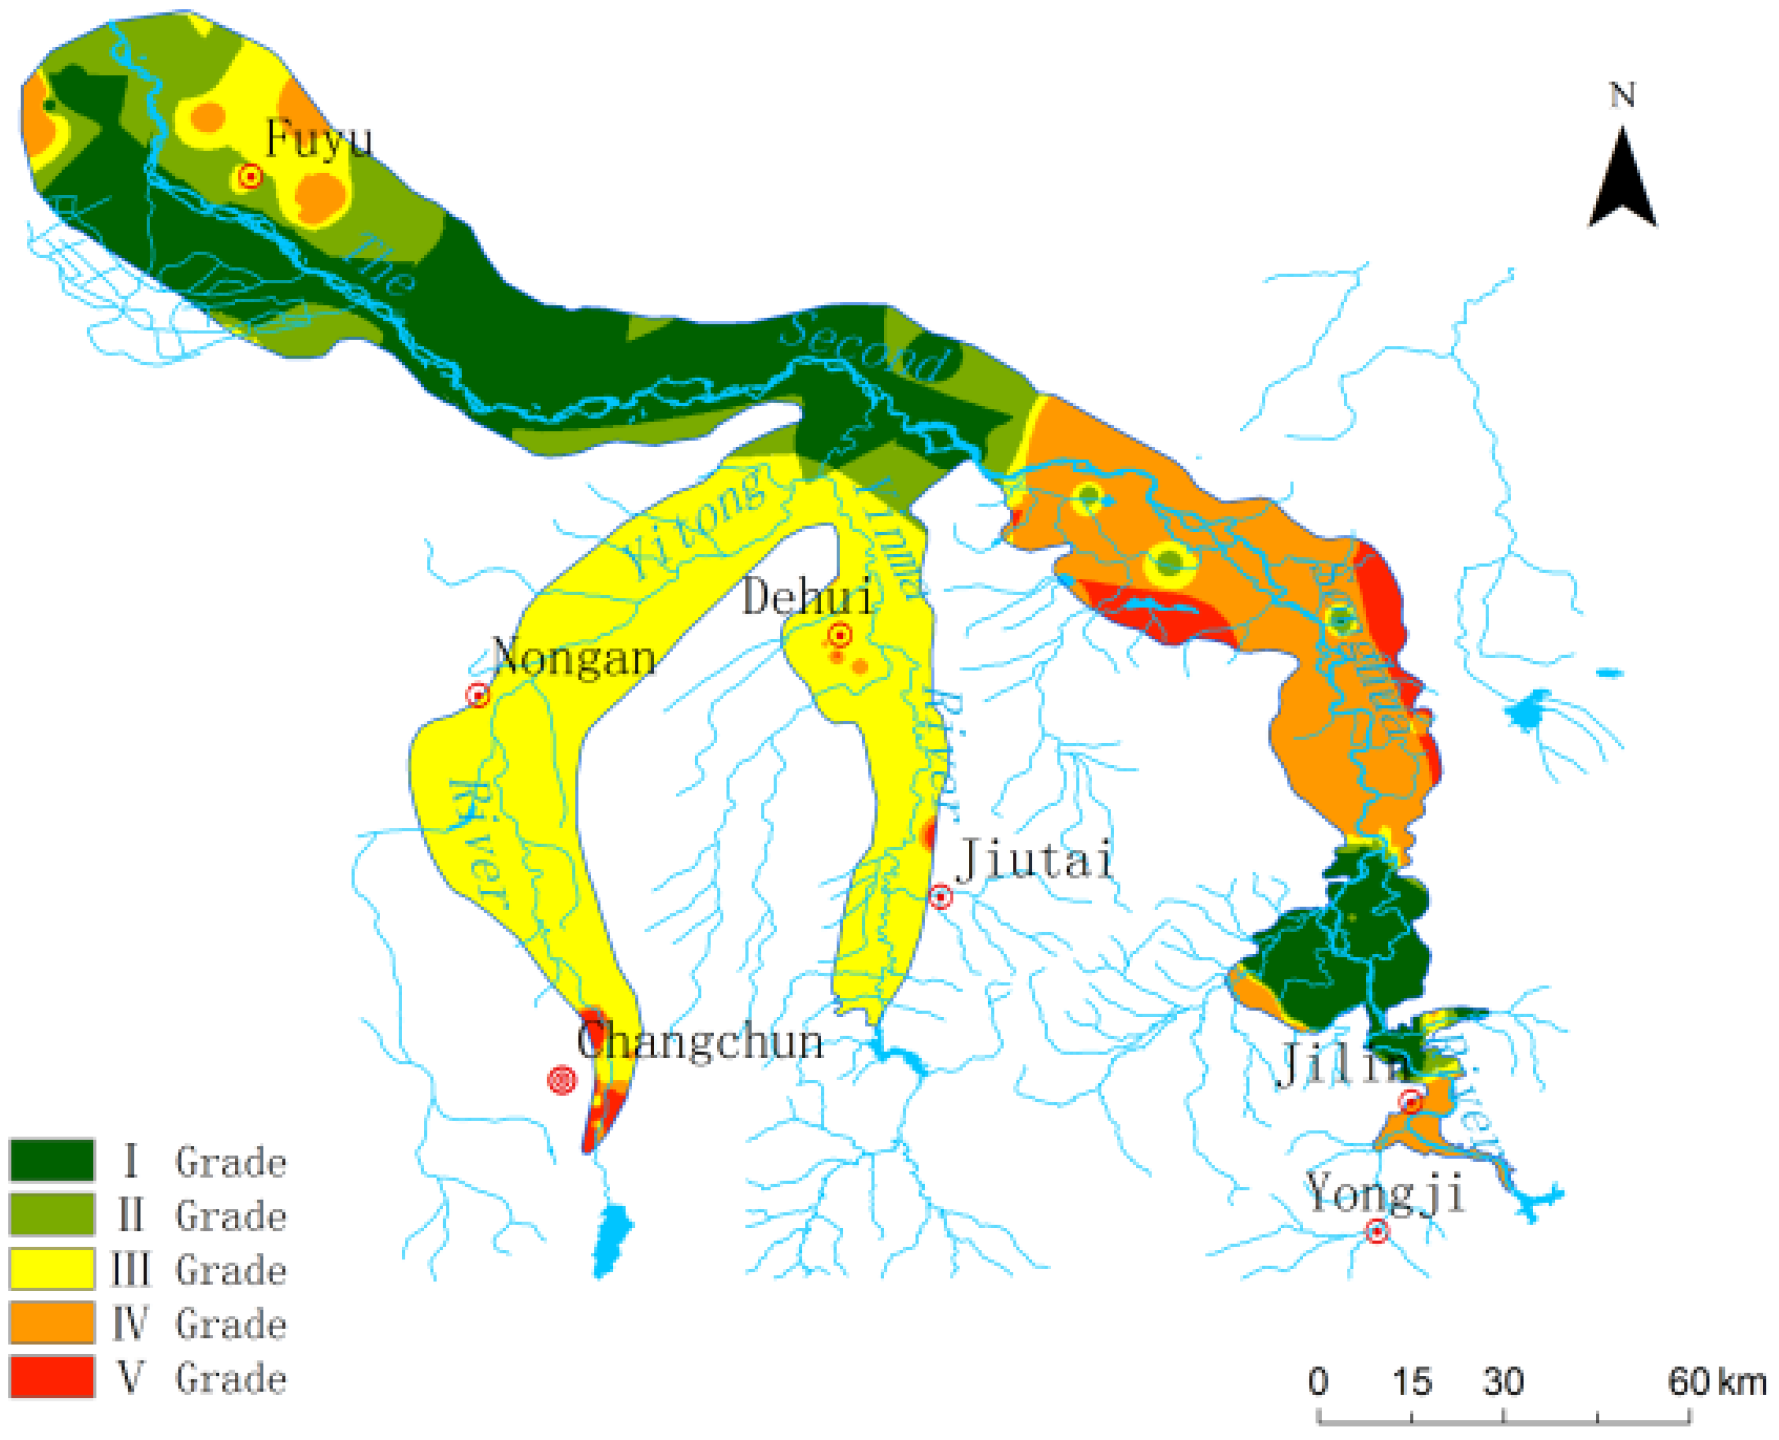
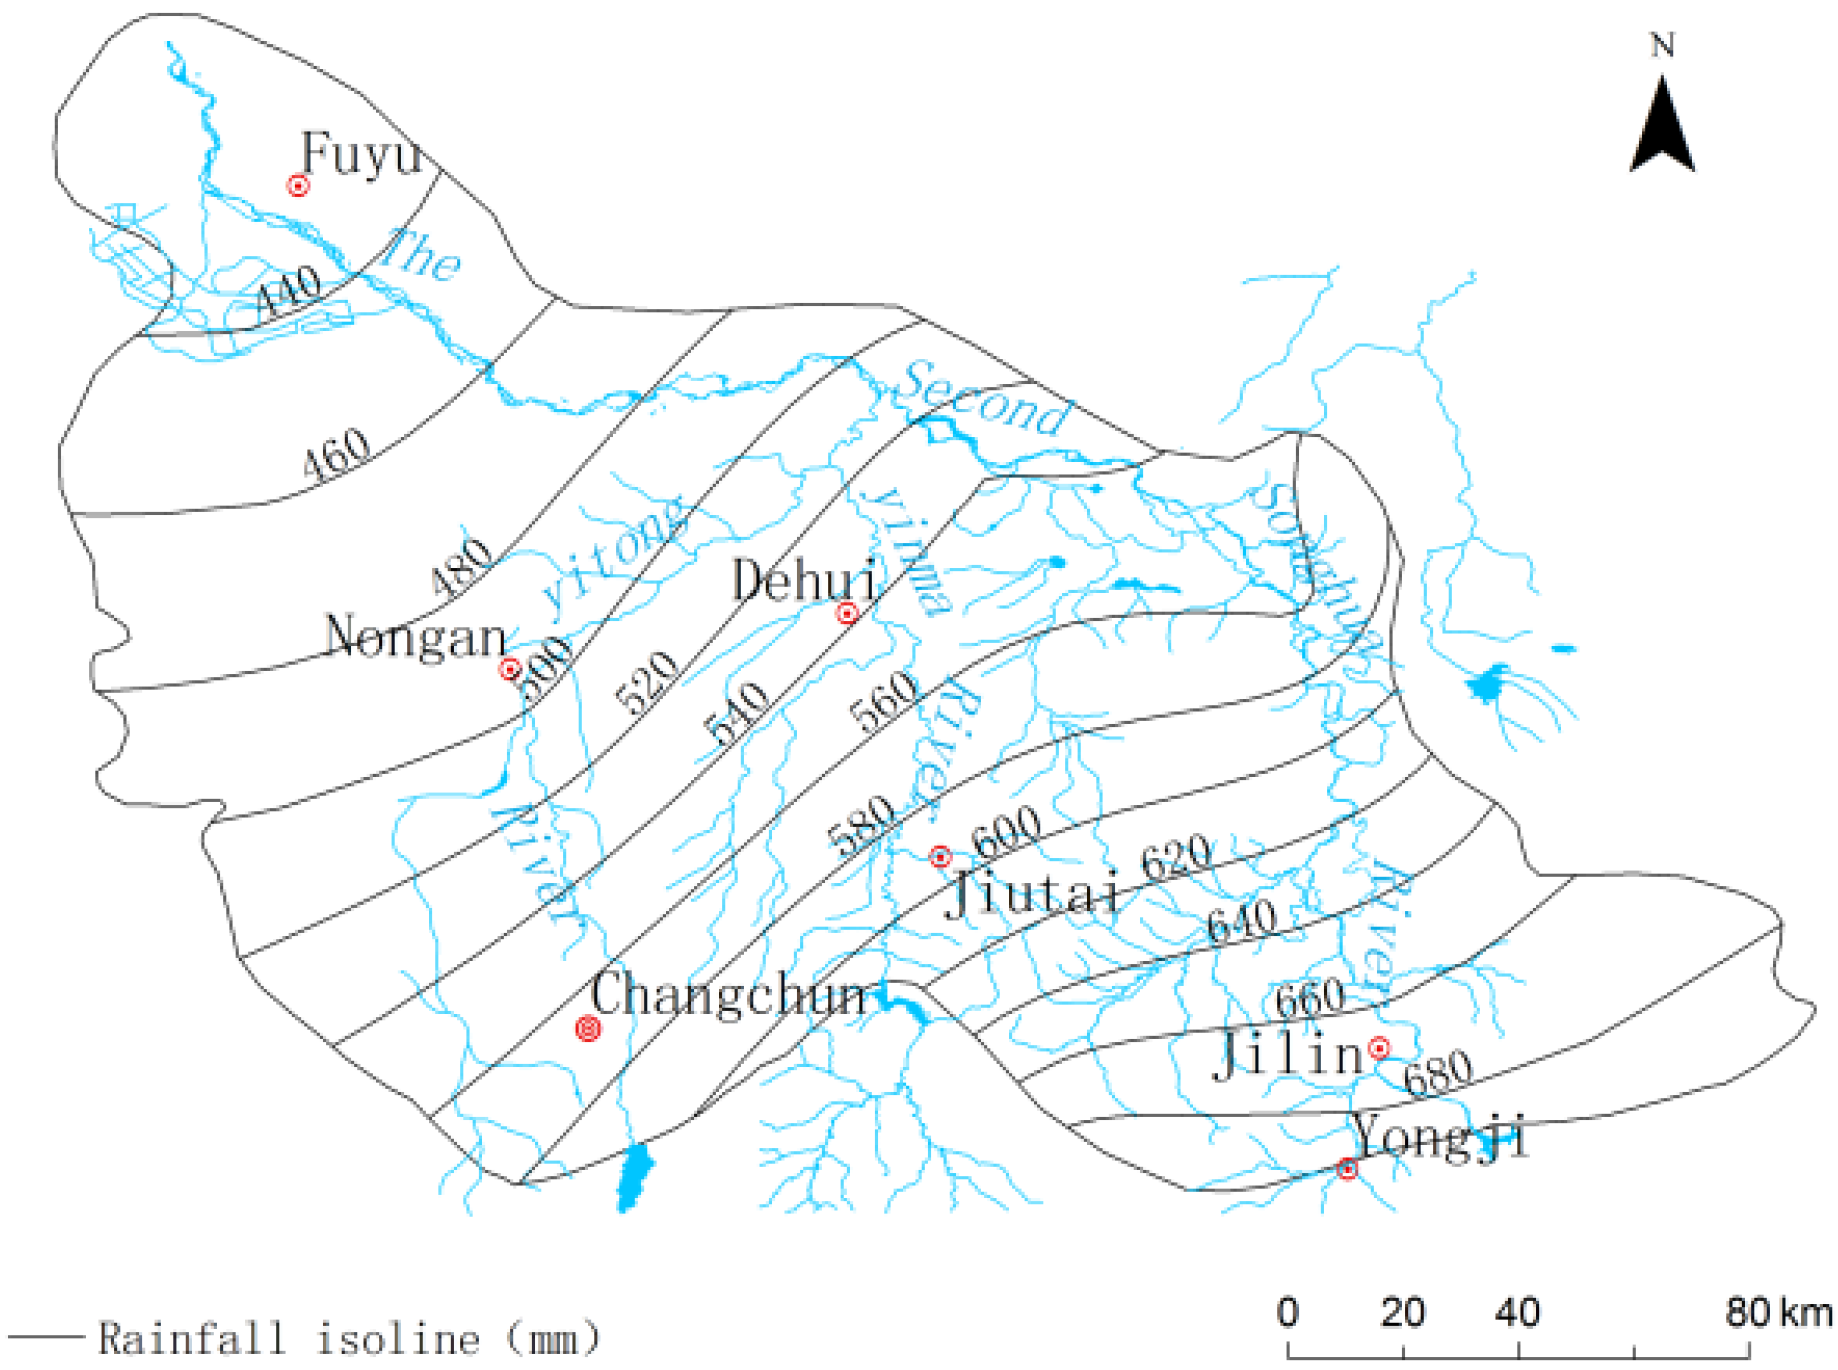
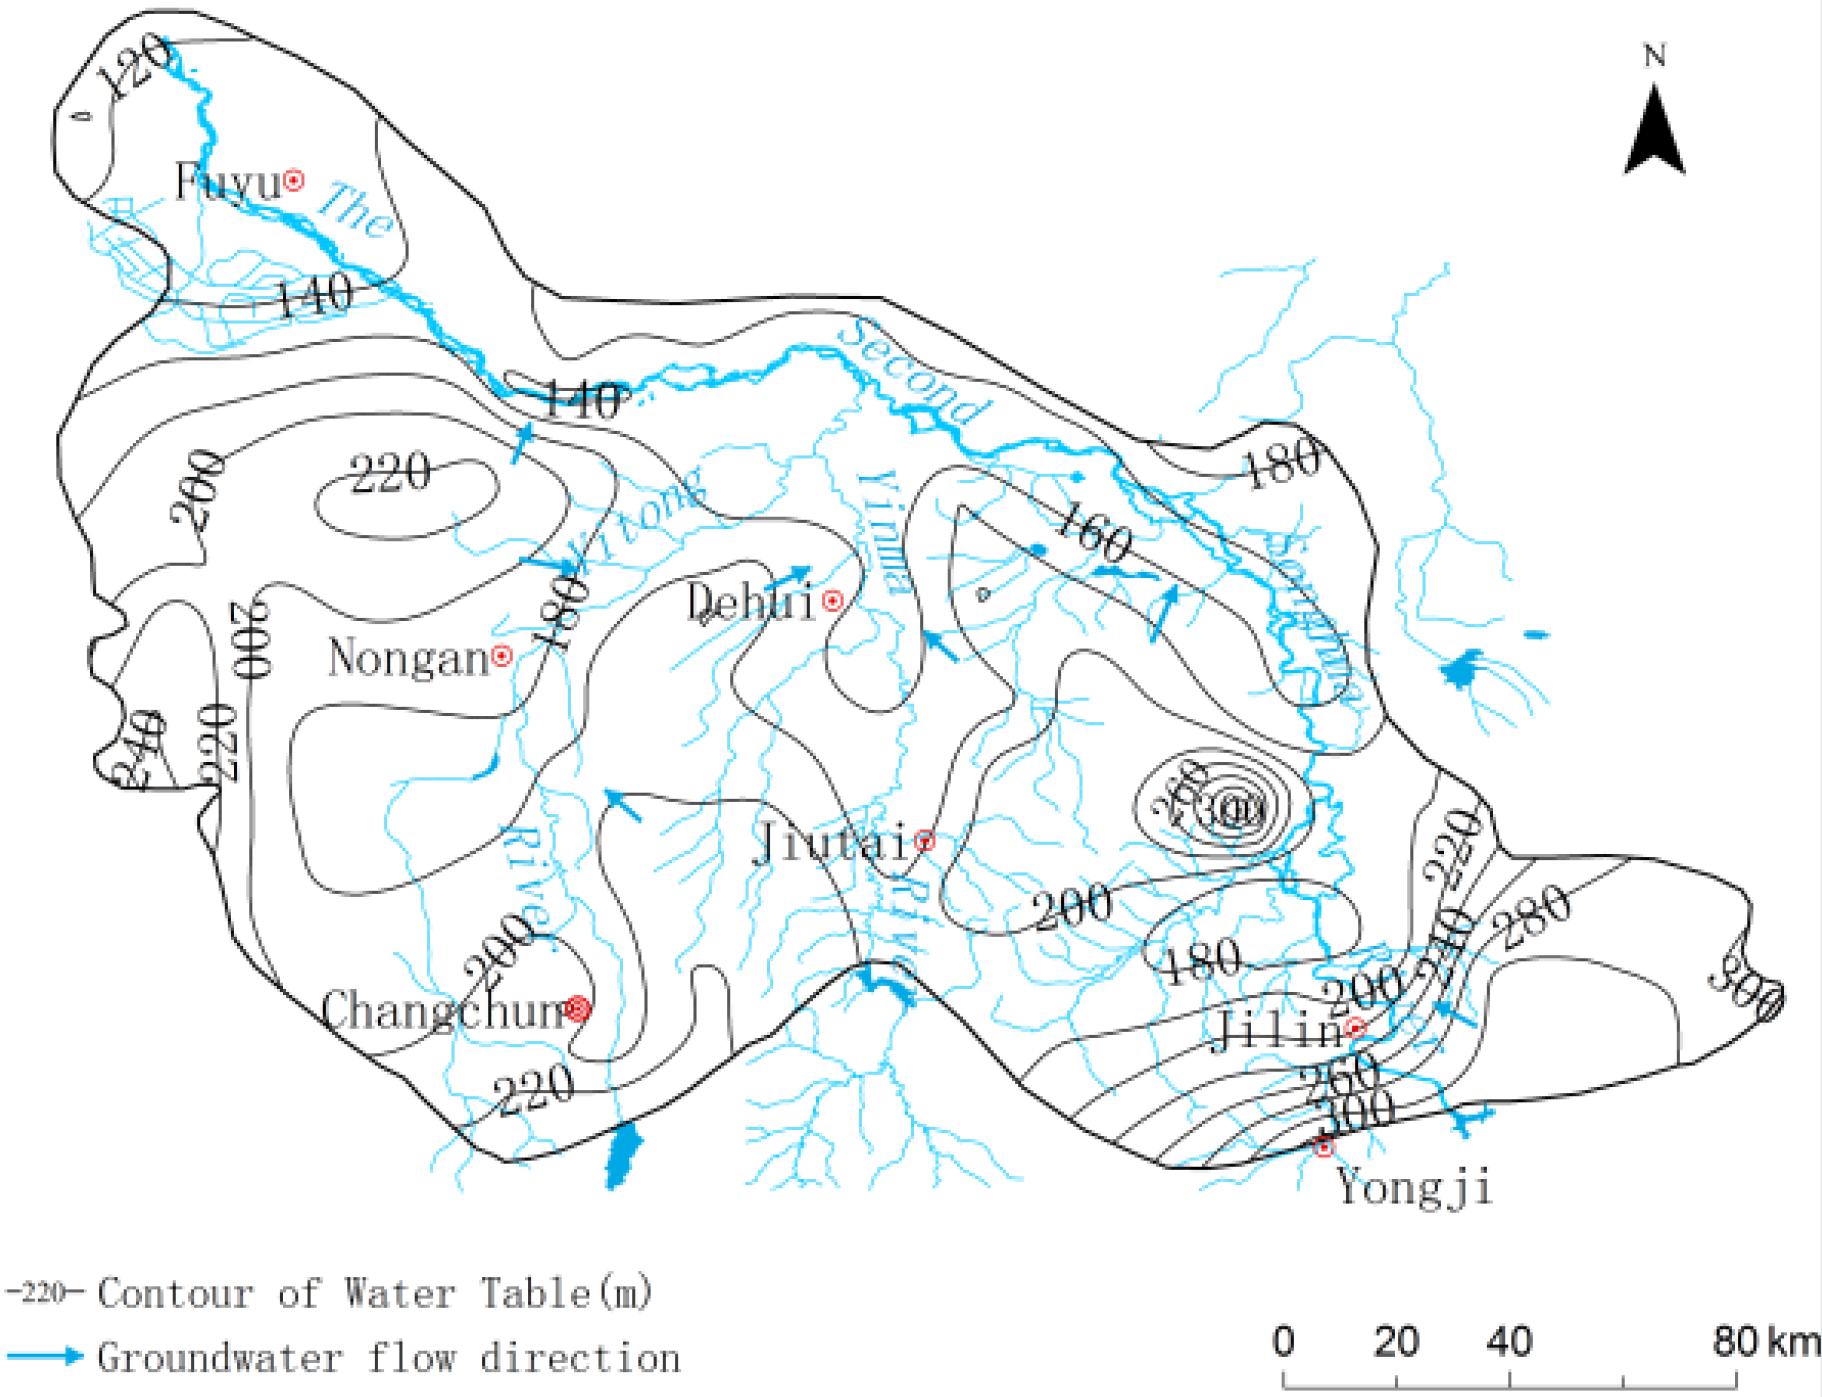
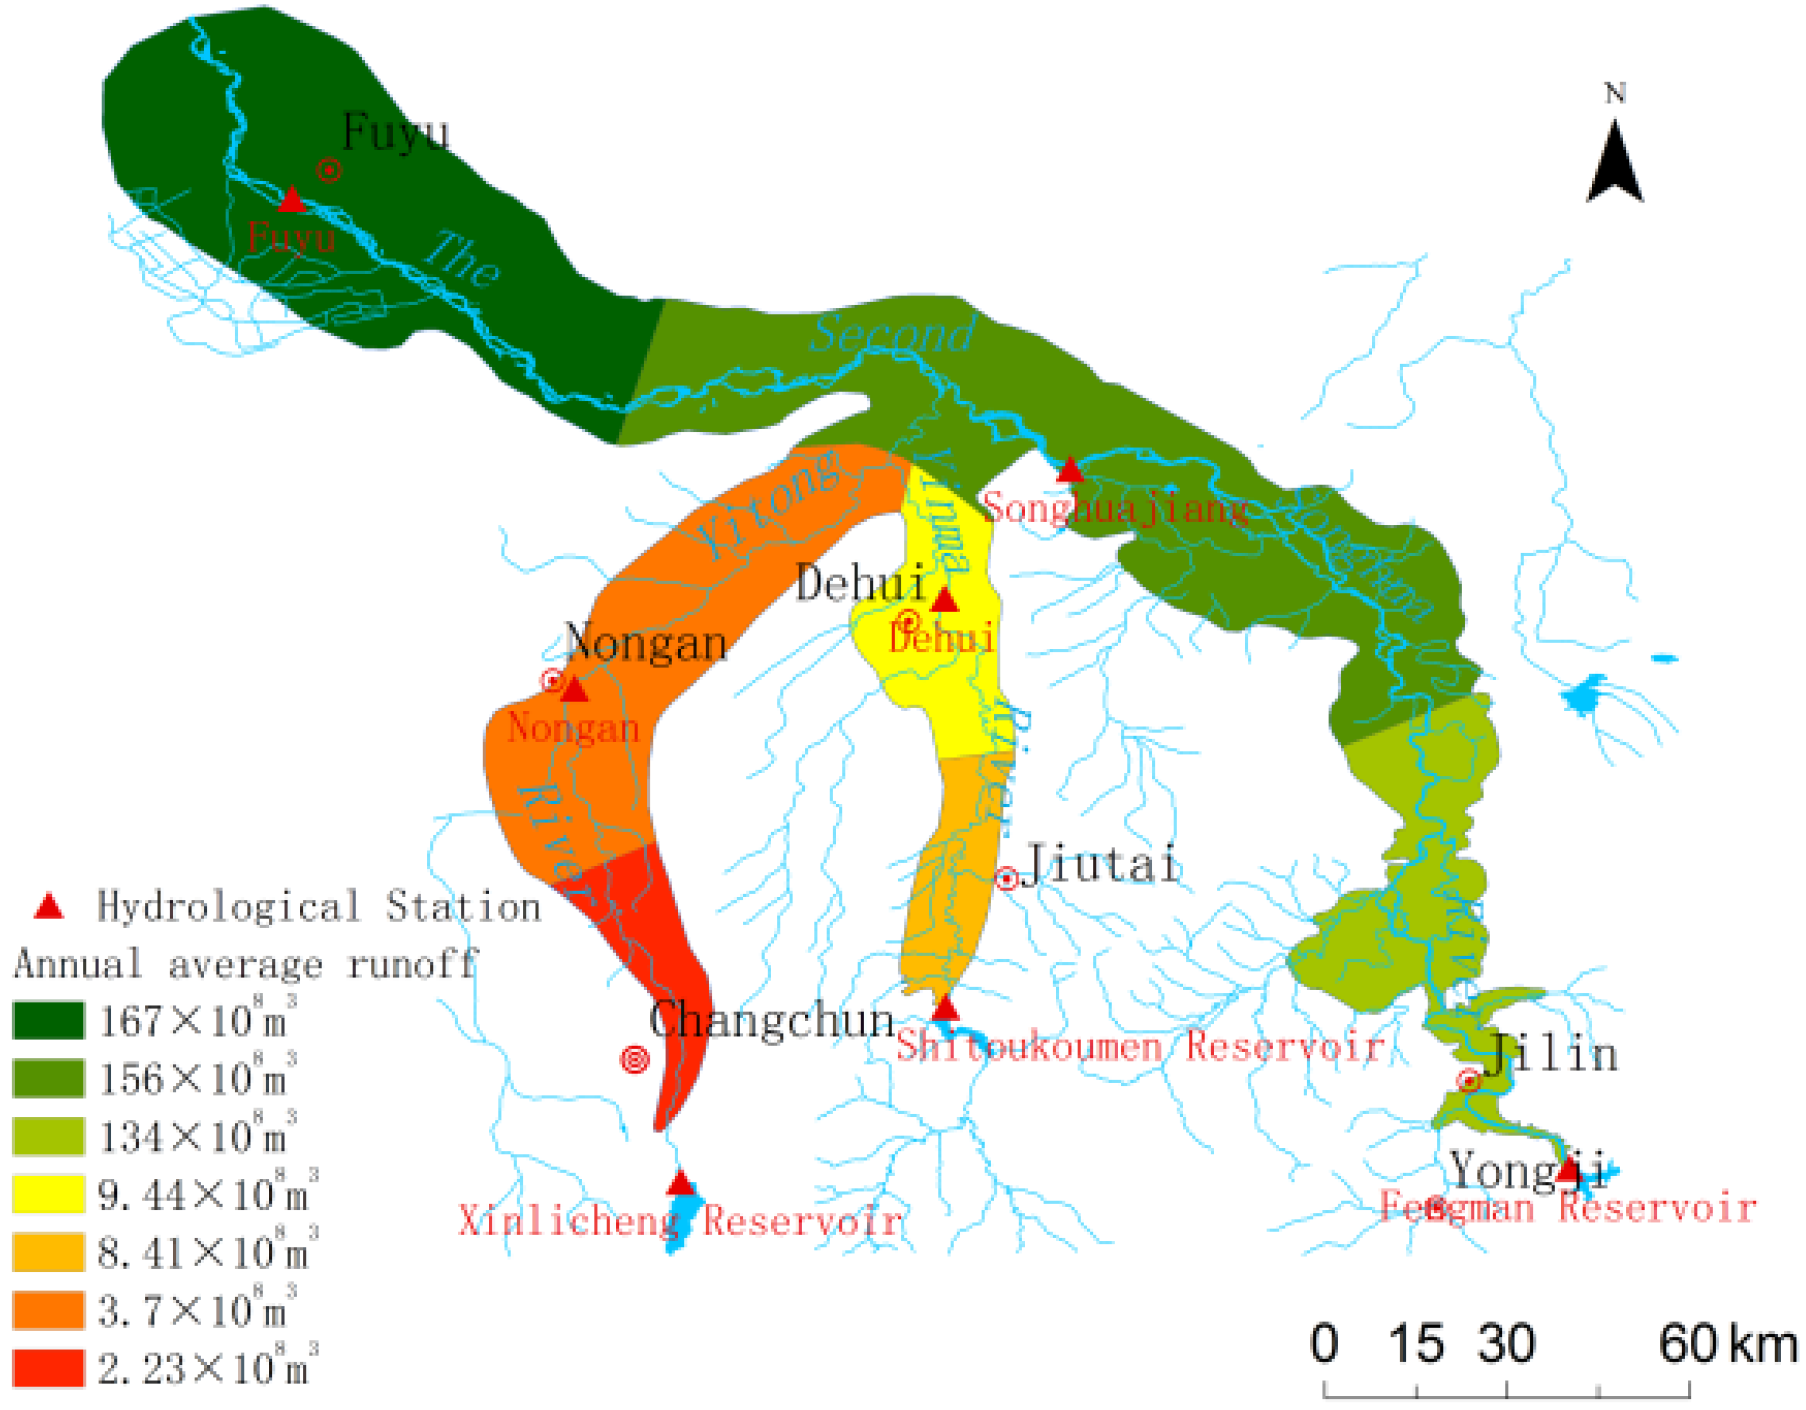
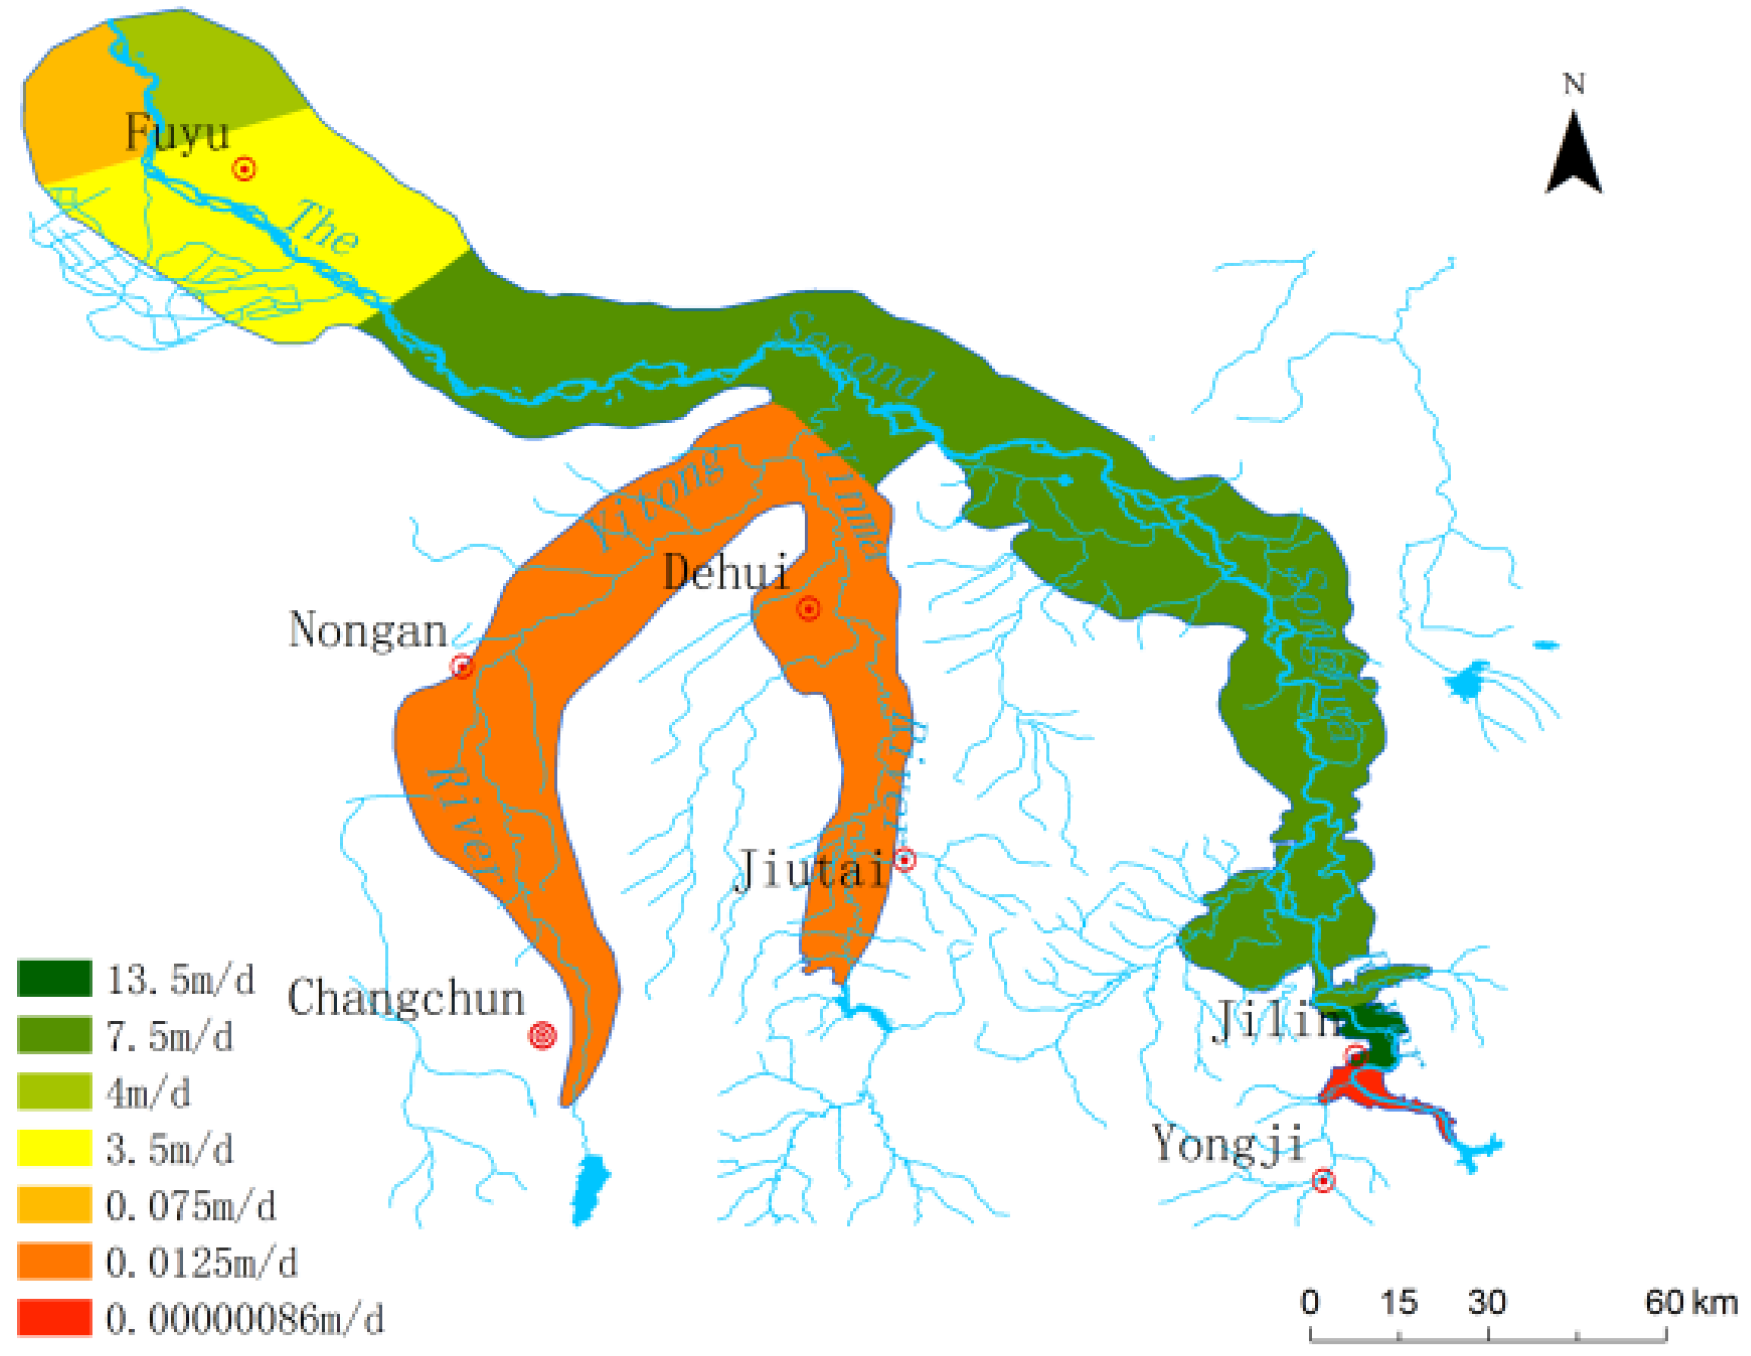
The major cities in the study area include Changchun City, the provincial capital of Jilin Province, and Jilin City, Dehui City, Jiutai City, Nong’an County, and Fuyu County. The total length of the Second Songhua River is approximately 330 km in the study area. The Yinma River is the largest tributary of the Second Songhua River and stems from Hulanling Mountain in Panshi County, Jilin Province, finally entering the Second Songhua River in Nong’an County. The Yitong River is the tributary of the Yinma River and the second tributary of the Second Songhua River. The Yitong River stems from the north of Qingding Mountain in Yitong County, Jilin Province, and finally flows into the Second Songhua River. The average annual precipitation in the study area is 400–700 mm, decreasing from southeast to northwest (
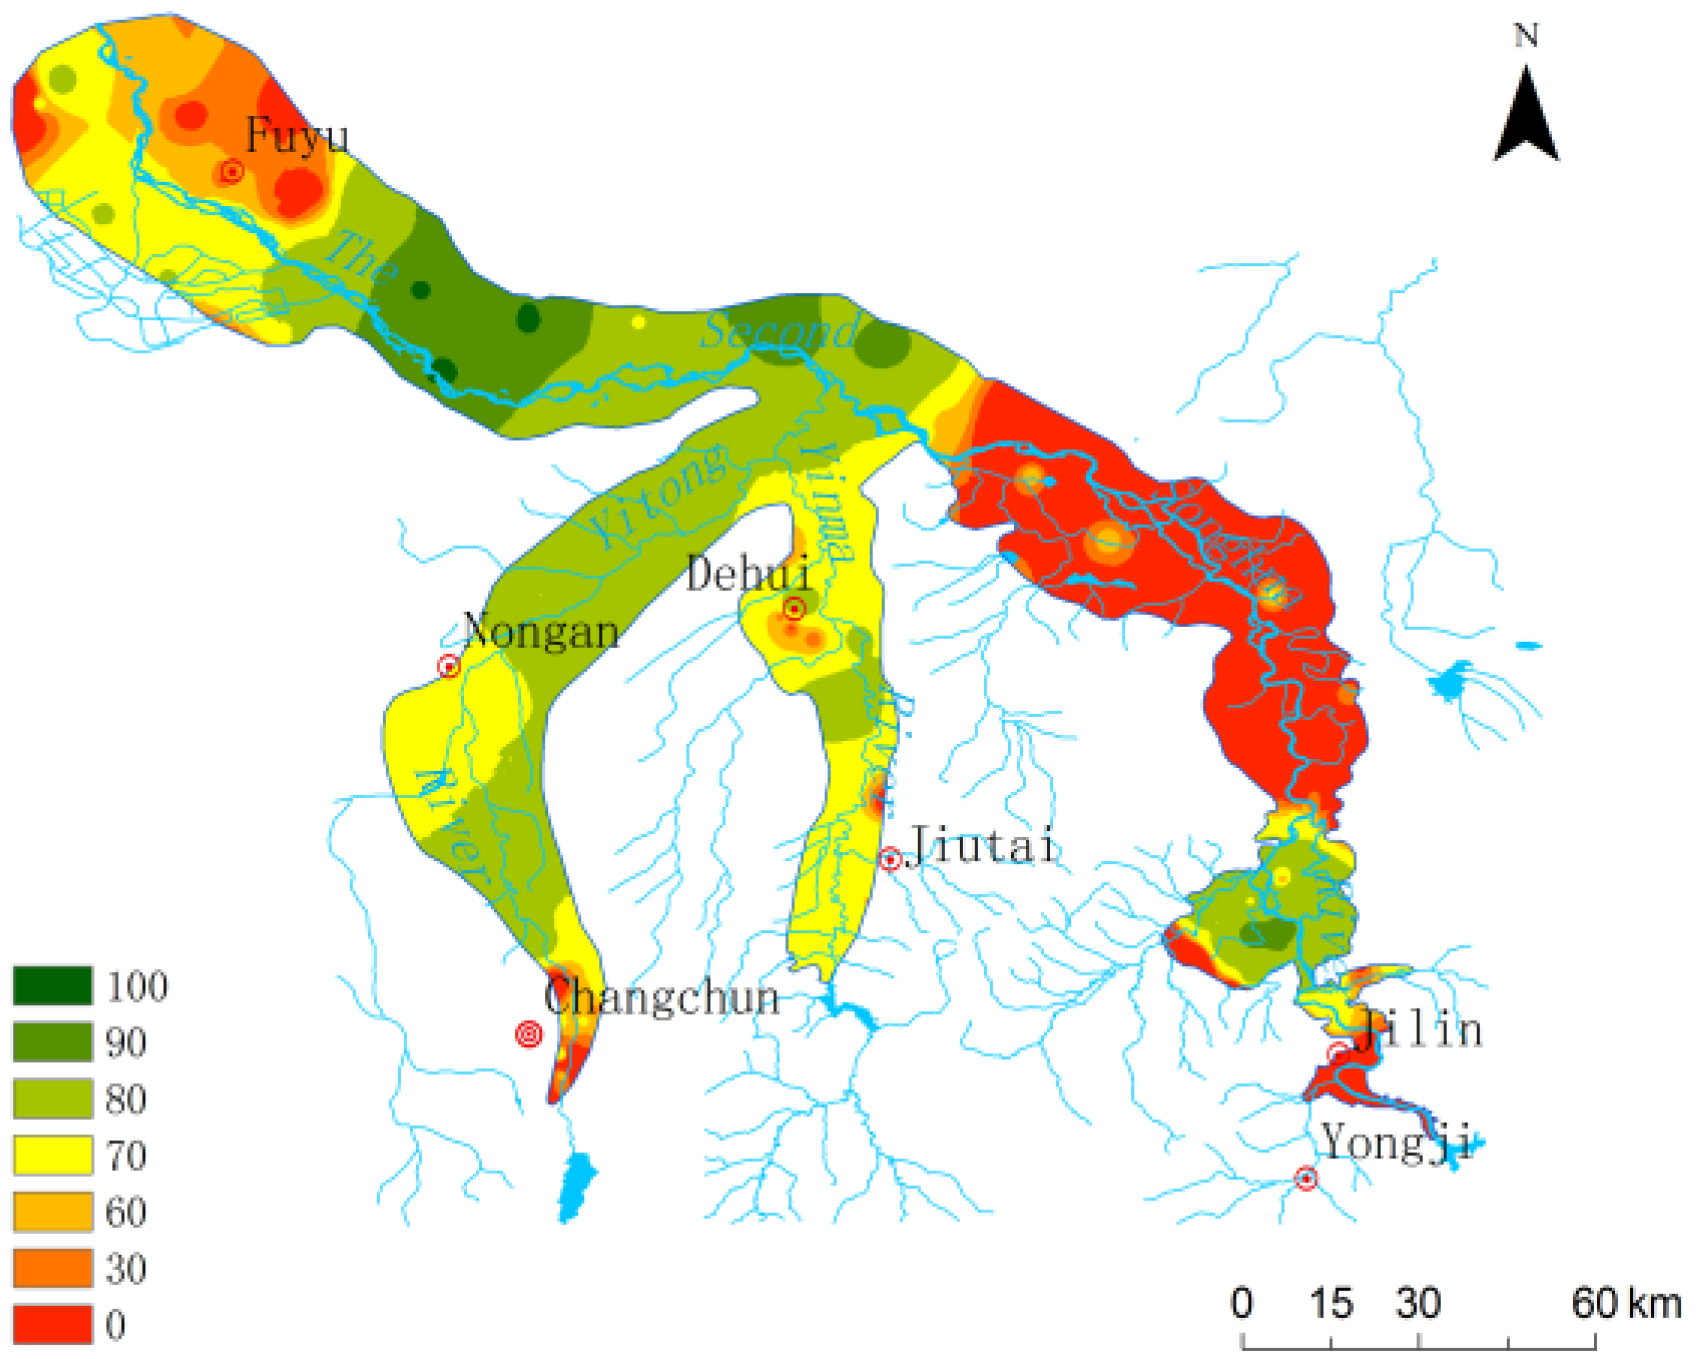
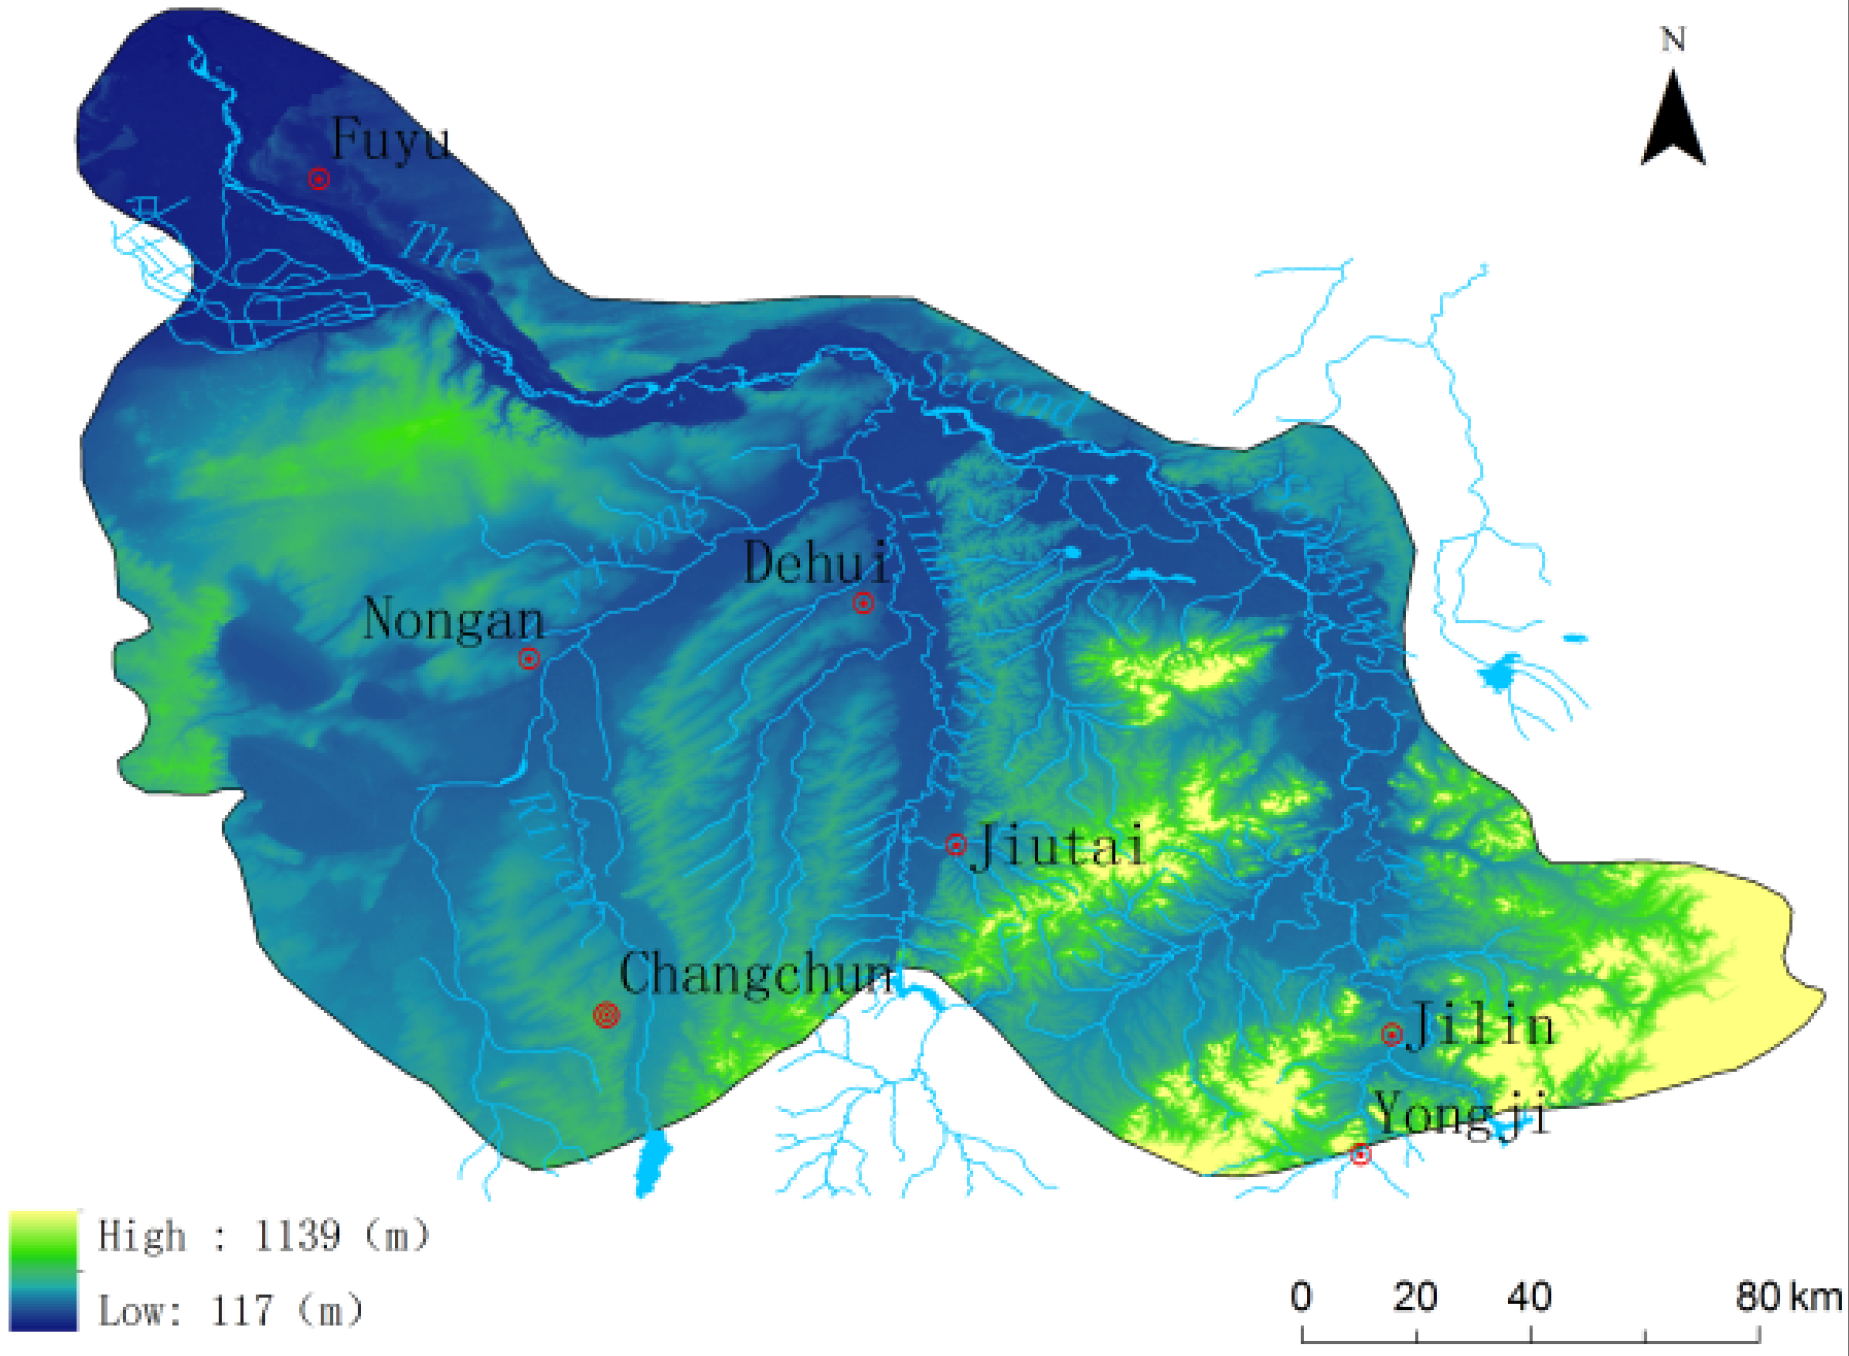
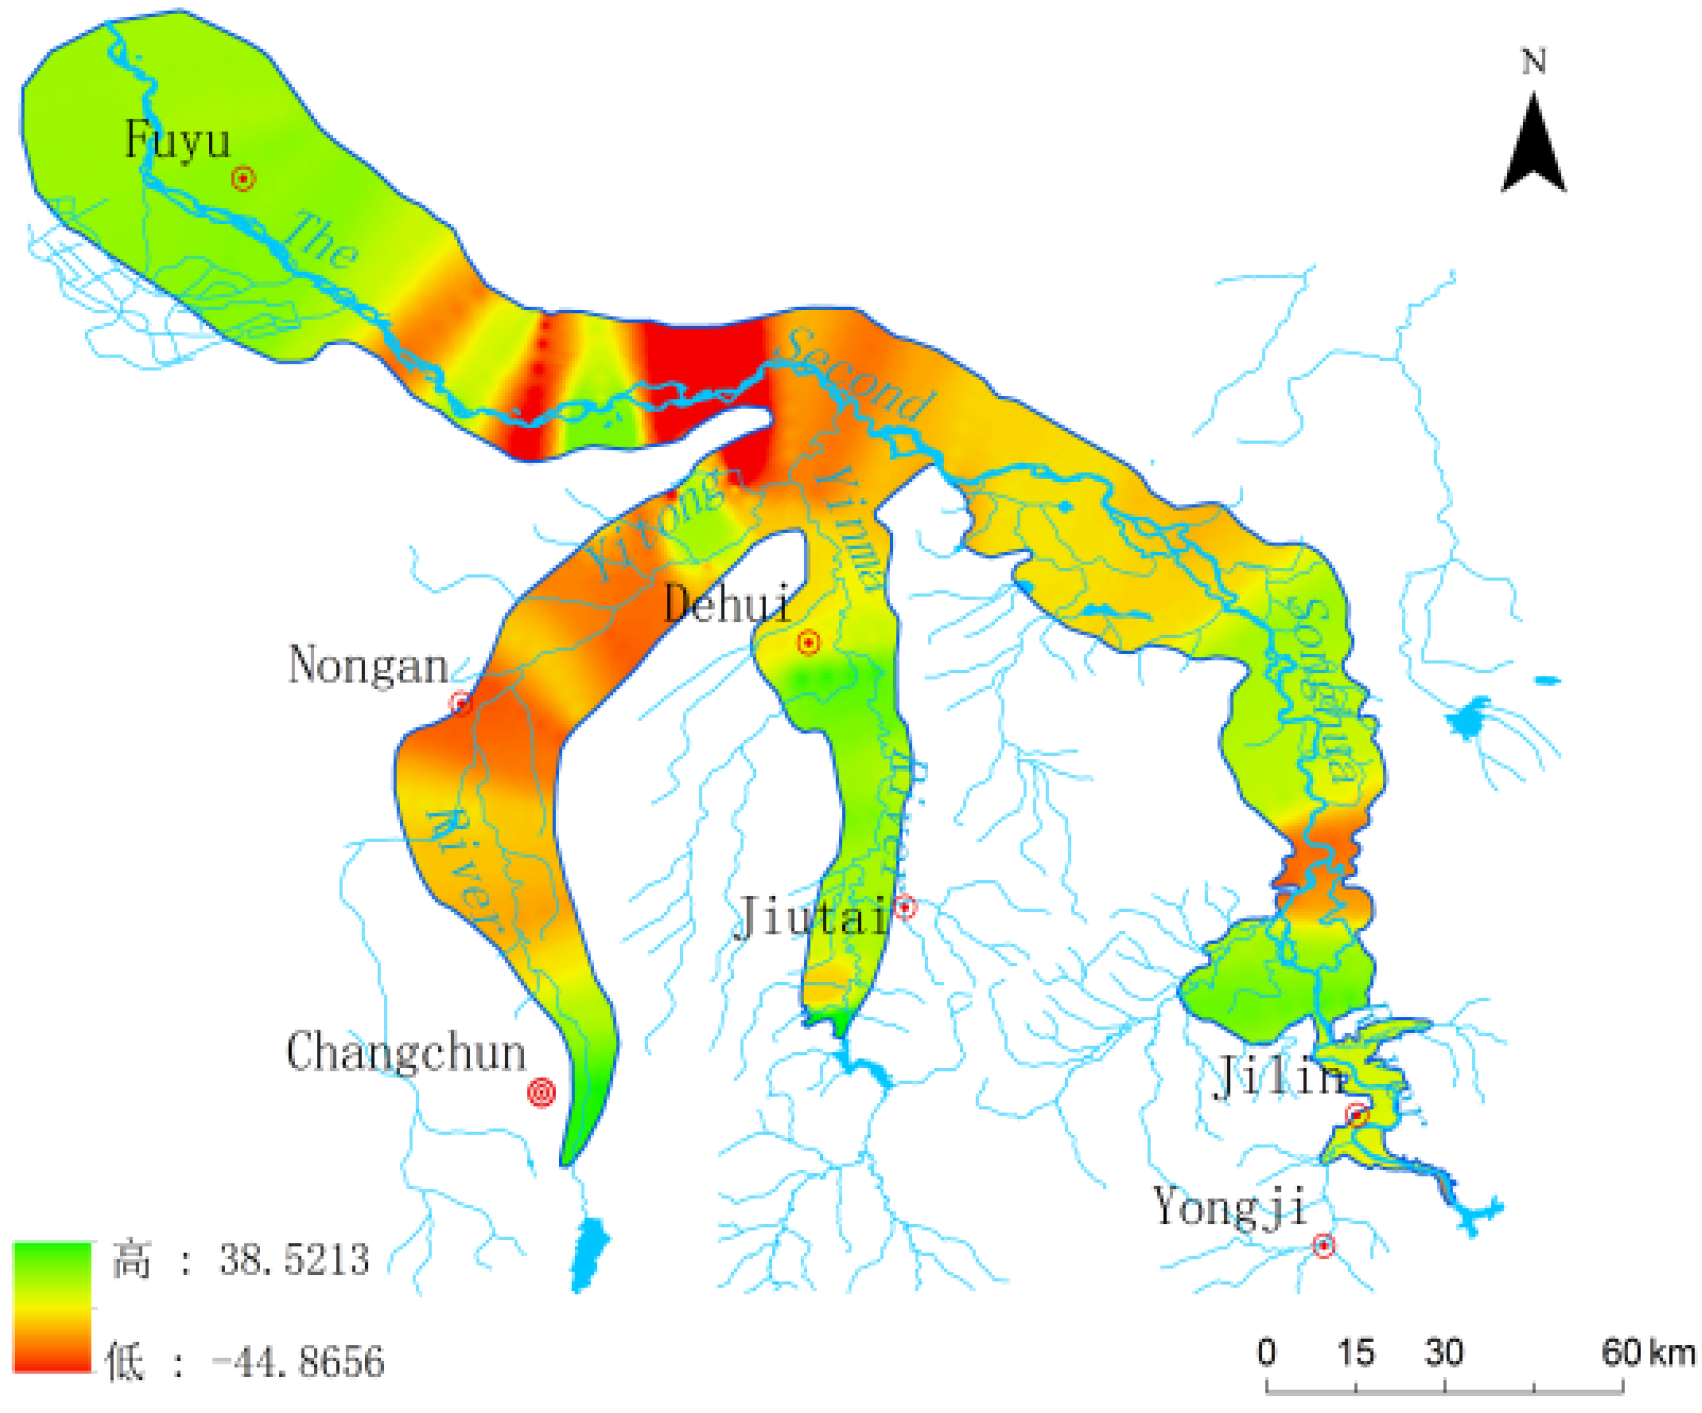
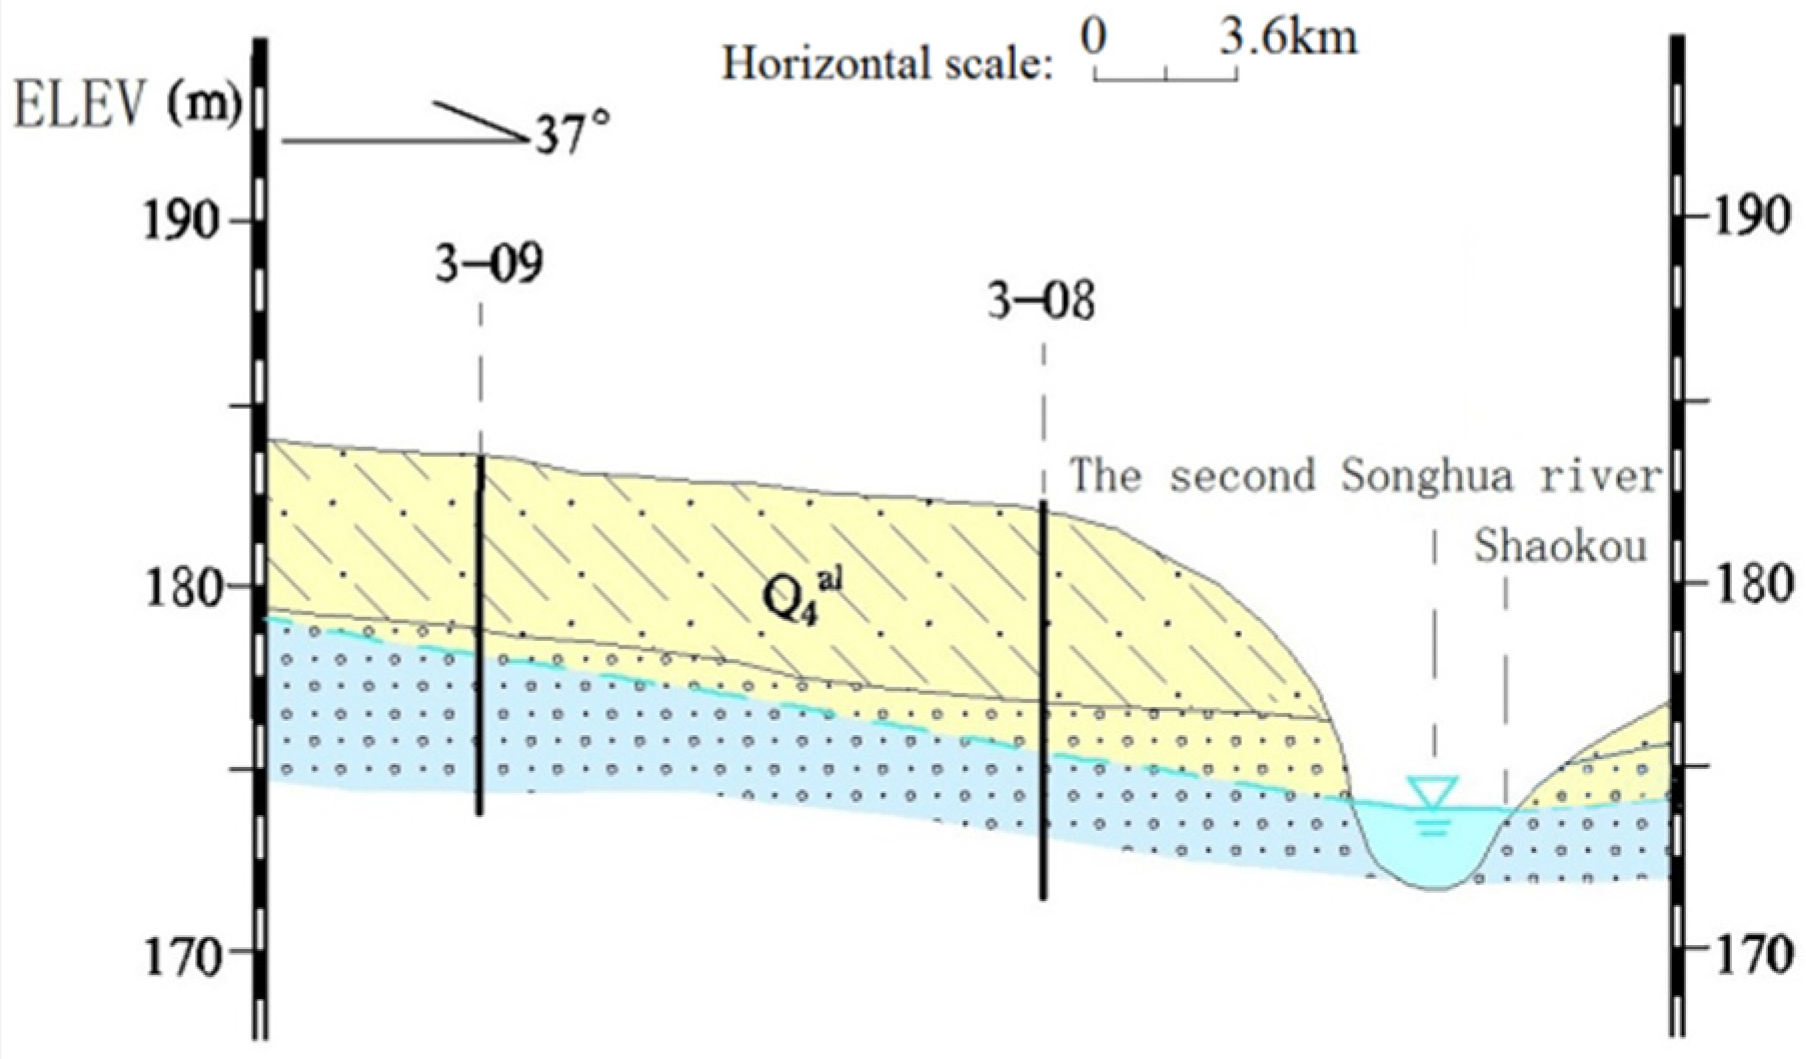
Figure 2). Both sides of the Second Songhua River are dominated by the valley plain geomorphic unit. The sedimentary plain is divided into multiple blocks between rivers with floodplain and terrace, and the surface elevation decreases gradually from the southeast to the northwest (
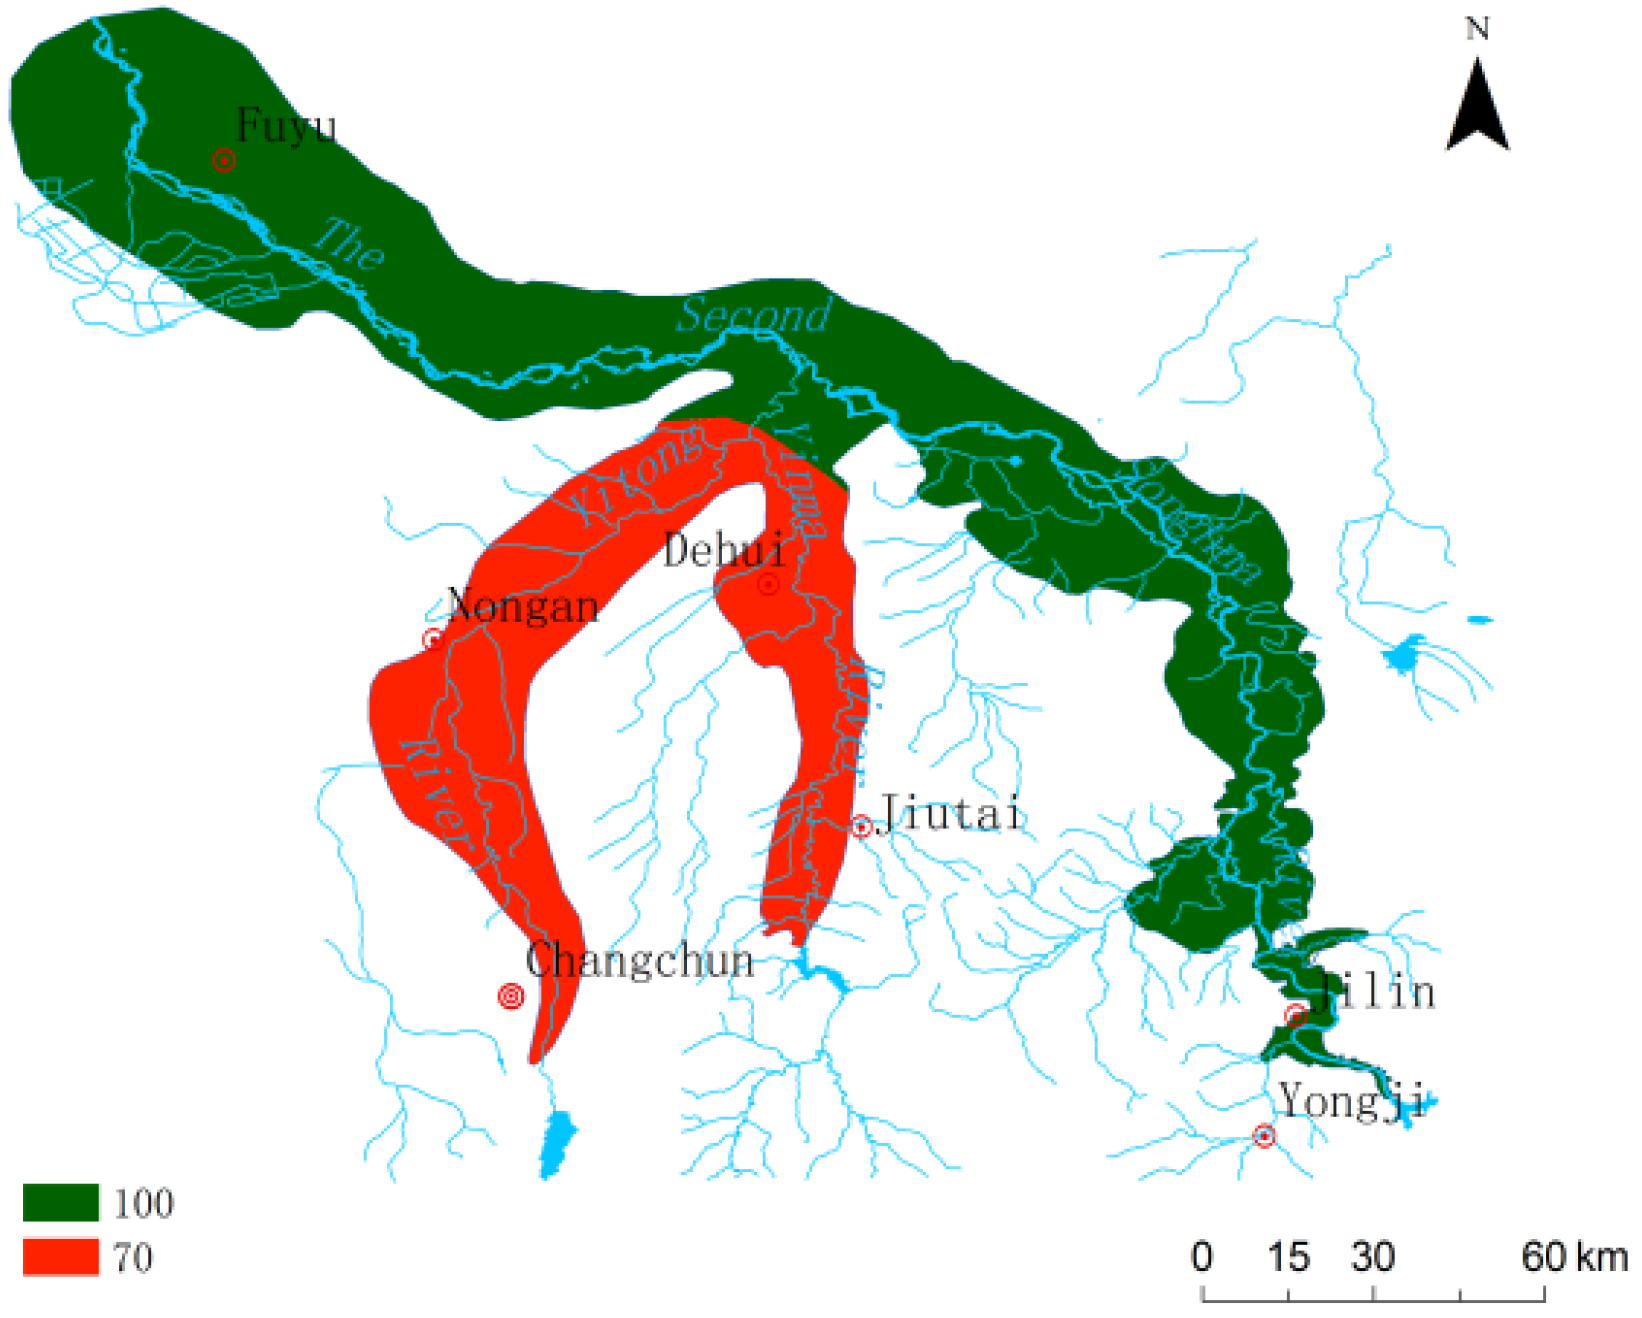
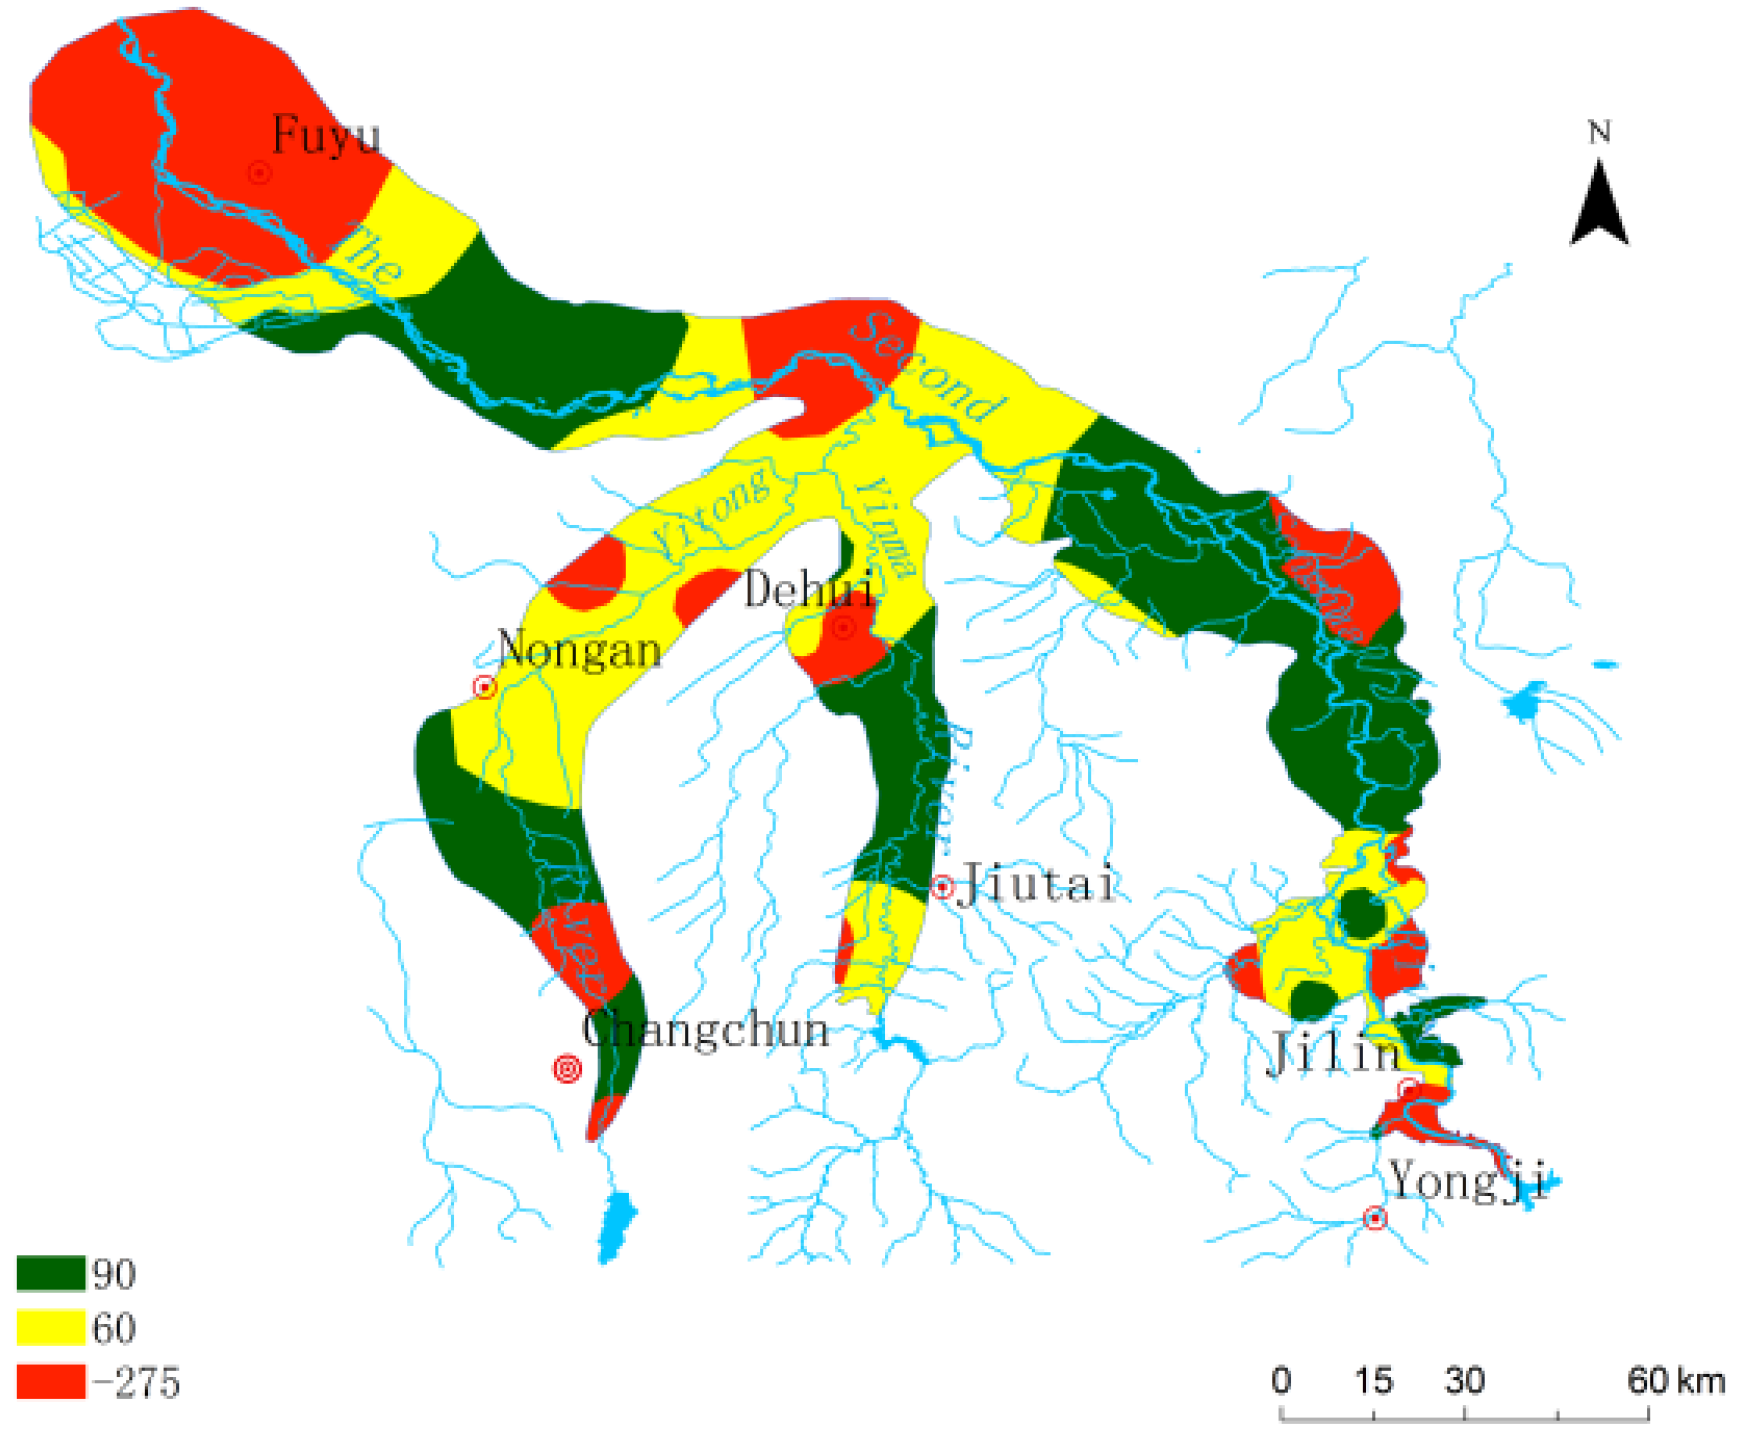
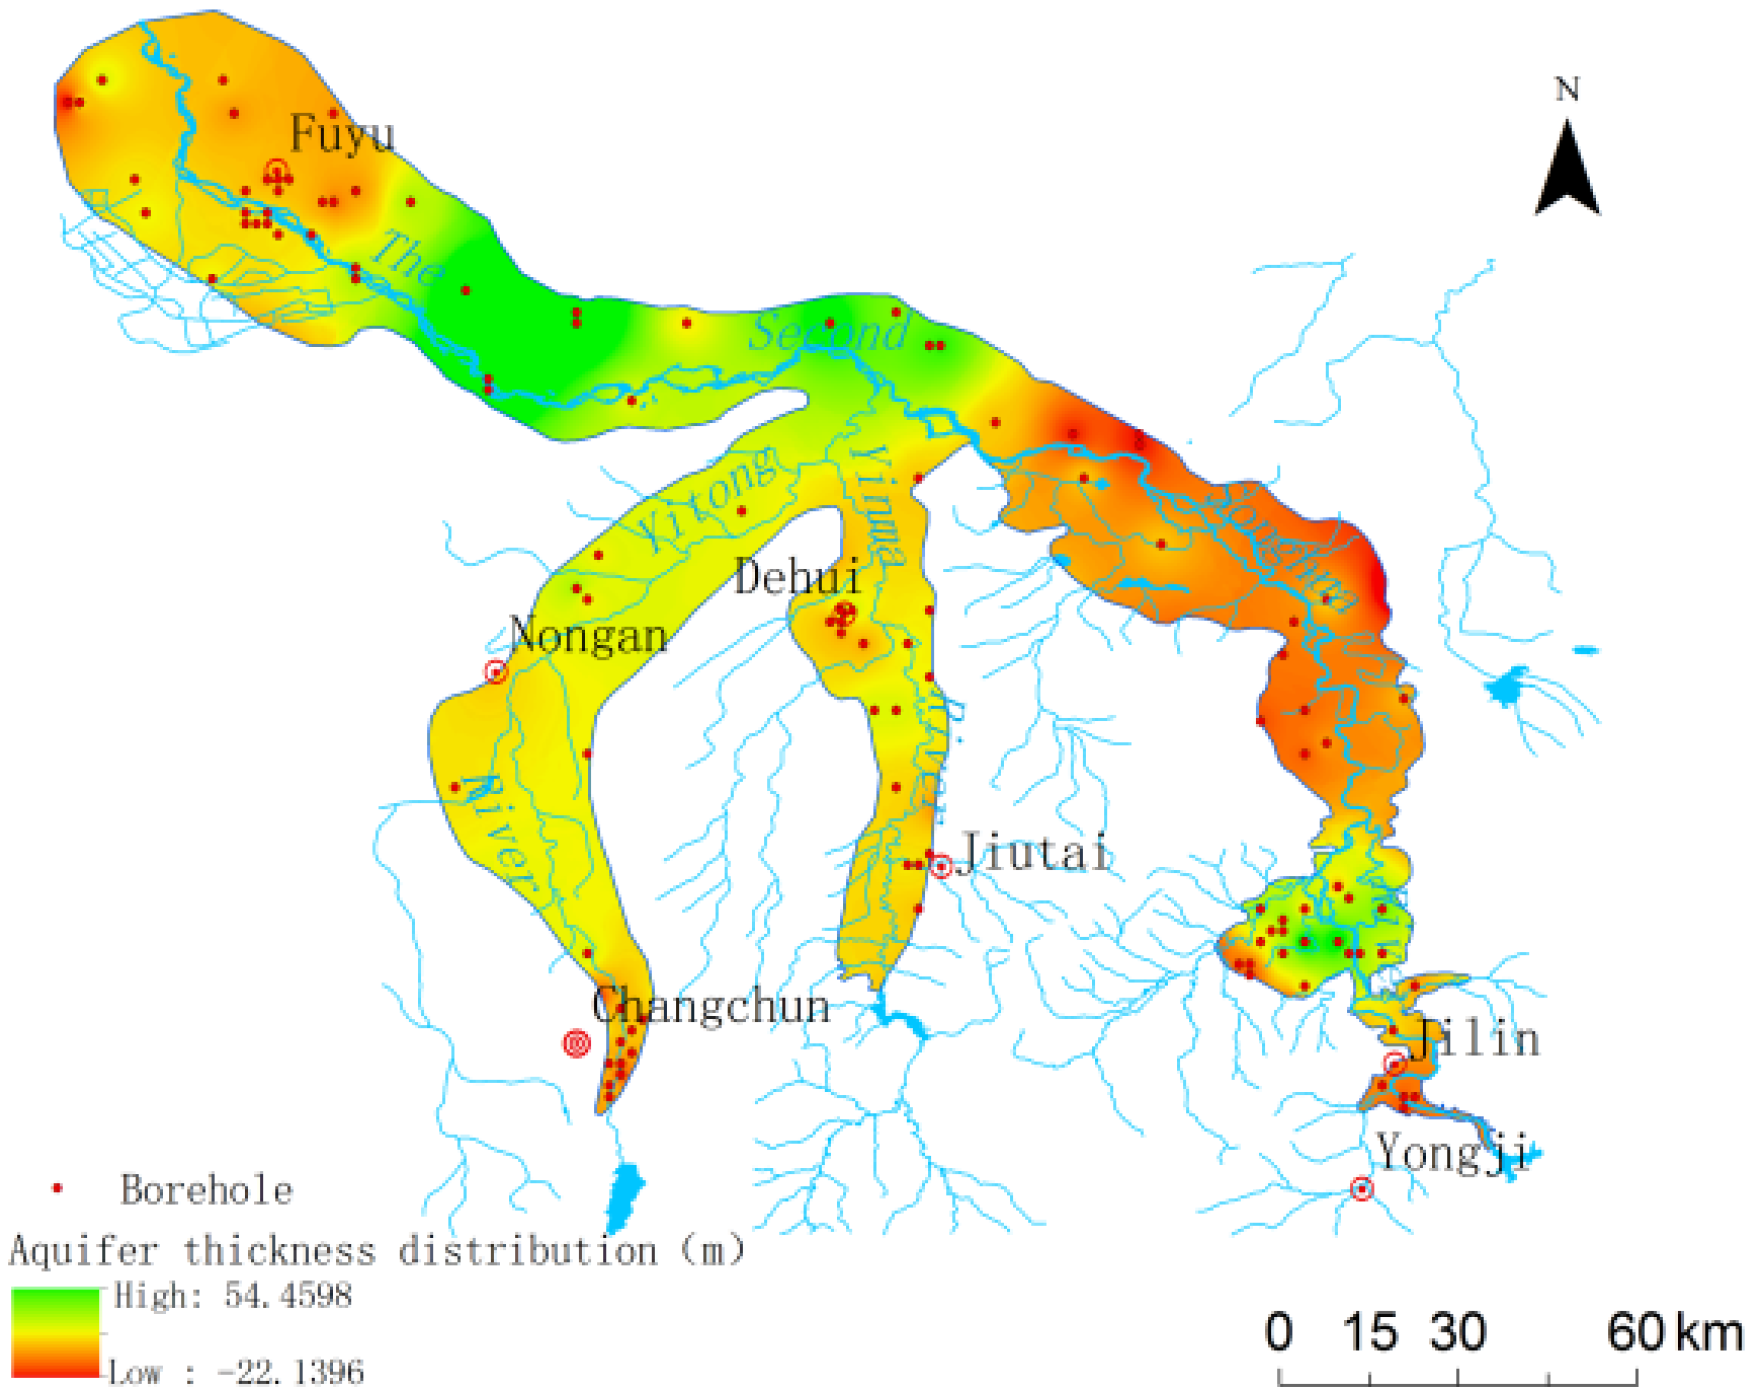
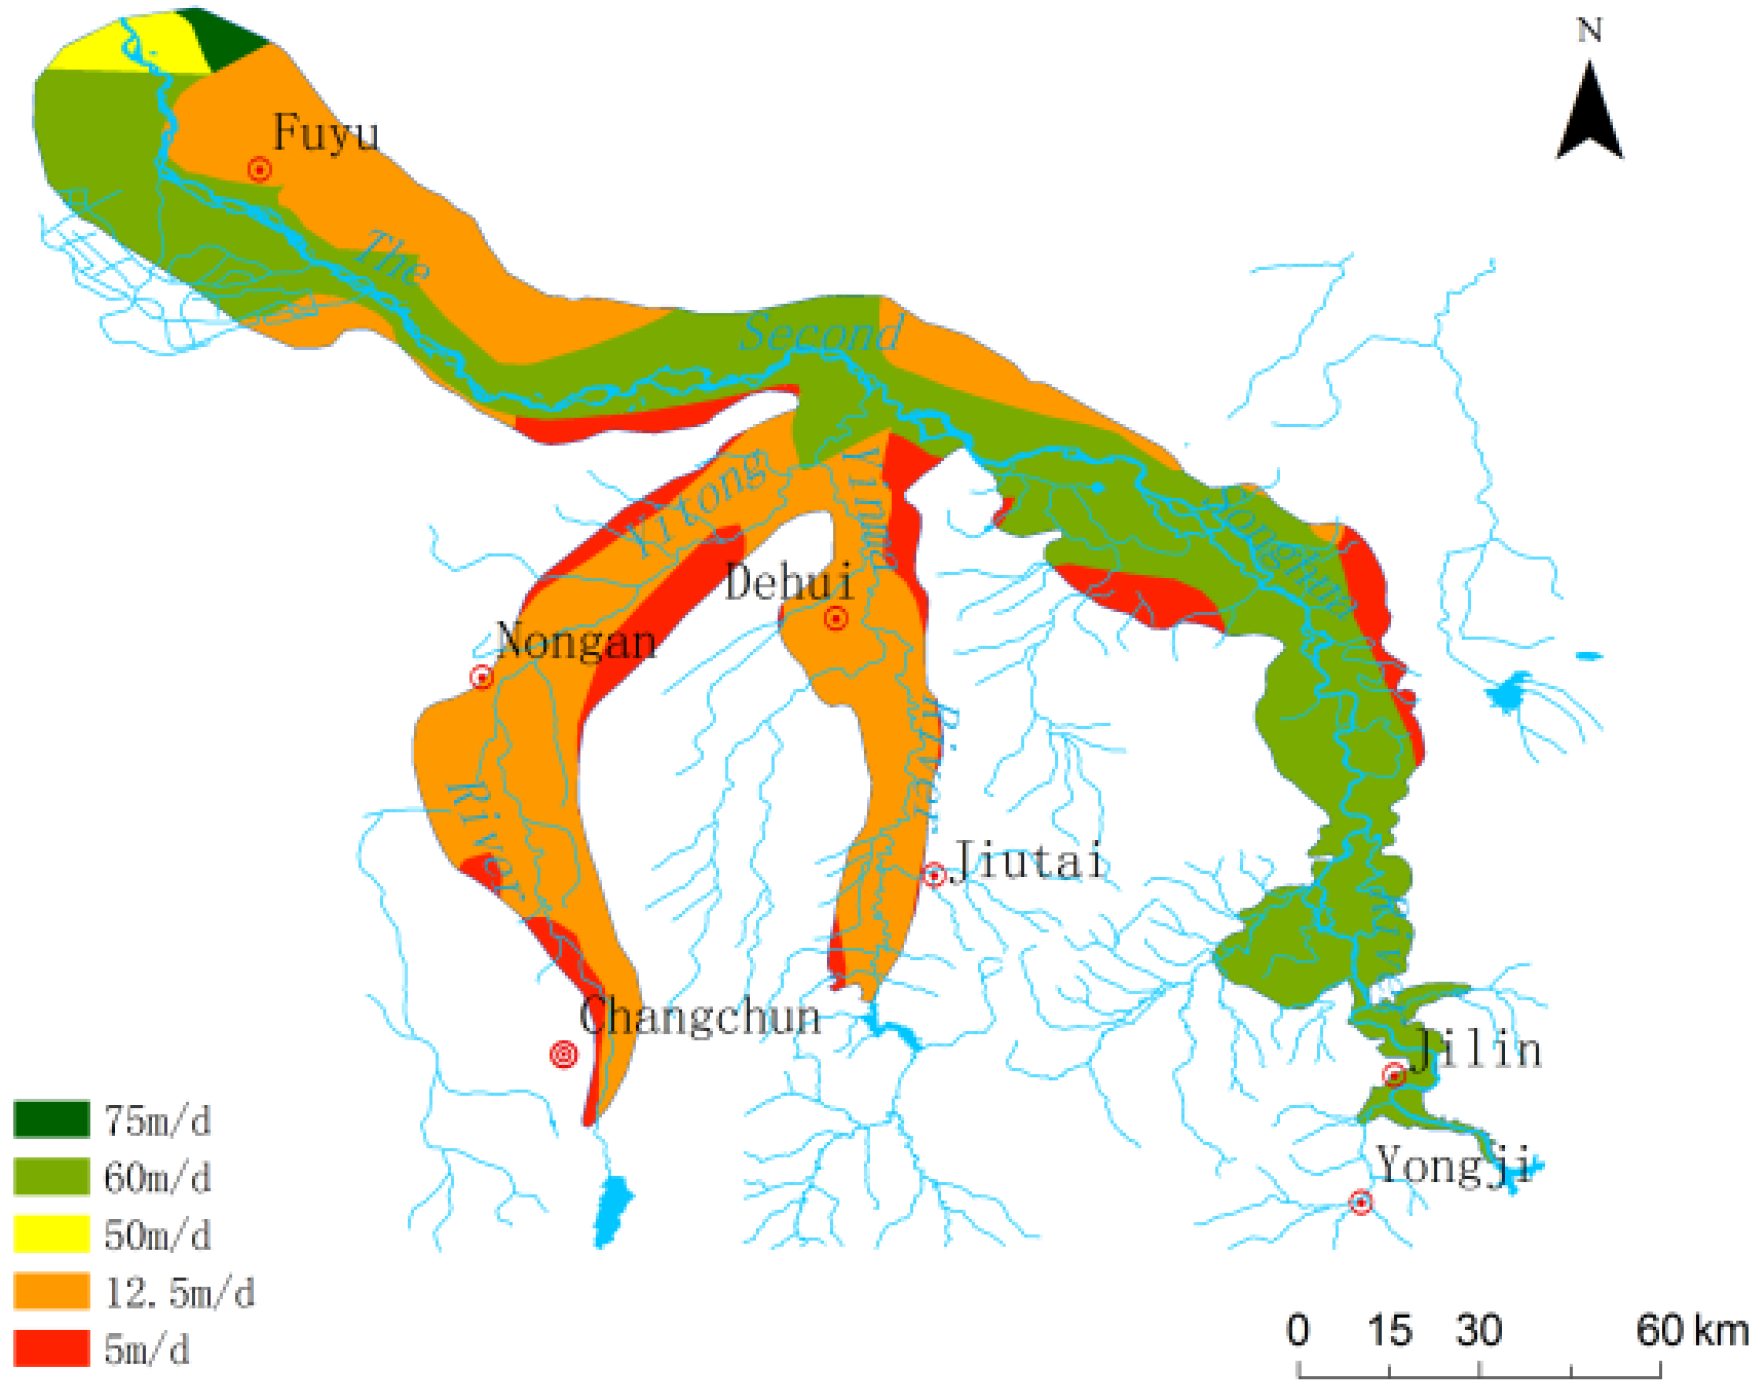
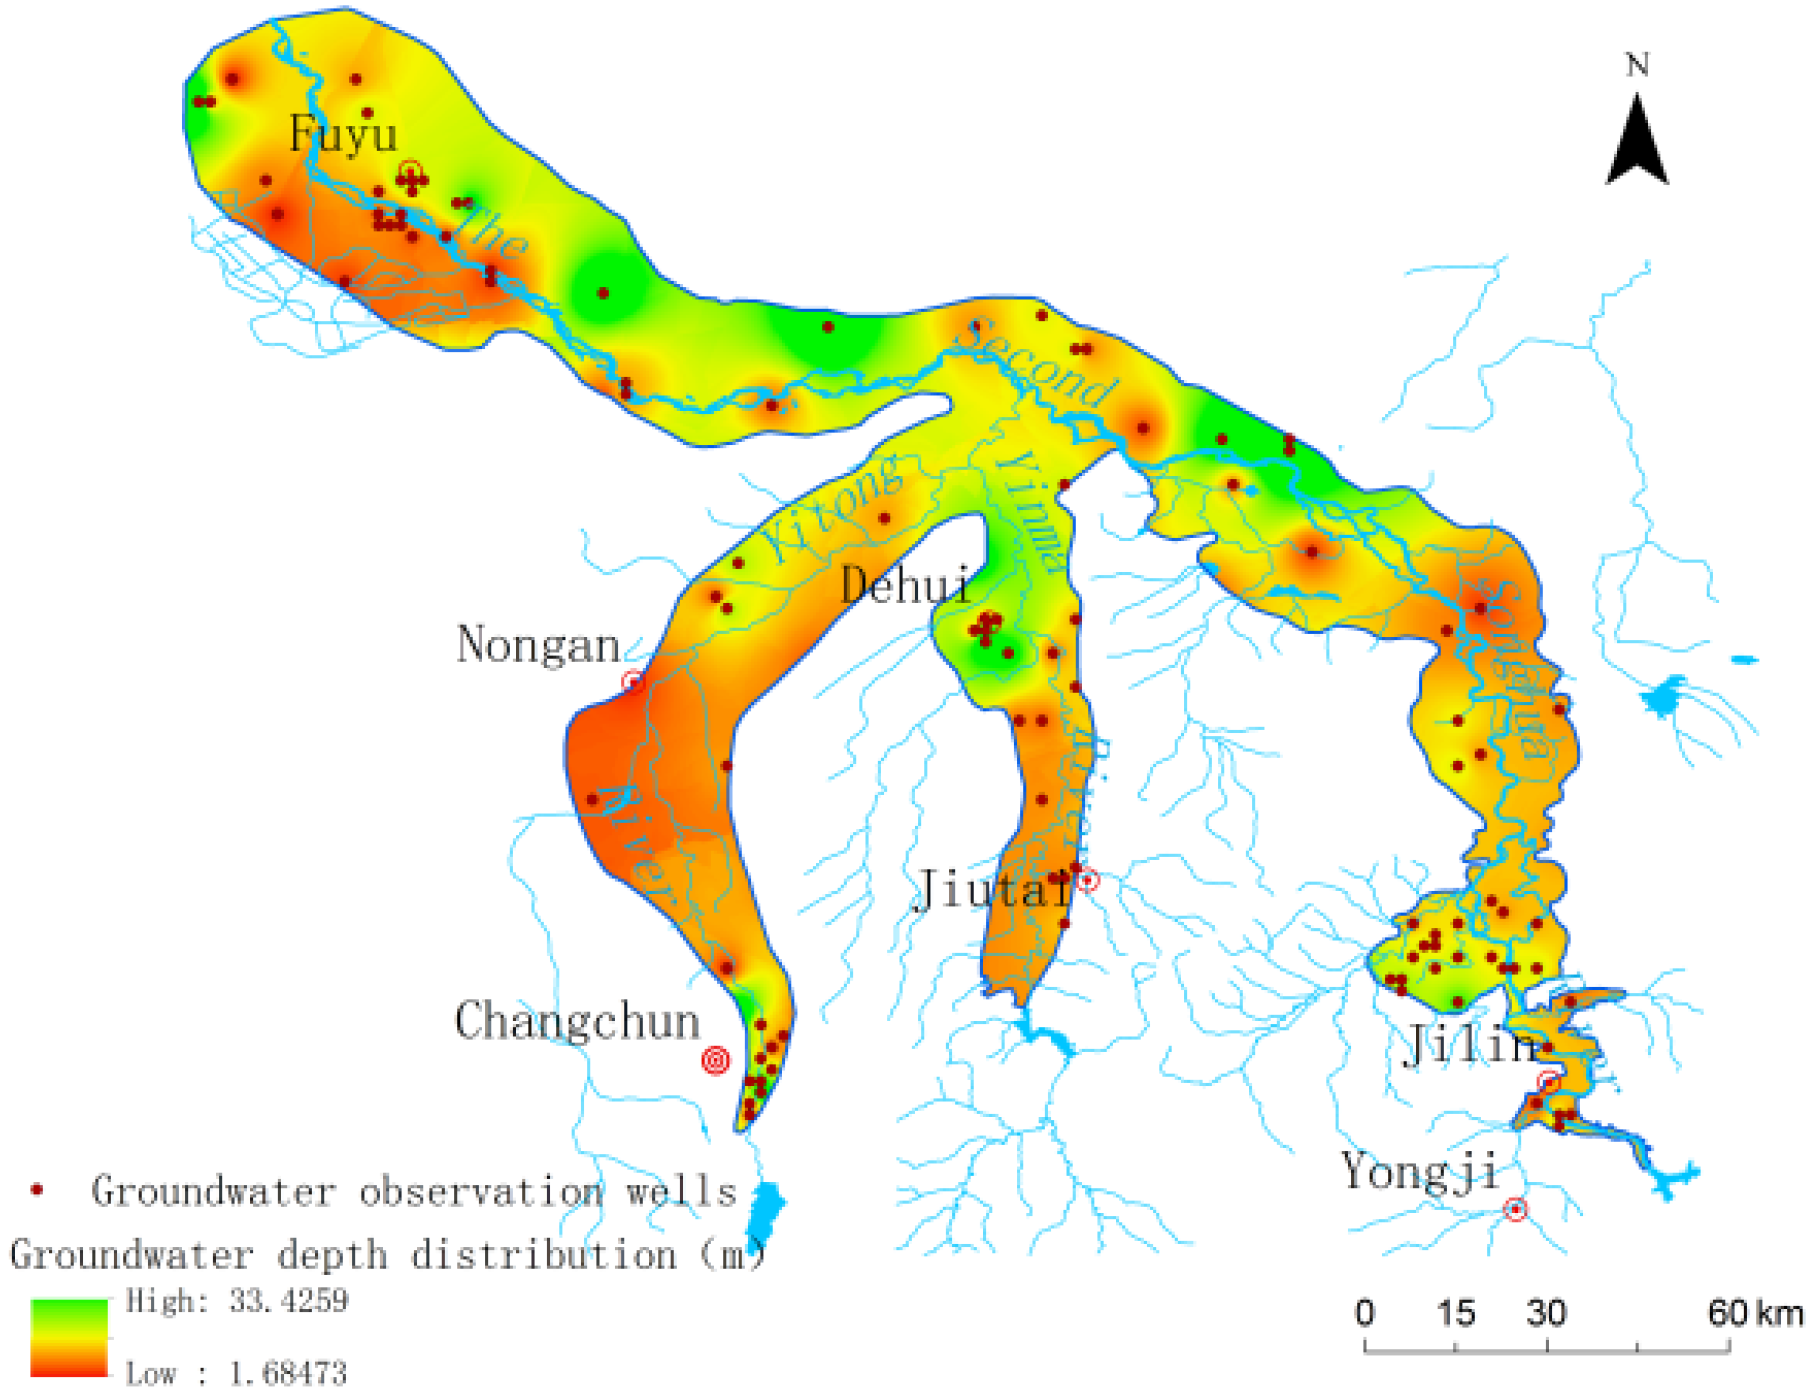
Figure 3). Quaternary sediment with good permeability is widely distributed in the Second Songhua River Basin with a thickness of 10–30 m. The type of groundwater is mainly pore groundwater in the sandy gravel layer and the groundwater table is shallow, generally 1–3 m below the ground surface. The single well groundwater production rate is generally 1000–3000 m
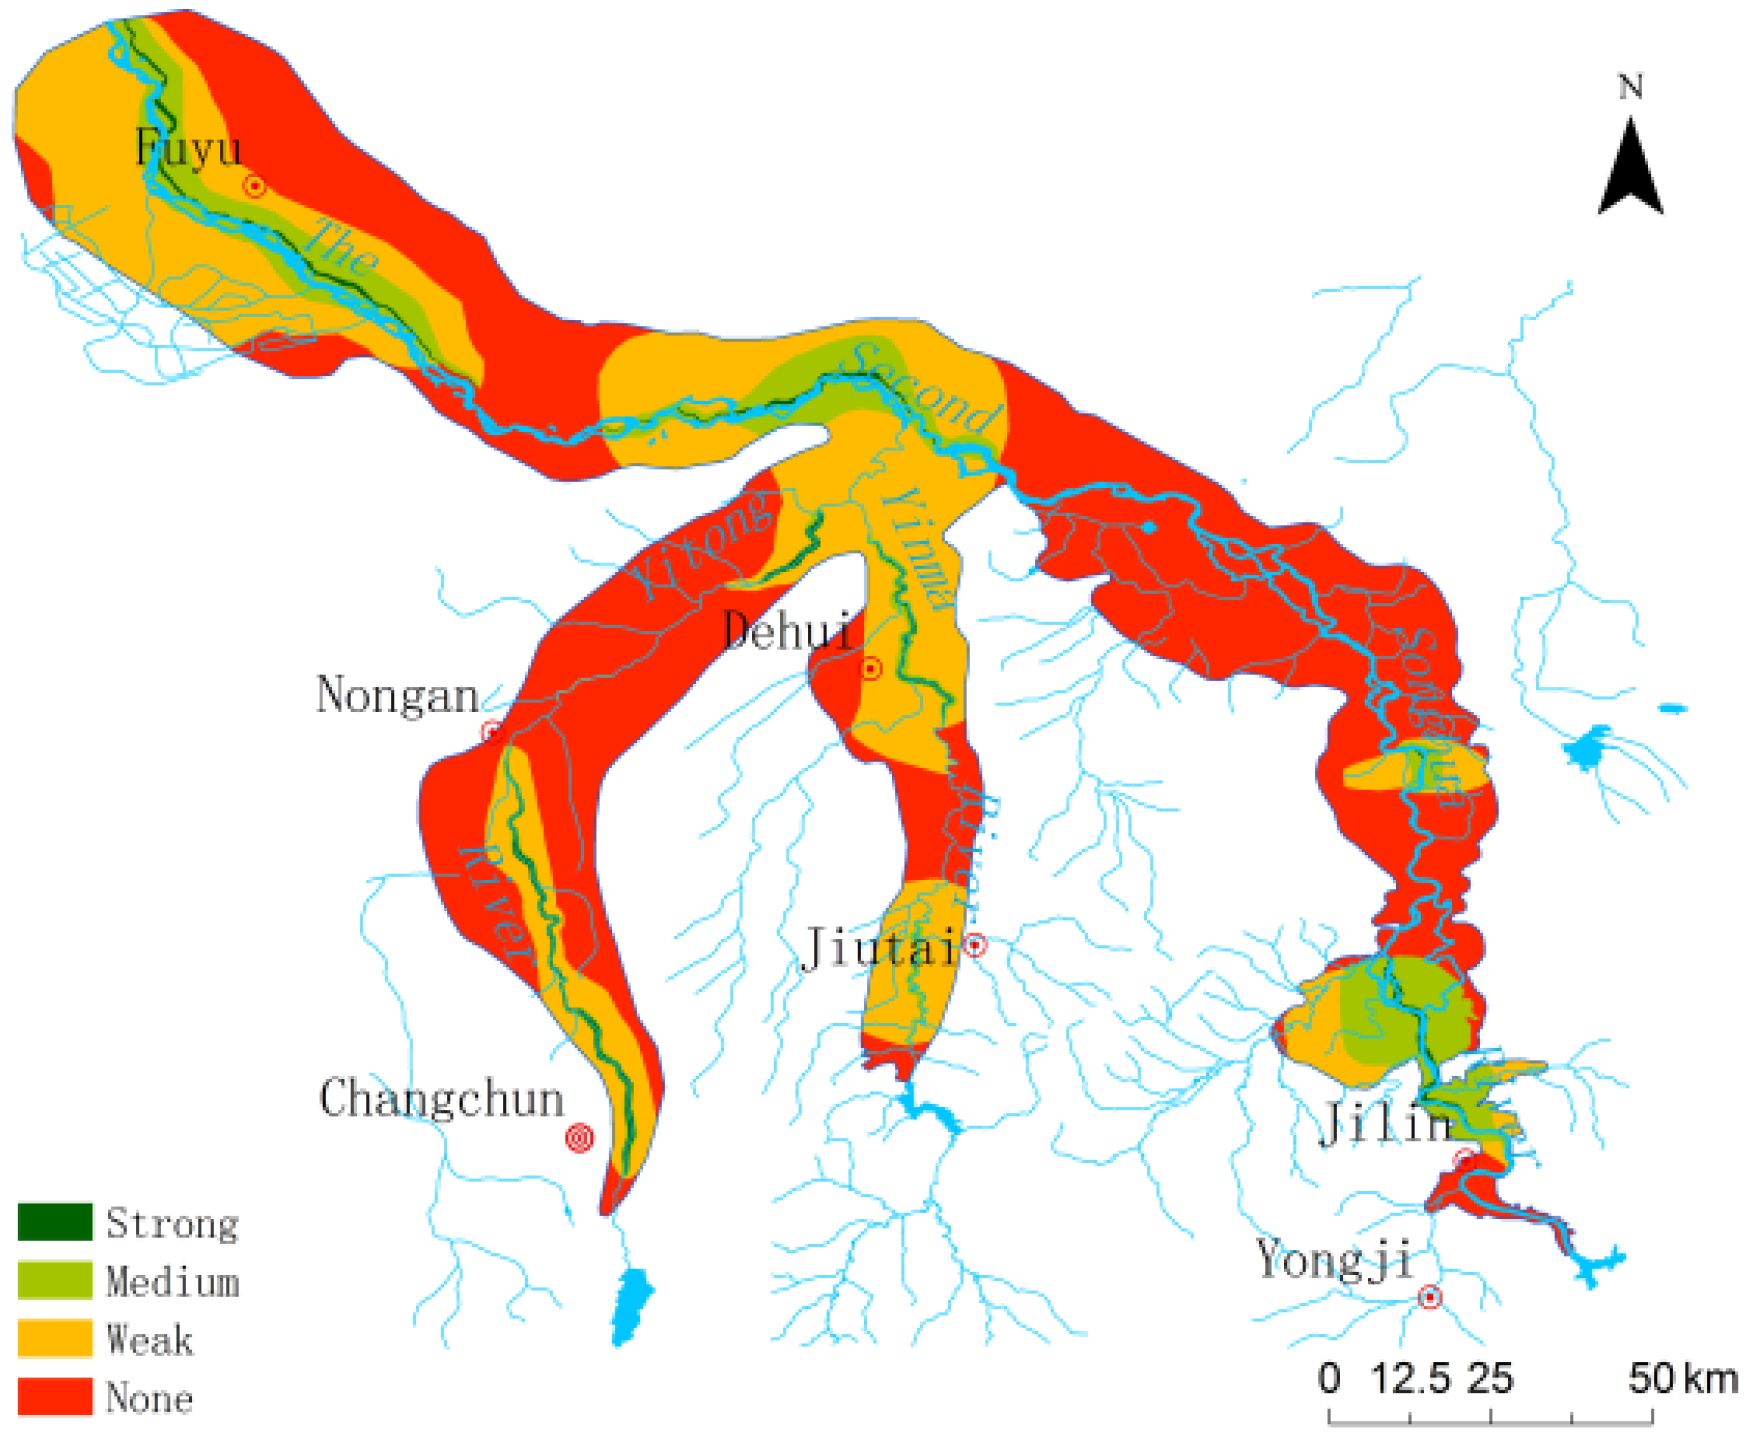
3/d. Surface water and groundwater are well connected, and groundwater recharges surface water in most areas along the river (Figure 4).
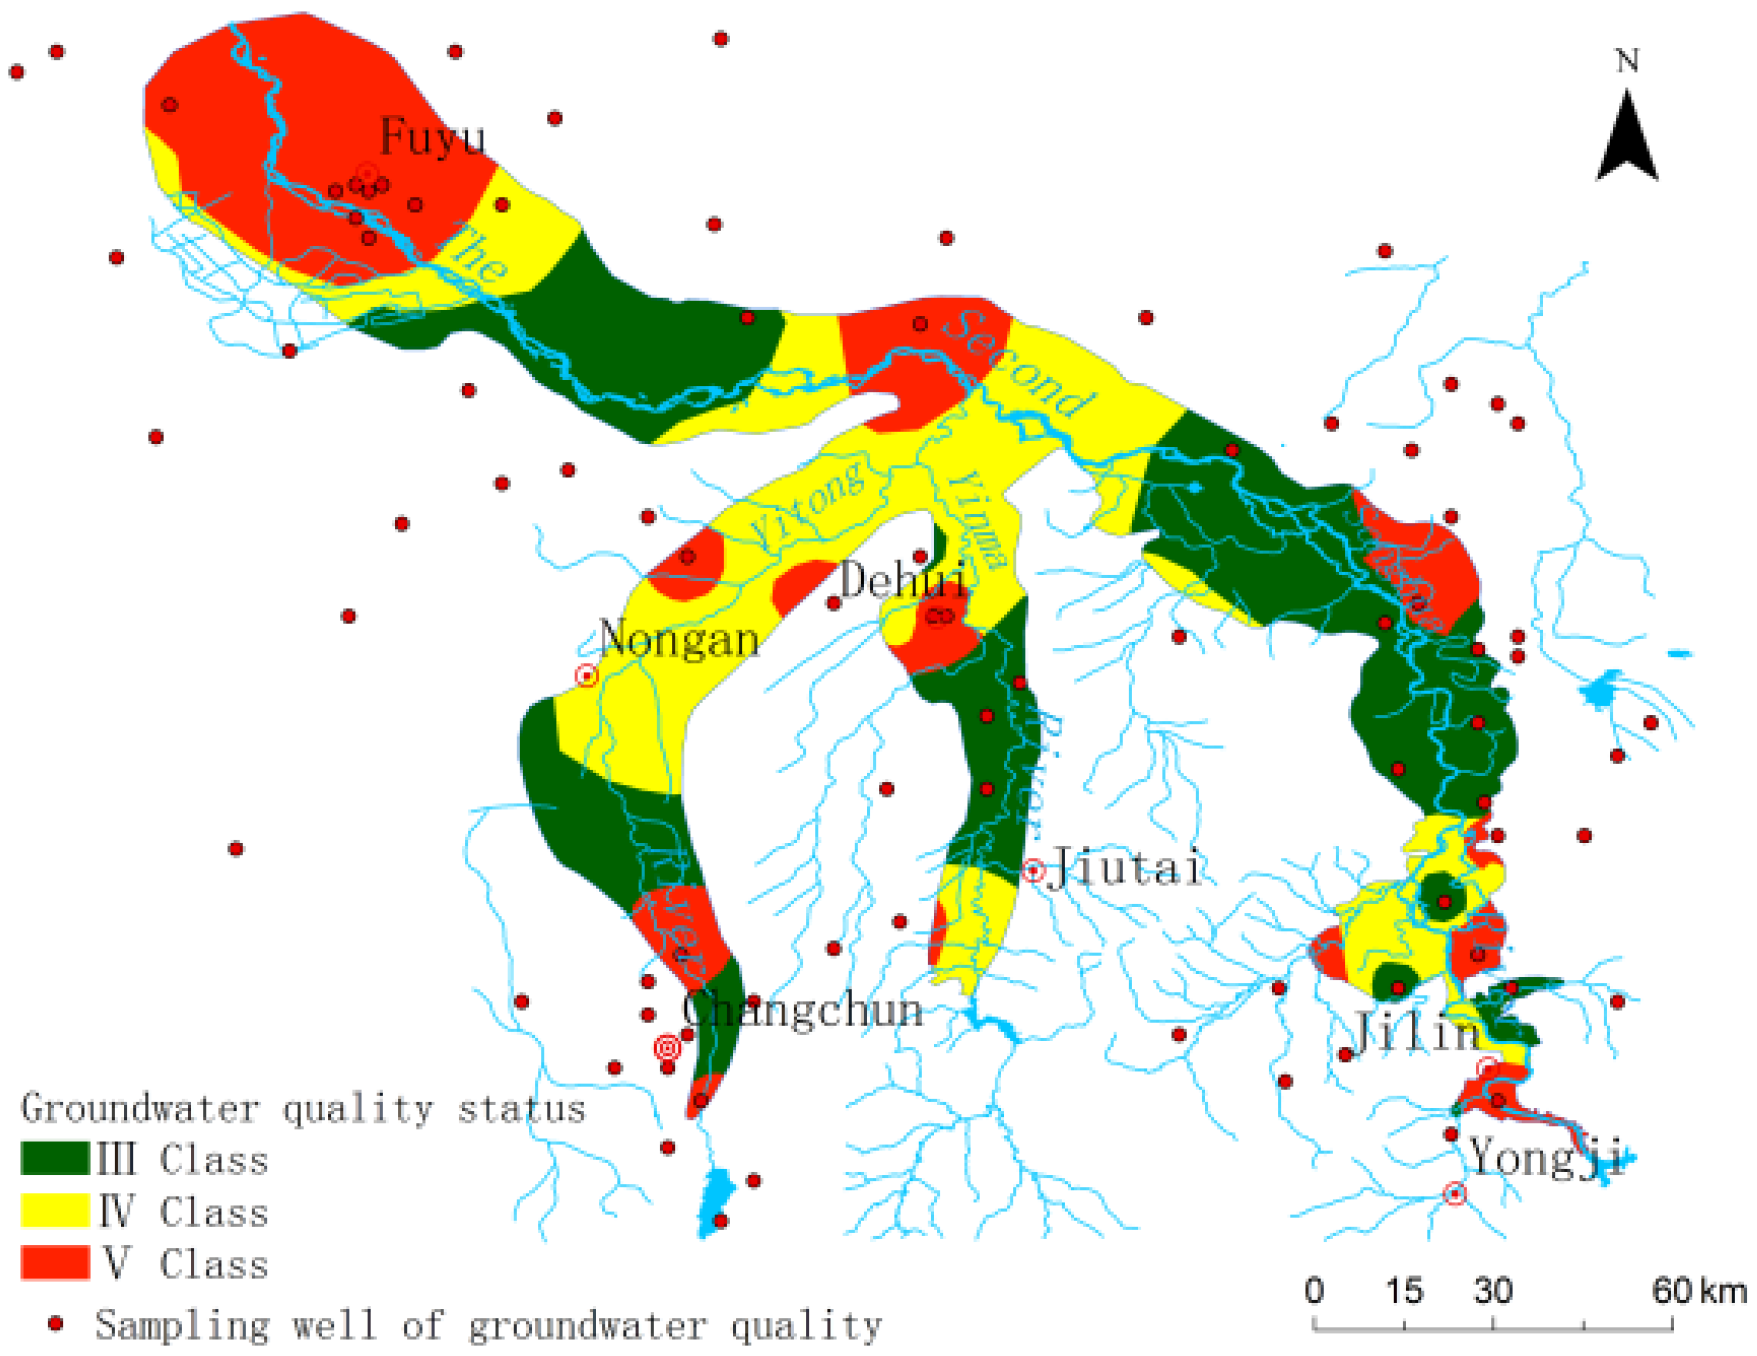
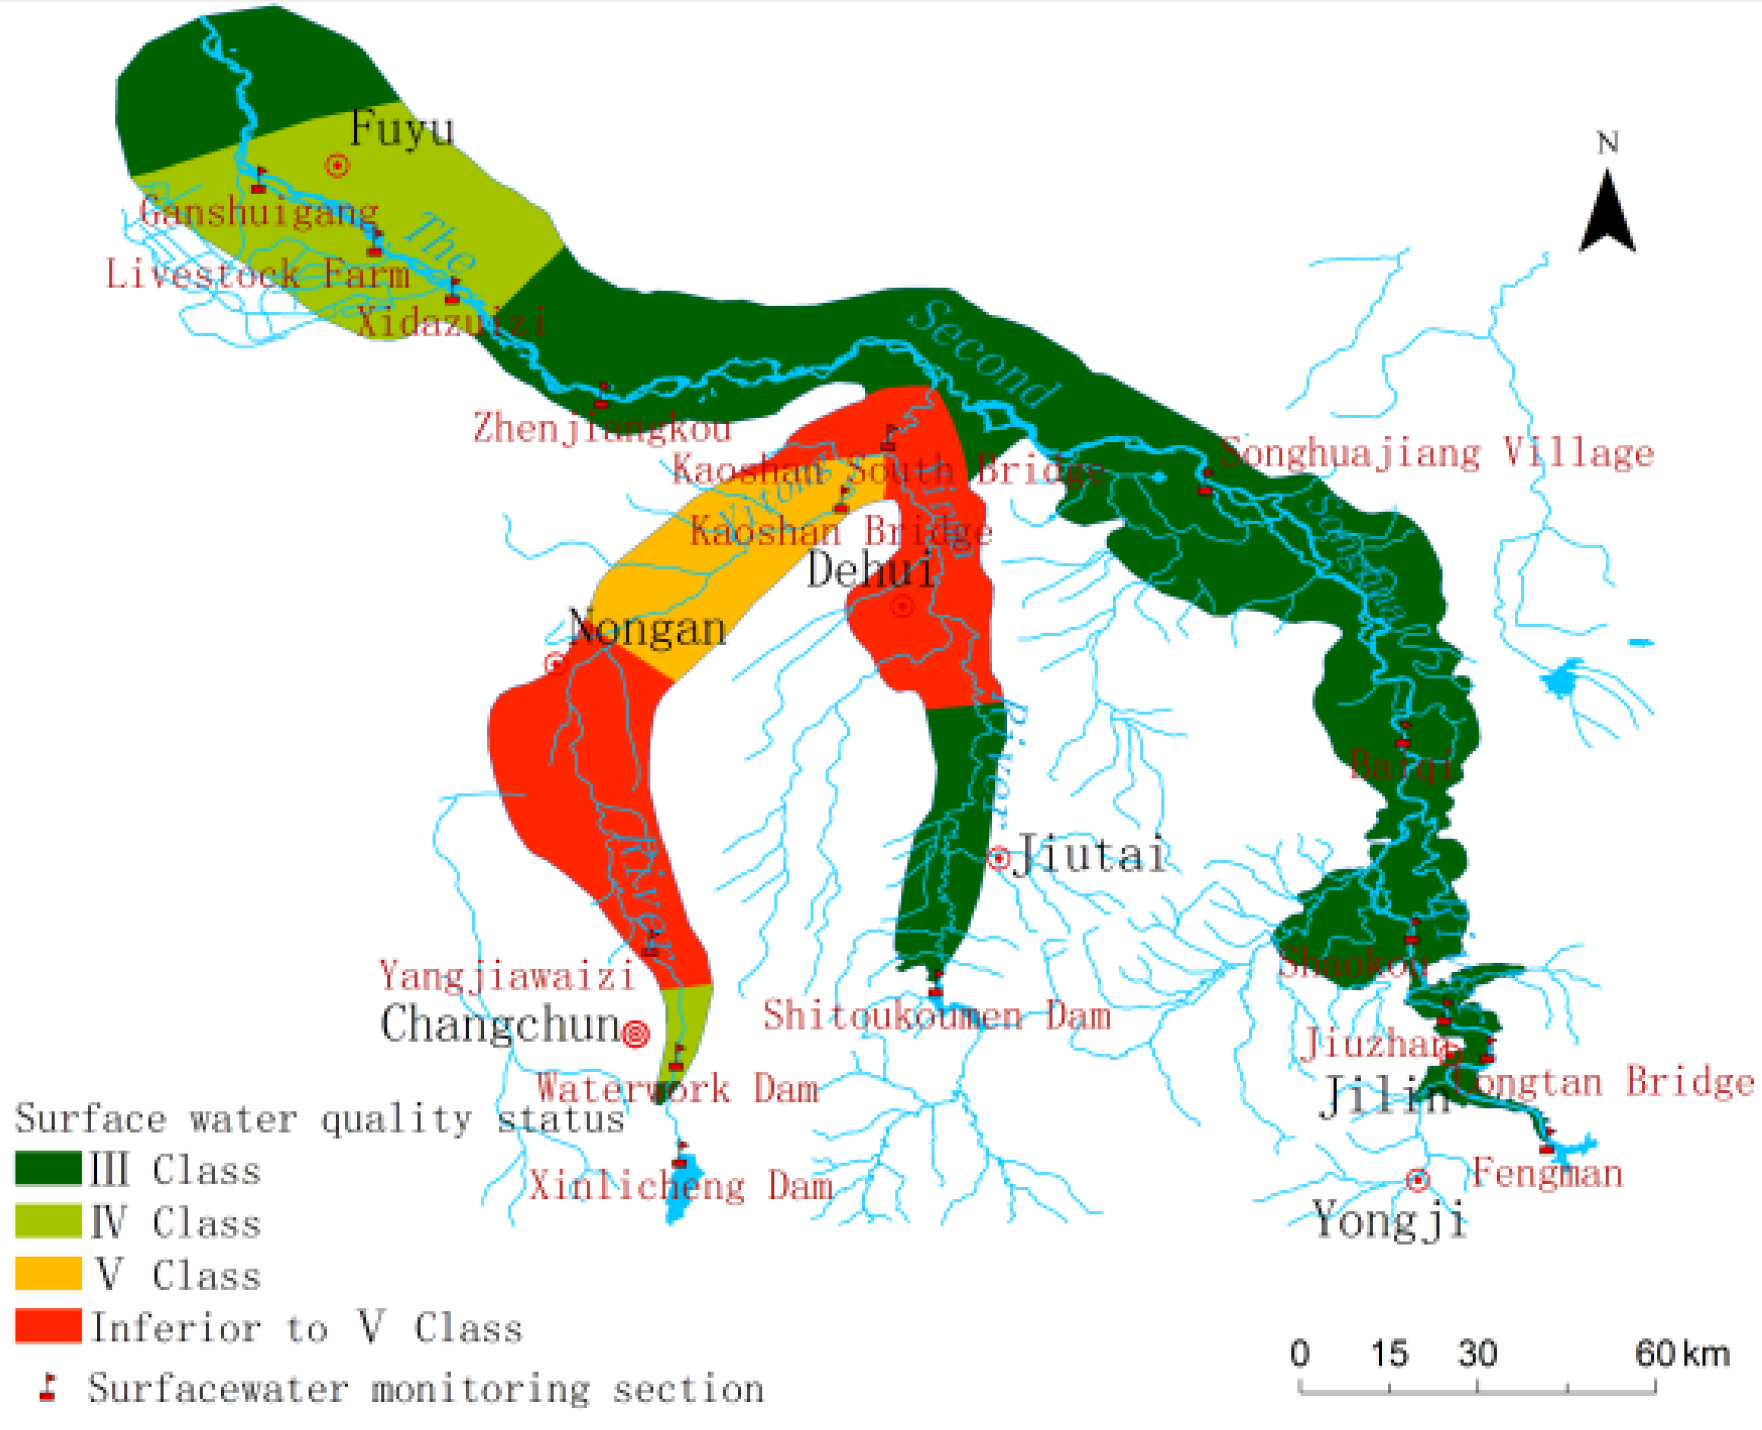
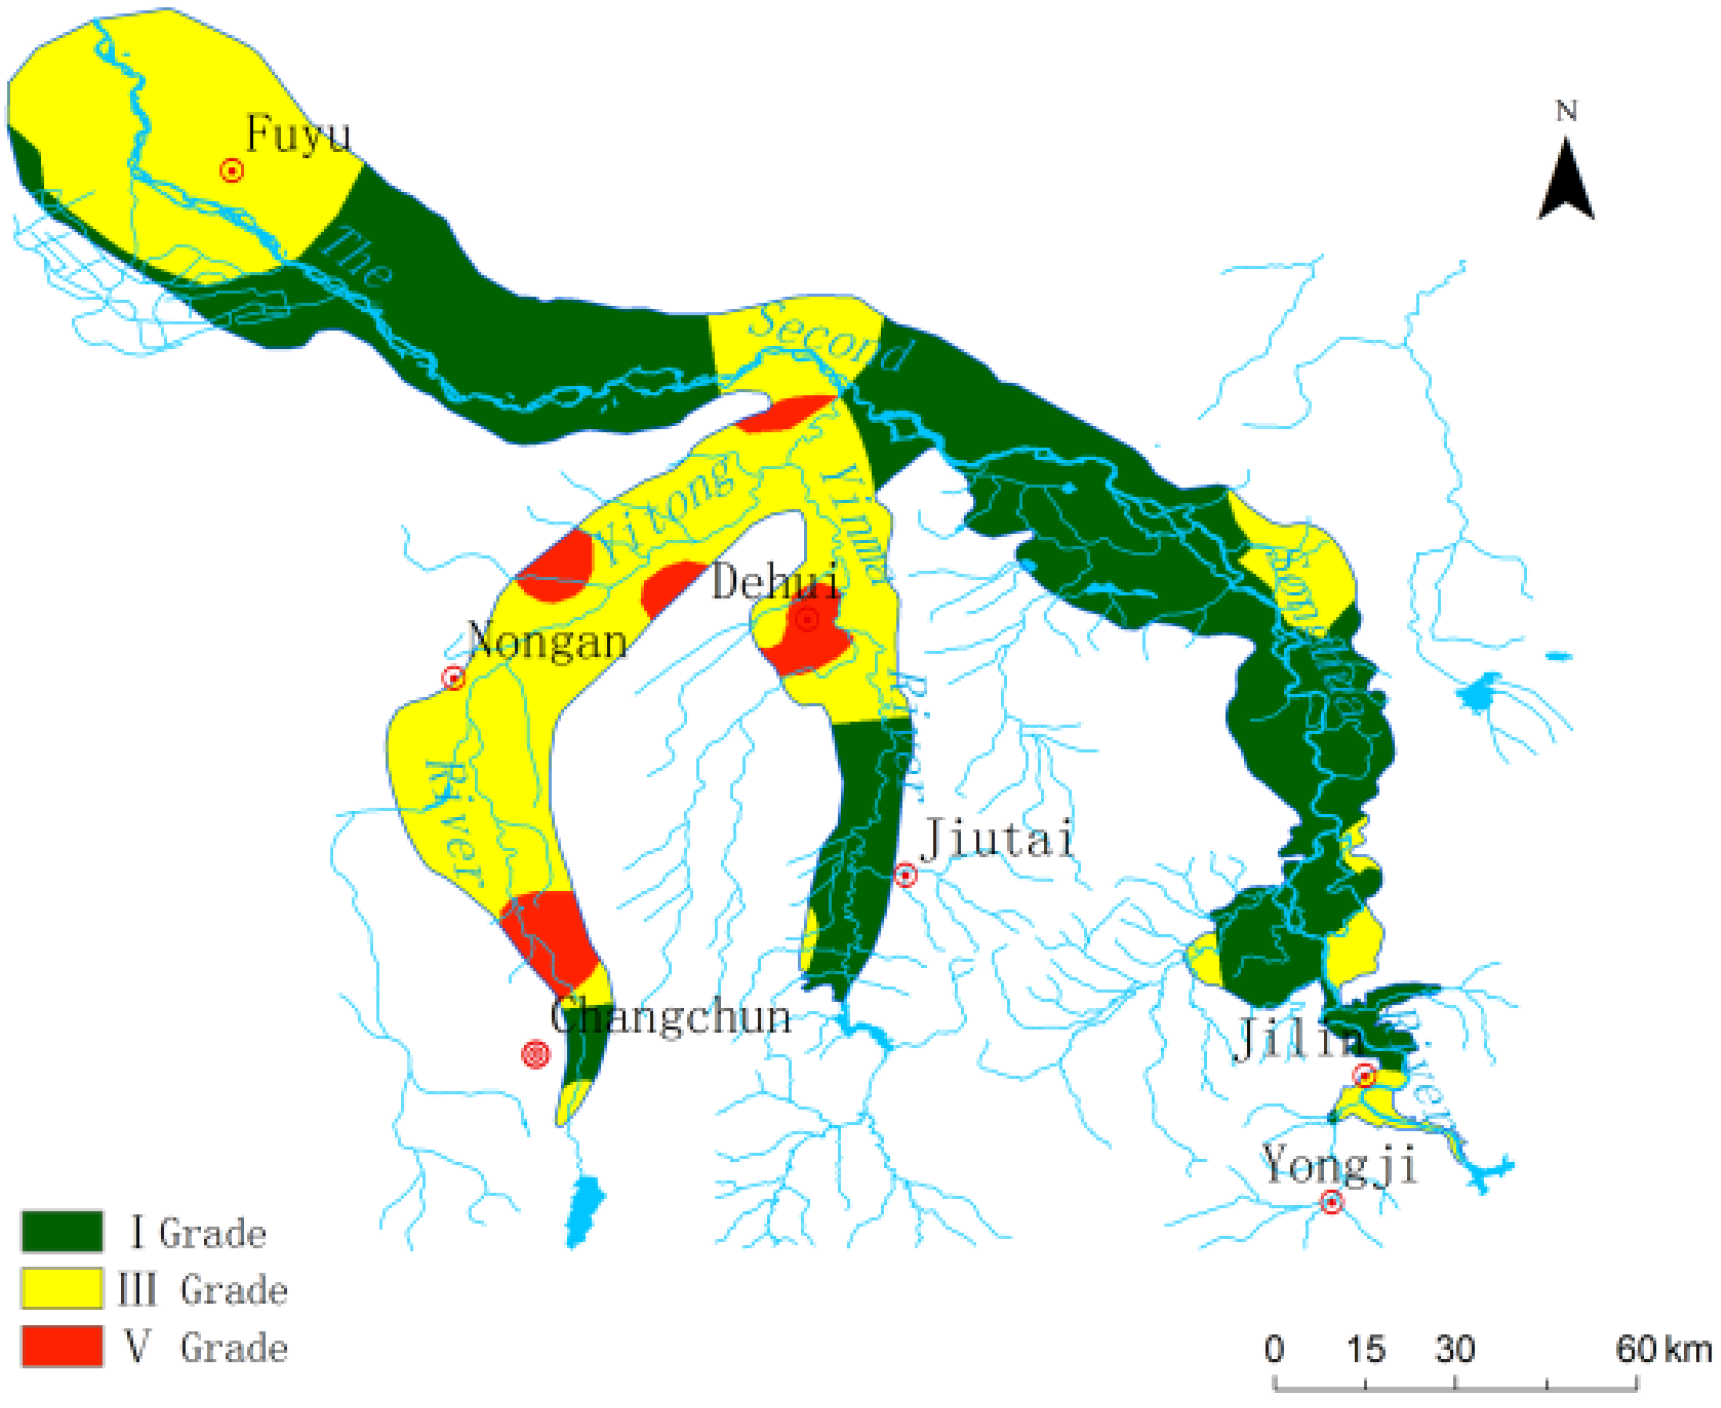
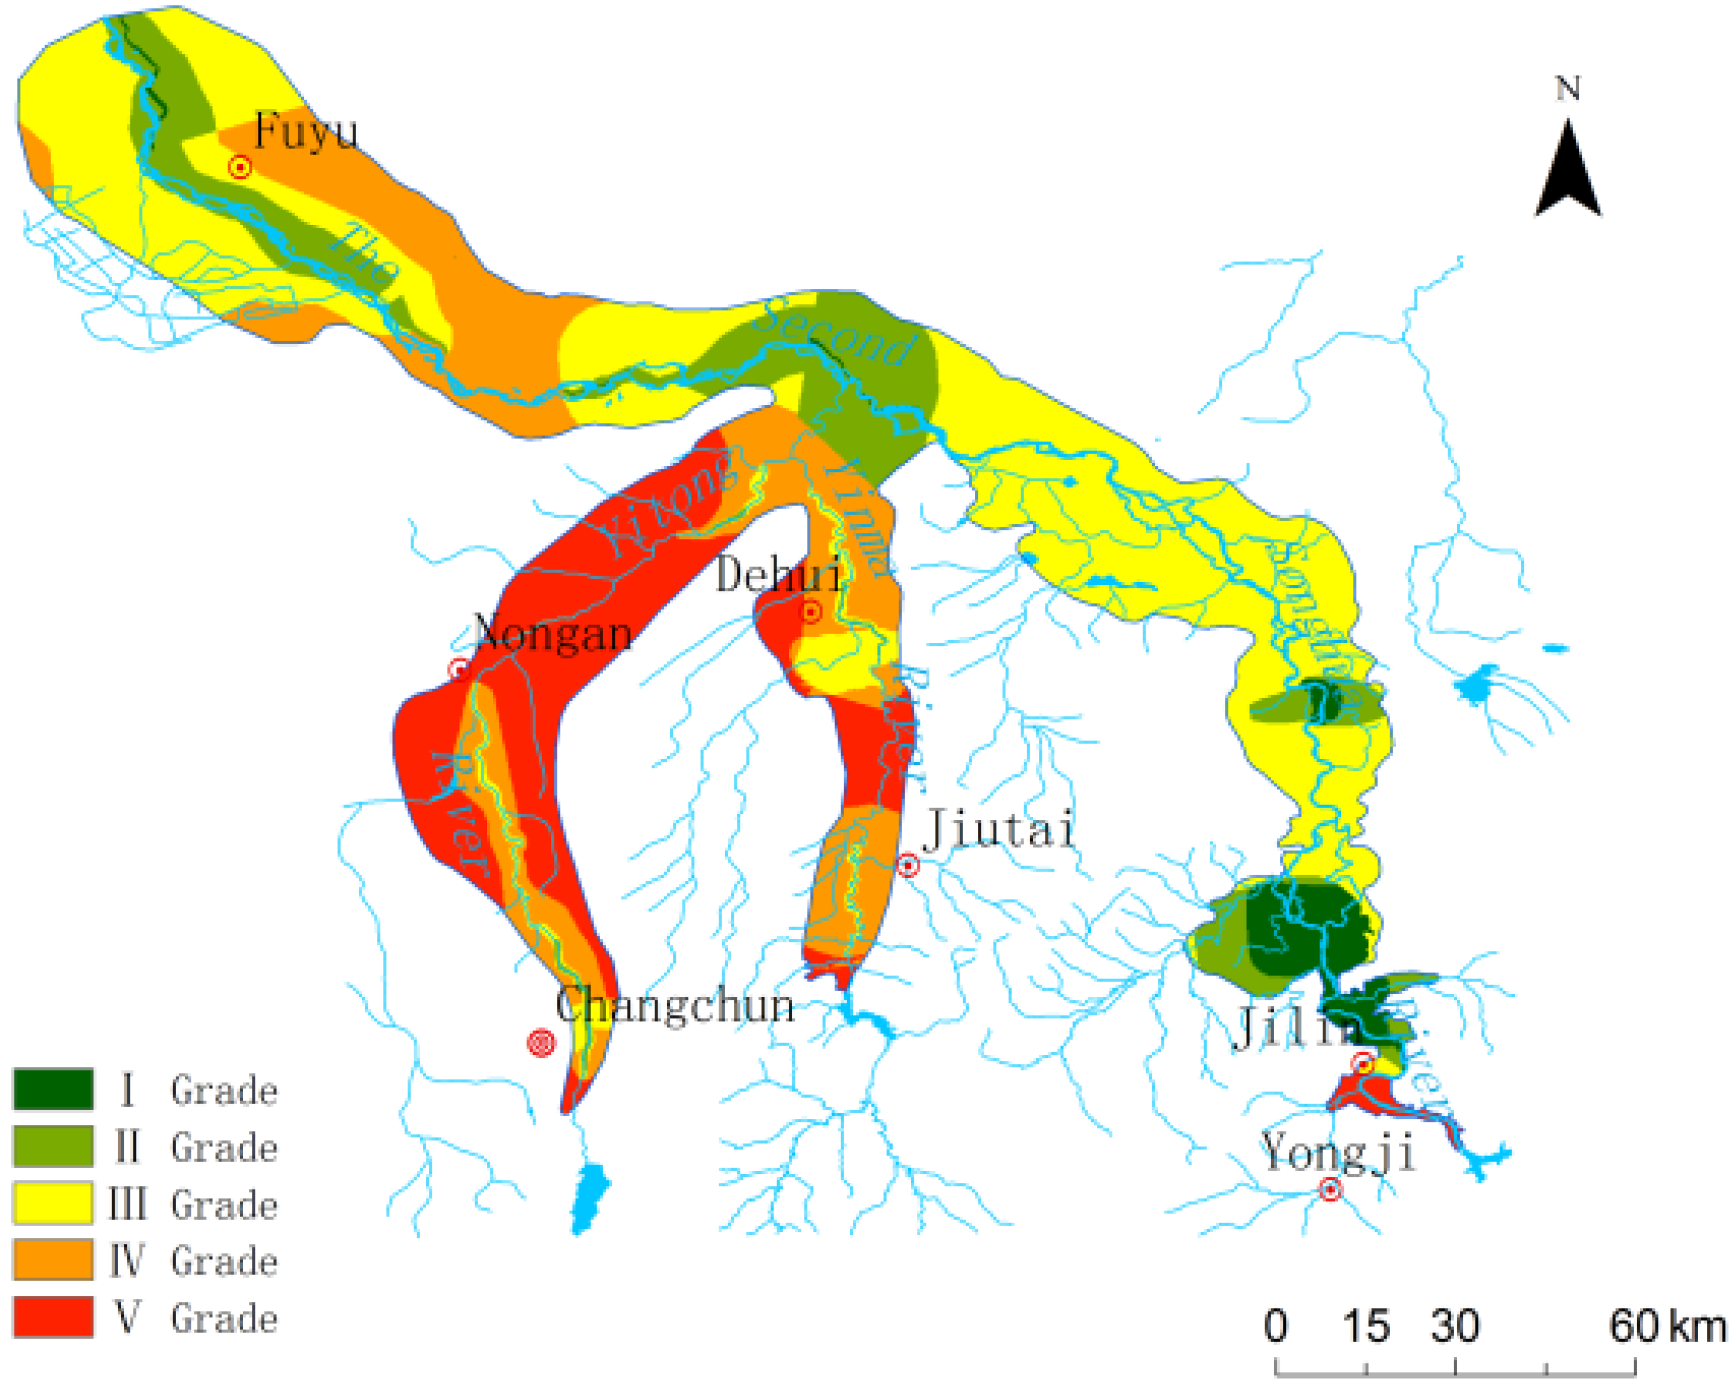
Municipal and industrial wastewater seriously affects the water quality of Second Songhua River. Annual emissions of wastewater in this basin are about 645 million tons, of which 44% arises in Jilin Province. As total nitrogen, total phosphorus, ammonia nitrogen exceed the standard, water quality deterioration in the Yinma River is very serious; the river length in which water quality is inferior to Grade V water quality accounts for 42.9% of the total length [20]. Changchun City is located in the middle reach of the Yitong River, and municipal and industrial sewage has had serious impacts on water quality of the river [21]. The Second Songhua River in Jilin Province has abundant water resources, but now cannot meet the needs of economic development, especially the water requirement of large cities [22].

3. Methodology

3.1. Division of the Core Study Area of RBF

In order to focus on the optimum area, the core study area of RBF was firstly separated considering the following two criteria:
  • Natural geographical conditions. The plain area along the river was mainly considered as it is the main place of production and human activity, which has a strong demand for water resources.
  • Hydraulic connection extent between river water and groundwater. The feasibility of RBF is getting worse and may even be impossible with increasing distance from river. In order to get more complete background information on potential RBF sites, a large study area was recommended. According to the runoff quantity, the study range of RBF was divided along the river (Table 1). Where there is a surface water divide in the study range, this natural feature is used as the boundary of the study area.
The scope of the study area of RBF and the feasible region of RBF was determined by overlay analysis of areas that satisfied the above two criteria, such that any areas that did not satisfy both criteria were excluded.

3.2. Suitability Evaluation Method of RBF

3.2.1. Evaluation Index System

The aim of this research is to find potential suitable areas for future water development plans and further detailed investigation of RBF systems. The specific goal of RBF is mainly to provide sufficient water resources with good water quality. A multi-criteria RBF evaluation index system was established based on water quantity, water quality, the development and utilization conditions of groundwater resources and the interaction intensity between surface water and groundwater. The index weight and detailed scoring criterion were all based on specialist marking methods, which is more effective for a specific site but may not be applicable to other areas (Table 2).
The main reasons for index weight are explained as follows. (1) The sum of evaluation index weight is equal to 1 by value assignment. The index weight of water quantity, water quality and interaction intensity between surface water and groundwater each accounts for 0.3 of total weight individually, and this allotment reflected the aim and decisive factors of RBF suitability evaluation along the Second Songhua River. The index weight of development and utilization conditions of groundwater resources only account for 0.1 of total weight, because the factor will influence groundwater development cost and help to confirm the priority, but it is not a decisive factor for RBF suitability evaluation. (2) For the index of water quantity, the groundwater index accounts for 0.20 and surface water index accounts for 0.1, because the water source of RBF waterworks comes from riverside groundwater and surface water via bank filtration. Hydraulic conductivity and aquifer thickness influence the infiltration rate and capacity of surface water to aquifer. (3) For water quality, the index weight of groundwater and surface water are equal to 0.15. The groundwater quality only indicates the current status and treatment effect of RBF. In order to avoid any possible groundwater contamination from surface water, the treatment effect of RBF should not be addressed too much and the surface water quality should not be neglected. (4) The interaction intensity between surface water and groundwater controls the water exchange efficiency. Only those places within the influence zone of surface water, the aquifer prone to receiving sufficient water quantity through RBF, the permeability of riverbed layer controls the real water exchange rate and the groundwater hydraulic gradient partly reflects the real condition of aquifer property. (4) The index weight of groundwater depth accounts for 0.1, because it will only influence the priority order of potential RBF areas.

3.2.2. Water Quantity

Hydraulic Conductivity (K)

Aquifer hydraulic conductivity (K) reflects lithology and permeability of an aquifer. The scoring criterion of hydraulic conductivity is shown in Table 3.

Aquifer Thickness (M)

A suitable RBF site requires a certain scale of aquifer for adequate water production. The aquifer thickness scoring criterion is shown in Table 4.

Runoff in Cross-Section (Q)

The magnitude of runoff in a given cross-section of the landscape directly reflects the richness of the surface water quantity. The larger the annual average runoff, the greater the recharge potential of surface water to groundwater, and the greater the potential suitability of the area for RBF. The runoff in the cross-section scoring criterion is shown in Table 5.

3.2.3. Water Quality

Water quality status directly reflects whether surface water or groundwater is suitable for drinking, and indicates the degree of difficulty and cost of water treatment that will produce drinking water. In order to guarantee the water quality of potential waterworks, the water quality improvement effect of RBF was thought of as an additional assurance. According to China's Environmental quality standards for surface water (GB3838-2002) [23] and Quality standard for groundwater (GB/T 14848-93) [24] (see Appendix A), water of quality grades I, II and III can be used as drinking water directly. Water of quality grade IV must be treated before it is supplied for drinking. Because higher index values of the quality grade indicate lower quality water, the assigned index values decrease as water quality grades change from I to IV. Water of quality grade V is a negative factor for the suitability of RBF, and its index value is assigned a negative number. This can make the negative water quality factor play a decisive role in the process of suitability evaluation of RBF. The groundwater quality (G) and surface water quality (S) suitability scoring criterion is shown in Table 6.

3.2.4. Interaction Intensity between Surface Water and Groundwater

A large proportion of RBF waterworks primarily capture surface water; the interaction intensity between surface water and groundwater plays an essential role.

Hydraulic Gradient (I) under the Current Condition 

The hydraulic gradient directly reflects recharge-discharge relationship between surface water and groundwater, and it also indicates recharge-discharge conditions of the interaction zone. A positive hydraulic gradient was defined to represent scenarios in which river water recharges groundwater; similarly, a negative hydraulic gradient indicates that river water is recharged by groundwater. A positive value of hydraulic gradient is beneficial to RBF in most situations; however, a very large value for the hydraulic gradient might mean that riverside groundwater is being exploited intensively or that the interaction between surface water and groundwater is poor, because the very low permeability of aquifer or riverbed will obviously enlarge hydraulic gradient and decrease water exchange intensity. A negative hydraulic gradient indicates that the surface water cannot be induced into the ambient aquifer at present. Nevertheless, a negative gradient might be reversed and to be beneficial for RBF under groundwater exploitation condition. If the present negative hydraulic gradient is excessively small, it may indicate that the permeability of aquifer or riverbed is very poor, and the large groundwater recharge potential from river water should not be expected under any exploitation conditions. The hydraulic gradient suitability scoring criterion is shown in Table 7.

Possible Influence Zone Width of Surface Water under the Condition of Groundwater Exploitation (L)

The possible influence zone width by surface water indicates the range of the hydraulic connection between surface water and groundwater. The greater the hydraulic connection range between surface water and groundwater, the superior the RBF site. The possible influence zone width (L) was assumed to be equal to the ratio of the aquifer thickness (M) to the hydraulic gradient (I) in a specified cross section. The suitability scoring criterion for the possible influence zone width by surface water is shown in Table 8.

Permeability of Riverbed Layer (R)

Riverbed permeability indicates the exchange capacity between surface water and groundwater. Riverbed permeability is calculated using the hydrogeological cross section of the riverbed obtained from a field investigation as standard. Then, the lithology under the riverbed is analyzed to obtain its permeability, either by measurement or practical experience. The riverbed permeability suitability scoring criterion is shown in Table 9.

The Exploitation Condition of the Groundwater Resource 

When considering the development and utilization of groundwater resources, groundwater depth is a primary concern because it indicates the cost of building RBF wells. If the groundwater depth is too far below the ground surface, it may be in a highlands area or in a cone of a groundwater depression. In those places, the extraction of groundwater requires more energy. The groundwater depth scoring criterion is shown in Table 10. Because groundwater depth is strongly influenced by regional characteristics, this standard should be adapted to different hydrogeology conditions.

3.2.5. Suitability Index

According to the evaluation index system created above, the complex suitability index for a potential RBF site can be calculated by weighted summation using Equation (1).
A   =   X K   ×   W K   +   X M ×   W M   +   X Q W Q + X G   ×   W G + X S × W S + X I ×   W I   +   X L × W L +   X R   ×   W R   +   X D   × W D
In Equation (1), A is the suitability index of a potential RBF site, X is the score of individual indices as defined in Table 3, Table 4, Table 5, Table 6, Table 7, Table 8, Table 9 and Table 10, and W is the weight of each corresponding index as defined in Table 2. The RBF suitability was then classified into five grades according to the suitability index value (Table 11).
In areas for which RBF suitability grades are between I and III, water quality satisfies human drinking water requirements and does not need treatment, and water quantity is adequate. Furthermore, the exchange between river water and groundwater is intensive, the water quantity and water quality of RBF is guaranteed, and there are good development and utilization conditions of groundwater resources. In short, areas in grades I–III are suitable for RBF. In areas for which the RBF suitability grade is IV, either water quality does not satisfy drinking water requirements directly or the water recharge is insufficient. After water treatment and limited exploration, such areas may be suitable for limited-scale RBF waterworks. Areas in grade V are unsuitable for RBF works because of unacceptable water quality, high water treatment costs or insufficient water recharge to sustain extraction at the required rate and volume.

3.3. Spatial Analysis Based on GIS

GIS (Geographic Information System) has many powerful functions such as data editing, data management, data conversion, projection transformation, geographic analysis, metadata management, spatial analysis, and overlay analysis [25]. Applying GIS to a regional suitability evaluation of potential RBF sites can improve the accuracy and efficiency of evaluation. Spatial analysis based on GIS was adopted to facilitate the evaluation of the various indicators.

4. Results and Discussion

4.1. The Core Study Area of RBF

According to the terrain classification standard, the altitude range of 0 m–200 m belongs to the plain area. The boundary of the right bank of the Second Songhua River is mainly determined by the surface water divide. The annual average runoff of the Yinma River is 9.44 × 10⁸ m3 (Dehui Hydrological Station) and it belongs to river grade V. The annual average runoff of the Yitong River is 3.7 × 10⁸ m3 (Nong’an Hydrological Station) and this river also belongs to river grade V. So, the part of Dehui City that is on the left bank of the Yinma River and Nong’an County on the left bank of the Yitong River should take a hydraulic connection between river water and groundwater as standard. Thus, using the Yitong River and Yinma River as the center, an area extending 10 km from both sides of the rivers was defined as the core study area near the rivers (Figure 5).

4.2. Suitability Evaluation for RBF Works

4.2.1. Water Quantity Suitability

The aquifer lithology of the Second Songhua River plain mainly is gravel and coarse sand, and the aquifer hydraulic conductivity is approximately 60 m/day. The aquifer lithology of the Yinma River and the Yitong River plain is mainly medium sand and sandy clay, and the aquifer hydraulic conductivity is only 12.5 m/day. The distribution of aquifer hydraulic conductivity in the core study area is shown in Figure 6.
The aquifer thickness distribution in the core study area is shown in Figure 7. In the area traversed by the Second Songhua River downstream of Jilin city and in the reach from the Yinma River estuary to Fuyu City upstream of the Second Songhua River, the aquifer thickness is usually 10 m–30 m, and as much as 50 m in some sections. In the area traversed by the Yinma River, the aquifer thickness of the middle reach from Jiutai to Dehui is 10 m–30 m, whereas the aquifer thickness of other regions is only 5 m–10 m. In the area traversed by the Yitong River, the aquifer thickness of the Changchun City reach and of the Nong’an County reach is relatively thin, but in other locations the thickness is 10 m–30 m.
The runoff of the Second Songhua River is very large (approximately 150 × 108 m3/a). The runoff of the Yinma River and the Yitong River is 9 × 10⁸ m3/a and 3 × 10⁸ m3/a, respectively. The annual average runoff of rivers in the study area is shown in Figure 8.
According to the distribution of aquifer hydraulic conductivity, aquifer thickness and runoff quantity in the region, the water quantity suitability scores assessed by using Equation (1) is shown in Figure 9. The score distribution of all indexes is shown in Appendix B.
As seen in Figure 9, the suitability of water quantity in most regions of the core study area is better than grade III. Only in the middle reach of the Second Songhua River and in the Songhua Lake upstream reach in Jilin City is the water quantity suitability relatively poor (grade IV). Overall, the suitability of water quantity in the study area is good and can basically ensure an adequate water supply for RBF wells.

4.2.2. Water Quality Suitability

The groundwater quality assessment was based on the Quality standard for groundwater (GB/T 14848-93) [24] using the monitoring results for chloride, fluoride, sulfate, ammonia, total hardness, total iron, nitrite and nitrate as the evaluation index. The single-factor evaluation, which contrasts each water quality index to the national standard, was adopted to assess the water quality grade. The status of groundwater quality in the study area is shown in Figure 10.
The surface water quality assessment was based on the Environmental quality standards for surface water (GB 3838-2002) [23] as a standard; the Water Quality Index was adopted for the assessment. The status of surface water quality in the study area is shown in Figure 11. Using Equation (1), the scoring distributions of groundwater and surface water quality in the study area were integrated to produce the water quality suitability distribution shown in Figure 12.
As seen in Figure 12, water quality is distributed across the core study in discrete areas. In the Fuyu City reach and in the downstream reach of the Yinma River estuary of the Second Songhua River, the water quality suitability is grade III. Other parts of the Second Songhua River have grade I water quality suitability. In the Jiutai City reach of the Yinma River, the water quality suitability is grade I, but other parts of the Yinma River are grade III. In the Yitong River basin, the water quality suitability is mainly grade III and grade V, distributed sporadically, except for the Changchun City reach where the water quality suitability is grade I. In general, the water quality suitability is of an acceptable standard in most of the study area.

4.2.3. Interaction Intensity between Surface Water and Groundwater

The interaction intensity between surface water and groundwater was assessed using the river level (H) and the groundwater level (h) at 1 km (L) distant from the river bank to calculate the hydraulic gradient (I = [(H – h)/L]) at intervals along the river of not more than 10 km. The cross sections at which hydraulic gradients were calculated are shown in Figure 13. According to these calculations, the hydraulic gradient scoring index was assigned and distributed as shown in Figure 14.
Then, using the calculated cross sections of the hydraulic gradient, the possible influence zone widths of surface water were determined and assigned a score (from Table 8), as shown in Figure 15.
The locations of hydrogeology profiles based on drilling results are shown in Figure 16. For each cross section, the lithology under the riverbed was analyzed and, using the Handbook of Hydrogeology [26] to obtain a value of the lithology permeability, the lithology permeability was multiplied by 0.1 to determine riverbed permeability. For example, Figure 17 shows the No. 3 hydrogeology profile from Xinlitun to Shaokou; the lithology layer incised by the river is comprised of sand gravel and its hydraulic conductivity (based on experience) is 50 m/day–100 m/day. In this assessment, the hydraulic conductivity of the sand and gravel (75 m/day) was adopted; thus, the riverbed permeability at this cross section was 7.5 m/day. The distribution of riverbed permeability is shown in Figure 18. According to the riverbed permeability suitability evaluation criterion (Table 9), the riverbed permeability was assigned a score.
Using Equation (1), the distribution of scores for hydraulic gradient, possible interaction zone widths of surface water, and riverbed permeability in the core study area were combined to determine the suitability of interaction intensity between surface water and groundwater, as shown in Figure 19.
As shown in Figure 19, the suitability of the interaction intensity between surface water and groundwater is grade IV and grade V at the Fuyu part and the Jilin part, respectively, of the Second Songhua River; in other parts of the river the suitability of interaction is superior to grade III. The suitability of the interaction intensity between surface water and groundwater at most parts of the Yitong River and Yinma River is inferior to grade III, except at the Changchun part of the Yitong River and the middle part between Jiutai and Dehui of the Yinma River, where the suitability of the interaction intensity between surface water and groundwater is grade III.

4.2.4. The Exploitation Condition of Groundwater Resources

The variation of groundwater depth is shown as Figure 20, respectively. The groundwater depth in the core study area is generally less than 15 m, which meets the criteria for groundwater exploitation and is beneficial to the construction of RBF works.

4.3. The Comprehensive Suitability Evaluation of RBF Sites

The various index scores were integrated using Equation (1) to determine the overall suitability of locations in the core study area for RBF works (Figure 21). Five typical points were selected to show the characteristics of each grade of suitability (Table 12).
Based on the multi-criteria analysis, the suitability of many locations in the study area was classified as grade V. These locations were the Jilin City reach, the Yinma River estuary and the Fuyu City reach of the Second Songhua River, as well as the whole Yitong River and the Dehui City reach of the Yinma River. These locations are unsuitable as potential RBF sites. The remainder of the study area was classified with a better than grade III suitability, and should be suitable for locating RBF works.

5. Conclusions

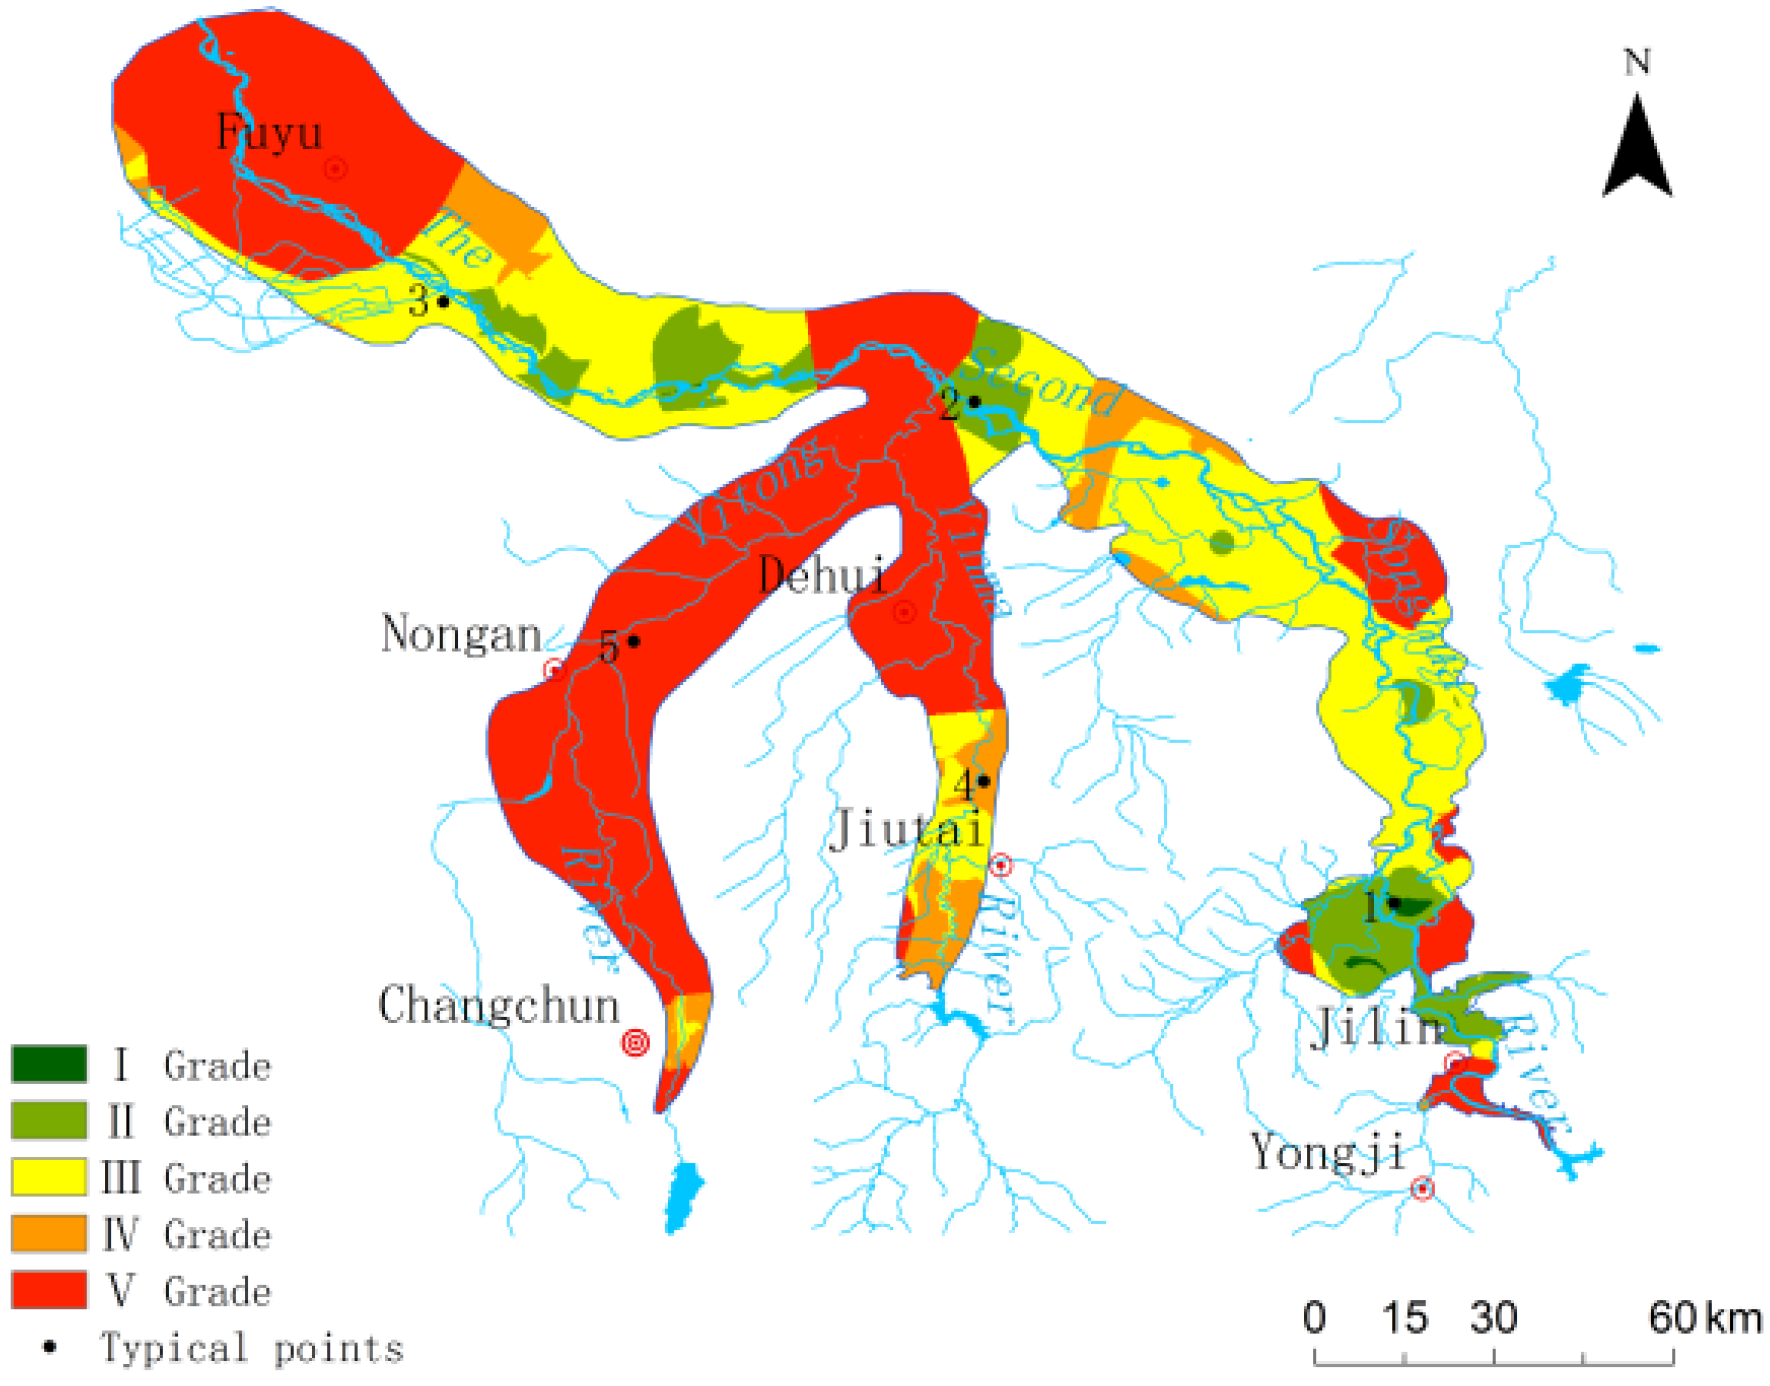
Many important factors affect the site selection for RBF works such as groundwater and surface water quantity, current water quality situation, hydraulic interaction degree and exchange relationship between groundwater and surface water. In this research, a multi-criteria index system was developed for the regional assessment of RBF site suitability in the Second Songhua River and Yinma River. The system was based on a detailed analysis of physical geography and geological and hydrogeological conditions (which were considered to be the main influential factors of RBF), as well as on the development and utilization of water resources and water demand. Scoring criteria based on specialist marking methods were used to determine weighting coefficients and weighted scores. The evaluation method was integrated into the spatial analysis features of GIS to determine the distribution of suitable areas for RBF works. By identifying the suitability grade of areas along the Second Songhua River, the regional evaluation system highlights locations that should be targeted for RBF works. The suitability evaluation system developed in this research thus provides a scientific basis for making decisions for regional industry distribution and relevant groundwater development plans.
However, this research still has some limitations that must be mentioned here and will be studied further. (1) The evaluation index system to assess RBF site suitability that was established in this research is suitable for use only in the Second Songhua River catchment. Unfortunately, this catchment is not universally representative of other catchments because of its very specific hydrogeological conditions. (2) The index system is not very comprehensive; some factors such as riverbed thickness and river width were missing because of the limited field data in the study area.(3) Some index value such as riverbed permeability was inferred by limited information, and this would bring some uncertainty to the final results. (4) The specialist marking method was adopted to determine the preference weights; the applicability was limited within specific areas. The AHP (Analytic Hierarchy Process) method and Fuzzy theory would be better to adopt in a general index system [27,28]. (5) For the specialist marking method, it is important to perform a sensitivity analysis on the preference weights and provide measures for assessing the sensitivity due to changes in these weights [28,29]. Nevertheless, the primary evaluation principle and the index system are reasonable, and can be used as a scientific reference for any other regional site selection or feasibility research of RBF.

Acknowledgments

This study was supported by Major Science and Technology Program for Water Pollution Control and Treatment (2014ZX07201-010).

Author Contributions

Lixue Wang is primarily responsible for implementing the suitability evaluation and preparing manuscript. Xueyan Ye and Xinqiang Du are responsible for establishing the evaluation index system. And meanwhile Xinqiang Du supervised the evaluation process and critically reviewed the draft manuscript.

Conflicts of Interest

The authors declare to have no conflict of interest.

Appendix

Appendix A

Table A1. Environmental quality standards for surface water (GB3838-2002) (Main items). Unit in mg/L.
Item NO.Classification Standard Value iIemsGrade IGrade IIGrade IIIGrade IVGrade V
1DO≥Saturation rate 90% (or 7.5)6532
2Potassium permanganate index≤2461015
3COD≤1515203040
4BOD5334610
5NH3-N≤0.150.51.01.52.0
6TP (counted as P) ≤0.02 (lake/reservoir 0.01)0.1 (lake/reservoir 0.025)0.2 (lake/reservoir 0.05)0.3 (lake/reservoir 0.1)0.4 (lake/reservoir 0.2)
7TN (counted as N) ≤0.20.51.01052.0
8Cu≤0.011.01.01.01.0
9Zn≤0.051.01.02.02.0
10Fluoride (counted as F) ≤1.01.01.01.51.5
11Se≤0.010.010.010.020.02
12As≤0.050.050.050.10.1
13Hg≤0.000050.000050.00010.0010.001
14Cd≤0.0010.0050.0050.0050.01
15Cr6+0.010.050.050.050.1
16Pb≤0.010.010.050.050.1
17Cyanide≤0.0050.050.20.20.2
18Volatile penol≤0.0020.0020.0050.010.1
19petroleum≤0.050.050.050.51.0
20Anionic surfactant≤0.20.20.20.30.3
21Sulfide≤0.050.10.20.51.0
22Coliform (number/L) ≤2002000100002000040,000
Table A2. Quality standard for groundwater (GB/T 14848-93).
Items NO.ItemsClass IClass IIClass IIIClass IVClass V
1Color (degree)≤5≤5≤15≤25>25
2Odor and tasteNoneNoneNoneNoneNone
3Turbidity (degree)≤3≤3≤3≤10>10
4Visible matters (unaided eye)NoneNoneNoneNoneNone
5pH6.5–8.55.5–6.5; 8.5–9<5.5, >9
6Total hardness (counted as CaCO3) (mg/L)≤150≤300≤450≤550>550
7TDS (mg/L)≤300≤500≤1000≤2000>2000
8Sulfate (mg/L)≤50≤150≤250≤350>350
9Chloride (mg/L)≤50≤150≤250≤350>350
10Fe (mg/L)≤0.1≤0.2≤0.3≤1.5>1.5
11Mn (mg/L)≤0.05≤0.05≤0.1≤1.0>1.0
12Cu (mg/L)≤0.01≤0.05≤1.0≤1.5>1.5
13Zn (mg/L)≤0.05≤0.5≤1.0≤5.0>5.0
14Mo (mg/L)≤0.001≤0.01≤0.1≤0.5>0.5
15Co (mg/L)≤0.005≤0.05≤0.05≤1.0>1.0
16Volatile phenolic (counted as phenol) (mg/L)≤0.001≤0.001≤0.002≤0.01>0.01
17Anion synthetic detergent (mg/L)Not detected≤0.1≤0.3≤0.3>0.3
18Potassium permanganate index (mg/L)≤1.0≤2.0≤3.0≤10>10
19Nitrate (counted as N) (mg/L)≤2.0≤5.0≤20≤30>30
20Nitrite (counted as N) (mg/L)≤0.001≤0.01≤0.02≤0.1>0.1
21Ammonia nitrogen (NH4) (mg/L)≤0.020.02≤0.2≤0.5>0.5
22Fluoride (mg/L)≤1.0≤1.0≤1.0≤2.0>2.0
23Iodide (mg/L)≤0.1≤0.1≤0.2≤1.0>1.0
24Cyanide (mg/L)≤0.001≤0.01≤0.05≤0.1>0.1
25Hg (mg/L)≤0.00005≤0.0005≤0.001≤0.001>0.001
26As (mg/L)≤0.005≤0.01≤0.05≤0.05>0.05
27Se (mg/L)≤0.01≤0.01≤0.01≤0.1>0.1
28Cd (mg/L)≤0.0001≤0.001≤0.01≤0.01>0.01
29Cr (sexavalence) (mg/L)≤0.005≤0.01≤0.05≤0.1>0.1
30Pb (mg/L)≤0.005≤0.01≤0.05≤0.1>0.1
31Be (mg/L)≤0.00002≤0.0001≤0.0002≤0.001>0.001
32Ba (mg/L)≤0.01≤0.1≤1.0≤4.0>4.0
33Ni (mg/L)≤0.005≤0.05≤0.05≤0.1>0.1
34DDD (μg/L)Not detected≤0.005≤1.0≤1.0>1.0
35Hexachloro-cyclohexane soprocide (μg/L)≤0.005≤0.05≤5.0≤5.0>5.0
36Coliform (number/L)≤3.0≤3.0≤3.0≤100>100
37Total bacteria (number/L)≤100≤100≤100≤1000>1000
38Total α radioactivity (Bq/L)≤0.1≤0.1≤0.1>0.1>0.1
39Total β radioactivity (Bq/L)≤0.1≤1.0≤1.0>1.0>1.0

Appendix B. Distribution figures of all evaluation index scores.

Figure A1. Distribution of hydraulic conductivity scores.
Water 08 00176 g022
Figure A2. Distribution of aquifer thickness scores.
Water 08 00176 g023
Figure A3. Distribution of annual average runoff scores.
Water 08 00176 g024
Figure A4. Distribution of groundwater quality scores.
Water 08 00176 g025
Figure A5. Distribution of surface water quality scores.
Water 08 00176 g026
Figure A6. Distribution of hydraulic gradient scores.
Water 08 00176 g027
Figure A7. Distribution of scores for the possible.
Water 08 00176 g028
Figure A8. Distribution of riverbed permeability scores.
Water 08 00176 g029
Figure A9. Distribution of the groundwater depth scores influence zone width of surface water.
Water 08 00176 g030

References

  1. Liu, P.G.; Shu, L.C. Uncertainty on Numerical Simulation of Groundwater Flow in the Riverside Well Field. J. Jilin Univ. (Earth Sci. Ed.) 2008, 38, 639–643. (In Chinese) [Google Scholar]
  2. Zhou, Z.; Liu, G.; Liu, M. Study on the construction conditions in the Riverside Well Field. Water Resour. Plan. Des. 2008, 6, 4–5. (In Chinese) [Google Scholar]
  3. Li, J.; Yang, Z. Self-Purification of the River Filtration System; The Yellow River Water Conservancy Press: Zhengzhou, China, 2006. (In Chinese) [Google Scholar]
  4. Han, Z. Several Issues of Riverside Groundwater Well Field. Geotech. Investig. Surv. 1996, 4, 24–26. (In Chinese) [Google Scholar]
  5. Wang, K.Z.; Kong, F.L. Analysis of Groundwater Pollution and its Sustainable Strategy. J. Shandong Agric. Univ. (Nat. Sci.) 2002, 33, 464–470. (In Chinese) [Google Scholar]
  6. Cao, J.F.; Ye, X.Y.; Jiang, J.Y.; Ping, J.Y. Groundwater Resources and Exploitation Potential of the Aboveground Segment of Yellow River Downstream. Recourses Sci. 2004, 26, 9–16. (In Chinese) [Google Scholar]
  7. Liao, Z.; Lin, X.; Shim, Q. Experimental Study on Groundwater Extraction of Yellow River in the Riverside Well Field-The Example in the Northern of Zhengzhou Yellow River Flood Plain. Sci. China Ser. E Technol. Sci. 2004, 1, 13–22. (In Chinese) [Google Scholar]
  8. Zhu, X.; Qian, X. Putting Rational Expoltation and Protection of Urban Groundwater Resources in East China. J. Hydraul. Eng. 1997, 11, 20–27. (In Chinese) [Google Scholar]
  9. Yi, S.; Chi, B.; Wu, F. Research on Numerical Simulation and Evalution of Riverside Source Fied-A Case Study of Liguangpu Riverside Source Field in Shenyang City. J. Nat. Resour. 2006, 21, 154–160. (In Chinese) [Google Scholar]
  10. Guo, X.; Zuo, R.; Wang, J. Sustainable Groundwater Yield and Scenarios in Water Resources Area Along Rivers. J. Beijing Nornal Univ. (Nat. Sci.) 2013, 49, 250–255. (In Chinese) [Google Scholar]
  11. Qin, X. Calculation Method of Induced Recharge in the Water Source of Riverside Well Field. Electr. Power Surv. 1995, 4, 8–14. (In Chinese) [Google Scholar]
  12. Ulrich, C.; Hubbard, S.S.; Florsheim, J. Riverbed Clogging Associated with a California Riverbank Filtration System: An Assessment of Mechanisms and Monitoring Approaches. J. Hydrol. 2015, 529, 1740–1753. [Google Scholar] [CrossRef]
  13. Grischek, T.; Ray, C. Bank filtration as managed surface-groundwater interaction. Int. J. Water 2009, 5, 125–139. [Google Scholar] [CrossRef]
  14. Sandhu, C.; Grischek, T.; Kumar, P. Potential for Riverbank Filtration in India. Clean Technol. Environ. Policy 2011, 13, 295–316. [Google Scholar] [CrossRef]
  15. Sontheimer, H. Experience with Riverbank Filtration Along the Rhine River. J. Am. Water Works Assoc. 1980, 72, 386–390. [Google Scholar]
  16. Wu, Y.; Hui, L.; Wang, H. Effectiveness of Riverbank Filtration for Removal of Nitrogen from Heavily Polluted Rivers: A Case Study of Kuihe River, Xuzhou, Jiangsu, China. Environ. Geol. 2007, 52, 19–25. (In Chinese) [Google Scholar] [CrossRef]
  17. Kim, H.S.; Kim, J.Y. High-resolution Profiling of Alluvial Aquifer in Potential Riverbank Filtration Site by Use of Combining CMP Refraction and Reflection Seismic Methods. J. Appl. Geophys. 2008, 66, 1–14. [Google Scholar] [CrossRef]
  18. Sharma, S.K.; Chaweza, D.; Bosuben, N. Framework for feasibility assessment and performance analysis of riverbank filtration systems for water treatment. J. Water Supply Res. Technol. Aqua 2012, 61, 73–81. [Google Scholar] [CrossRef]
  19. Patwal, P.S.; Sandhu, C.; Grischek, T.; Kimothi, P.C.; Kumar, A. An integrated approach using non-invasive techniques for the identification of potential riverbank filtration sites in mountainous regions. In Proceedings of the AQUA 2015 42nd IAH Congress, Rome, Italy, September 2015; p. 752.
  20. Wu, X.; Liu, S. Pollution Situation and Trend Analysis in Yinma River. Agric. Technol. 2013, 33, 43–44. [Google Scholar]
  21. Sun, S.; Xiao, W.; Zhou, Z. Impact of the Second Branch Yinma River on Water Quality of Songhua River Based on Mathematical Model. Water Resour. Prod. 2011, 27, 7–10. [Google Scholar]
  22. Wang, Y. Accelerating the Development and Utilization of Resources in the Second Songhua River. Water Resour. Hydropower Northeast China 1995, 12, 39–41. (In Chinese) [Google Scholar]
  23. General Bureau of China National Environmental Protection; General Administration of Quality Supervision, Inspection and Quarantine of the People’s Republic of China. Environmental Quality Standards for Surface Water (GB3838-2002); China Environmental Science Press: Beijing, China, 2002. (In Chinese)
  24. Quality Standard for Groundwater(GB/T 14848-93); General Administration of Quality Supervision, Inspection and Quarantine of the People’s Republic of China: Beijing, China, 1993. (In Chinese)
  25. Chen, C. Application of ArcGIS to DRASTIC in the Analysis of Groundwater Vulnerability Assessment Methods. China Water Transp. 2014, 14, 113–115. (In Chinese) [Google Scholar]
  26. China Geological Survey. Handbook of Hydrogeology; Geological Publishing House: Beijing, China, 2012; pp. 680–681. (In Chinese)
  27. Gao, L.; Hailu, A. Identifying preferred management options: An integrated agent-based recreational fishing simulation model with an AHP-TOPSIS evaluation method. Ecol. Model. 2013, 249, 75–83. [Google Scholar] [CrossRef]
  28. Gao, L.; Hailu, A. Ranking management strategies with complex outcomes: An AHP-fuzzy evaluation of recreational fishing using an integrated agent-based model of a coral reef ecosystem. Environ. Model. Softw. 2012, 31, 3–18. [Google Scholar] [CrossRef]
  29. Zhang, X.; Gao, L.; Barrett, D.; Chen, Y. Evaluating water management practice for sustainable mining. Water 2014, 6, 414–433. [Google Scholar] [CrossRef]
Figure 1. The Second Songhua River catchment.
Water 08 00176 g001
Figure 2. Rainfall isoline in the study area.
Water 08 00176 g002
Figure 3. Surface topography of the study area.
Water 08 00176 g003
Figure 4. Contour of the water table.
Water 08 00176 g004
Figure 5. The core study area for evaluating RBF site suitability.
Water 08 00176 g005
Figure 6. Distribution of hydraulic conductivity.
Water 08 00176 g006
Figure 7. Distribution of aquifer thickness.
Water 08 00176 g007
Figure 8. Annual average runoff.
Water 08 00176 g008
Figure 9. Distribution of water quantity suitability.
Water 08 00176 g009
Figure 10. Groundwater quality status.
Water 08 00176 g010
Figure 11. Surface water quality status.
Water 08 00176 g011
Figure 12. Distribution of water quality suitability in the core study area.
Water 08 00176 g012
Figure 13. Cross sections for calculation of hydraulic gradients.
Water 08 00176 g013
Figure 14. Distribution of hydraulic gradient.
Water 08 00176 g014
Figure 15. Distribution of the possible influence zone width of surface water.
Water 08 00176 g015
Figure 16. Location of hydrogeology cross sections.
Water 08 00176 g016
Figure 17. Illustration of the No. 3 hydrogeology profile.
Water 08 00176 g017
Figure 18. Distribution of riverbed permeability.
Water 08 00176 g018
Figure 19. Suitability of interaction intensity between surface water and groundwater.
Water 08 00176 g019
Figure 20. Groundwater depth distribution.
Water 08 00176 g020
Figure 21. Overall suitability of locations within the core study area for RBF works.
Water 08 00176 g021
Table 1. Core study range (distance from river) of river bank filtration (RBF) along river banks.
Grade12345
Runoff (108 m3/a)≥600600–250250–100100–40<40
Core study range (km)2018151310
Table 2. RBF suitability evaluation index system.
Category of Evaluation IndexEvaluation Index (X)Index Weight (W)
Water quantitygroundwaterhydraulic conductivity (K)0.100.30
aquifer thickness (M)0.10
surface waterrunoff in cross-section (Q)0.10
Water qualitygroundwaterstatus of groundwater quality (G)0.150.30
surface waterstatus of surface water quality (S)0.15
Interaction intensity between surface water and groundwatergroundwater hydraulic gradient (I)0.050.30
possible influence zone width of surface water under the condition of groundwater exploitation (L)0.15
permeability of riverbed layer (R)0.10
The exploitation condition of groundwater resourcegroundwater depth (D)0.100.10
Table 3. Hydraulic conductivity (K) scoring criterion.
K (m/d)>100100–5050–2020–55–11–0.1<0.1
Index Value10090807060300
Table 4. Aquifer thickness (M) scoring criterion.
M (m)>5030–5010–305–103–51–3<1
Index Value10090807060300
Table 5. Runoff in Cross Section (Q) Scoring Criterion.
Q (108 m3/a)250–100100–4040–1010–55–11–0.1<0.1
Index Value10090807060300
Table 6. Groundwater quality (G) and surface water quality (S) scoring criterion.
G/SIIIIIIIVV and Worse than V
Index Value100959060−275
Table 7. Hydraulic gradient (I) suitability evaluation criterion.
I (‰)>1010–50–50 to −5−10 to −5<−10
Index Value4080100908060
Table 8. Scoring criterion for the possible influence zone width of surface water under the condition of groundwater exploitation (L).
L< M | I | m a x M | I | m a x to M | I | a v e r a g e M | I | a v e r a g e to M | I | m i n > M | I | m i n
Influence IntensityStrongMediumWeakNone
Index Value100806030
Table 9. Permeability of riverbed layer (R) suitability scoring criterion.
R (m/d)>51–50.5–10.1–0.50.05–0.10.01–0.05<0.01
Index Value10090807060300
Table 10. Groundwater depth (D) scoring criterion.
D (m)<55–1010–1515–2020–2525–30>30
Index Value100908070603015
Table 11. RBF suitability grades.
Suitability Index ValueGradeSuitability Evaluation
90–100IExcellent suitable areas
80–89IIGood suitable areas
70–79IIIModerate suitable areas
60–69IVPoor suitable areas
<60VUnsuitable areas
Table 12. All single index values and scores for five typical points.
Index *Point 1Point 2Point 3Point 4Point 5
ValueScoreValueScoreValueScoreValueScoreValueScore
K60 m/d9060 m/d9060 m/d9012.5 m/d7012.5 m/d70
D17.9 m8020.2 m8021.6 m805.2 m7011.9 m80
R150×108 m3/a100150×108 m3/a100150×108 m3/a1009×108 m3/a709×108 m3/a70
GIII90IV60III90III90IV60
SIII90III90IV90III90V−275
I−3.590−17.860−5.880−3.390−15.360
Wstrong100middle80weak60none30none30
P7.5 m/d1007.5 m/d1003.5 m/d600.0125 m/d300.0125 m/d30
D6.6 m907.4 m905.3 m905.4 m906.6 m90
Score92.583.577.5699.25
GradeIIIIIIIVV
* The meaning of indexes is explained in Table 2.

