1. Introduction
Water scarcity is a structural condition in arid regions of the world, which can be further exacerbated by drought events. Droughts create periods of water shortage, affecting all economic uses and environmental services of water resources. The efforts of hydrologists have helped to characterize and forecast droughts, with several standard indicators available in the literature.
According to Wilhite and Glantz [
1], there is no single definition of a drought, with different definitions relating to the different aspects or effects that droughts have. Meteorological droughts usually relate to the degree of dryness (in comparison to some average quantity) and the duration of the dry period. Hydrological droughts relate to water flows through the hydrological system and usually lag the occurrence of meteorological and agricultural droughts. They can be defined as “periods during which streamflow is inadequate to supply established uses under a given water management system” [
2]. The concept of agricultural drought links various characteristics of meteorological (or hydrological) drought to agricultural impacts. With agricultural droughts, the focus lies on precipitation shortages, differences between actual and potential evapotranspiration, soil water deficits, and so forth. Finally, socioeconomic drought is associated with the supply and demand of certain economic goods, and includes elements of meteorological, hydrological, and agricultural droughts. There are indices for all types of drought, but there is no one-size-fits-all drought index or indicator.
In a recent review on the costs of natural hazards, Meyer
, et al. [
3] report a lack of studies that document drought-related economic losses. The studies that do exist differ in their scope and methodology; a review of methods and a complete assessment of drought-related costs can be found in Martin-Ortega and Markandya [
4].
Droughts have a large impact on biomass production and usually affect biodiversity and the environmental health of ecosystems in a negative way. They also have a significant economic impact, which is the topic of the current study. Specifically, we use the System of Environmental-Economic Accounting for Water (SEEA-Water) [
5] to assess the impact of drought on agricultural water productivity and, if possible, its indirect impact on the economy as a whole. SEEA-Water provides a conceptual framework for organizing hydrological and economic information in a coherent and consistent manner.
The European Commission recently published a guidance document to standardize economic information about water use in Europe [
6], proposing a wider use of the SEEA, but to date there have been few practical applications in European basins and regions. Some applications that use SEEA-W can be found in the literature: a valuation of water resources in the Netherlands using the System of National Accounts and SEEA-Water [
7]; an application to the Vélez River Basin in Southeastern Spain [
8]; the evaluation of measures for better water management in arid areas in China [
9]; and lastly, a methodological proposal for estimating cost recovery ratios based on SEEA-Water accounts as applied to the Guadalquivir River Basin (Southern Spain) [
10].
SEEA-Water provides the basis for the analysis of the water productivity and the drought impact in Guadalquivir between 2004 and 2012. Lange
et al. [
11] use the SEEA framework for water accounting applied to the Orange River Basin, which is shared by four nations, and calculate water use and productivity by industry and country.
The agricultural productivity literature focuses on Total Factor Productivity (TFP) indices and DEA models, while in irrigation water economics literature, single-factor productivity has been widely used. Agricultural economists have estimated water productivity by means of crop yield measurements and water use at experimental stations and farmer fields, as either a ratio of kilograms of yield relative to evapotranspiration or kilograms to applied irrigation water. When the analysis is conducted at a regional or basin level, Molden
et al. [
12] propose using the ratio of a dollar value relative to the consumed for the whole basin.
The objective of this study is to investigate whether the SEEA-Water tables can be used to estimate the economic impact of drought on agricultural water productivity. We apply the methodology to a Euro-Mediterranean river basin (Guadalquivir). By covering periods when meteorological, hydrological and agricultural droughts occur and when Drought Management Plans (DMPs) were implemented, we can track and characterize the economic impact of drought events. DMPs are regulatory instruments that establish priorities among the different water uses during droughts; in recent years, they have been widely adopted across southern EU basins. Estrela and Vargas [
13] present a general overview of drought governance and DMPs in the EU, reviewing scientific and technical advances, as well as the implementation of policy tools.
Section 2 shows general information about the case study and the data sources.
Section 3 focuses on the results of meteorological and hydrological data in the period under study and presents the economic analysis. Discussions are developed in
Section 4 and some concluding remarks can be found in
Section 5.
2. Materials and Methods
2.1. Case Study: Guadalquivir River Basin 2004–2012
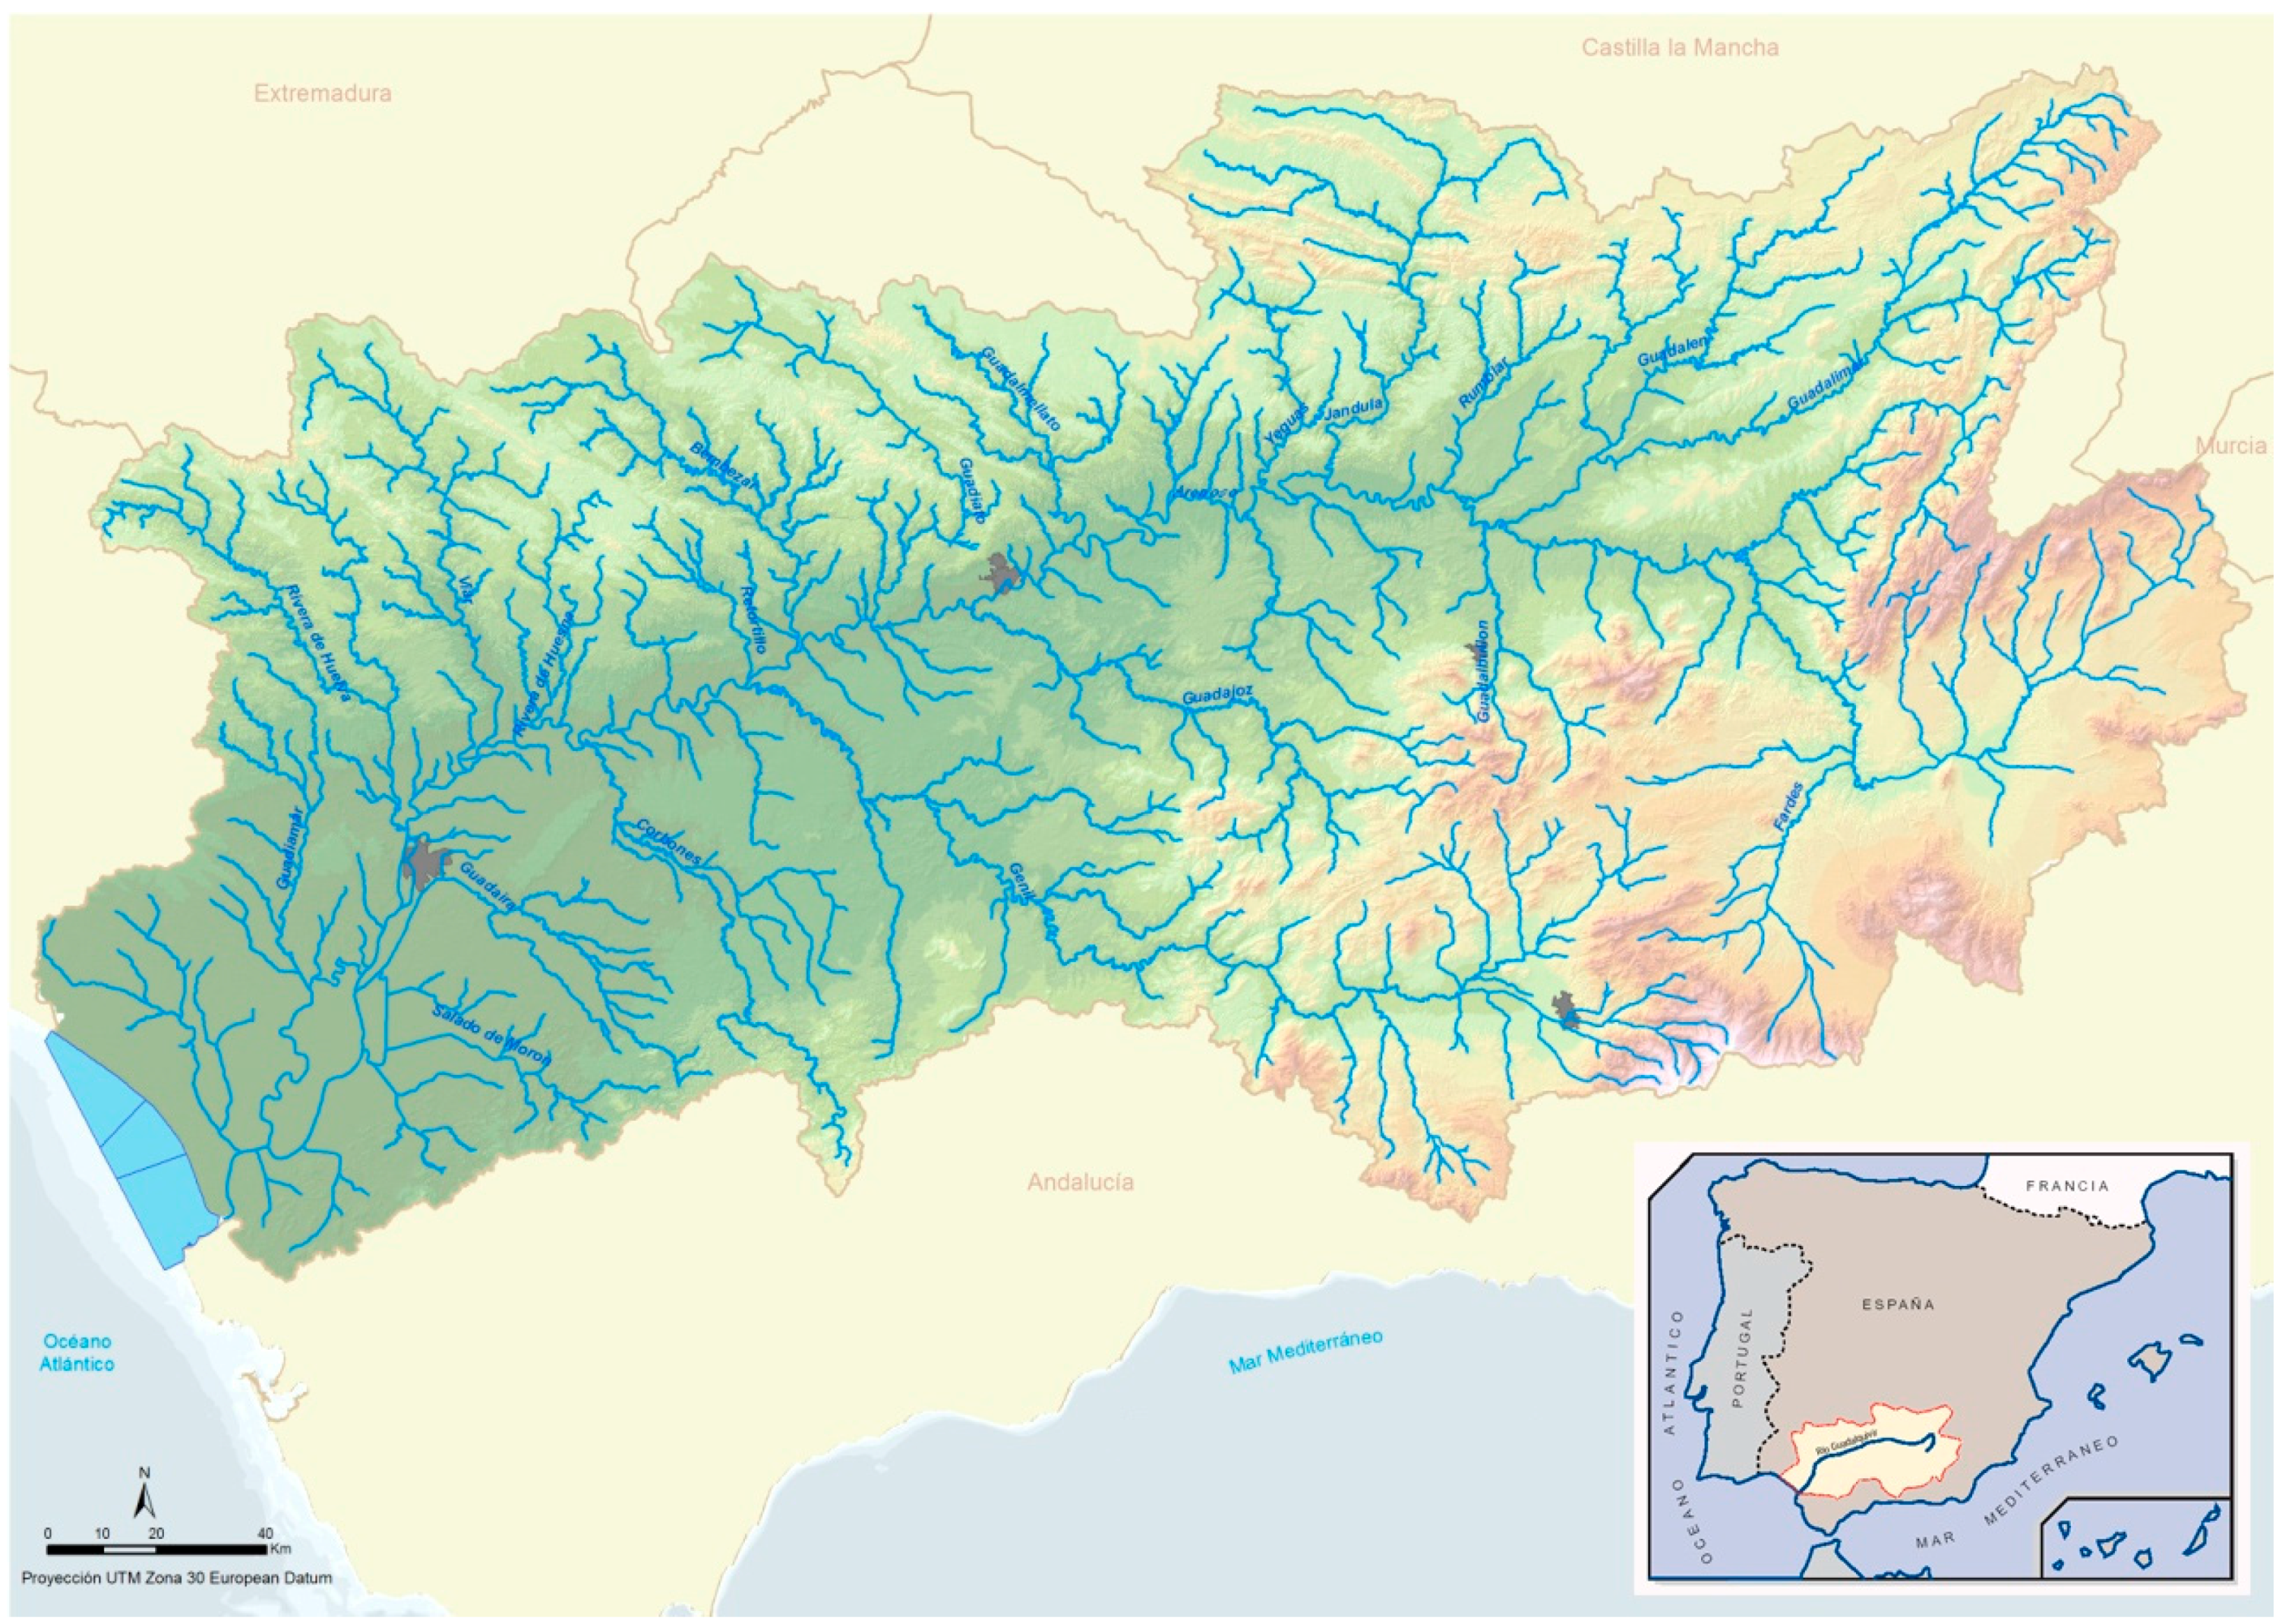
The Guadalquivir River is the longest river in southern Spain with a length of around 650 km. Its basin covers an area of 57,527 km
2 and has a population of 4,107,598 inhabitants (see
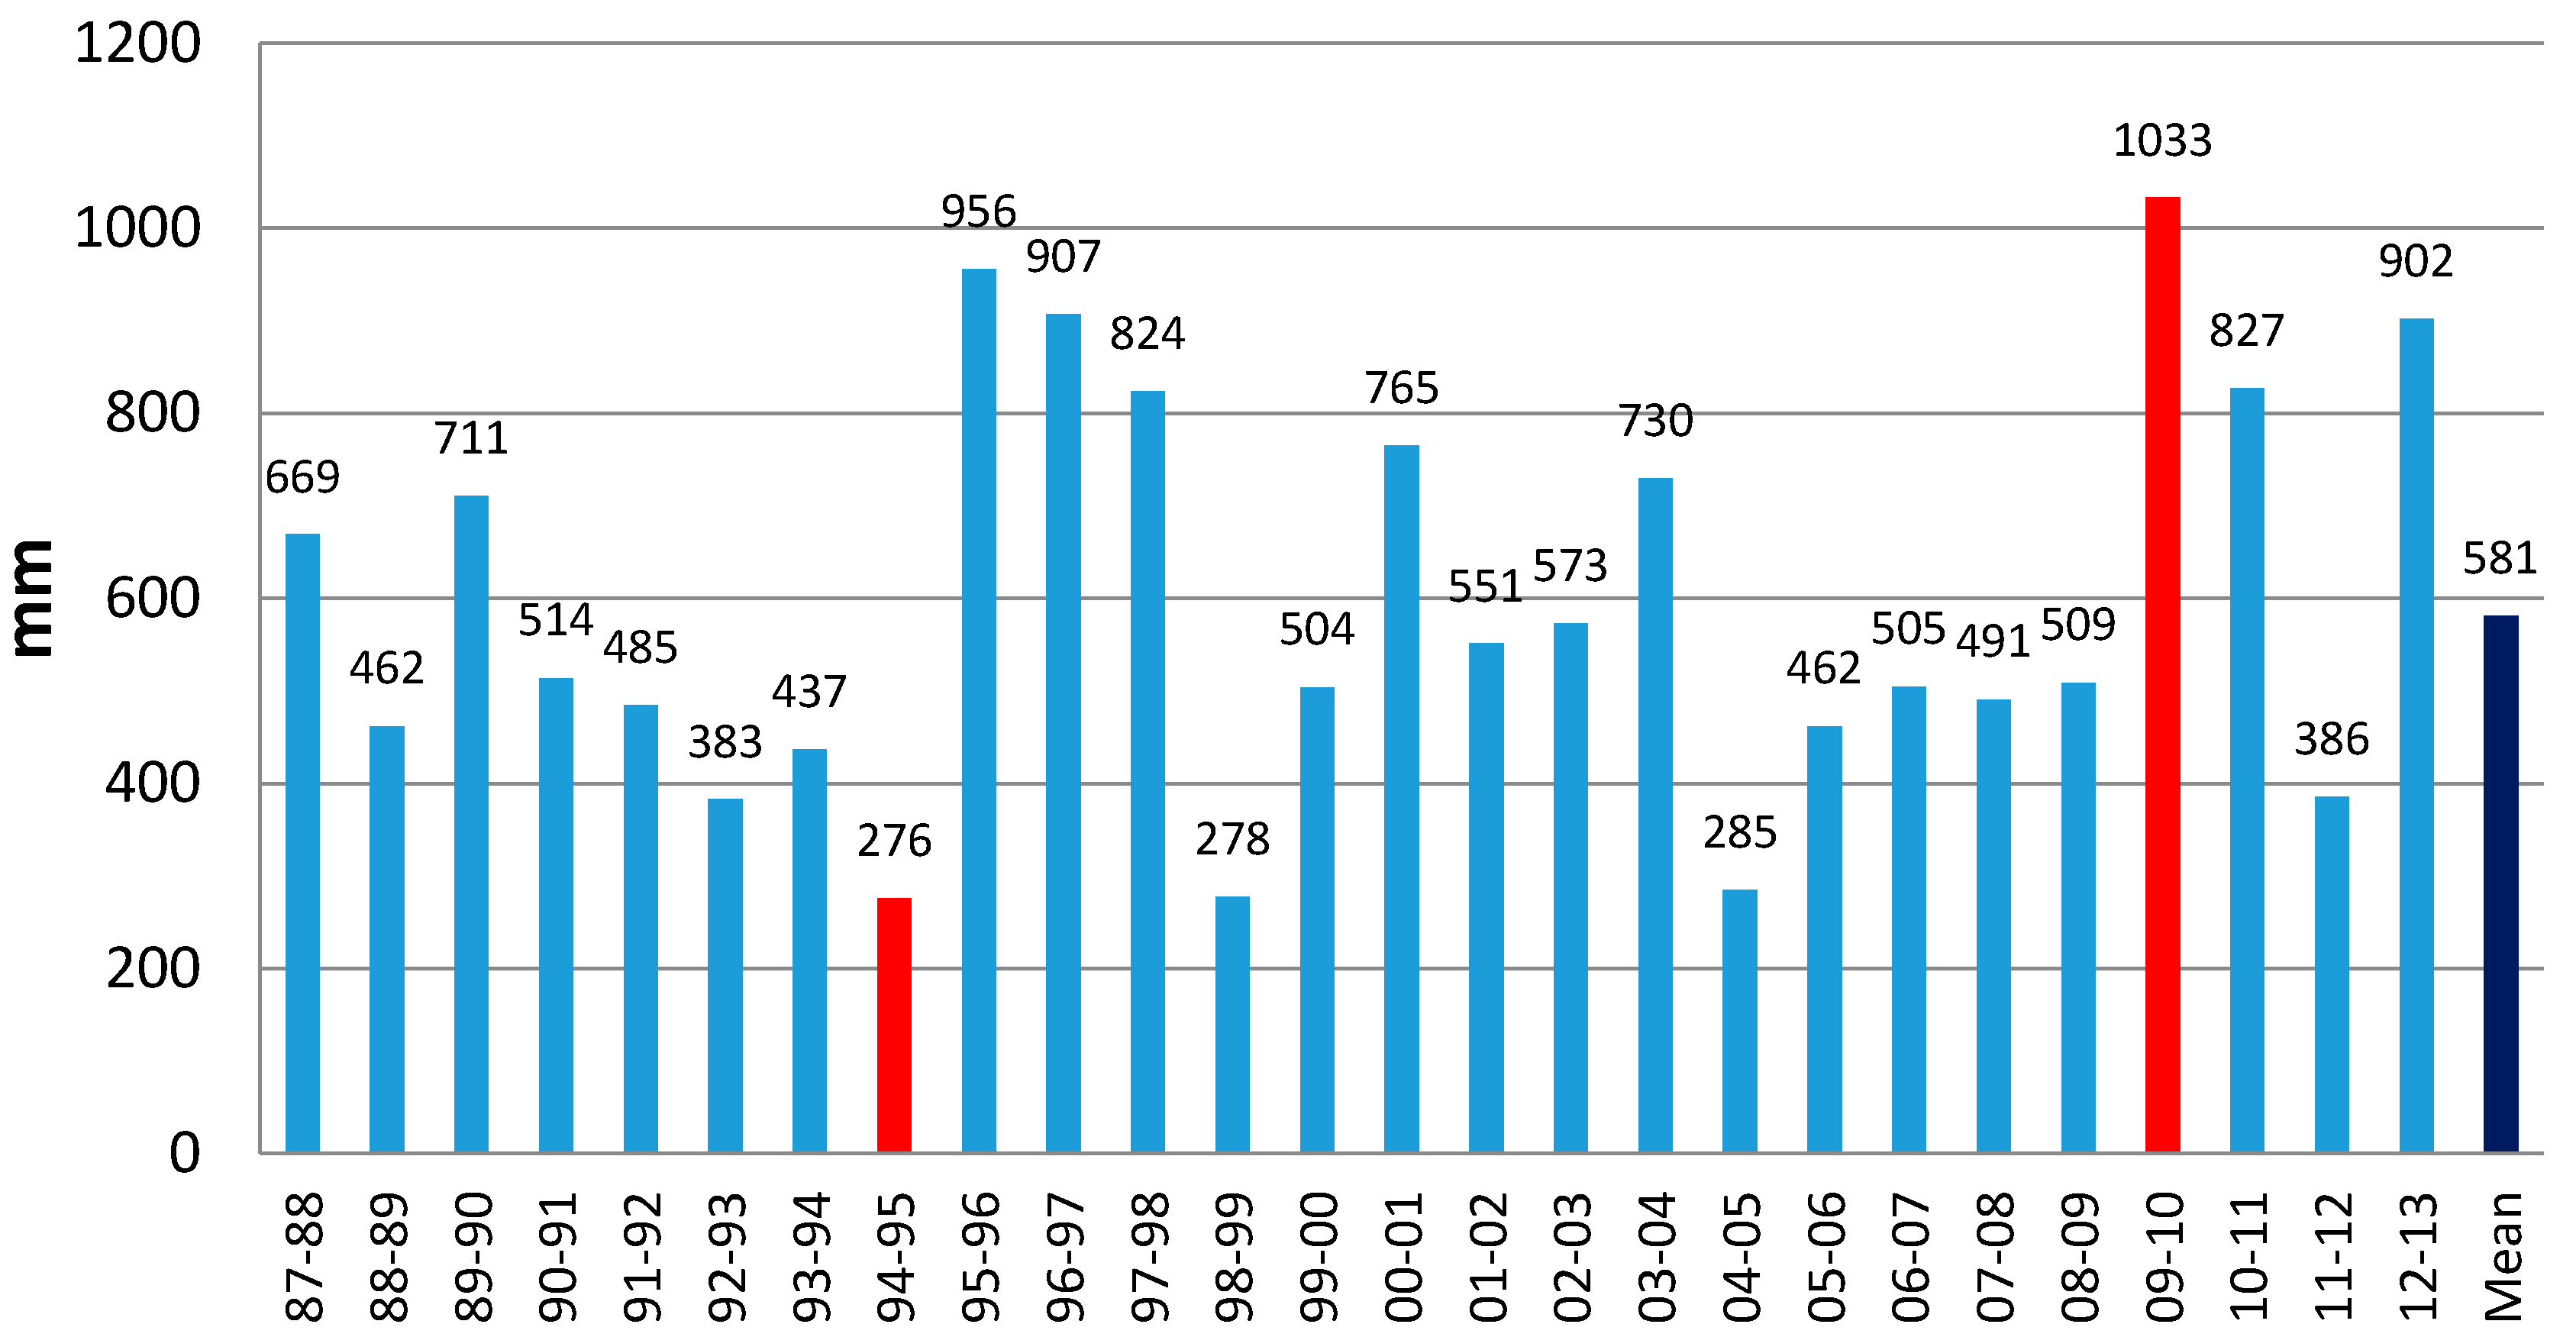
Figure 1 for a map of the basin). The basin has a Mediterranean climate with a heterogeneous precipitation distribution. For the period 1940–2012, the annual average temperature was 16.8 °C, and the annual precipitation averaged 573 mm (similar to the average precipitation between 1987–2013 shown in
Figure 2), with a range between 260 mm and 1033 mm (standard deviation of 161 mm). The average renewable resources in the basin amount to 7043 (arithmetic mean) and 5078 hm
3/year (median), ranging from a minimum of 372 hm
3/year to a maximum of 15,180 hm
3/year [
14]. In a normal year, a potential volume of around 8500 hm
3 can be stored through a complex and interconnected system of 65 dams. The main land uses in the basin are forestry (49.1%), agriculture (47.2%), urban areas (1.9%) and wetlands (1.8%).
An analysis of the Guadalquivir Hydrological Basin Plan can be found in Berbel
et al. [
15]. Agriculture is the main water user in the basin and has made large investments in water-saving measures, referred to as “modernization” [
16]. Berbel
et al. [
17] analyze the impact of modernization on water use and cost for a sample of irrigation water user associations during the period 2004–2012.
The Guadalquivir River Basin Authority [
18] approved a DMP that was first implemented in the most recent period of drought in 2005–2008. The resulting effects of the reduction in irrigation quotas will be shown later as part of the discussion on SEEA accounts. The full period of analysis (2004–2012) starts before the implementation of water-saving measures, includes the last drought (2012), and is long enough to study the implementation of water-saving measures and their impact.
2.2. Data Sources
Implementation of the SEEA-Water tables requires good quality hydrological and economic data. Several sources have been consulted to estimate the hydrological variables required. As can be seen in
Table 1, the data are based on the official Ministry for Environment framework, SIMPA (Integrated System Modeling Process Precipitation Contribution), which gives rain precipitation and evapotranspiration for the basin in 1 km
2 cells, along with further estimates based on the Guadalquivir River Basin Authority (RBA) surveys for irrigated areas and measurements of water served to large irrigation schemes and municipal users. The RBA publishes accurate measures of water consumption and river flow in strategic locations that provide a good estimate of annual water resources use and that have been integrated in the analysis of water volumes in the SEEA Tables.
2.3. Hydrological/Agricultural Drought in the Guadalquivir River Basin 2004–2012
The nine consecutive years under study include dry and wet years (see
Table 2). For the purpose of this paper, we treat hydrological and agricultural droughts as equivalent, meaning that a lack of water flow through the hydrological system results in restrictions to irrigation, while a good reservoir water storage situation allows full irrigation despite the meteorological situation. These years can be grouped, hydrological and meteorologically, into four classes:
Two very dry years with normal irrigation: 2004/5 and 2011/12, when rainfall was 51% and 33% below average, respectively. These years can be defined as meteorological droughts with no effect on agriculture.
Three years with normal-to-low precipitation (80%–87% of the average). In these years, rain-fed crops suffered a minor reduction in productivity, but they are not considered proper drought periods by meteorological standards. However, water storage fell below its critical point and irrigation cuts were applied according to the DMP. We consider these years as hydrological/agricultural droughts.
One year with normal precipitation (88% of the average) and with no irrigation constraints: 2008/09.
Three wet years (126%–178% of average) with full irrigation: 2003/4; 2009/10 and 2010/11.
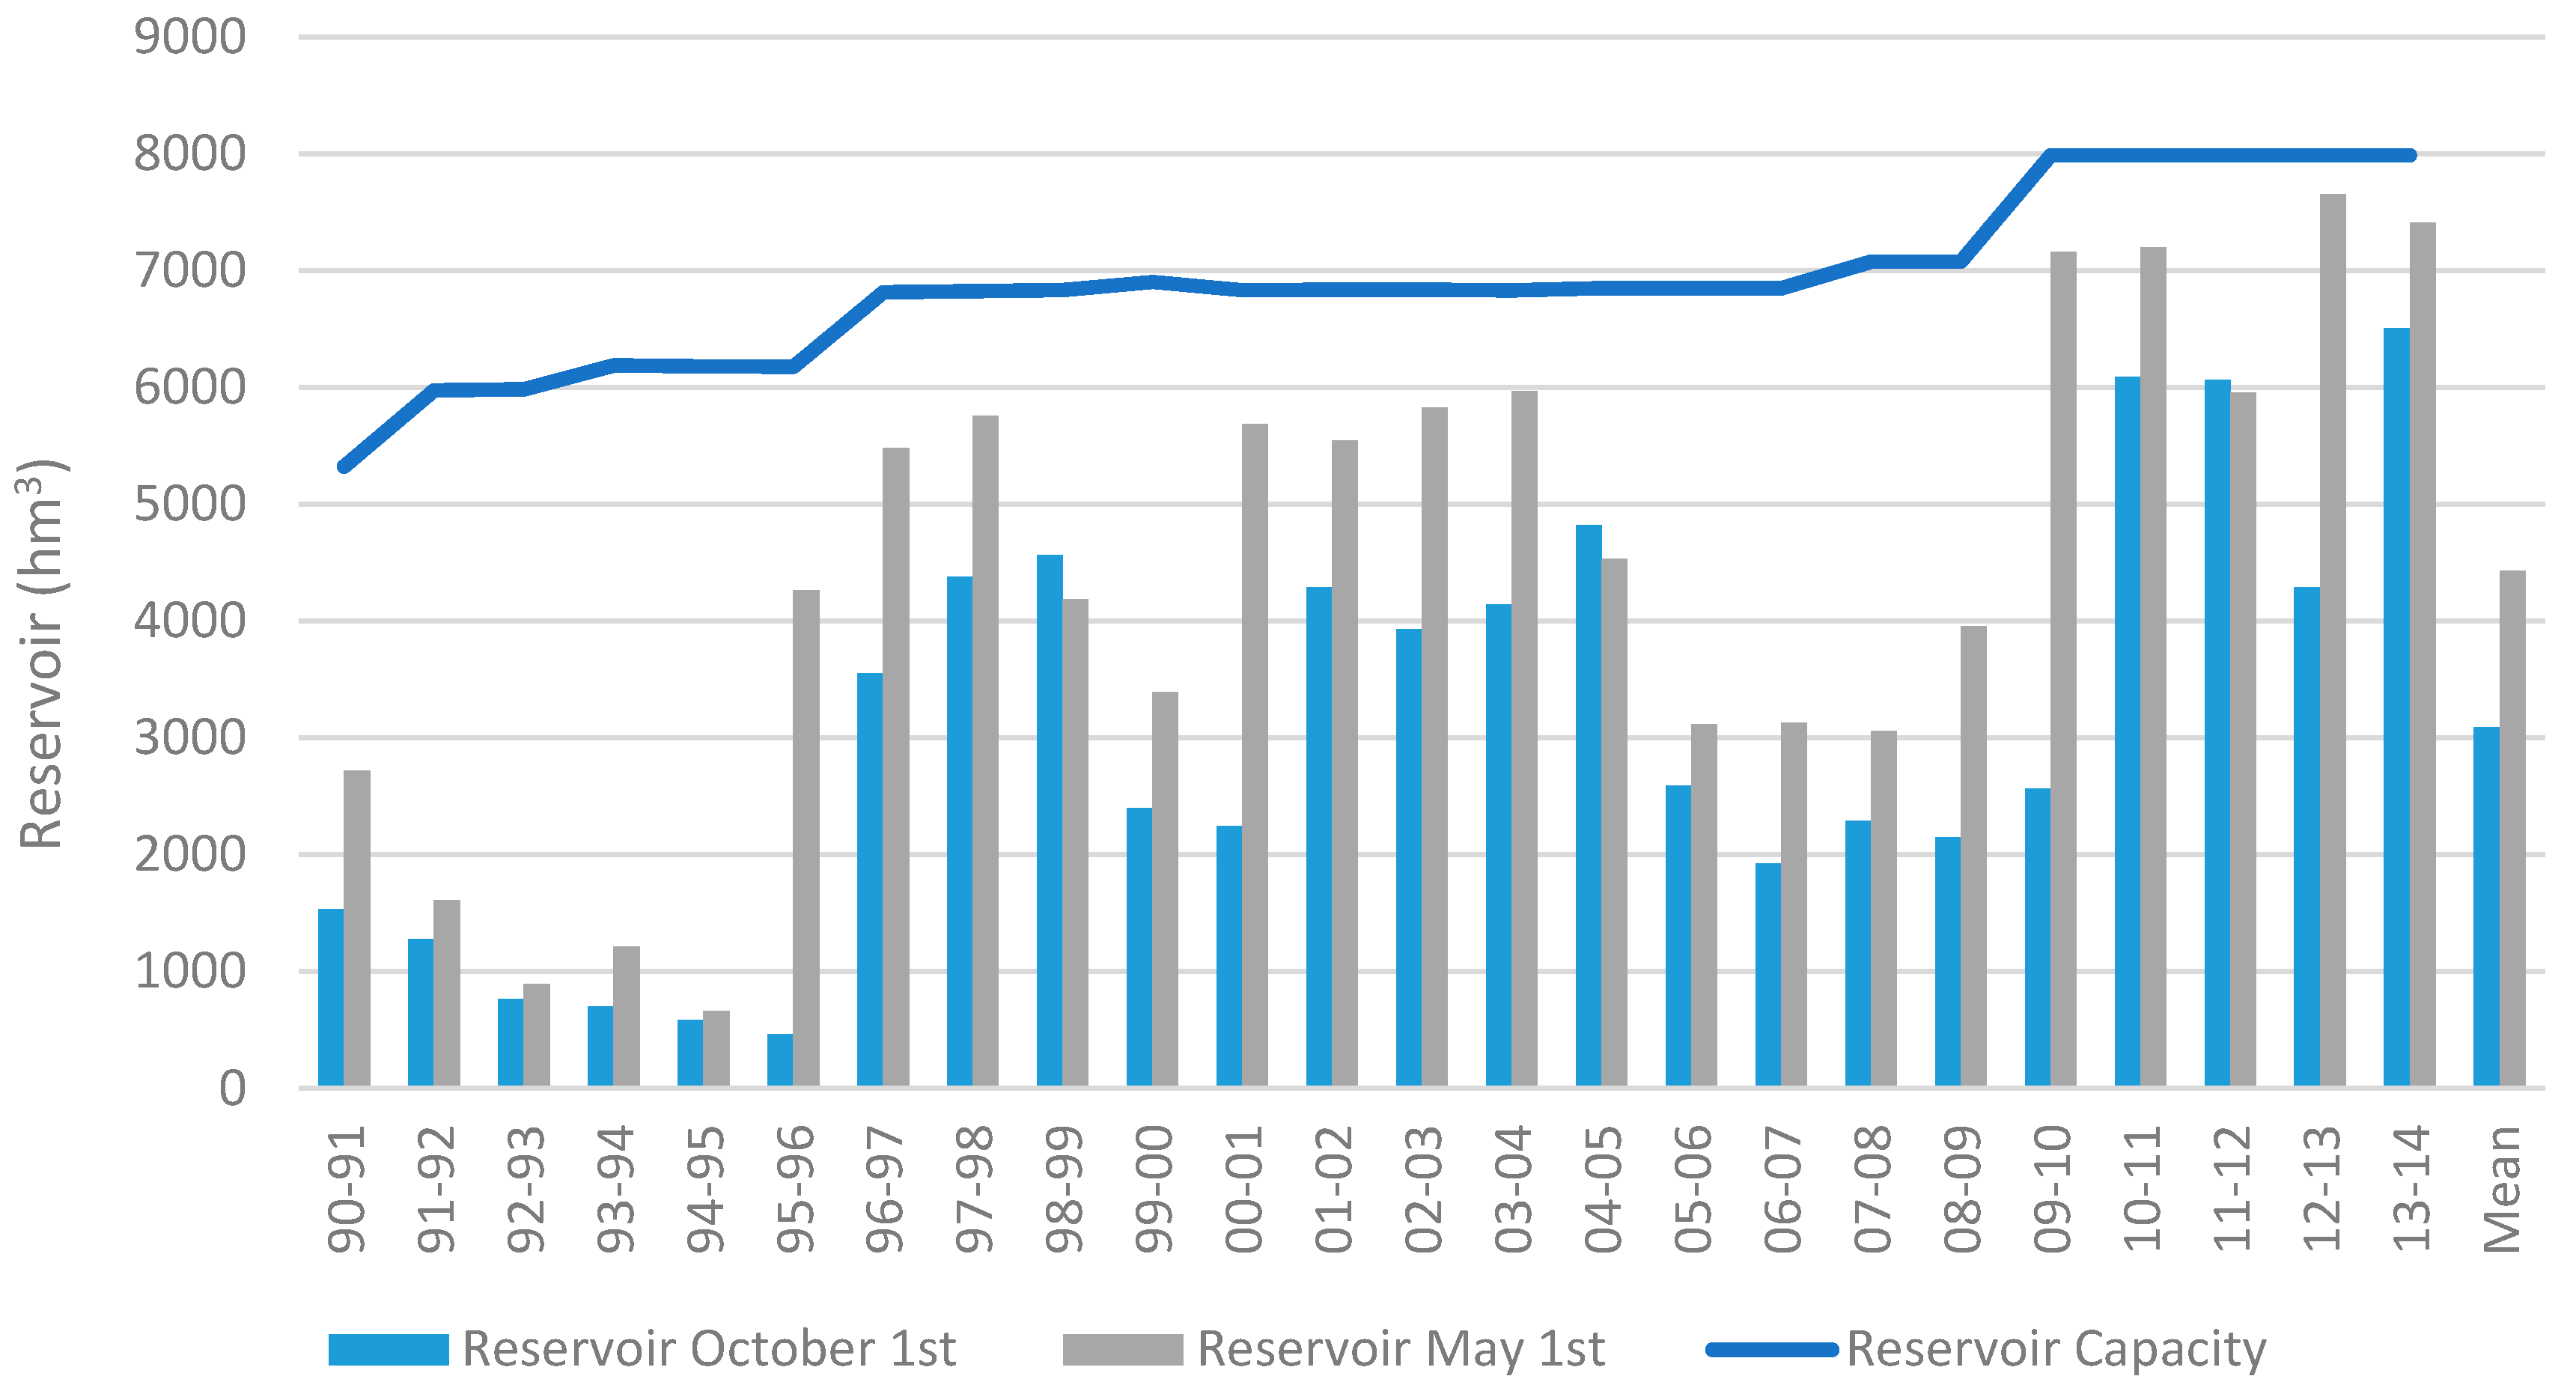
Figure 3 shows the reservoir water storage situation on October 1st, at the end of the irrigation season and the start of the new hydrological year, and on May 1st, which is a critical value as the new irrigation season begins and no significant additional resources are expected. It can be seen that in the 2004–2012 period, water volumes stored on May 1st in 2006, 2007 and 2008 were low compared to the rest of the series under study. In those years, implementation of the DMP meant that irrigation quotas were reduced to 50% of normal water rights, whereas the supply to urban and industry was not affected. For further information about water storage in the Guadalquivir Basin, we refer to Argüelles, Berbel and Gutiérrez-Martín [
14], who analyze the evolution of water supply and reservoir volume in the basin, and Berbel
et al. [
19], who discuss the trajectory towards basin closure as a result of the inability to meet growing demand by increasing supply.
2.4. Method
The SEEA-Water system links physical water balances to socio-economic information, such as gross income, value added and employment of the main water abstractors. The economic data for this study were obtained from official sources in order to maximize reproducibility and transparency, and to minimize the cost of compiling the water account tables. The full set of tables can be found in Berbel
et al. [
20].
As mentioned above, SEEA-Water is used to analyze water productivity and drought impact in Guadalquivir between 2004 and 2012, and to compute water use and productivity during the period. The added value of using SEEA for this is the standardization for all temporal and spatial contexts.
The meteorological conditions and water storage management affect other basin water variables that are significant for agriculture. According to the SEEA-Water methodology, the key variables in this respect are: soil water, supply of irrigation, and reused water and return flows. Values for these variables are given in
Table 3. Soil water was estimated with SIMPA software [
21] that uses 1 km
2 simulation cells, and was estimated for irrigated area, rain-fed crop area and forests including pastures. Soil water estimates are based on the estimated rain in a location and the type of vegetation. Three groups of vegetation are distinguished within agrarian soil: permanent trees, herbaceous and heterogeneous systems. SIMPA is the official model in Spain for estimating water resources and we adopt this standard tool to create the water tables for hydrological variables.
The SEEA-Water handbook [
5] states that “Abstraction from soil water includes water use in rain-fed agriculture, which is computed as the amount of precipitation that falls onto agricultural fields”. This definition may lead some researchers to measure soil water only for rain-fed land, thus failing to take into account the rain that falls on irrigated land. We believe this is not a practical approach for Mediterranean basins where a significant proportion of the agricultural area is irrigated. In addition, it does not account for forestry or rangelands. Therefore, we use the following definition: soil water abstraction is the rain water evapotranspired by crops in both rain-fed and irrigated agriculture and by pastures and trees in forested areas. For irrigated areas in the Guadalquivir Basin, 62% of soil water comes from rain water (also called “green water”), with the remaining 38% coming from irrigation water (or “blue water”).
3. Results
Table 3 shows the figures for green and blue water for the period under study ("Soil water irrigated land" and “Irrigation supply”, respectively), with an average of 453 mm of green water compared to 278 mm of blue water. The low proportion of irrigation supply is a consequence of the widespread use of deficit irrigation, which is applied to 70% of the irrigated area [
22]. Finally, the supply of reused water is very small (16 hm
3,
i.e., less than 1% of irrigation supply).
Table 3 shows the water volume in absolute terms (hm
3) since it is the measure that needs to be included in SEEA Tables. We have also included the relevant value for agronomic information in ‘mm’. The first value is the result of multiplying the unit of water resource (mm) by the area (km
2). We can see that rainfall on irrigated land is slightly higher than the estimated value for rain-fed and forested land, and this is estimated by the SIMPA tool using the available hydrological information.
By definition, SEEA-Water is a hybrid accounting system that includes both economic and hydrological data. This allows several combined indicators to be calculated; we have selected the ratio of GVA to water consumption, although we distinguish between rain and irrigation water productivity. Apparent water productivity does not capture the productivity of the resource alone, since other factors-mainly land, labor, capital and management are also included [
23]. In the remainder of this paper, we refer to this ratio using the abbreviated term 'water productivity', because this ratio gives not the value of marginal productivity and additionally, the numerator is the GVA which also includes items such as salary and interest. However, according to Young and Loomis [
23] the ratio is a useful indicator for economic analysis and water management.
Table 4 shows the evolution of agricultural GVA in real terms. We can see the impact of the years with meteorological droughts (2005 and 2012) compared to years prior to those droughts (2004 and 2011, respectively). Years when water supply was restricted due to the DMP being in force (2006, 2007 and 2008) also had lower GVA than previous years with normal rainfall and no restrictions (2004). The SEEA uses aggregated regional data and we cannot clearly determine whether other sectors are affected by the droughts; obviously there should be some impact in sectors such as the food industry (29% of industrial output in the region) but we have not been able to detect this impact based on the regional statistics.
Common Agricultural Policy (CAP) subsidies in agricultural GVA for the years 2004 and 2005 have been corrected. The reformed CAP does not include price support from 2006 onwards, and so to enable comparison of all economic data in the period, we have subtracted price support from the official GVA data for the first two years of the series. In a preliminary version of this paper, the agricultural production value was taken directly from the Ministry's official estimation and that includes the CAP subsidies for 2004, and 2005 [
24].
Table 5 shows the water productivity of the primary sectors (ISIC Sectors 01–03) for the period under study. Both livestock and forestry (together making up around 15% of total agricultural GVA in the basin) and rain-fed agriculture (around 20% of total GVA) have mean values below the overall average ratio (0.06 and 0.09 compared to 0.17 EUR/m
3, respectively), whereas irrigated agriculture (65% of total primary sector GVA) has a considerably higher water productivity.
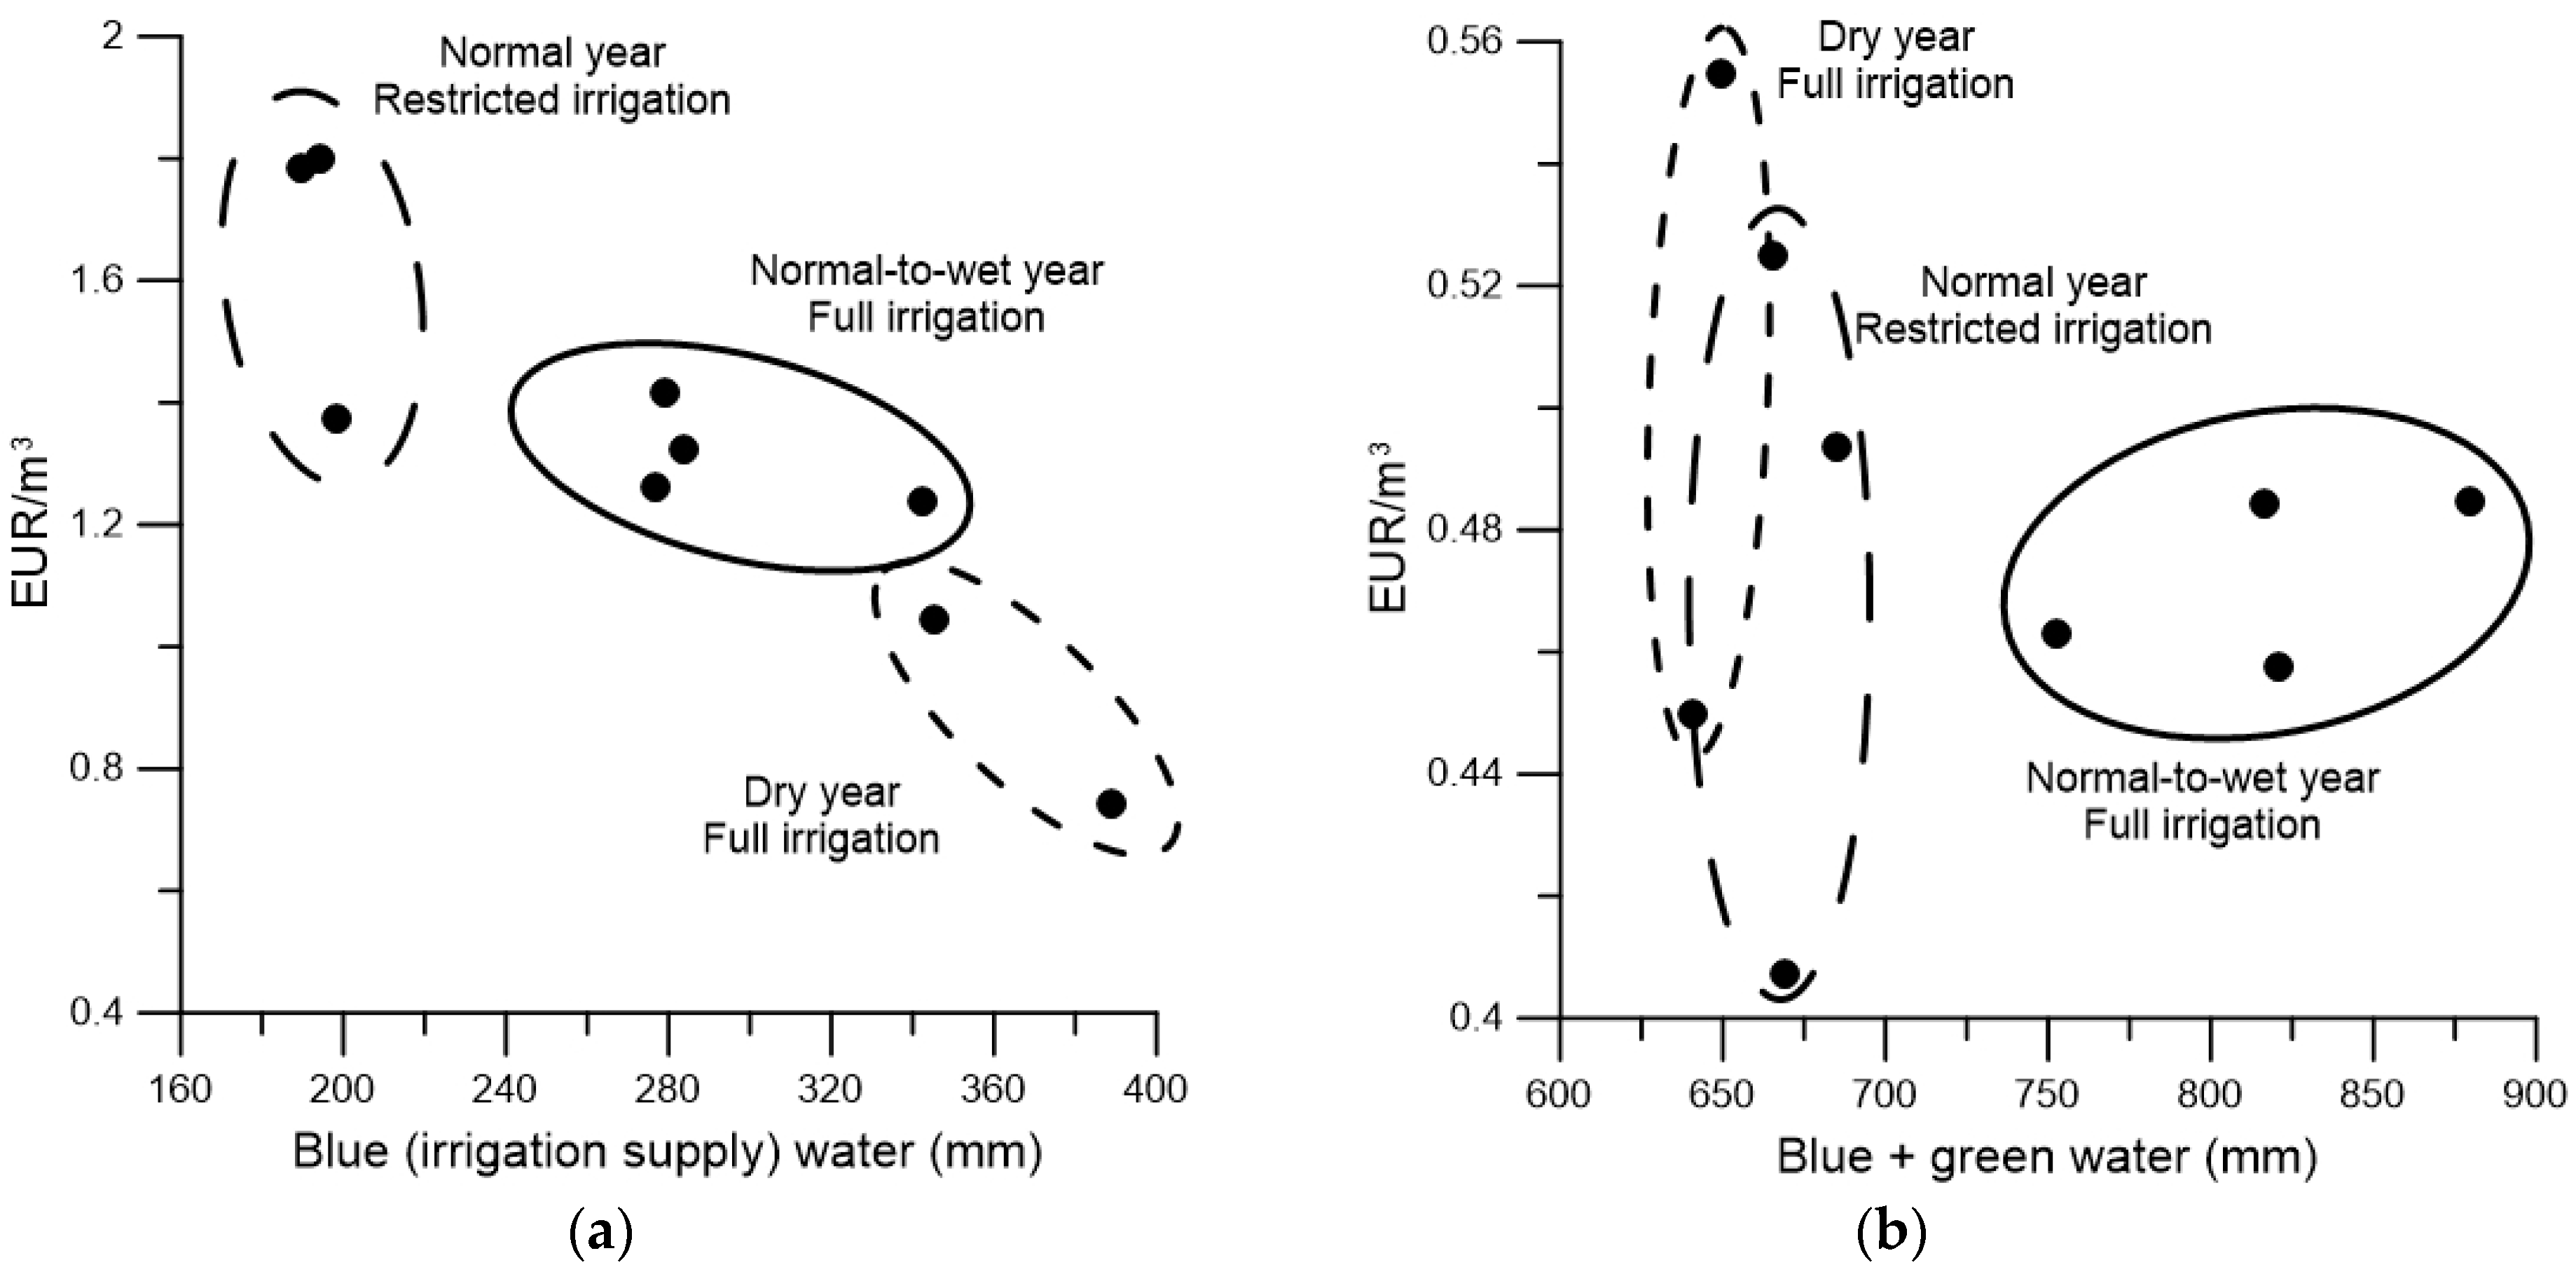
Within irrigated agriculture, we separately examined blue water productivity (
Table 5, Irrigation (blue Water)) and total water productivity Irrigation (green + blue Water), finding average productivity values of 1.33 EUR/m
3 and 0.48 EUR/m
3, respectively. Of course, these results cannot be compared directly as the same GVA values were used in both ratios, but the interest lies in how both relate to precipitation and irrigation water, as shown in
Figure 4.
In our opinion, we can separate observations into three groups of years: (a) Normal precipitation with restricted irrigation; (b) Dry years with full irrigation and (c) Normal precipitation with full irrigation. Only 2009 (normal year, normal irrigation) is an “independent year”. In comparison with “blue water” productivity, the productivity of 'blue + green water' is more diverse, ranging widely in the first and second groups.
Figure 4 is a curve that relates the use of the factor (either blue water or blue + green water) with the average apparent productivity, that is, GVA per m
3; although water is on both axes, the productivity decreases when the use of the factor increases according the law of marginal decreasing returns.
4. Discussion
We have estimated the impact of droughts on the evolution of agricultural GVA in years with meteorological droughts and hydrological droughts. Numerous papers have studied the economic impacts of droughts, including the report on the ongoing Californian drought [
25], which was based on data from the USDA National Agricultural Statistics Survey. The conclusion from that paper is that the impact of the drought on California’s agricultural sector was less severe than expected in 2014. This fact can be explained by various factors: (a) increased, but unsustainable, groundwater pumping; (b) the role played by water transfers; and (c) short and long-term shifts in the types of crops grown and improvements in irrigation technologies and practices.
In Australia, The Murray-Darling Basin Authority commissioned, as one of a number of consultancy reports, a report [
26] on a range of different aspects of the socio-economic implications of reducing current diversion limits, a situation similar to a hydrological drought. It suggests that the reduced water availability could result in a 16%–20% decline in regional farm profits compared to those under the current diversion limits. However, the impacts could vary substantially across catchments, reflecting the mix of agricultural activities, the proposed adjustment to the water withdrawal cap compared to current water use, and the availability of water trading. All the above factors influence the opportunity costs faced by irrigators and the feasible options for adjustment.
In our application, results have shown that the range of water productivity is lower (0.41–0.55 EUR/m3) for total (green + blue) water than for blue water alone (0.74–1.80 EUR/m3). In addition, with respect to blue water only, there does seem to be a pattern whereby increased volumes of irrigation water leads to lower water productivity according to the law of marginal decreasing returns. It can be observed that, in general, normal and wet meteorological years with full irrigation produced medium productivity values, while dry years with full irrigation and normal years with restrictions tended to the extremes.
The relationship between water productivity and blue water use is almost linear (coefficient of determination = r2 = 0.8). On the contrary, there is no good fit when green water is included. The explanation for this may be that while blue water is a well-controlled input that is applied by farmers under optimal conditions, the distribution of rain is not controlled and the “productivity” of green water is therefore more uncertain, or even counterproductive if rain falls before seeding or after crops have completed their growth cycle and some of the water is lost by evapotranspiration.
The water productivity values determined in this study are in line with those in a number of previous studies. Carrasco
et al. [
27] studied the evolution of irrigated crop water productivity for the Guadalquivir Basin between 1989 and 2005 using statistical data at regional and crop level. The results indicated that the irrigated crop water productivity was 0.12 EUR per m
3 (in 2005 prices) in 1989, increasing to 0.50 EUR per m
3 in 2005 (9% annual growth). Berbel, Mesa-Jurado and Piston [
22] also study water productivity ratios, finding a similar figure for 2005 as well as providing results for the residual value of water, signaling the differences between apparent productivity and water value.
García-Vila
et al. [
28] conducted a study aimed at characterizing the behavior of an irrigated area from 1991 to 2010 encompassing over 7000 ha in Southern Spain. Water productivity (value of production divided by the volume of irrigation water delivered) in the district was moderate and highly variable (around 2.0 EUR/m
3) and did not increase with time; that value is higher than the values calculated in this study because the focus is on the value of production rather than GVA. Irrigation water productivity (increase in production value due to irrigation divided by irrigation water delivered) was much lower (0.65 EUR/m
3) and similarly, it did not increase with time. The low irrigation water productivity shows the important role of green water in total productivity.
The Regional Government of Andalusia [
29] estimates for determining the productivity of Andalusian irrigated agriculture are valued as 1.37 EUR/m
3 (Guadalquivir basin represents 90% of total irrigated land in Andalusia); this value for the Andalusian region is within the range obtained in this analysis and also in the range of the values reported by the Hydrological Plan [
30] for irrigation water of 0.77 EUR/m
3.
Nevertheless, it would be advisable to look at total factor productivity, which represents the ratio of the total quantity of outputs to the total quantity of inputs, in order to account for total effect [
31]. Along these lines, Mallawaarachchi
et al. [
32] performed an economic analysis of the impact of the Australian National Water Initiative on the efficiency and productivity of water use. They conclude that the average annual growth rate of total factor productivity for all irrigated farms is 1.1% a year, which is mainly driven by a decrease in input usage, including irrigation water. While this decrease in input usage may be attributable to efficiency gains in water use, the principal reason for reducing water use is the drought rather than any policy changes. Policy changes did, however, enable the irrigators to better manage the water scarcity.
5. Concluding Remarks
The Department of Economic and Social Affairs of the United Nations Secretariat, with the support of other institutions, has made an ambitious effort to build the SEEA-Water accounts and define a standard methodology that can facilitate international inter-basin comparisons and knowledge creation on the status and quantitative management of water resources.
This study has made a contribution by providing a practical application of these accounts in the Guadalquivir River for a period with different hydrological and meteorological conditions (2004–2012). We found three types of years: (a) meteorological drought years with rainfall below 33% of average but no constraints on irrigation water; (b) normal years (rainfall ±15%) and irrigation supply reductions; and (c) normal-to-wet years with no constraints on irrigation.
When economic and hydrological data are linked, water productivity values (the ratio of GVA to consumed water) can be estimated by sector and year. The analysis of this ratio over the study period helps to understand the effect of meteorological and hydrological conditions on productivity, and the role of blue (abstracted) water and green (rain) water in irrigated agriculture.
The innovative contribution of the present study is to separate the productivity of blue and green water; we have thus been able to illustrate the impact of the different type of droughts on water productivity. This analysis provides additional information that may help improve the decision making of policy makers, administrators and farmers and can also be used for scenario exercises that simulate the impact of institutional or natural events.
The results of the current case study in the Guadalquivir Basin are as follows:
The impact of meteorological droughts is observed in economic aggregated data for agriculture but not for other economic sectors. Agriculture is more directly dependent on weather conditions than most other sectors. Moreover, other sectors did not face reductions in allocated water, and "contagion" from agriculture to other sectors is limited due to the relatively low economic contribution of agriculture to the overall economy (7% of total GVA including livestock and forest).
Hydrological/agricultural droughts, when they lead to reductions in irrigation volumes (due to low stocks and implementation of DMPs), result in higher 'blue water' productivity.
Our estimation of blue/green water use in the basin reveals that only 38% of total water consumed by irrigated agriculture is 'blue water' with the remaining 62% being green (soil) water. This result adds to previous reports by Berbel, Mesa-Jurado and Piston [
22] and Berbel, Pedraza and Giannoccaro [
19], who stated that 70% of the area in the basin irrigates crops under a deficit irrigation regime.
These results show that hybrid tables can be used to estimate river basin water productivity values. Studying the ratio over the 2004–2012 period has provided useful knowledge about water productivity in these years and its relationship to rainfall and irrigation volumes. Furthermore, using the standard SEEA methodology allows this knowledge to be more easily shared and compared to other basins.
The application of SEEA accounts enables the determination of the direct impacts of meteorological and hydrological droughts, but it fails to detect the indirect effects (on the basin economy) based on aggregated basin data. The lack of non-farm impact may be explained by four factors: a) the fact that agriculture only represents 4% of basin GDP; (b) the role of irrigation in the basin, which mitigates the effects meteorological droughts by compensating for the lack of rain (this is relevant as irrigation provides 65% of the sector’s overall value); (c) the effect the Common Agricultural Policy; and (d) fluctuating prices, which compensate for lower production. Further research is therefore required to fully assess the economic impact of droughts using aggregated data.
Finally, our research demonstrated the importance of “green water” in irrigated areas, illustrating the fact that SEEA-Water’s definition of “soil water” is incomplete since it focuses exclusively on rain-fed agriculture. The volume of consumed soil water (green water) by irrigated crops makes up around 62% of their total water consumption in this basin, with blue water supplying only 38% of crop requirements (at global basin level).
To conclude, we confirm that the SEEA-Water accounts are a useful tool for the economic analysis of water use and the impact of climatic conditions, but this exercise has also demonstrated the limitations of using aggregated economic data and has shown there are still conceptual problems with the SEEA-Water definitions that need to be addressed.
Acknowledgments
The research behind this study was financed by the European Commission under the grant “System of Water Accounting in the Guadalquivir River Basin” (SYWAG). The authors wish to thank the Guadalquivir River Basin Authority for their support in acquiring the data used in this study. A preliminary version of the study was published in the Proceedings of Drought: Research and Science-Policy Interfacing Congress. Valencia, March 2015.
Author Contributions
The authors contributed equally to this work.
Conflicts of Interest
The authors declare no conflict of interest.
Abbreviations
The following abbreviations are used in this manuscript:
| SEEA | System of Environmental-Economic Accounting |
| DMP | Drought Management Plan |
| PETmax | Potencial Evapotranspiration |
| CAP | Common Agricultural Policy |
| GVA | Gross Value Added |
| GDP | Gross Domestic Product |
References
- Wilhite, D.A.; Glantz, M.H. Understanding: The drought phenomenon: The role of definitions. Water Int. 1985, 10, 111–120. [Google Scholar] [CrossRef]
- Linsley, R.K.; Kohler, M.A.; Paulhus, J.L. Hydrology for Engineers; McGraw-Hill: New York, USA, 1975. [Google Scholar]
- Meyer, V.; Becker, N.; Markantonis, V.; Schwarze, R.; van den Bergh, J.C.J.M.; Bouwer, L.M.; Bubeck, P.; Ciavola, P.; Genovese, E.; Green, C.; et al. Review article: Assessing the costs of natural hazards-state of the art and knowledge gaps. Nat. Hazards Earth Syst. Sci. 2013, 13, 1351–1373. [Google Scholar] [CrossRef]
- Martin-Ortega, J.; Markandya, A. The costs of drought: The exceptional 2007–2008 case of Barcelona. In BC3 Working Paper Series 2009–09; Basque Centre for Climate Change (BC3): Bilbao, Spain, 2009. [Google Scholar]
- United Nations. System of Environmental-Economic Accounting for Water (SEEA-Water); Department of Economic and Social Affairs, Statistics Division: New York, NY, USA, 2012. [Google Scholar]
- Guidance document on the application of water balances for supporting the implementation of the WFD; European Commission: Brussels, Belgium, 2015.
- Edens, B.; Graveland, C. Experimental valuation of Dutch water resources according to SNA and SEEA. Water Resour. Econ. 2014, 7, 66–81. [Google Scholar] [CrossRef]
- Pedro-Monzonís, M.; Jiménez-Fernández, P.; Solera, A.; Jiménez-Gavilán, P. The use of AQUATOOL DSS applied to the System of Environmental-Economic Accounting for Water (SEEAW). J. Hydrol. 2016, 533, 1–14. [Google Scholar] [CrossRef]
- Ma, Z.; Lui, S.; Wang, M. The compilation of physical water supply and use table in Zhangye City. In Proceedings of the 2012 International Symposium on Geomatics for Integrated Water Resources Management (GIWRM), Lanzhou, Gansu, China, 19–21 October 2012; pp. 1–4.
- Borrego-Marín, M.M.; Gutiérrez-Martín, C.; Berbel, J. Estimation of cost recovery ratio for water services based on the system of environmental-economic accounting for water. Water Resour. Manag. 2016, 30, 767–783. [Google Scholar] [CrossRef]
- Lange, G.-M.; Mungatana, E.; Hassan, R. Water accounting for the Orange River Basin: An economic perspective on managing a transboundary resource. Ecol. Econ. 2007, 61, 660–670. [Google Scholar] [CrossRef]
- Molden, D.; Murray-Rust, H.; Sakthivadivel, R.; Makin, I. A water-productivity framework for understanding and action. In Water Productivity in Agriculture: Limits and Opportunities for Improvement; Kijne, J., Barker, R., Molden, D., Eds.; CAB International: Wallingford, UK, 2003; pp. 1–18. [Google Scholar]
- Estrela, T.; Vargas, E. Drought Management Plans in the European Union. The Case of Spain. Water Resour. Manag. 2012, 26, 1537–1553. [Google Scholar] [CrossRef]
- Argüelles, A.; Berbel, J.; Gutiérrez-Martín, C. La evolución de la Cuenca del Guadalquivir (España). Rev. Obras Públicas 2012, 159, 51–64. (In Spanish) [Google Scholar]
- Berbel, J.; Kolberg, S.; Martin-Ortega, J. Assessment of the draft Hydrological Basin Plan of the Guadalquivir River Basin (Spain). Int. J. Water Resour. Dev. 2012, 28, 43–55. [Google Scholar] [CrossRef]
- Ministerio de Medio Ambiente (MIMAM). Plan de Choque de Modernización de Regadíos. Real Decreto 287/2006, de 10 de Marzo; MIMAM: Madrid, Spain, 2006. [Google Scholar]
- Berbel, J.; Gutiérrez-Martín, C.; Rodríguez-Díaz, J.A.; Camacho, E.; Montesinos, P. Literature review on rebound effect of water saving measures and analysis of a Spanish case study. Water Resour. Manag. 2015, 29, 663–678. [Google Scholar] [CrossRef]
- Confederación Hidrográfica del Guadalquivir (CHG). Plan Especial de Actuación en Situaciones de Alerta y Eventual Sequía de la Cuenca Hidrográfica del Guadalquivir; CHG: Seville, Spain, 2007. [Google Scholar]
- Berbel, J.; Pedraza, V.; Giannoccaro, G. The trajectory towards basin closure of a European river: Guadalquivir. Int. J. River Basin Manag. 2013, 11, 111–119. [Google Scholar] [CrossRef]
- Berbel, J.; Borrego-Marín, M.M.; Gutiérrez-Martín, C. System of Water Accounting in Guadalquivir River Basin (SYWAG); Final Report; Universidad de Córdoba: Córdoba, Spain, 2015. [Google Scholar]
- Alvarez, J.; Sanchez, A.; Quintas, L. SIMPA, a grass based tool for hydrological studies. Int. J. Geoinform. 2005, 1, 13–30. [Google Scholar]
- Berbel, J.; Mesa-Jurado, M.A.; Piston, J.M. Value of irrigation water in Guadalquivir Basin (Spain) by residual value method. Water Resour. Manag. 2011, 25, 1565–1579. [Google Scholar] [CrossRef]
- Young, R.A.; Loomis, J.B. Determining the Economic Value of Water: Concepts and Methods; RFF Press: New York, NY, USA, 2014. [Google Scholar]
- Borrego-Marín, M.M.; Perales, J.M.; Posadillo, A.; Gutiérrez-Martín, C.; Berbel, J. Analysis of Guadalquivir droughts 2004–2012 based on SEEA-W tables. In DROUGHT: Research and Science-Policy Interfacing, Proceeding of the International Conference on DROUGHT: Research and Science-Policy Interfacing; Valencia, Spain, 10–13 March 2015, Andreu, J., Solera, A., Paredes-Arquiola, J., Haro-Monteagudo, D., Van Lanen, H.A.J., Eds.; CRC Press: Leiden, The Netherlands, 2015; pp. 79–84. [Google Scholar]
- Cooley, H.; Donnelly, K.; Phurisamban, R.; Subramanian, M. Impacts of California's ongoing Drought: Agriculture; Pacific Institute: Oakland, CA, USA, 2015. [Google Scholar]
- Mallawaarachchi, T.; Adamson, D.; Chambers, S.; Schrobback, P. Economic Analysis of Diversion Options for the Murray-Darling Basin Plan: Returns to irrigation under reduced water availability. In A commissioned Study for the Murray-Darling Basin Authority; The University of Queensland: Brisbane, Australia, 2010. [Google Scholar]
- Carrasco, J.M.; Pistón, J.M.; Berbel, J. Evolution of water productivity in the Guadalquivir basin 1989–2005. Econ. Agrar. Recur. Nat. (Agric. Res. Econ.) 2010, 10, 59–69. [Google Scholar]
- García-Vila, M.; Lorite, I.J.; Soriano, M.A.; Fereres, E. Management trends and responses to water scarcity in an irrigation scheme of Southern Spain. Agric. Water Manag. 2008, 95, 458–468. [Google Scholar] [CrossRef]
- Junta de Andalucía. Agenda del Regadío Andaluz. Horizonte 2015; Consejería de Agricultura y Pesca: Seville, Spain, 2011. [Google Scholar]
- Confederación Hidrográfica del Guadalquivir (CHG). Plan Hidrológico de la Demarcación Hidrográfica del Guadalquivir; CHG: Madrid, Spain, 2013. [Google Scholar]
- Gómez-Limón, J.A.; Martin-Ortega, J. The economic analysis in the implementation of the Water-Framework Directive in Spain. Int. J. River Basin Manag. 2013, 11, 301–310. [Google Scholar] [CrossRef]
- Mallawaarachchi, T.; Adamson, D.; Hughes, N.; O’Donnell, C.; Quiggin, J. An economic analysis of the impact of the National Water Initiative on the efficiency and productivity of water use. The University of Queensland: Brisbane, Australia, 2011. [Google Scholar]
© 2016 by the authors; licensee MDPI, Basel, Switzerland. This article is an open access article distributed under the terms and conditions of the Creative Commons by Attribution (CC-BY) license (http://creativecommons.org/licenses/by/4.0/).


