Article

Monitoring of β-d-Galactosidase Activity as a Surrogate Parameter for Rapid Detection of Sewage Contamination in Urban Recreational Water

1
Norwegian Institute for Water Research, Gaustadalléen 21, 0349 Oslo, Norway
2
Norwegian University of Life Sciences, P.O. Box 5003, 1432 Ås, Norway
3
Colifast AS, Strandveien 33, 1366 Lysaker, Norway
4
Oslo Water and Sewerage Works, Postboks 4704 Sofienberg, 0506 Oslo, Norway
*
Author to whom correspondence should be addressed.
Water 2016, 8(2), 65; https://doi.org/10.3390/w8020065
Submission received: 11 December 2015 / Revised: 18 January 2016 / Accepted: 28 January 2016 / Published: 18 February 2016
(This article belongs to the Special Issue Pathogens in Water)

Abstract

:
Simple, automated methods are required for rapid detection of wastewater contamination in urban recreational water. The activity of the enzyme β-d-galactosidase (GAL) can rapidly (<2 h) be measured by field instruments, or a fully automated instrument, and was evaluated as a potential surrogate parameter for estimating the level of fecal contamination in urban waters. The GAL-activity in rivers, affected by combined sewer overflows, increased significantly during heavy rainfall, and the increase in GAL-activity correlated well with the increase in fecal indicator bacteria. The GAL activity in human feces (n = 14) was high (mean activity 7 × 10⁷ ppb MU/hour) and stable (1 LOG10 variation), while the numbers of Escherichia coli and intestinal enterococci varied by >5 LOG10. Furthermore, the GAL-activity per gram feces from birds, sheep and cattle was 2–3 LOG10 lower than the activity from human feces, indicating that high GAL-activity in water may reflect human fecal pollution more than the total fecal pollution. The rapid method can only be used to quantify high levels of human fecal pollution, corresponding to about 0.1 mg human feces/liter (or 103 E. coli/100 mL), since below this limit GAL-activity from non-fecal environmental sources may interfere.

1. Introduction

The monitoring of hygienic quality of recreational water is generally performed by culture based methods for detection of fecal indicator bacteria, like fecal coliforms, Escherichia coli and intestinal enterococci, which take 18–48 h before the result is available. Several water samples are analyzed on preset dates during the bathing season, and at the end of the season the bathing beaches are classified based on a set of criteria [1]. Such monitoring and classification of beaches into quality classes (excellent, good, sufficient or poor) give a good impression of the general hygienic water quality at the beach. However, for urban recreational areas with sporadic poor water quality due to short-term pollution, for example if the area is located near discharges from combined sewer overflows (CSOs), results from routine monitoring are of limited value for real-time decision-making.
In such areas, rapid, simple methods that provide an estimate of the level of fecal contamination in the water are needed for supporting decisions about whether to give advice against recreational activities and if so, for how many days after a short-term pollution event. Such rapid methods are also useful for detection of wastewater contamination and location of its points of ingress into storm sewer systems, e.g., due to cross-connection in separate sewer systems, illicit connections or overflows and leakages through broken sewers [2].
An alternative indicator can be defined as an organism or non-biological constituent of fecal pollution or sewage that is used to indicate the presence of fecal pollution. Constituents can range from commensal organisms found only in one type of host species to viruses, caffeine, or optical brighteners [3]. Epidemiological studies and quantitative microbial risk assessment indicate a stronger association between fecal indicators and waterborne diseases when sewage contamination is present compared to the presence of fecal pollution from non-human (animal) sources [4,5]. One reason for this may be that viruses, which are human-specific, cause over half of gastroenteritis cases associated with recreational water use worldwide [6]. A rapid method that mainly reflects the level of sewage/human fecal pollution, and to a lower extent the sporadic fecal contribution from birds/animals, may therefore potentially better reflect the risk of gastroenteritis associated with recreational activities. Methods for detection of human specific markers (based on PCR) have been developed and are useful for microbial source tracking [3], but the methods are still too complicated to be implemented in fully automated on-line instruments and require special laboratory facilities and trained personnel.
Measurement of enzyme activities in water samples, like the β-d-galactosidase (GAL)- or β-d-glucuronidase (GLU) activity, is less complicated, and easy-to-use field kits and automated on-line instruments have been developed [7,8,9]. GAL activity is suggested as a rapid “early warning” indicator of gross sewage contamination [10,11,12]. The enzyme GAL hydrolyzes β-d-galactosides, including lactose, to monosaccharides by cleaving the β-glycosidic bond formed between a galactose and a second moiety. Several substrates, mainly chromogenic and fluorogenic, have been developed to measure the activity of this enzyme [13]. Common culture-based methods for detection of coliform bacteria or fecal coliform bacteria are based on growth of the coliform bacteria on solid- or in liquid media, which contain inhibitors to suppress the growth of non-target bacteria, inducers to induce the formation of GAL and chromogenic/fluorogenic substrates, with subsequent detection of a fluorescent or colored end product. The sum of selective growth and GAL activity ensure the specificity of such methods [14]. By using sensitive instruments for detection of the end product, GAL activity can also often be measured directly in contaminated environmental water samples without pre-cultivation [15]. Such direct measurement of GAL activity in a water sample is not a measurement of culturable coliform bacteria, but of all enzymes (compounds that may hydrolyze the actual substrate) initially present in the water samples [12,16]. The enzyme GAL is ubiquitous in nature and has been isolated from bacteria, yeasts, molds, plants and animals [17]. The activity per cell may, however, vary among the different species/strains, and high temperature (44 °C) during the measurement may to some extent select for the detection of activity from heat-stabile enzymes [18]. GAL synthesis is, in some strains, induced by lactose or galactose and repressed in the presence of glucose [19], e.g., E. coli grown in the presence of the inducer isopropyl-β-d-thiogalactopyranoside (IPTG) showed >3 LOG10 higher GAL activity than E. coli grown in the absence of an inducer [18]. Since the incubation time in rapid methods (<2 h) is too short to induce the synthesis of new enzymes [20], the measured GAL activity of a water sample will depend on the “historical” growth conditions of the organisms that have synthesized the enzymes.
Some beaches are exposed to birds and bird feces, or feces from other animals, which periodically may influence the measured number of fecal indicator bacteria. It may be hypothesized that the GAL activity in human feces (and sewage), due to the human diet, is relatively higher than in some other potential sources of GAL activity, e.g., birds and adult animals feces. This hypothesis was further tested in the presented paper.
The aim of the present study was (1) to measure the GAL activity relative to other fecal indicators in different fecal sources, like sewage, human and animal feces, as well as in recreational water and river water exposed to combined sewer overflows during heavy rainfall, for evaluating its usefulness as a rapid indicator of sewage contamination in urban areas and (2) to test and demonstrate measurement of the GAL activity in urban river water in a fully automated set-up.

2. Materials and Methods

2.1. Collection of Water and Fecal Samples

2.1.1. River Water Samples

Automatic water samplers (Avalanche Teledyne ISCO) with coolers (3 ± 2 °C) were used for automatic sampling of river water samples before and after heavy rainfall events (total of 45 samples from 4 different rivers). The autosamplers were started prior to a heavy rainfall event, and 0.9-L river water samples were automatically collected in separate clean bottles every hour for the next 14 h. The water samples were then transported to the laboratory (30 min transport time) and analyzed immediately, and always within 24 h after the first sample was taken. Initial studies (not presented) showed that storage of the water samples in the dark at 3 ± 2 °C (in flasks in the autosampler) for 24 h did not significantly reduce the numbers of E. coli The purpose was to investigate to what extent the hygienic water quality in the river was affected by the heavy rainfall event, and whether the rapid method based on direct measurement of GAL-activity was able to determine the deterioration of the hygienic water quality. Samples were collected from four different urban rivers/streams in Oslo: (1) Hoffselva, which is a recipient for several CSOs; (2) Mærradalsbekken, which is generally affected by leakages from sewer pipes, but less CSOs (3) Hovinbekken, a highly contaminated stream in the city center and (4) Ljanselva, a generally less contaminated river, but a recipient for a few CSOs. None of the rivers/streams are used for bathing, but they all discharge into the Inner Oslofjord, close to areas that are used for bathing/recreational activities.

2.1.2. Municipal Wastewater, Black Water and Human Feces

Crude sewage samples were collected at the Skiphelle wastewater treatment plant (Drøbak, Norway, about 12,000 persons (PE) connected) on 8 June 2015 and 28 October 2015 at 9:00. Three samples of municipal wastewater were also collected from a municipal wastewater pipe from an area in Ås municipality (Norway) with about 500 PE connected, on 18 November 2014 at 9:00, 13:00 and 17:00. From another area in Ås municipality, where grey water and black water is separated and there are 48 PE connected, three samples of black water were collected 3 November 2014 at 10:30, 13.30 and 15:00. The samples were immediately analyzed for fecal indicator bacteria and GAL activity as described in Section 2.4 and Section 2.5).
Samples of fresh human feces were diluted 1:10 in phosphate-buffered saline (PBS), with further ten-fold dilutions, including vigorous vortex-mixing, before analysis of fecal indicator bacteria and GAL activity. A total of 14 fecal samples were tested, from 8 different healthy persons (4 of them tested several times, with minimum 3 weeks between each sample), from 5 different families, age 0.5–44 years.

2.1.3. Bird Feces from Local Beaches

Fresh fecal droppings from birds were collected from two local beaches; the coastal beach Kadettangen and the fresh water beach Bogstadvannet. Mixed-samples were prepared by mixing 0.1–0.2 g of individual samples: Sample 1 consisted of a mixture of swan and geese feces from 4 different fresh fecal droppings (collected at Kadettangen), sample 2 consisted of a mixture of 10 different fresh fecal droppings (mainly from swans, collected at Kadettangen), and sample 3 consisted of a mixture of 6 different fecal droppings (most probably from ducks, collected at Bogstadvannet). The fecal samples were immediately transported to the laboratory, dissolved in PBS in 10-fold dilution series with vigorous vortex-mixing, and the feces dilutions were thereafter analyzed for fecal indicator bacteria and GAL activity.

2.1.4. Feces from Farm Animals

Fresh fecal droppings from 8 individual young and adult cattle and 5 individual young and adult sheep were collected from Bogstad farm. All the animals were located indoors, still eating winter fodder. We were not able to collect feces from newborns (only fed with milk). The fecal samples were immediately transported to the laboratory, dissolved in PBS in 10-fold dilution series with vigorous vortex-mixing, and the feces dilutions were thereafter analyzed for fecal indicator bacteria and GAL activity.

2.1.5. Bathing Water Samples from Beaches

Bathing water samples from beaches (38 seawater samples and 11 fresh water samples from rivers) in the Oslo area were collected in 0.5-L sterile bottles. The samples were taken by holding the bottles about 30 cm beneath the surface in water that was 50–100 cm deep. The samples were transported to the laboratory within 2 h, stored at 4 °C and analyzed within 24 h. In general, the bathing water samples at the coastal beaches were collected on days after rainfall events.

2.2. Determination of Precipitation and Water Flows in Rivers

Data on precipitation were obtained from the Norwegian Metrological Institutes webpage [21] Data from the nearest weather stations were used (average of several stations) and are reported as the amount of precipitation that was registered in the hour before the sample was taken. Data on water flows in the rivers were obtained from the Oslo water and sewerage works.

2.3. Reference Methods for Detection of Fecal Indicator Bacteria

E. coli was enumerated using the IDEXX Colilert 18® Quanti-Tray/2000 method (ISO 9308-2). As specified in the standard, the marine water samples were diluted 1:10 in sterile distilled water before analysis. The results are given as most probable number (MPN). Intestinal enterococci and fecal (thermotolerant) coliforms (FC) were quantified after membrane filtration using the ISO 7899-2 method and the NS 4792 method, respectively. The results are given as colony forming units (cfu).

2.4. Field Kit for Measurement of GAL Activity

A water sample/feces-dilution (10 mL) was mixed with 10 mL 2xColifast 6 medium (Colifast AS, Lysaker, Norway), which contained the substrate 4-methylimbelliferyl-β-d-galactoside, for detection of GAL activity, in pre-filled vials. The vials were placed in a water bath at 44 °C, and the fluorescence development was measured by analyzing 3 mL sub-samples in a fluorimeter (Colifast microdetector, excitation at 365 nm, emission at 440 nm, Colifast AS, Lysaker, Norway), after 15, 30, 60 and 120 min. A blank, containing medium and distilled water, was always included. The pH was increased by adding 33 µL 0.5 M NaOH to the cuvettes before the fluorescence measurement. The Colifast microdetector was calibrated with known concentrations of 4-Methylumbelliferone (MU) and the GAL activity of the sample was measured as the slope, i.e., production of MU per hour (ppb MU/hour), as further described in the manufacturer’s protocol (Colifast AS, Lysaker, Norway). Based on historical data from the manufacturer (previous correlations between FC and GAL activity), the measured GAL activity was converted to a fecal coliform estimate (rapid FC-estimate), using the Formula (1):
Rapid-FC-estimate (FC/100 mL) = 200 × GAL-activity (measured as ppb MU/h)

2.5. CALM Test for Automated Measurement of the GAL Activity in the Akerselva River

An automated instrument CALM (Colifast AS, Lysaker, Norway) was located at Myraløkka (Akerselva River in Oslo) and used for daily sampling of the river water during the bathing season. Normally the instrument is set up in a format allowing for specific detection of culturable FC after a 9–12-h incubation period, and the Most Probable Number is calculated based on fluorescence production in 5 vials with growth medium and a 0.06-mL water sample added to each vial [22]. For further reducing the detection time, a format based on direct measurement of GAL activity was tested over a 3-week period in the summer 2014. The method included automated daily pumping of 10 mL of river water into vials pre-filled with 5 mL 3xColifast 6 medium. The vials were incubated at 44 °C and the fluorescence development was measured by automated analysis of 3 sub-samples. The GAL activity, calculated as MU production per hour (ppb MU/h), was available 2.5 h after the sample was taken. Based on the measured GAL activity, a rapid FC-estimate was calculated as described above. For comparison, water samples (n = 13) were manually taken from the river at the same time as the sample was taken by CALM, and analyzed for FC by the reference method.

2.6. Effect of Salinity on the Measurement of GAL Activity

Since the measurement of GAL activity in this study was performed with a simple method of direct mixing of the water sample with the medium, constituents in the water sample may potentially affect the measured enzyme activity. To test the effect of salts on the measured GAL-activity, crude sewage was diluted 1:200 or 1:1000 in water with different salt contents before the measurement of the GAL activity. The following diluents were tested: (1) Deep sterile seawater from Oslofjord with salinity 34 PFU; (2) Deep seawater diluted with distilled water to obtain salinity 17 PFU (to mimic brackish water) and (3) Deep seawater diluted with distilled water to obtain salinity 3.4 PFU, and in another experiment: (1) Distilled water added to 34 g/L NaCl; (2) Distilled water added to 17 g/L NaCl and (3) Distilled water added to 3.4 g/L NaCl.

2.7. Statistical Analysis

For investigating potential correlation between GAL activity and the numbers of E. coli in the fresh water samples, the numbers were presented in logarithmic scale. The coefficient of determination (R2) of log10-transformed values was calculated (linear regression) using Microsoft Excel.
A classical paired t-test statistics was performed to investigate if there were any significant (p < 0.05) differences between the rapid FC estimate obtained by CALM in the Akerselva River and the reference FC method.

3. Results

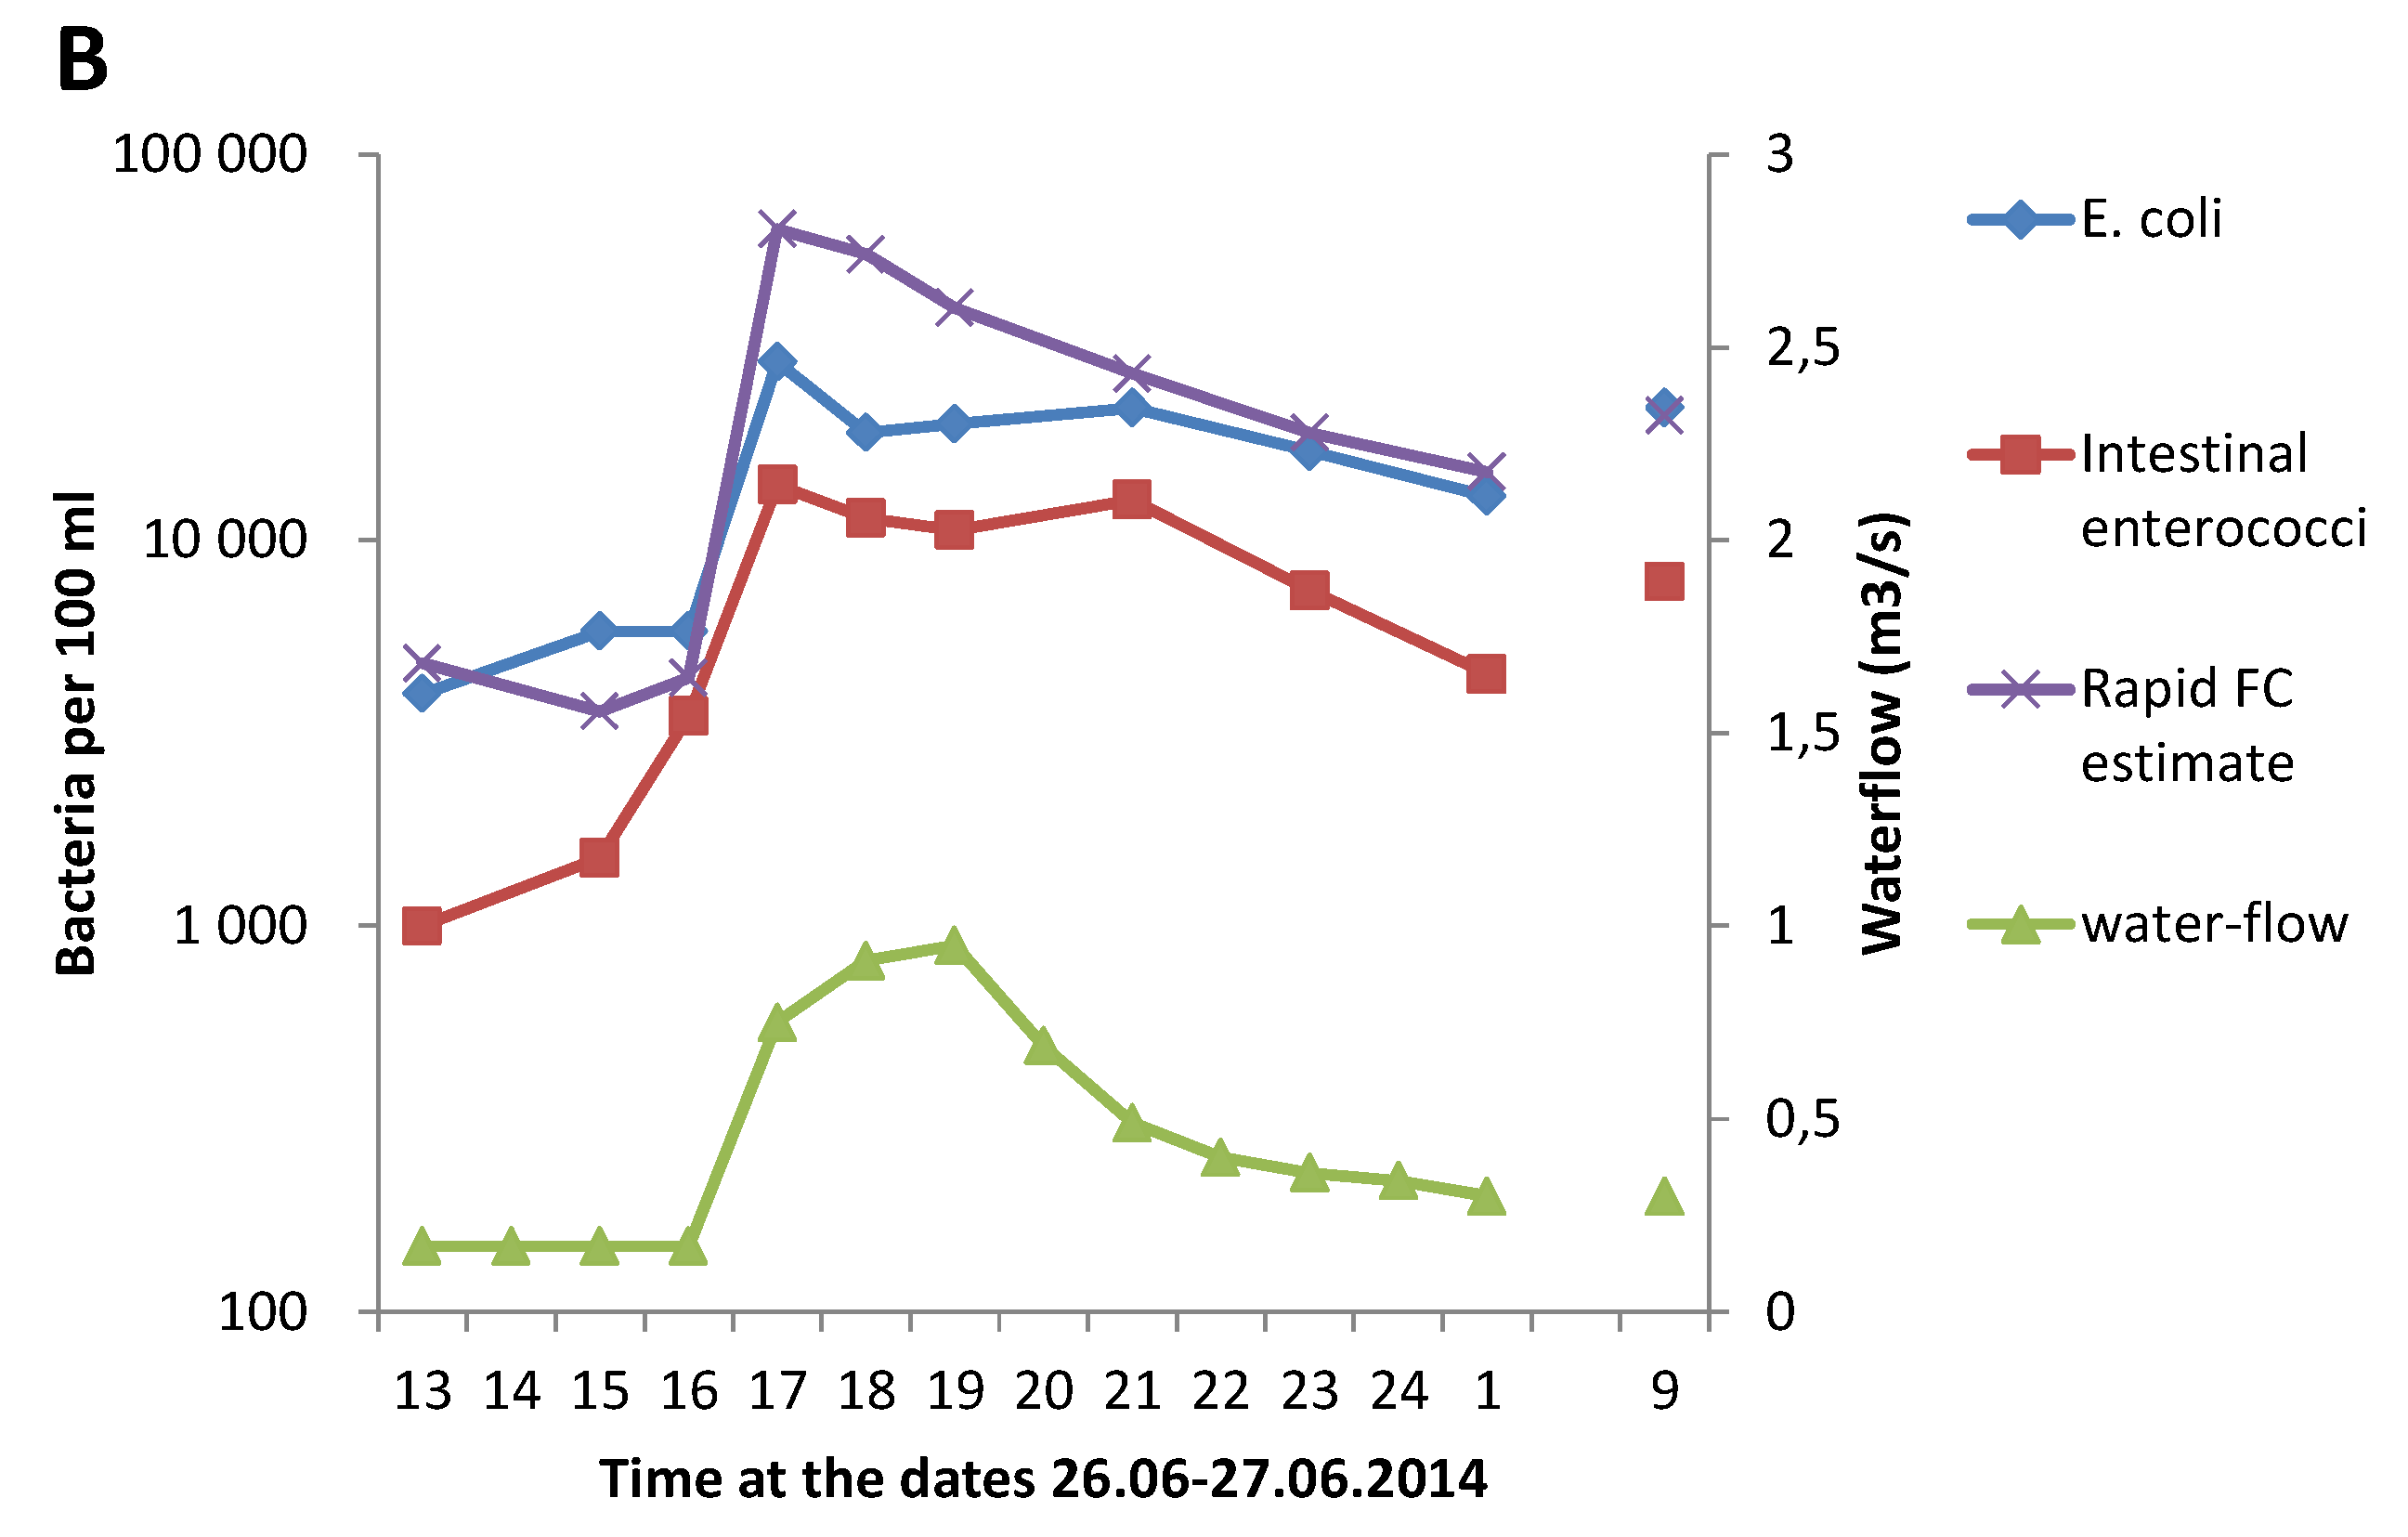
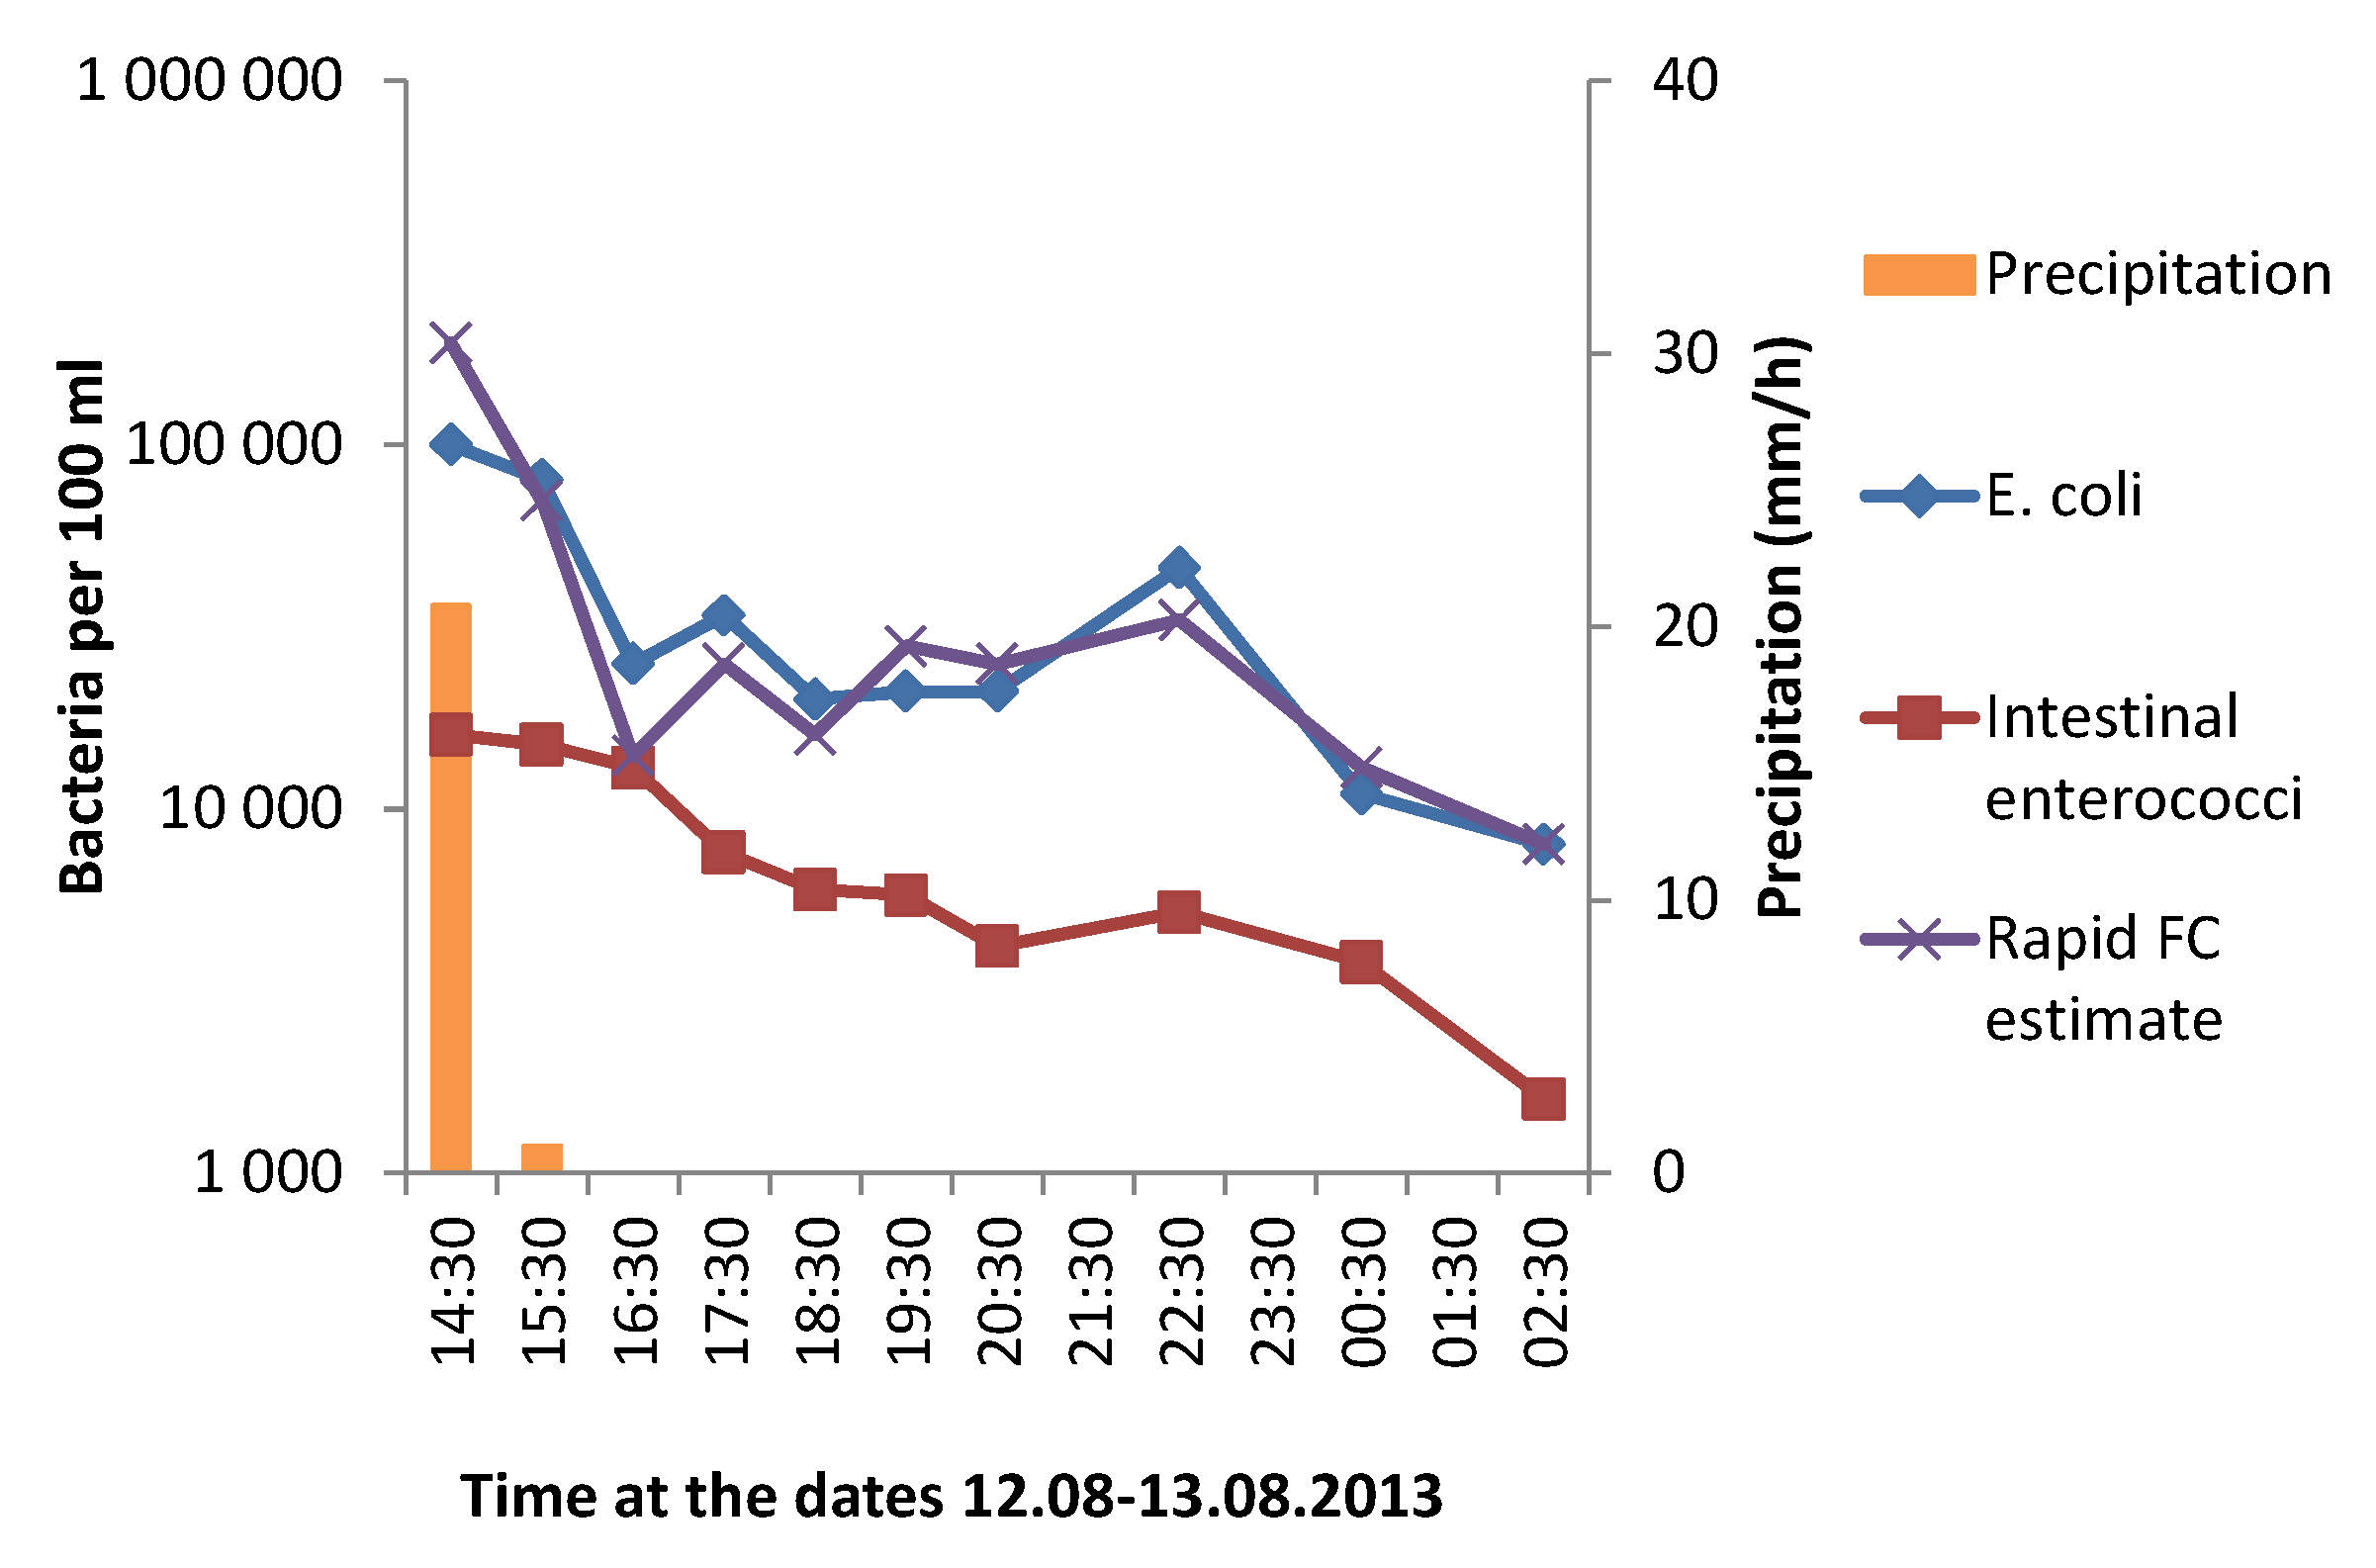
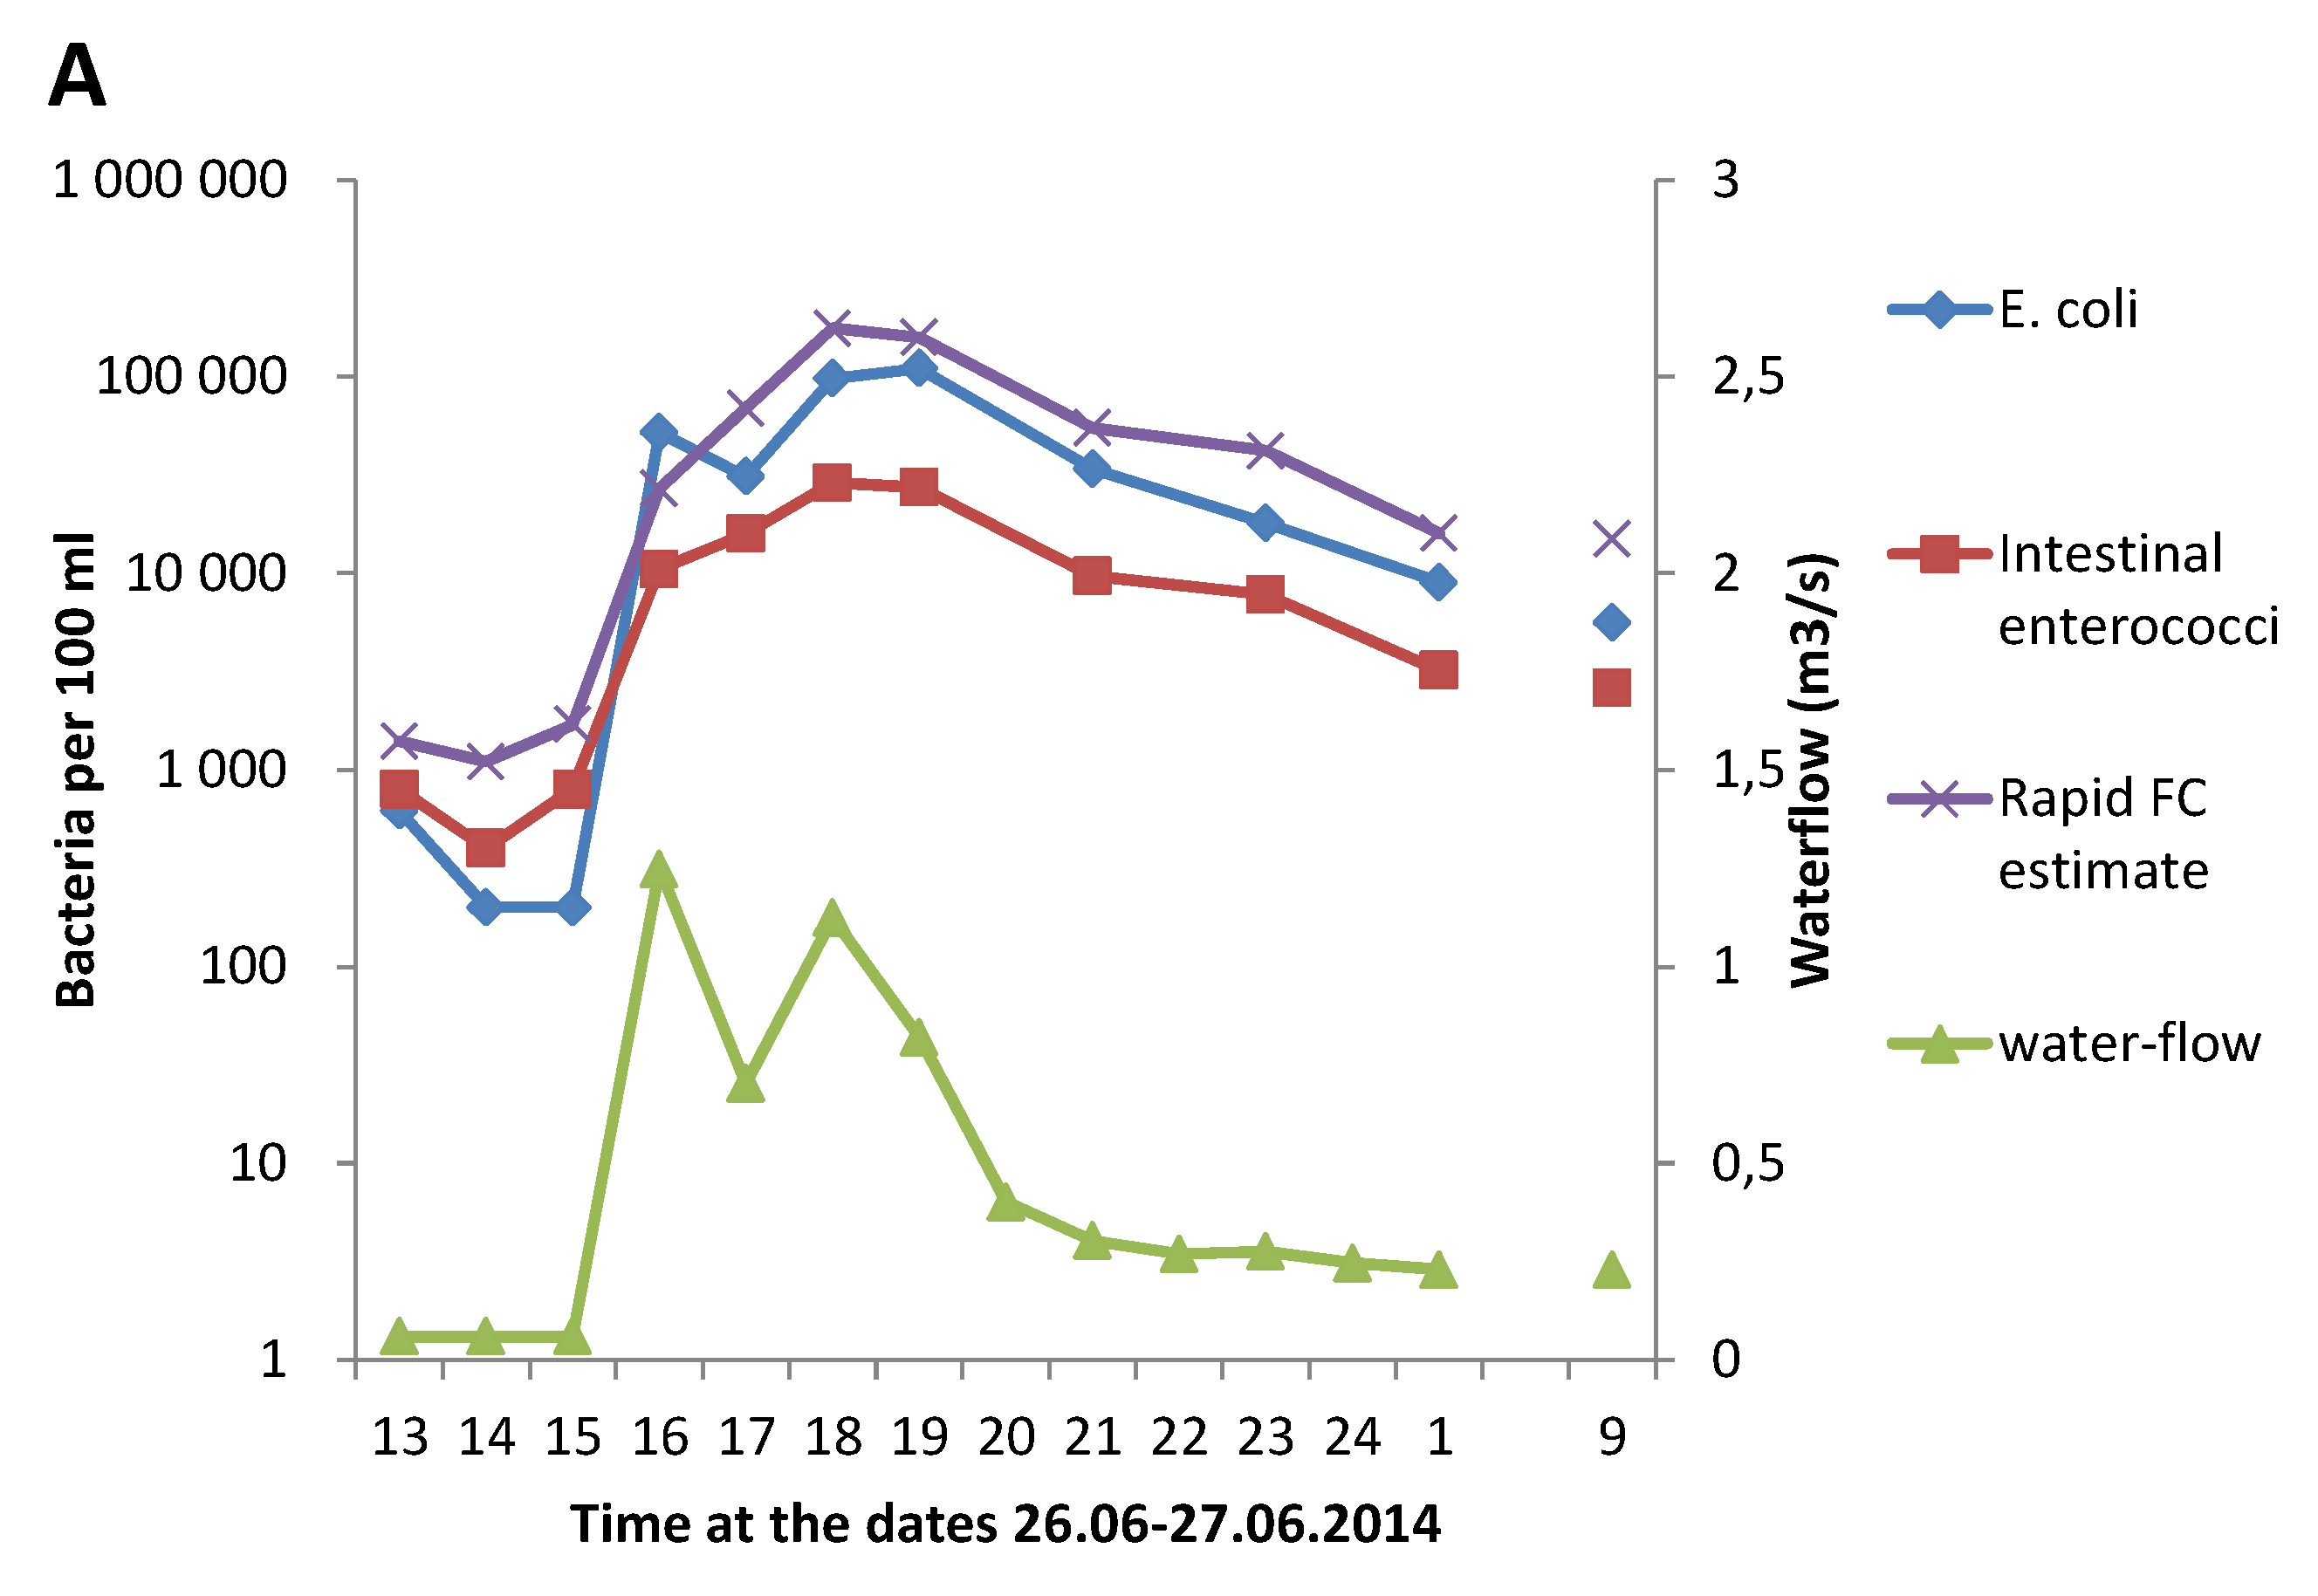
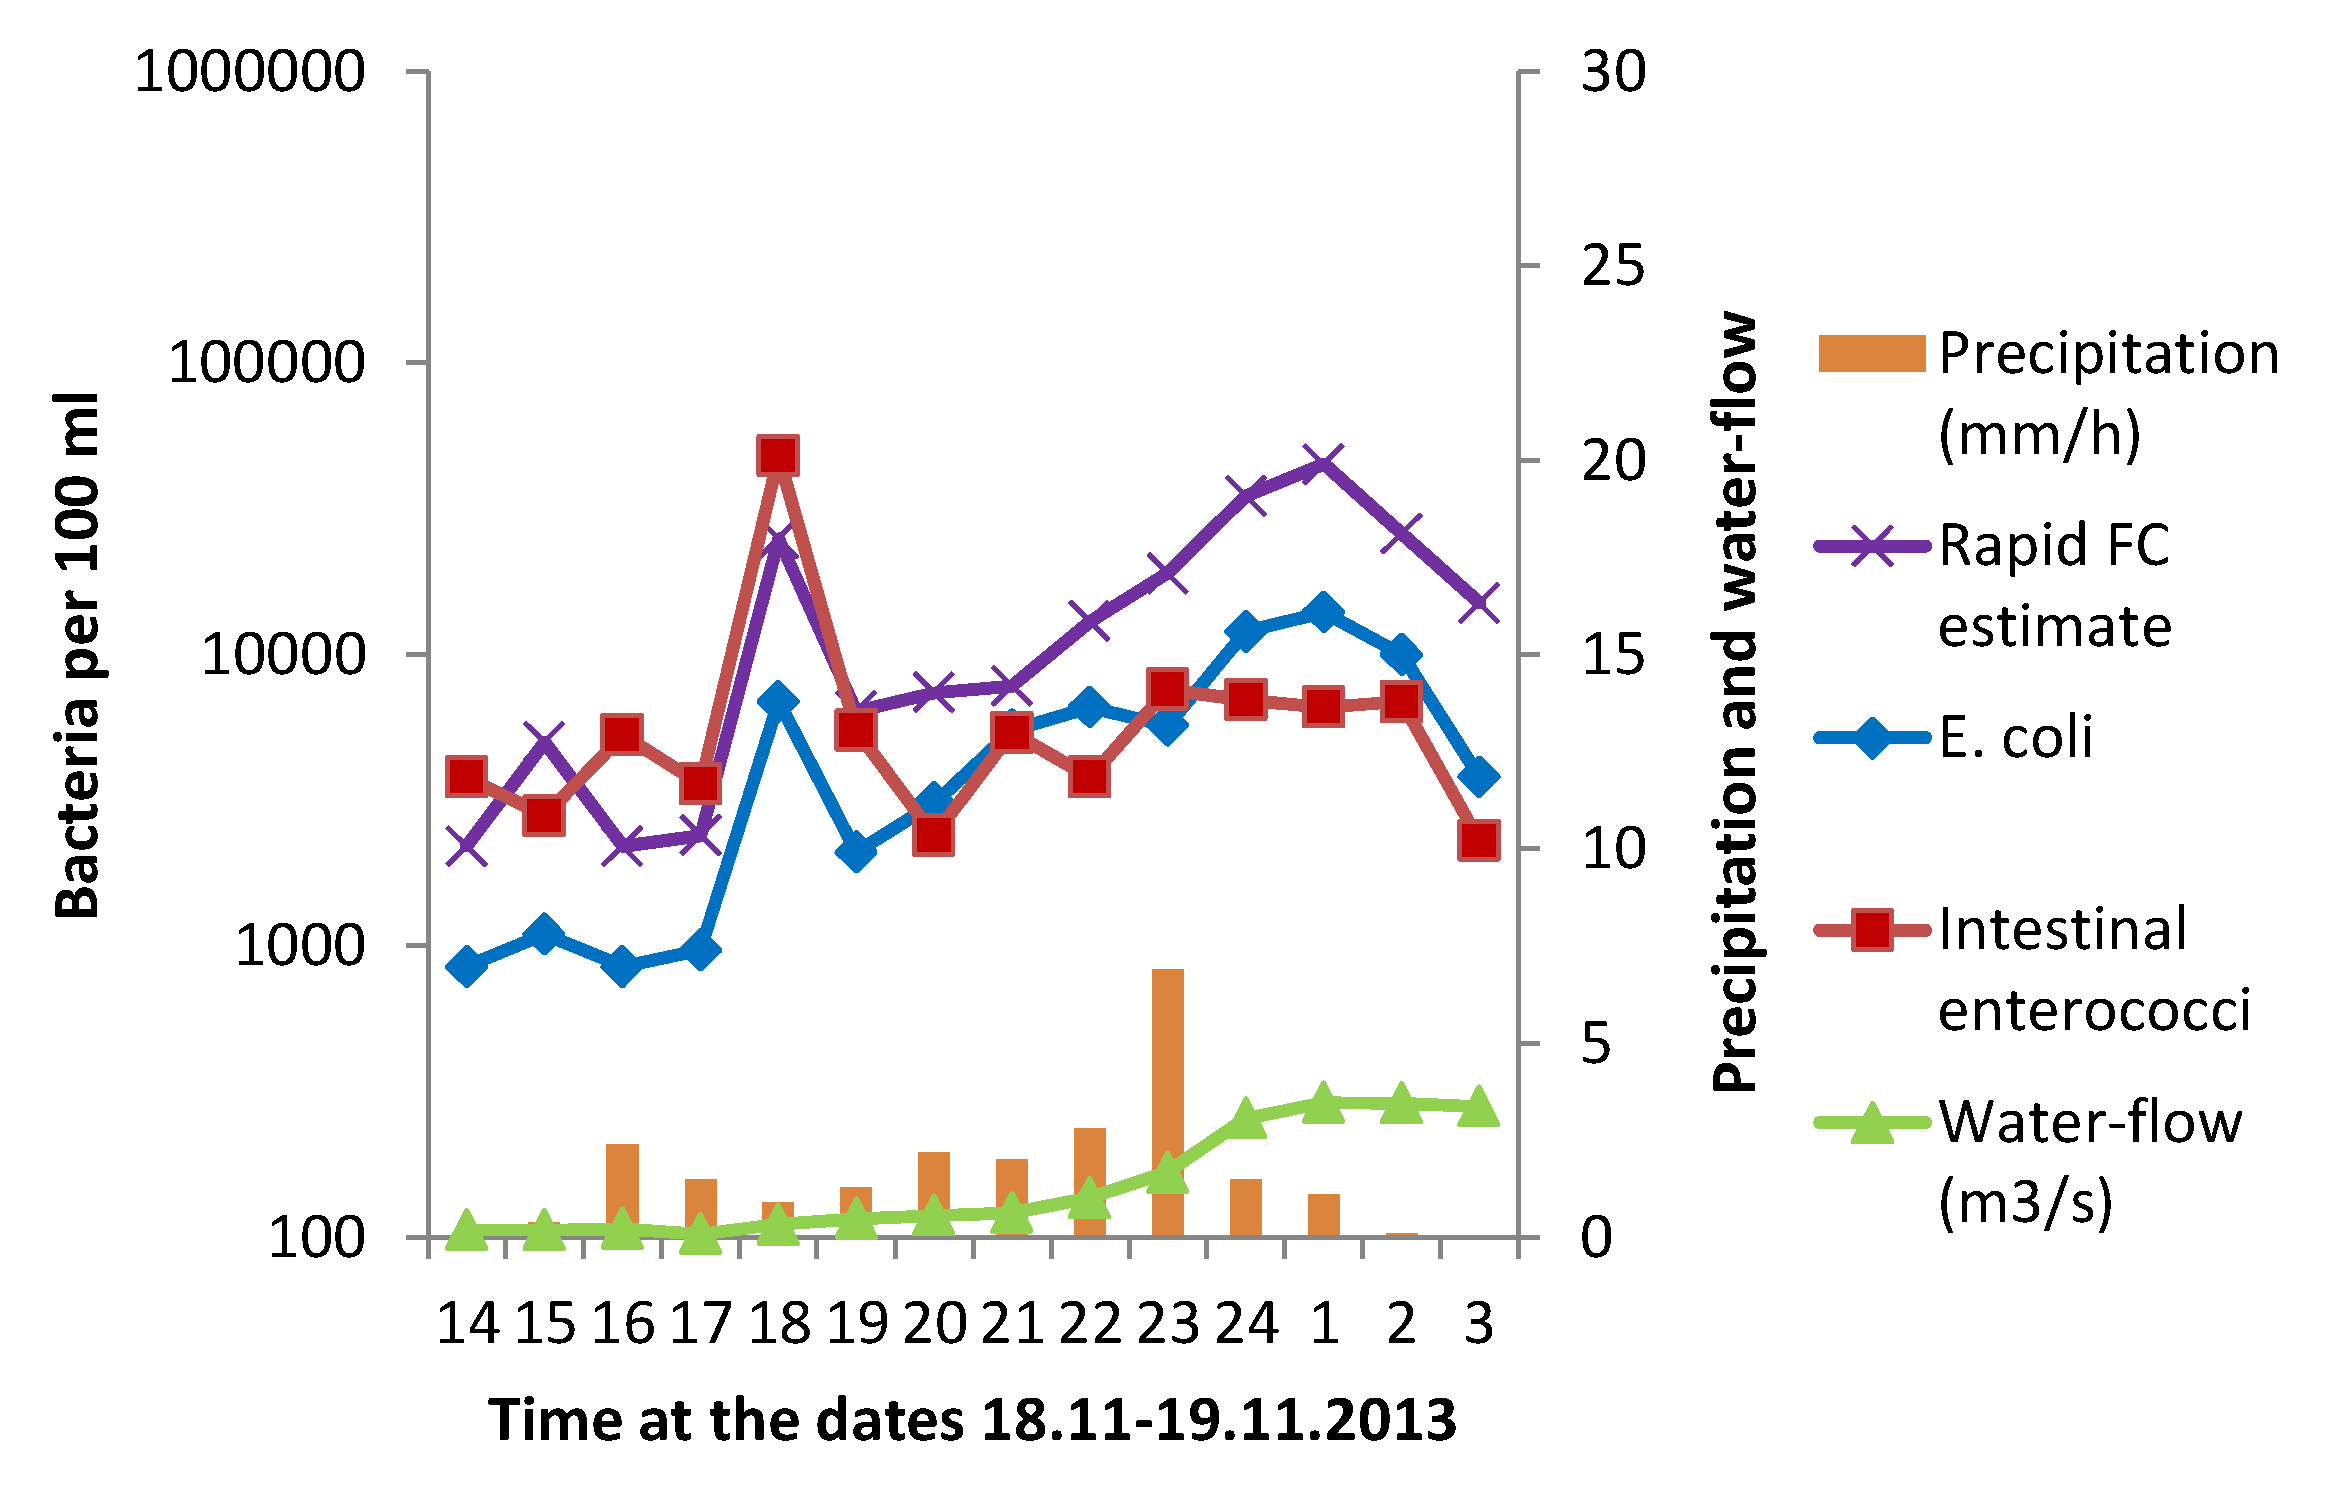
3.1. Effect of Heavy Rainfall on the Water Quality in Urban Rivers

The heavy rainfall strongly reduced the hygienic water quality in all of the tested urban rivers (Figure 1, Figure 2 and Figure 3), especially in the Hoffselva River where the E. coli concentration increased from <1000 E. coli per 100 mL before the rainfall to >100,000 E. coli per 100 mL during/immediately after the heavy rainfall (Figure 1A). The rapid FC estimate, calculated from the measured GAL activity, showed similar trends as E. coli; a deterioration in the hygienic water quality during/immediately after the heavy rainfall and some improvements in the hours after the rainfall (Figure 1, Figure 2 and Figure 3).

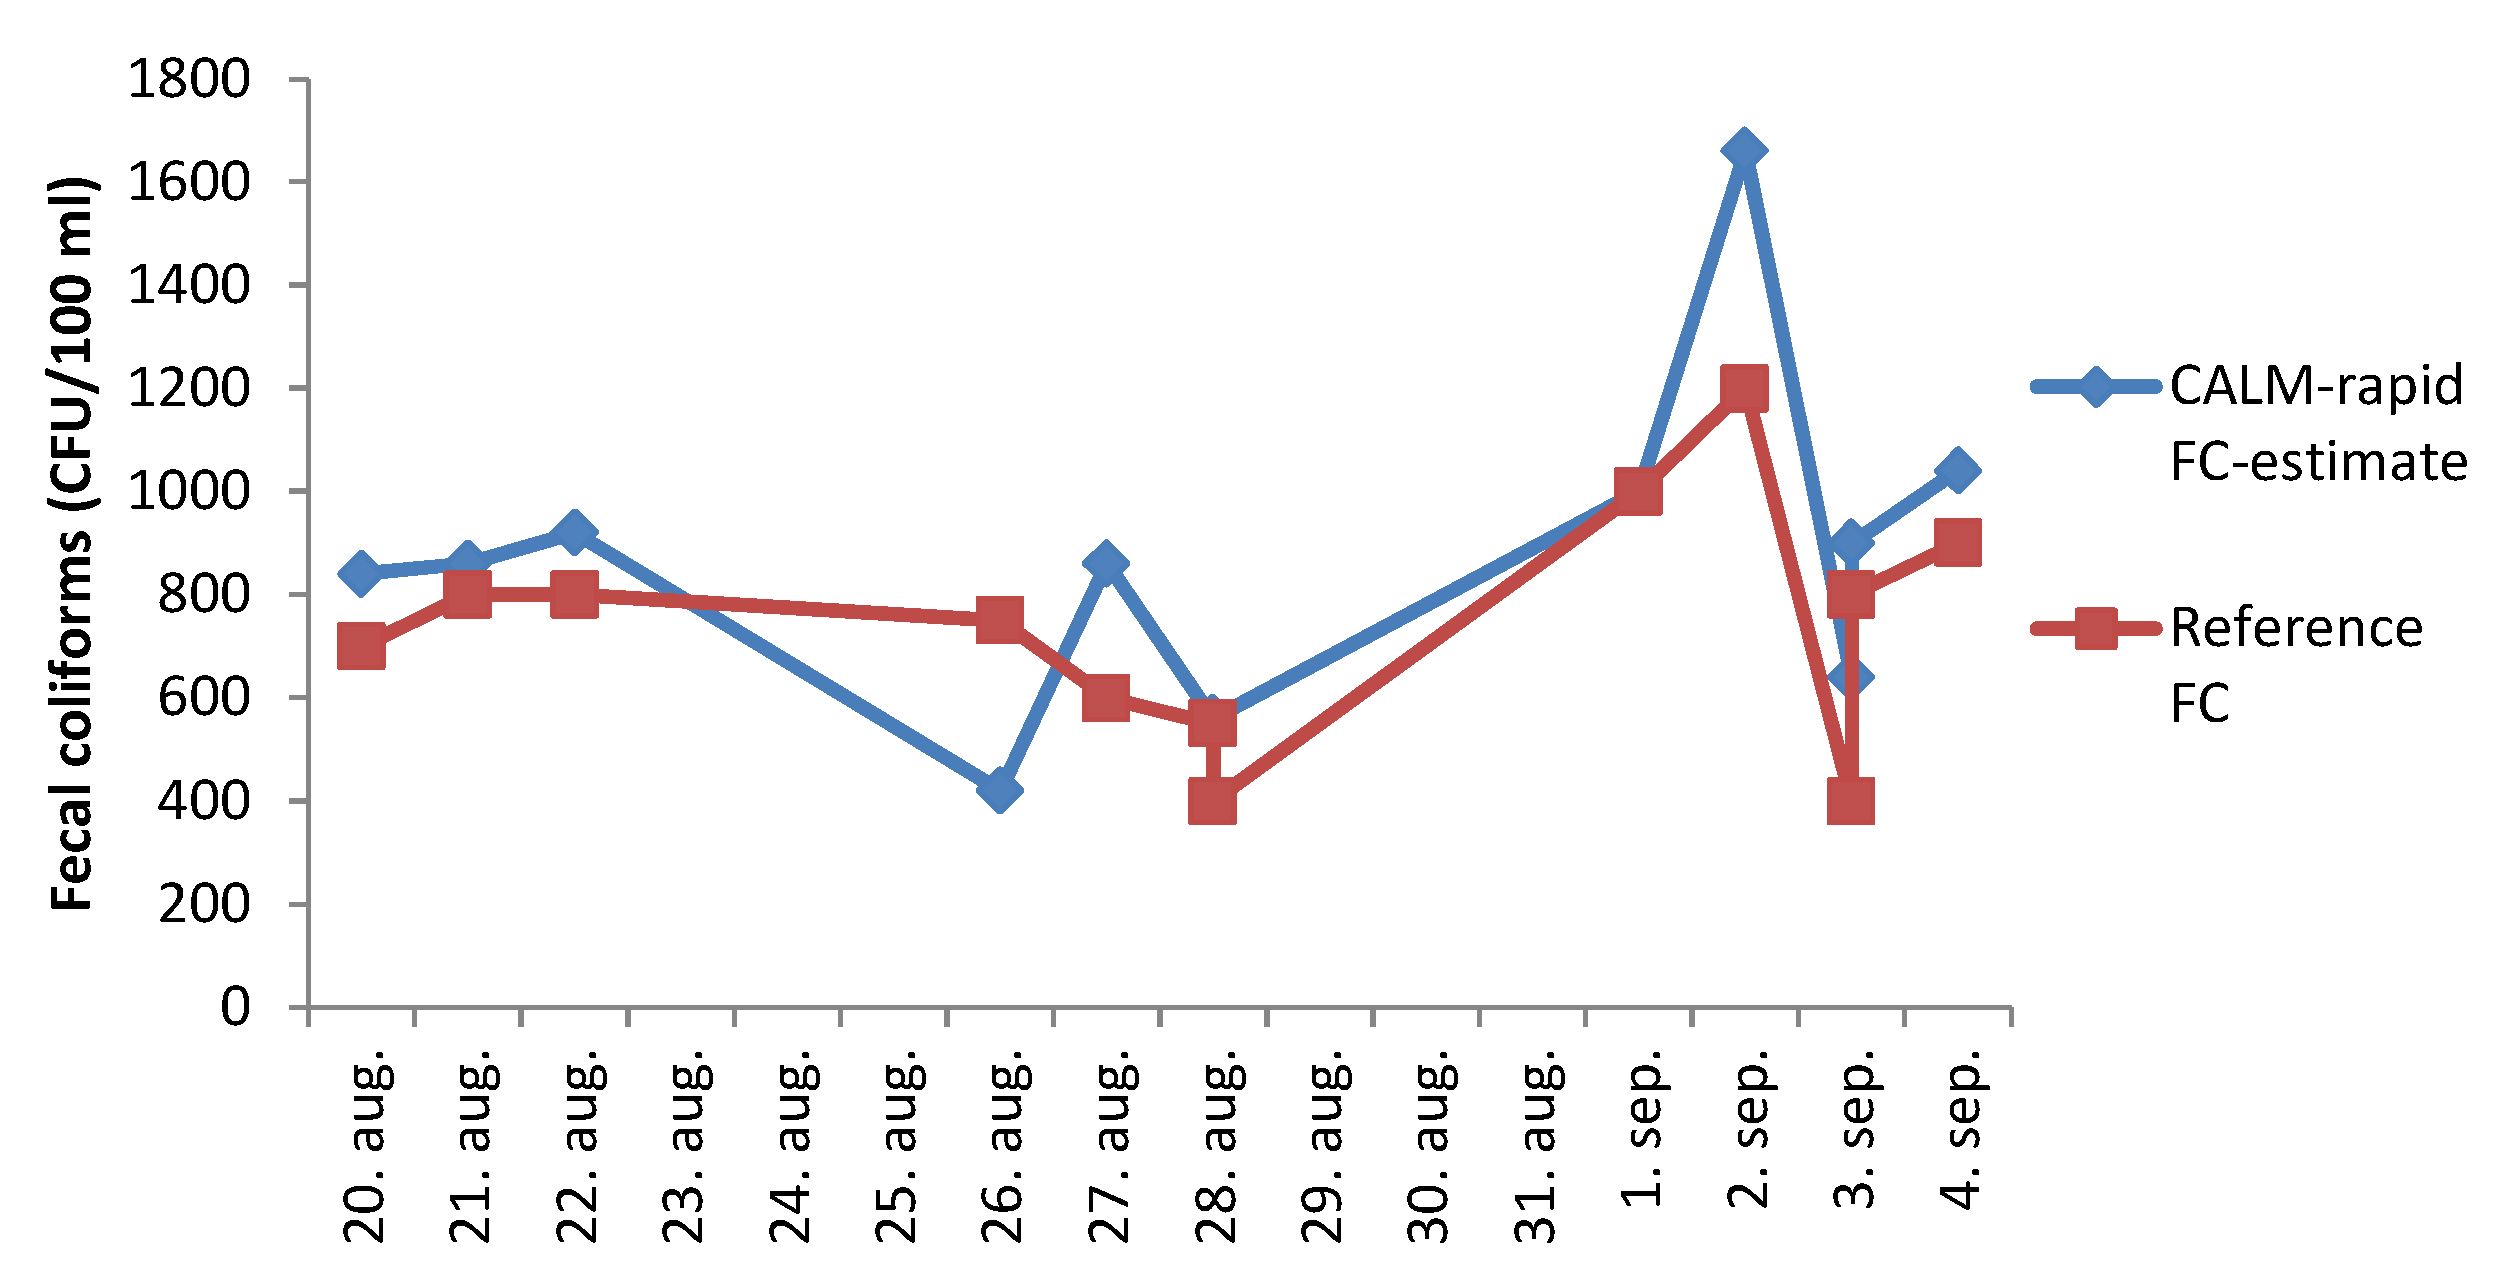
3.2. Test of a Fully Automated Instrument for Measurement of GAL Activity in River Water

The rapid FC estimate, calculated from the measured GAL activity by the fully automated CALM instrument, in the Akerselva River (at Myraløkka) during the late bathing season in 2014, also showed good agreement with the reference method for FC (Figure 4), i.e., no significant difference between the two methods (p > 0.05). Technically, the CALM instrument was shown to work well for measurement of GAL activity in this 2-h rapid format, demonstrating its usefulness as an instrument for automated and rapid detection of high levels of fecal contamination in urban rivers.

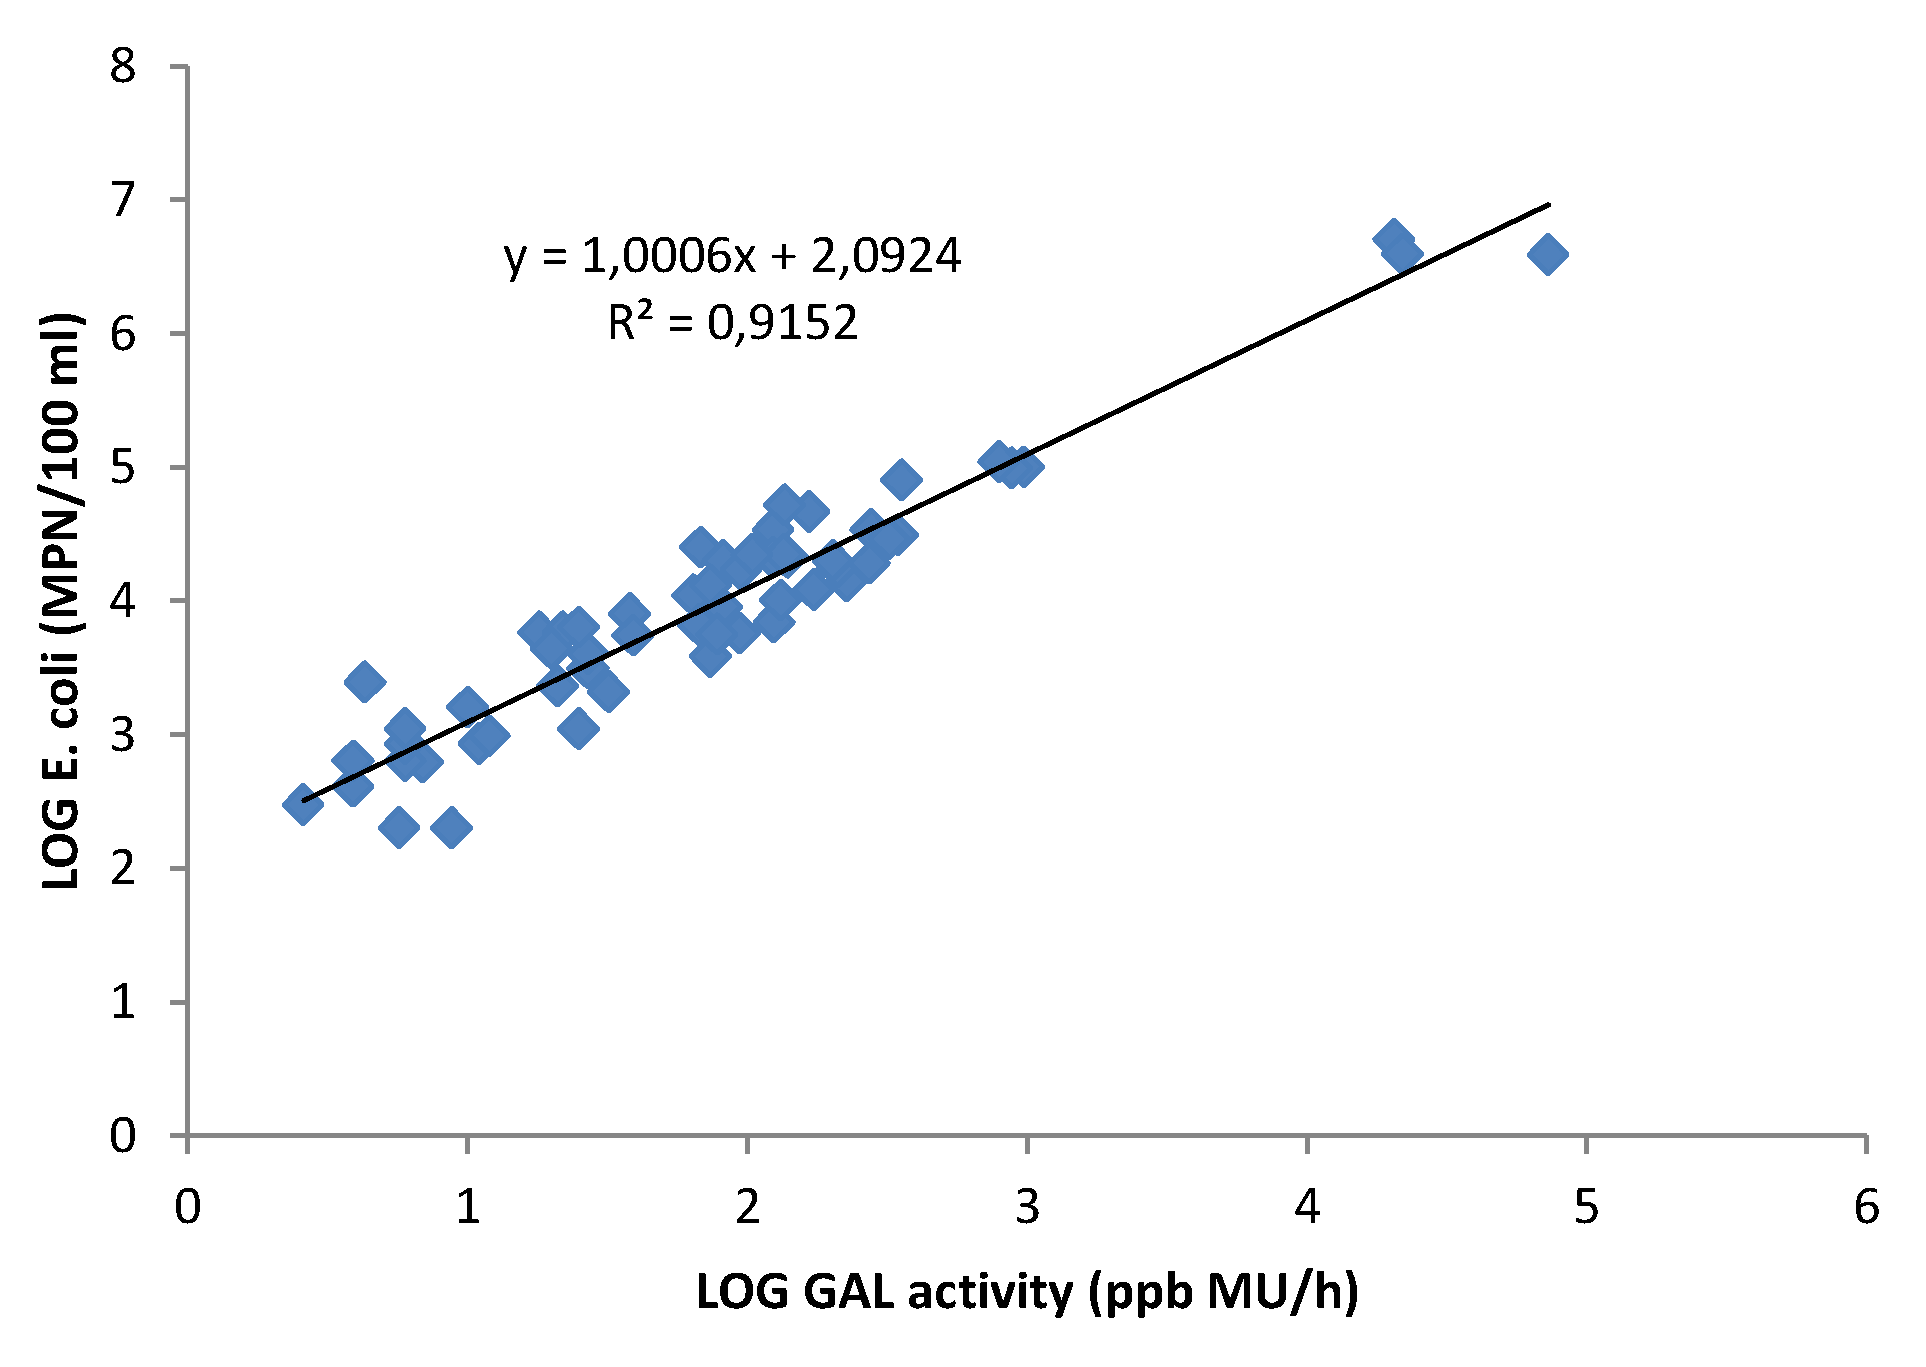
3.3. Correlation between GAL Activity and E. coli in Fresh Water Samples

For the fresh-water samples analyzed in the project (N = 59), i.e., samples mainly from urban rivers and three samples of municipal wastewater, a good correlation (LOG-LOG-plot) was observed between the measured GAL-activity and the E. coli concentration, with a slope of 1.00 and a R2 of 0.92 (Figure 5). If the three points representing sewage were not included in the linear regression, a slope of 1.00 was still observed (y = 1.00x + 2.09), but the R2 was lower (R2 = 0.86). The slope 1.00 indicates a similar ratio between GAL activity and E. coli in the sewage (high numbers of E. coli) and in the urban river water samples. Based on these results, a simple formula (2) for converting the measured GAL activity to a rapid E. coli estimate was suggested:
Rapid E. coli-estimate (E. coli/100 mL) = 150 × GAL-activity (measured as ppb MU/h)
which was quite similar to the formula for converting GAL activity to a rapid FC estimate as described above.
According to the European bathing water directive [1], the quality of bathing water (fresh water) is considered good if the calculated 95-percentile does not exceed 1000 E. coli/100 mL. If 1000 E. coli/100 mL is set as a threshold for “poor bathing water quality”, the corresponding GAL activity indicating poor quality (measured by this specific method) is then 6.7 ppb MU/h.

3.4. Influence of Salinity on the Direct Measurement of GAL Activity

The concentration of E. coli in most (33 of 38) of the water samples collected from coastal beaches (salt water) in the Inner Oslofjord was less than 1000 E. coli per 100 mL and the GAL activity was below 6.7 ppb MU/h (Table 1), even though the samples in general were collected after rainfall events when high levels of fecal contamination were expected. In two of the samples, both high GAL activity and high E. coli concentrations were measured (Table 1), but in three of the samples, a low GAL activity was measured in water where the E. coli number was high (>1000 E. coli per 100 mL).
Since the measurement of GAL activity was performed with a simple method of direct mixing of the water sample (10 mL) with medium (10 mL), constituents in the water sample may potentially affect the measured enzyme activity, and the potential influence of salts on the measured GAL activity was tested in laboratory experiments. A minor effect was seen when sewage was diluted in water with high salinity (34 PSU), where the measured GAL activity was reduced to 65%–70% compared with the activity measured in sewage diluted in water with low salinity (Table 2).

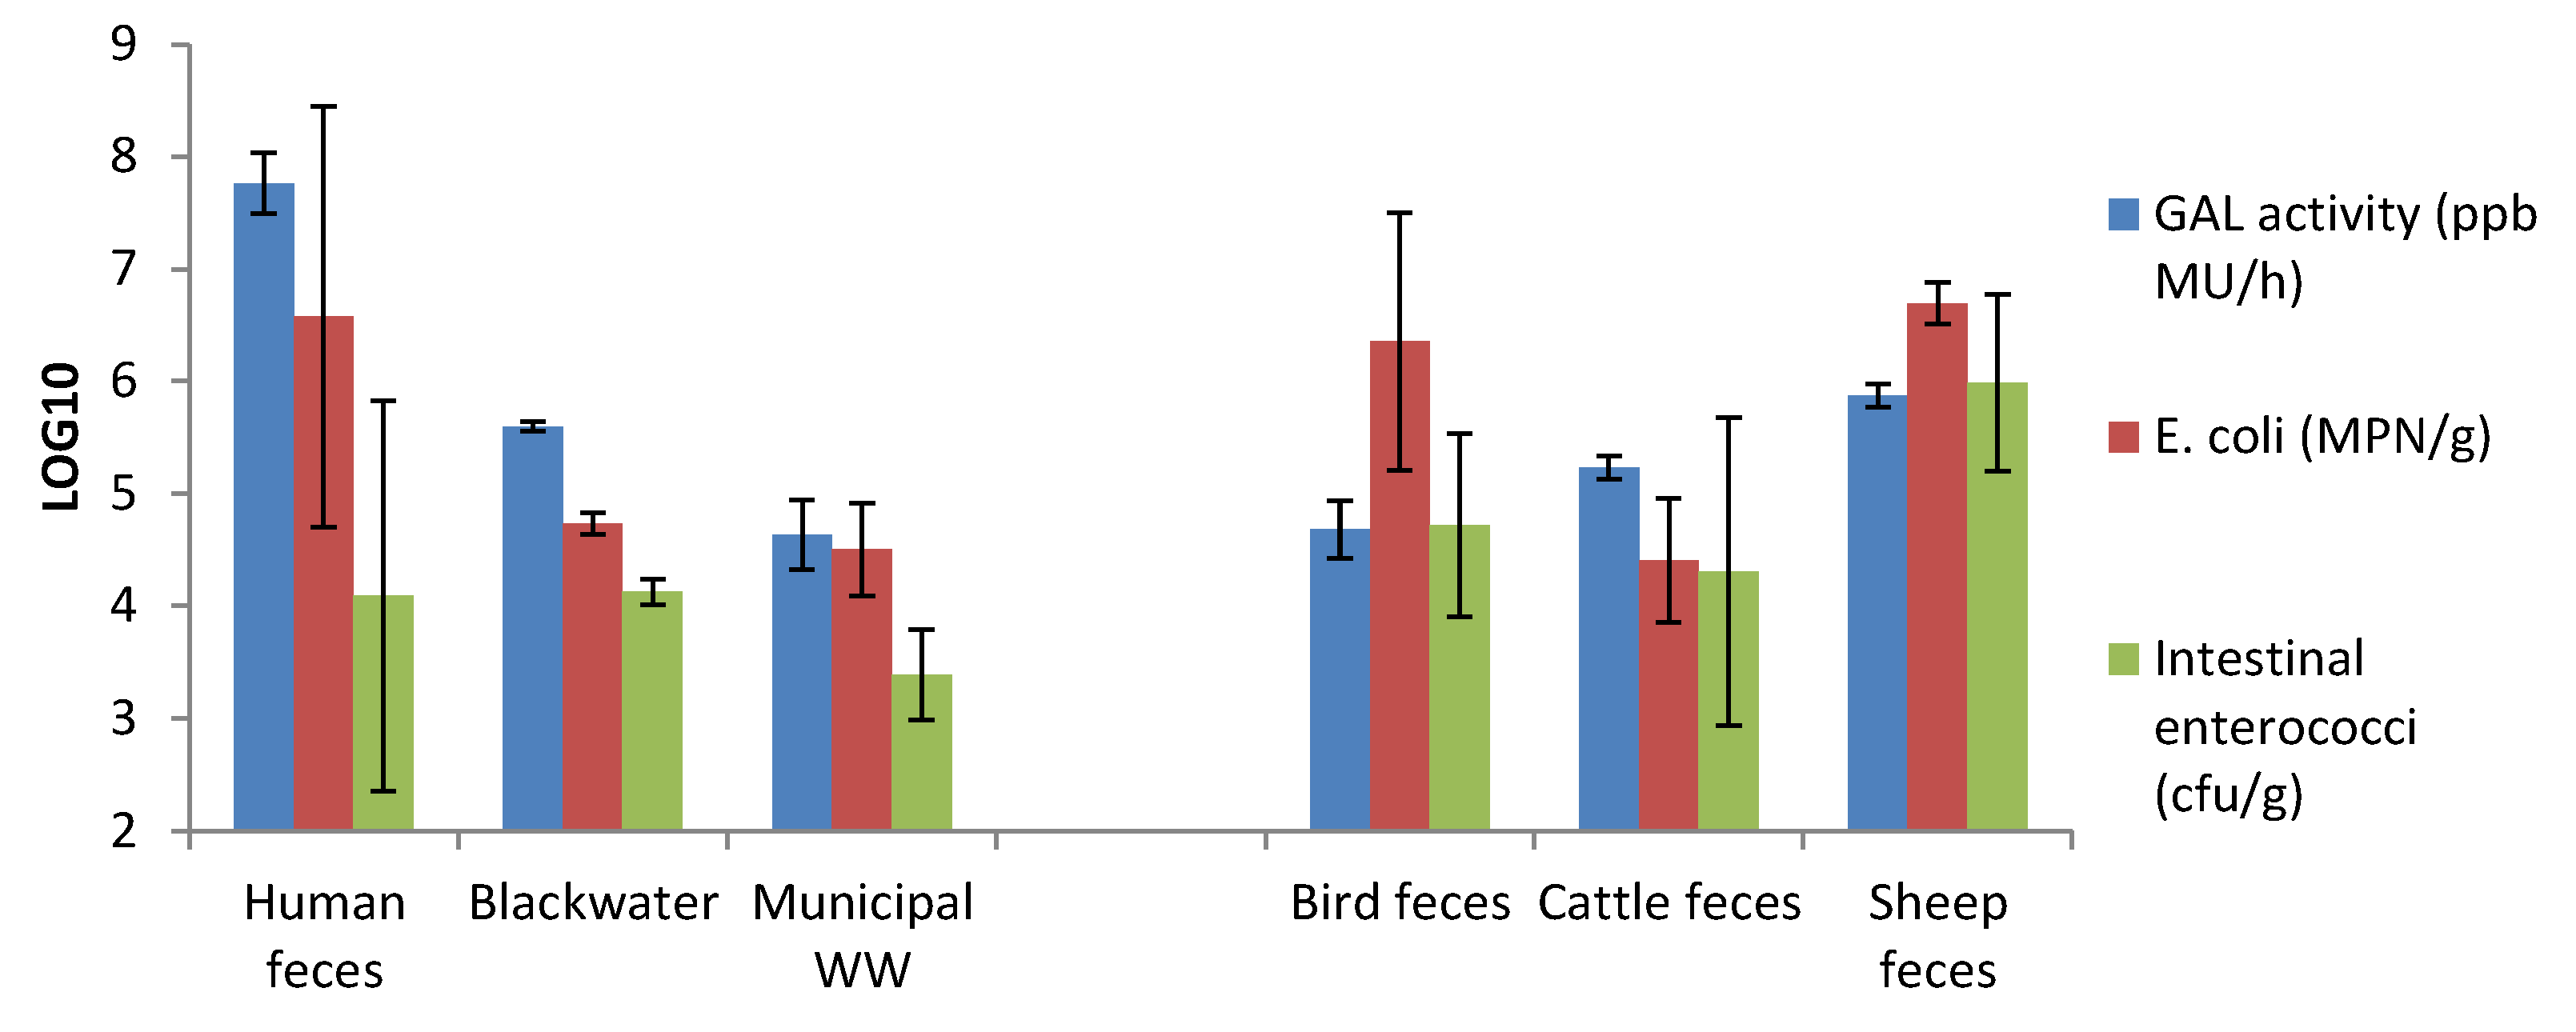
3.5. GAL Activity in Human and Animal Feces

Since large flocks of birds were located on the beaches where high numbers of E. coli were measured in the bathing water, but with low GAL activity, work was initiated for measurement of GAL activity and E. coli in bird feces relative to human feces.
The GAL activity was high in all the measured human fecal samples (n = 14), with only 1.0 LOG10 variation between the highest and the lowest value (Table 3). The concentration of E. coli varied much more, with >6.5 LOG10 difference between the highest and the lowest measured value. In addition, the numbers of intestinal enterococci varied by >5.7 LOG10 (Table 3).
Based on the measured GAL activity in human feces (Table 3), the limit suggested for poor bathing water quality, i.e., 6.7 ppb MU/h (about 1000 E. coli/100 mL) corresponds to an average of 0.1 mg human feces/L.
The GAL activity of the measured black water and municipal wastewater was about 0.6% and 0.07%, respectively, of the average GAL activity of human feces, indicating that the black water contained an average of 6 g feces per L and the municipal wastewater contained an average of about 0.7 g feces per L. Since the black water and municipal wastewater originate from several persons (natural average), the variation of E. coli and intestinal enterococci in individual samples of these waters was lower than the variations in individual human fecal samples (Figure 6).
The GAL activity per gram of bird and animal feces was significantly lower than in human feces, i.e., in average 3 LOG10 lower in bird feces and 2 LOG10 lower in sheep feces (Figure 5). E. coli per gram of bird feces was, however, not significantly lower than in the human feces (logarithmic mean), and these results supported our hypothesis that the GAL activity in human feces (and sewage), probably due to the human diet, is relatively higher than in some other potential sources of GAL activity in urban bathing water, like birds and adult animal feces.

4. Discussion

Several studies have shown quite a good correlation between GAL activity or GLU activity and fecal indicator bacteria in water samples, but some studies have shown no or low correlation, in particular at low levels of fecal contamination [11,12,23,24,25,26]. The present study also indicated a low correlation between GAL activity and E. coli in coastal water at levels <1000 E. coli per 100 mL, but too few samples were included to determine a potential relationship. Lack of correlation has been explained by enzyme activity from sources other than the culturable fecal indicator bacteria (E. coli, FC or total coliforms) that were used for comparison, for example, activity from non-fecal sources like algae and marine vibrios, non-specific cell-free enzymes or other cell-free substances capable of hydrolyzing the actual substrate, GAL-positive fecal microorganisms others than coliforms or by active, but non-culturable coliforms, and variations in the contribution from such sources [11,12,23,24,25,26]. Disinfection or environmental stresses are shown to reduce the number of culturable fecal indicator bacteria more than the GAL activity, which may often explain why the enzyme activity is high even if the numbers of culturable coliforms are low [27,28,29,30].
In the present study, the GAL-activity per gram of feces from birds was found to be 3 LOG10 lower than the activity per gram of human feces, even though the E. coli numbers per gram of bird- and human feces (logarithmic mean) were not significantly different. This may explain why the GAL-activity at some bird-affected urban beaches was low, even though the E. coli numbers were high. A minor reduction (less than 50%) of the GAL activity was also observed if the salinity of the water sample was increased, which may further affect the correlation between GAL activity and E. coli in coastal water. High levels of suspended solids or chemicals are also reported to potentially reduce the enzyme activity of water samples [31,32].
The GAL-activity per gram of feces from sheep and cattle was also lower than from human feces (about 2 LOG10). Only a few samples of animal feces were analyzed, from animals from the same farm with a quite similar diet, so further studies are required to obtain a more comprehensive picture of the variations in GAL activity in feces from different animals, at different age groups and diets. In a study by Rada et al. (2010), the GAL activity in calf feces was found to be similar to the activity in feces from infants [33]. Our initial work, however, indicate that high levels of GAL-activity in urban water samples may reflect the impact of human fecal pollution to a greater extent than the total fecal pollution.
This study also indicates that the main GAL activity in human feces is caused by sources other than culturable coliforms, since the GAL activity was high and relatively constant in all of the tested human feces samples, but the E. coli/coliform numbers varied by >6.5 LOG10. The human gut contains a significant number of different bacteria, which are potential contributors to the total fecal GAL-activity [34,35]. Measurement of GAL activity therefore represents an alternative indicator of fecal contamination than the traditional culturable coliforms, FC or E. coli. Although the E. coli and intestinal enterococci numbers showed high variation within the individual human fecal samples, the average of all of the individual samples was as expected, based on levels in sewage and black water (which represent a natural average from several persons).
Davies and Apte (2000) reported that at FC concentrations above 2.3 × 10³ cfu/100 mL in environmental water samples, the GAL activity was related to FC concentration, but below this concentration, a large background signal was observed, which was independent of the FC concentration [11]. Despite this apparent limitation, the GAL measurement was concluded to have potential as an early warning indicator of treatment process failure and gross sewage contamination and leakage in situations where FC concentrations exceed 2.3 × 10³ cfu/100 mL. This conclusion was supported by the results from this study, where a good correlation was observed between the GAL activity and E. coli in samples taken from urban rivers before, during and after heavy rainfall. The ratio between GAL activity and E. coli was similar in sewage and in the urban river water (slope = 1.00 in LOG-LOG-plot), indicating that fresh sewage was the main source of fecal contamination in the rivers during the rainfall episodes.

5. Conclusions

Bird feces were shown to contain low GAL activity, but high levels of E. coli, which may explain why rapid methods based on GAL measurement do not always detect high levels of E. coli at some bird-affected beaches. The GAL activity of all of the tested human fecal samples was, however, high and stable, and the GAL activity of sewage-polluted river water correlated well with the presence of fecal indicator bacteria. A rapid method based on GAL measurement can only be used to quantify high levels of human fecal pollution, corresponding to about 0.1 mg human feces/liter (or 103 E. coli/100 mL) since below this limit, GAL-activity from non-fecal environmental sources may interfere. However, since the GAL activity can easily be measured by field instruments, or as shown in the present study, by a fully automated instrument, it may be a useful surrogate parameter for detecting high levels of sewage contamination in urban waters. The simple method, based on direct mixing of the water sample and medium, is best suited for fresh water, since high salt concentrations were shown to reduce the GAL activity.

Acknowledgments

The research reported herein was funded by the Research Council of Norway (Regionale Forskningsfond Hovedstaden) through the WaterQualityTools Project (217576/97227). The authors are also grateful to Anastasiia Oliinyk (NMBU) and colleagues from Colifast AS and Oslo VAV for their work related to the project and for provision of data.

Author Contributions

Ingun Tryland initiated the project. Field work and/or laboratory work were performed by all authors. Henrik Braathen and Anna-Lena Beschorner were responsible for the field testing using CALM. Ingun Tryland drafted the manuscript, which was revised substantially by all authors.

Conflicts of Interest

One of the authors (Henrik Braathen) is employee at Colifast AS. The other authors declare no conflict of interest.

References

  1. European Union. Directive 2006/7/ec of the European Parliament and of the Council of 15 February 2006 Concerning the Management of Bathing Water Quality and Repealing Directive 76/160/eec. Available online: http://eur-lex.Europa.Eu/legal-content/en/txt/?Uri=celex:32006l0007 (assessed on 11 November 2015).
  2. Panasiuk, O.; Hedstrom, A.; Marsalek, J.; Ashley, R.M.; Viklander, M. Contamination of stormwater by wastewater: A review of detection methods. J. Environ. Manag. 2015, 152, 241–250. [Google Scholar] [CrossRef] [PubMed]
  3. McLellan, S.L.; Eren, A.M. Discovering new indicators of fecal pollution. Trends Microbiol. 2014, 22, 697–706. [Google Scholar] [CrossRef] [PubMed]
  4. Colford, J.M.; Schiff, K.C.; Griffith, J.F.; Yau, V.; Arnold, B.F.; Wright, C.C.; Gruber, J.S.; Wade, T.J.; Burns, S.; Hayes, J.; et al. Using rapid indicators for enterococcus to assess the risk of illness after exposure to urban runoff contaminated marine water. Water Res. 2012, 46, 2176–2186. [Google Scholar] [CrossRef] [PubMed]
  5. Schoen, M.E.; Ashbolt, N.J. Assessing pathogen risk to swimmers at non-sewage impacted recreational beaches. Environ. Sci. Technol. 2010, 44, 2286–2291. [Google Scholar] [CrossRef] [PubMed]
  6. Ahmed, W.; Harwood, V.J.; Gyawali, P.; Sidhu, J.P.S.; Toze, S. Comparison of concentration methods for quantitative detection of sewage-associated viral markers in environmental waters. Appl. Environ. Microbiol. 2015, 81, 2042–2049. [Google Scholar] [CrossRef] [PubMed]
  7. Zuckerman, U.; Hart, I.; Armon, R. Field evaluation of colilert 3000 for ground, raw and treated surface water and comparison with standard membrane filtration method. Water Air Soil Pollut. 2008, 188, 3–8. [Google Scholar] [CrossRef]
  8. Ryzinska-Paier, G.; Lendenfeld, T.; Correa, K.; Stadler, P.; Blaschke, A.P.; Mach, R.L.; Stadler, H.; Kirschner, A.K.T.; Farnleitner, A.H. A sensitive and robust method for automated on-line monitoring of enzymatic activities in water and water resources. Water Sci. Technol. 2014, 69, 1349–1358. [Google Scholar] [CrossRef] [PubMed]
  9. Tryland, I.; Eregno, F.E.; Braathen, H.; Khalaf, G.; Sjolander, I.; Fossum, M. On-line monitoring of Escherichia coli in raw water at oset drinking water treatment plant, Oslo (Norway). Int. J. Environ. Res. Public Health 2015, 12, 1788–1802. [Google Scholar] [CrossRef] [PubMed] [Green Version]
  10. Berg, J.D.; Fiksdal, L. Rapid detection of total and fecal coliforms in water by enzymatic-hydrolysis of 4-methylumbelliferone-beta-d-galactoside. Appl. Environ. Microbiol. 1988, 54, 2118–2122. [Google Scholar] [PubMed]
  11. Davies, C.M.; Apte, S.C. An evaluation of potential interferences in a fluorimetric assay for the rapid detection of thermotolerant coliforms in sewage. Lett. Appl. Microbiol. 2000, 30, 99–104. [Google Scholar] [CrossRef] [PubMed]
  12. Fiksdal, L.; Tryland, I. Application of rapid enzyme assay techniques for monitoring of microbial water quality. Curr. Opin. Biotechnol. 2008, 19, 289–294. [Google Scholar] [CrossRef] [PubMed]
  13. Sicard, C.; Shek, N.; White, D.; Bowers, R.J.; Brown, R.S.; Brennan, J.D. A rapid and sensitive fluorimetric beta-galactosidase assay for coliform detection using chlorophenol red-β-D-galactopyranoside. Anal. Bioanal. Chem. 2014, 406, 5395–5403. [Google Scholar] [CrossRef] [PubMed]
  14. Edberg, S.C.; Allen, M.J.; Smith, D.B. National field-evaluation of a defined substrate method for the simultaneous enumeration of total coliforms and escherichia-coli from drinking-water—comparison with the standard multiple tube fermentation method. Appl. Environ. Microbiol. 1988, 54, 1595–1601. [Google Scholar] [PubMed]
  15. Tryland, I.; Samset, I.D.; Hermansen, L.; Berg, J.D.; Rydberg, H. Early warning of faecal contamination of water: A dual mode, automated system for high- (<1 h) and low-levels (6–11 h). Water Sci. Technol. 2001, 43, 217–220. [Google Scholar] [PubMed]
  16. VanPoucke, S.O.; Nelis, H.J. Limitations of highly sensitive enzymatic presence-absence tests for detection of waterborne coliforms and Escherichia coli. Appl. Environ. Microbiol. 1997, 63, 771–774. [Google Scholar]
  17. Wallenfels, K.; Weil, R. B-galactosidase. In The Enzymes; Academic Press: New York, NY, USA, 1972; Volume VIII, pp. 617–663. [Google Scholar]
  18. Tryland, I.; Fiksdal, L. Enzyme characteristics of β-D-galactosidase- and β-D-glucuronidase-positive bacteria and their interference in rapid methods for detection of waterborne coliforms and Escherichia coli. Appl. Environ. Microbiol. 1998, 64, 1018–1023. [Google Scholar] [PubMed]
  19. Arukha, A.P.; Mukhopadhyay, B.C.; Mitra, S.; Biswas, S.R. A constitutive unregulated expression of β-galactosidase in lactobacillus fermentum M1. Curr. Microbiol. 2015, 70, 253–259. [Google Scholar] [CrossRef] [PubMed]
  20. Tryland, I. Rapid Enzymatic Detection of Microbial Water Quality. Ph.D. Thesis, Norwegian University of Science and Technology, Trondheim, Norway, 1999. [Google Scholar]
  21. The Norwegian Meteorological Institute. Available online: http://sharki.oslo.dnmi.no/portal/page?_pageid=73,39035,73_39049&_dad=portal&_schema=PORTAL (accessed on 16 February).
  22. Tryland, I.; Braathen, H.; Beschorner, A.-L.; Muthanna, T. Monitoring of hygienic bathing water quality. Vann 2012, 2, 194–206. (in Norwegian). [Google Scholar]
  23. Wutor, V.C.; Togo, C.A.; Pletschke, B.I. Comparison of the direct enzyme assay method with the membrane filtration technique in the quantification and monitoring of microbial indicator organisms—Seasonal variations in the activities of coliforms and E-coli, temperature and ph. Water SA 2007, 33, 107–110. [Google Scholar] [CrossRef]
  24. Baudart, J.; Servais, P.; De Paoli, H.; Henry, A.; Lebaron, P. Rapid enumeration of Escherichia coli in marine bathing waters: Potential interference of nontarget bacteria. J. Appl. Microbiol. 2009, 107, 2054–2062. [Google Scholar] [CrossRef] [PubMed]
  25. Davies, C.M.; Apte, S.C.; Peterson, S.M. Possible interference of lactose-fermenting marine vibrios in coliform β-D-galactosidase assays. J. Appl. Bacteriol. 1995, 78, 387–393. [Google Scholar] [CrossRef] [PubMed]
  26. Davies, C.M.; Apte, S.C.; Peterson, S.M.; Stauber, J.L. Plant and algal interference in bacterial β-D-galactosidase and β-D-glucuronidase assays. Appl. Environ. Microbiol. 1994, 60, 3959–3964. [Google Scholar] [PubMed]
  27. Davies, C.M.; Apte, S.C.; Peterson, S.M. β-D-galactosidase activity of viable, non-culturable coliform bacteria in marine waters. Lett. Appl. Microbiol. 1995, 21, 99–102. [Google Scholar] [CrossRef] [PubMed]
  28. Fiksdal, L.; Tryland, I. Effect of UV Light irradiation, starvation and heat on Escherichia coli β-D-galactosidase activity and other potential viability parameters. J. Appl. Microbiol. 1999, 87, 62–71. [Google Scholar] [CrossRef] [PubMed]
  29. Pommepuy, M.; Fiksdal, L.; Gourmelon, M.; Melikechi, H.; Caprais, M.P.; Cormier, M.; Colwell, R.R. Effect of seawater on Escherichia coli β-galactosidase activity. J. Appl. Bacteriol. 1996, 81, 174–180. [Google Scholar] [CrossRef] [PubMed]
  30. Tryland, I.; Pommepuy, M.; Fiksdal, L. Effect of chlorination on β-D-galactosidase activity of sewage bacteria and Escherichia coli. J. Appl. Microbiol. 1998, 85, 51–60. [Google Scholar] [CrossRef] [PubMed]
  31. Molina-Munoz, M.; Poyatos, J.M.; Vilchez, R.; Hontoria, E.; Rodelas, B.; Gonzalez-Lopez, J. Effect of the concentration of suspended solids on the enzymatic activities and biodiversity of a submerged membrane bioreactor for aerobic treatment of domestic wastewater. Appl. Microbiol. Biotechnol. 2007, 73, 1441–1451. [Google Scholar] [CrossRef] [PubMed]
  32. Wutor, V.C.; Togo, C.A.; Pletschke, B.I. The effect of physico-chemical parameters and chemical compounds on the activity of β-D-galactosidase (B-GAL), a marker enzyme for indicator microorganisms in water. Chemosphere 2007, 68, 622–627. [Google Scholar] [CrossRef] [PubMed]
  33. Rada, V.; Vlkova, E.; Nevoral, J.; Trojanova, I. Comparison of bacterial flora and enzymatic activity in faeces of infants and calves. FEMS Microbiol. Lett. 2006, 258, 25–28. [Google Scholar] [CrossRef] [PubMed]
  34. Rodriguez, J.M.; Murphy, K.; Stanton, C.; Ross, R.P.; Kober, O.I.; Juge, N.; Avershina, E.; Rudi, K.; Narbad, A.; Jenmalm, M.C.; et al. The composition of the gut microbiota throughout life, with an emphasis on early life. Microb. Ecol. Health Dis. 2015, 26, 26050. [Google Scholar] [CrossRef] [PubMed]
  35. Szilagyi, A.; Shrier, I.; Heilpern, D.; Je, J.S.; Park, S.; Chong, G.; Lalonde, C.; Cote, L.F.; Lee, B. Differential impact of lactose/lactase phenotype on colonic microflora. Can. J. Gastroenterol. 2010, 24, 373–379. [Google Scholar] [PubMed]
Figure 1. Hoffselva (A) and Mærradalsbekken River (B) before, during and after heavy rainfall 26 June 2014. Local heavy precipitation was observed in the area (average for the 4 nearest weather stations: no precipitation occurred on the days before 15 pm on 26 June 2014, 25 mm occurred between 15 and 18 pm and a further 4 mm occurred before 9 am on 27 June 2014.
Water 08 00065 g001aWater 08 00065 g001b
Figure 2. Fecal indicator bacteria in the Hovinbekken River during and after heavy rainfall on 12 August 2013.
Water 08 00065 g002
Figure 3. Fecal indicator bacteria and water-flow in the Ljanselva River before, during and after rainfall on 18 November 2013.
Water 08 00065 g003
Figure 4. The concentration of fecal coliforms in Akerselva (Myraløkka) at different dates during the late summer period of 2014, measured by the reference method and the fully automated CALM using a method based on 2-h measurement of the GAL activity.
Water 08 00065 g004
Figure 5. E. coli numbers versus GAL activity in fresh water samples (n = 59).
Water 08 00065 g005
Figure 6. GAL activity and fecal indicator bacteria in different fecal samples. The figure shows logarithmic values (average ± standard deviation).
Water 08 00065 g006
Table 1. Number of coastal bathing water samples with E. coli concentration higher or lower than 1000 E. coli/100 mL and GAL activity higher or lower than 6.7 ppb MU/h.
GAL Activity <6.7 ppb MU/hGAL Activity >6.7 ppb MU/h
E. coli concentration <1000 E. coli/100 mL330
E. coli concentration >1000 E. coli/100 mL32
Table 2. The measured GAL activity when sewage was diluted in water with increased salinity, relative to low salinity (set to 100%). Increased salinity was obtained by diluting sewage in sterile deep seawater from Oslofjord (seawater) or from adding NaCl to distilled water.
SeawaterNaCl
Low salinity (3.4 PSU)100%100%
Medium salinity (17 PSU)90%93%
High salinity (34 PSU)65%70%
Table 3. GAL activity and fecal indicator bacteria in samples of human feces (total of 14 samples from 8 individuals).
Arithmetic MeanGeometric MeanMinimumMaximum 1LOG Variation 2
GAL activity (ppb MU/h)6.9 × 1075.8 × 1071.7 × 1071.8 × 1081.0
E. coli (MPN/g) 33.4 × 1083.7 × 106<1 × 1033.1 × 109>6.5
Intestinal enterococci (cfu/g)4.7 × 1061.8 × 104<1 × 1026.0 × 107>5.7
1 The highest number, with regard to GAL activity, E. coli and intestinal enterococci, was observed in the feces from a 6-month-old child, mainly fed by breast milk; 2 The concentration of E. coli also showed high variation on an individual scale: In feces from one person, tested 4 times over a 1-year period, the E. coli concentration varied from 1 × 10³–7 × 10⁷ E. coli per gram; 3 In all of the samples of human feces, the E. coli and the coliform numbers were equal.

