
Hazard Ratings of Debris Flow Evacuation Sites in Hillside Communities of Ershui Township, Changhua County, Taiwan


Abstract
:1. Introduction
2. Material and Methods
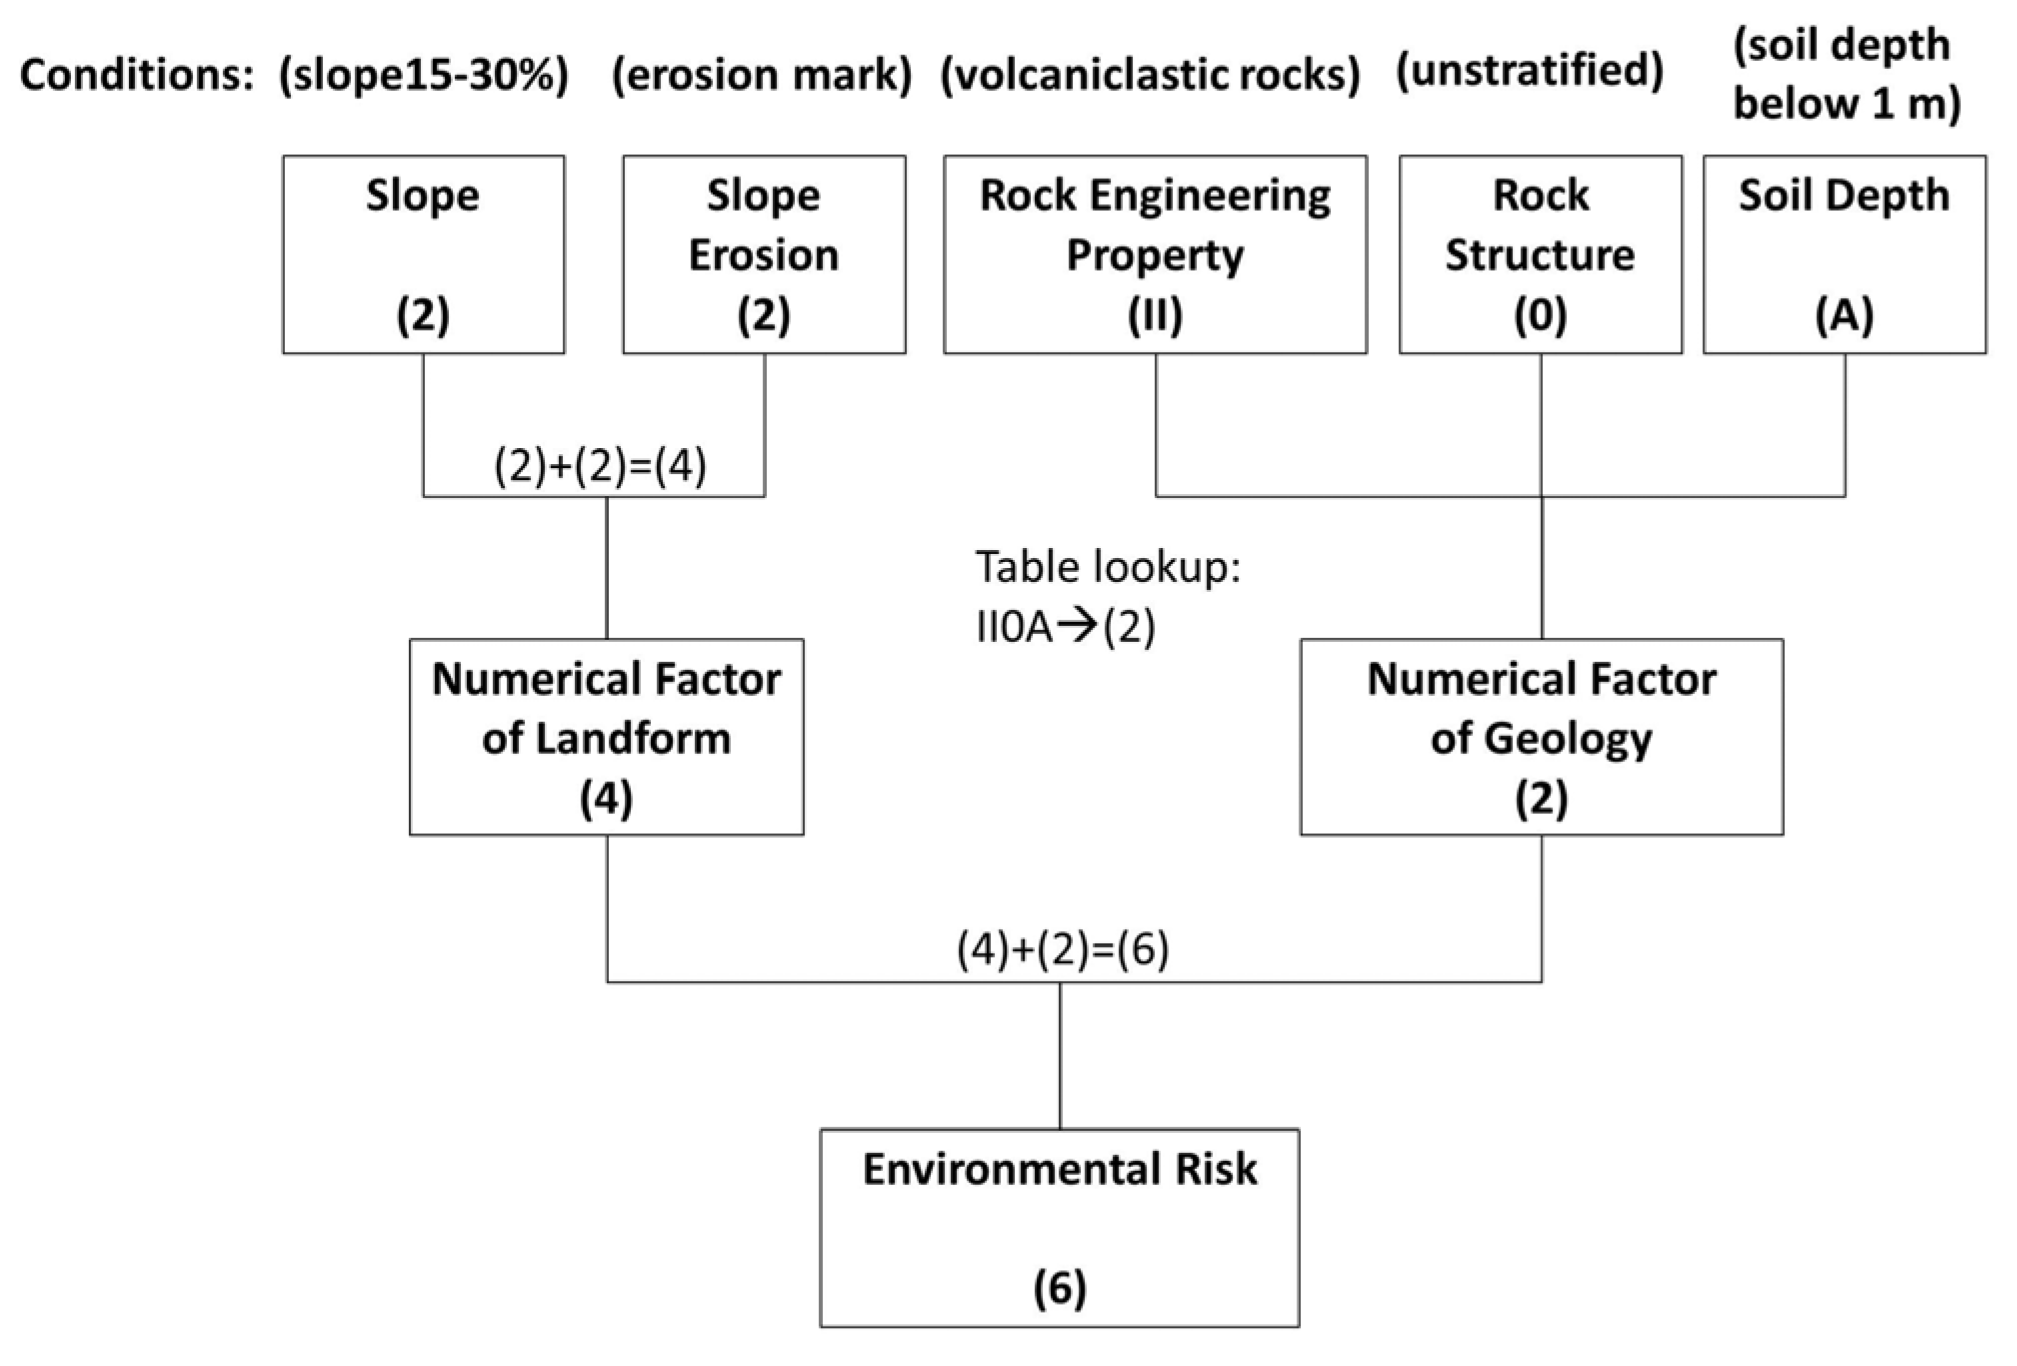
2.1. Environmental Sensitivity

| Numerical Factor | Slope (%) | Numerical Factor | Erosion | Numerical Factor | Geological Factor |
|---|---|---|---|---|---|
| 0 | ≤5 | 1 | Flat slope | 1 | I0A, I1A, I2A, [I3A (without free end) *] |
| 1 | 5–15 | 2 | Erosion mark | 2 | I0B, I1B, I2B, [I3B (without free end) *] II0A, II1A, II2A, [II3A (without free end) *] |
| 2 | 15–30 | 3 | Shallow gully | 3 | I0C, I1C, I2C, [I3C (without free end) *] II0B, II1B, II2B, [II3B (without free end) *] |
| 4 | 30–40 40–55 | 4 | Deep groove | 4 | I3A, I4A, II0C, II1C, II2C, [II3C (without free end) *] |
| 6 | 55–100 | 5 | Previous landslide, cinder pile | 5 | II3A, II4A, I3B, I4B |
| 8 | >100 | 6 | New landslide | 6 | I3C, I4C, II3B, II4B, II3C, II4C |
| Rock Type | Engineering Property Grade | Rock Name |
|---|---|---|
| Sedimentary rock | I | Hard sandstone; Dense limestone; Well-cemented conglomerate |
| II | Poorly cemented sandstone, Alternations of sandstone & shale, shale, mudstone; Porous limestone; Tuff; Gravel layer or poorly cemented conglomerate; Fragmentation of hard rock | |
| Igneous rock | I | Lava, intrusive rock, well-consolidated volcaniclastic rocks |
| II | Poorly consolidated volcaniclastic rocks | |
| Metamorphic rock | I | Gneiss; Marble; Quartz schist; Slate, Phyllite, Green schist |
| II | Shattered zone; Split developed in the slate, phyllite, schist black, and green schist |
| Code | Slope Type (Hillside Rock Formations) |
|---|---|
| 0 | Non-ramp (unstratified rock) |
| 1 | Oblique slope |
| 2 | Reverse slope (cliff) |
| 3 | Dip slope (strata dip more than 10 degrees) |
| 4 | Shattered zone |
| Code | Soil Depth |
|---|---|
| A | One meter or less |
| B | More than one meter to four meters |
| C | More than four meters |
| Environmental Risk | Environmental Sensitivity | |
|---|---|---|
| Below 5 | 1 | Extremely Low |
| 6–7 | 2 | Low |
| 8–9 | 3 | Medium |
| 10–11 | 4 | High |
| Above 12 | 5 | Extremely High |

2.2. Numerical Model for Debris Flow
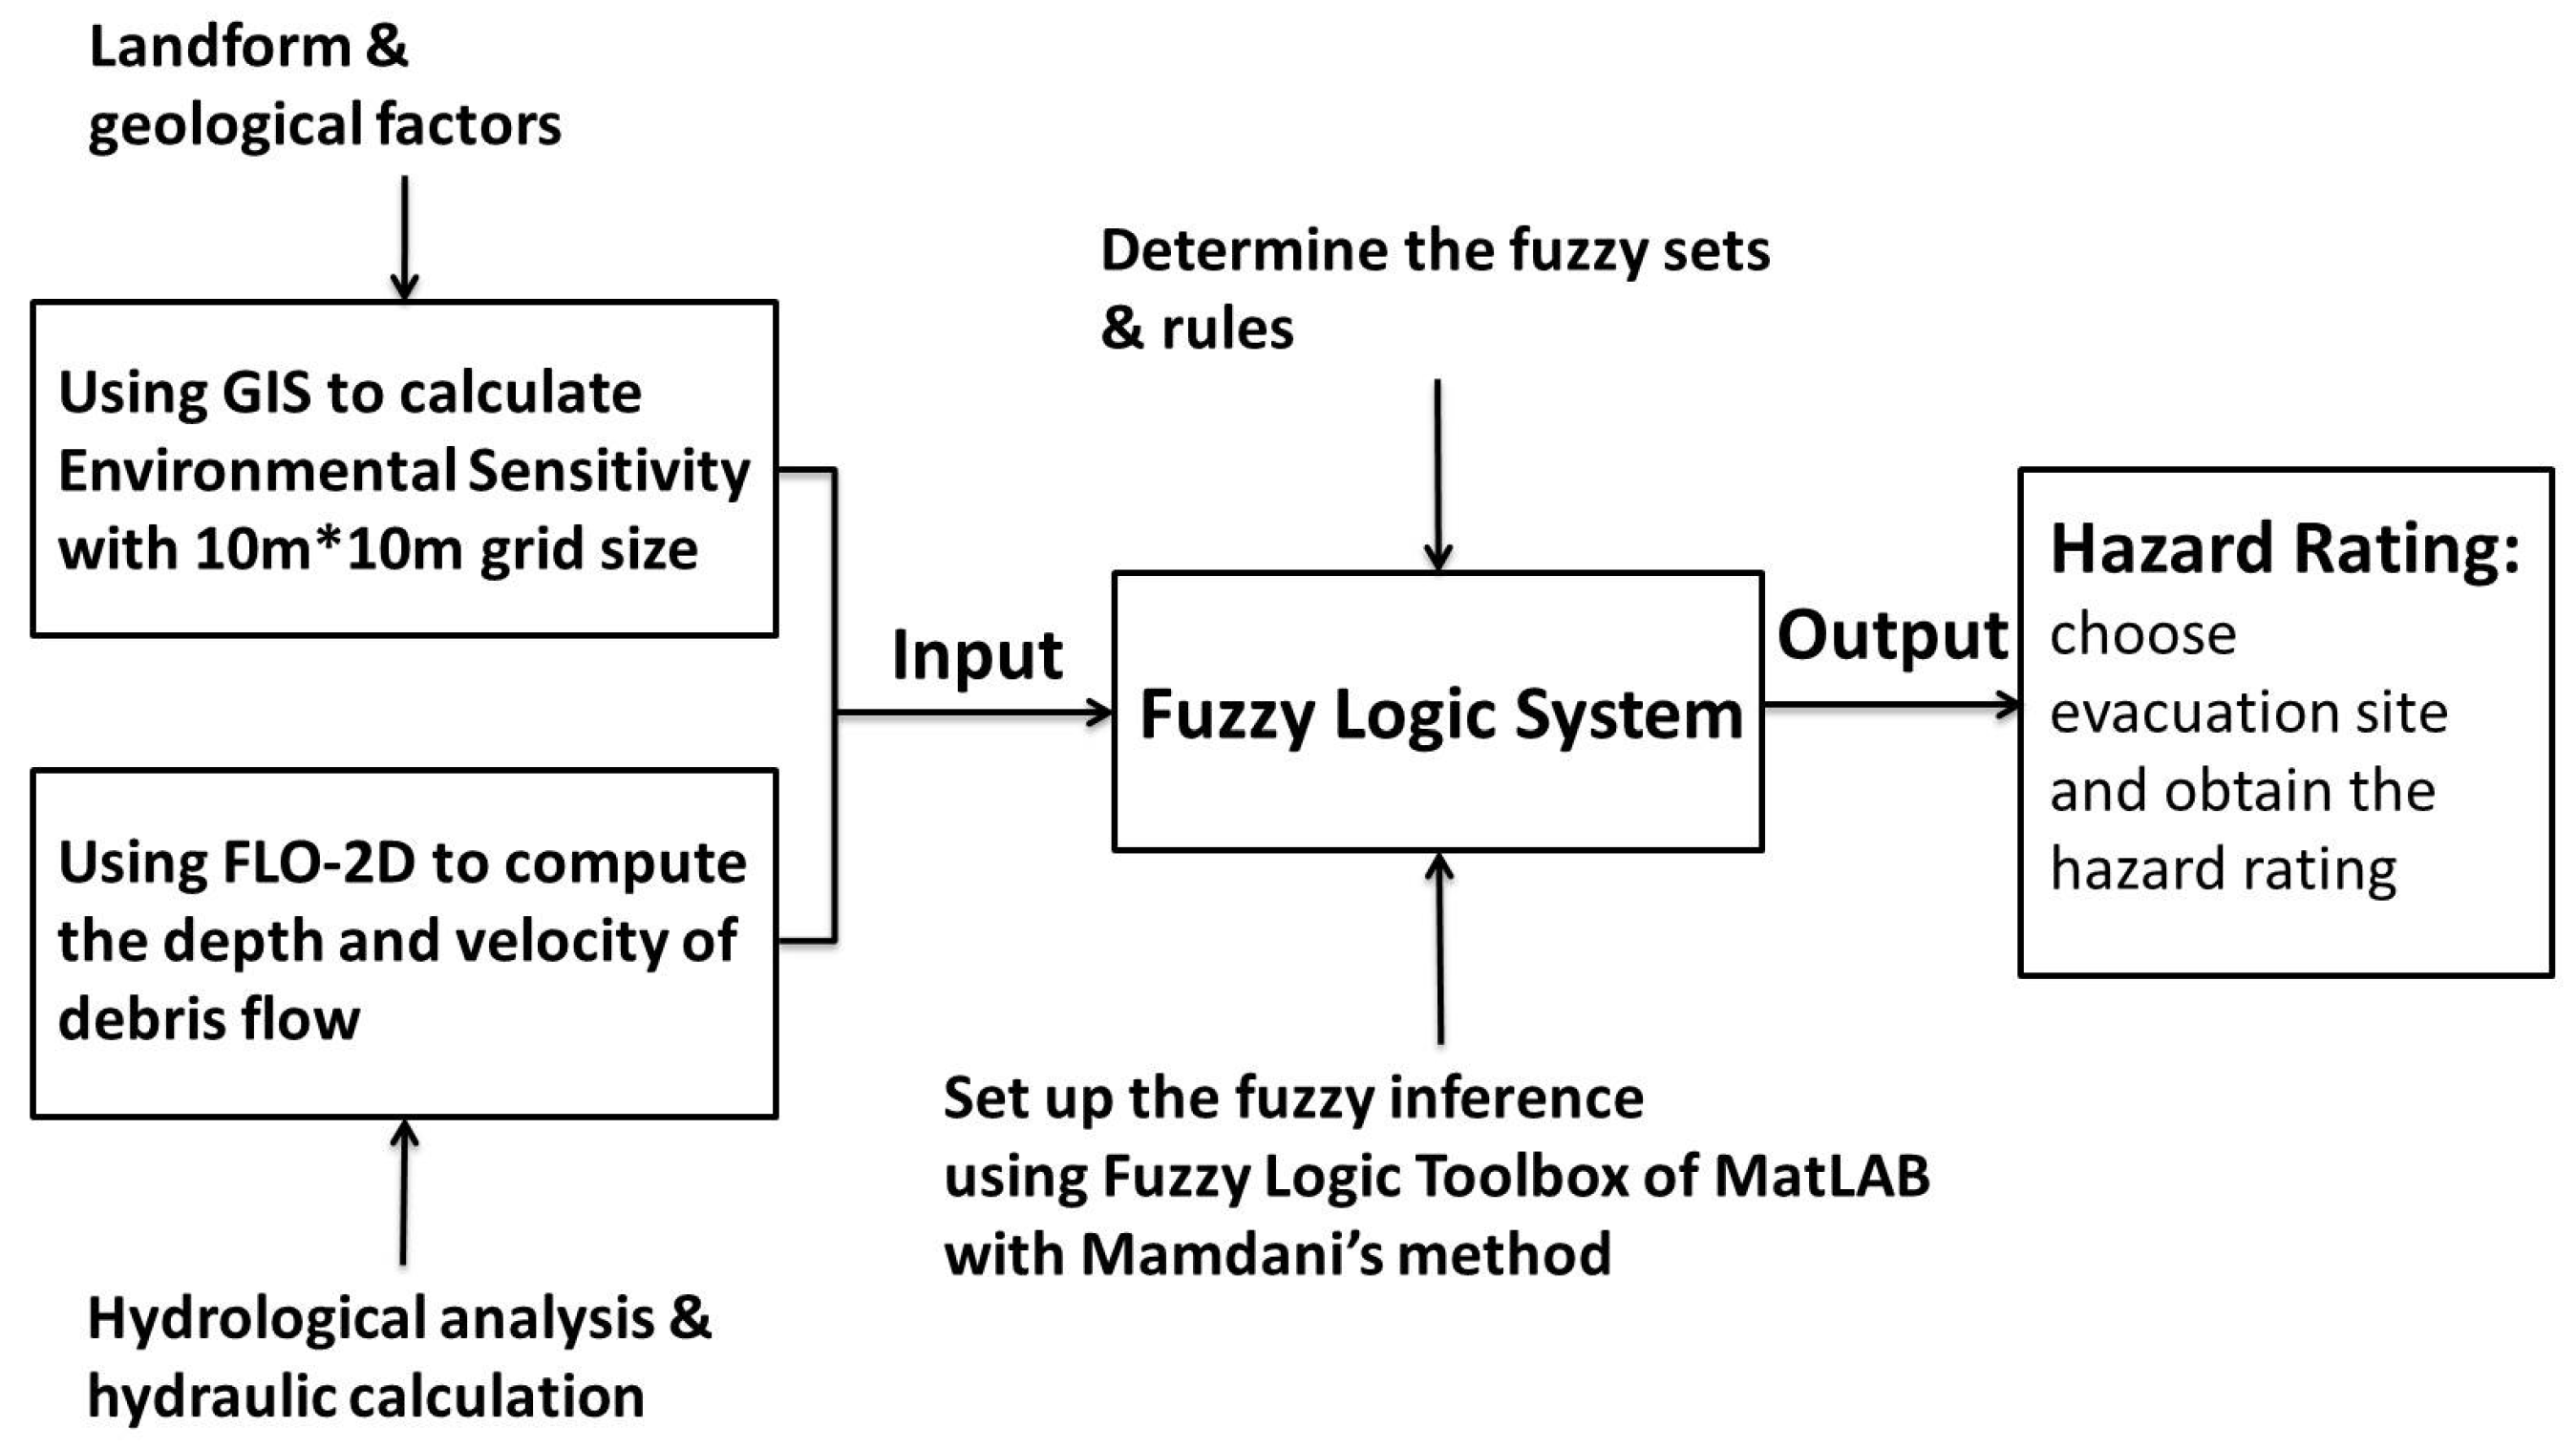
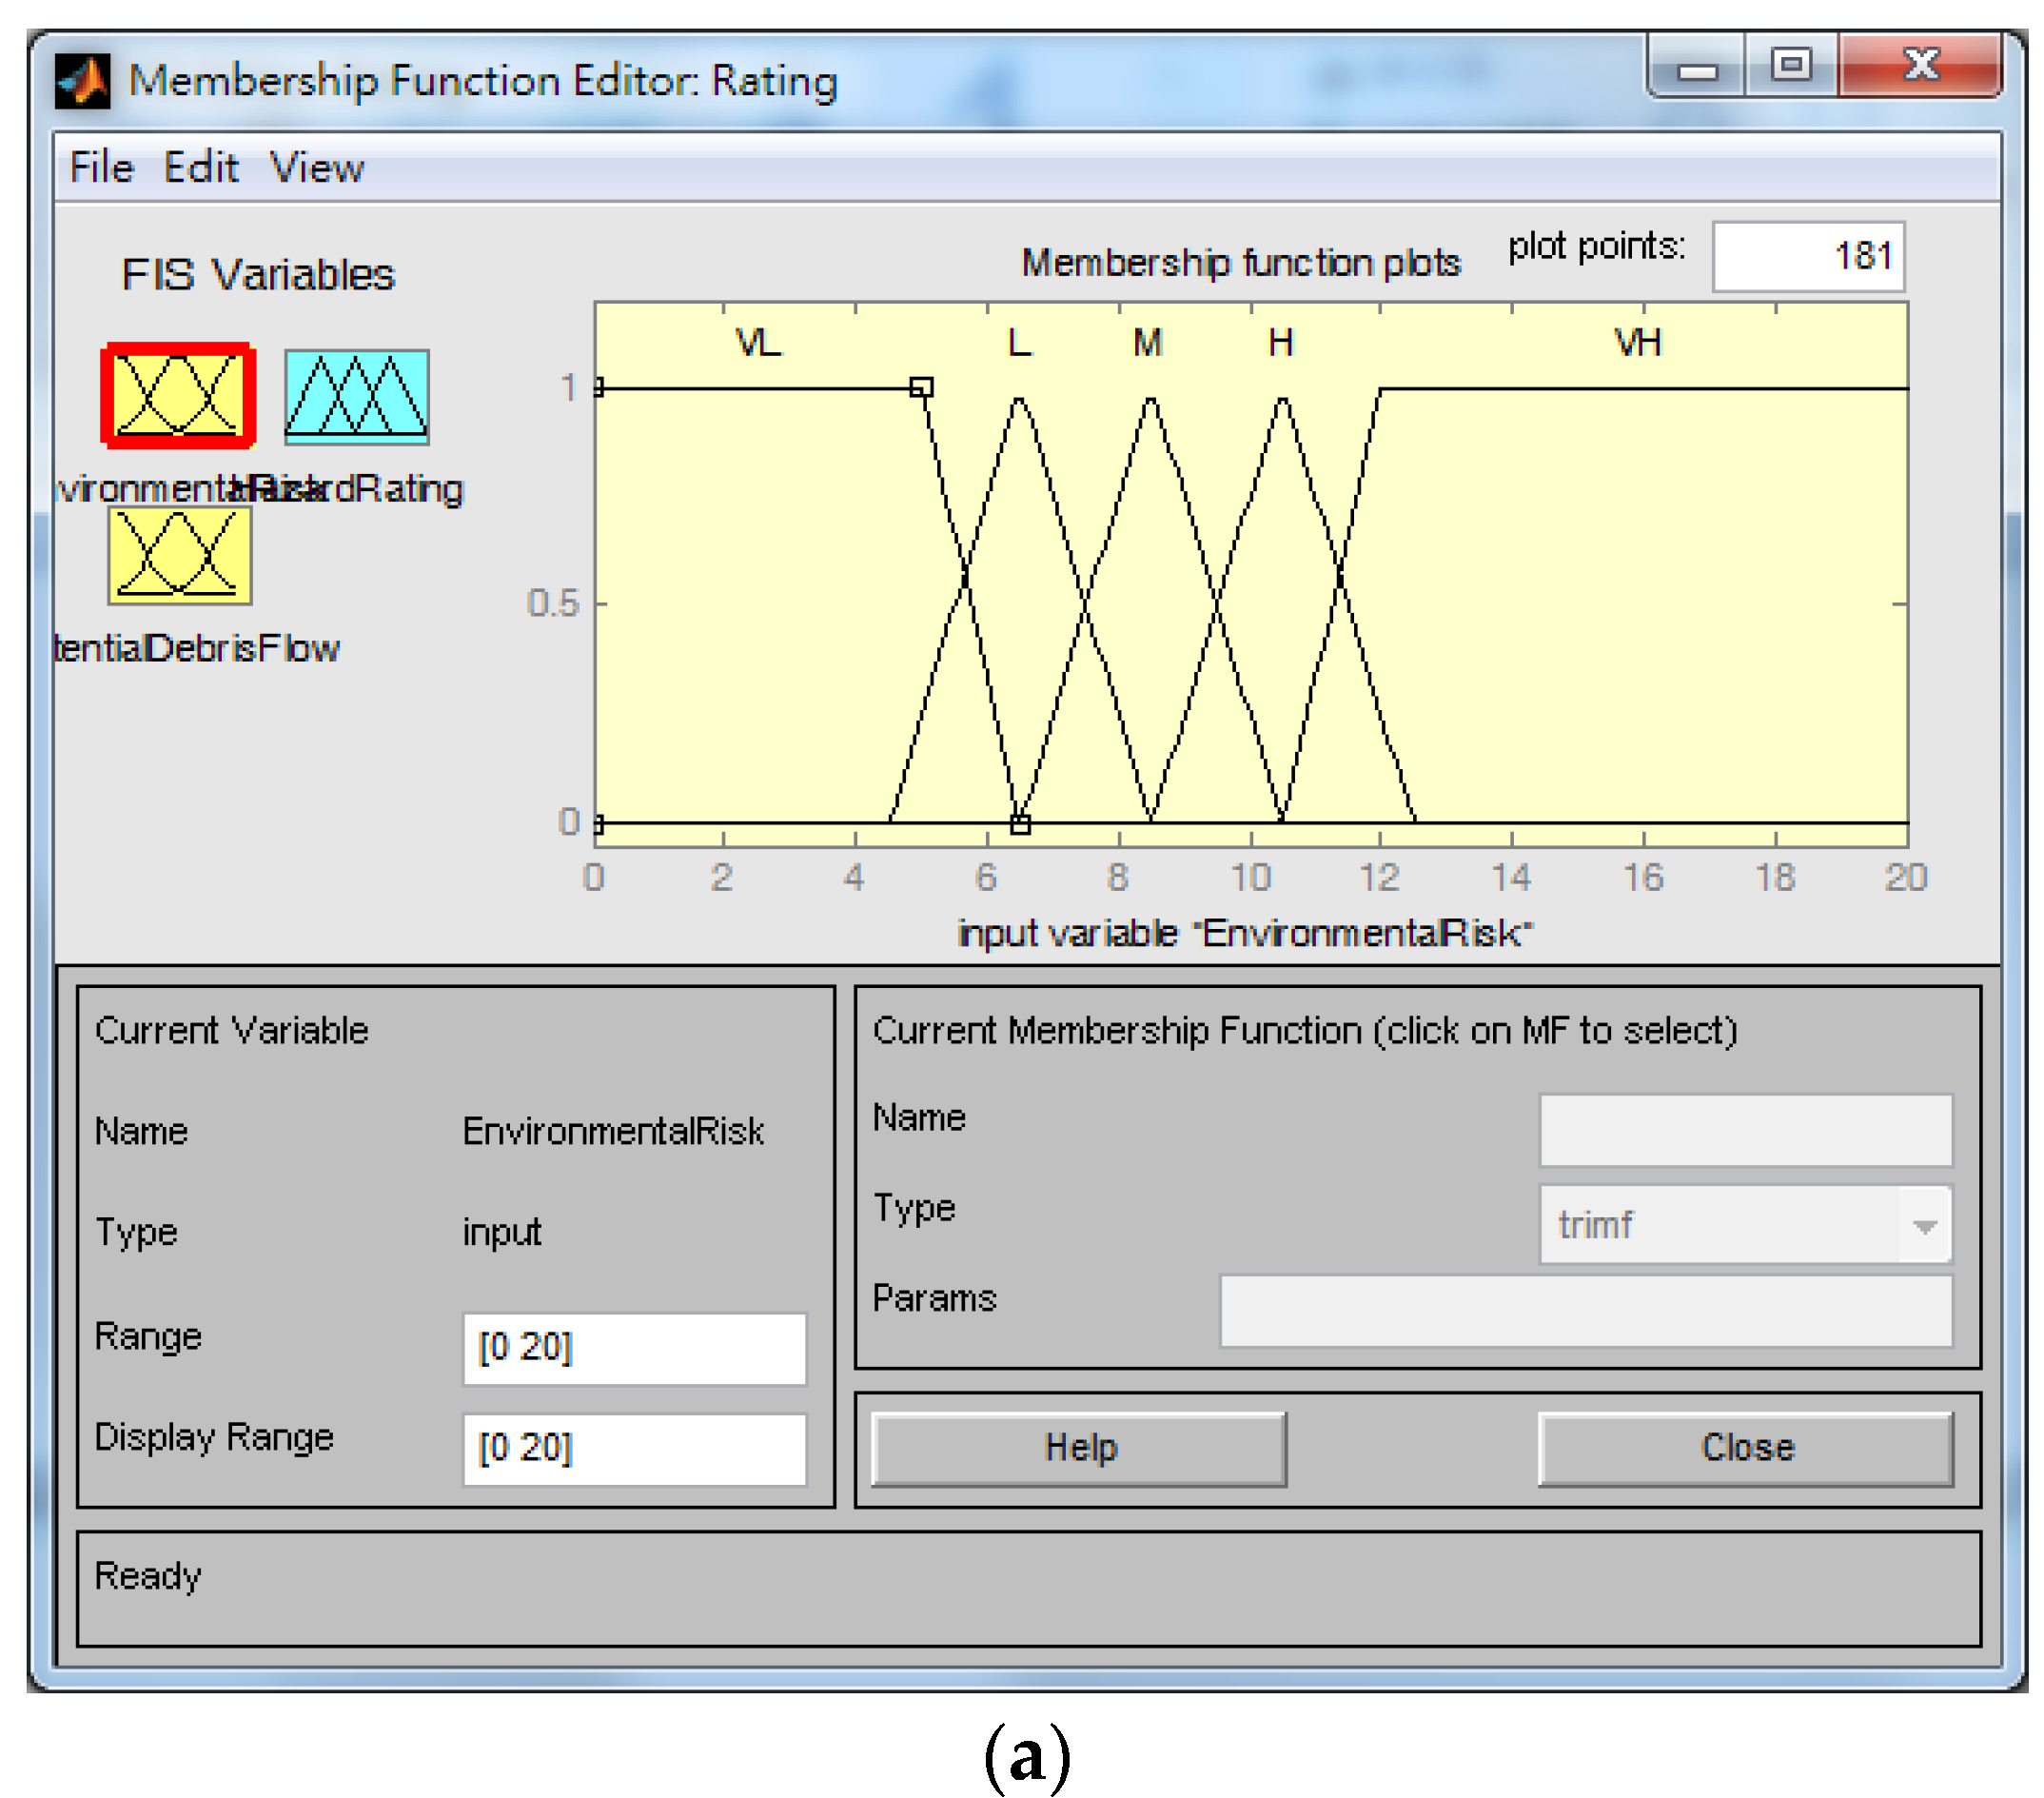
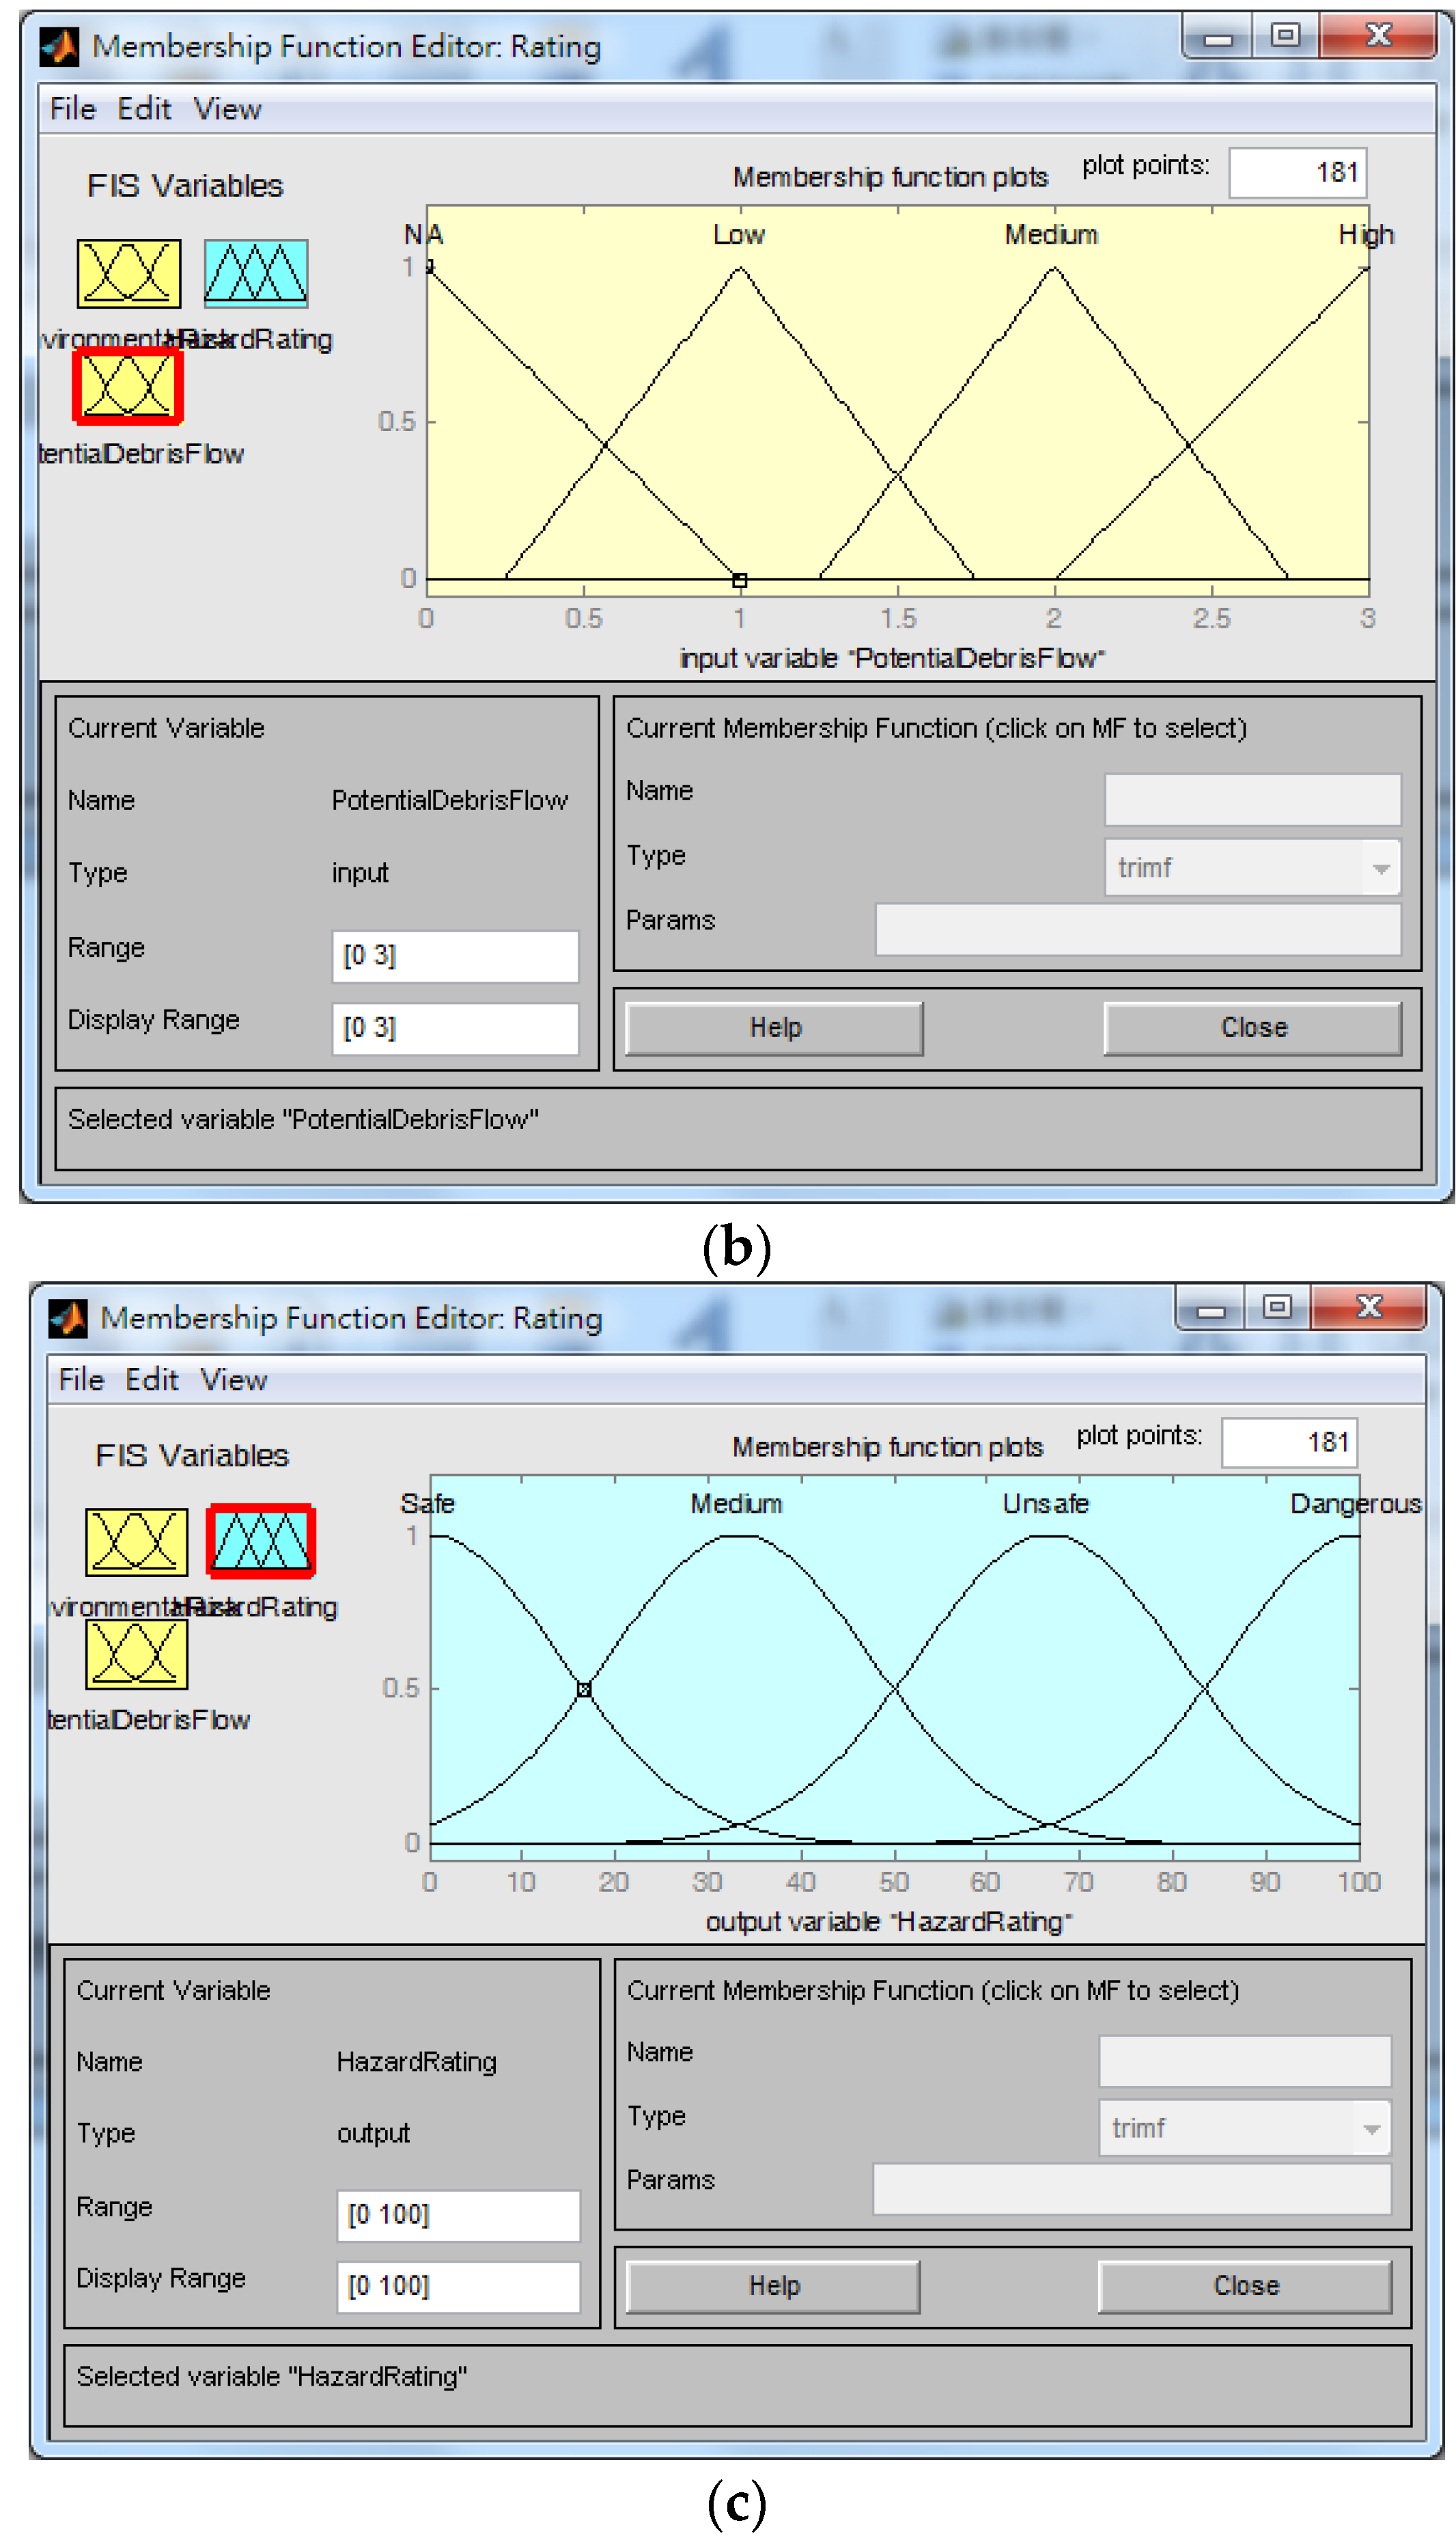
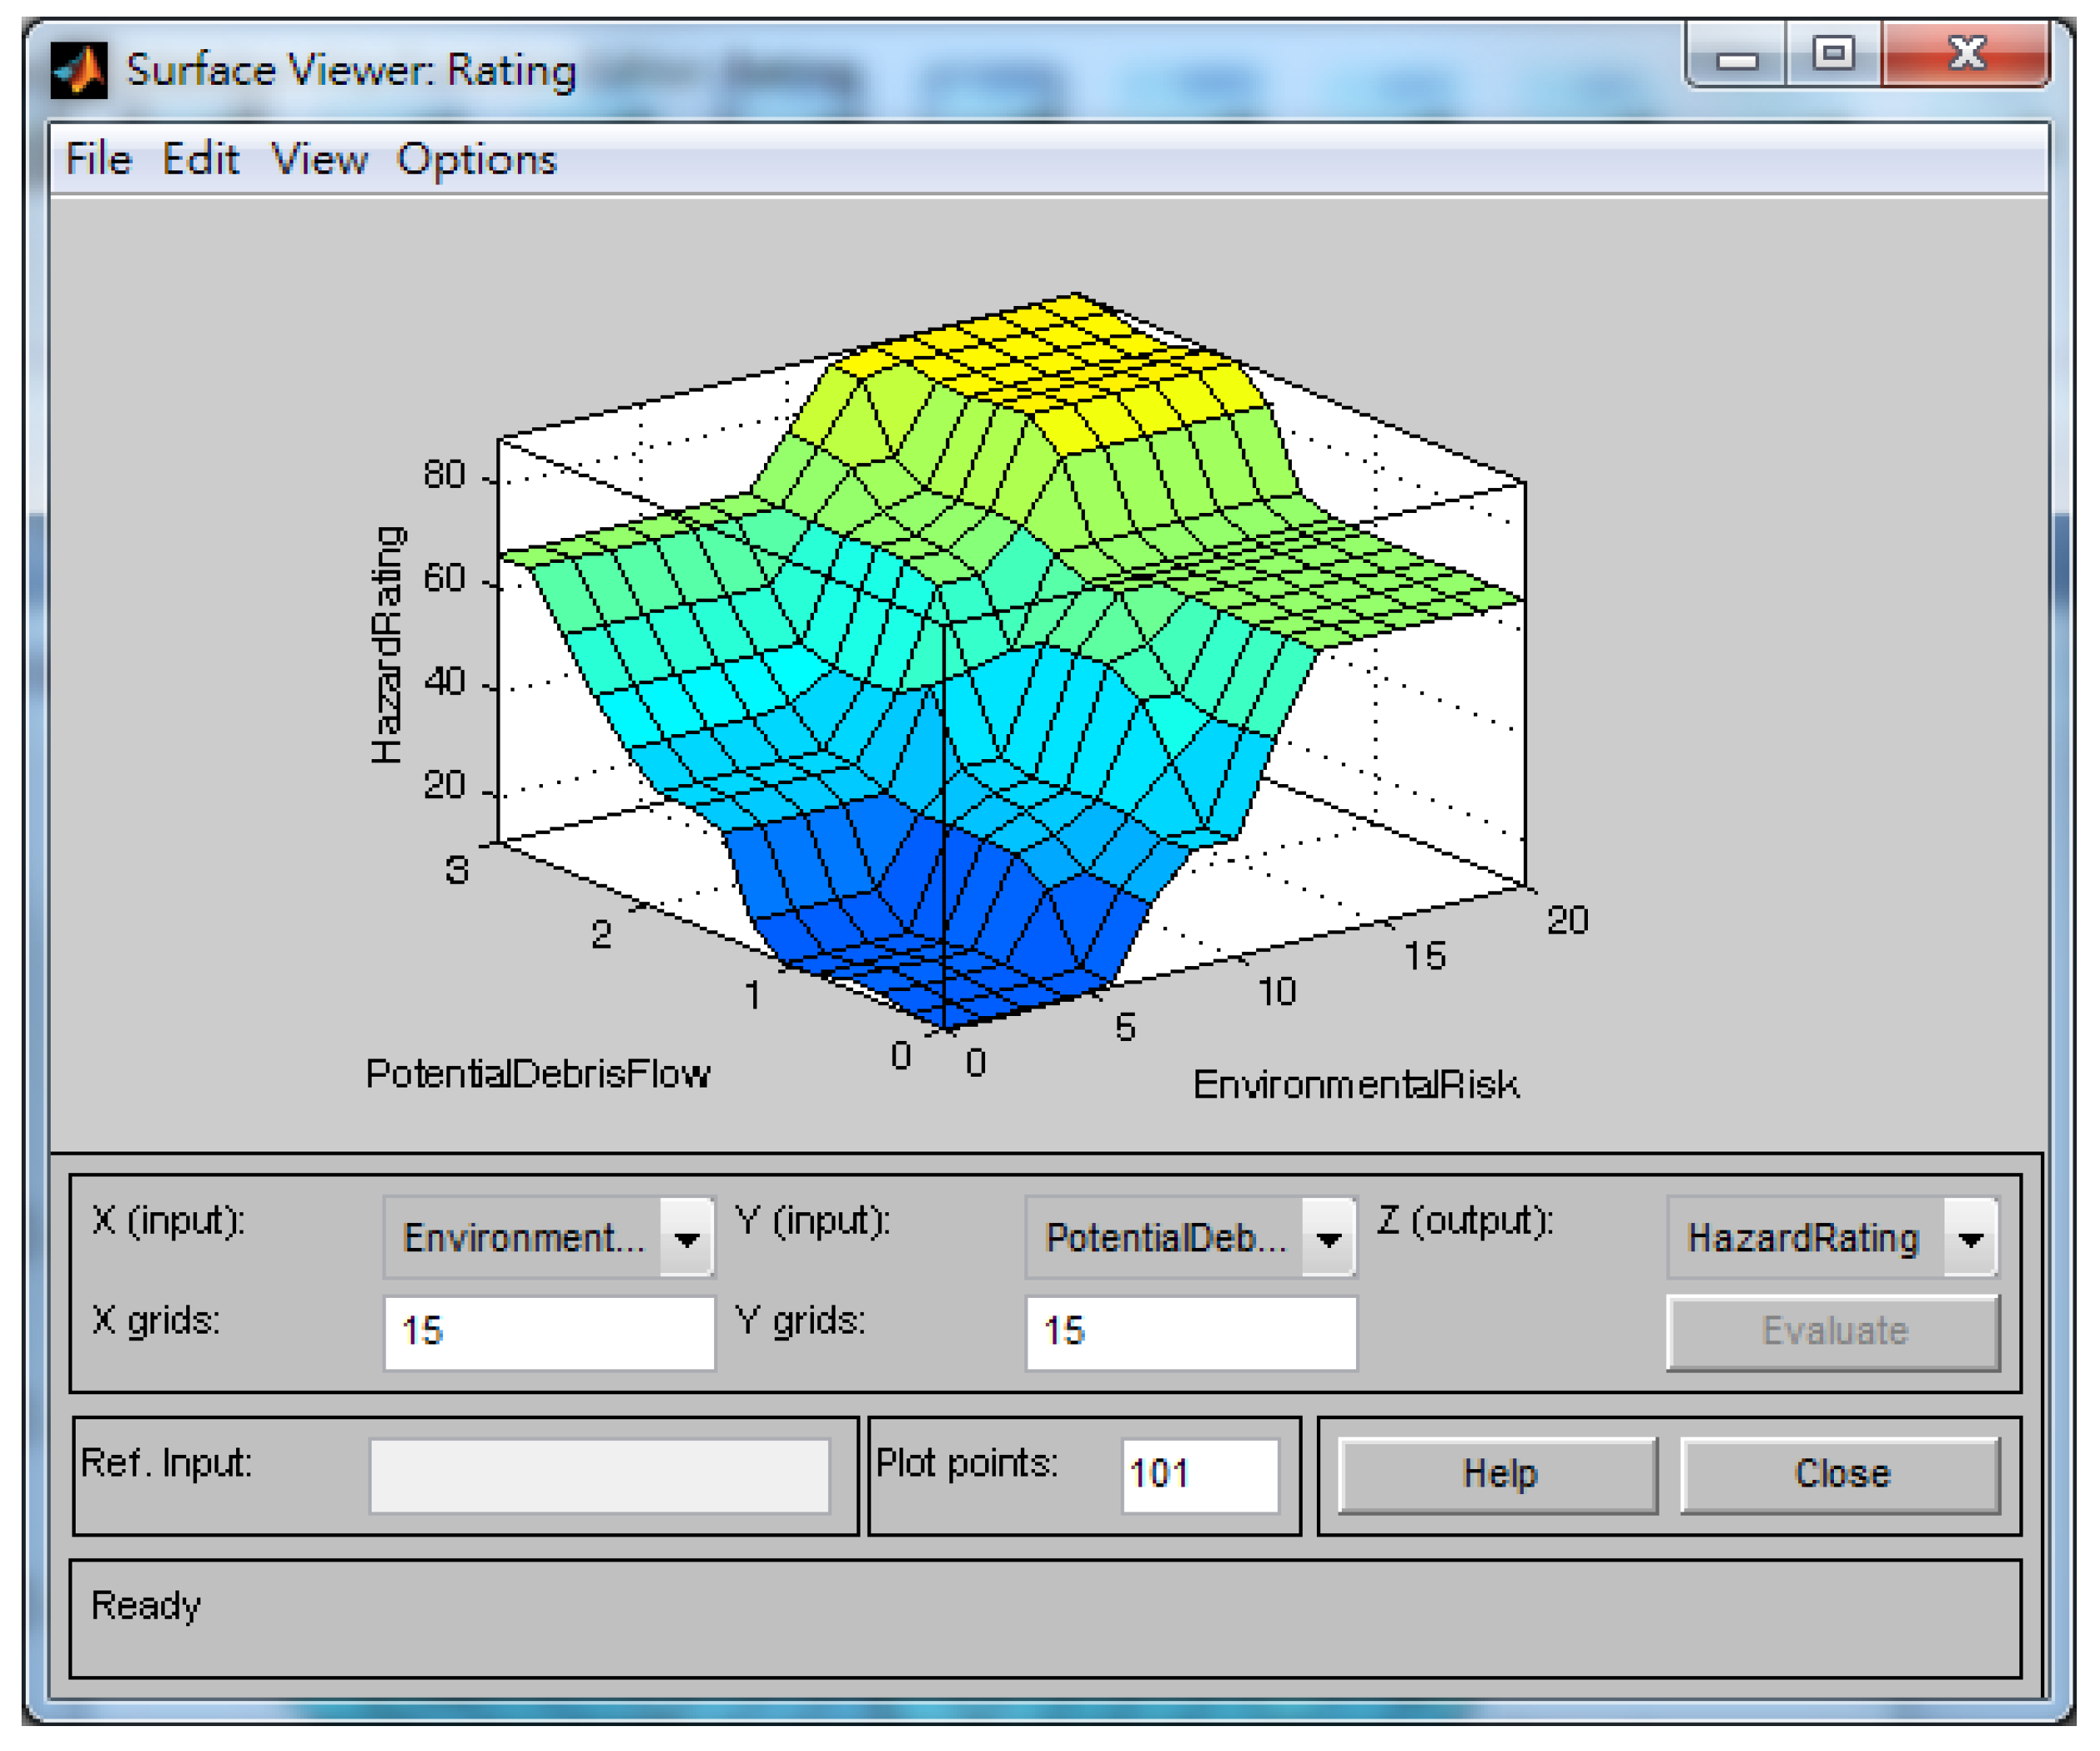
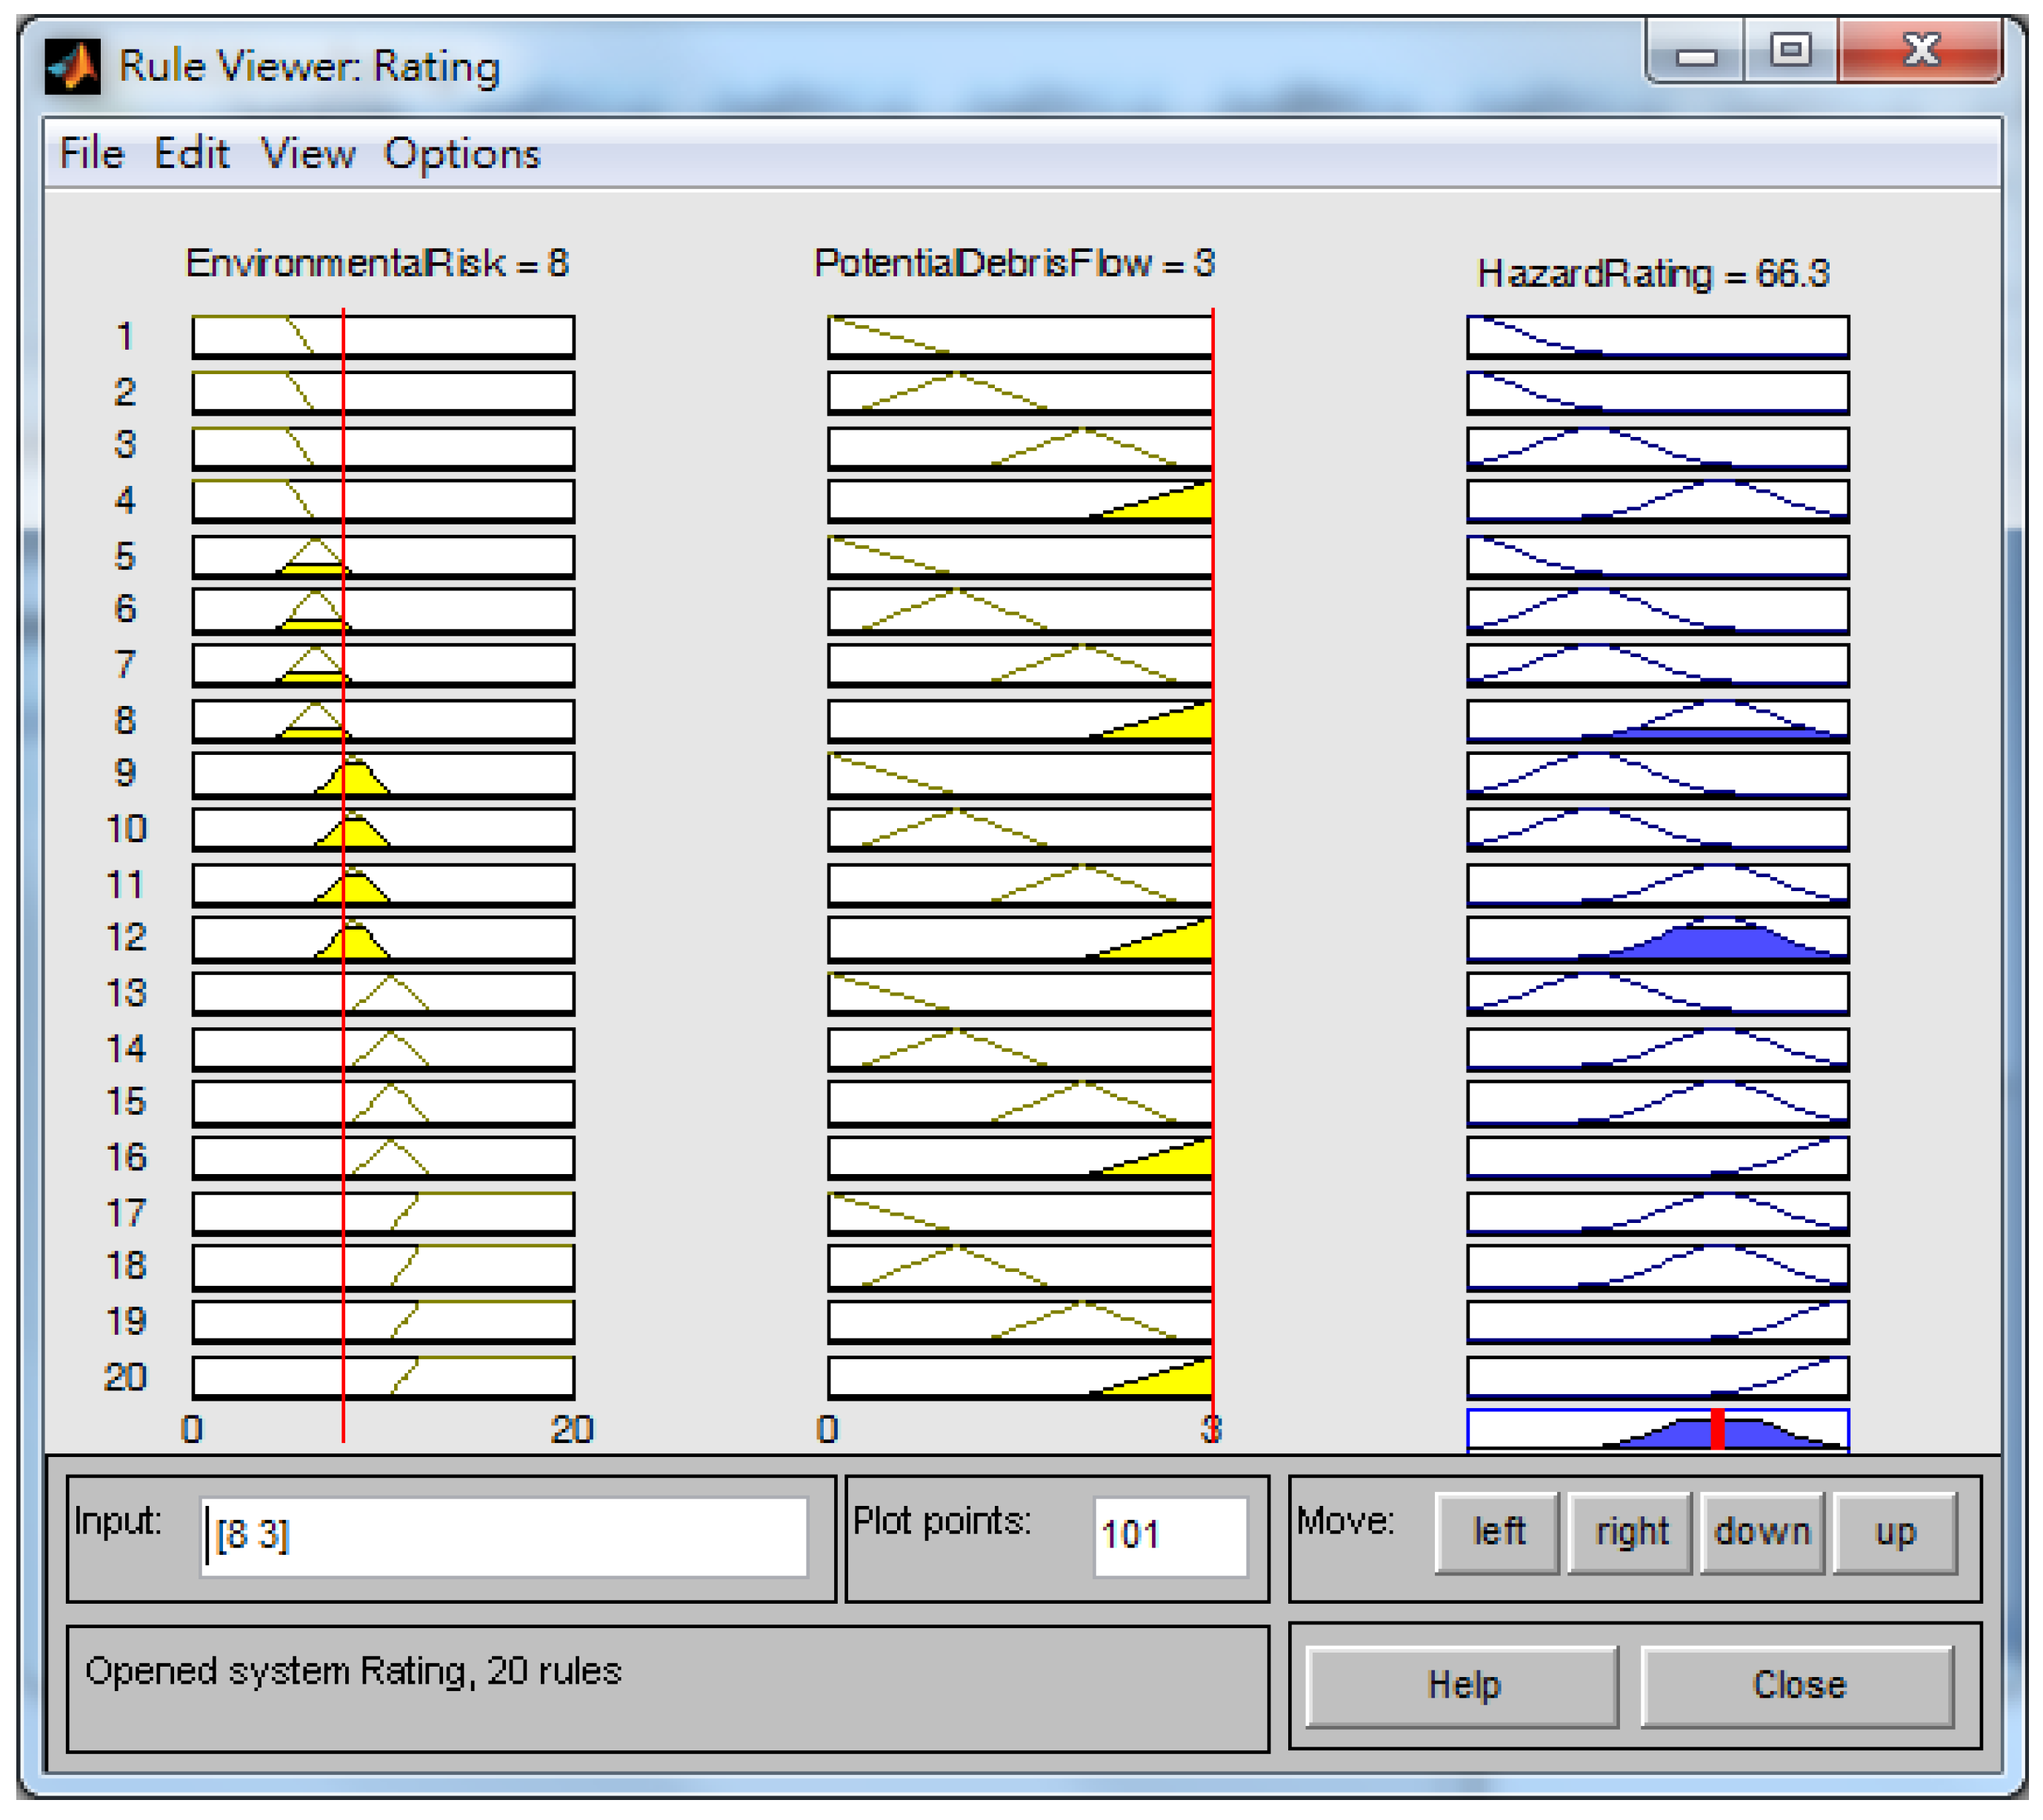
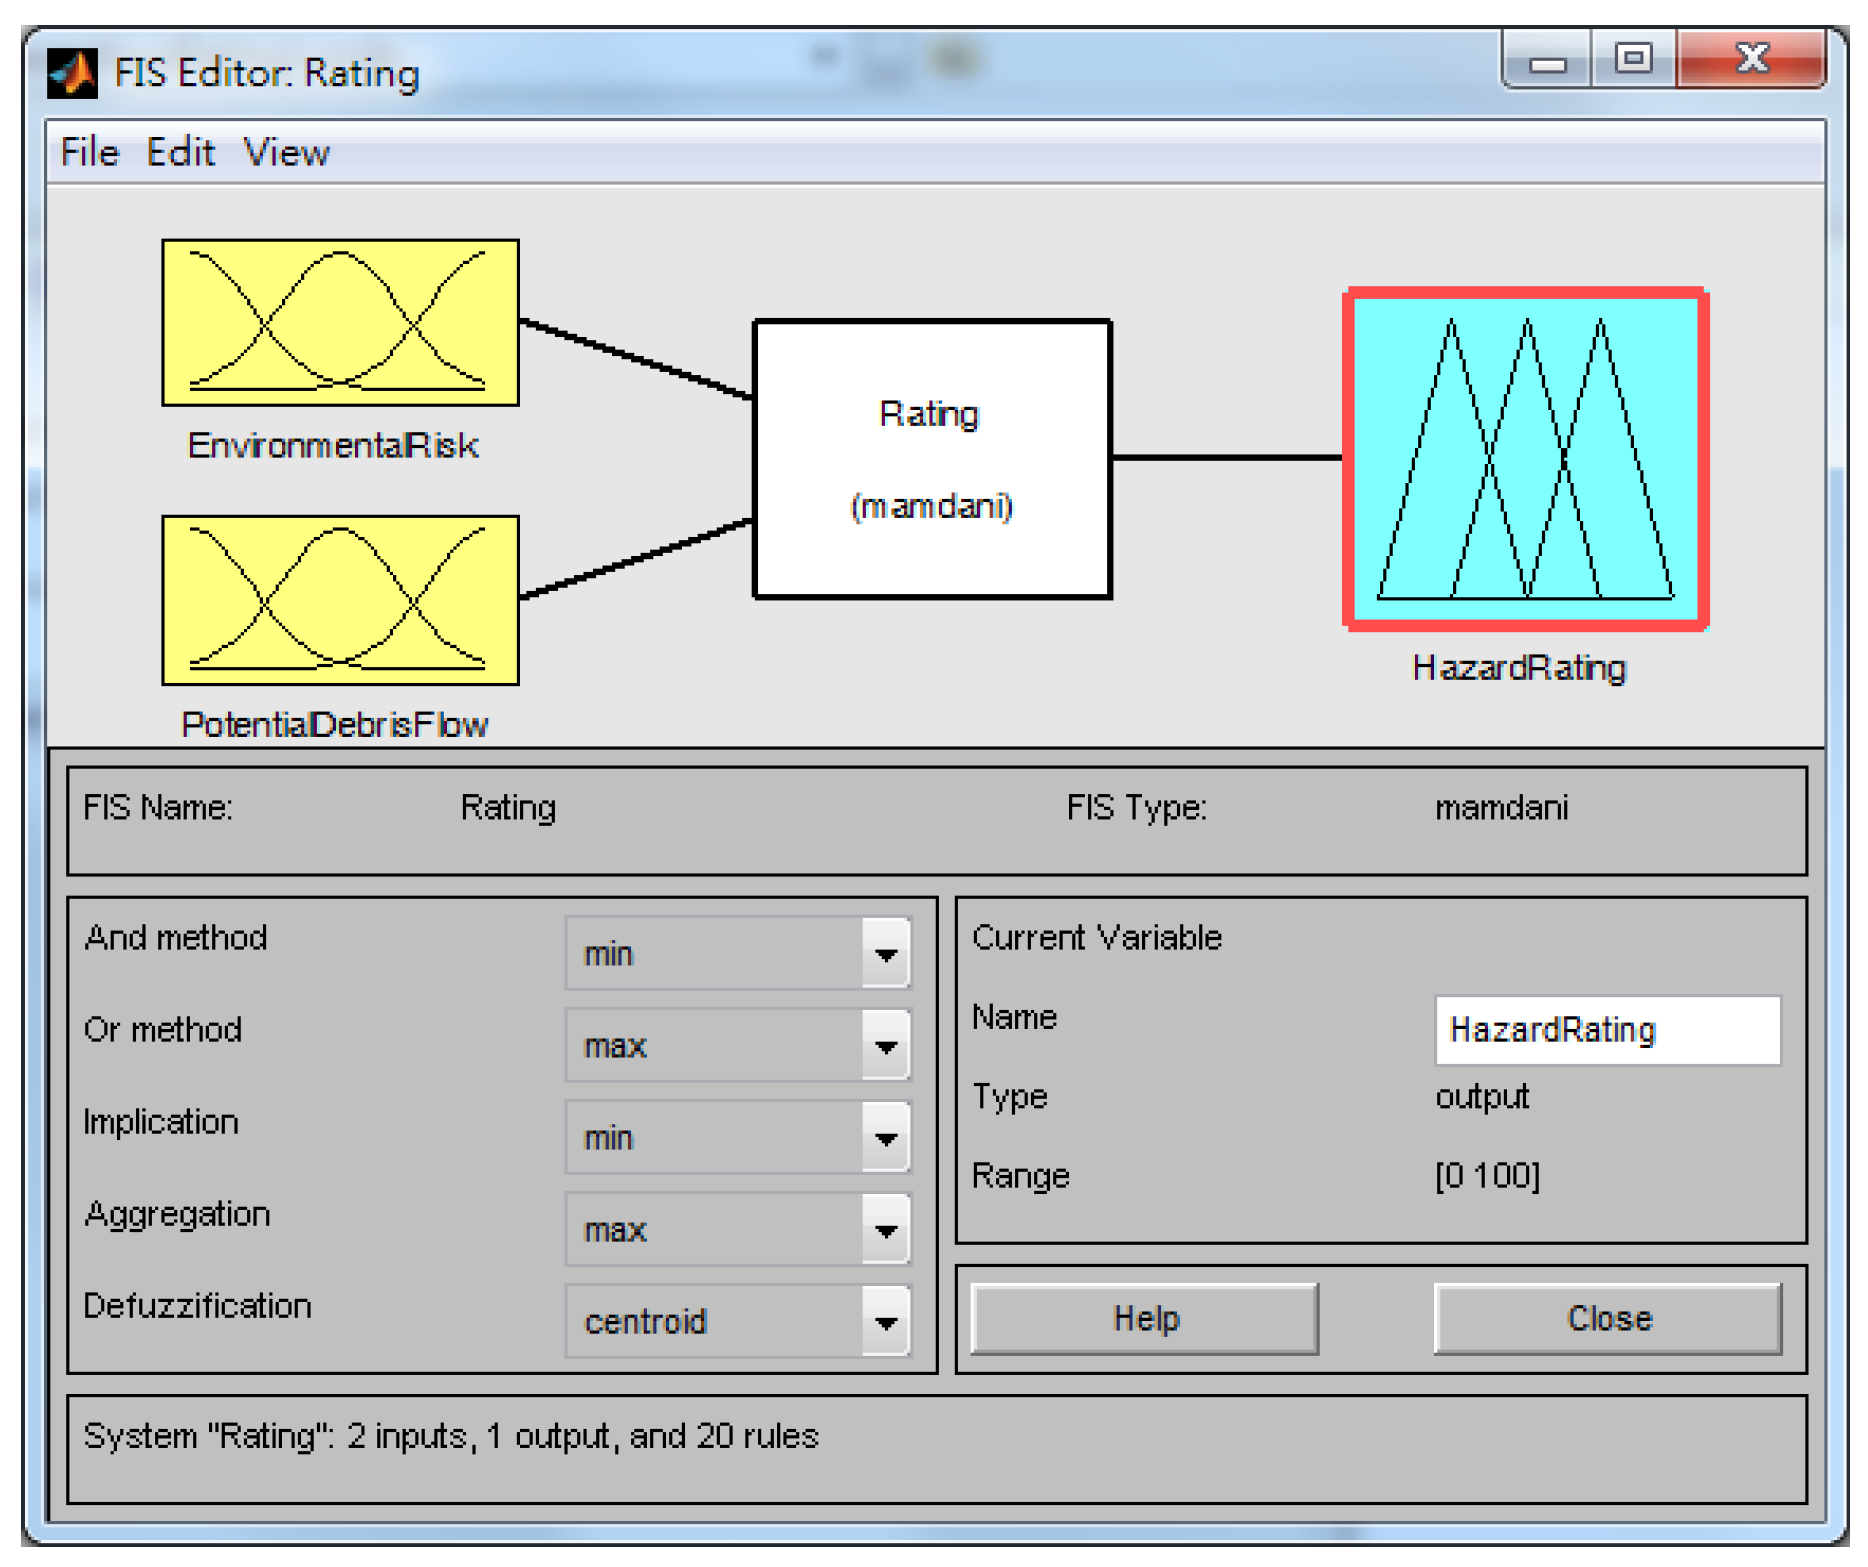
2.3. Fuzzy Logic System
| Input 1 (Environmental Risk) | Input 2 (Potential Debris Flow) | Output * (Hazardous Rating) |
|---|---|---|
| VL | N/A | Safe |
| VL | Low | Safe |
| VL | Medium | Medium |
| VL | High | Unsafe |
| L | N/A | Safe |
| L | Low | Medium |
| L | Medium | Medium |
| L | High | Unsafe |
| M | N/A | Medium |
| M | Low | Medium |
| M | Medium | Unsafe |
| M | High | Unsafe |
| H | N/A | Medium |
| H | Low | Unsafe |
| H | Medium | Unsafe |
| H | High | Dangerous |
| VH | N/A | Unsafe |
| VH | Low | Unsafe |
| VH | Medium | Dangerous |
| VH | High | Dangerous |


3. Results and Discussion
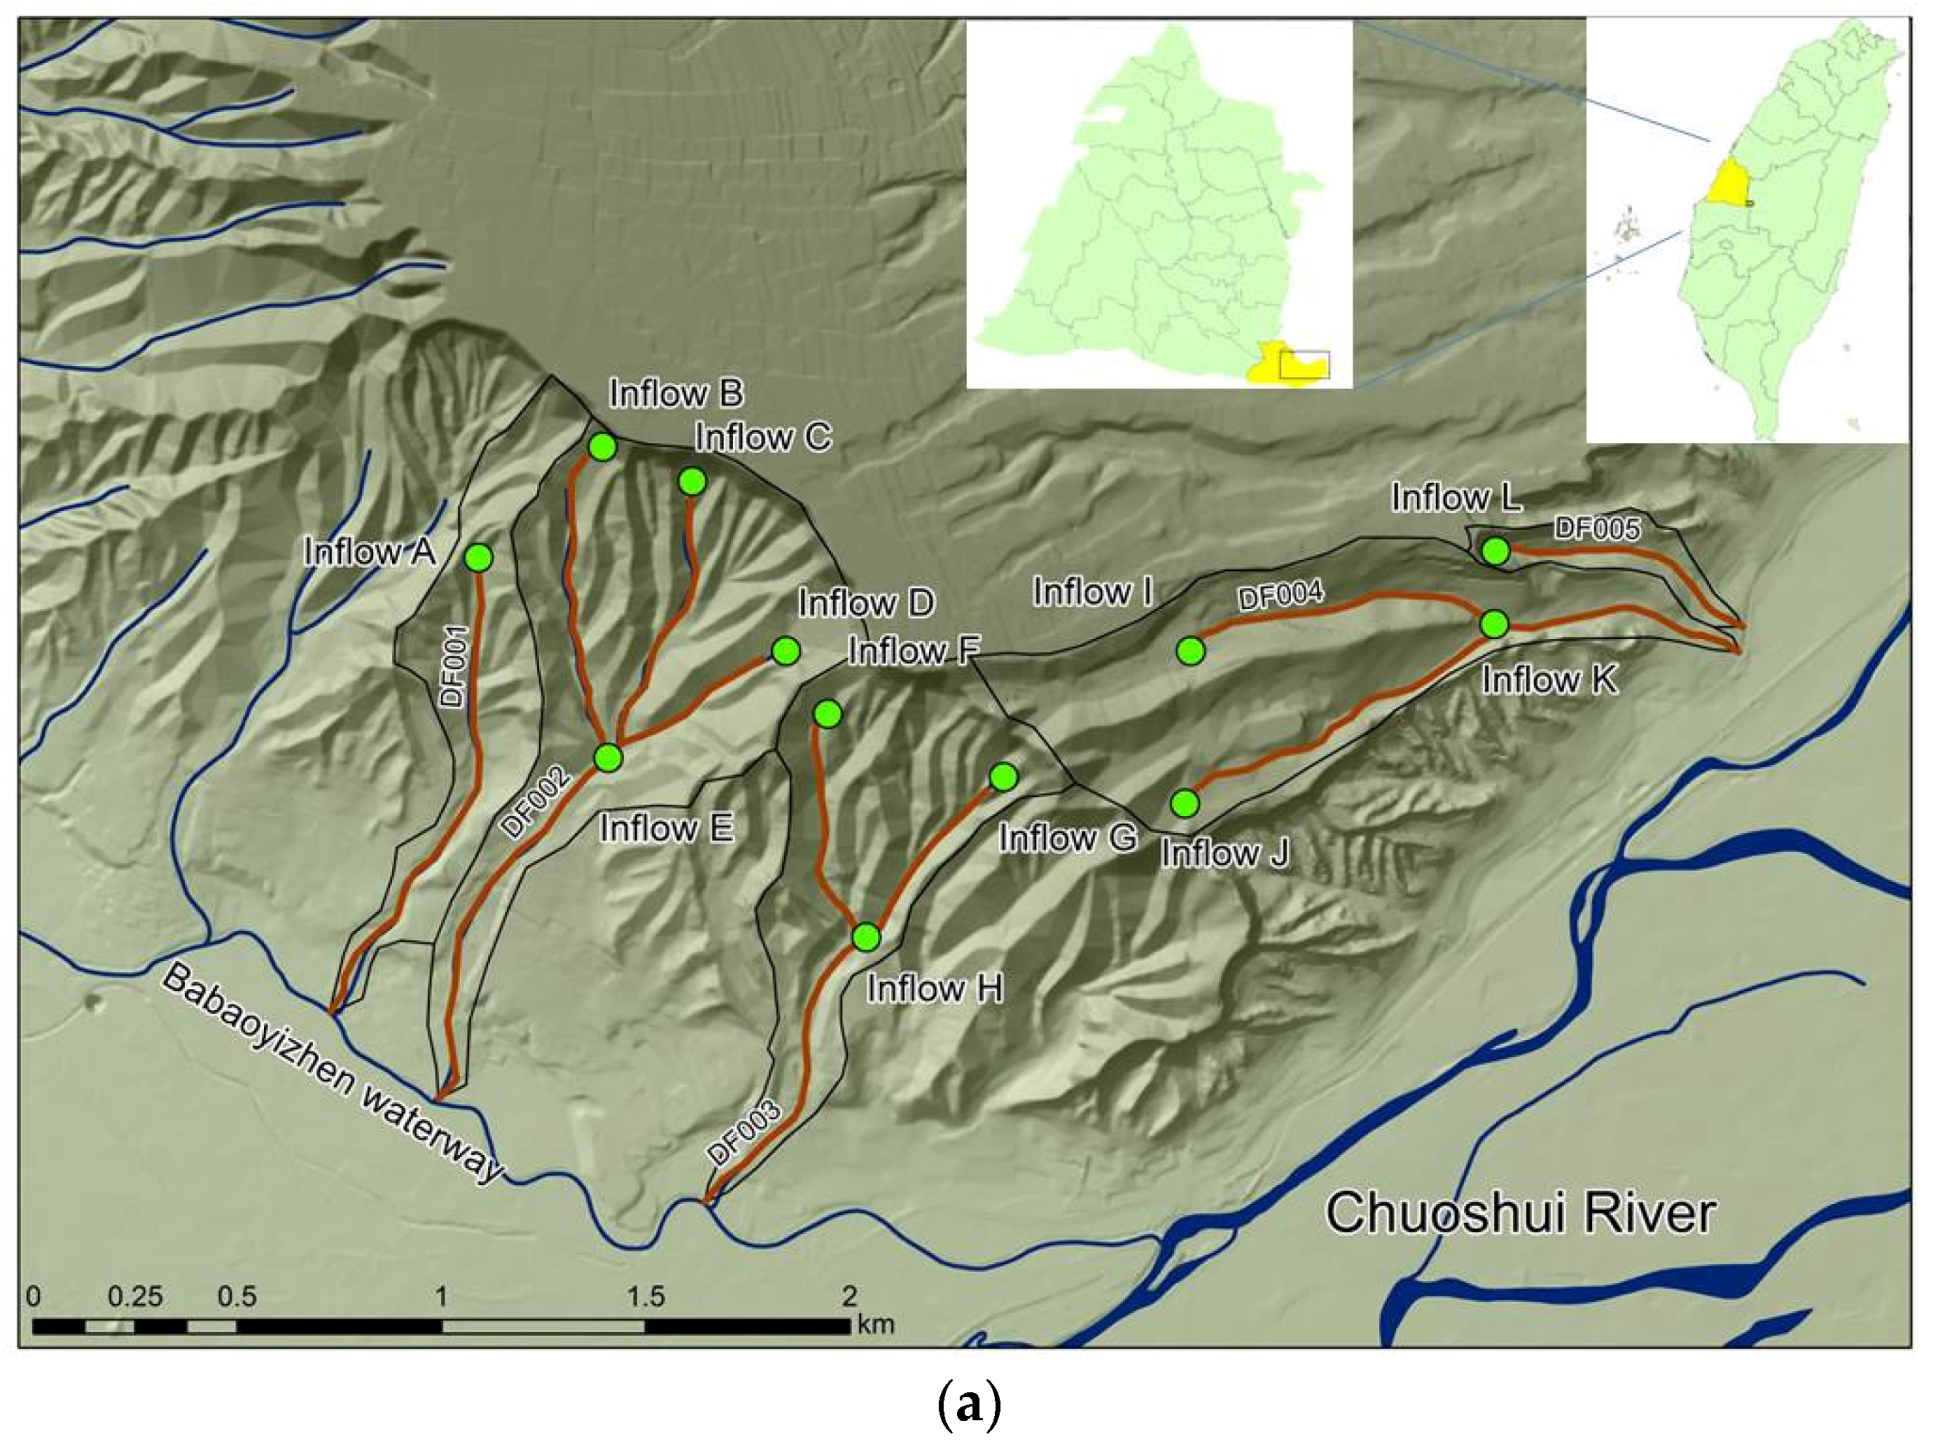
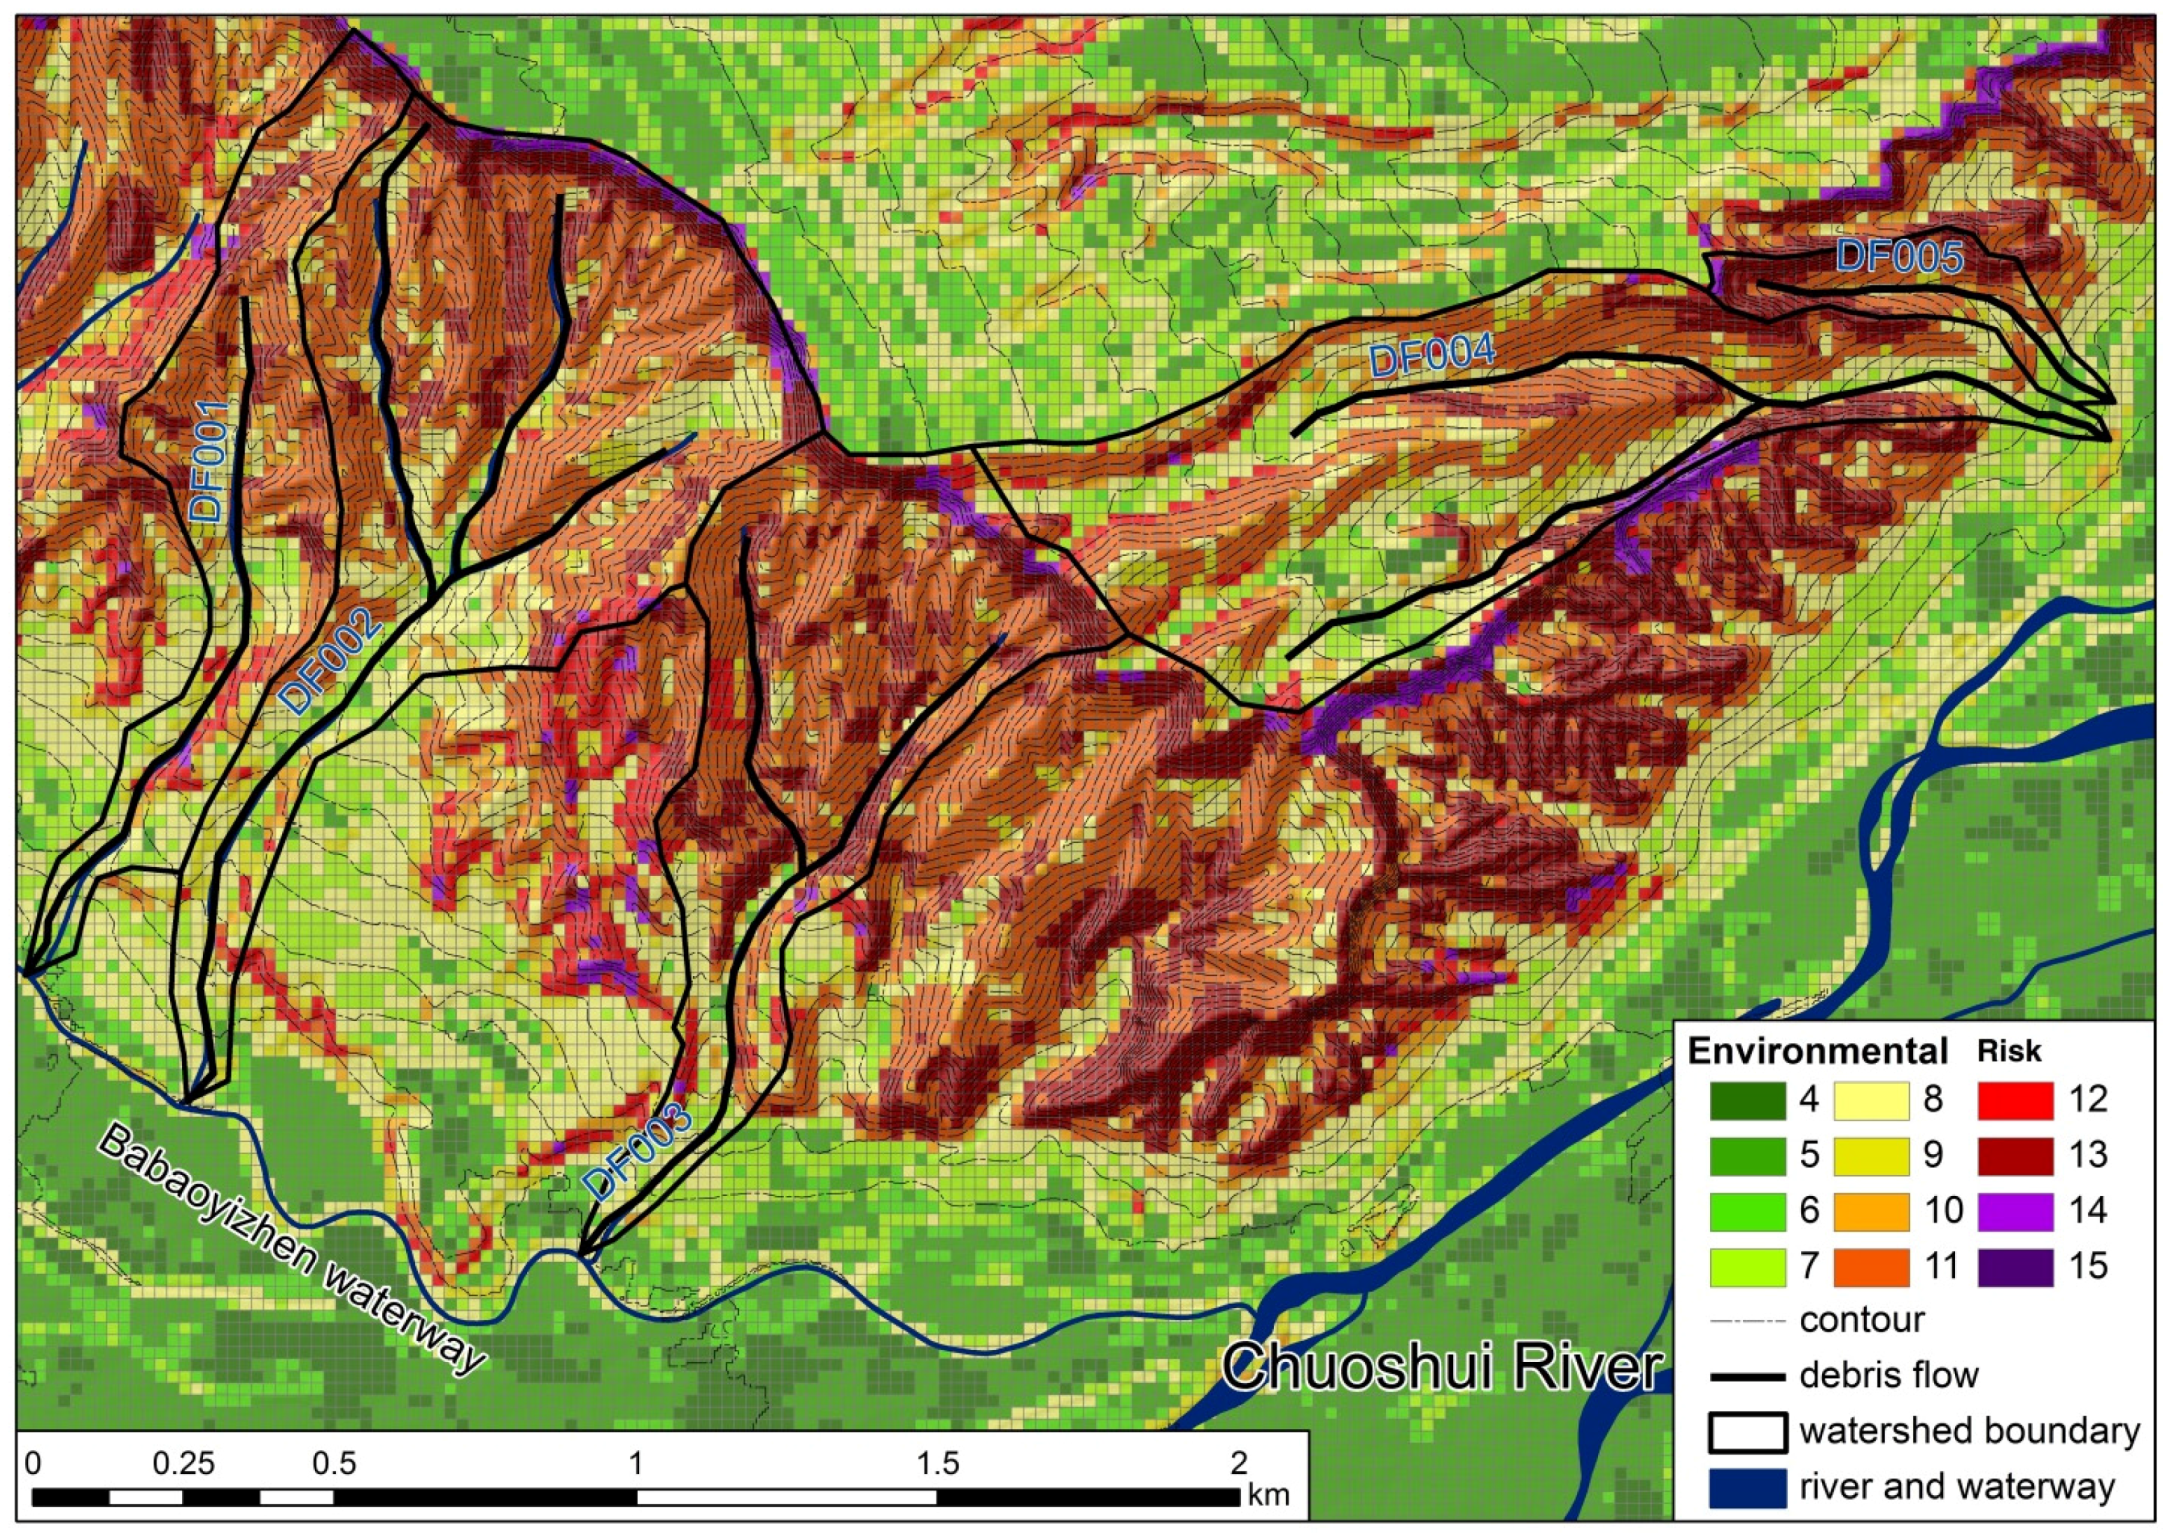
3.1. Study Area
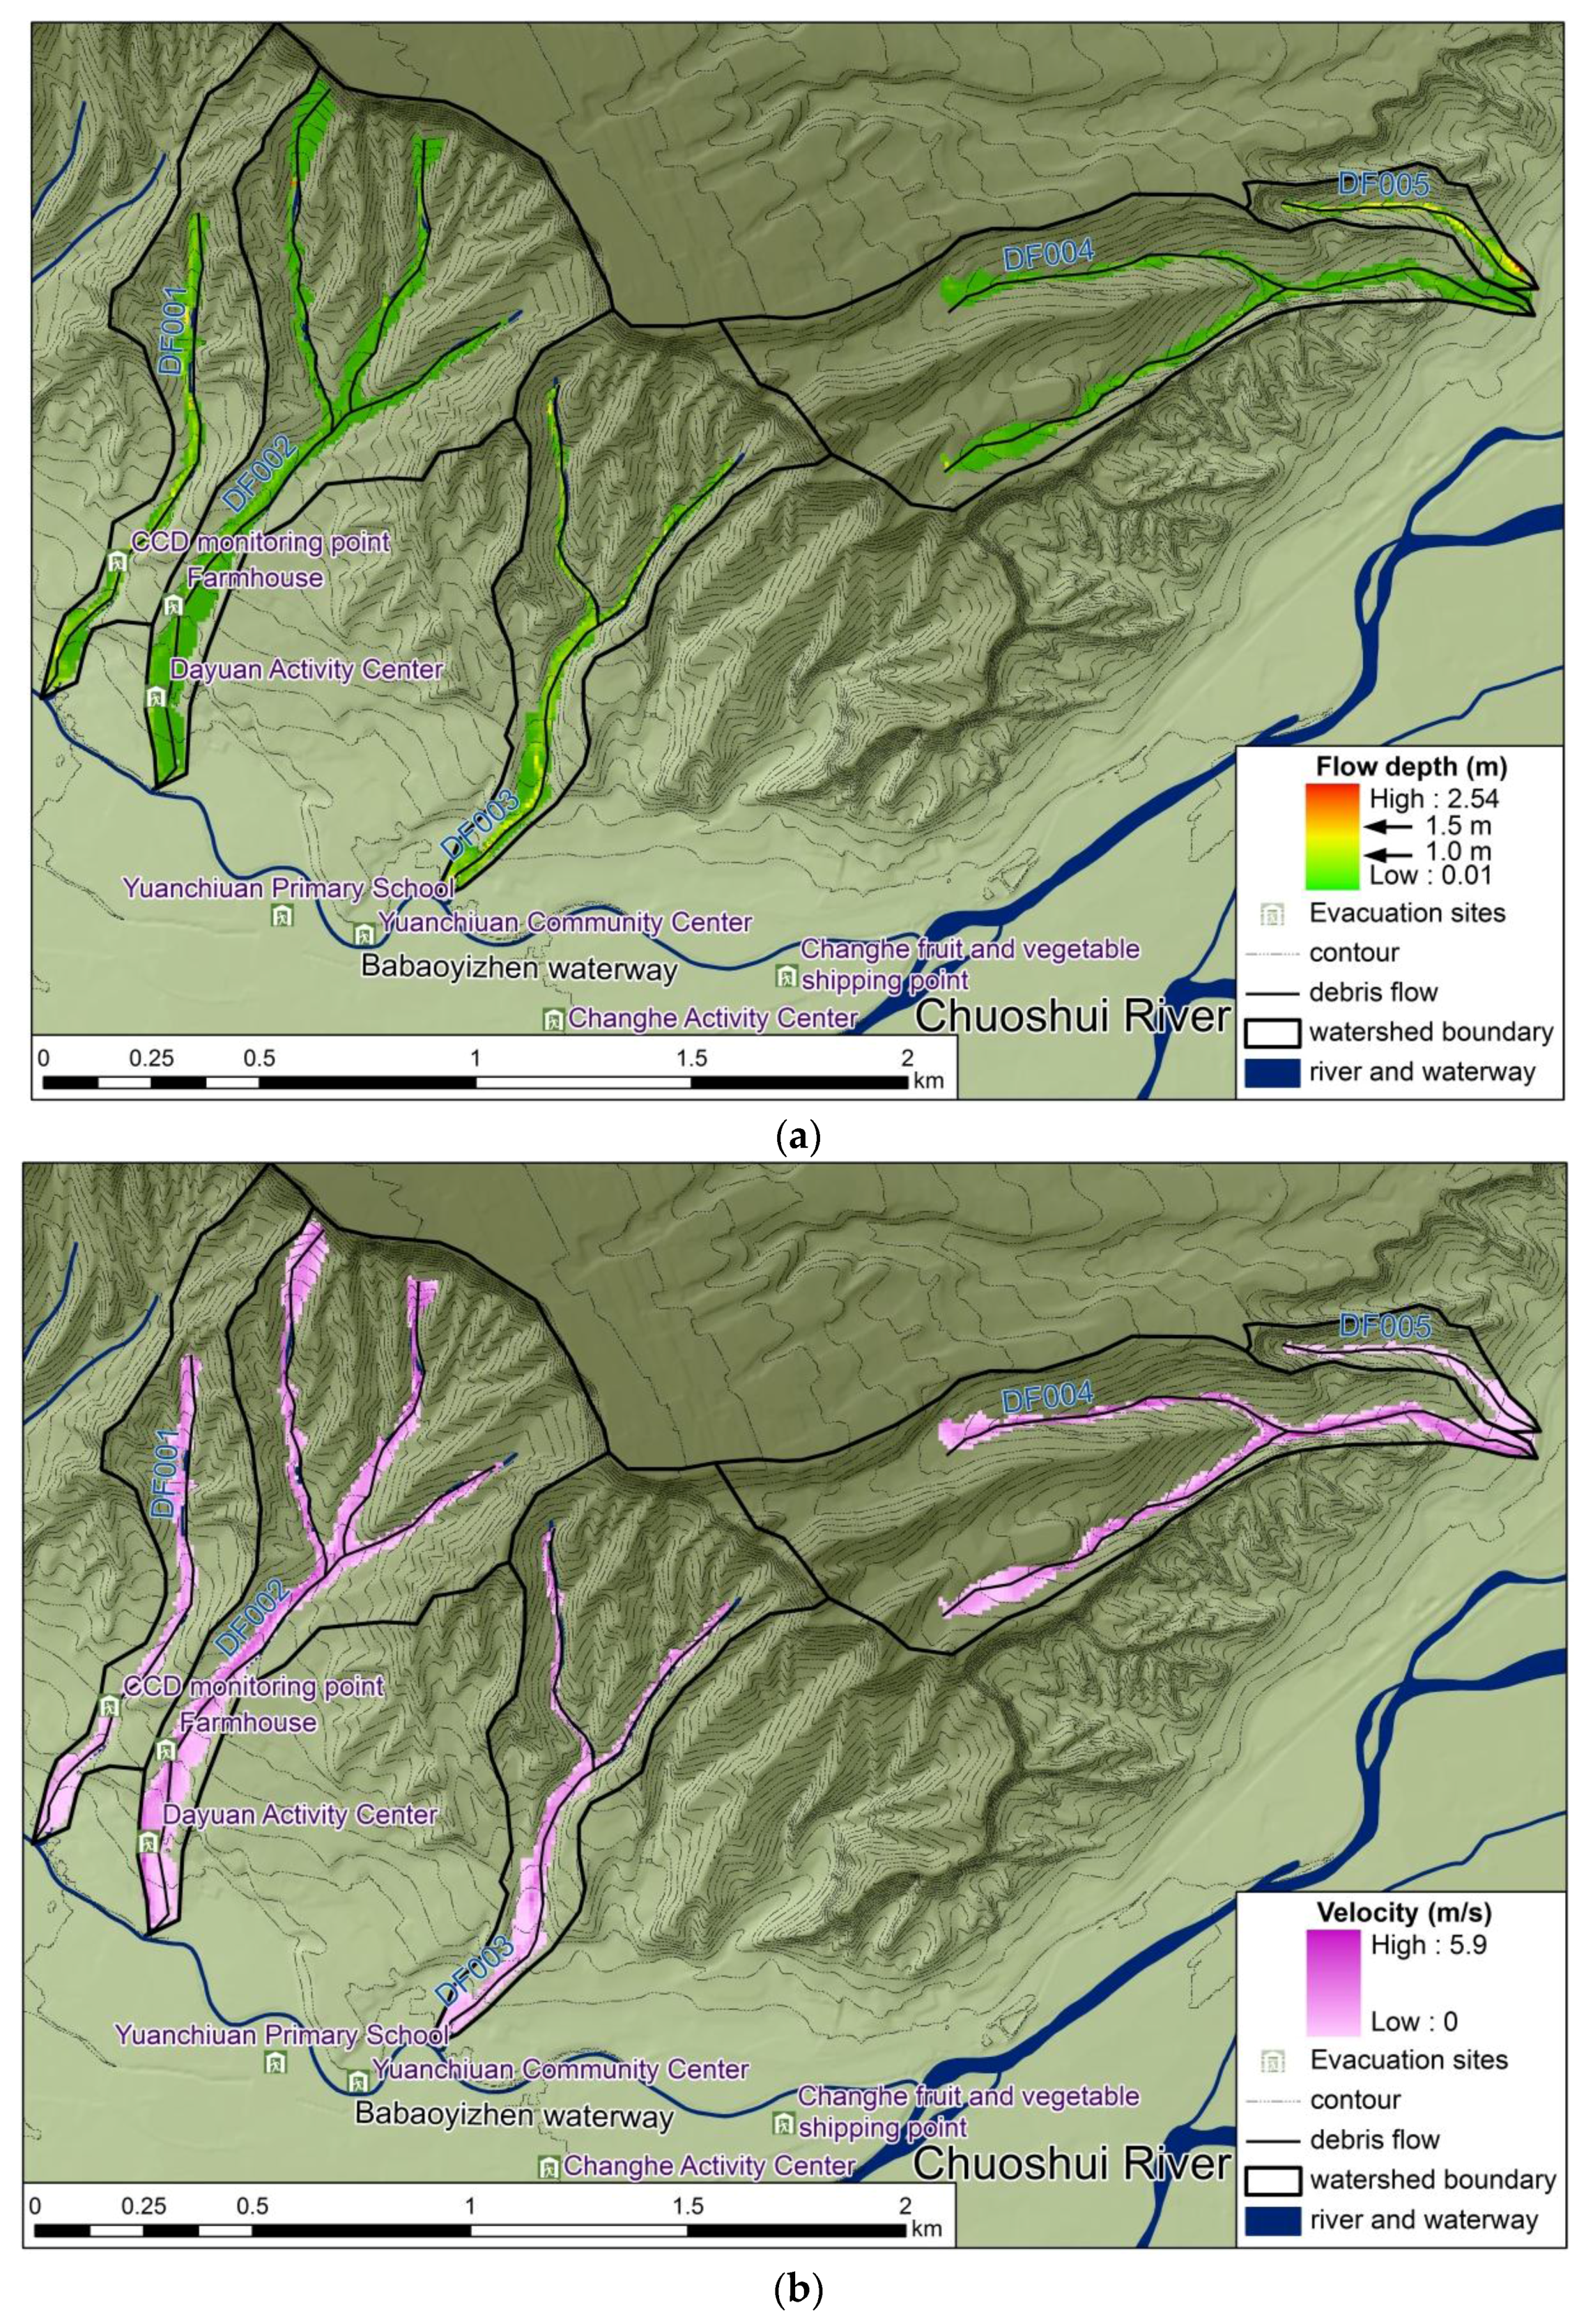
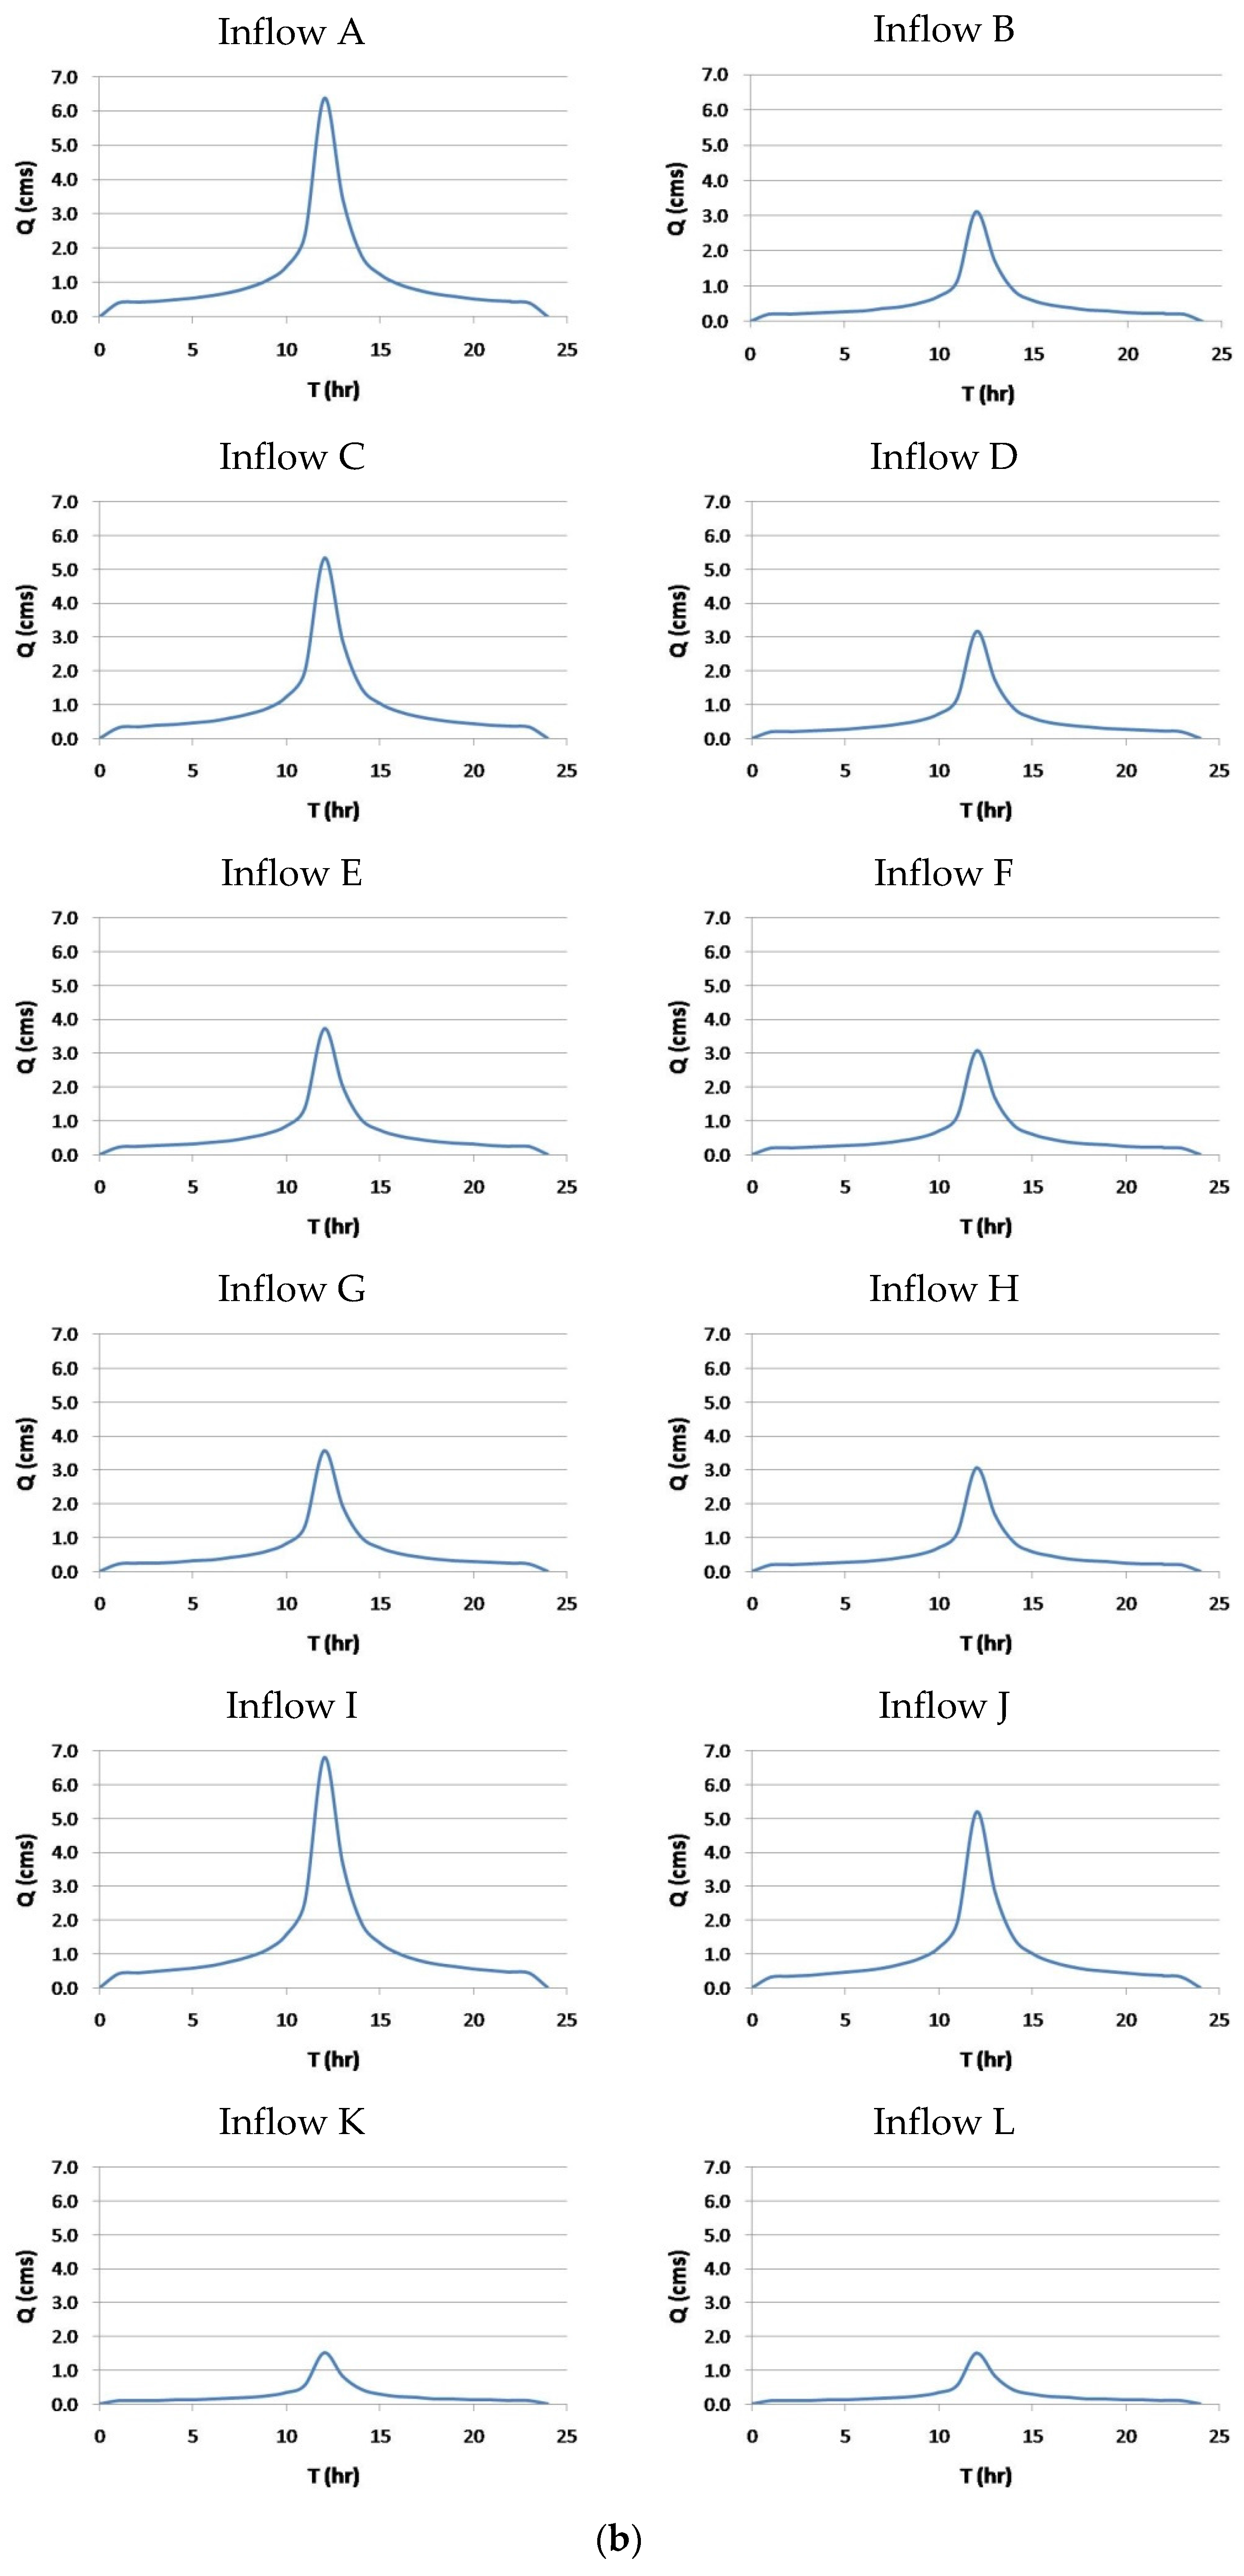
3.2. Numerical Simulations of Potential Debris Flow
| Number | Village | Potential | Households May Be Affected | Rainfall Alert Value during 24 h (mm) |
|---|---|---|---|---|
| DF001 | Dayuan Village | Low | 1~4 households | 500 |
| DF002 | Dayuan Village | Medium | More than 5 households | 500 |
| DF003 | Yuanchuan Village | Low | More than 5 households | 500 |
| DF004 | Changhe Village | Medium | More than 5 households | 500 |
| DF005 | Changhe Village | Medium | More than 5 households | 500 |


3.3. Hazard Assessment of Debris Flow Evacuation Sites
| No. | Name | Position | Environmental Risk | Potential Debris Flow | Hazard Rating | |
|---|---|---|---|---|---|---|
| X | Y | |||||
| 1 | Yuanchiuan Primary School | 213,624 | 2,632,953 | 4 | 0 | 11.0 |
| 2 | Yuanchiuan Community Center | 213,814 | 2,632,909 | 8 | 0 | 32.6 |
| 3 | Changhe fruit and vegetable shipping point | 214,792 | 2,632,813 | 5 | 0 | 11.0 |
| 4 | Changhe Activity Center | 214,250 | 2,632,687 | 4 | 0 | 11.0 |
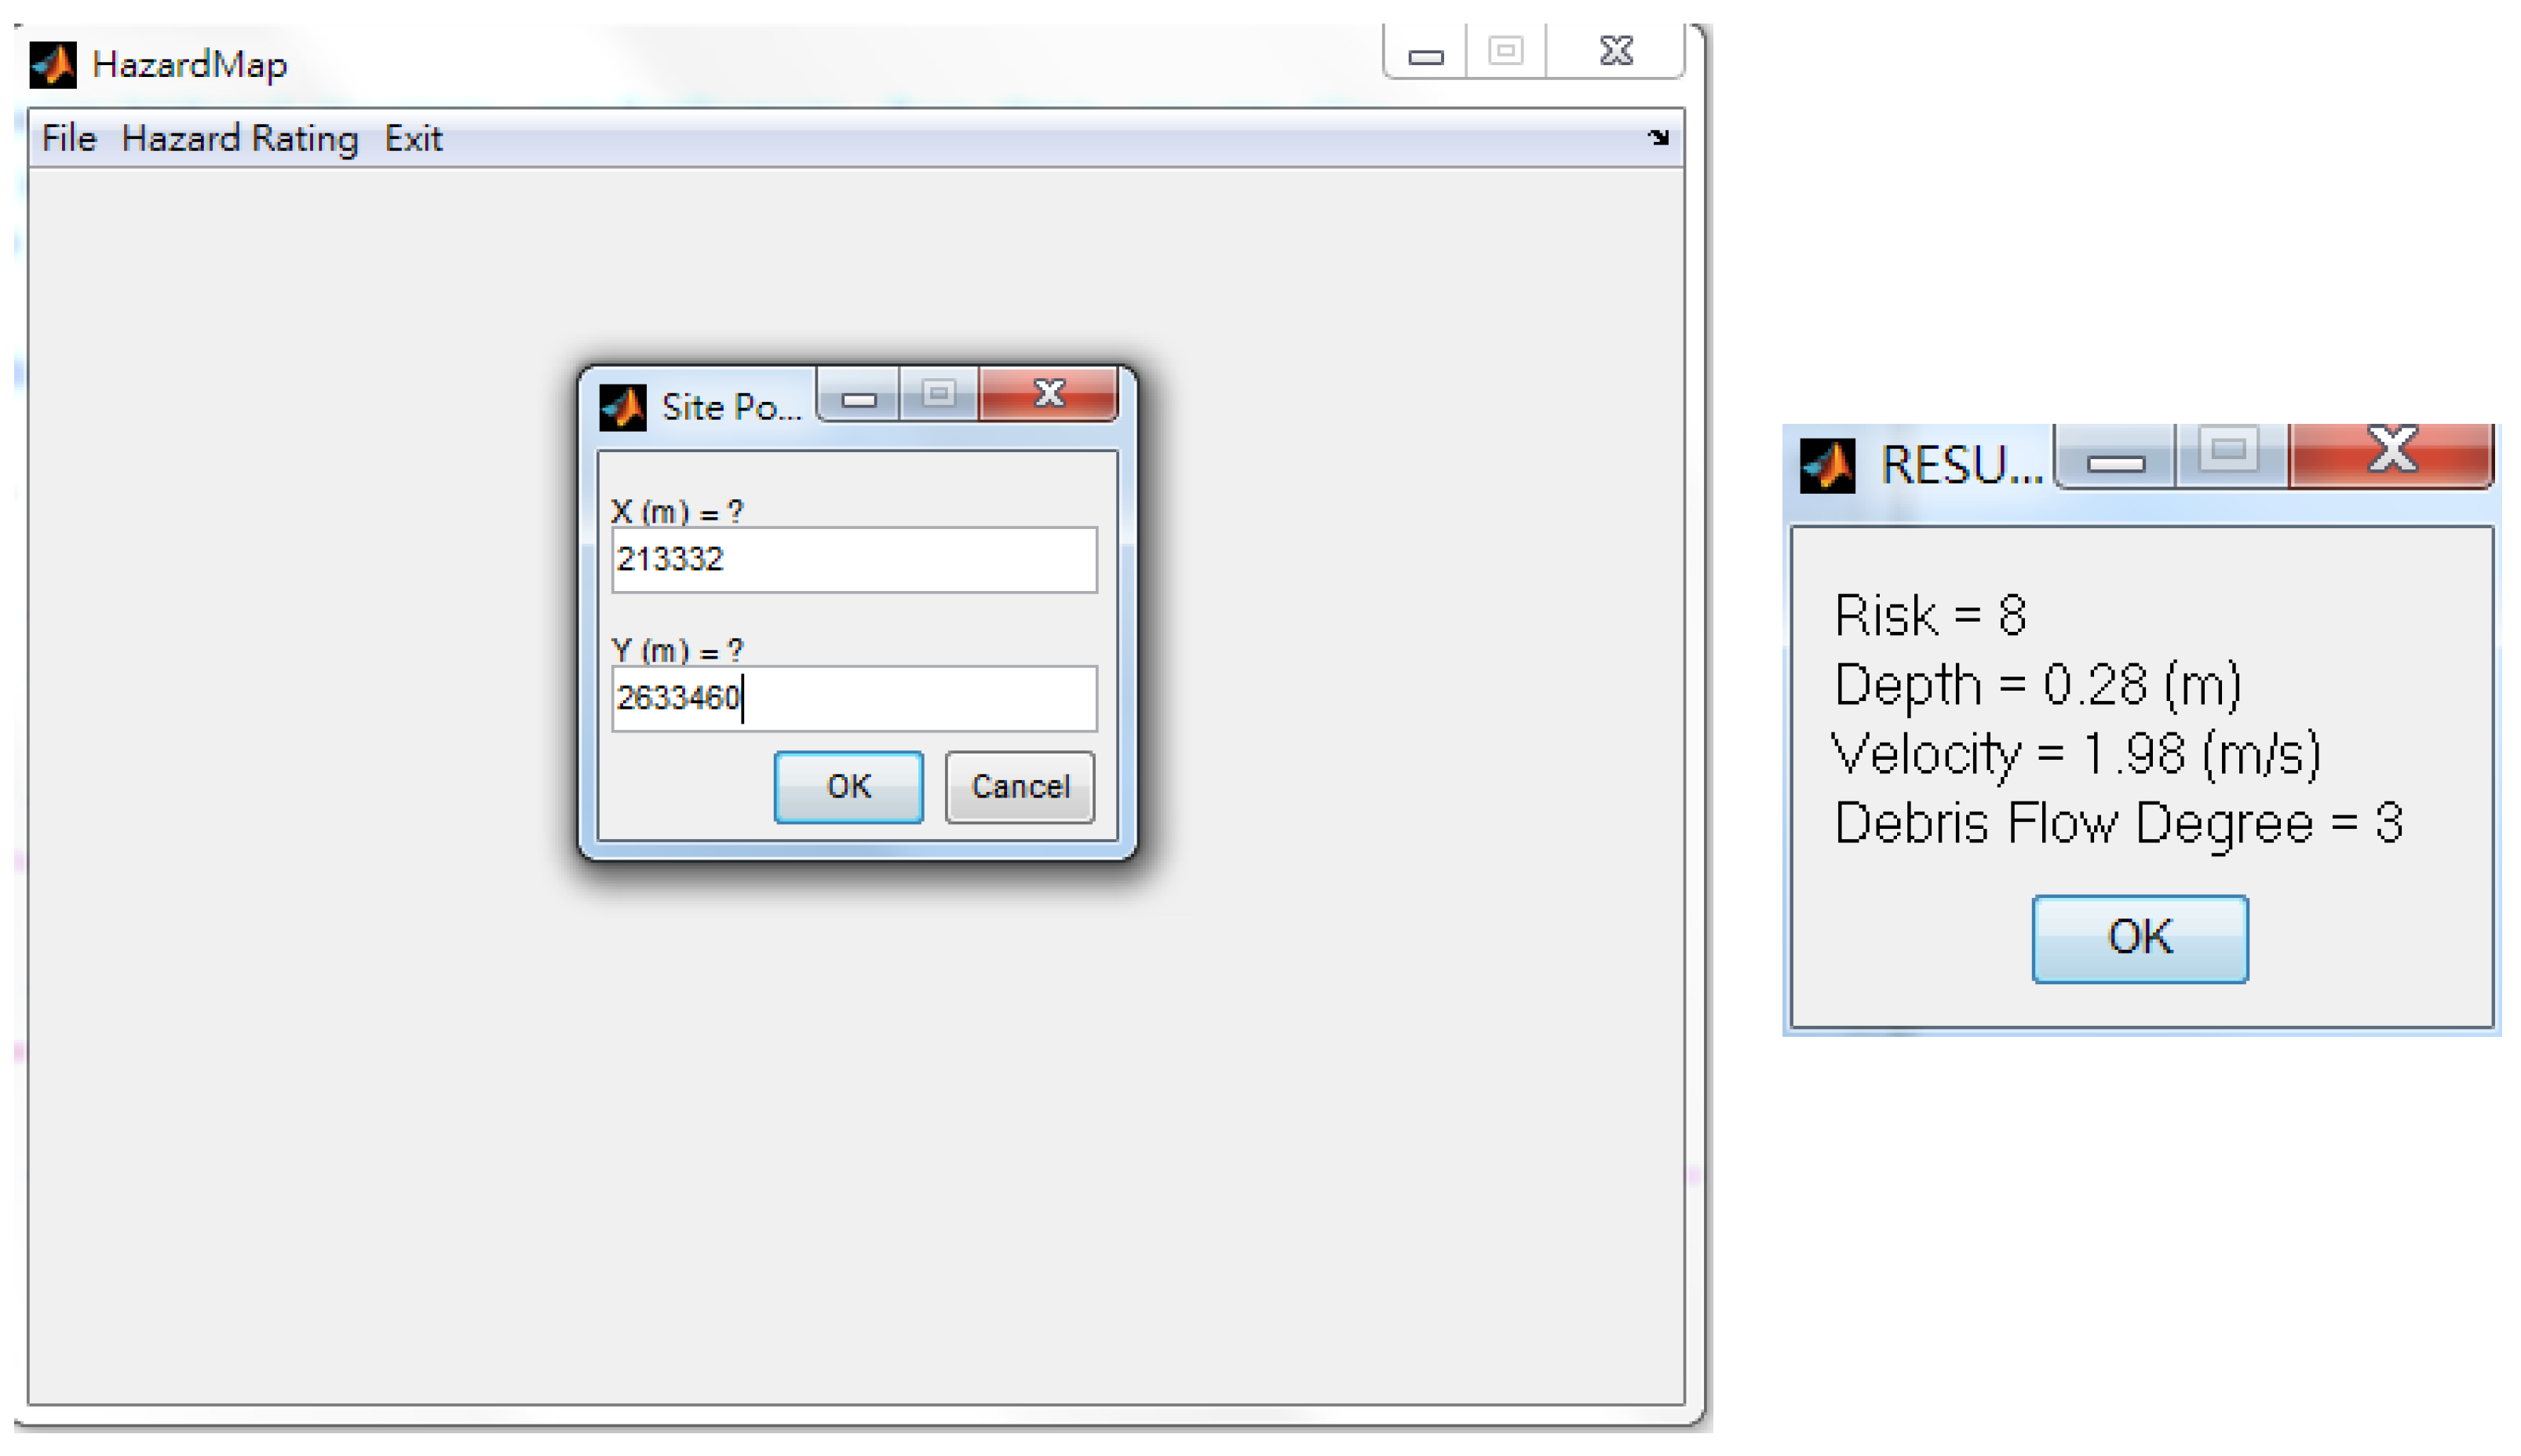
| 5 | Dayuan Activity Center | 213,332 | 2,633,460 | 8 | 3 | 66.3 |
| 6 | CCD monitoring point | 213,243 | 2,633,773 | 12 | 1 | 66.3 |
| 7 | Farmhouse | 213,372 | 2,633,672 | 9 | 3 | 67.4 |

4. Conclusions
Acknowledgments
Conflicts of Interest
References
- Chien, F.C.; Kuo, H.C. On the extreme rainfall of Typhoon Morakot (2009). J. Geophys. Res. Atmos. 2011, 116. [Google Scholar] [CrossRef]
- Ge, X.; Li, T.; Zhang, S.; Peng, M. What causes the extremely heavy rainfall in Taiwan during Typhoon Morakot (2009)? Atmos. Sci. Lett. 2010, 11, 46–50. [Google Scholar] [CrossRef]
- Peng, S.H.; Lu, S.C. FLO-2D simulation of mudflow caused by large landslide due to extremely heavy rainfall in southeastern Taiwan during Typhoon Morakot. J. Mt. Sci. 2013, 10, 207–218. [Google Scholar] [CrossRef]
- Tsou, C.Y.; Feng, Z.Y.; Chigira, M. Catastrophic landslide induced by Typhoon Morakot, Shiaolin, Taiwan. Geomorphology 2011, 127, 166–178. [Google Scholar] [CrossRef]
- Huang, G. A comparative study on flood management in China and Japan. Water 2014, 6, 2821. [Google Scholar] [CrossRef]
- Changhua County Government. Slopeland Drainage Planning Assessment for Four Townships Near Bagua Mountain in the South Changhua County; Changhua County Government: Changhua City, Taiwan, 2007.
- Changhua County Government. Slopeland Drainage Planning Assessment for Four Townships Near Bagua Mountain in the North Changhua County; Changhua County Government: Changhua City, Taiwan, 2009.
- Baker, E.J. Hurricane evacuation behavior. Int. J. Mass Emerg. Disasters 1991, 9, 287–310. [Google Scholar]
- Burnside, R.; Miller, D.S.; Rivera, J.D. The impact of information and risk perception on the hurricane evacuation decision-making of greater New Orleans residents. Sociol. Spectr. 2007, 27, 727–740. [Google Scholar] [CrossRef]
- Dash, N.; Gladwin, H. Evacuation decision making and behavioral responses: Individual and household. Nat. Hazards Rev. 2007, 8, 69–77. [Google Scholar] [CrossRef]
- Dow, K.; Cutter, S.L. Emerging hurricane evacuation issues: Hurricane Floyd and South Carolina. Nat. Hazards Rev. 2002, 3, 12–18. [Google Scholar] [CrossRef]
- Hasan, S.; Ukkusuri, S.; Gladwin, H.; Murray-Tuite, P. Behavioral model to understand household-level hurricane evacuation decision making. J. Transp. Eng. 2011, 137, 341–348. [Google Scholar] [CrossRef]
- Lindell, M.K.; Lu, J.-C.; Prater, C.S. Household decision making and evacuation in response to Hurricane Lili. Nat. Hazards Rev. 2005, 6, 171–179. [Google Scholar] [CrossRef]
- Lindell, M.K.; Prater, C.S. A hurricane evacuation management decision support system (EMDSS). Nat. Hazards 2007, 40, 627–634. [Google Scholar] [CrossRef]
- Stewart, A. The measurement of personal self-efficacy in preparing for a hurricane and its role in modeling the likelihood of evacuation. J. Mar. Sci. Eng. 2015, 3, 630. [Google Scholar] [CrossRef]
- Whitehead, J.C.; Edwards, B.; Van Willigen, M.; Maiolo, J.R.; Wilson, K.; Smith, K.T. Heading for higher ground: Factors affecting real and hypothetical hurricane evacuation behavior. Glob. Environ. Chang. B Environ. Hazards 2000, 2, 133–142. [Google Scholar] [CrossRef]
- Chen, S.C.; Wu, C.Y.; Huang, B.T. The efficiency of a risk reduction program for debris-flow disasters—A case study of the Songhe community in Taiwan. Nat. Hazards Earth Syst. Sci. 2010, 10, 1591–1603. [Google Scholar] [CrossRef]
- Garcia, R.; López, J.L.; Noya, M.; Bello, M.E.; Bello, M.T.; González, N.; Paredes, G.; Vivas, M.I.; O’Brien, J.S. Hazard Mapping for Debris Flow Events in the Alluvial fans of Northern Venezuela, Proceedings of the Third International Conference on Debris-Flow Hazards Mitigation: Mechanics, Prediction and Assessment, Davos, Switzerland, 10–12 September 2003.
- Huang, L.C.; Chang, K.C.; Lee, S.K.; Lee, J.F. Evaluation of simprecise method applied to landslide susceptibility assessment—The case of the Chinshui Hsi River, Hualien. Bull. Geogr. Soc. China 2006, 37, 1–25. [Google Scholar]
- SWCB. Technical Manual for Soil and Water Conservation; Soil and Water Conservation Bureau, Council of Agriculture: Nantou, Taiwan, 2005.
- Steiner, F.R. The Living Landscape: An Ecological Approach to Landscape Planning; Island Press: Washington, DC, USA, 2008. [Google Scholar]
- Malczewski, J. GIS-based multicriteria decision analysis: A survey of the literature. Int. J. Geogr. Inf. Sci. 2006, 20, 703–726. [Google Scholar] [CrossRef]
- Karmakar, S.; Simonovic, S.P.; Peck, A.; Black, J. An information system for risk-vulnerability assessment to flood. J. Geogr. Inf. Syst. 2010, 2, 129–146. [Google Scholar] [CrossRef]
- Al-Hanbali, A.; Alsaaideh, B.; Kondoh, A. Using GIS-based weighted linear combination analysis and remote sensing techniques to select optimum solid waste disposal sites within Mafraq City, Jordan. J. Geogr. Inf. Syst. 2011, 3, 267–268. [Google Scholar] [CrossRef]
- Meng, Y.; Malczewski, J.; Boroushaki, S. A GIS-based multicriteria decision analysis approach for mapping accessibility patterns of housing development sites: A case study in Canmore, Alberta. J. Geogr. Inf. Syst. 2011, 3, 50–61. [Google Scholar] [CrossRef]
- Peng, S.H.; Shieh, M.J.; Fan, S.Y. Potential hazard map for disaster prevention using GIS-based linear combination approach and analytic hierarchy method. J. Geogr. Inf. Syst. 2012, 4, 403–411. [Google Scholar] [CrossRef]
- O’Brien, J.S.; Julien, P.Y.; Fullerton, W.T. Two-dimensional water flood and mudflow simulation. J. Hydraul. Eng. 1993, 119, 244–261. [Google Scholar] [CrossRef]
- SWCB. Integrated Watershed Investigation and Planning Manual; Report of Soil and Water Conservation Bureau, Council of Agriculture: Nantou, Taiwan, 2008.
- Negnevitsky, M. Artificial Intelligence: A Guide to Intelligent Systems, 3rd ed.; Pearson: Harlow, UK, 2011. [Google Scholar]
- MathWorks. Fuzzy Logic Toolbox™ User’s Guide; MathWorks, Incorporated: Natic, MA, USA, 2010. [Google Scholar]
- Juan, Y.K.; Castro, D.; Roper, K. Decision support approach based on multiple objectives and resources for assessing the relocation plan of dangerous hillside aggregations. Eur. J. Oper. Res. 2010, 202, 265–272. [Google Scholar] [CrossRef]
- Chou, L.C. Vulnerability Index of the Disaster-Prone Areas in Changhua and Nantou County; National Science and Technology Center for Disaster Reduction: Taipei, Taiwan, 2012.
- Chow, V.T. Applied Hydrology; McGraw Hill: New York, NY, USA, 1988. [Google Scholar]
- Takahashi, T. Mechanical characteristics of debris flow. J. Hydraul. Div. 1978, 104, 1153–1169. [Google Scholar]
- SWCB. The Investigation and Assessment of Potential Debris Flow Torrents; Report of Soil and Water Conservation Bureau; Council of Agriculture: Nantou, Taiwan, 2014.
- O’Brien, J.S. FLO-2D: User’s Manual Version 2006; FLO Engineering: Nutrioso, AZ, USA, 2006. [Google Scholar]
- Jan, C.D.; Yu, C.Y.; Wu, Y.R. Preliminary study of the influence of sediment concentration on the rheological parameters of flow. In Proceedings of the First Debris Flow Conference, Nantou, Taiwan; 1997; pp. 179–190. [Google Scholar]
- Wu, C.C. Scenario Simulation of Debris-Flow: Examples from Shitou; National Taiwan University: Taipei, Taiwan, 2003. [Google Scholar]
- Chang, C.H.; Wang, Y.T. Establishing hill tribe disaster environmental indicators and application security assessment. J. Chin. Soil Water Conserv. 2015, 46, 123–132. [Google Scholar]
- Chen, C.Y. The factors of evacuation decisions for local governments and inhabitants in debris-flow potential areas. J. Chin. Soil Water Conserv. 2013, 44, 165–178. [Google Scholar] [CrossRef]
© 2016 by the author; licensee MDPI, Basel, Switzerland. This article is an open access article distributed under the terms and conditions of the Creative Commons by Attribution (CC-BY) license (http://creativecommons.org/licenses/by/4.0/).
Share and Cite
Peng, S.-H. Hazard Ratings of Debris Flow Evacuation Sites in Hillside Communities of Ershui Township, Changhua County, Taiwan. Water 2016, 8, 54. https://doi.org/10.3390/w8020054
Peng S-H. Hazard Ratings of Debris Flow Evacuation Sites in Hillside Communities of Ershui Township, Changhua County, Taiwan. Water. 2016; 8(2):54. https://doi.org/10.3390/w8020054
Chicago/Turabian StylePeng, Szu-Hsien. 2016. "Hazard Ratings of Debris Flow Evacuation Sites in Hillside Communities of Ershui Township, Changhua County, Taiwan" Water 8, no. 2: 54. https://doi.org/10.3390/w8020054