Article

Effects of Environmental Factors on the Temporal Stability of Phytoplankton Biomass in a Eutrophic Man-Made Lake

Research Center for Engineering Ecology and Nonlinear Science, North China Electric Power University, Beijing 102206, China
*
Author to whom correspondence should be addressed.
Water 2016, 8(12), 582; https://doi.org/10.3390/w8120582
Submission received: 23 October 2016 / Revised: 29 November 2016 / Accepted: 5 December 2016 / Published: 7 December 2016

Abstract

:
The stability of phytoplankton biomass is important in maintaining the health of an aquatic ecosystem. In this study, the main environmental factors and phytoplankton biomass were investigated monthly from May 2011 to April 2013 in a eutrophic lake. The influence of both the mean values and variability (standard deviation) of environmental factors on the temporal stability index (TSI, measured as coefficient of variation) of phytoplankton was analyzed. Complex relationships were observed between the mean environmental factors and phytoplankton TSI: a positive relationship for dissolved oxygen (DO) and pH, a negative relationship for total nitrogen (TN) and ammonia nitrogen (NH4+-N), a unimodal relationship for total phosphorus (TP), and no relationship for water temperature (WT). Mean values of DO and pH mainly influenced the stability of phytoplankton through increasing the average total biomass. However, mean TN and NH4+-N concentrations destabilized phytoplankton TSI primarily through increasing the variability of community biomass. There were also complex relationships between the variability of environmental factors and phytoplankton TSI: a negative relationship for TN, a unimodal relationship for NH4+-N and TP, and no relationship for WT, DO, and pH. The variability of nutrient concentrations mainly affected phytoplankton TSI through influencing the variability of community biomass, while their influence on the average total biomass was weak. Results in this research will be helpful in understanding the influence of environmental factors on the temporal stability of phytoplankton.

1. Introduction

Phytoplankton is the most important primary producer in aquatic ecosystems and it is characterized by a short generation time and efficient trophic transfer, and is sensitive to the variations of environmental factors [1,2,3,4]. Recently, more and more lakes face eutrophication caused by human activities and global climate warming [5,6,7,8,9]. As a result, catastrophic consequences such as species turnover and algae blooms are common in aquatic ecosystems [3,5,6,10]. Thus, studies on the stability of phytoplankton community and its influencing factors are essential to develop appropriate conservation strategies in aquatic ecosystems [11,12,13,14].
The stability of phytoplankton community is multidimensional and contains a wide range of components, such as temporal and spatial stability, resistance, resilience, persistence, and robustness [15,16,17,18]. In most cases, ecologists mainly focused on the effects of phytoplankton diversity on community stability [19,20,21,22]. Most studies based on artificial phytoplankton communities in the laboratory have shown positive diversity-stability relationships [19,21,23]. McGrady-Steed et al. [19] suggested that aquatic microbial communities with higher diversity were more stable (measured as predictability). Corcoran and Boeing [21] found that phytoplankton temporal stability increased with increasing diversity. However, field investigations conducted over the past few years have shown conflicting diversity-stability relationships in phytoplankton communities [24,25]. Ptacnik et al. [24] reported that there was a negative relationship between phytoplankton species richness and community turnover. Conversely, Filstrup et al. [25] came to a contrary conclusion that more diverse phytoplankton communities would generate higher community turnover. Generally, the analyses of diversity-stability relationships need long-term observation of phytoplankton communities, especially in natural ecosystems [25]. However, the main environmental factors in aquatic ecosystems are not constant values, but rather varying all the time [26,27,28]. Therefore, it remains unknown to what extent the phytoplankton diversity-stability relationship derived from field ecosystems is influenced by the fluctuation of environmental factors.
Among all of the measures of stability, temporal stability is an important one and has drawn much attention [29,30,31]. Ecologists have defined the temporal stability of a community as the coefficient of variation—i.e., the variance in a time series of biomass related to the mean value [29,31]. Therefore, there are two components in calculating the temporal stability of a community: the temporal mean and temporal variability of biomass. Yachi and Loreau [32] suggested that diversity could stabilize ecosystem productivity by increasing the temporal mean and decreasing the temporal variability of productivity. However, some ecologists have found that in natural ecosystems, species diversity was less important than environmental variables in influencing ecosystem functioning [33,34,35]. Grace et al. [35] found that the relationship between plant diversity and community biomass production in grassland ecosystems was weak when compared with other environmental variables. Zimmerman and Cardinale [36] found that taxonomic richness, nitrogen, and phosphorus were the significant variables that influence the biomass of algae in North American lakes. In aquatic ecosystems, both of the two components of phytoplankton temporal stability are influenced by many environmental factors, such as water temperature (WT), dissolved oxygen (DO), pH, dissolved organic carbon, nutrient concentrations, and so on [6,37]. These variables mainly influence the abundance, growth rates, metabolic rates, and photosynthesis of phytoplankton community [6,37]. Meanwhile, the stability of phytoplankton also has an influence on lake environmental variables such as DO, pH, and nutrient concentrations [38,39]. The growth rate of most phytoplankton species increases with growing WT [40,41]; however, when the temperature approaches and exceeds 20 °C, they generally stabilize or decrease [6]. In most temperate regions, WT is the main environmental factor driving the seasonal variations of phytoplankton community [42,43]. It seems that WT is one of the main environmental factors destabilizing the temporal stability of phytoplankton in temperate regions. However, Gonzalez and Descamps-Julien [44] reported that for a given level of species richness, temperature fluctuations induced lower community covariance and thus stabilized community biomass. In addition, nutrient availability also has great influence on the temporal mean and variability of phytoplankton biomass [45]. Rothenberger et al. [27] showed that the long-term variations of phytoplankton community in the Neuse River estuary were strongly related to WT, total nitrogen (TN), and total phosphorus (TP). Salmaso [28] discovered that changes in nutrient concentrations have the greatest effect on the long-term variability of phytoplankton community. Based on the above-mentioned studies, many environmental factors have an influence on the stability of phytoplankton. However, there are two main characteristics in the long-term fluctuation of environmental factors: their mean values and temporal variability. The effects of these two aspects of environmental factors on phytoplankton temporal stability are insufficiently studied.
In the present study, environmental factors and phytoplankton biomass were investigated monthly in a eutrophic lake from May 2011 to April 2013. The relationships between environmental factors (measured as both the mean and variability) and the temporal stability (measured as the coefficient of variance) of phytoplankton were analyzed. The purpose of the present study was to explore the influence of environmental factors on the stability of phytoplankton and to characterize the underlying mechanisms in a eutrophic artificial lake.

2. Materials and Methods
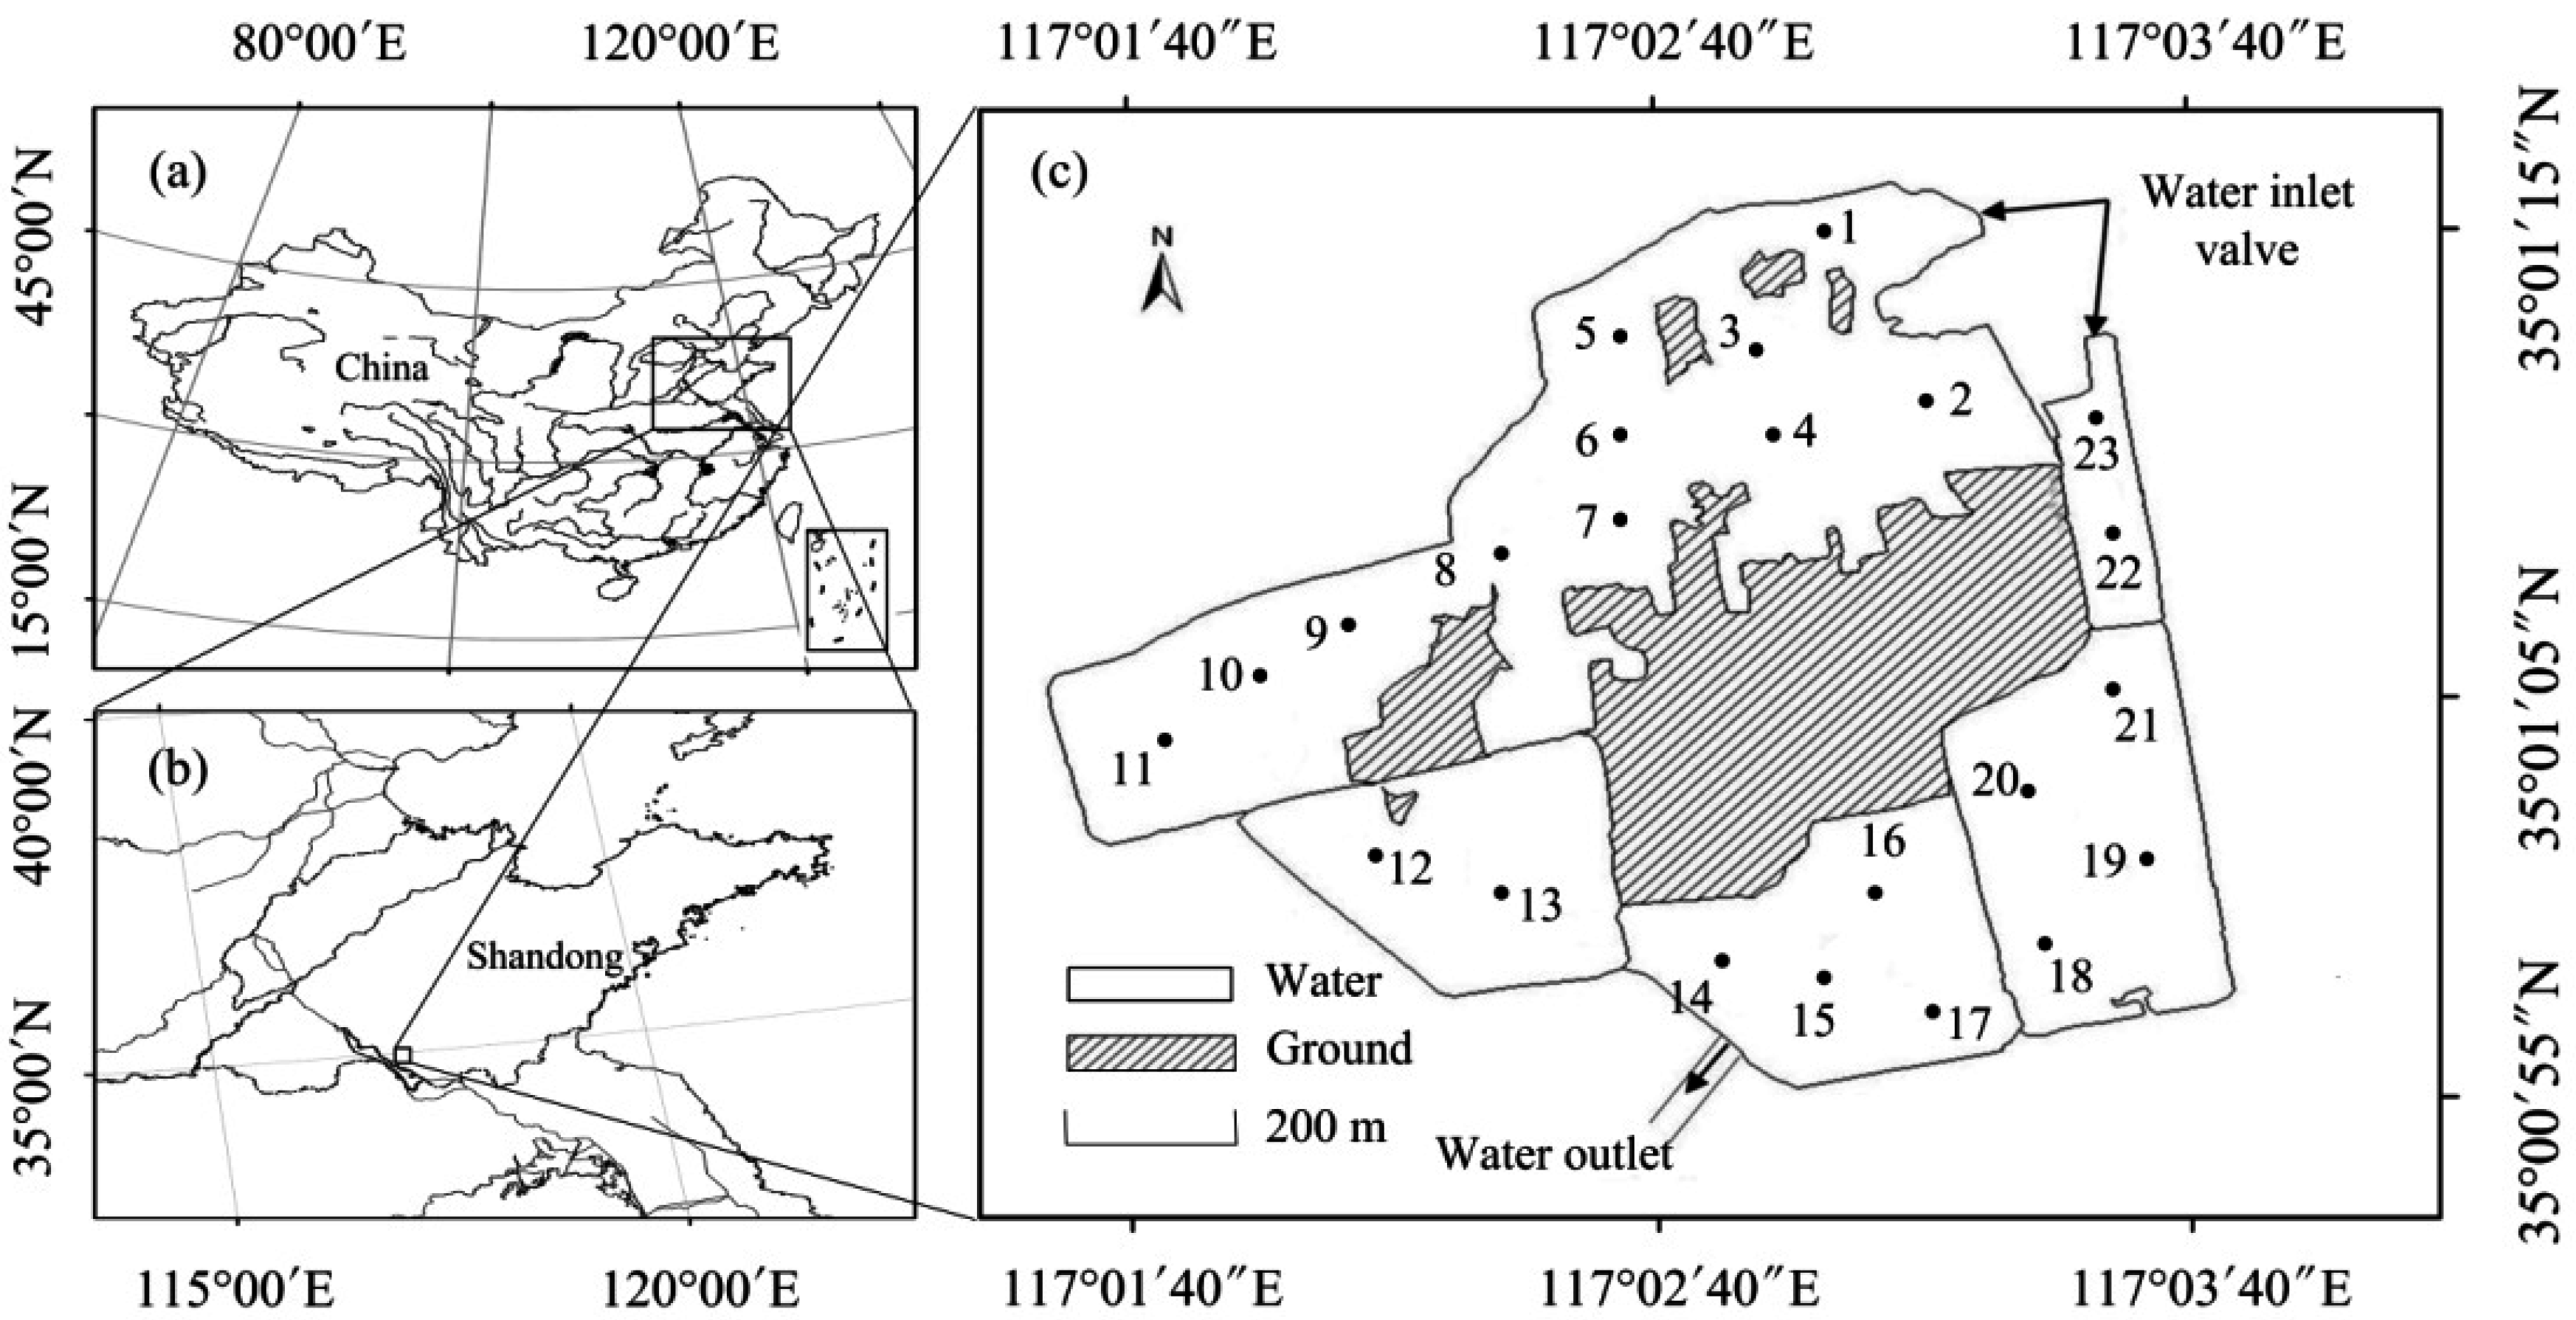
2.1. Study Area

Lake Qixinghu is located in the Shandong Province in China (Figure 1). It was artificially constructed in 2006 on the basis of a coal mine subsidence area. The lake has a total water area of 2.05 km2 and a capacity of about 2.16 × 10⁶ m3. The mean depth of Lake Qixinghu is about 1.50 m with a maximum value of 2.75 m. The climate of the area is warm temperate monsoon with an annual average temperature of 13.7 °C. The annual average rainfall is from 550 mm to 720 mm, and nearly 60% of the precipitation occurs during the rainy summer. The wind in this region is very weak throughout the year. River Chenghe is the fosse of City Zaozhuang and a large amount of industrial wastewater and agricultural runoff is flowing into it. Lake Qixinghu has a water inlet valve, which can help to control the amount of water that flows into the lake. The river flows into the lake almost throughout the year; however, the amount of the flow is changed irregularly and sometimes controlled by the environmental protection department through the inlet valve. There is no other source of water that flows into Lake Qixinghu. The lake also has an outlet valve to keep the balance of water (Figure 1). Polluted water from the coal mine has been specially treated so there is no heavy metal pollution in the lake. As a result, the lake is eutrophic and its main environmental factors vary a lot in different months. Due to its heavy pollution and young age, there are almost no fish in the lake.

2.2. Sampling and Measurements

Data were collected from 23 sites evenly distributed throughout the lake (Figure 1). Field investigations were conducted monthly from May 2011 to April 2013. The positions of the sample sites were taken by a Handheld GPS device to guarantee that all of the investigations were conducted at the same sites. Samplings and measurements were carried out between 8:00 a.m. and 10:00 a.m. along the same route. This time interval was chosen to minimize the effects of plankton migration and was then kept in the following samplings.
WT, DO, and pH were measured in situ using YSI Professional Plus (YSI Incorporated, Yellow Springs, OH, USA) at the 23 sites. Water quality samples were collected using a Tygon tube water sampler at 0.50 m under the water surface. The samples were stored in acid-cleaned glass bottles (the bottles were cleaned with 10% hydrochloric acid and then rinsed repeatedly with deionized water) at 4 °C and filtered through a 0.45-μm acetate filter for subsequent analyses. The concentration of TN was measured using the potassium persulfate oxidation-UV spectrophotometry method [46], ammonia nitrogen (NH4+-N) was determined by Nessler’s reagent spectrophotometry method [46] and TP was measured using the Mo–Sb anti-spectrophotometry method [47]. The phytoplankton biomass at each site was measured as the concentration of chlorophyll a [48]. The concentrations of chlorophyll a were determined by the spectrophotometry method [46].
Previously, many studies used chlorophyll a as an indicator of phytoplankton biomass [48]. However, Felip and Catalan [49] found that chlorophyll a is not simply correlated with phytoplankton biovolume. Kasprzak et al. [50] also suggested that chlorophyll a should be used with caution as a predictor of phytoplankton biomass. Generally, the ratios between phytoplankton biovolume and chlorophyll a were influenced by the nutrient availability, temperature, phytoplankton taxonomic composition, and light intensity of a lake [49]. To obtain the relationship between the two variables in Lake Qixinghu, as well as the effects of zooplankton on phytoplankton, we investigated the plankton community at 16 of the sites (Sites 1, 4, 6, 9, 11–22) in August 2012.
Phytoplankton samples (1 L) were collected from 0.5 m under the water surface at each site and subsequently preserved in acidified Lugol’s solution for 24 h and condensed to 30 mL. A 0.1-mL aliquot of the condensed sample was added to a phytoplankton counting box to identify and quantify the cells of each species [46]. Total phytoplankton biovolume was calculated by adding together the biovolume of all species [51].
Zooplankton samples (1 L) were collected 0.5 m under the water surface and preserved with formaldehyde (4%) for 24 h. The samples were condensed to 50 mL prior to analyses. A 0.1-mL aliquot of the condensed sample was used to count the individual protozoa, and a 1.0-mL sample was used to count the numbers of rotifera, cladocera, and copepods under the microscope [52]. The zooplankton biomass was estimated from the biovolume after comparing the body shape with approximate geometric shapes [52]. The Secchi depth of each site was measured using a Secchi disk.

2.3. Temporal Stability Index and Statistical Analyses

The temporal stability index (TSI) of phytoplankton biomass was measured as the coefficient of variation (the variance in a time series of biomass related to the mean value), which is widely used in ecology [29,31]. The index was calculated using the following equation [29,31]:
TSI = μ σ = Mean ( Chla ) Std ( Chla )
where TSI is the temporal stability index of phytoplankton biomass; Chla is the concentration of chlorophyll a, Std is standard deviation, μ is the average total biomass of phytoplankton, which is calculated as the mean concentration of chlorophyll a in the long-term observation of one sample site; σ is the variability of phytoplankton biomass and calculated as the standard deviation of chlorophyll a. In each sample site, the phytoplankton TSI was calculated using data from May 2011 to April 2013, the temporal mean and variability (measured as standard deviation) of environmental factors were also calculated using data from the same period. Therefore, the relationships between environmental variables and phytoplankton TSI can be analyzed using the data from different sites in the lake.
The temporal stability of phytoplankton biomass comprised two components: average total biomass and the variability of total biomass. Therefore, factors would increase the stability of phytoplankton through increasing the temporal mean or decreasing the temporal variability of biomass [32]. The relationships between environmental factors and the two components of phytoplankton stability were also analyzed to explore the underlying mechanisms.
The differences of environmental factors and phytoplankton biomass among the four seasons were analyzed via one-way analysis of variance (ANOVA). Prior to analysis, the Kolmogorov-Smirnov method was used to test whether the data were normally distributed, and the Bartlett test was performed to assess the homogeneity of variance of the data. Post hoc comparisons were applied using the Tukey HSD test at a significance level of 0.05. The relationships between each of the environmental factors and phytoplankton TSI were analyzed using linear regression analysis and polynomial fitting. The regression model with the minimum Akaike information criterion value was selected as the best fitting [53,54]. To show the combined relationships among all the environmental variables and phytoplankton TSI, principal components analysis (PCA) was carried out using the six environmental factors, their variability, and phytoplankton TSI of the 23 sample sites. All the variables were transformed by log10(x + 1) except for pH. The calculation of PCA was conducted with Canoco for Windows 4.5, and the figure was drawn with Canodraw for Windows.

3. Results

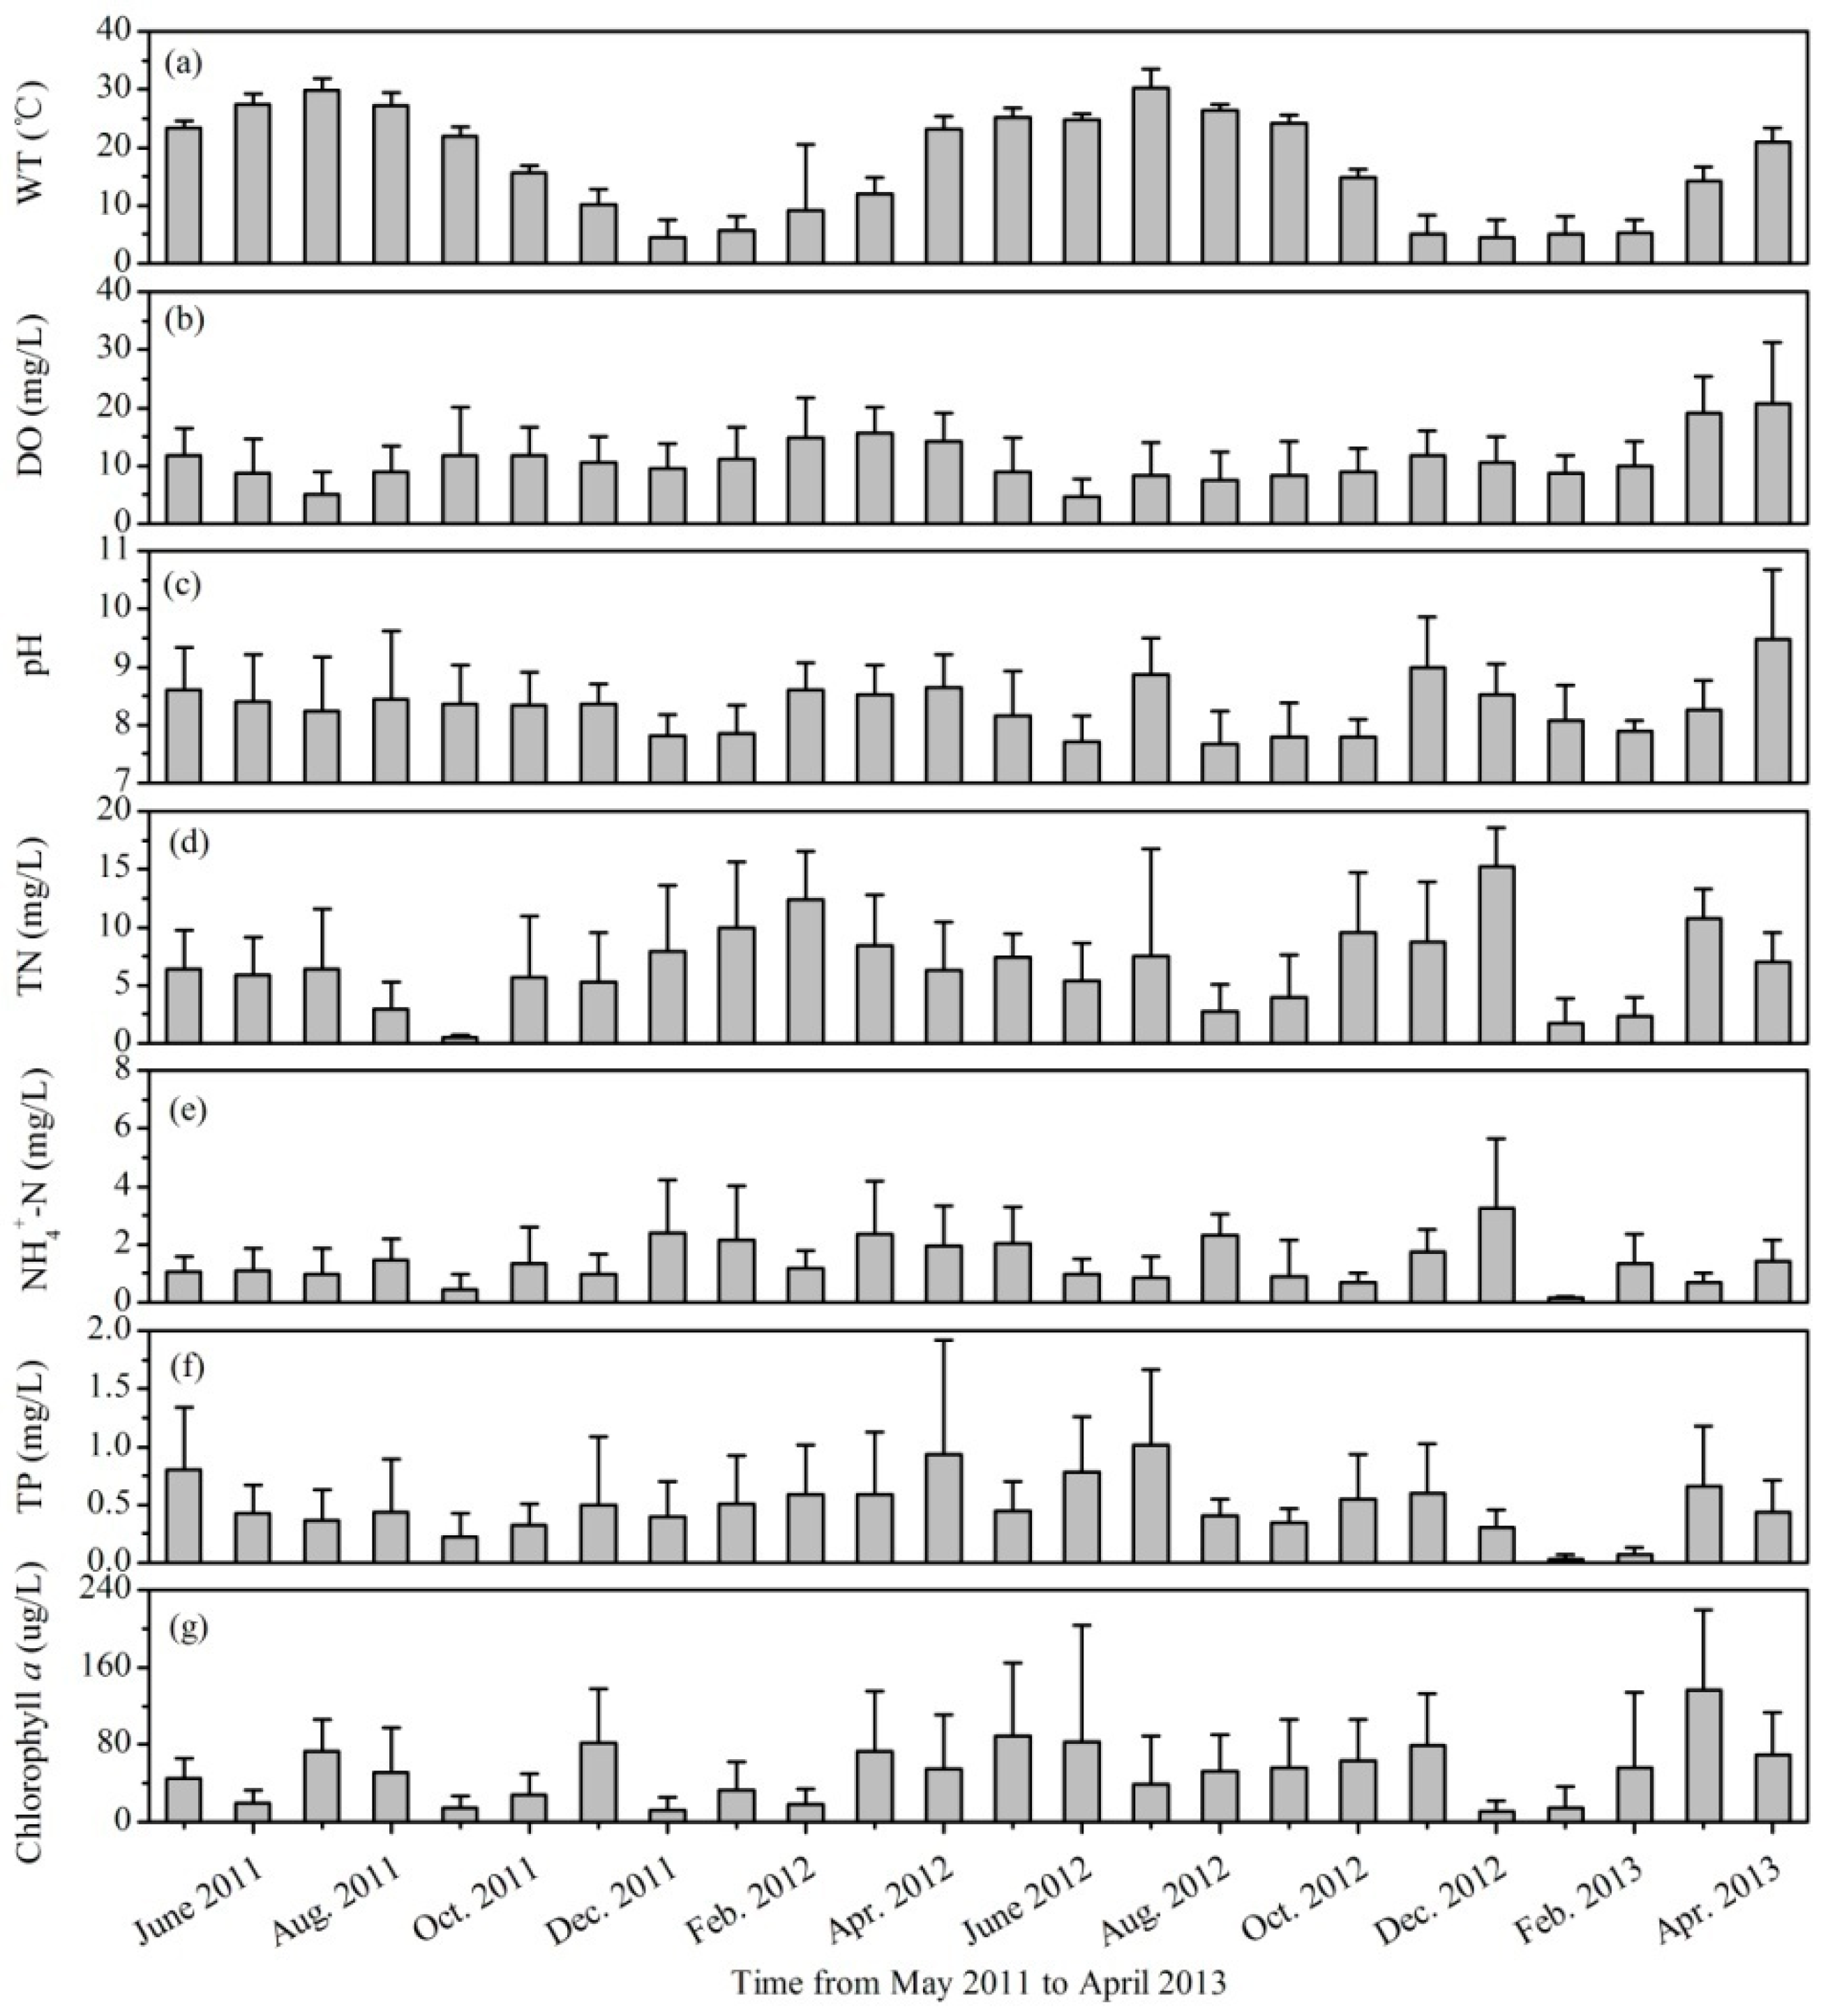
3.1. Variations of Environmental Factors and Phytoplankton Biomass

There were apparent monthly variations of environmental factors (the mean values of the 23 sites in each month) in Lake Qixinghu, as shown in Figure 2. Mean WT in the lake varied from 4.40 ± 3.08 °C (mean ± standard deviation) in December 2011 to 30.28 ± 3.20 °C in July 2012 (Figure 2a). WT in the lake showed apparent seasonal variations (one way ANOVA: F(3, 548) = 376.7, p < 0.001), with a mean value in summer (June, July, and August) significantly higher than that in other seasons (all p < 0.001 by post hoc Tukey HSD). DO concentration in the lake also varied a lot in different months and its mean values ranged between 4.72 ± 3.09 mg/L in June 2012 and 20.66 ± 10.66 mg/L in April 2013 (Figure 2b). There were significant differences of DO in the four seasons (one way ANOVA: F(3, 548) = 42.3, p < 0.001), with mean concentration in spring (March, April, and May) significantly higher than that in other seasons (all p < 0.001 by post hoc Tukey HSD). However, in autumn and winter, mean DO values were nearly at the same level (p > 0.05 by post hoc Tukey HSD). Most of the sites in the lake showed weak alkalinity with a variation of mean pH from 7.67 ± 0.57 in August 2012 to 9.47 ± 1.20 in April 2013 (Figure 2c).
The nutrient concentrations in the lake were high, as shown in Figure 2. Mean TN concentration ranged from 0.46 ± 0.23 mg/L in September 2011 to 15.20 ± 3.33 mg/L in December 2012. There were significant differences of TN in the four seasons (one way ANOVA: F(3, 548) = 11.8, p < 0.001), with mean concentrations in the spring and winter being significantly higher than those in the summer and autumn (all p < 0.01 by post hoc Tukey HSD). Average values of NH4+-N ranged from 0.15 ± 0.07 mg/L in January 2013 to 3.24 ± 2.40 mg/L in December 2012. There were also apparent variations of NH4+-N in the four seasons (one way ANOVA: F(3, 548) = 8.9, p < 0.001), with mean concentrations in the winter and spring being significantly higher than those in the summer and autumn (all p < 0.05 by post hoc Tukey HSD). The mean concentrations of TP varied from 0.03 ± 0.04 mg/L in January 2013 to 1.01 ± 0.65 mg/L in July 2012 in the lake. Significant differences of TP were observed in the four seasons (one way ANOVA: F(3, 548) = 12.9, p < 0.001). The mean concentrations in the spring and summer were significantly higher than those in the autumn and winter (all p < 0.05 by post hoc Tukey HSD). Through the concentrations of nutrients, we could conclude that Lake Qixinghu was in a eutrophic state.
The concentration of chlorophyll a varied a lot in different months, as shown in Figure 2g. Sometimes, there were sharp variations of mean chlorophyll a in two consecutive months. The mean concentration of chlorophyll a ranged from 11.1 ± 10.7 ug/L in December 2012 to 135.9 ± 44.1 ug/L in March 2013, indicating a high phytoplankton biomass in the lake. The concentrations of chlorophyll a were relatively high in the spring and early summer but low in the winter (Figure 2g). One way ANOVA analysis showed that there were significant differences of chlorophyll a in the four seasons (F(3, 548) = 22.4, p < 0.001), with mean values in the spring being significantly higher than that in other seasons (all p < 0.01 by post hoc Tukey HSD). In the summer and autumn, mean chlorophyll a values were nearly at the same level (p > 0.05 by post hoc Tukey HSD).

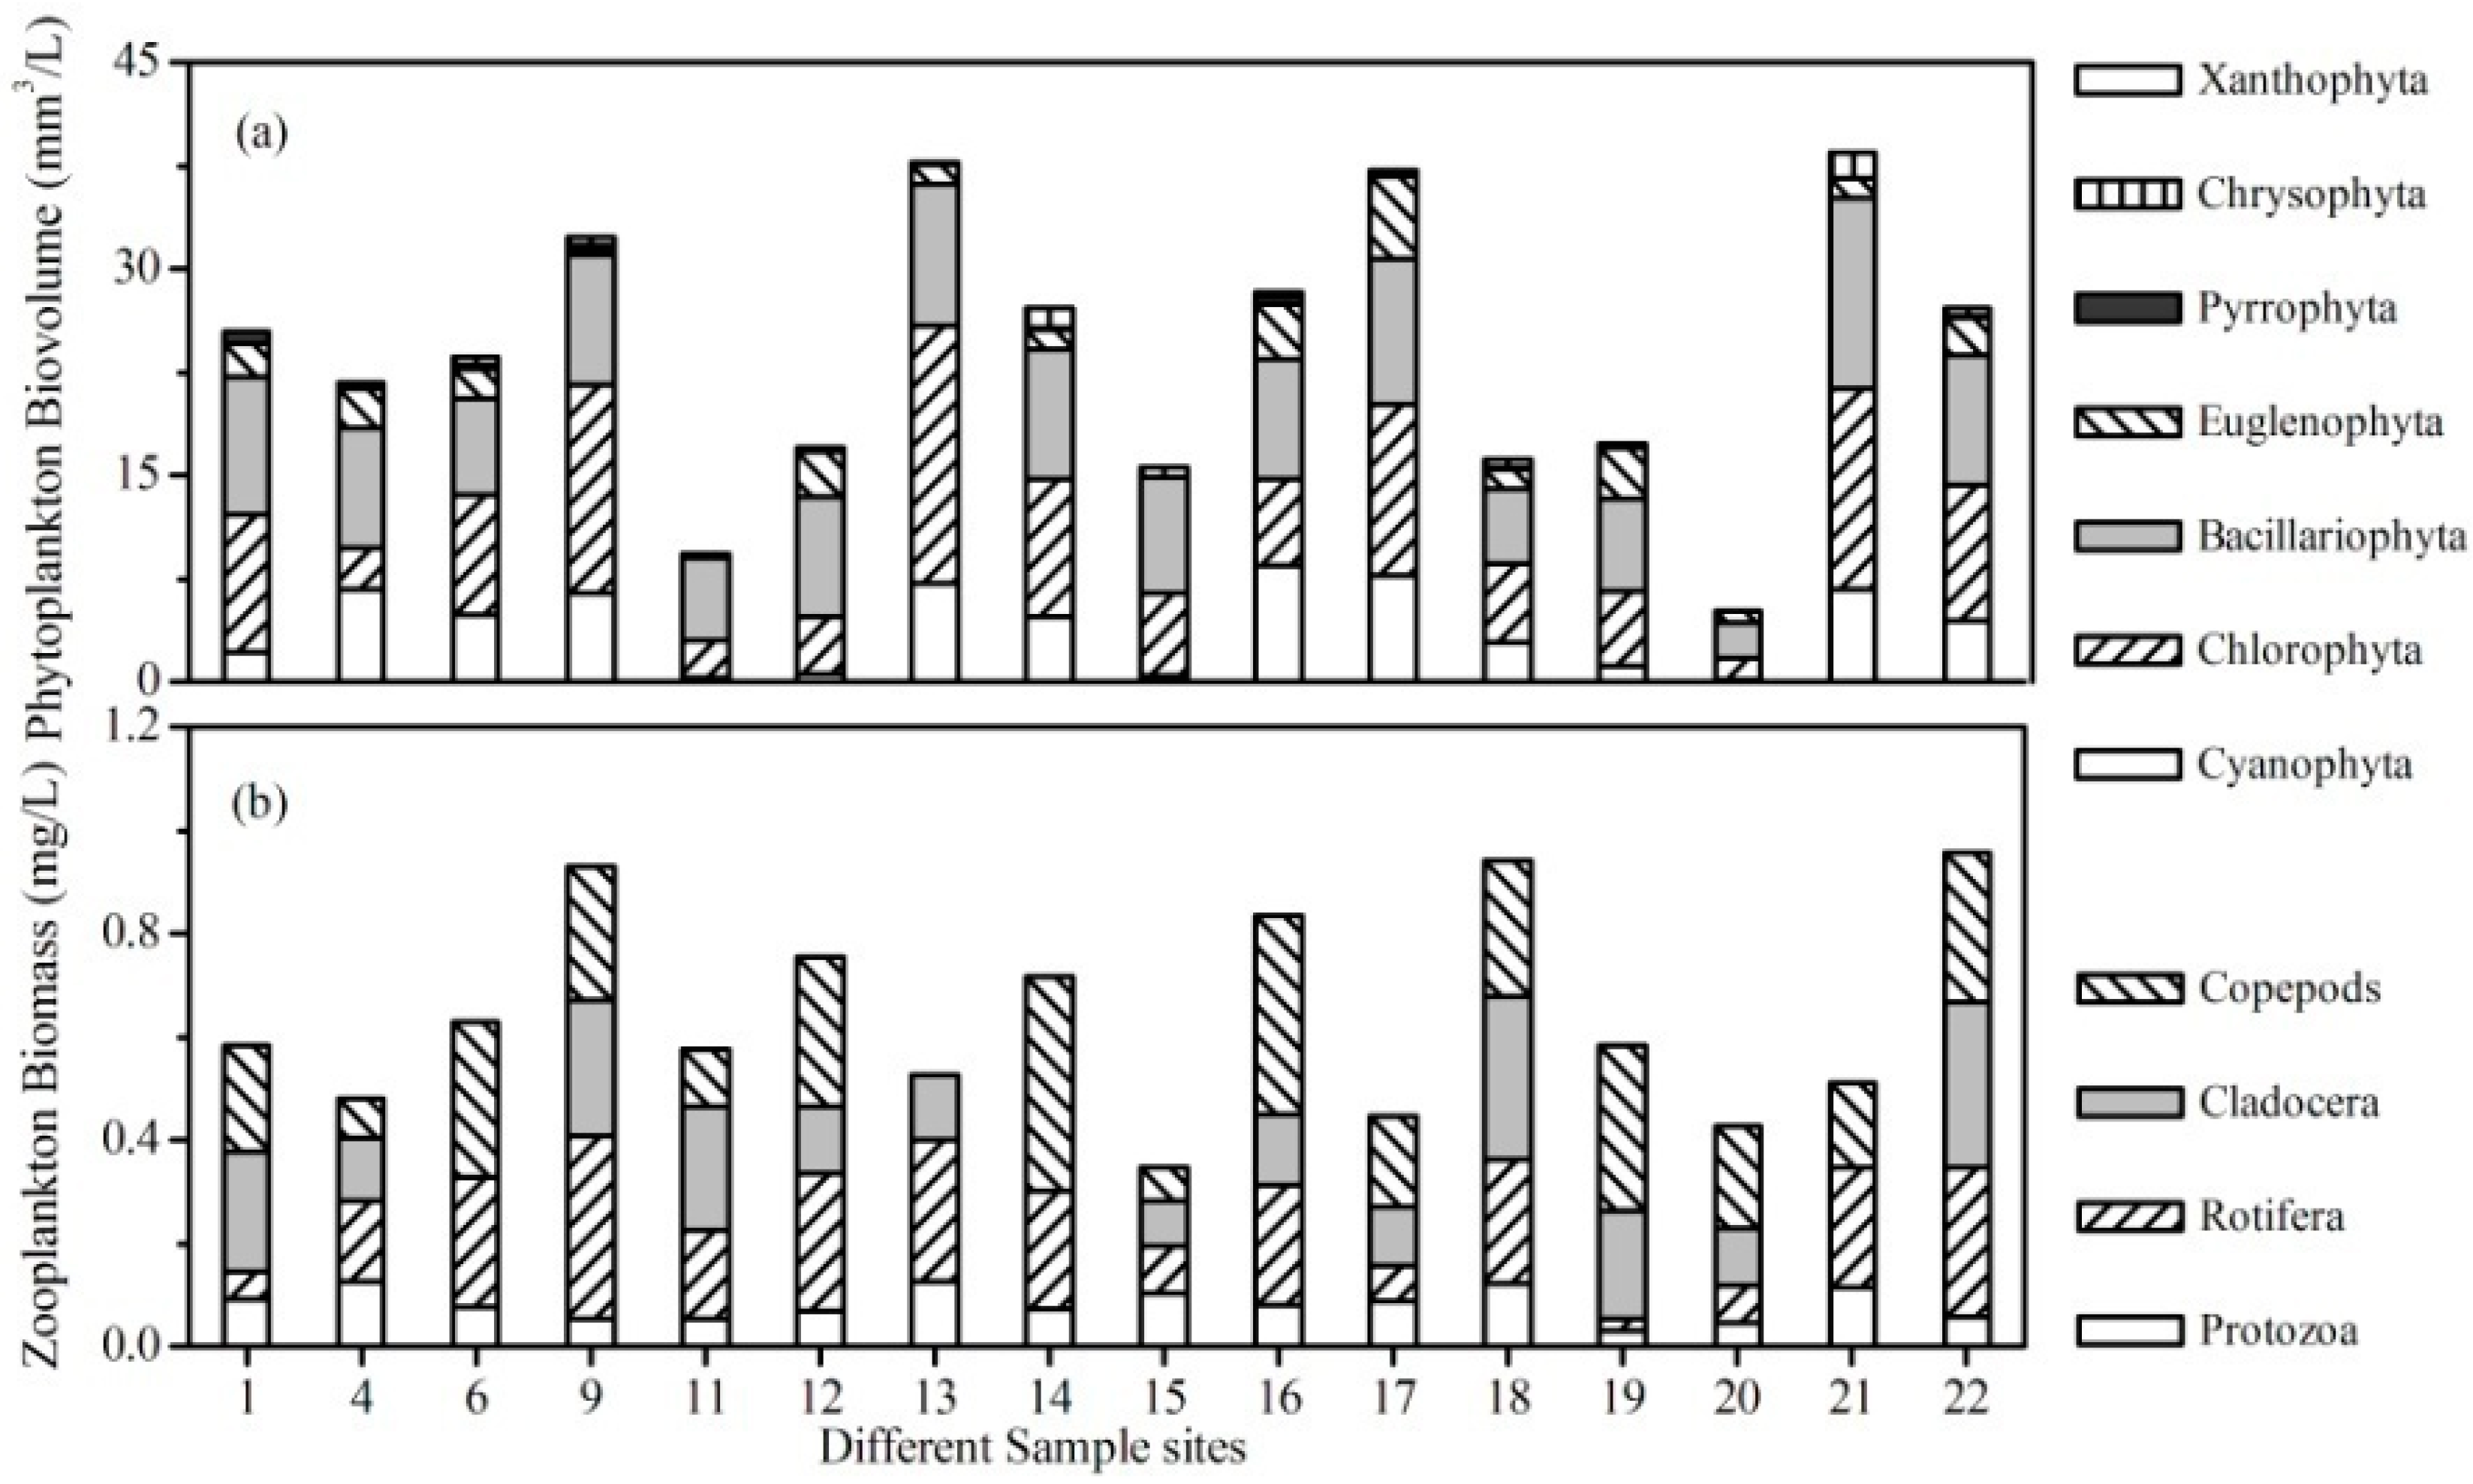
3.2. Plankton Community in the Lake

A total of 71 phytoplankton species belonging to 45 genera and 7 phyla were identified in the lake. The phytoplankton community included 28 Chlorophyta species, 19 Bacillariophyta species and 12 Cyanophyta species. Phytoplankton biovolume in different sites ranged from 5.10 mm3/L to 38.40 mm3/L, with an average value of 23.70 mm3/L. The mean biovolume of Cyanophyta, Chlorophyta, and Bacillariophyta were 4.03 mm3/L, 8.39 mm3/L, and 8.46 mm3/L, which accounted for 17.01%, 35.39%, and 35.71% of the total phytoplankton biovolume, respectively (Figure 3a). The dominant taxa in the lake were Cyclotella (Bacillariophyta), Pandorina (Chlorophyta), and Phormidium (Cyanophyta). Chlorophyll a concentration was strongly correlated with phytoplankton biovolume (R = 0.893, p < 0.001, N = 16), as shown in Figure 4. Ratios between chlorophyll a and phytoplankton biovolume had no relationship with the biovolume proportions of Cyanophyta (R = −0.013, p = 0.962, N = 16), Chlorophyta (R = −0.078, p = 0.773, N = 16), and Bacillariophyta (R = −0.081, p = 0.766, N = 16) in these sites. Secchi depths of the 16 sites varied from 0.95 m to 1.25 m. Secchi depth had no significant influence on the ratios between chlorophyll a and phytoplankton biovolume (R = 0.131, p = 0.628, N = 16).
There were 43 zooplankton species in the lake, including 9 protozoa species, 17 rotifera species, 9 cladocera species, and 8 copepods species. Zooplankton biomass in different sites ranged from 0.35 mg/L to 0.96 mg/L, with an average value of 0.64 mg/L. The mean biomasses of protozoa, rotifera, cladocera, and copepods were 0.08 mg/L, 0.19 mg/L, 0.15 mg/L, and 0.22 mg/L, respectively (Figure 3b). Zooplankton biomass in the lake was very low due to the heavy pollution and young age of the lake.

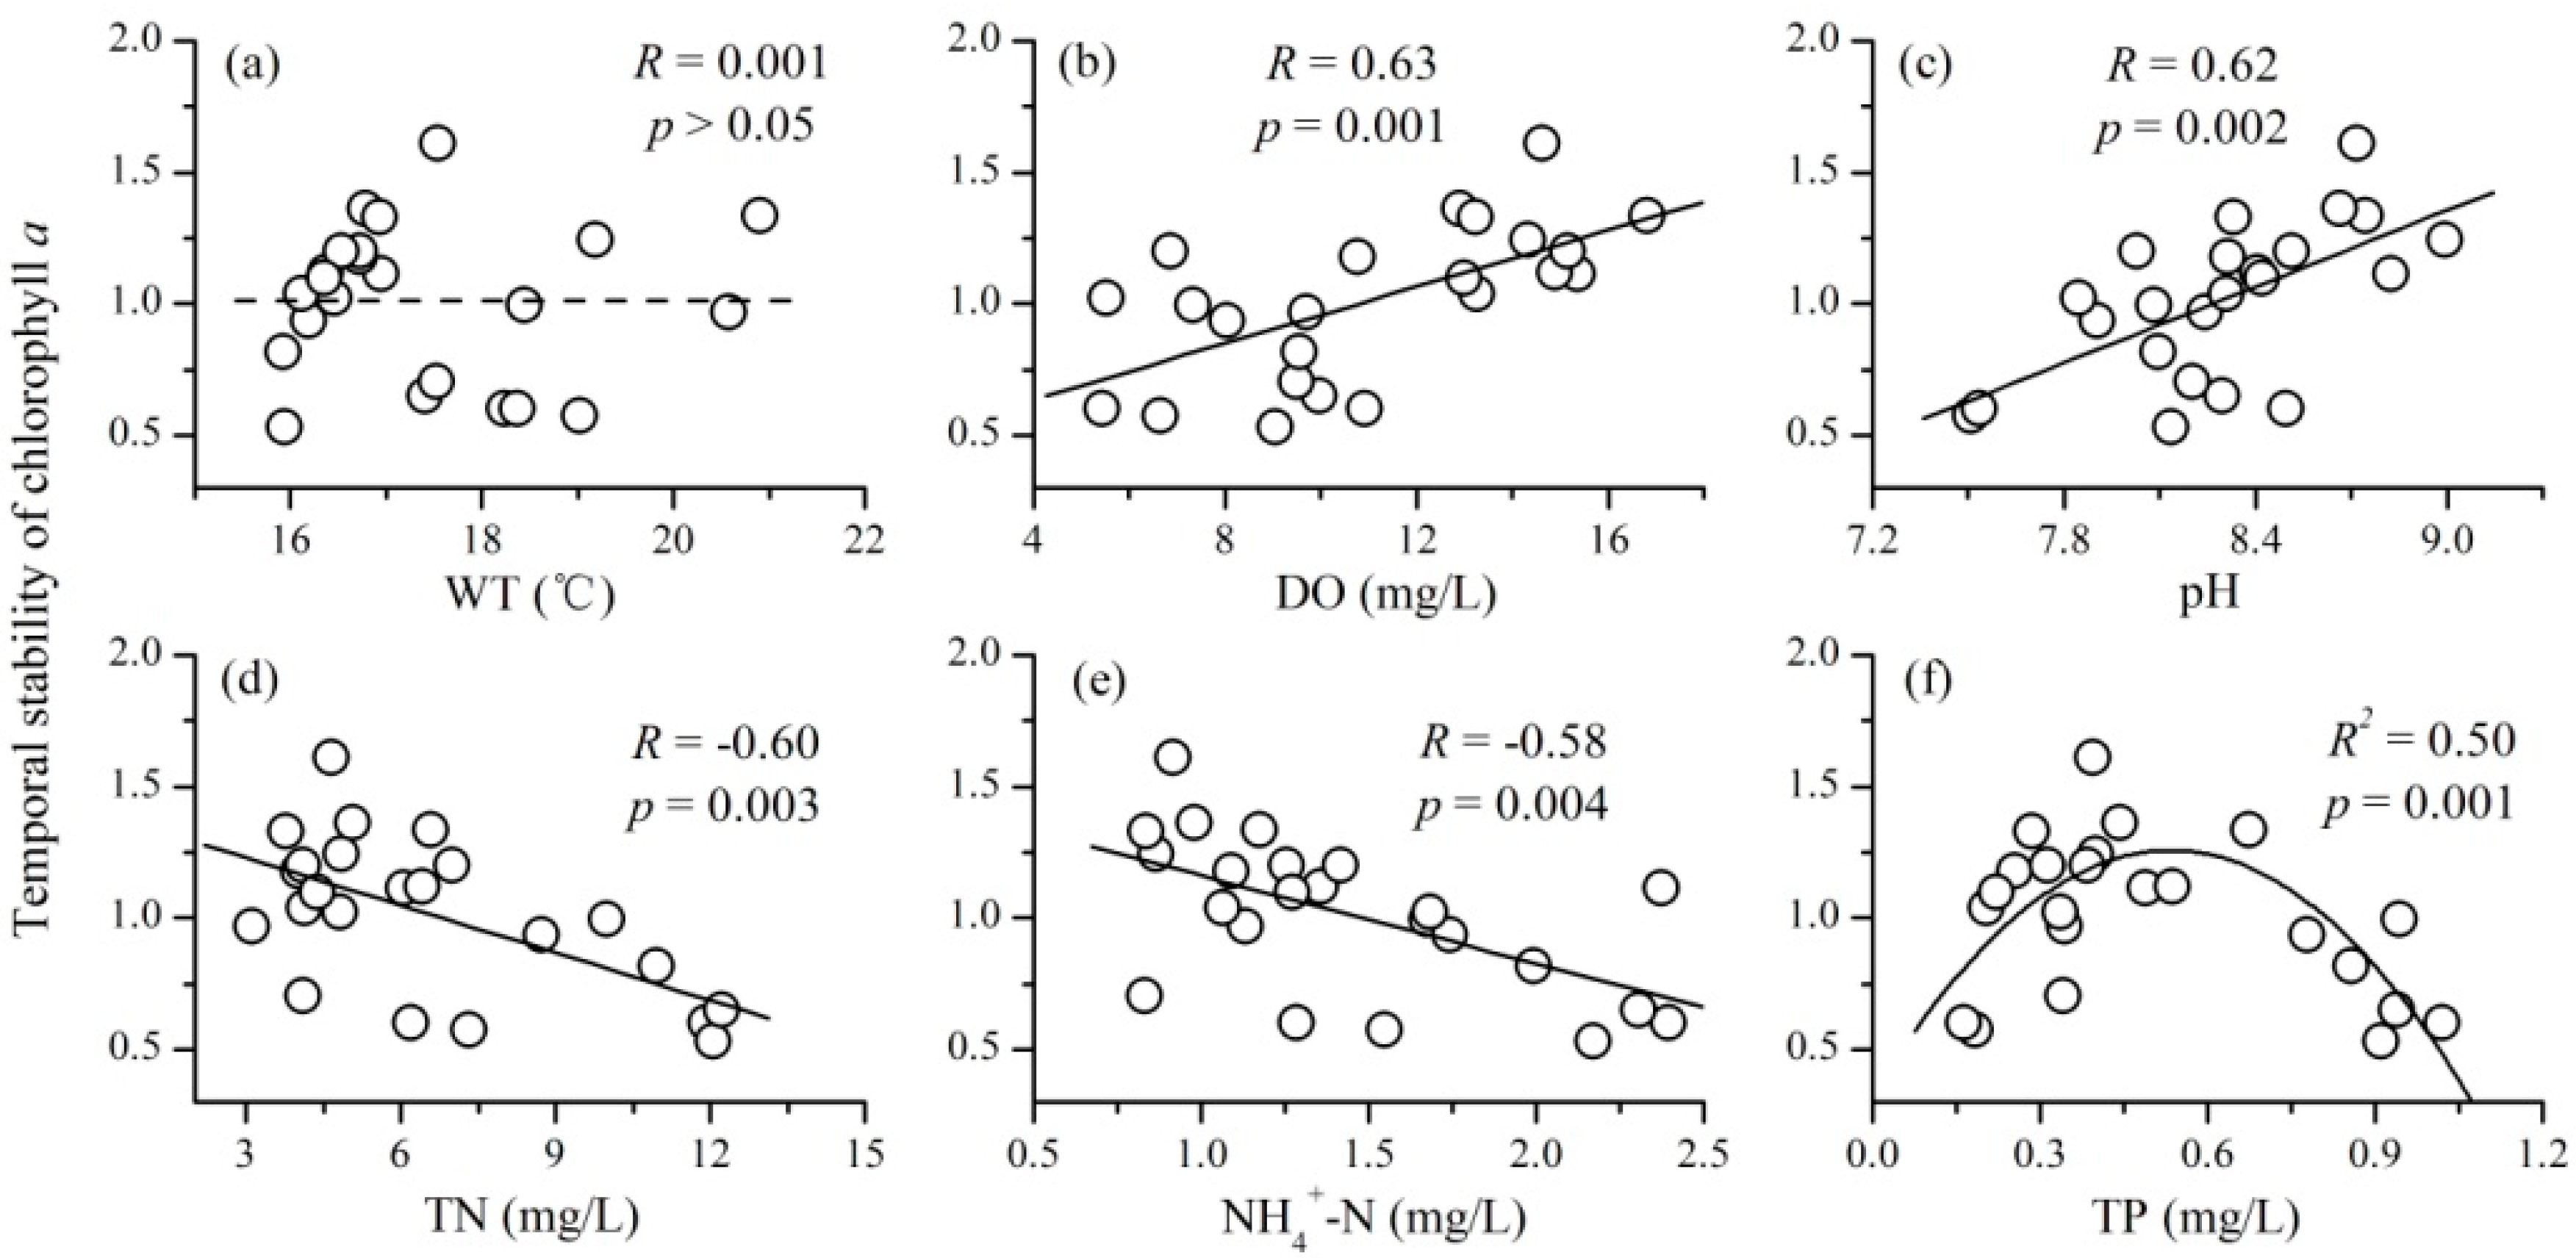
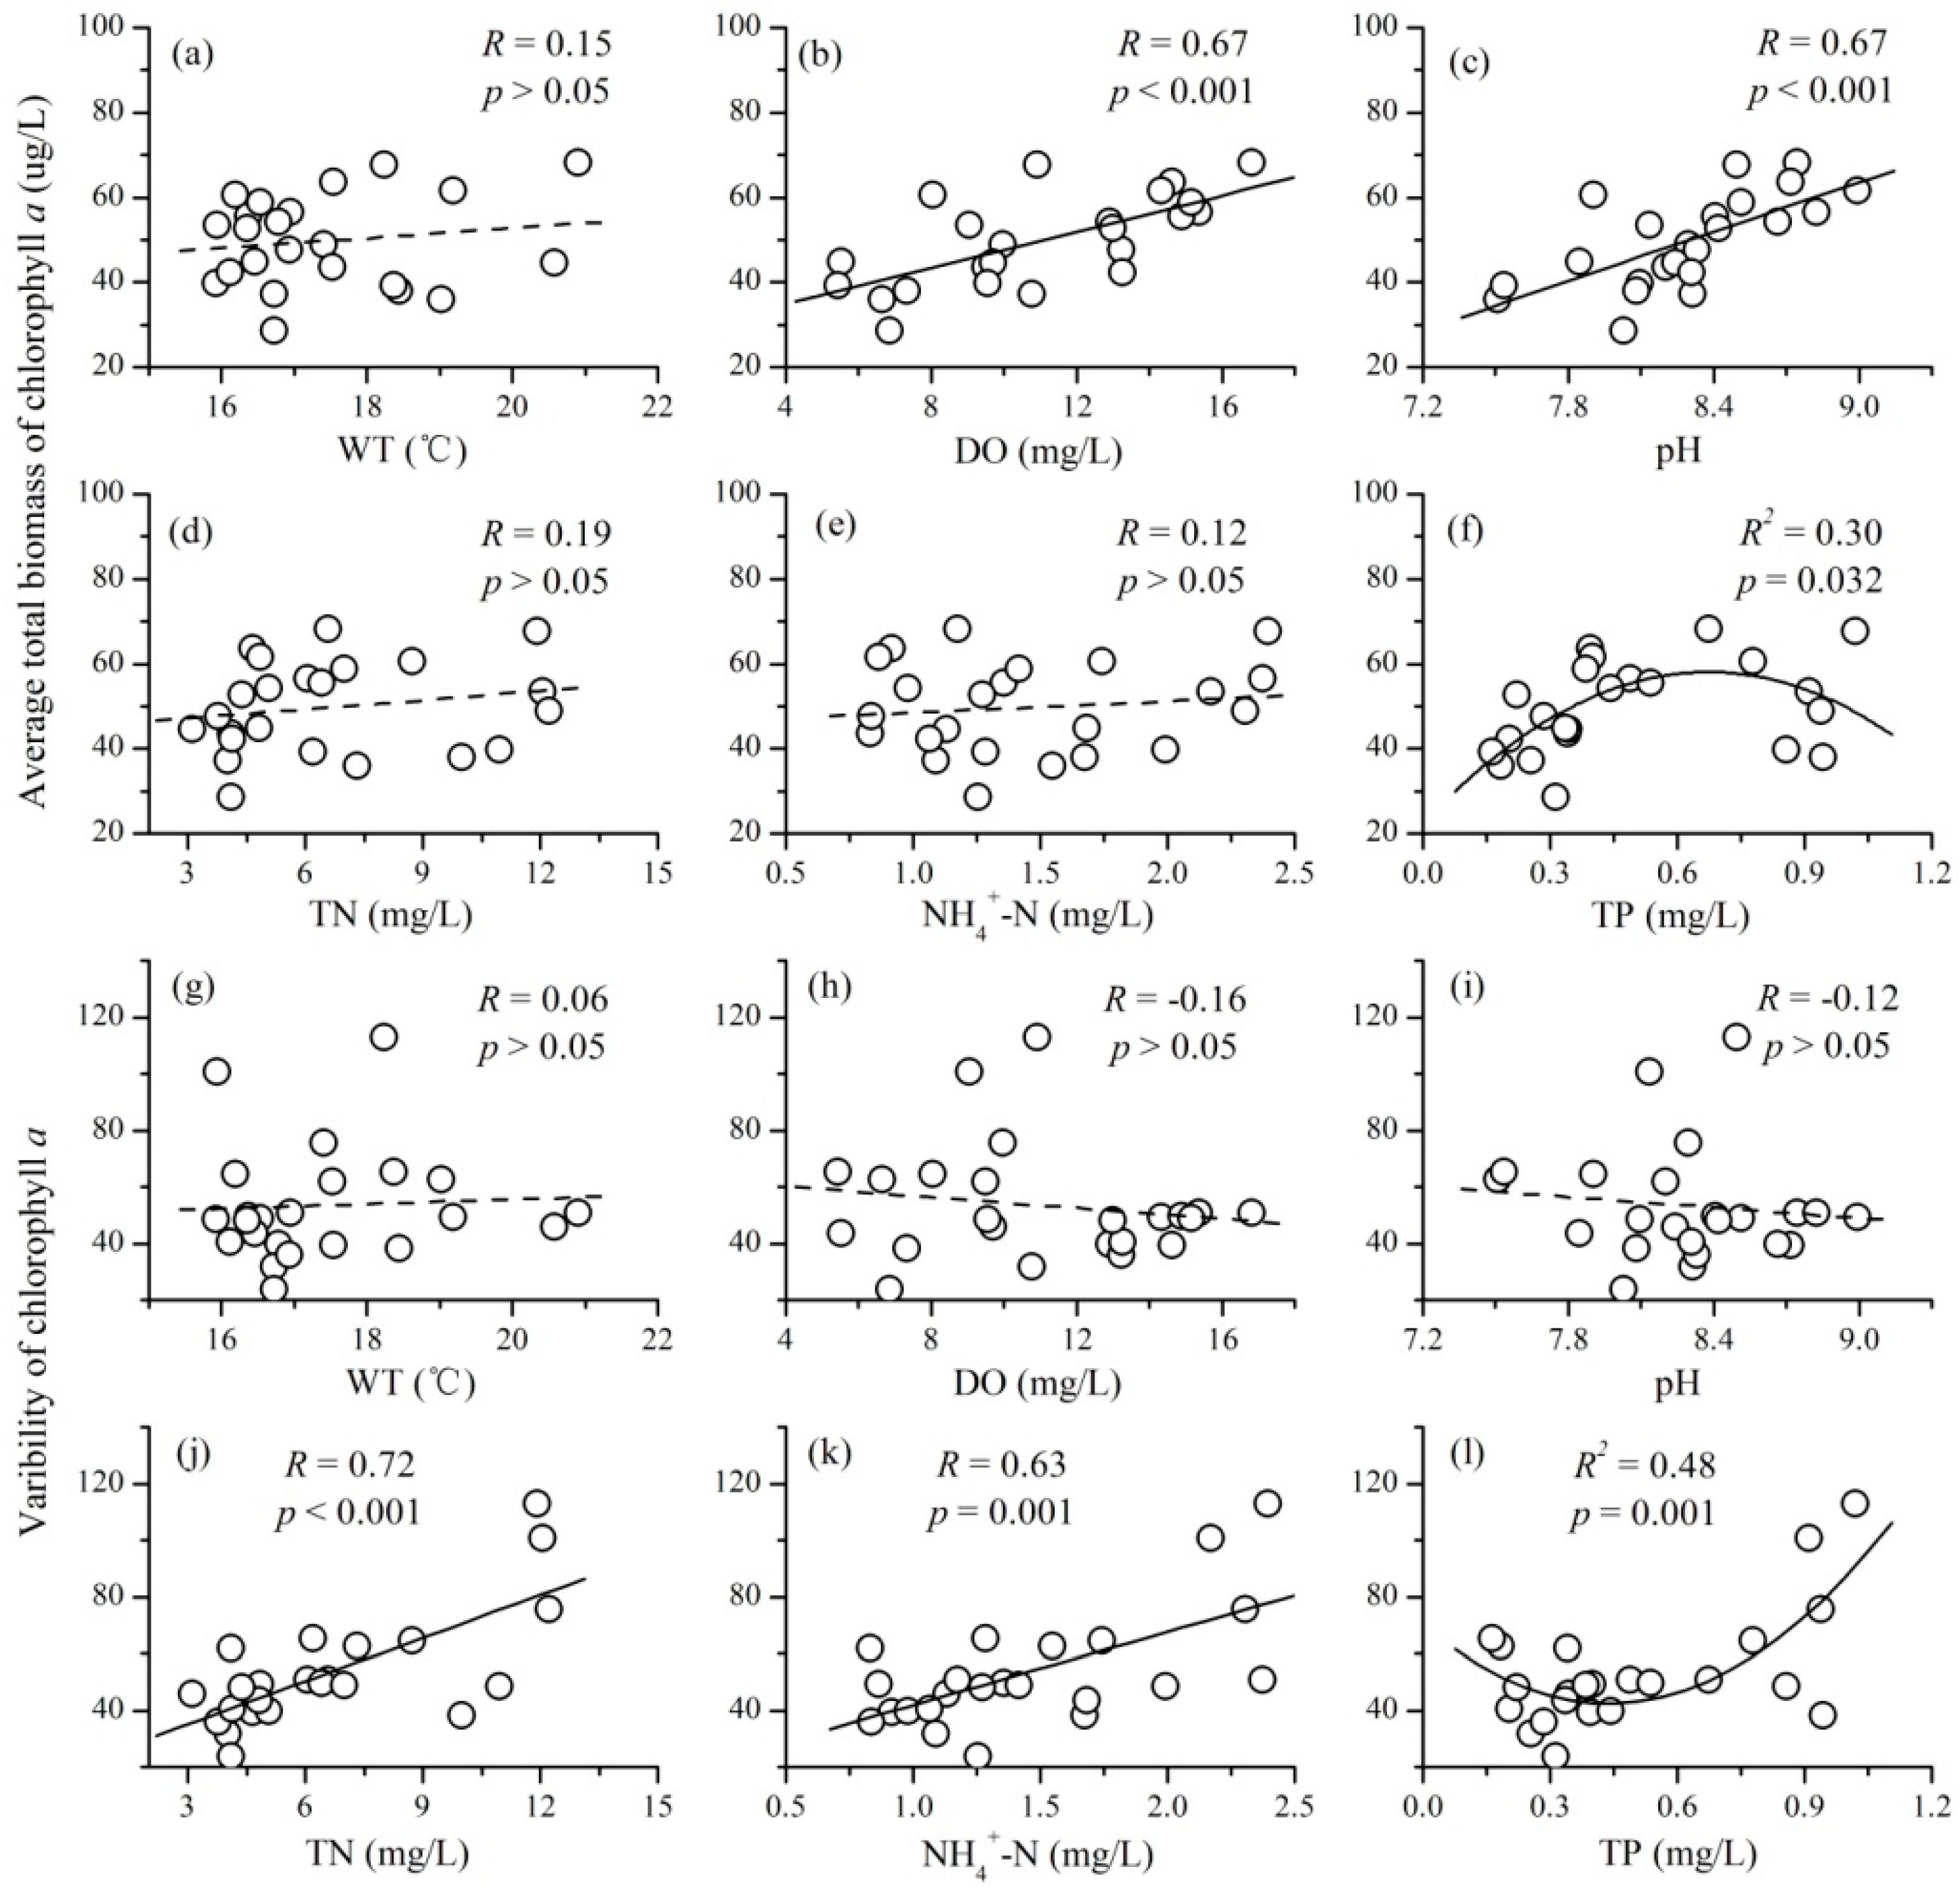
3.3. The Relationships between Mean Environmental Factors and Phytoplankton TSI

There was no significant relationship between mean WT and phytoplankton TSI (R = 0.001, p > 0.05, N = 23), as shown in Figure 5a. Further investigations showed that mean WT had no influence on the average total biomass (R = 0.15, p > 0.05, N = 23) and temporal variability (R = 0.06, p > 0.05, N = 23) of phytoplankton (Figure 6). A strong positive relationship between mean DO and phytoplankton TSI was observed (R = 0.63, p = 0.001, N = 23). Further investigations indicated that mean DO had a positive influence on the average total biomass (R = 0.67, p < 0.001, N = 23), but had no influence on the variability of phytoplankton (R = −0.16, p > 0.05, N = 23). Mean values of pH also had a positive relationship with phytoplankton TSI (R = 0.62, p = 0.002, N = 23), as shown in Figure 5c. The strong positive relationship between mean pH and the average total biomass of phytoplankton was responsible for this phenomenon (R = 0.67, p < 0.001, N = 23; Figure 6c). The mean concentrations of both TN and NH4+-N had negative effects on phytoplankton TSI (for TN, R = −0.60, p = 0.003, N = 23; for NH4+-N, R = −0.58, p = 0.004, N = 23). Both the two variables had positive relationships with the variability of phytoplankton biomass (for TN, R = 0.72, p < 0.001, N = 23; for NH4+-N, R = 0.63, p = 0.001, N = 23), but had no relationship with the average total biomass (for TN, R = 0.19, p > 0.05, N = 23; for NH4+-N, R = 0.12, p > 0.05, N = 23). In addition, a concave relationship between the mean TP concentration and phytoplankton TSI was observed (R2 = 0.50, p = 0.001, N = 23). Further investigations showed that mean TP had a concave relationship with the average total biomass (R2 = 0.30, p = 0.032, N = 23) and a unimodal relationship with the variability of phytoplankton (R2 = 0.48, p = 0.001, N = 23).

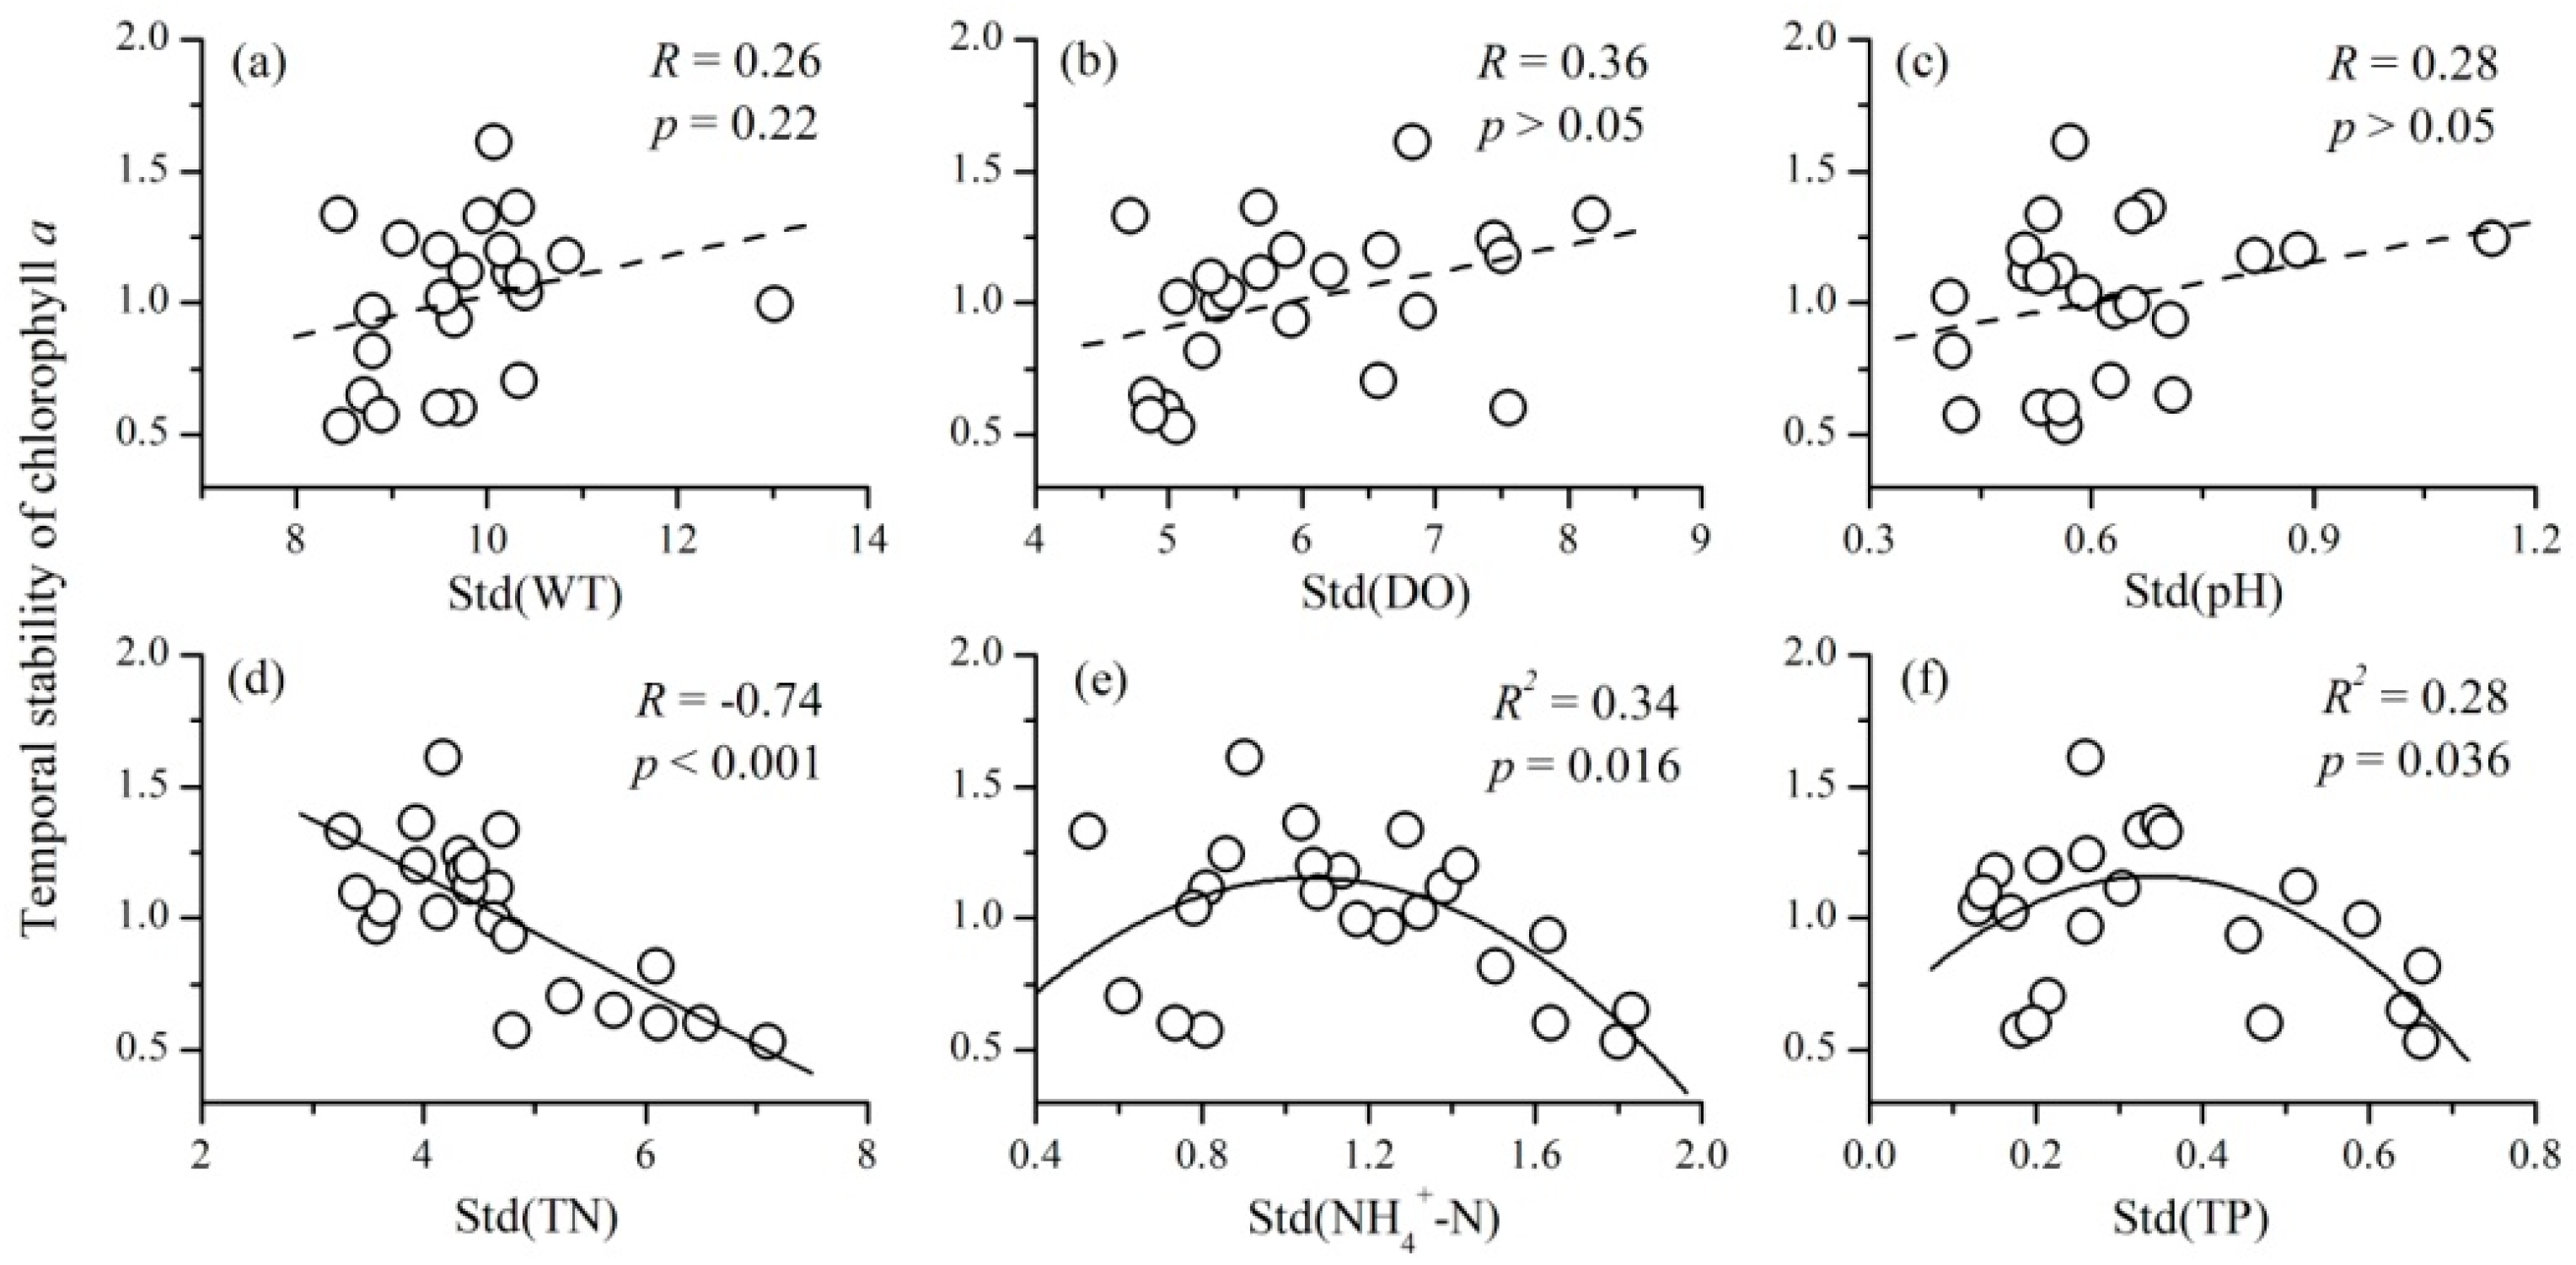
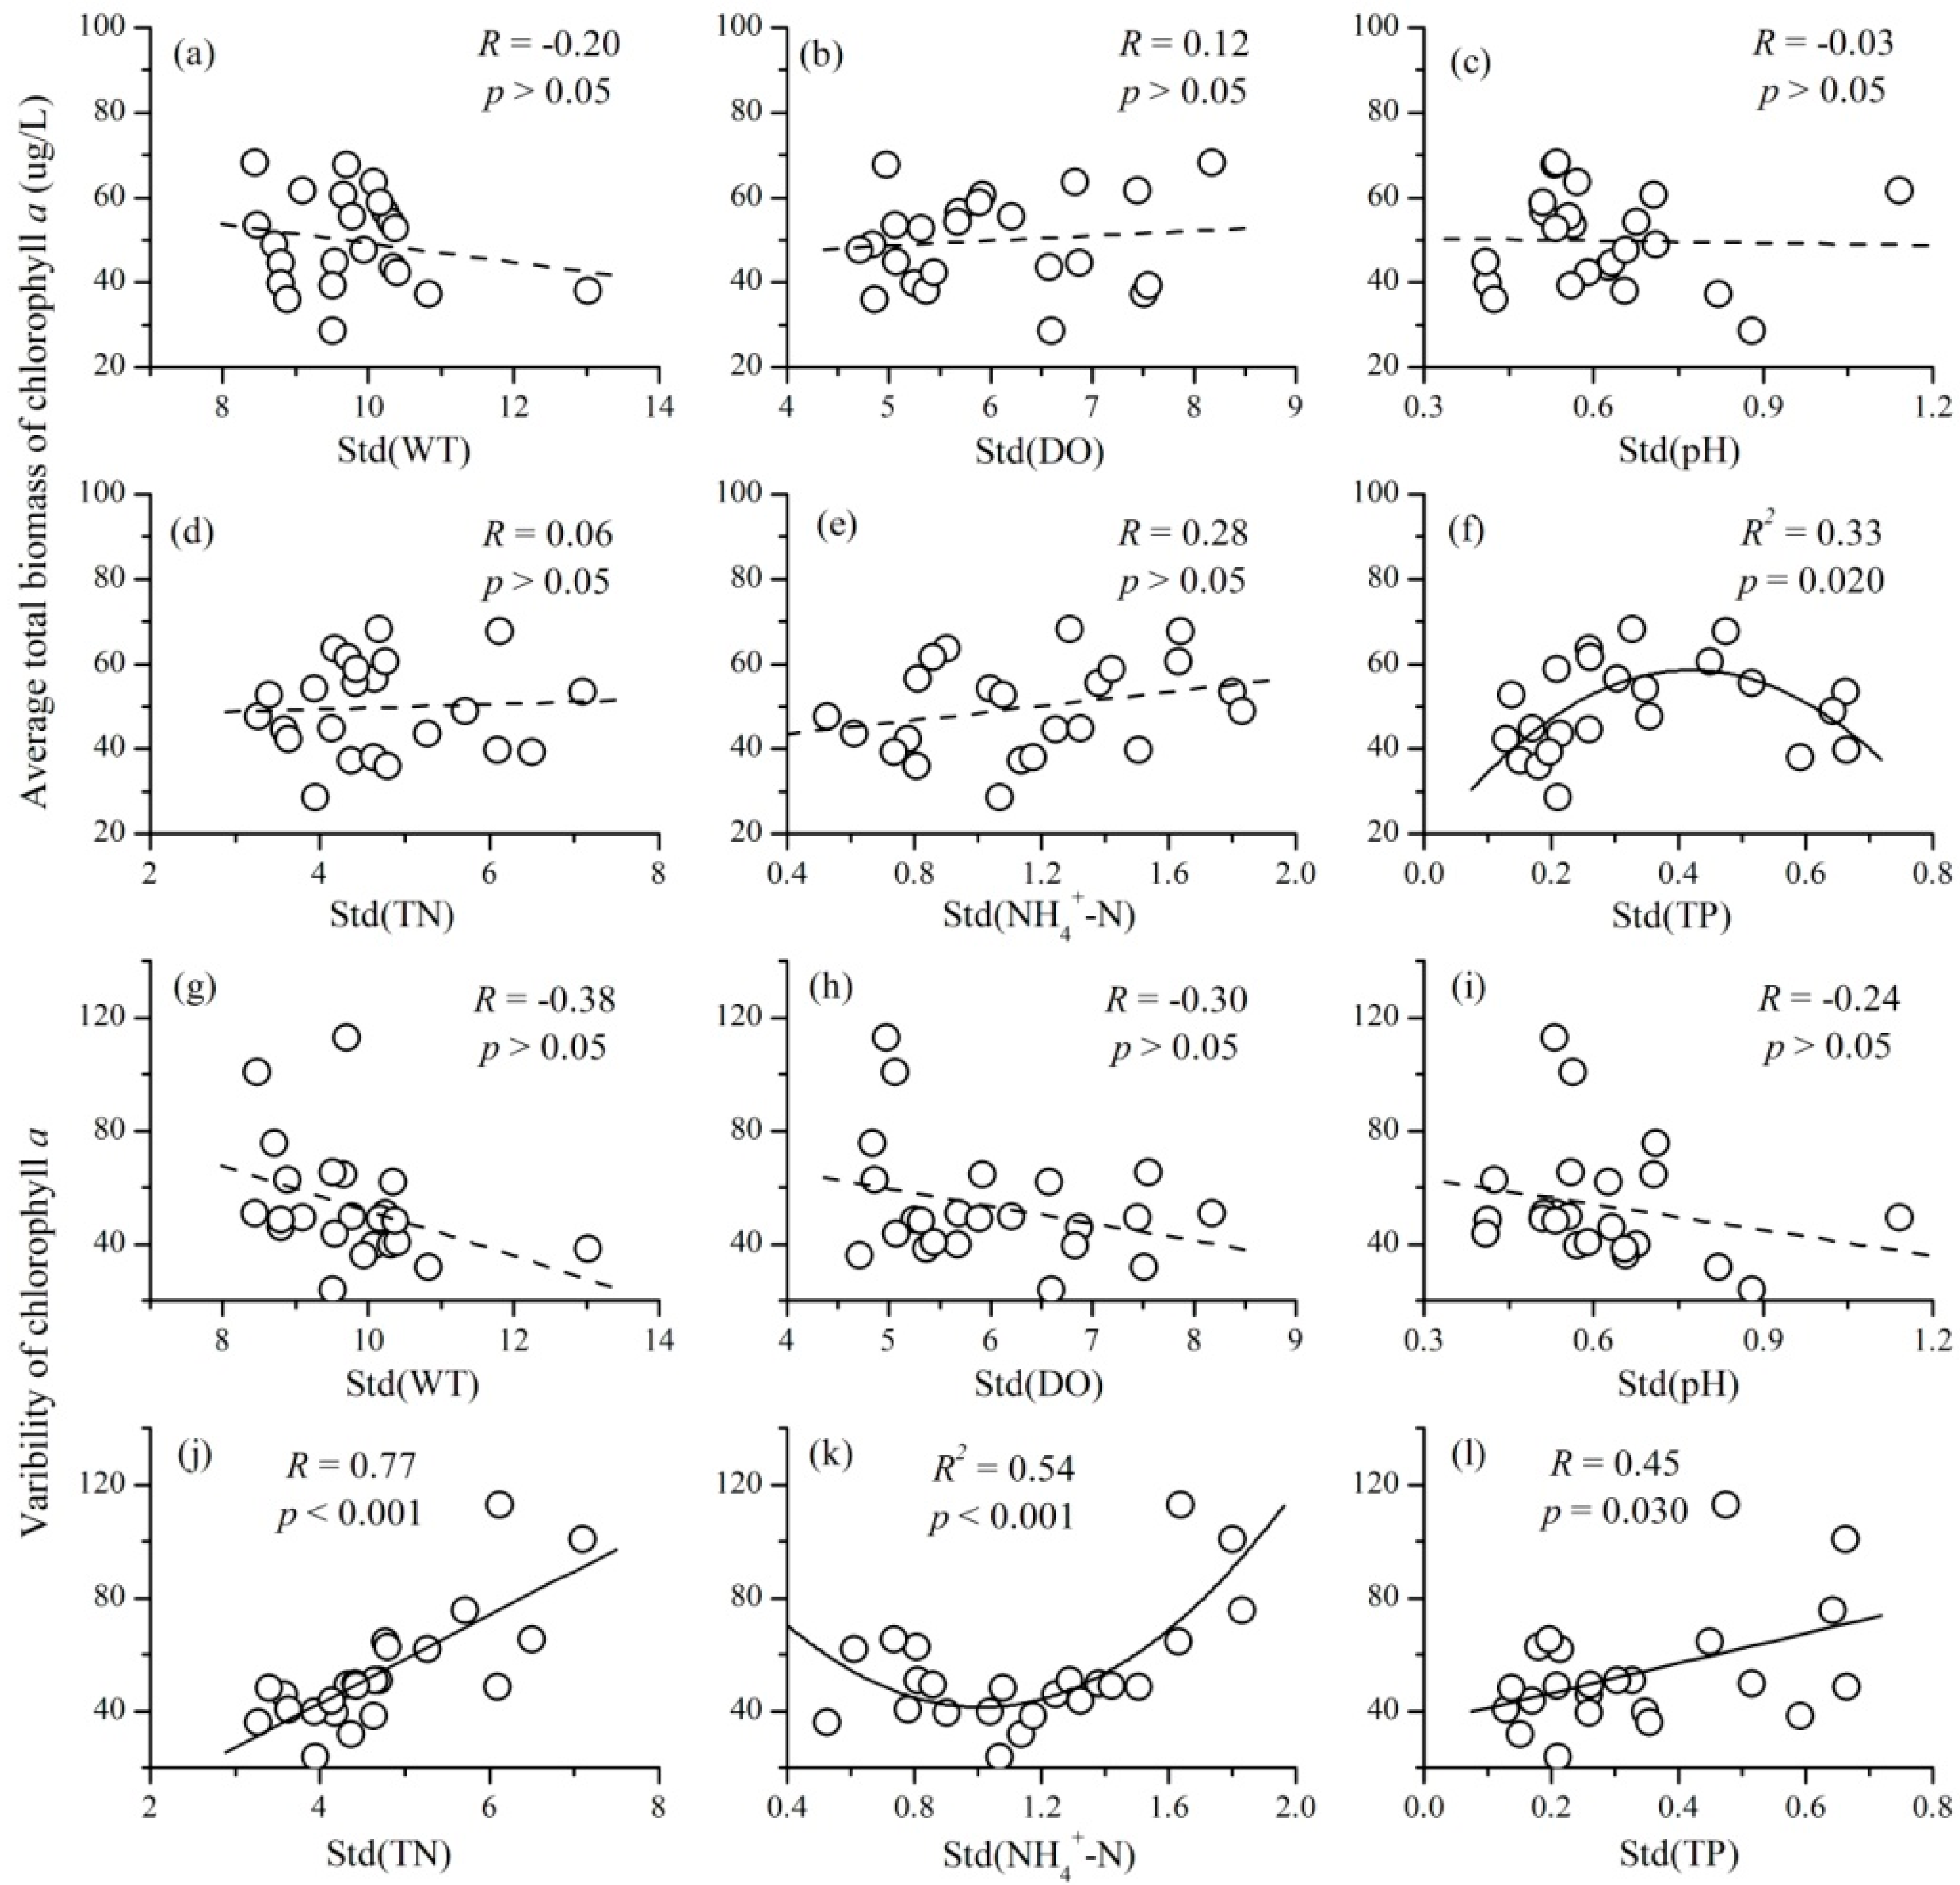
3.4. The Relationships between the Variability of Environmental Factors and Phytoplankton TSI

The variability of WT, DO, and pH all had no significant influence on the temporal stability of phytoplankton biomass (for WT, R = 0.26, p > 0.05, N = 23; for DO, R = 0.36, p > 0.05, N = 23; for pH, R = 0.28, p > 0.05, N = 23), as shown in Figure 7. The three variables also had no influence on the average total biomass (for WT, R = −0.20, p > 0.05, N = 23; for DO, R = 0.12, p > 0.05, N = 23; for pH, R = −0.03, p > 0.05, N = 23) and variability of phytoplankton (for WT, R = −0.38, p > 0.05, N = 23; for DO, R = −0.30, p > 0.05, N = 23; for pH, R = −0.24, p > 0.05, N = 23). However, a strong negative relationship between the variability of TN and phytoplankton TSI was observed (R = −0.74, p < 0.001, N = 23), as shown in Figure 7d. Further investigations showed that the variability of TN had no influence on the average total biomass (R = 0.06, p > 0.05, N = 23), but had a strong positive influence on the variability of phytoplankton (R = 0.77, p < 0.001, N = 23). A unimodal relationship between the variability of NH4+-N concentration and phytoplankton TSI (R2 = 0.34, p = 0.016, N = 23) was observed. The concave relationship between the variability of NH4+-N and phytoplankton was responsible for this phenomenon (R2 = 0.54, p < 0.001, N = 23). There was also a unimodal relationship between the variability of TP and phytoplankton TSI (R2 = 0.28, p = 0.036, N = 23), as shown in Figure 7f. The variability of TP was highly correlated with both the two components of phytoplankton TSI (Figure 8). It had a unimodal relationship with the average total biomass (R2 = 0.33, p = 0.020, N = 23) and a positive relationship with the variability of phytoplankton (R = 0.45, p = 0.030, N = 23).

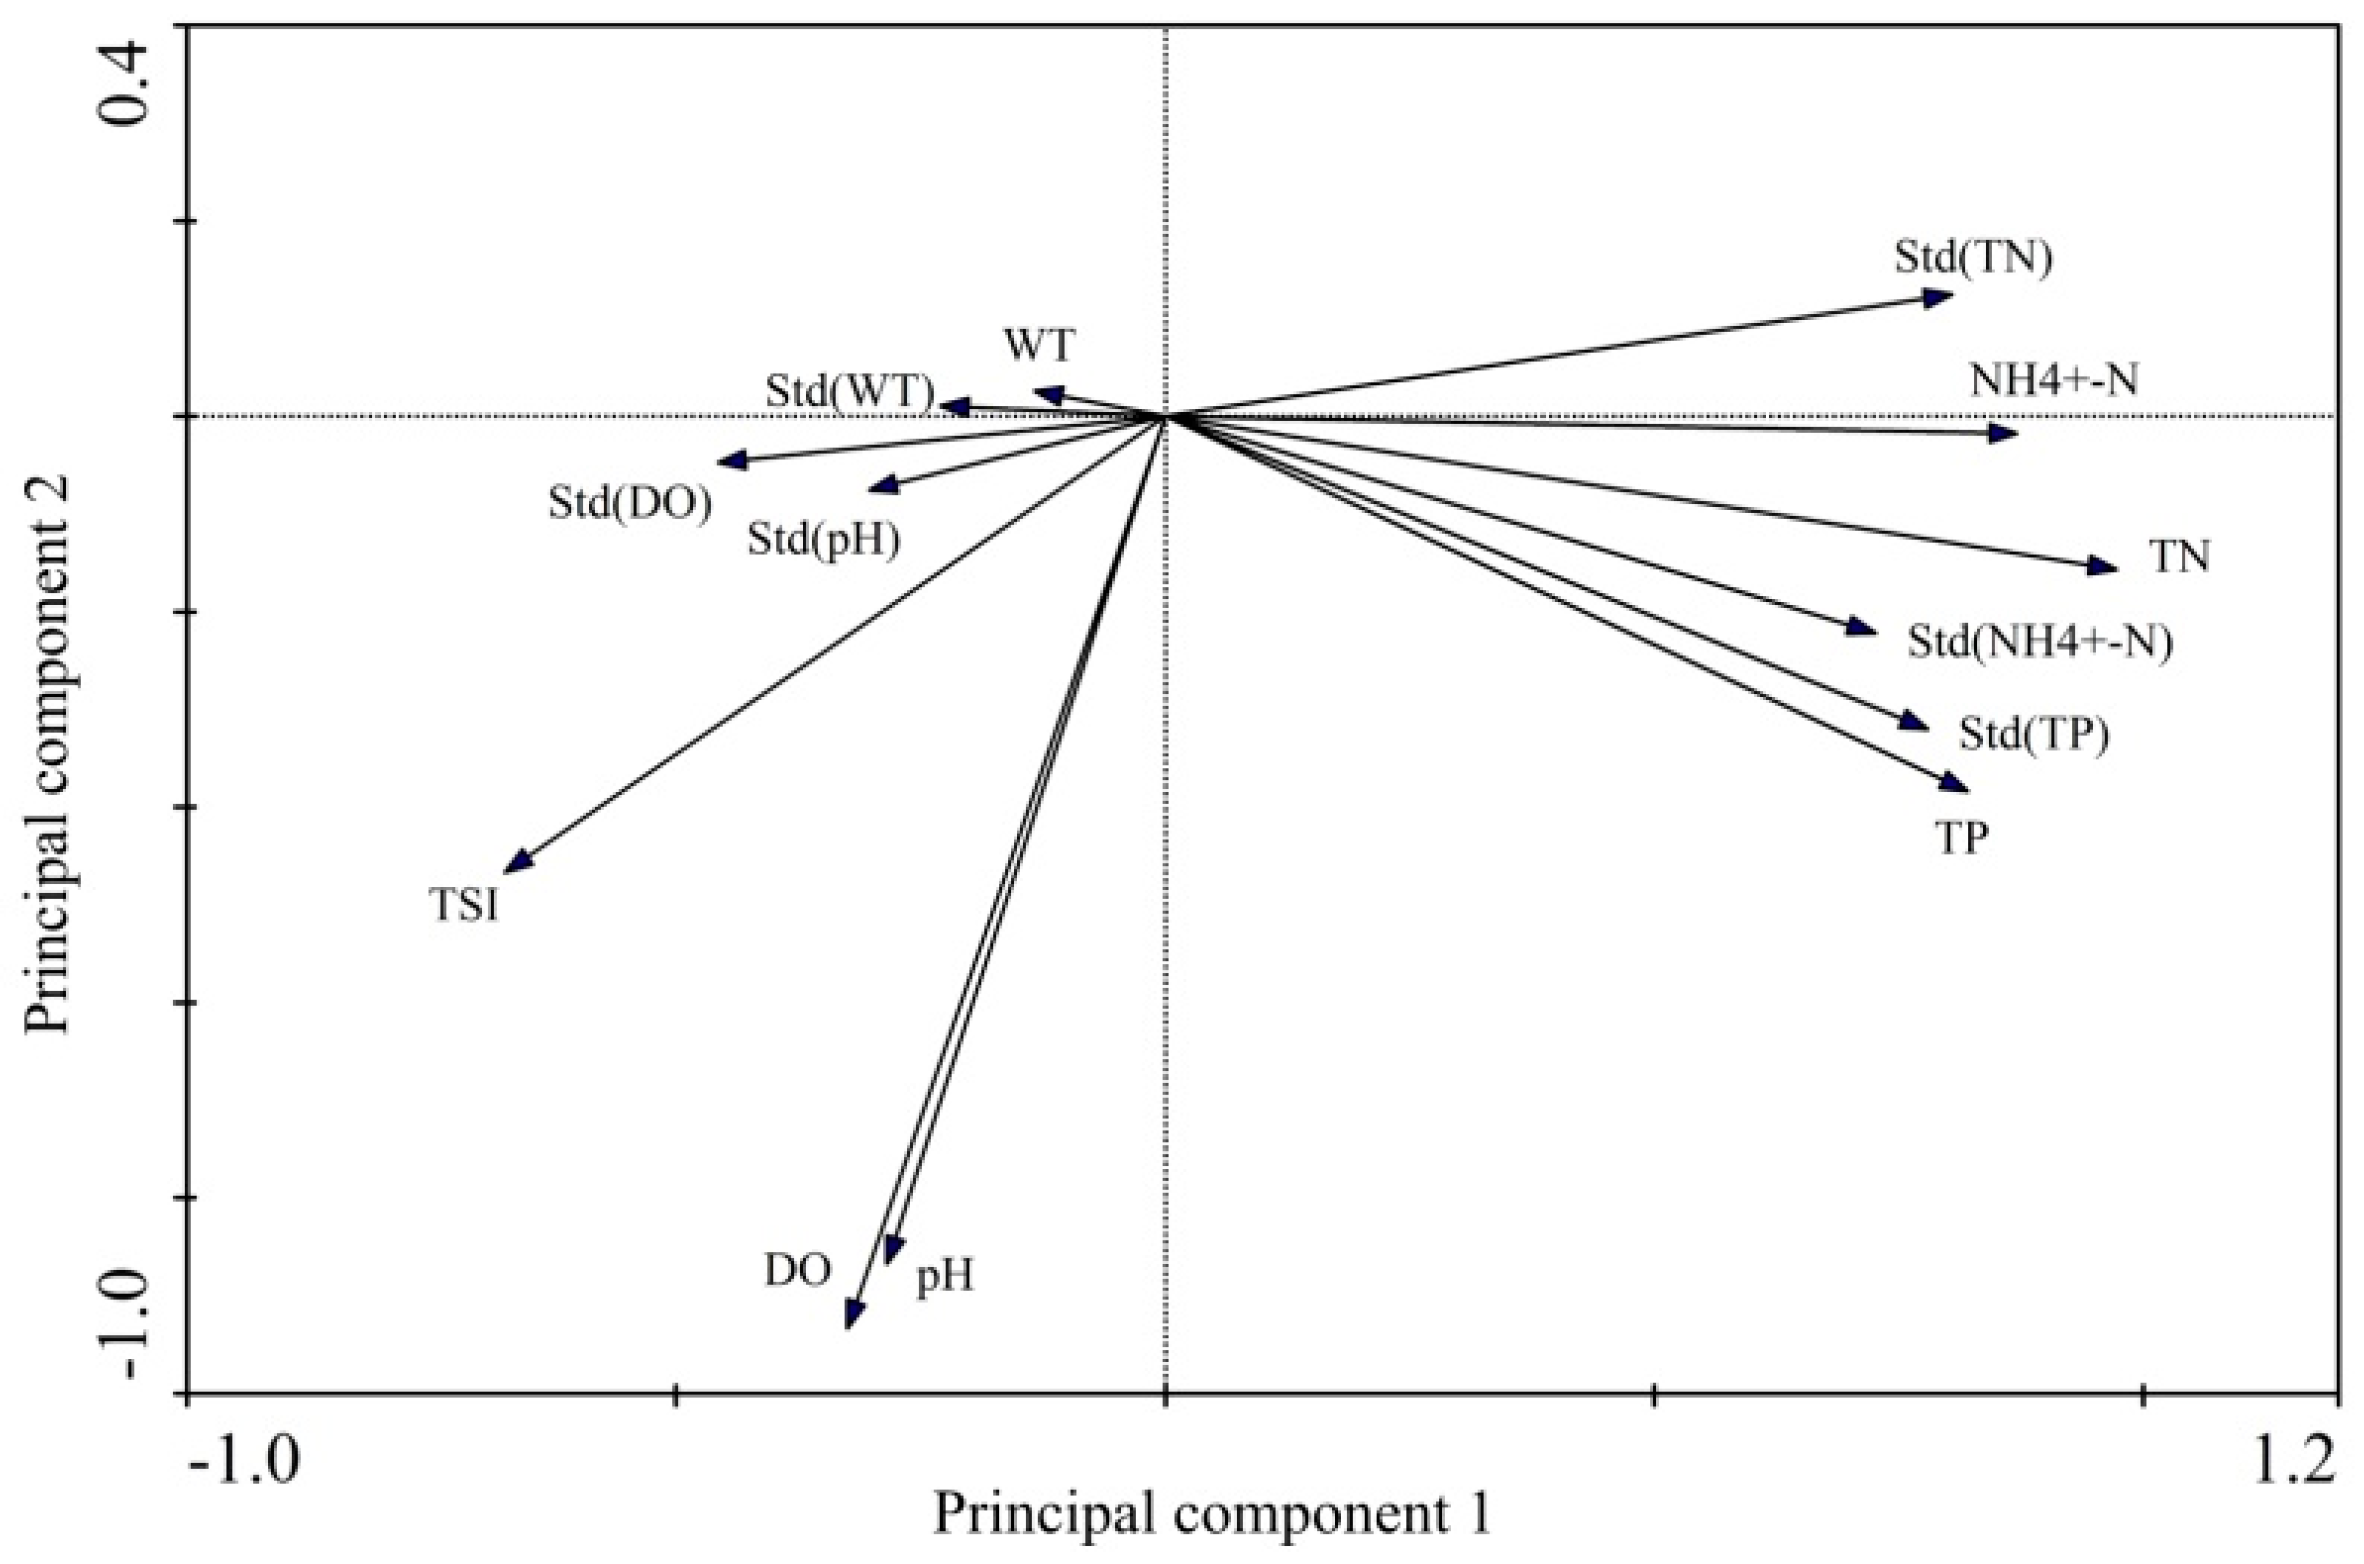
3.5. Combined Relationships between Environmental Factors and Phytoplankton TSI

The PCA revealed that the first and second principal components explained 56.0% (eigenvalues = 0.560) and 22.7% (eigenvalues = 0.227), respectively, of the variance for all the variables. Phytoplankton TSI was positively correlated with both DO and pH (Figure 9), which was consistent with the relationships in Figure 5. The mean values of DO and pH in the lake were highly correlated with each other (Figure 9). However, phytoplankton TSI was negatively correlated with all the nutrients (TN, TP, and NH4+-N) and their variability in the lake (Figure 9). Some of the nutrients were highly correlated with each other, e.g., TN and NH4+-N, TN, and TP (Figure 9). In summary, mean values of DO and pH had a positive influence on the stability of phytoplankton, while the effects of nutrients were always negative (Figure 9).

4. Discussion

Based on the field investigations at Lake Qixinghu, we analyzed the effects of environmental factors on the temporal stability of phytoplankton biomass and explored the potential mechanisms involved. The mean and variability of environmental factors had complex relationships with phytoplankton temporal stability (Figure 5 and Figure 7). Besides, our results also facilitated the quantification of the mechanisms in maintaining the effects of environmental factors on phytoplankton stability.
We observed that the mean values of WT had no significant influence on phytoplankton TSI (Figure 5 and Figure 7). Its effects on the average total biomass and variability of phytoplankton were also not significant (Figure 6 and Figure 8). Previously, ecologists had found that WT has a great influence on the long-term stability of phytoplankton community [27,44]. Gonzalez and Descamps-Julien [44] found that, for a given level of species richness, temperature fluctuations induced lower community covariance and thus stabilized the biomass of an artificial phytoplankton community. Rothenberger et al. [27] showed that the long-term variations of phytoplankton community in the Neuse River estuary were strongly related to WT. Our result was different with the findings of these studies [27,44]. Further comparison showed that the present research was conducted in a small lake, and there was little variation of mean WT in different sites. Taken together, these results suggest that WT has influence on the stability of phytoplankton biomass at a regional scale, but no influence at a local scale. Besides, environmental factors in Lake Qixinghu were unstable due to the inflow of polluted water. As a result, mean phytoplankton biomass was not fluctuating synchronously with mean WT in the lake (Figure 2a,g). Therefore, the influence of WT on phytoplankton biomass might be weakened by the unstable environments.
The mean values of both DO and pH were positively correlated with the temporal stability of phytoplankton in Lake Qixinghu (Figure 5). The two variables had a positive influence on the average total biomass of phytoplankton; however, their influence on the temporal variability of phytoplankton was not significant. Therefore, both DO and pH increased the temporal stability of phytoplankton through increasing the temporal mean of biomass. Ecologists often use DO concentrations in a lake to estimate the rates of primary production and ecosystem respiration [55,56]. Tilman et al. [57] found that the values of pH played an important role in nutrient availability and the uptake rate of phytoplankton species. Hinga [58] and Hansen [59] reported that the growth rate of phytoplankton generally had a unimodal relationship with the values of pH and reached the maximum value when pH ranged from 8.3 to 8.5. In the present research, mean values of pH varied from 7.5 to 9.0 and the average total biomass of phytoplankton increased with increasing pH. Besides, value of pH was highly correlated with DO in the lake (Figure 9). Phytoplankton community can remove dissolved inorganic carbon from lakes and produce oxygen, which may result in high pH and DO values [55,56,60]. Thus, the relationships among phytoplankton biomass, pH, and DO in Lake Qixinghu may be influenced by the photosynthesis of phytoplankton. Besides, DO and pH not only influenced phytoplankton biomass, but also had an impact on the long-term stability of phytoplankton.
The mean concentrations of both TN and NH4+-N were negatively correlated with the temporal stability of phytoplankton (Figure 5). The two variables had no influence on the average total biomass, but had a positive influence on the temporal variability of phytoplankton (Figure 6). Therefore, mean TN and NH4+-N decreased phytoplankton temporal stability through increasing the temporal variability of community biomass. There was a strong unimodal relationship between mean TP concentrations and phytoplankton temporal stability (Figure 5). Mean values of TP had a unimodal relationship with average total biomass and a concave relationship with the temporal variability of phytoplankton. In most cases (TP < 0.6 mg/L), mean values of TP would benefit phytoplankton stability through increasing the temporal mean and decreasing the temporal variability of phytoplankton biomass. Thus in Lake Qixinghu, the biomass of phytoplankton was more influenced by TP than other nutrients. In summary, both nitrogen and phosphorus had significant effects on the stability of phytoplankton. The limiting nutrient (TP) would benefit phytoplankton stability mainly through increasing the average total biomass. Other nutrients would decrease phytoplankton stability through increasing the variability of community biomass. Ecologists have found that nutrient availability has great influence on the temporal mean and variability of phytoplankton biomass [45]. Salmaso [28] and Rothenberger et al. [27] showed that the long-term variations of phytoplankton community were greatly related to the concentrations of nutrients. Our results were consistent with these findings that nutrients have a strong influence on the stability of phytoplankton [27,28,45]. However, the relationships between nutrients and phytoplankton stability are not straightforward.
We observed that the variability of some environmental factors also had a significant influence on the temporal stability of phytoplankton (Figure 7). The temporal stability of phytoplankton had a unimodal relationship with both NH4+-N and TP, a negative relationship with TN, and no relationship with WT, DO, and pH. The variability of these variables had little influence on the average total biomass of phytoplankton (Figure 8). However, the variability of nutrients all significantly correlated with that of phytoplankton. Therefore, at a local scale, the fluctuations of nutrients will decrease the temporal stability of phytoplankton, while the effects of WT, DO, and pH were not significant.
We used chlorophyll a as a predictor of phytoplankton biomass in the present research. Vörös and Padisák [48] found that chlorophyll a was highly correlated with phytoplankton biomass in some shallow lakes in central Europe. However, Felip and Catalan [49] discovered that chlorophyll a content per unit of phytoplankton biovolume fluctuated greatly throughout the year, depending on light intensity, temperature, and phytoplankton composition in a deep oligotrophic, high mountain lake. Kasprzak et al. [50] also suggested that chlorophyll a concentration might be used with caution as a predictor of phytoplankton biomass. In Lake Qixinghu, chlorophyll a concentration was strongly correlated with phytoplankton biovolume (Figure 4). Therefore, chlorophyll a can be used as a predictor of phytoplankton biomass in Lake Qixinghu. Besides, the influence of Secchi depth on the ratios between chlorophyll a and phytoplankton biovolume was not significant. Therefore, light intensity may have little influence on the relative content of chlorophyll a in phytoplankton in the present study. Ecologists found that phytoplankton community composition had great influence on daily migration over the water column [61]. However, Li et al. [62] showed that there was no apparent vertical migration (0–0.3, 0.3–0.6, 0.6–0.9, 0.9–1.2, 1.2–1.5 m) of Chlorophyta, Bacillariophyta, and Cryptophyta; while Cyanophyta only showed very weak vertical migration in a shallow pond. In Lake Qixinghu, mean water depth is 1.50 m and phytoplankton was dominated by Cyanophyta, Chlorophyta, and Bacillariophyta. The biomass proportions of the three phyla all had no significant influence on the ratios between chlorophyll a and phytoplankton biovolume. Therefore, phytoplankton vertical migration in the lake had a weak influence on the variation of chlorophyll a.
The biomass of phytoplankton is generally influenced by both bottom-up and top-down effects [63]. The predation of zooplankton is recognized as an important factor that regulates phytoplankton biomass in many lakes [64]. Besides, fish species also have great influence on phytoplankton and they are usually used to control algae blooms through trophic cascading [65]. However in Lake Qixinghu, zooplankton and fish species had very low biomass due to the heavy pollution and young age of the lake. Therefore, the biomass of phytoplankton was mainly influenced by environmental factors rather than predation.
Ecologists argue that the temporal stability of phytoplankton is positively influenced by its diversity [14,19,21,22,23,24]. In the present study, we observed that both the temporal mean and variability of many environmental factors had an influence on the temporal stability of phytoplankton. Thus, what the main driving factors of phytoplankton biomass stability in artificially made lakes are should be identified in the future. In Lake Qixinghu, nutrients had negative relationships with the stability of phytoplankton biomass in most cases. They generally had a weak positive influence on phytoplankton biomass and a strong positive influence on the variability of phytoplankton biomass. Therefore, to depress the biomass of phytoplankton in eutrophic lakes, we should limit the concentrations of nitrogen and phosphorus. Finally, in order to decrease the variability (or increase the stability) of phytoplankton biomass, we should not only limit the concentrations of nitrogen and phosphorus, but also decrease the variability of them.

5. Conclusions

In the present study, the influence of environmental factors on the temporal stability of phytoplankton biomass was analyzed based on field investigations in a eutrophic lake. As per the findings of the present study, the following can be concluded:
(1)
There were complex relationships between the mean environmental factors and phytoplankton TSI: a positive relationship for DO and pH, a negative relationship for TN and NH4+-N, a unimodal relationship for TP, and no relationship for WT. Mean values of DO and pH mainly increased the stability of phytoplankton through increasing the average total biomass; while that of TN and NH4+-N destabilized phytoplankton TSI primarily through increasing the variability of phytoplankton.
(2)
There were also complex relationships between the variability of environmental factors and phytoplankton TSI: a negative relationship for TN, a unimodal relationship for NH4+-N and TP, and no relationship for WT, DO, and pH. The variability of nutrient concentrations mainly affected phytoplankton TSI through influencing the variability of community biomass. Therefore, at a local scale, the fluctuations of nutrients will decrease the temporal stability of phytoplankton.
The results of the present study are helpful in understanding the influence of environmental factors on the stability of phytoplankton in eutrophic lakes.

Acknowledgments

We extend our thanks to Sassan Hafizi for the assistance in language editing. This study was financially supported by the National Special Water Programs (No. 2009ZX07210-009, No. 2015ZX07203-011, No. 2015ZX07204-007) and the Department of Environmental Protection of Shan Dong Province (SDHBPJ-ZB-08, Investigating and evaluating ecological security of Lake Nansihu).

Author Contributions

Huayong Zhang and Wang Tian were responsible for the research design. Wang Tian, Lei Zhao, Yuanwu Xiong, and Hai Huang analyzed the data and prepared the figures. Wang Tian drafted the main text. All authors participated in discussions and editing.

Conflicts of Interest

The authors declare no conflict of interest.

References

  1. Litchman, E.; Klausmeier, C.A. Trait-based community ecology of phytoplankton. Annu. Rev. Ecol. Evol. Syst. 2008, 39, 615–639. [Google Scholar] [CrossRef]
  2. Schwaderer, A.S.; Yoshiyama, K.; de Tezanos Pinto, P.; Swenson, N.G.; Klausmeier, C.A.; Litchman, E. Eco-evolutionary differences in light utilization traits and distributions of freshwater phytoplankton. Limnol. Oceanogr. 2011, 56, 589–598. [Google Scholar] [CrossRef]
  3. Weyhenmeyer, G.A.; Peter, H.; Willen, E. Shifts in phytoplankton species richness and biomass along a latitudinal gradient-consequences for relationships between biodiversity and ecosystem functioning. Freshw. Biol. 2013, 58, 612–623. [Google Scholar] [CrossRef]
  4. Yu, Q.; Chen, Y.; Liu, Z.; de Giesen, N.V.; Zhu, D. The influence of a eutrophic lake to the river downstream: Spatiotemporal algal composition changes and the driving factors. Water 2015, 7, 2184–2201. [Google Scholar] [CrossRef]
  5. Anderson, D.M.; Glibert, P.M.; Burkholder, J.M. Harmful algal blooms and eutrophication: Nutrient sources, composition, and consequences. Estuaries 2002, 25, 704–726. [Google Scholar] [CrossRef]
  6. O’neil, J.M.; Davis, T.W.; Burford, M.A.; Gobler, C.J. The rise of harmful cyanobacteria blooms: The potential roles of eutrophication and climate change. Harmful Algae 2012, 14, 313–334. [Google Scholar] [CrossRef]
  7. Smith, S.J.; Edmonds, J.; Hartin, C.A.; Mundra, A.; Calvin, K. Near-term acceleration in the rate of temperature change. Nat. Clim. Chang. 2015, 5, 333–336. [Google Scholar] [CrossRef]
  8. O’Reilly, C.M.; Sharma, S.; Gray, D.K.; Hampton, S.E.; Read, J.S.; Rowley, R.J.; Schneider, P.; Lenters, J.D.; Mclntyre, P.B.; Kraemer, B.M.; et al. Rapid and highly variable warming of lake surface waters around the globe. Geophys. Res. Lett. 2015, 42, 10773–10781. [Google Scholar] [CrossRef]
  9. Paerl, H.W.; Huisman, J. Blooms like it hot. Science 2008, 320, 57–58. [Google Scholar] [CrossRef] [PubMed]
  10. Zhao, L.; Zhang, H.; O’Gorman, E.J.; Tian, W.; Ma, A.; Moore, J.C.; Borrett, S.R.; Woodward, G. Weighting and indirect effects identify keystone species in food webs. Ecol. Lett. 2016, 19, 1032–1040. [Google Scholar] [CrossRef] [PubMed]
  11. Berman, T.; Yacobi, Y.Z.; Pollingher, U. Lake Kinneret phytoplankton: Stability and variability during twenty years (1970–1989). Aquat. Sci. 1992, 54, 104–127. [Google Scholar] [CrossRef]
  12. Rojo, C.; Alvarez-Cobelas, M. Are there steady-state phytoplankton assemblages in the field? Hydrobiologia 2003, 502, 3–12. [Google Scholar] [CrossRef]
  13. Honti, M.; Istvánovics, V.; Osztoics, A. Stability and change of phytoplankton communities in a highly dynamic environment-the case of large, shallow Lake Balaton (Hungary). Hydrobiologia 2007, 581, 225–240. [Google Scholar] [CrossRef]
  14. Tian, W.; Zhang, H.; Zhao, L.; Xu, X.; Huang, H. Plankton community stability and its relationship with phytoplankton species richness in Lake Nansihu, China. Water 2016, 8, 454. [Google Scholar] [CrossRef]
  15. Cardinale, B.J.; Duffy, J.E.; Gonzalez, A.; Hooper, D.U.; Perrings, C.; Venail, P.; Narwani, A.; Mace, G.M.; Tilman, D.; Wardle, D.A.; et al. Biodiversity loss and its impact on humanity. Nature 2012, 486, 59–67. [Google Scholar] [CrossRef] [PubMed]
  16. Pimm, S.L. The complexity and stability of ecosystems. Nature 1984, 307, 321–326. [Google Scholar] [CrossRef]
  17. Ives, A.R.; Carpenter, S.R. Stability and diversity of ecosystems. Science 2007, 317, 58–62. [Google Scholar] [CrossRef] [PubMed]
  18. Donohue, I.; Petchey, O.L.; Montoya, J.M.; Jackson, A.L.; McNally, L.; Viana, M.; Healy, K.; Lurgi, M.; O’Connor, N.E.; Emmerson, M.C. On the dimensionality of ecological stability. Ecol. Lett. 2013, 16, 421–429. [Google Scholar] [CrossRef] [PubMed]
  19. McGrady-Steed, J.; Harris, P.M.; Morin, P.J. Biodiversity regulates ecosystem predictability. Nature 1997, 390, 162–165. [Google Scholar]
  20. Zhang, Q.G.; Zhang, D.Y. Species richness destabilizes ecosystem functioning in experimental aquatic microcosms. Oikos 2006, 112, 218–226. [Google Scholar] [CrossRef]
  21. Corcoran, A.A.; Boeing, W.J. Biodiversity increases the productivity and stability of phytoplankton communities. PLoS ONE 2012, 7, e49397. [Google Scholar] [CrossRef] [PubMed]
  22. Smol, J.P.; Wolfe, A.P.; Birks, H.J.B.; Douglas, M.S.; Jones, V.J.; Korhola, A.; Pienitz, R.; Rühland, K.; Sorvari, S.; Antoniades, D.; et al. Climate-driven regime shifts in the biological communities of arctic lakes. Proc. Natl. Acad. Sci. USA 2005, 102, 4397–4402. [Google Scholar] [CrossRef] [PubMed]
  23. Giller, P.S.; Hillebrand, H.; Berninger, U.G.; Gessner, M.O.; Hawkins, S.; Inchausti, P.; Inglis, C.; Leslie, H.; Malmqvist, B.; Monaghan, M.T.; et al. Biodiversity effects on ecosystem functioning: Emerging issues and their experimental test in aquatic environments. Oikos 2004, 104, 423–436. [Google Scholar] [CrossRef]
  24. Ptacnik, R.; Solimini, A.G.; Andersen, T.; Tamminen, T.; Brettum, P.; Lepistö, L.; Willén, E.; Rekolainen, S. Diversity predicts stability and resource use efficiency in natural phytoplankton communities. Proc. Natl. Acad. Sci. USA 2008, 105, 5134–5138. [Google Scholar] [CrossRef] [PubMed]
  25. Filstrup, C.T.; Hillebrand, H.; Heathcote, A.J.; Harpole, W.S.; Downing, J.A. Cyanobacteria dominance influences resource use efficiency and community turnover in phytoplankton and zooplankton communities. Ecol. Lett. 2014, 17, 464–474. [Google Scholar] [CrossRef] [PubMed]
  26. Suikkanen, S.; Laamanen, M.; Huttunen, M. Long-term changes in summer phytoplankton communities of the open northern Baltic Sea. Estuar. Coast. Shelf Sci. 2007, 71, 580–592. [Google Scholar] [CrossRef]
  27. Rothenberger, M.B.; Burkholder, J.A.M.; Wentworth, T.R. Use of long-term data and multivariate ordination techniques to identify environmental factors governing estuarine phytoplankton species dynamics. Limnol. Oceanogr. 2009, 54, 2107–2127. [Google Scholar] [CrossRef]
  28. Salmaso, N. Long-term phytoplankton community changes in a deep subalpine lake: Responses to nutrient availability and climatic fluctuations. Freshw. Biol. 2010, 55, 825–846. [Google Scholar] [CrossRef]
  29. Tilman, D.; Reich, P.B.; Knops, J.M. Biodiversity and ecosystem stability in a decade-long grassland experiment. Nature 2006, 441, 629–632. [Google Scholar] [CrossRef] [PubMed]
  30. Tilman, D. The ecological consequences of changes in biodiversity: A search for general principles. Ecology 1999, 80, 1455–1474. [Google Scholar] [CrossRef]
  31. Thibaut, L.M.; Connolly, S.R. Understanding diversity-stability relationships: Towards a unified model of portfolio effects. Ecol. Lett. 2013, 16, 140–150. [Google Scholar] [CrossRef] [PubMed]
  32. Yachi, S.; Loreau, M. Biodiversity and ecosystem productivity in a fluctuating environment: The insurance hypothesis. Proc. Natl. Acad. Sci. USA 1999, 96, 1463–1468. [Google Scholar] [CrossRef] [PubMed]
  33. Fridley, J.D. Resource availability dominates and alters the relationship between species diversity and ecosystem productivity in experimental plant communities. Oecologia 2002, 132, 271–277. [Google Scholar] [CrossRef]
  34. Wardle, D.A.; Zackrisson, O. Effects of species and functional group loss on island ecosystem properties. Nature 2005, 435, 806–810. [Google Scholar] [CrossRef] [PubMed]
  35. Grace, J.B.; Anderson, M.T.; Smith, M.D.; Seabloom, E.; Andelman, S.J.; Meche, G.; Weiher, E.; Allain, L.K.; Jutila, H.; Sankaran, M.; et al. Does species diversity limit productivity in natural grassland communities? Ecol. Lett. 2007, 10, 680–689. [Google Scholar] [CrossRef] [PubMed]
  36. Zimmerman, E.K.; Cardinale, B.J. Is the relationship between algal diversity and biomass in North American lakes consistent with biodiversity experiments? Oikos 2014, 123, 267–278. [Google Scholar] [CrossRef]
  37. Boyd, P.W.; Strzepek, R.; Fu, F.; Hutchins, D.A. Environmental control of open-ocean phytoplankton groups: Now and in the future. Limnol. Oceanogr. 2010, 55, 1353–1376. [Google Scholar] [CrossRef]
  38. Lee, H.S.; Lee, J.H. Continuous monitoring of short term dissolved oxygen and algal dynamics. Water Res. 1995, 29, 2789–2796. [Google Scholar] [CrossRef]
  39. Lopez-Archilla, A.I.; Moreira, D.; López-García, P.; Guerrero, C. Phytoplankton diversity and cyanobacterial dominance in a hypereutrophic shallow lake with biologically produced alkaline pH. Extremophiles 2004, 8, 109–115. [Google Scholar] [CrossRef] [PubMed]
  40. Bissinger, J.E.; Montagnes, D.J.; Sharples, J.; Atkinson, D. Predicting marine phytoplankton maximum growth rates from temperature: Improving on the Eppley curve using quantile regression. Limnol. Oceanogr. 2008, 53, 487–493. [Google Scholar] [CrossRef]
  41. Raven, J.A.; Geider, R.J. Temperature and algal growth. New Phytol. 1988, 110, 441–461. [Google Scholar] [CrossRef]
  42. Stomp, M.; Huisman, J.; Mittelbach, G.G.; Litchman, E.; Klausmeier, C.A. Large-scale biodiversity patterns in freshwater phytoplankton. Ecology 2011, 92, 2096–2107. [Google Scholar] [CrossRef] [PubMed]
  43. Lv, H.; Yang, J.; Liu, L.; Yu, X.Q.; Zheng, Y.; Chiang, P.C. Temperature and nutrients are significant drivers of seasonal shift in phytoplankton community from a drinking water reservoir, subtropical China. Environ. Sci. Pollut. Res. Int. 2014, 21, 5917–5928. [Google Scholar] [CrossRef] [PubMed]
  44. Gonzalez, A.; Descamps-Julien, B. Population and community variability in randomly fluctuating environments. Oikos 2004, 106, 105–116. [Google Scholar] [CrossRef]
  45. Dokulil, M.; Chen, W.; Cai, Q. Anthropogenic impacts to large lakes in China: The Tai Hu example. Aquat. Ecosyst. Health 2000, 3, 81–94. [Google Scholar] [CrossRef]
  46. American Public Health Association (APHA); American Water Works Association (AWWA); Water Environment Federation (WEF). Standard Methods for the Examination of Water and Wastewater, 19th ed.; American Public Health Association: Washington, DC, USA, 1995. [Google Scholar]
  47. Ding, C.R.; Shi, H. Discussion on the problems of total phosphor determination by Mo-Sb anti-spectrophotometry method. Pollut. Control Technol. 2009, 22, 106–108. (In Chinese) [Google Scholar]
  48. Vörös, L.; Padisák, J. Phytoplankton biomass and chlorophyll-a in some shallow lakes in central Europe. Hydrobiologia 1991, 215, 111–119. [Google Scholar] [CrossRef]
  49. Felip, M.; Catalan, J. The relationship between phytoplankton biovolume and chlorophyll in a deep oligotrophic lake: Decoupling in their spatial and temporal maxima. J. Plankton Res. 2000, 22, 91–106. [Google Scholar] [CrossRef]
  50. Kasprzak, P.; Padisak, J.; Koschel, R.; Krienitz, L.; Gervais, F. Chlorophyll a concentration across a trophic gradient of lakes: An estimator of phytoplankton biomass? Limnol.-Ecol. Manag. Inland Waters 2008, 38, 327–338. [Google Scholar] [CrossRef]
  51. Sun, J.; Liu, D.Y.; Qian, S.B. Study on phytoplankton biomass I. Phytoplankton measurement biomass from cell volume or plasma volume. Acta Oceanol. Sin. 1999, 21, 75–85. (In Chinese) [Google Scholar]
  52. Zhang, H.; Cui, B.; Zhang, Z.; Fan, X. Species diversity and distribution for zooplankton in the inter-tidal wetlands of the Pearl River estuary, China. Procedia Environ. Sci. 2012, 13, 2383–2393. [Google Scholar]
  53. Akaike, H. Information theory as an extension of the maximum likelihood principle. In Second International Symposium on Information Theory; Petrov, B.N., Csaki, F., Eds.; Akaemiai Kiado: Budapest, Hungary, 1973; pp. 267–281. [Google Scholar]
  54. Symonds, M.R.; Moussalli, A. A brief guide to model selection, multimodel inference and model averaging in behavioural ecology using Akaike’s information criterion. Behav. Ecol. Sociobiol. 2011, 65, 13–21. [Google Scholar] [CrossRef]
  55. Lauster, G.H.; Hanson, P.C.; Kratz, T.K. Gross primary production and respiration differences among littoral and pelagic habitats in northern Wisconsin lakes. Can. J. Fish. Aquat. Sci. 2006, 63, 1130–1141. [Google Scholar] [CrossRef]
  56. Staehr, P.A.; Kaj, S.J. Temporal dynamics and regulation of lake metabolism. Limnol. Oceanogr. 2007, 52, 108–120. [Google Scholar] [CrossRef]
  57. Tilman, D.; Kilham, S.S.; Kilham, P. Phytoplankton community ecology: The role of limiting nutrients. Annu. Rev. Ecol. Syst. 1982, 13, 349–372. [Google Scholar] [CrossRef]
  58. Hinga, K.R. Effects of pH on coastal marine phytoplankton. Mar. Ecol.-Prog. Ser. 2002, 238, 281–300. [Google Scholar] [CrossRef]
  59. Hansen, P.J. Effect of high pH on the growth and survival of marine phytoplankton: Implications for species succession. Aquat. Microb. Ecol. 2002, 28, 279–288. [Google Scholar] [CrossRef]
  60. Engel, A. Direct relationship between CO2 uptake and transparent exopolymer particles production in natural phytoplankton. J. Plankton Res. 2002, 24, 49–53. [Google Scholar] [CrossRef]
  61. Olli, K. Diel vertical migration of phytoplankton and heterotrophic flagellates in the Gulf of Riga. J. Mar. Syst. 1999, 23, 145–163. [Google Scholar] [CrossRef]
  62. Li, T.; Li, Y.J.; Xu, W.J.; Wang, G.S.; Chen, Z.M.; Sun, C.B. Diurnal vertical migration laws of plankton in late breeding period of marsupenaeus japonicus in intensive pond culture. J. Anhui Agric. Sci. 2015, 43, 72–79. (In Chinese) [Google Scholar]
  63. McQueen, D.J.; Johannes, M.R.; Post, J.R.; Stewart, T.J.; Lean, D.R. Bottom-up and top-down impacts on freshwater pelagic community structure. Ecol. Monogr. 1989, 59, 289–309. [Google Scholar] [CrossRef]
  64. Elser, J.J.; Goldman, C.R. Zooplankton effects on phytoplankton in lakes of contrasting trophic status. Limnol. Oceanogr. 1971, 36, 64–90. [Google Scholar] [CrossRef]
  65. Carpenter, S.R.; Kitchell, J.F.; Hodgson, J.R. Cascading trophic interactions and lake productivity. BioScience 1985, 35, 634–639. [Google Scholar] [CrossRef]
Figure 1. Location of Lake Qixinghu in (a) China; and (b) Shandong Province; and (c) the sample sites in the lake.
Water 08 00582 g001
Figure 2. Combined variations of (a) water temperature (WT); (b) dissolved oxygen (DO); (c) pH; (d) total nitrogen (TN); (e) ammonia nitrogen (NH4+-N); (f) total phosphorus (TP); and (g) chlorophyll a in different months in Lake Qixinghu. The environmental factors in each month are expressed as mean values and standard deviations of the 23 sample sites in the lake.
Water 08 00582 g002
Figure 3. (a) The biovolume of phytoplankton and; (b) the biomasses of zooplankton in different sites of Lake Qixinghu.
Water 08 00582 g003
Figure 4. The relationship between phytoplankton biovolume and chlorophyll a in Lake Qixinghu.
Water 08 00582 g004
Figure 5. The relationships between the mean values of (a) water temperature (WT); (b) dissolved oxygen (DO); (c) pH; (d) total nitrogen (TN); (e) ammonia nitrogen (NH4+-N); (f) total phosphorus (TP) and the temporal stability of phytoplankton biomass (chlorophyll a) in Lake Qixinghu. The fitting of regression equations is calculated using the 23 sample sites in the lake (all N = 23).
Water 08 00582 g005
Figure 6. The relationships between the mean values of (a) water temperature (WT); (b) dissolved oxygen (DO); (c) pH; (d) total nitrogen (TN); (e) ammonia nitrogen (NH4+-N); (f) total phosphorus (TP) and the average total biomass of phytoplankton. Figures (gl) are the relationships between the mean values of the six environmental factors and the variability of phytoplankton biomass (chlorophyll a) in the lake. The fitting of regression equations is calculated using the 23 sample sites in the lake (all N = 23).
Water 08 00582 g006
Figure 7. The relationships between the variability of (a) water temperature (WT); (b) dissolved oxygen (DO); (c) pH; (d) total nitrogen (TN); (e) ammonia nitrogen (NH4+-N); (f) total phosphorus (TP) and the temporal stability of phytoplankton biomass (chlorophyll a) in Lake Qixinghu. Std: standard deviation. The fitting of regression equations is calculated using the 23 sample sites in the lake (all N = 23).
Water 08 00582 g007
Figure 8. The relationships between the variability of (a) water temperature (WT); (b) dissolved oxygen (DO); (c) pH; (d) total nitrogen (TN); (e) ammonia nitrogen (NH4+-N); (f) total phosphorus (TP) and the average total biomass of phytoplankton. Figures (gl) are the relationships between the variability of the six environmental factors and the variability of phytoplankton biomass (chlorophyll a) in the lake. The fitting of regression equations is calculated using the 23 sample sites in the lake (all N = 23).
Water 08 00582 g008
Figure 9. Principal components analysis (PCA) biplot for the relationships between environmental factors and phytoplankton stability (TSI).
Water 08 00582 g009

